
Submitted:
25 June 2026
Posted:
26 June 2026
You are already at the latest version
Abstract
Extreme precipitation events exert profound impacts on regional ecosystems, hydrological cycles and human societies. As an important ecological barrier in northern China, Inner Mongolia (IM) is highly vulnerable to climate change, making it a key region for precipitation research. Based on meteorological station observations and ERA5 reanalysis data, this study analyzed the spatiotemporal variations of summer total precipitation (TP) and extreme precipitation (EP) across IM from 1981 to 2025, as well as their driving mechanisms. The results showed that EP events primarily occurred in July over eastern and central IM, whereas western IM experienced concentrated extreme rainfall in August. Long-term trends revealed that the reduction in TP amount was mainly attributed to decreasing rainy days, accompanied by intensified precipitation intensity. Meanwhile, EP became more frequent and intense, particularly in western IM. Both TP and EP exhibited a three-stage (increase–decline–recovery) interdecadal evolution pattern. A notable abrupt climate shift took place in 1998, which reduced regional average TP amount by nearly 20%. Further analysis suggested that local near-surface warming lowered regional relative humidity and thus reduced rainy days over IM. In contrast, rising temperatures enhanced atmospheric water-holding capacity and promoted the occurrence of extreme precipitation. This study provides scientific references for regional disaster prevention and water resource management in IM.
Keywords:
extreme precipitation
; frequency
; intensity
; spatiotemporal variations
1. Introduction
Extreme climate events have received widespread attention due to their significant impacts on the ecological environment and human society [1,2,3]. The Synthesis Report (SYR) of the IPCC Sixth Assessment Report (AR6) revealed that the global mean surface temperature rose by 1.1℃ during 2011–2020 relative to the pre-industrial baseline of 1850–1900 [4]. Specifically, every 0.5℃ increment in global temperature exacerbated the frequency and severity of extreme heat, intense precipitation and regional drought events worldwide [5,6,7]. As one of the most destructive extreme climate events, extreme precipitation and storms have displaced more than 20 million people annually since 2008 [8,9,10]. It should be noted that the impacts of global warming are faster and more severe than expected [11,12].
Changes in precipitation characteristics are one of the most important responses to global warming, especially variations in extreme precipitation [13,14]. Observational evidence indicated that global mean precipitation increased by approximately 7.4% per℃ of warming from 1987 to 2006, which matches well with the classic Clausius-Clapeyron (CC) relation [15,16]. Fundamentally, atmospheric water vapor holding capacity increases by roughly 7% per degree of global warming [17,18,19]. Furthermore, both observations and numerical models confirmed that extreme precipitation increased under a warmer climate [20,21,22]. However, precipitation changes exhibit pronounced spatial heterogeneity for both total precipitation and extreme precipitation [23,24]. Dore et al. [25] found that total precipitation increased in high-latitude regions, while it decreased in China, Australia, and the Small Island States in the Pacific. Moreover, some studies found that the extreme precipitation scaling rate rises in mid-latitudes but declines in tropical regions [26,27]. This is because variations in extreme precipitation are controlled by multiple factors, including vertical velocity profiles and moisture availability [28]. The above studies indicate that precipitation changes differ distinctly across precipitation types (total precipitation and extreme precipitation) and geographical regions.
As an ecological barrier in northern China, Inner Mongolia (IM) is among the regions most sensitive to global climate change [29]. Previous studies have documented a slight decline in annual precipitation, primarily driven by reduced rainfall in July and August, while extreme precipitation events also showed an overall decreasing trend [30,31]. These studies only focused on variations in total precipitation or extreme precipitation separately and ignored regional differences in precipitation changes. Moreover, precipitation trends varied greatly across different decadal periods. Therefore, it is necessary to further explore the changing characteristics of different precipitation types in Inner Mongolia over recent decades.
This study investigates the spatiotemporal variation of summer total precipitation (TP) and extreme precipitation (EP) in IM over the past 45 years (1981–2025), using daily precipitation data from meteorological stations. In addition, relevant meteorological factors are further explored to clarify the dominant mechanisms behind the differing trends between the two precipitation categories. This paper is structured as follows. Data and methodologies are presented in Section 2. Section 3 investigates the spatiotemporal variation of the two precipitation types. Section 4 discusses the possible mechanisms responsible for their trend differences, and the main conclusions are summarized in Section 5.
2. Materials and Methods
2.1. Study Area
Inner Mongolia (IM) is located in northern China, ranging from 37°N–53°N and 97°E–126°E (Figure 1). Extending about 2400 km east–west and 1700 km north–south, this region stretches northeast to southwest and is primarily covered by plateaus [32]. A clear climatic gradient exists across IM: the eastern part is humid and sub-humid, and the western part gradually turns into semi-arid and arid zones [33]. Summer is the major rainy season here, where precipitation is generally scarce and shows strong spatial heterogeneity. There are twelve prefecture-level cities and leagues across IM. Specifically, the eastern zone includes Hulun Buir, Hinggan League, Tongliao and Chifeng; the central zone includes Xilingol League, Ulanqa, Hohhot and Baotou; the western zone consists of Ordos, Bayannur, Wuhai and Alxa League.
2.2. Materials
Summer (June–August, JJA) daily precipitation data covering the period 1981–2025 were obtained from 117 national meteorological stations across Inner Mongolia (IM), as shown in Figure 1. To explore the dominant mechanisms for precipitation variation, the fifth-generation ERA5 reanalysis dataset provided by the European Centre for Medium-Range Weather Forecasts (ECMWF) was adopted for analysis (available at https://cds.climate.copernicus.eu) [34]. Three key atmospheric variables were used from the ERA5 dataset, including 2-m air temperature (T2m), 925 hPa relative humidity (RH), and total column water vapor (TCWV).
2.3. Methods
Following the national standard GB/T33669-2017 issued by the China Meteorological Administration (CMA), extreme precipitation (EP) events are defined via a percentile threshold method. Specifically, the annual maximum and second-maximum daily precipitation values during the climatological baseline period (1991–2020) are extracted to establish an ascending 60 value sample sequence. The 95th percentile of the sorted sequence is determined as the regional EP threshold, and days with daily precipitation equal to or higher than this threshold are classified as EP days.
Combining official CMA criteria with localized climatic characteristics of IM, unified precipitation indicators are defined in this study. For total precipitation (TP) metrics, a rainy day is defined as a day with daily precipitation ≥ 0.5 mm; TP amount refers to cumulative precipitation on all rainy days; TP frequency represents the total number of rainy days; TP intensity is calculated as the quotient of total TP amount divided by TP frequency. EP-related metrics are computed using the identical statistical framework, whereas all EP metrics are counted based on qualified EP days rather than conventional rainy days.
The non-parametric Mann-Kendall (MK) test is a robust time-series trend diagnosis tool widely used in hydrometeorological studies [35,36,37]. It is applied herein to detect precipitation temporal trends at the 95% confidence level. Sen’s slope estimator is further utilized to quantify trend magnitudes [38,39], and annual slope values are converted into decadal variation rates.
where S represents the decadal slope, Xj and Xi represent the observed values in the j-th and i-th years (j > i), respectively.
In addition, the sliding t-test was applied to identify abrupt change points and evaluate their significance [40]. Furthermore, Pearson correlation analysis was used to explore the relationships between meteorological variables and precipitation, with the t-test to verify the statistical significance of these relationships [41].
3. Results
3.1. Climatological Patterns of Total and Extreme Precipitation
A distinct spatial pattern is observed for summer TP amount across IM, showing a gradual decline from east to west (Figure 2(a)). In eastern and central IM, July contributes the largest proportion to summer TP, followed by August, while June has the smallest contribution (Figure 2(b)). In western IM, TP amounts are relatively high in both July and August, with slightly higher values in August. This spatial distribution is mainly controlled by the activity of the Western Pacific Subtropical High (WPSH). During the 38th–40th pentads, the WPSH advances northward, with its ridge line reaching approximately 28°N. Consequently, Northeast China and North China enter their main rainy seasons. After the 40th pentad, the Hetao area and western IM begin their primary rainy period [42].
TP frequency exhibits a similar east-to-west decreasing spatial trend (Figure 2(c)). No obvious monthly disparities in TP frequency are found across the entire region (Figure 2(d)). Areas with strong TP intensity are concentrated to the east of the Greater Khingan Mountains and south of the Yinshan Mountains, where TP intensity exceeds 11 mm day−1 at multiple meteorological stations (Figure 2(e)). This feature is closely related to topographic effects: southerly winds are blocked by terrain on windward slopes, triggering moisture convergence and upward motion, which further enhances local precipitation intensity [43]. Figure 2(f) indicates that TP intensity peaks in July over eastern and central IM, while western IM sees the maximum TP intensity in August.
EP amount exhibits distinct spatial characteristics (Figure 3(a)), with high values concentrated east of the Greater Khingan Mountains and south of the Yinshan Mountains. Clearly, eastern and central IM have the largest EP amount in July, whereas western IM reaches its peak in August (Figure 3(b)). No evident spatial trend is detected for EP frequency (Figure 3(c)). The pattern in Figure 3(d) resembles that in Figure 3(b): EP events occur more frequently in July across eastern and central areas, while the western region sees higher frequency in August. EP intensity (Figure 3(e)) shares a similar spatial distribution with TP intensity shown in Figure 2(e). Regions with strong EP intensity are also located east of the Greater Khingan Mountains and south of the Yinshan Mountains. As illustrated in Figure 3(f), the maximum EP intensity in most prefecture-level cities appears in July or August.
3.2. Long-Term Variation of Total and Extreme Precipitation
This section investigates the long-term variations of summer TP across IM during 1981–2025. As shown in Figure 4(a), TP amount showed decreasing trends at most meteorological stations in IM, whereas a mild increase was detected in regions with relatively high precipitation intensity. Statistically, 79% of stations exhibited decreasing trends in TP amount, while only 21% showed increasing trends. All 117 stations (100% of the total) recorded statistically significant declines in TP frequency, as confirmed by the MK test (Figure 4(b)). Conversely, TP intensity displayed a notable increasing trend across IM, with 87% of stations showing upward trends. Accordingly, these findings indicate that the reduction in total precipitation over the past 45 years was primarily driven by the widespread decline in precipitation frequency, while precipitation intensity has generally intensified across IM.
To investigate the long-term trends of summer TP over the past 45 years (1981–2025) across different regions of IM, we analyzed precipitation variations at twelve prefecture-level cities and leagues. As shown in Figure 5(a), most cities and leagues exhibited decreasing trends in TP amount, with particularly pronounced reductions in Chifeng, Xilingol League, and Huhhot. Only three regions showed weak positive trends: Hinggan League and Tongliao in eastern IM, and Wuhai in western IM. Notably, the decreasing trends in TP amount were more evident in July and August across most regions. TP frequency showed statistically significant decreasing trends in all months across IM (Figure 5(b)), with most cities and leagues passing the MK test at the 0.05 level. In contrast, TP intensity presented an overall increasing trend across IM (Figure 5(c)).
The long-term trends of summer EP over 1981–2025 were evaluated across twelve prefecture-level cities and leagues in IM. As illustrated in Figure 6(a), EP amount showed increasing trends across all regions except Chifeng. Notably, significant positive trends in EP amount were detected in eastern IM (Hinggan League and Tongliao) and western IM (Baotou, Ordos, Bayannur, and Wuhai). For most cities and leagues, both EP frequency (Figure 6(b)) and EP intensity (Figure 6(c)) displayed statistically significant increasing trends, with no obvious differences in trends across the individual summer months (June, July, and August). Collectively, these findings suggest that eastern and western IM may face more frequent and intense extreme precipitation events in the future.
3.3. Interannual Variability of Total and Extreme Precipitation
The interannual variations of summer TP amount, frequency, and intensity across IM from 1981 to 2025 are illustrated in Figure 7. The 7-year moving averages are adopted to smooth the original annual datasets and identify evident interdecadal fluctuations. The regional-averaged TP amount (Figure 7(a)) followed a typical three-stage variation pattern: an increasing phase from the 1980s to the mid-1990s, a decreasing phase from the mid-1990s to the 2010s, and a slow increasing phase from the 2010s to the 2020s.
The sliding t-test detected a significant precipitation abrupt change in 1998, which split the study period into two sub-periods. During the pre-1998 period (1981–1998), the regional mean TP amount was 268.57 mm with an increasing trend (s = 2.35 mm decade−1). For the post-1998 period (1999–2025), the average TP amount dropped to 223.01 mm, while its upward trend became statistically significant at the 0.05 level (s* = 2.94 mm decade−1). Besides, the mean value of TP frequency decreased significantly from 34.2 days to 27.21 days across two periods. By comparison, TP intensity maintained a stable increasing trend throughout 1981–2025, with average values rising from 7.6 mm day−1 to 7.93 mm day−1.
Regional disparities were evident across eastern, central, and western IM (Figure 7(b-d)). Eastern IM possessed the highest summer TP amount and the most pronounced interdecadal fluctuations. Central IM had lower precipitation magnitude than eastern IM, and shared consistent variation features with eastern regions. Western IM was characterized by the lowest TP amount, with weaker interdecadal variability relative to central and eastern IM. These results demonstrate that summer TP over IM experiences remarkable interdecadal fluctuations, especially in central and eastern IM, and the mean precipitation magnitude changed obviously before and after the abrupt year of 1998.
Figure 8 presents the interannual variability of summer EP across IM during 1981–2025. At the regional scale (Figure 8(a)), EP amount conformed to a typical three-stage evolution pattern: an increase from the 1980s to the mid-1990s, a decrease from the mid-1990s to the early 2010s, and a subsequent rebound. Although the regional mean EP amount decreased from 17.31 mm (pre-1998) to 15.38 mm (post-1998), it exhibited significant increasing trends in both sub-periods (s = 0.89 and 0.9 mm decade−1). The mean EP frequency decreased from 0.24 days to 0.21 days but maintained significant positive decadal trends, while EP intensity increased steadily and peaked in the 2020s.
Obvious regional disparities existed across the three subregions (Figure 8(b–d)). Eastern IM had the highest EP magnitude and the most evident three-stage variation characteristics in EP amount, frequency and intensity. Central IM presented synchronous variations in EP amount and frequency, accompanied by steady growth in EP intensity. By contrast, western IM witnessed continuous growth in EP amount throughout the study period. Its EP intensity showed a statistically significant increasing trend after 1998, despite a slight decline in the regional average value.
These results confirm pronounced interdecadal fluctuations in summer EP over IM, featuring a clear increase-decline-recovery three-stage pattern and an evident mean shift around 1998, especially in central and eastern IM. Distinct from TP, EP maintained positive decadal trends and late-period recovery even with reduced average magnitude after 1998. The sustained growth of EP indicators in western IM implies elevated hydrological risks in this arid subregion.
To quantify the contributions of precipitation frequency and intensity to TP and EP amount variations after the 1998 climate abrupt change, Figure 9 illustrates the percentage change in mean precipitation amount, as well as the corresponding contributions of the two components over IM and its three subregions. For TP (Figure 9(a)), the regional mean amount decreased by 17.0% in the post-1998 period. This overall decline was predominantly governed by reduced precipitation frequency, which contributed −20.4% to total amount variation, whereas enhanced precipitation intensity partially offset this negative effect with a positive contribution of 3.4%. Obvious regional disparities were observed: eastern and central IM both suffered TP decreases induced by falling frequency, with a larger magnitude in central IM (−23.6%). Notably, western IM had the slightest TP reduction (−12.2%), which was largely attributed to the strong positive contribution of precipitation intensity (+10.4%), offsetting nearly half the negative impact from frequency decline (−22.6%).
For EP (Figure 9(b)), regional mean EP amount declined by 11.1% after 1998, following a consistent driving pattern with TP: frequency reduction dominated the EP decrease (−13.5%), while rising intensity offered a minor positive contribution (+2.4%). Nevertheless, prominent regional divergences existed. Eastern and central IM presented EP decreases driven by frequency reduction (approximately −20.0%). By comparison, western IM was the sole subregion with a significant increase in EP amount (+19.6%), which was almost dominated by increased precipitation frequency (+19.0%), while the contribution of intensity remained negligible (+0.6%).
Collectively, this contribution decomposition verifies that precipitation frequency served as the dominant factor modulating TP and EP variations across most areas of IM, while precipitation intensity acted as a critical regulatory factor. Western IM showed totally differentiated characteristics: its mild TP reduction benefited from intense intensity enhancement, and its significant EP increment was primarily controlled by rising frequency. These findings are consistent with the foregoing trend results, further confirming the increasing risk of extreme precipitation hazards in arid western IM.
4. Discussion
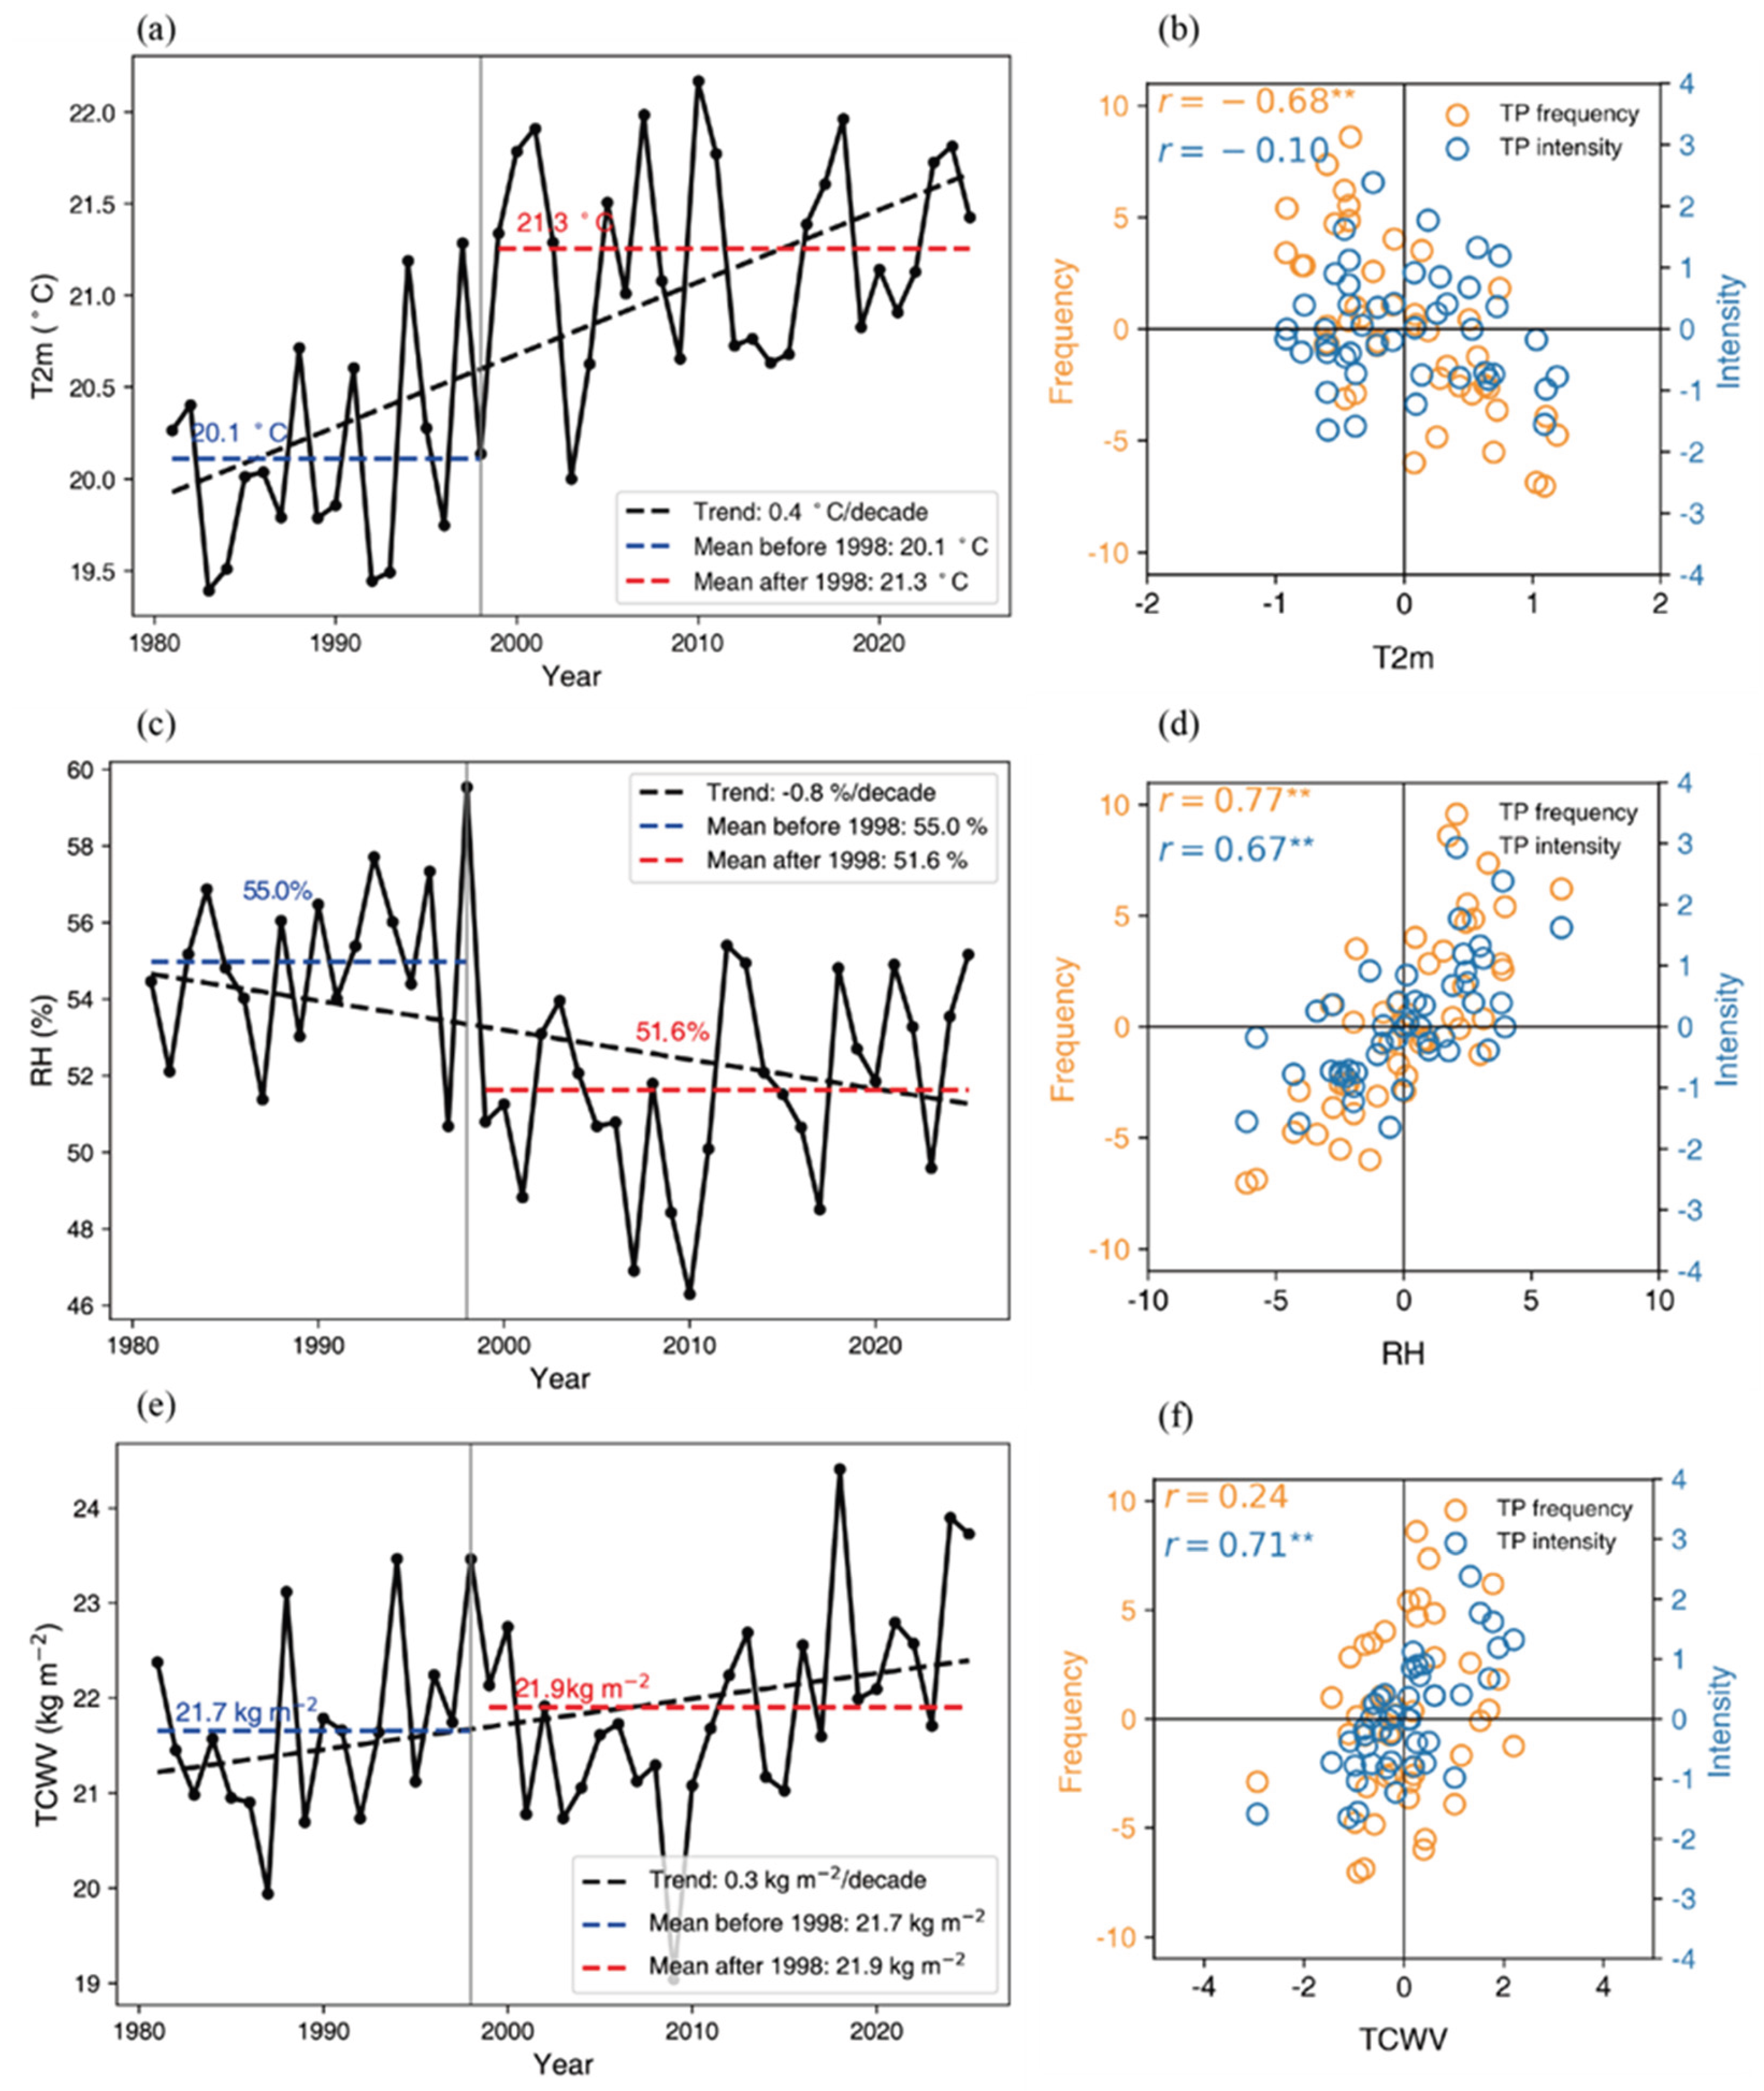
The physical mechanisms behind the variations in summer precipitation are further analyzed based on Figure 10, which displays the temporal evolution of key meteorological factors and their relationships with TP frequency and intensity. During 1981–2025, 2-m air temperature (T2m) over IM rose significantly at 0.4 °C decade−1, with the regional mean increasing from 20.1 °C before 1998 to 21.3 °C after 1998. Meanwhile, relative humidity (RH) at 925 hPa declined markedly at 0.8% decade−1 (from 55.0% to 51.6%), whereas total column water vapor (TCWV) increased steadily by 0.3 kg m−2 decade−1. Detrended correlation results showed that TP frequency had a strong negative correlation with T2m (r = -0.68, p < 0.01) and a positive correlation with RH (r = 0.77, p < 0.01), demonstrating that warming and drying conditions primarily caused the reduction in precipitation days. In addition, TP intensity was significantly positively correlated with TCWV (r = 0.71, p < 0.01), suggesting that enhanced atmospheric moisture availability favored stronger rainfall.
Physically, RH reduction induced by surface warming inhibits vapor condensation and suppresses the formation of light-to-moderate rainfall, thereby lowering precipitation frequency. In accordance with the Clausius-Clapeyron law, rising temperature improves atmospheric water-holding capacity, and the increased TCWV supplies sufficient moisture for precipitation. As a result, precipitation tends to occur less frequently but with higher intensity. Such a structural transformation from conventional rainfall to intense events accounts for the rise in extreme precipitation across the study area.
Beyond local thermodynamic changes, the 1998 precipitation abrupt change corresponds to a large-scale East Asian climate regime transition, which is jointly regulated by phase changes of the Atlantic Multidecadal Oscillation (AMO) and Pacific Decadal Oscillation (PDO), as well as the weakened East Asian Summer Monsoon (EASM)[44]. This large-scale circulation change exacerbated regional warming and humidity decline after 1998, forming the key background for the observed precipitation shifts.
In summary, variations in IM summer precipitation are modulated by both large-scale climate forcing and local meteorological conditions. Continued warming may further intensify extreme precipitation, and differentiated adaptation measures are required for different subregions.
5. Conclusions
Based on meteorological station observations and ERA5 reanalysis datasets, this study analyzed the spatiotemporal characteristics of summer TP and EP over IM from 1981 to 2025, as well as the mechanisms affecting their variations. Key findings are summarized as follows.
- (1)
- Summer precipitation showed distinct east-west spatial heterogeneity across IM. TP amount and frequency gradually decreased from east to west. Owing to topographic forcing, areas with high precipitation intensity were distributed east of the Greater Khingan Mountains and south of the Yinshan Mountains. EP events mainly occurred in July over eastern and central IM, while they concentrated in August over western IM
- (2)
- Over the past 45 years, the regional TP amount declined significantly across IM, which was mainly attributed to the marked reduction in TP frequency, while TP intensity increased prominently. Both the frequency and intensity of EP increased throughout IM, especially in western IM, which faces escalating risks of extreme precipitation.
- (3)
- TP and EP both exhibited a three-stage interdecadal evolution pattern (increase–decline–rebound). Eastern and central IM experienced strong interdecadal fluctuations in precipitation. A significant climate abrupt change was identified in 1998 by the sliding t-test, after which the regional mean TP amount fell by approximately 20%.
- (4)
- Precipitation variations were jointly governed by local thermodynamic conditions and large-scale atmospheric circulations. Regional near-surface warming lowered relative humidity and thus reduced the number of rainy days. By contrast, the enhanced atmospheric water-holding capacity induced by rising temperatures intensified precipitation intensity and promoted the occurrence of extreme precipitation. The 1998 climate shift, modulated by AMO, PDO and the weakened EASM, further intensified regional warming and aridification and altered the precipitation regime across IM.
This study clarifies the differentiated spatiotemporal evolution and driving mechanisms of total and extreme precipitation across Inner Mongolia. It provides scientific references for regional extreme rainstorm prevention, water resource management and targeted climate adaptation under global warming.
Author Contributions
Conceptualization, H.W. and Y.M.; methodology, H.W.; software,H.W.; formal analysis,Y.M.; resources, Y.M.; writing—original draft preparation, H.W., and X.L.; writing—review and editing, H.W., Y.M. and X.L.; funding acquisition, Y.M. All authors have read and agreed to the published version of the manuscript.
Funding
This work was supported by the National Natural Science Foundation of China [grant number 42105023], the China Meteorological Administration Review and Summary Special Project [grant numbers FPZJ2025-021 and 201908510032], the Natural Science Foundation of Inner Mongolia Autonomous Region [grant numbers 2025LHMS04003 and 2024QN04007], the Key Scientific and Technological Innovation Project of Inner Mongolia Meteorological Bureau [grant numbers nmqxkjcx202554 and nmqxkjcx202559], and the Director’s Foundation of Inner Mongolia Earthquake Administration [grant numbers 2023QN16].
Acknowledgments
The authors would like to thank all data providers, editors, and reviewers for their outstanding work and contributions to the manuscript.
Conflicts of Interest
The authors declare no conflict of interes.
References
- Handmer, J.; Honda, Y.; Kundzewicz, Z.W.; Arnell, N.; Benito, G.; Hatfield, J.; Mohamed, I.F.; Peduzzi, P.; Wu, S.; Sherstyukov, B.; et al. Changes in Impacts of Climate Extremes: Human Systems and Ecosystems. In Managing the Risks of Extreme Events and Disasters to Advance Climate Change Adaptation: Special Report of the Intergovernmental Panel on Climate Change; Field, C.B., Barros, V., Stocker, T.F., Dahe, Q., Eds.; Cambridge University Press: Cambridge, 2012; pp. 231–290. ISBN 9781107025066. [Google Scholar]
- Donat, M.G.; Alexander, L. V.; Yang, H.; Durre, I.; Vose, R.; Dunn, R.J.H.; Willett, K.M.; Aguilar, E.; Brunet, M.; Caesar, J.; et al. Updated Analyses of Temperature and Precipitation Extreme Indices since the Beginning of the Twentieth Century: The HadEX2 Dataset. J. Geophys. Res. Atmos. 2013, 118, 2098–2118. [Google Scholar] [CrossRef]
- Fischer, E.M.; Beyerle, U.; Knutti, R. Robust Spatially Aggregated Projections of Climate Extremes. Nat. Clim. Chang. 2013, 3, 1033–1038. [Google Scholar] [CrossRef]
- IPCC. Climate Change 2023: Synthesis Report. Contribution of Working Groups I, II and III to the Sixth Assessment Report of the Intergovernmental Panel on Climate Change; Core Writing Team, Lee, H., Romero, J., Eds.; IPCC: Geneva, Switzerland, 2023; p. 184. [Google Scholar] [CrossRef]
- Wang, X.; Jiang, D.; Lang, X. Future Extreme Climate Changes Linked to Global Warming Intensity. Sci. Bull. 2017, 62, 1673–1680. [Google Scholar] [CrossRef] [PubMed]
- Du, H.; Alexander, L. V.; Donat, M.G.; Lippmann, T.; Srivastava, A.; Salinger, J.; Kruger, A.; Choi, G.; He, H.S.; Fujibe, F.; et al. Precipitation From Persistent Extremes Is Increasing in Most Regions and Globally. Geophys. Res. Lett. 2019, 46, 6041–6049. [Google Scholar] [CrossRef]
- Zhang, J.; Wang, F. Changes in the Risk of Extreme Climate Events over East Asia at Different Global Warming Levels. Water 2019, 11. [Google Scholar] [CrossRef]
- Chou, C.; Lan, C.W. Changes in the Annual Range of Precipitation under Global Warming. J. Clim. 2012, 25, 222–235. [Google Scholar] [CrossRef]
- O’Gorman, P.A. Precipitation Extremes Under Climate Change. Curr. Clim. Chang. Rep. 2015, 1, 49–59. [Google Scholar] [CrossRef] [PubMed]
- Peng, J.; Fan, Z.; Wu, D.; Zhuang, J.; Dai, F.; Chen, W.; Zhao, C. Heavy Rainfall Triggered Loess–Mudstone Landslide and Subsequent Debris Flow in Tianshui, China. Eng. Geol. 2015, 186, 79–90. [Google Scholar] [CrossRef]
- Ma, Y.; Hu, Z.; Li, C.; Feng, T.; Meng, X.; Dong, W. Anthropogenic Climate Change Enhances the July 2021 Super-Heavy Rainfall Event in Central China. Bull. Am. Meteorol. Soc. 2023, 104, E736–E741. [Google Scholar] [CrossRef]
- Intergovernmental Panel on Climate Change (IPCC). Climate Change 2022—Impacts, Adaptation and Vulnerability: Working Group II Contribution to the Sixth Assessment Report of the Intergovernmental Panel on Climate Change; Cambridge University Press, 2023. [Google Scholar] [CrossRef]
- Trenberth, K.E. Changes in Precipitation with Climate Change. Clim. Res. 2011, 47, 123–138. [Google Scholar] [CrossRef]
- Dai, A.; Rasmussen, R.M.; Liu, C.; Ikeda, K.; Prein, A.F. A New Mechanism for Warm-Season Precipitation Response to Globalwarming Based on Convection-Permitting Simulations. Clim. Dyn. 2020, 55, 343–368. [Google Scholar] [CrossRef]
- Wentz, F.J.; Ricciardulli, L.; Hilburn, K.; Mears, C. How Much More Rain Will Global Warming Bring? Science (80-. ). 2007, 317, 233–235. [Google Scholar] [CrossRef] [PubMed]
- Allen, M.R.; Ingram, W.J. Constraints on Future Changes in Climate and the Hydrologic Cycle. Nature 2002, 419, 224–232. [Google Scholar] [CrossRef] [PubMed]
- Trenberth, K.E.; Dai, A.; Rasmussen, R.M.; Parsons, D.B. The Changing Character of Precipitation. Bull. Am. Meteorol. Soc. 2003, 84, 1205–1218. [Google Scholar] [CrossRef]
- Allan, R.P.; Soden, B.J. Atmospheric Warming and the Amplification of Precipitation Extremes. Science (80-. ) . 2008, 321, 1481–1484. [Google Scholar] [CrossRef] [PubMed]
- O’Gorman, P.A.; Schneider, T. The Physical Basis for Increases in Precipitation Extremes in Simulations of 21st-Century Climate Change. Proc. Natl. Acad. Sci. 2009, 106, 14773–14777. [Google Scholar] [CrossRef] [PubMed]
- Muller, C.J.; O’Gorman, P.A.; Back, L.E. Intensification of Precipitation Extremes with Warming in a Cloud-Resolving Model. J. Clim. 2011, 24, 2784–2800. [Google Scholar] [CrossRef]
- Westra, S.; Alexander, L. V.; Zwiers, F.W. Global Increasing Trends in Annual Maximum Daily Precipitation. J. Clim. 2013, 26, 3904–3918. [Google Scholar] [CrossRef]
- Bao, J.W.; Sherwood, S.C.; Alexander, L. V.; Evans, J.P. Future Increases in Extreme Precipitation Exceed Observed Scaling Rates. Nat. Clim. Chang. WE—Science Citation Index Expanded (SCI-EXPANDED) WE—Social Science Citation Index (SSCI). 2017, 7, 128–132. [Google Scholar] [CrossRef]
- Frich, P.; Alexander, L. V.; Della-Marta, P.; Gleason, B.; Haylock, M.; Tank, A.M.G.K.; Peterson, T. Observed Coherent Changes in Climatic Extremes during the Second Half of the Twentieth Century. Clim. Res. 2002, 19, 193–212. [Google Scholar] [CrossRef]
- Walther, G.-R.; Post, E.; Convey, P.; Menzel, A.; Parmesan, C.; Beebee, T.J.C.; Fromentin, J.-M.; Hoegh-Guldberg, O.; Bairlein, F. Ecological Responses to Recent Climate Change. Nature 2002, 416, 389–395. [Google Scholar] [CrossRef] [PubMed]
- Dore, M.H.I. Climate Change and Changes in Global Precipitation Patterns: What Do We Know? Environ. Int. 2005, 31, 1167–1181. [Google Scholar] [CrossRef] [PubMed]
- Hardwick Jones, R.; Westra, S.; Sharma, A. Observed Relationships between Extreme Sub-Daily Precipitation, Surface Temperature, and Relative Humidity. Geophys. Res. Lett. 2010, 37. [Google Scholar] [CrossRef]
- Utsumi, N.; Seto, S.; Kanae, S.; Maeda, E.E.; Oki, T. Does Higher Surface Temperature Intensify Extreme Precipitation? Geophys. Res. Lett. 2011, 38. [Google Scholar] [CrossRef]
- Lenderink, G.; van Meijgaard, E. Increase in Hourly Precipitation Extremes beyond Expectations from Temperature Changes. Nat. Geosci. 2008, 1, 511–514. [Google Scholar] [CrossRef]
- Wang, L.; Zhen, L.; Liu, X.; Batkhishig, O.; Qinxue, W. Comparative Studies on Climate Changes and Influencing Factors in Central Mongolian Plateau Region. Geogr. Res. 2008, 27, 171–180. [Google Scholar]
- Hu, Q.; Pan, F.; Pan, X.; Zhang, D.; Li, Q.; Pan, Z.; Wei, Y. Spatial Analysis of Climate Change in Inner Mongolia during 1961–2012, China. Appl. Geogr. 2015, 60, 254–260. [Google Scholar] [CrossRef]
- Tong, S.; Li, X.; Zhang, J.; Bao, Y.; Bao, Y.; Na, L.; Si, A. Spatial and Temporal Variability in Extreme Temperature and Precipitation Events in Inner Mongolia (China) during 1960–2017. Sci. Total Environ. 2019, 649, 75–89. [Google Scholar] [CrossRef] [PubMed]
- Wang, H.; Liu, X.; Guo, J.; Ren, Z.; Wang, F.; Pan, D. Improvement of AMMRR Interpolation and Application in CSCS Classification of Inner Mongolia Grassland. Chin. J. Eco-Agric. 2013, 21, 904–912. [Google Scholar] [CrossRef]
- Tong, S.; Zhang, J.; Ha, S.; Lai, Q.; Ma, Q. Dynamics of Fractional Vegetation Coverage and Its Relationship with Climate and Human Activities in Inner Mongolia, China. Remote Sens. 2016, 8. [Google Scholar] [CrossRef]
- Hersbach, H.; Bell, B.; Berrisford, P.; Hirahara, S.; Horányi, A.; Muñoz-Sabater, J.; Nicolas, J.; Peubey, C.; Radu, R.; Schepers, D.; et al. The ERA5 Global Reanalysis. Q. J. R. Meteorol. Soc. 2020, 146, 1999–2049. [Google Scholar] [CrossRef]
- Mann, H.B. Nonparametric Tests Against Trend. Econometrica 1945, 13, 245–259. [Google Scholar] [CrossRef]
- Kendall, M.G. Rank Correlation Methods.4th Edition. 1975.
- You, Q.; Kang, S.; Aguilar, E.; Yan, Y. Changes in Daily Climate Extremes in the Eastern and Central Tibetan Plateau during 1961–2005. J. Geophys. Res. Atmos. 2008, 113. [Google Scholar] [CrossRef]
- Theil, H. Rank‐Invariant Method of Linear and Polynomial Regression Analysis I, II, III. Proceedings of the Koninklijke Nederlandse Akademie van Wetenschappen. 1950.
- Sen, P.K. Estimates of the Regression Coefficient Based on Kendall’s Tau. J. Am. Stat. Assoc. 1968, 63, 1379–1389. [Google Scholar] [CrossRef]
- Waliser, D.E.; Stern, W.; Schubert, S.; Lau, K.M. Dynamic Predictability of Intraseasonal Variability Associated with the Asian Summer Monsoon. Q. J. R. Meteorol. Soc. 2003, 129, 2897–2925. [Google Scholar] [CrossRef]
- Gao, W.; Duan, K.; Li, S. A Spatial–Temporal Analysis of Cold Surge Days in Northern China during 1960–2016. Nat. Hazards 2021, 108, 147–162. [Google Scholar] [CrossRef]
- Wang, Z.; Ding, Y. Climatic Characteristics of Rainy Seasons in China. Chin. J. Atmos. Sci. 2008, 32, 1–13. [Google Scholar]
- He, B.; Sun, J.; Yu, J.; Wang, H.; Zhang, M.; Hua, W. Simulation Study on the Influence of the Great Khingan Strip and Changbai Mountain on Summer Rainfall in Northeast China. Clim. Environ. Res. 2020, 25, 268–280. (in Chinese). [Google Scholar]
- Li, Y.; Gong, H.; Chen, W.; Wang, L.; Wu, R.; Dong, Z.; Piao, J.; Ma, K. Summer Precipitation Variability in the Mongolian Plateau and Its Possible Causes. Glob. Planet. Change 2023, 228, 104189. [Google Scholar] [CrossRef]
Figure 1.
Topography and distribution of 117 meteorological stations in IM.
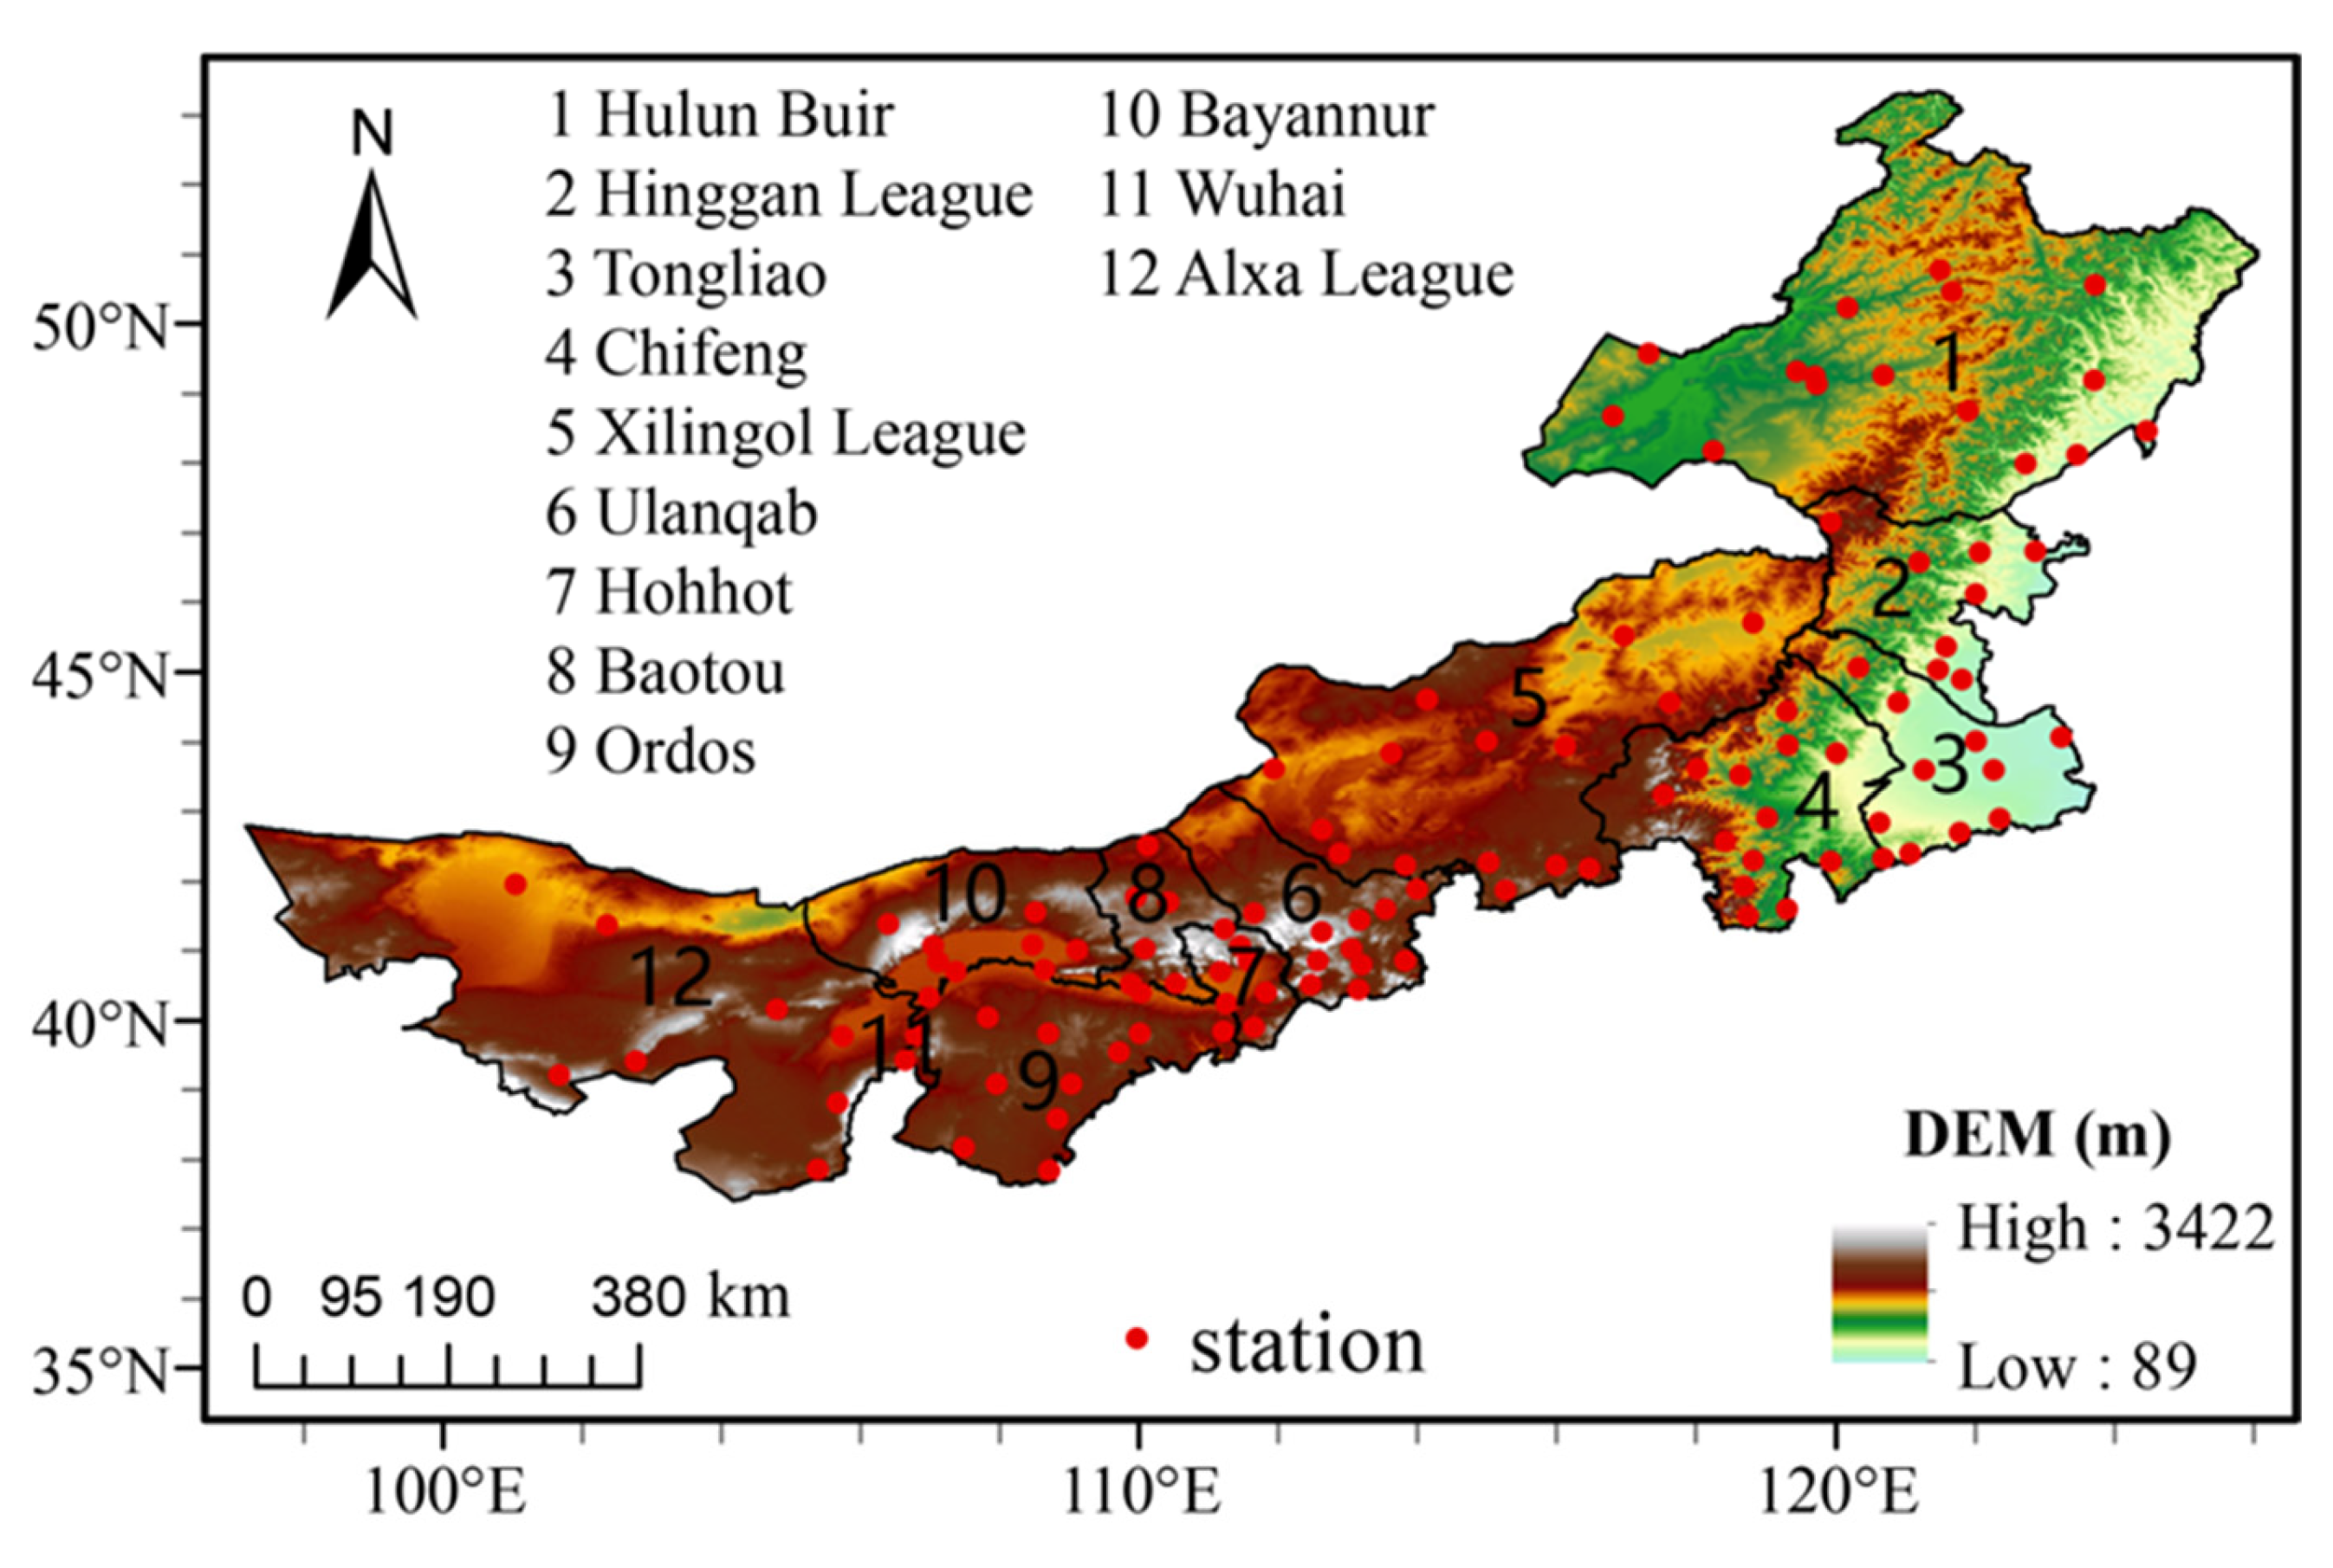
Figure 2.
Climatological patterns of summer total precipitation (TP). (a) summer accumulated TP amount (units: mm); (b) monthly contribution proportion of TP amount to summer total across twelve prefecture-level cities and leagues; (c) summer TP frequency (units: day); (d) monthly contribution proportion of TP frequency to summer total; (e) summer TP intensity (units: mm day−1); (f) monthly contribution proportion of TP intensity to summer total.
Figure 2.
Climatological patterns of summer total precipitation (TP). (a) summer accumulated TP amount (units: mm); (b) monthly contribution proportion of TP amount to summer total across twelve prefecture-level cities and leagues; (c) summer TP frequency (units: day); (d) monthly contribution proportion of TP frequency to summer total; (e) summer TP intensity (units: mm day−1); (f) monthly contribution proportion of TP intensity to summer total.
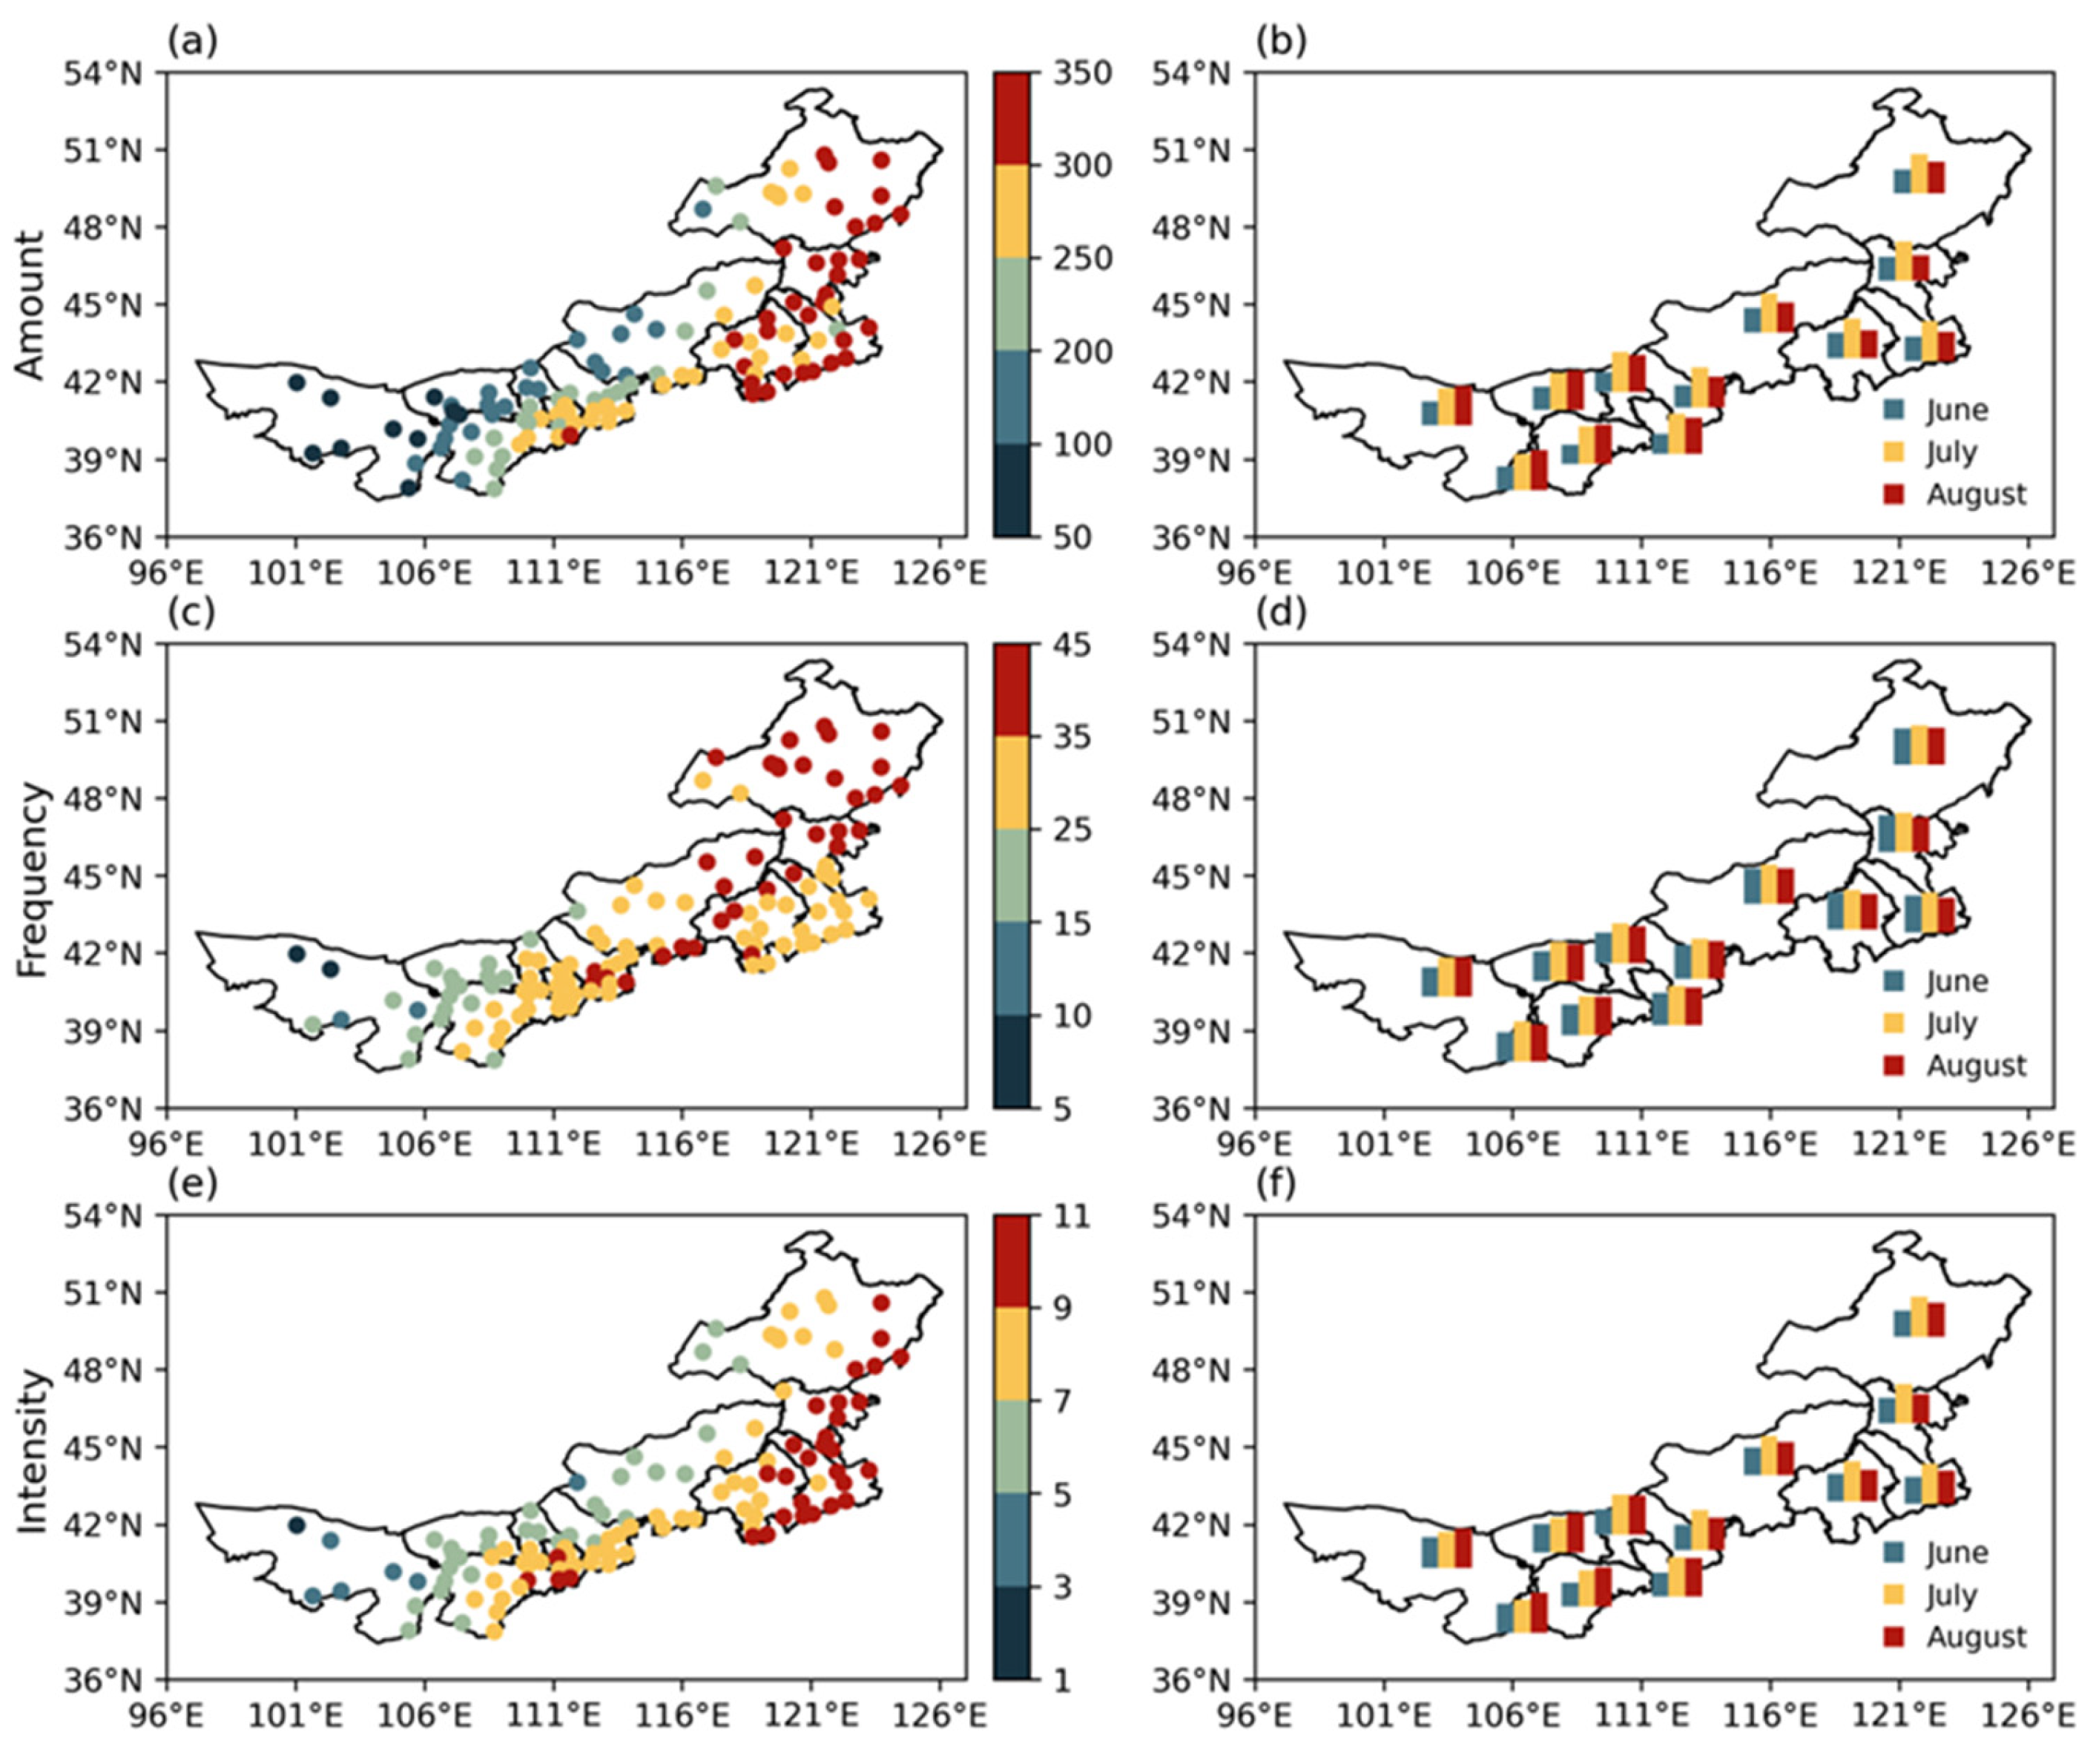
Figure 3.
Same as Figure 2, but for climatological patterns of extreme precipitation (EP).
Figure 3.
Same as Figure 2, but for climatological patterns of extreme precipitation (EP).
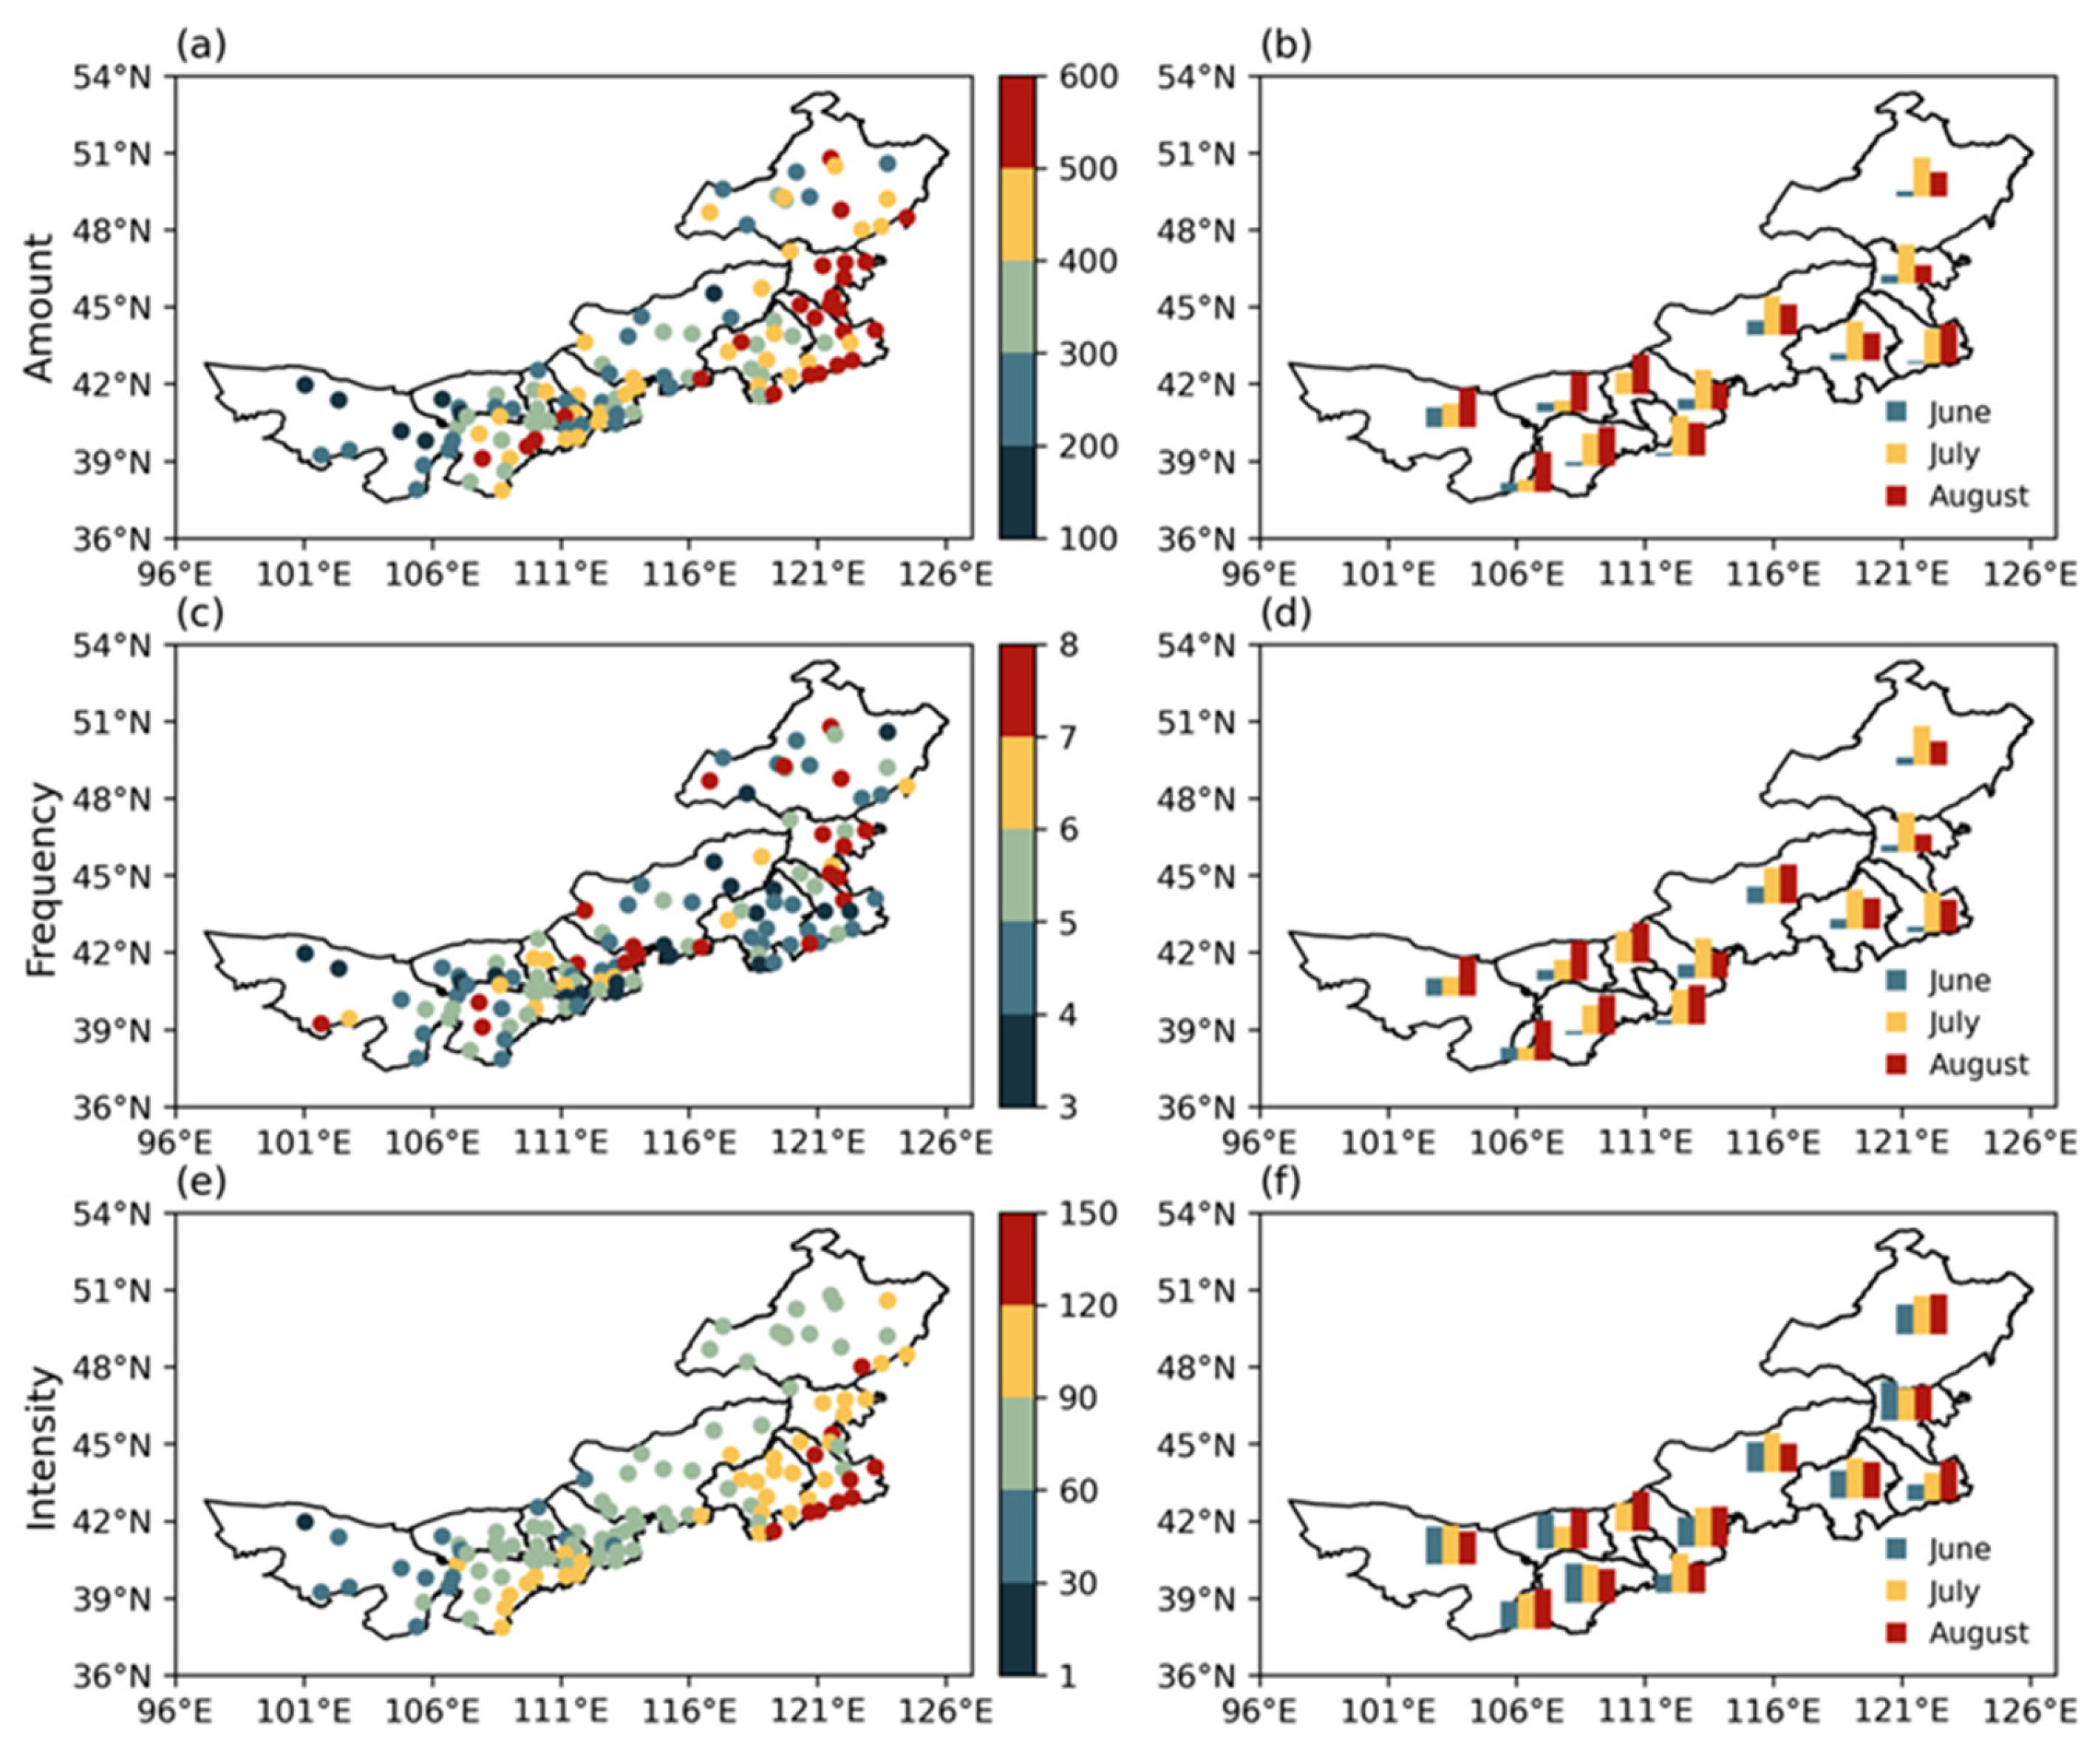
Figure 4.
Spatial patterns of long-term summer total precipitation (TP) trends at 117 meteorological stations during 1981–2025. (a) TP amount (units: mm decade−1); (b) TP frequency (units: day decade−1); (c) TP intensity (units: mm day−1 decade−1). Pie charts represent the proportion of stations with positive and negative trends: blue circles denote positive trends, and red circles denote negative trends. Solid symbols indicate statistically significant trends at the 0.05 significance level.
Figure 4.
Spatial patterns of long-term summer total precipitation (TP) trends at 117 meteorological stations during 1981–2025. (a) TP amount (units: mm decade−1); (b) TP frequency (units: day decade−1); (c) TP intensity (units: mm day−1 decade−1). Pie charts represent the proportion of stations with positive and negative trends: blue circles denote positive trends, and red circles denote negative trends. Solid symbols indicate statistically significant trends at the 0.05 significance level.
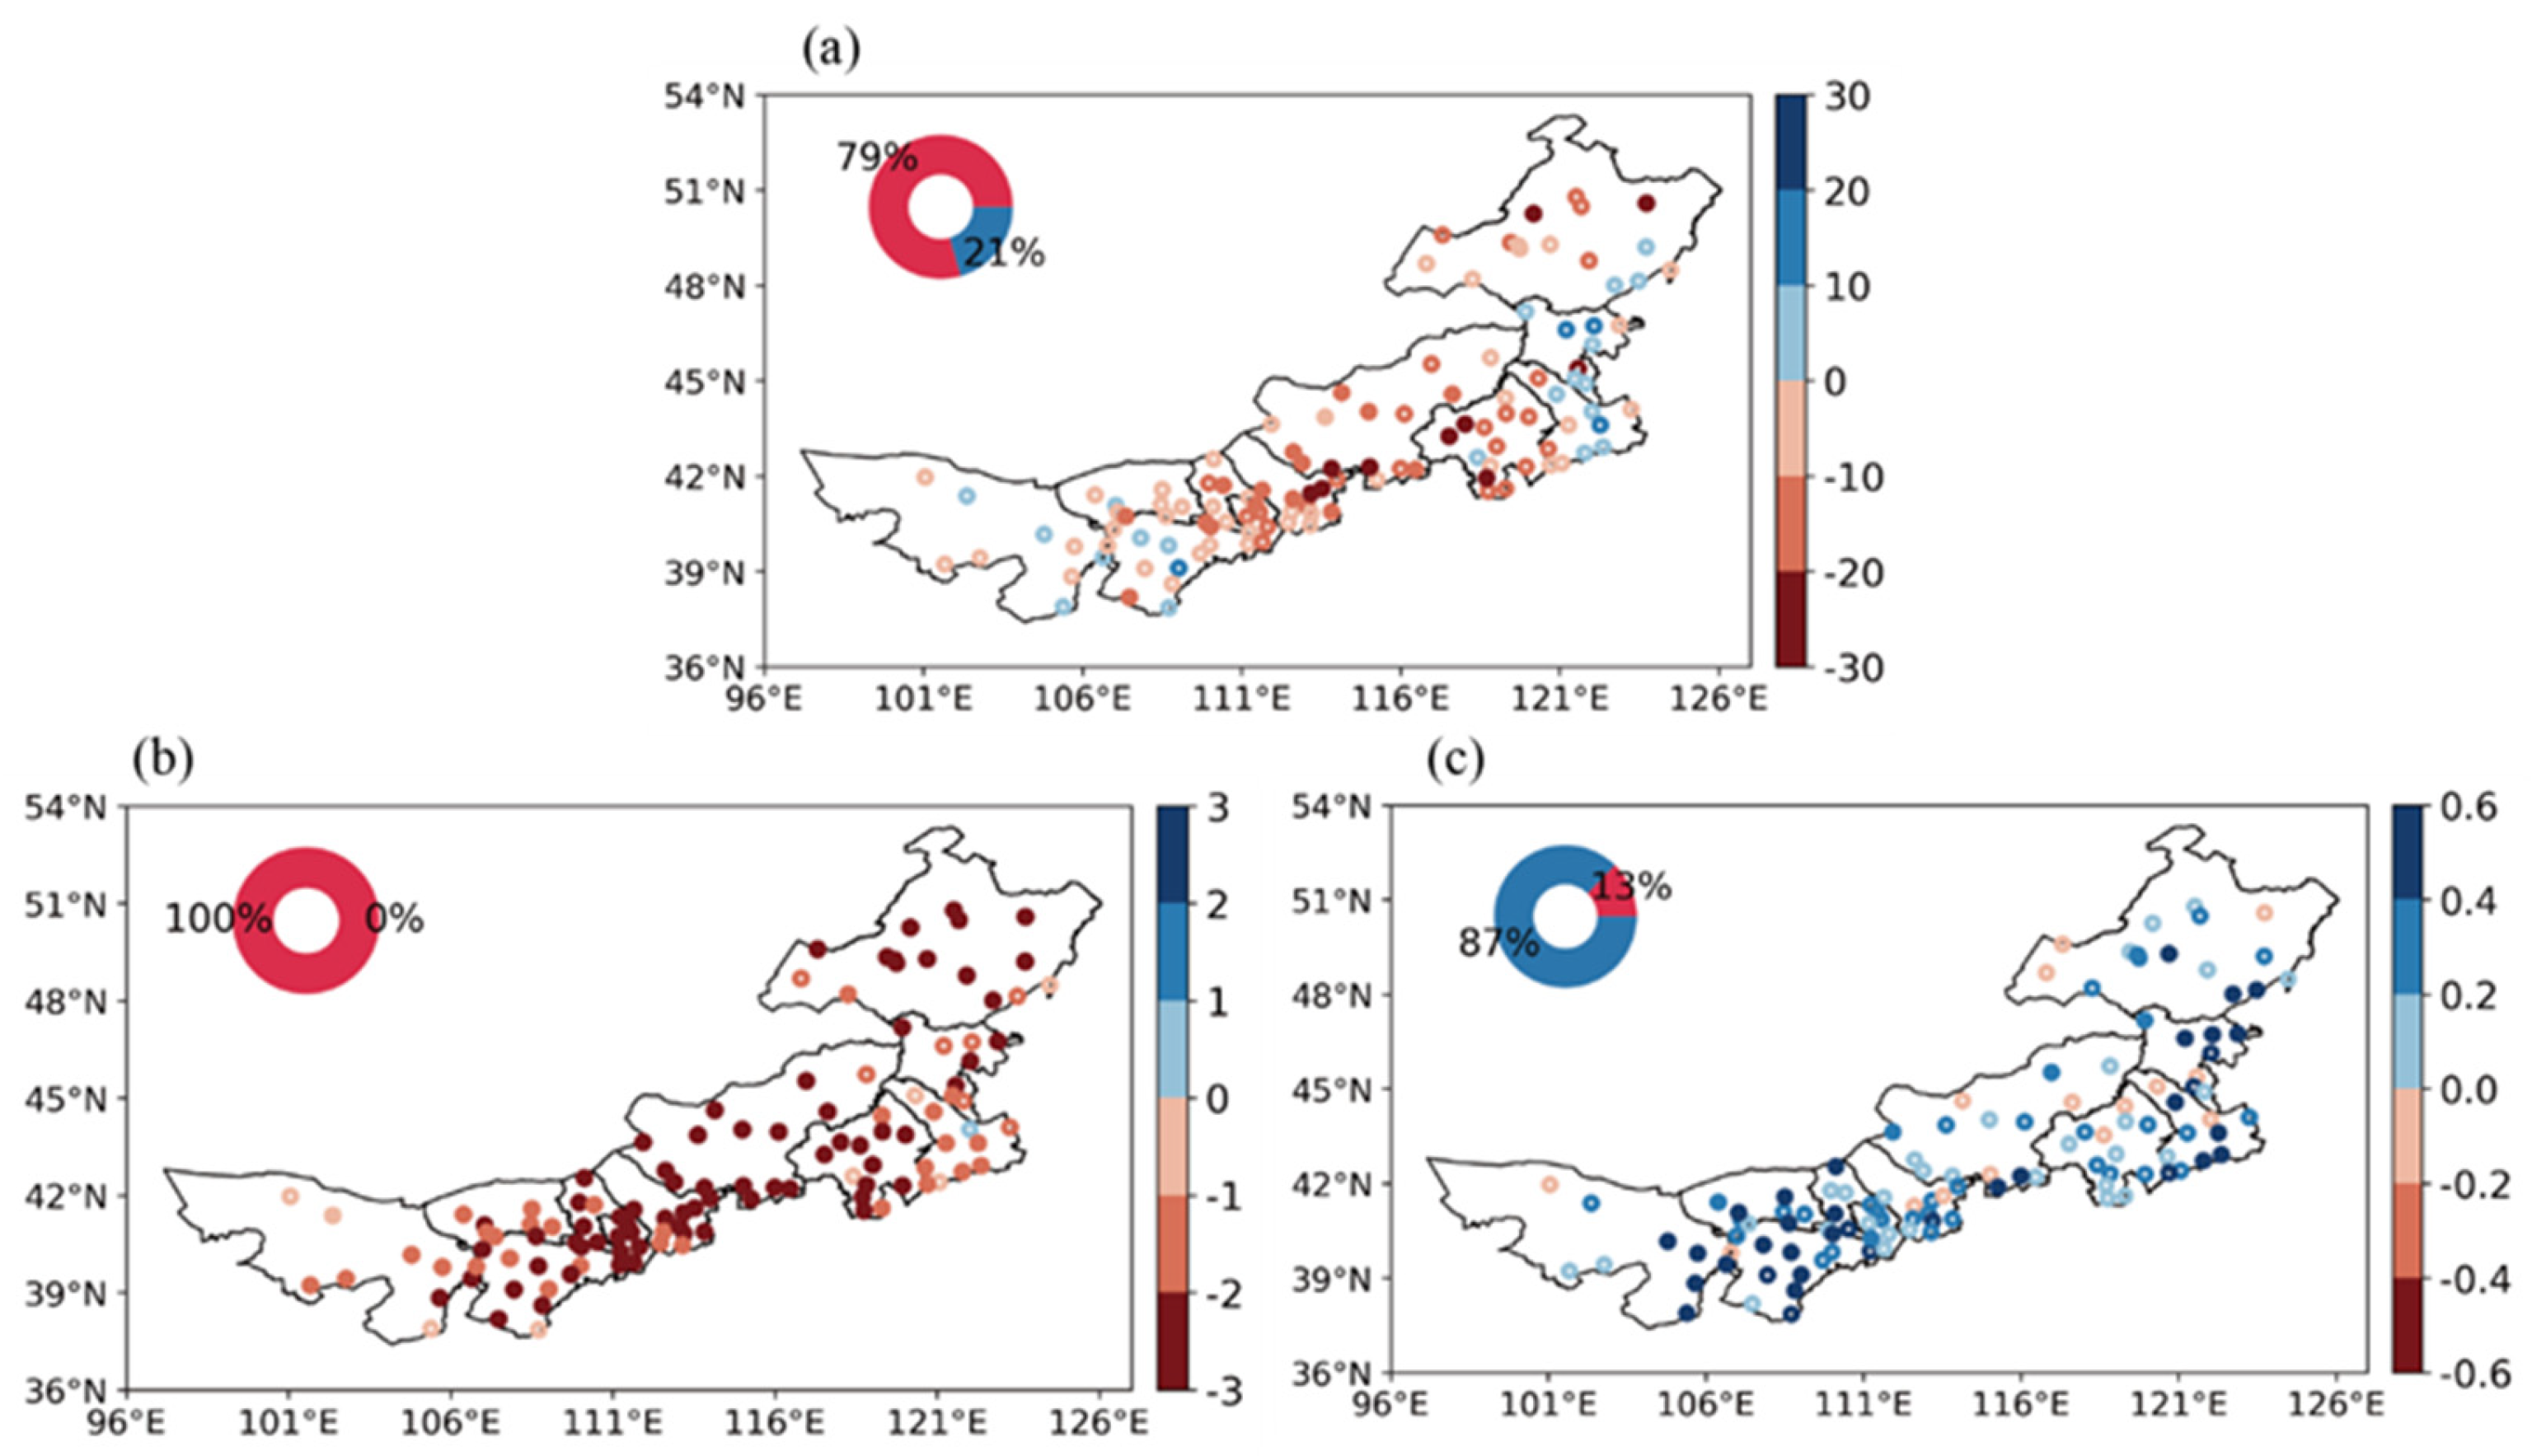
Figure 5.
Long-term trends in summer total precipitation (TP) during 1981–2025 across twelve prefecture-level cities and leagues, for the summer (June–August, JJA) and individual months. (a) TP amount (units: mm decade−1); (b) TP frequency (units: day decade−1); (c) TP intensity (units: mm day−1 decade−1). Black squares denote statistically significant trends at the 0.05 significance level.
Figure 5.
Long-term trends in summer total precipitation (TP) during 1981–2025 across twelve prefecture-level cities and leagues, for the summer (June–August, JJA) and individual months. (a) TP amount (units: mm decade−1); (b) TP frequency (units: day decade−1); (c) TP intensity (units: mm day−1 decade−1). Black squares denote statistically significant trends at the 0.05 significance level.
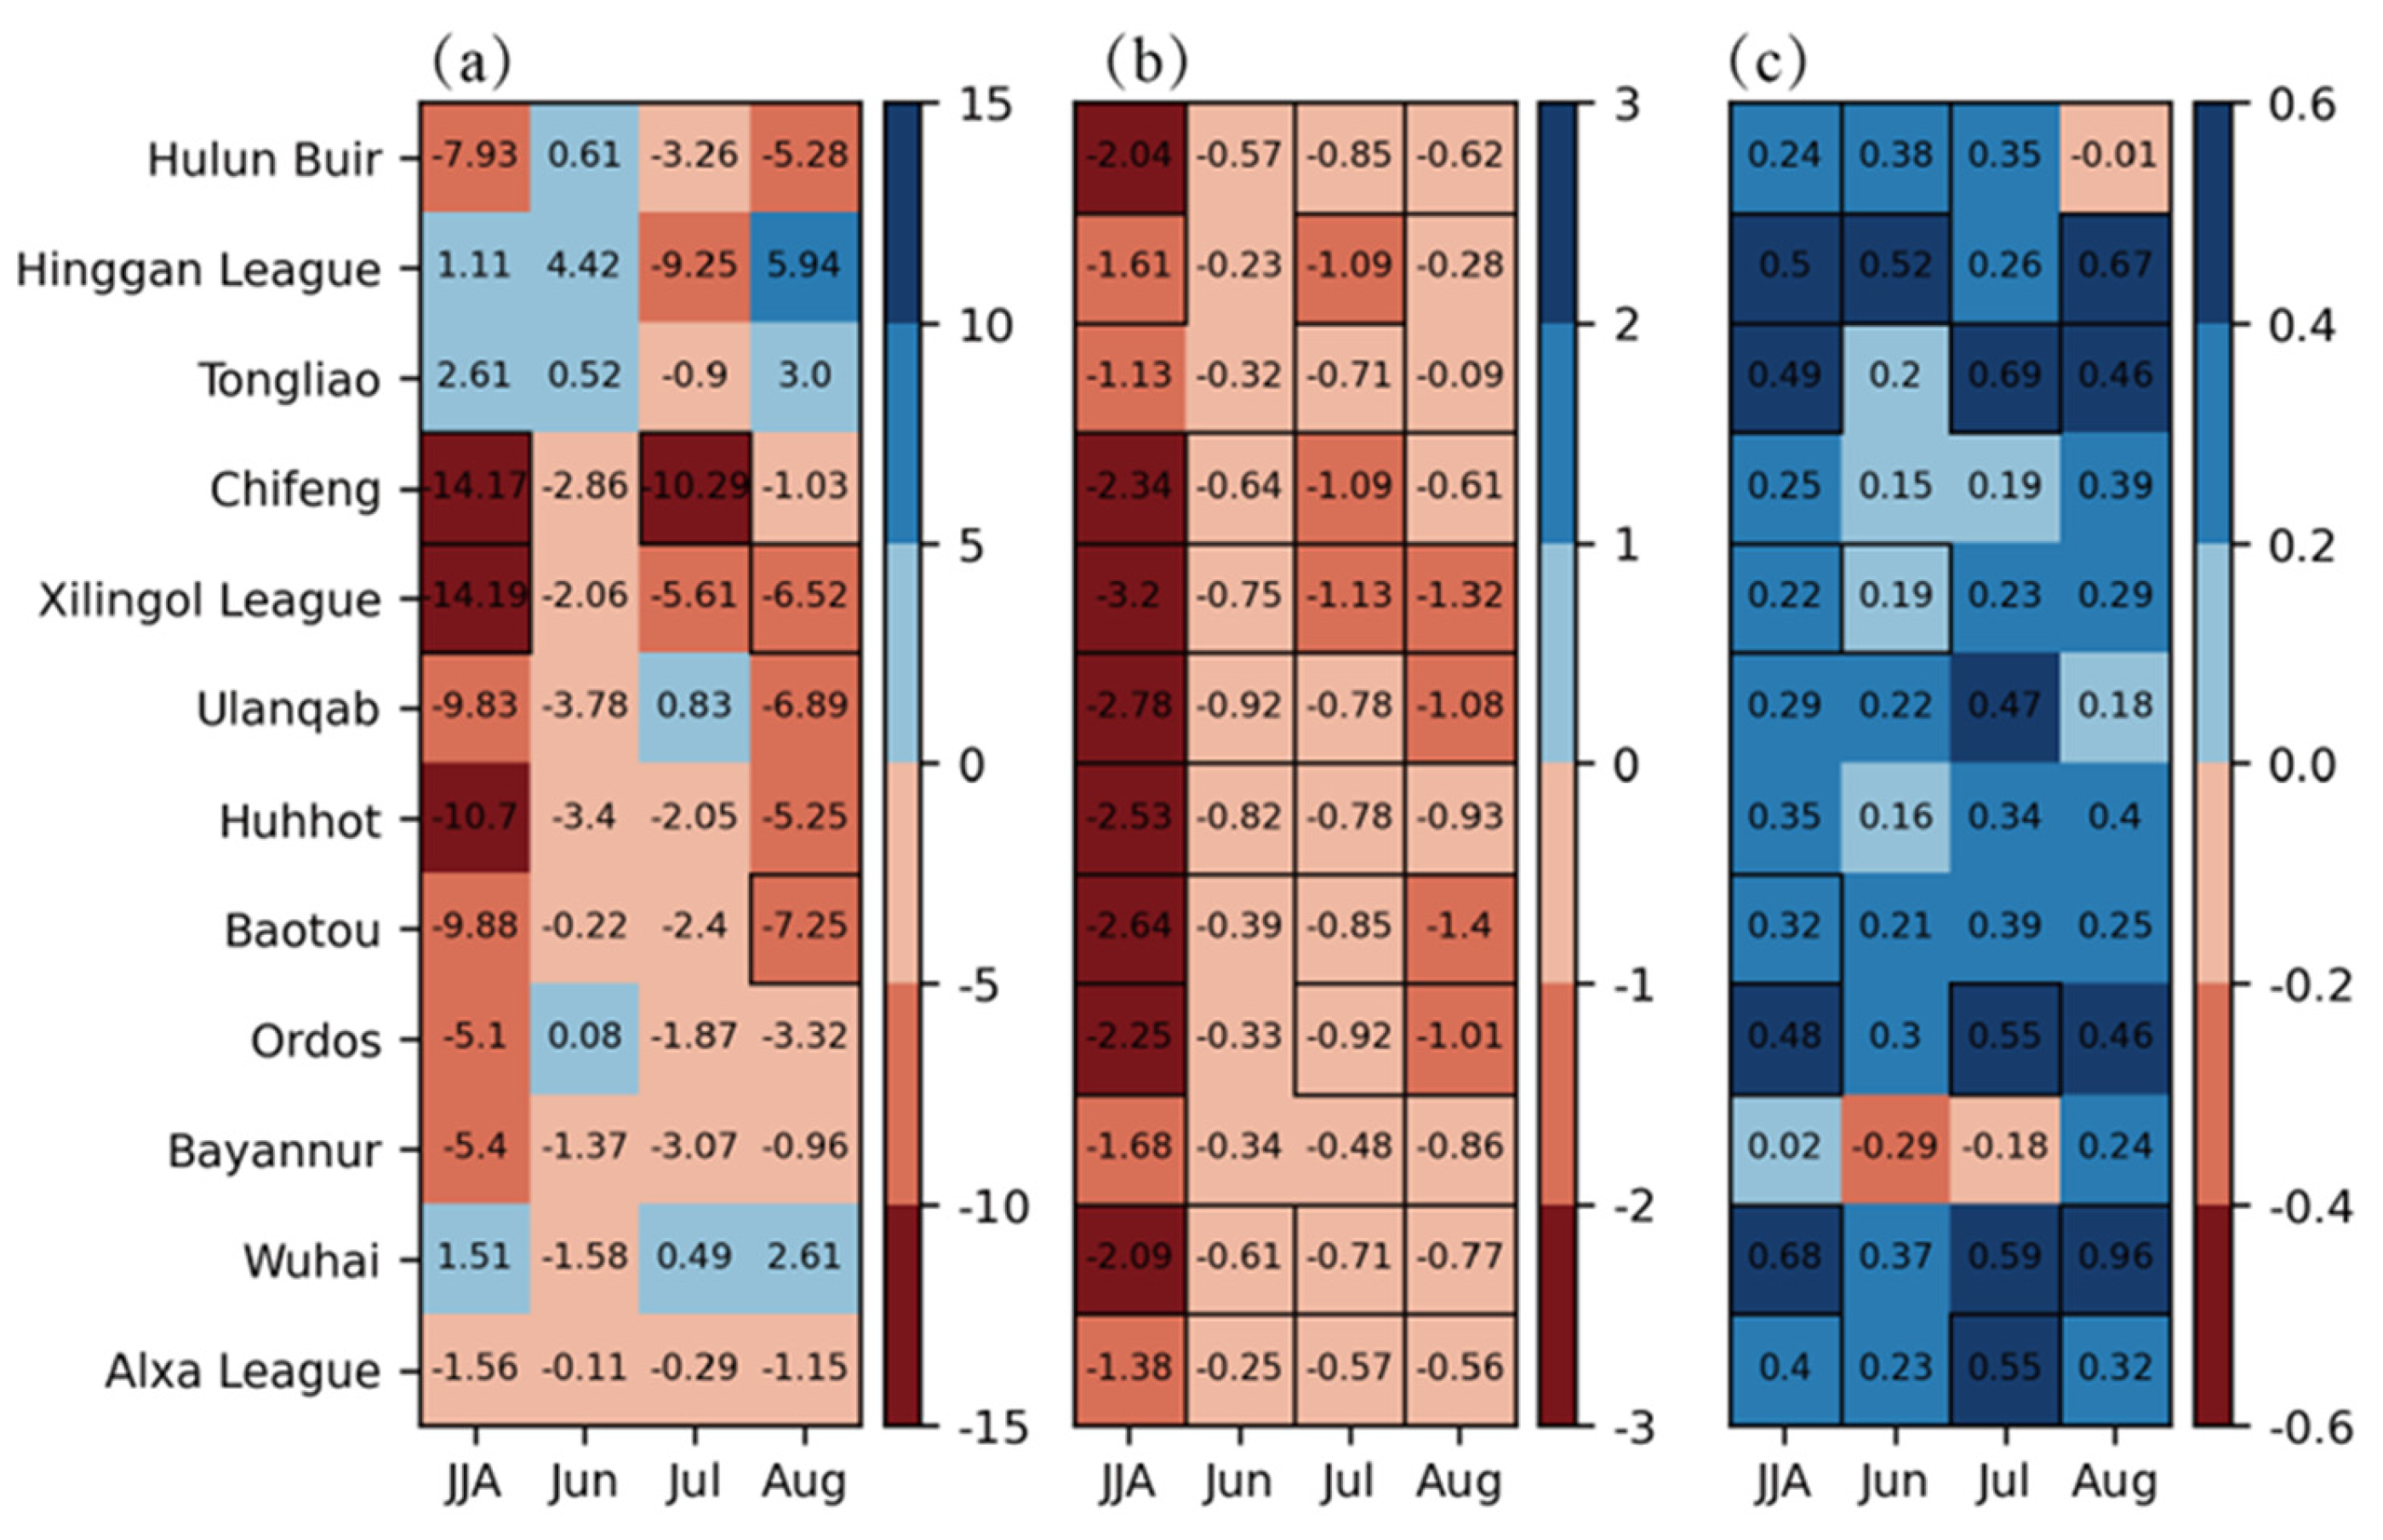
Figure 6.
Same as Figure 5, but for extreme precipitation (EP).
Figure 6.
Same as Figure 5, but for extreme precipitation (EP).
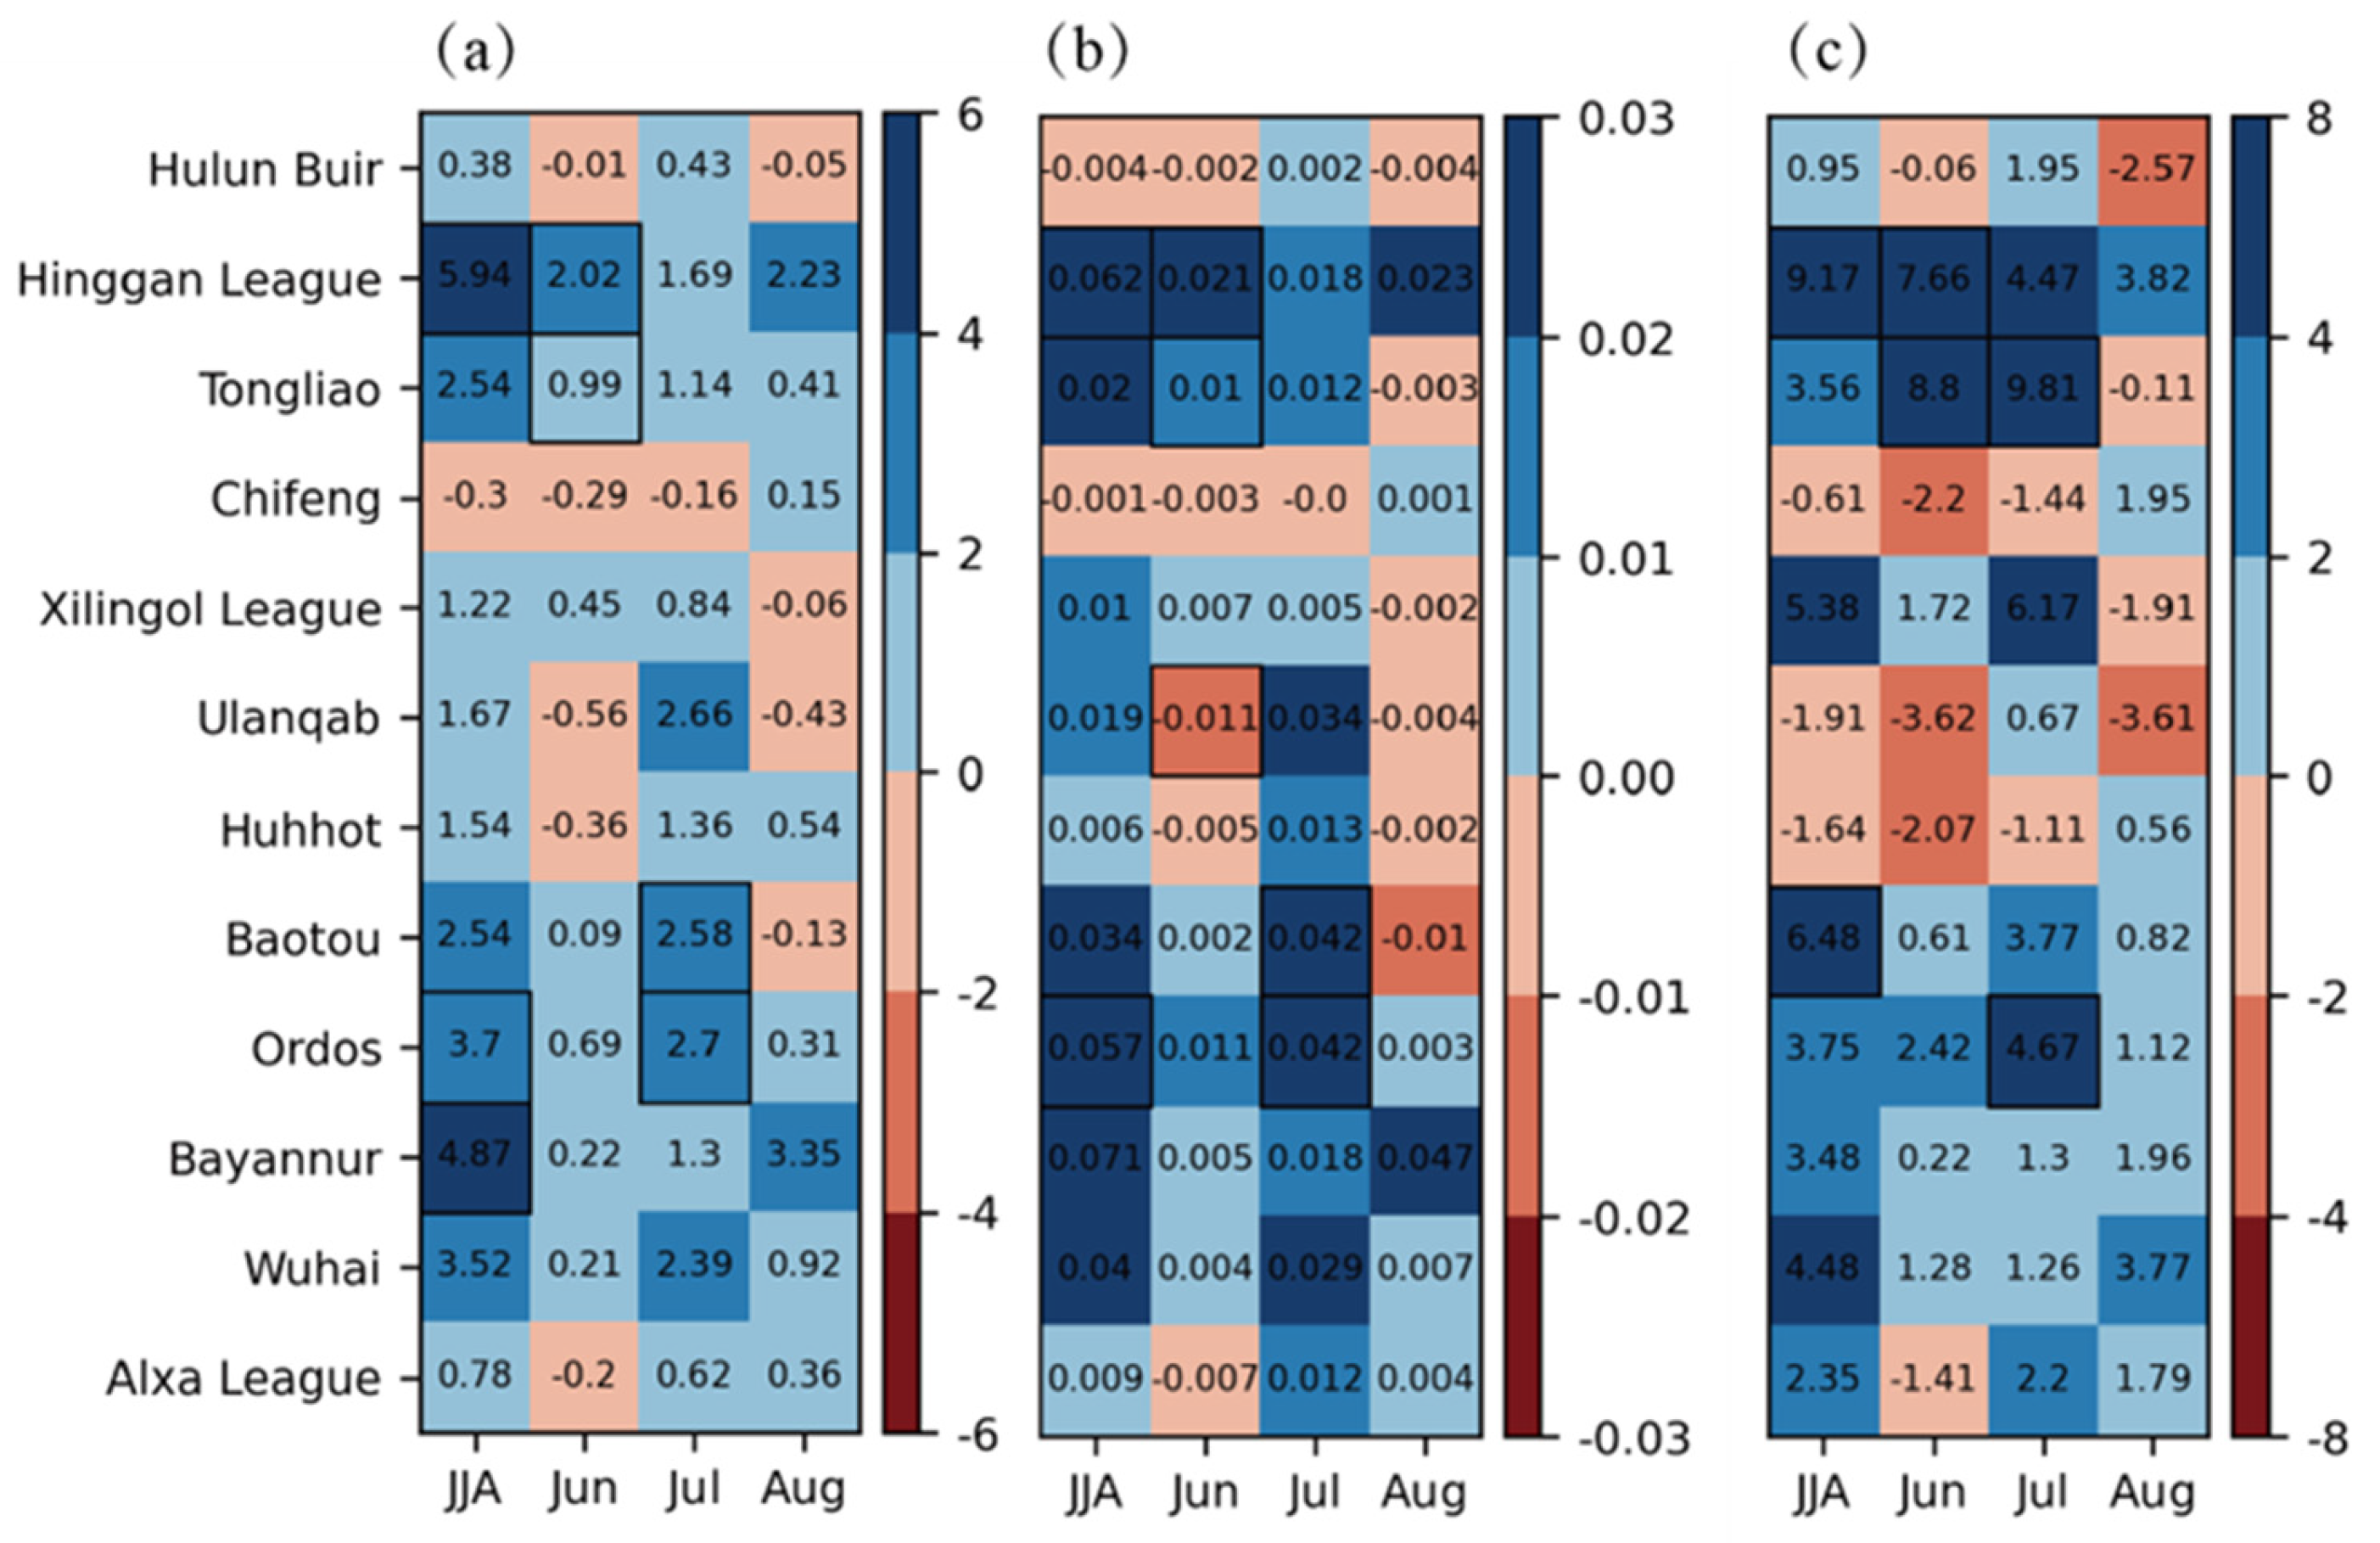
Figure 7.
Interannual variations of total precipitation (TP) (black line), frequency (red line) and intensity (blue line) in JJA across different regions of IM, for the periods 1981–1998 and 1999–2025. (a) Whole IM, (b) Eastern IM, (c) Central IM, (d) Western IM. (Dashed lines denote original annual values; solid lines represent 7-year moving averages. “m” indicates the mean values before and after 1998; “s” denotes decadal slopes; * marks trends statistically significant at the 0.05 level.).
Figure 7.
Interannual variations of total precipitation (TP) (black line), frequency (red line) and intensity (blue line) in JJA across different regions of IM, for the periods 1981–1998 and 1999–2025. (a) Whole IM, (b) Eastern IM, (c) Central IM, (d) Western IM. (Dashed lines denote original annual values; solid lines represent 7-year moving averages. “m” indicates the mean values before and after 1998; “s” denotes decadal slopes; * marks trends statistically significant at the 0.05 level.).
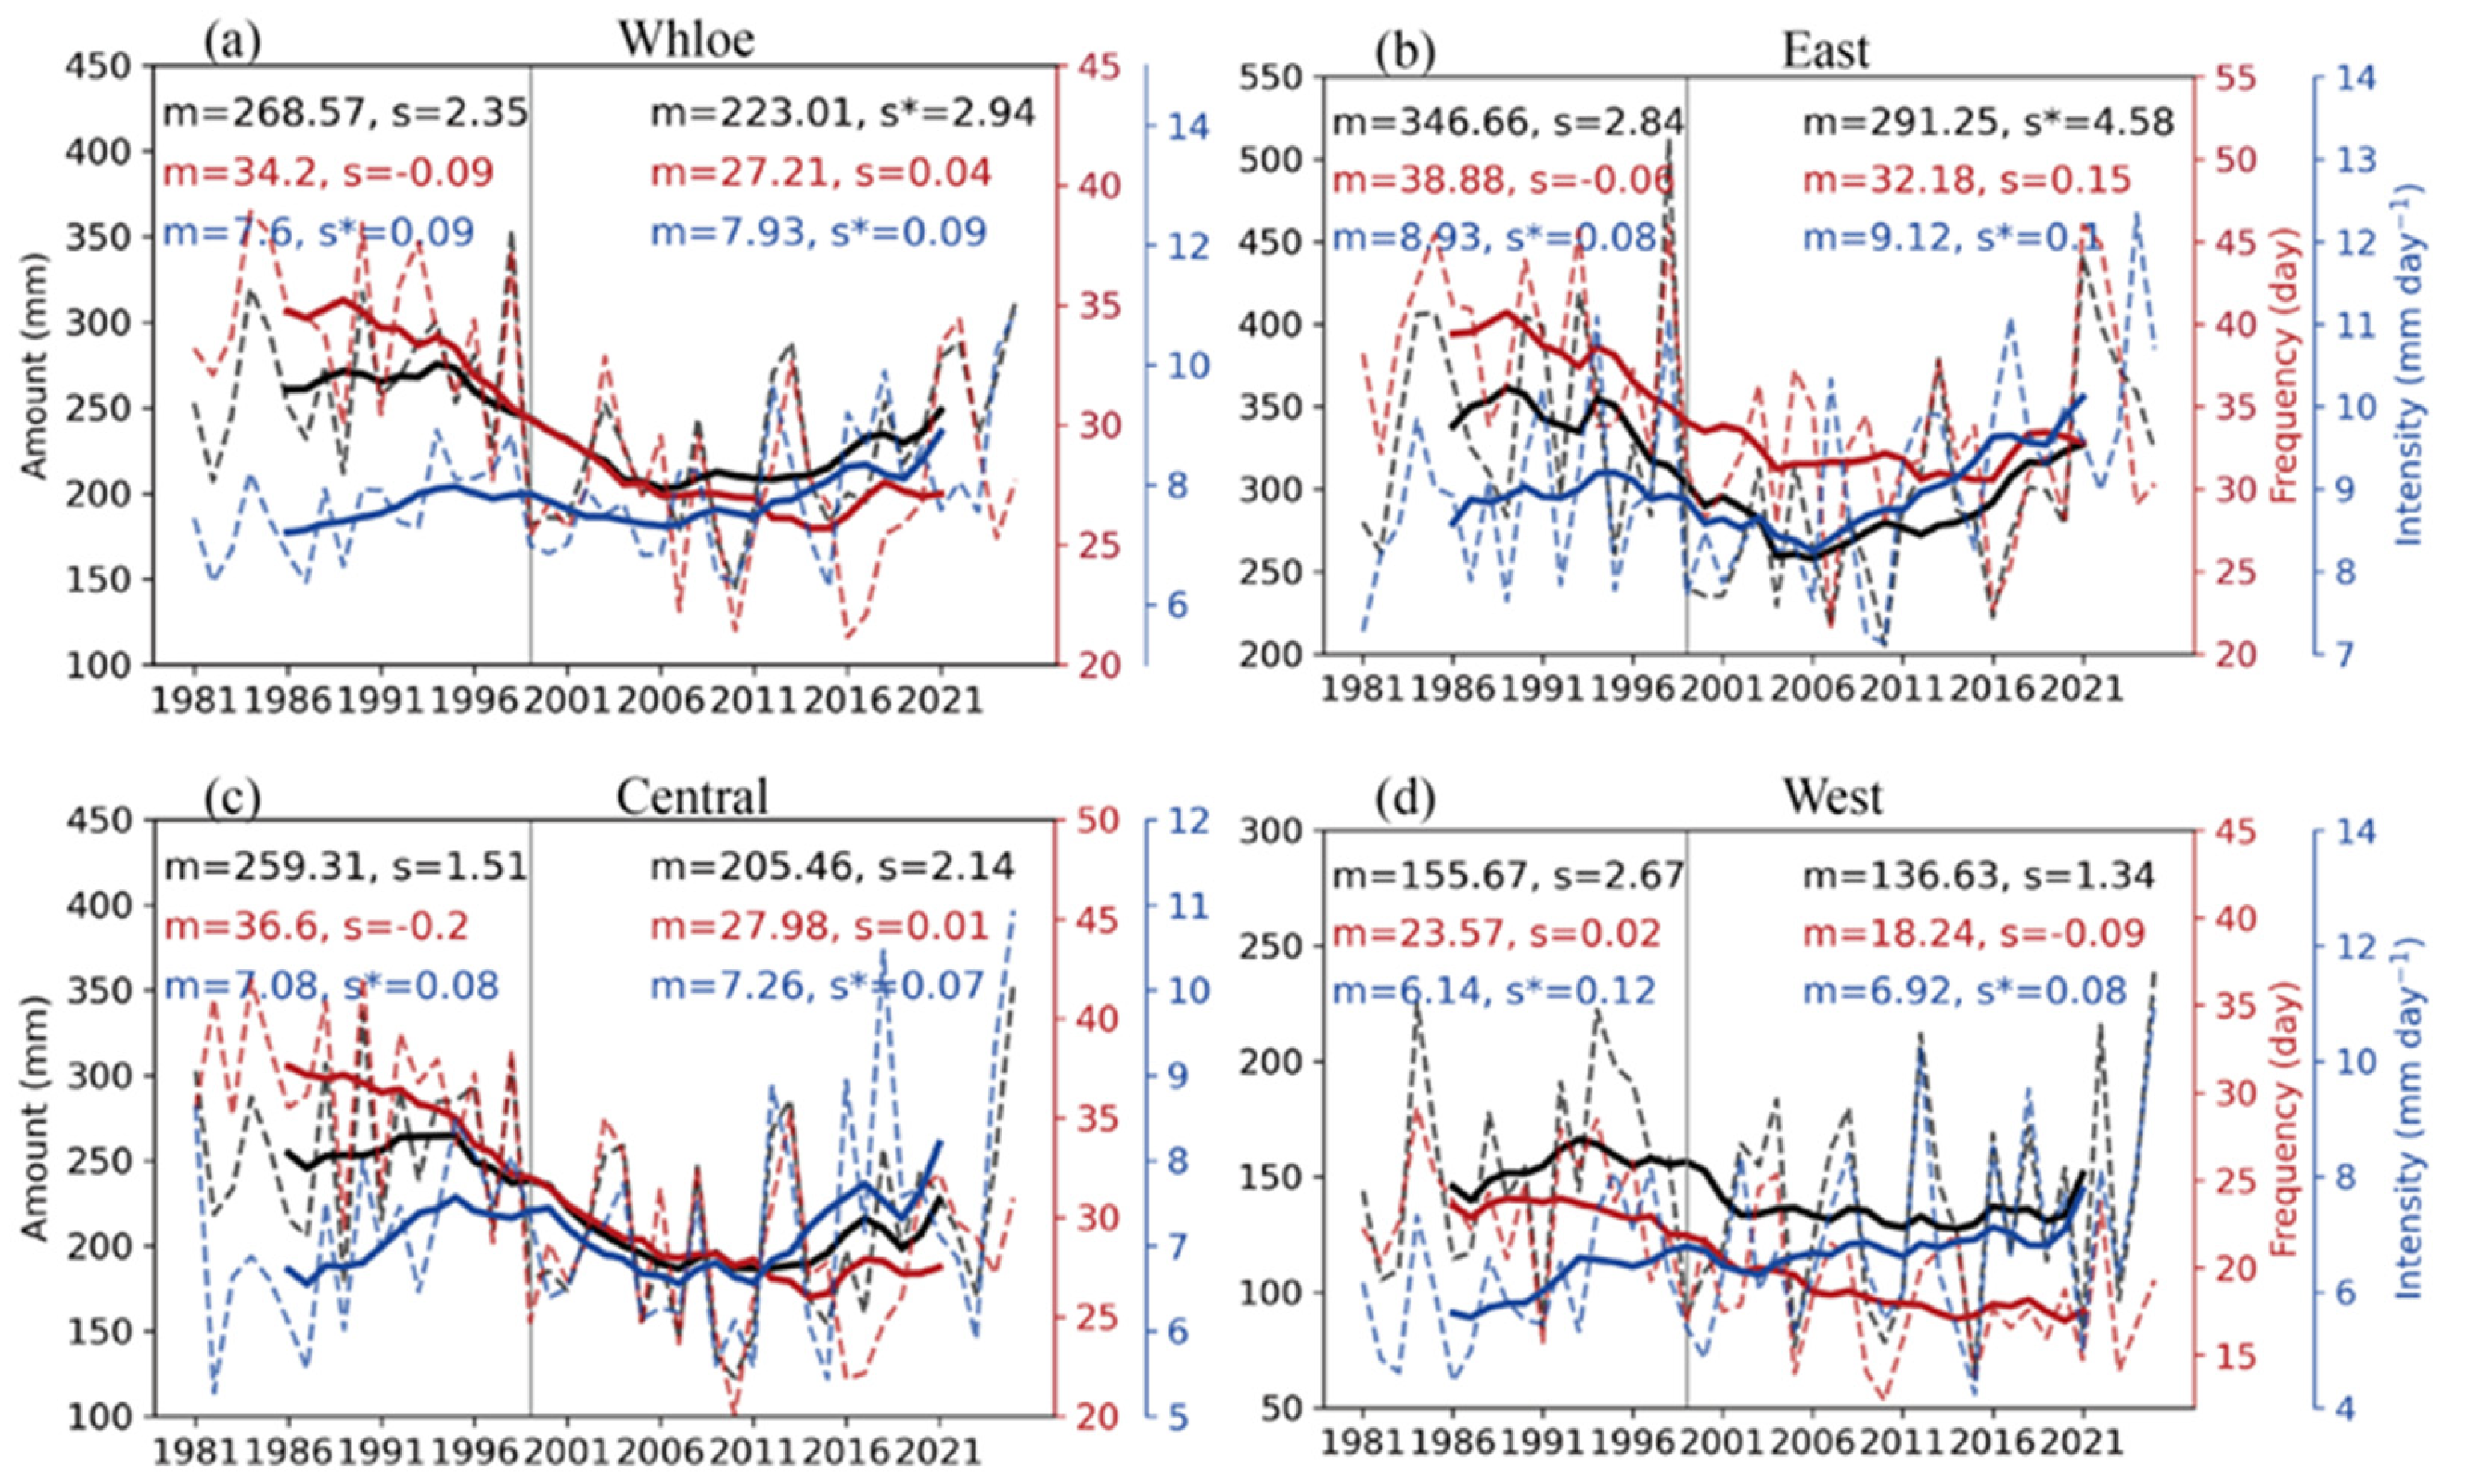
Figure 8.
Same as Figure 7, but for extreme precipitation (EP).
Figure 8.
Same as Figure 7, but for extreme precipitation (EP).
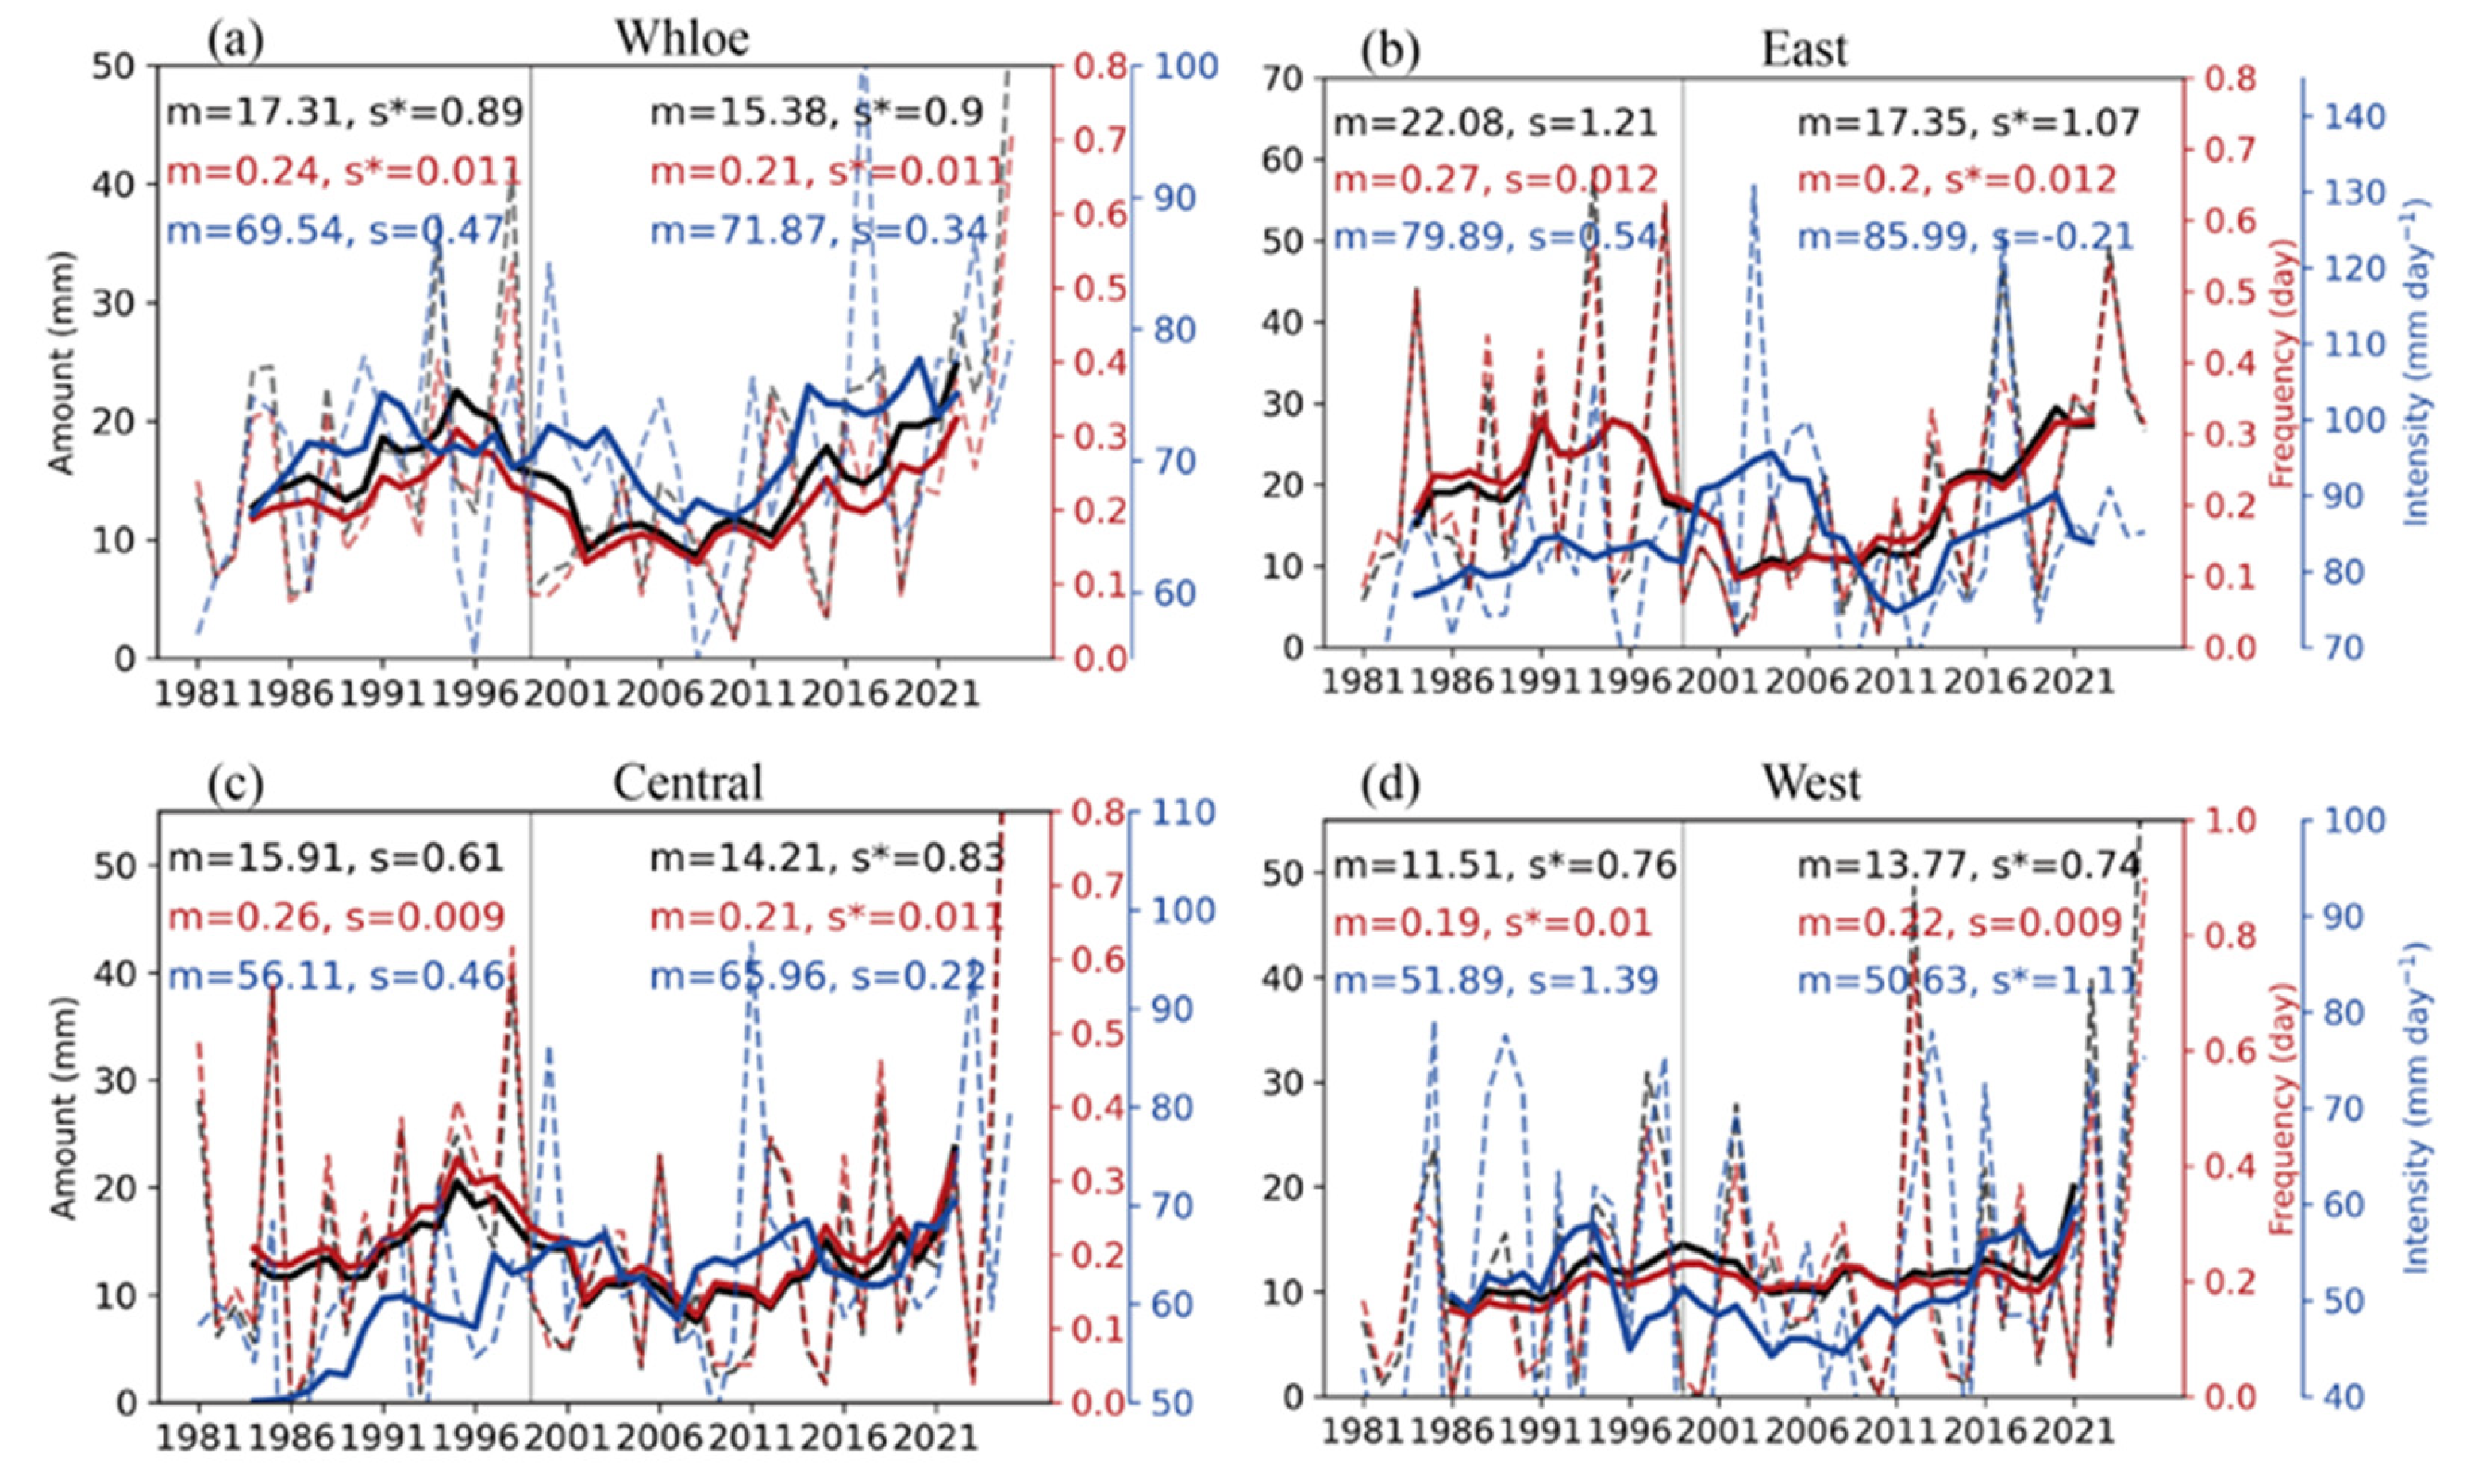
Figure 9.
Ratios of mean precipitation change and contributions of frequency and intensity to amount change after the 1998 abrupt change across IM and its subregions. (a) TP; (b) EP.
Figure 9.
Ratios of mean precipitation change and contributions of frequency and intensity to amount change after the 1998 abrupt change across IM and its subregions. (a) TP; (b) EP.
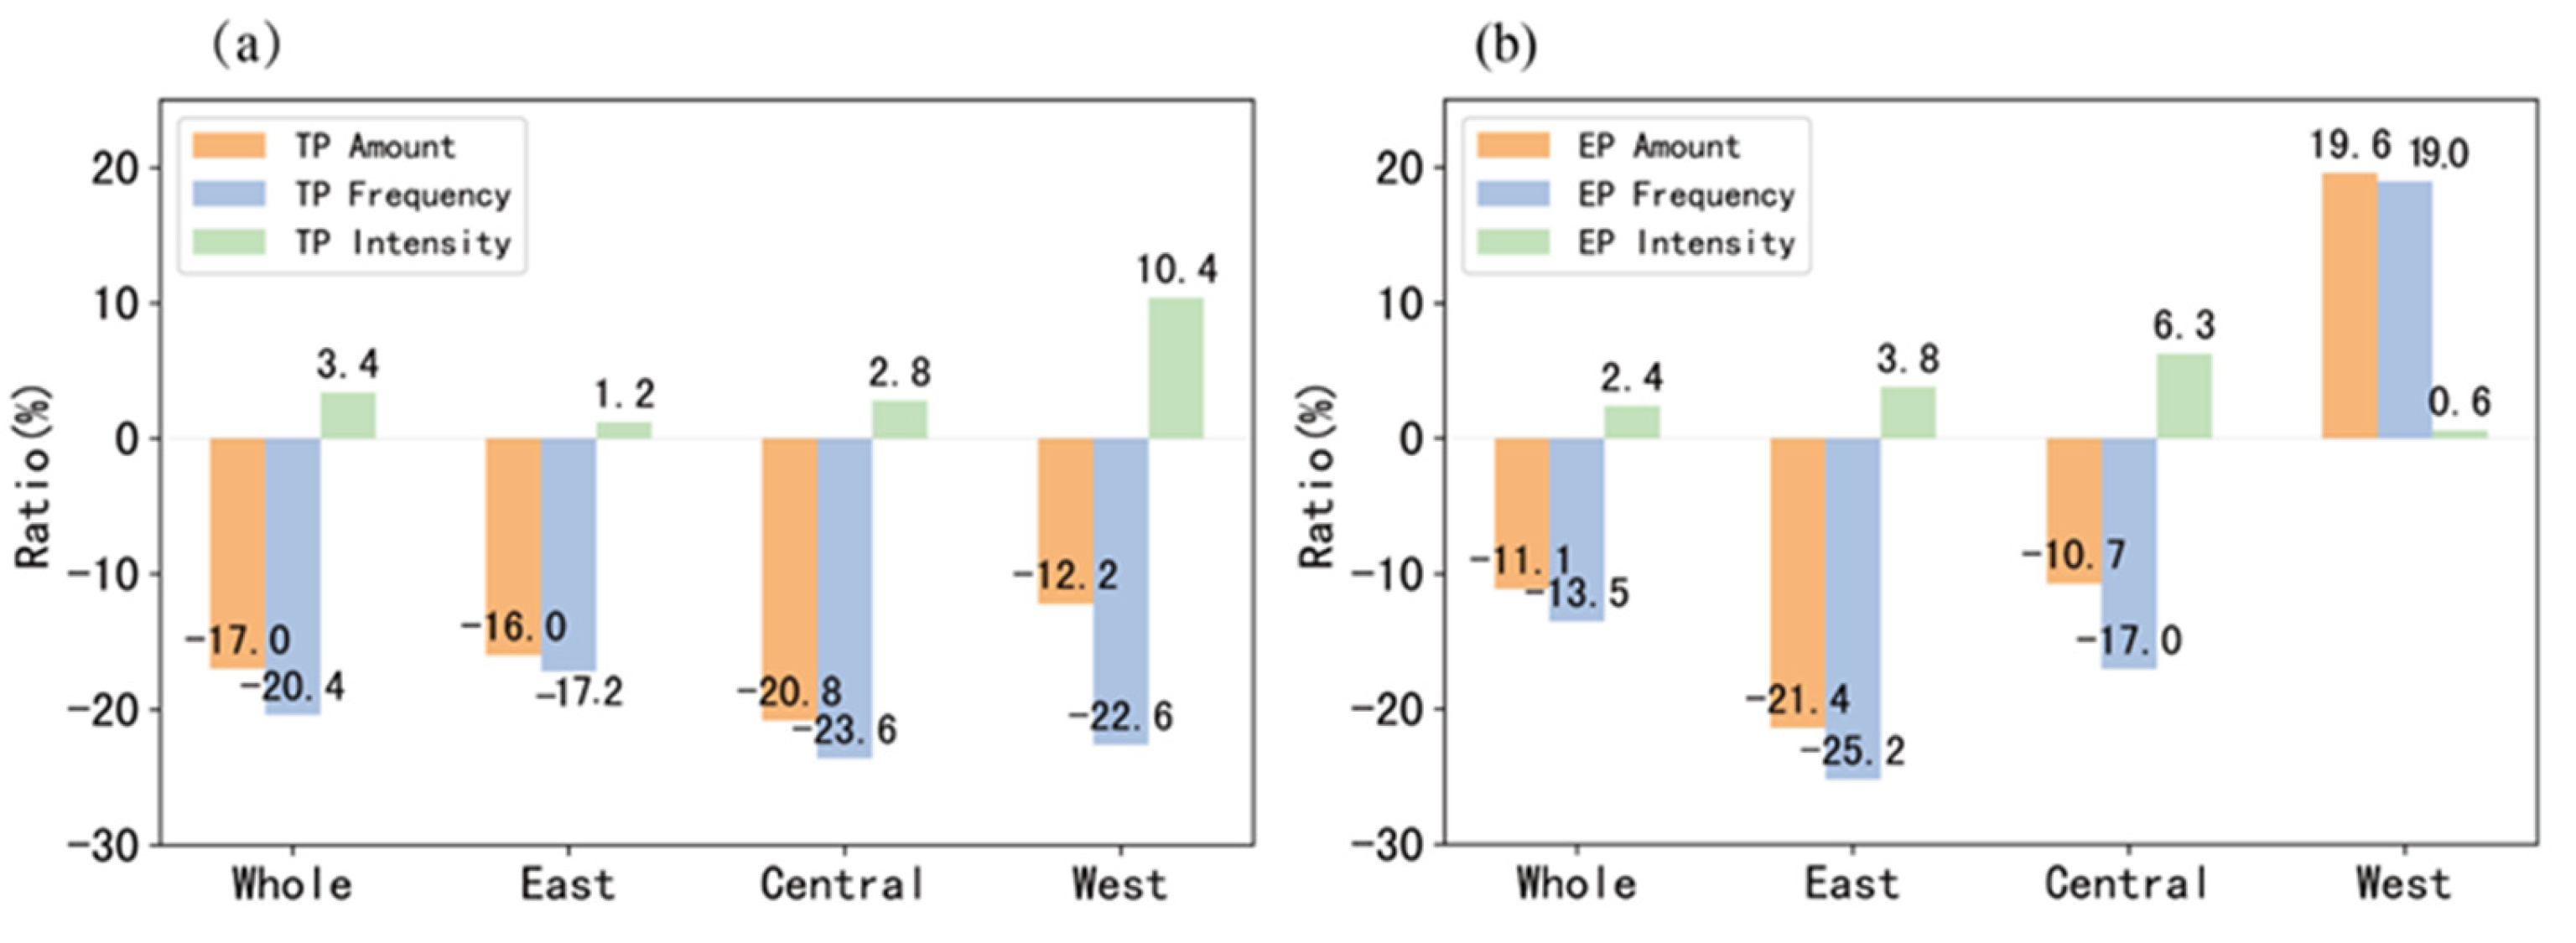
Figure 10.
Temporal variations of 2-m air temperature (T2m), relative humidity (RH), and total column water vapor (TCWV) across IM, and their detrended correlations with summer TP frequency and intensity. (a, c, e) Time series of meteorological variables, showing linear trends and mean values before and after the 1998 abrupt change. (b, d, f) Scatter plots of detrended correlations between TP metrics and meteorological variables; ** indicates significance at the p < 0.01 level.
Figure 10.
Temporal variations of 2-m air temperature (T2m), relative humidity (RH), and total column water vapor (TCWV) across IM, and their detrended correlations with summer TP frequency and intensity. (a, c, e) Time series of meteorological variables, showing linear trends and mean values before and after the 1998 abrupt change. (b, d, f) Scatter plots of detrended correlations between TP metrics and meteorological variables; ** indicates significance at the p < 0.01 level.
Disclaimer/Publisher’s Note: The statements, opinions and data contained in all publications are solely those of the individual author(s) and contributor(s) and not of MDPI and/or the editor(s). MDPI and/or the editor(s) disclaim responsibility for any injury to people or property resulting from any ideas, methods, instructions or products referred to in the content. |
© 2026 by the authors. Licensee MDPI, Basel, Switzerland. This article is an open access article distributed under the terms and conditions of the Creative Commons Attribution (CC BY) license.
Copyright: This open access article is published under a Creative Commons CC BY 4.0 license, which permit the free download, distribution, and reuse, provided that the author and preprint are cited in any reuse.


