
Submitted:
24 June 2026
Posted:
25 June 2026
You are already at the latest version
Abstract
The quality of sweet tamarind fruit, as determined by its total soluble solids (TSS), titratable acidity (TA), and TSS/TA ratio, is important for consumer satisfaction. Nondestructive techniques are therefore required to assess the quality of sweet tamarind fruit. This study investigated whether near-infrared hyperspectral imaging (NIR-HSI) in the wavelength range of 935–1720 nm can be used as a non-destructive method to assess TSS, TA, and the TSS/TA ratio of sweet tamarind fruit and to classify it under commercial standards. NIR-HSI, combined with deep learning and chemometrics, was applied for quantification and qualification analyses. Calibration models for determining TSS, TA, and the TSS/TA ratio were developed using partial least squares regression (PLSR) and support vector machine regression (SVMR). A combination of 1st derivative and SNV spectral pretreatment, was optimized to establish an SVMR model for TSS determination. MSC spectral pretreatment was optimized to develop the SVMR model for TA assessment, and the 1st derivative spectral pretreatment was optimized to establish an SVMR model for the TSS/TA ratio. Correlation coefficients of prediction (Rp) of 0.959, 0.961, and 0.956 were obtained with root mean square errors of prediction (RMSEP) of 1.102%, 0.369%, and 11.282 for TSS, TA, and the TSS/TA ratio evaluation, respectively. Partial least squares discriminant analysis (PLS-DA) and support vector machine classification (SVMC) were used for classifying sweet tamarind fruit under a commercial acidity standard ( 4%). The SVMC with SNV spectral pretreatment produced the best prediction results for distinguishing standard and off-standard sweet tamarind fruit with an 82.86% accuracy. NIR HSI can be used to non-destructively predict the quality of tamarind fruit. It can be applied for online sorting to evaluate individual sweet tamarind fruits for grading and quality control in factory environments.
Keywords:
calibration
; classification
; non-destructive
; prediction
; spectra
1. Introduction
Tamarind (Tamarindus indica L.) is a vital leguminous species in a member of the Fabaceae family [1]. Its origin is tropical Africa, but currently the tamarind tree is widely cultivated across tropical and subtropical regions, including India, Pakistan, Thailand, and the Caribbean [2]. There are many tamarind varieties and cultivars, but they are generally classified into sweet and sour depending on their flavor and morphological characteristics [3]. Sweet tamarind is a tropical fruit well-known for its unique taste arising from its balanced sweetness and acidity. It is also nutritionally dense, providing a rich source of essential nutrients and bioactive compounds that contribute to various health benefits [2]. Sweet tamarind is a commercially important tropical fruit [4]. Global exports of fresh sweet tamarind exceeded 1.2 million metric tons in 2024, with a total value of over 2 billion USD [5].
Sweet tamarind is an elongated, pod-like legume comprising three distinct layers: a brittle, light-to-dark brown shell (exocarp); a soft, sticky pulp (mesocarp); and seeds. Upon ripening, the pulp develops a deep brown hue and its signature sweet-and-sour flavors. Inside this pulp are glossy, flattened seeds that range in color from dark brown to ebony [6]. Sweet tamarind predominantly contains tartaric acid, which remains upon ripening and is accompanied by increased sugar levels [7,8]. Tamarind pulp contains low amounts of water, high levels of carbohydrate, protein, and minerals [9]. Reference [10,11] reported that customer preferences for sweet tamarind depended on the maturity as well as the sugar and acid content, which are related to their flavor. Despite high market demand, producers and exporters face a challenge of inconsistent sweetness and acidity. For instance, the levels of sugar and acid are important for producing sauces that use tamarind as a raw material. The fruits’ internal attributes cannot be assessed by conventional visual inspection. Chemical analysis of total soluble solids (TSS) and titratable acidity (TA) is time-consuming, destructive, labor-intensive, and environmentally unfriendly owing to the use of chemicals [12]. Therefore, a non-destructive method for quality analysis would be very useful. Near-infrared spectroscopy (NIR) combined with chemometrics has been used as a scalable tool for rapid screening in various agricultural applications and in the food supply chain [13,14]. NIR is a rapid and non-destructive technique. Earlier research reports of its wide application for non-destructive food quality testing, especially for the quality of apples [15], mangoes, tangerines, and avocados [16], grapes [17], lychee [18], and passion fruit [19]. However, conventional NIR yields spectral information only at the point of measurement. Therefore, for large fruits, many measurements at various points of each fruit body are needed. Then, this spectral information is averaged to yield representative values. This is difficult to do in a production environment. Previously, conventional NIR was used for sweet tamarind fruit with long pods to predict internal qualities [10,20]. Also, it was used for pineapples to evaluate their nitrate levels [21]. Various segments of each fruit had to be measured, which was labor- and time-intensive.
NIR can be combined with hyperspectral imaging (HSI) in an advanced method that integrates imaging and spectral techniques into a single system. A three-dimensional data cube is provided by NIR HSI, which can be used to create a spatial map [22,23]. The vibrational behavior of organic molecules provides the complex data obtained from NIR-HSI. It yields information about C-H, C-O, O-H, and C-C groups [24]. Thus, the vibration energy of organic molecules in a sample can be detected using NIR-HSI. This means that the detection of specific chemical groups is possible from the vibrational behavior of each organic molecule. NIR-HSI is therefore a rapid and non-destructive technique that enables online analysis of fruits based on their chemical content.
The absorption characteristics of materials acquired by NIR-HSI and chemometric algorithms can be applied to obtain more useful and understandable data for quantification and qualification models [26,26]. For quantification, quality aspects of fruit can be predicted by a model employing independent spectral variables and their true chemical composition as dependent variables. Partial least squares regression (PLSR) is suitable for analyzing a large number of independent variables [27]. PLSR uses spectral data as independent variables to predict the chemical content of tested fruit as dependent variables [28]. Support vector machine regression (SVMR) has also been utilized to enhance the quantification of the chemical component. As a supervised machine learning algorithm, SVMR often employs a radial basis function (RBF) kernel to map complex, non-linear data into a higher-dimensional space, enabling the construction of effective decision functions [29,30]. For qualification, partial least squares-discriminant analysis (PLS-DA), which combines regression with linear discrimination [31] and support vector machine classification (SVMC) is a powerful tool that has non-linear classification capabilities. It can be used to resolve complex data relationships by mapping samples into a higher-dimensional space through a kernel function [32]. Previous studies of NIR-HSI have shown that this technique has potential applications for foods and agricultural materials such as litchi fruit [33], mangoes [34], curcumae radix [35], Angelica sinensis [36], apples and pears [37], persimmons [38], hazelnuts [39], kiwifruit [40], tapioca starch [41], cake [42], almonds [43], beef [44], lamb meat, lime [45], tomatoes [46], eggs [47,48], and mushrooms [49].
The quality of sweet tamarind fruit is based on TSS, TA, and the TSS/TA ratio, but these parameters cannot be visually determined. Regulatory requirements control the quality of sweet tamarind fruit in commerce. Acceptable sweet tamarind fruit should have a maximum TA of 4% [50]. Therefore, a nondestructive technique for predicting the TSS, TA, and TSS/TA ratio would be industrially useful. Since sweet tamarind fruits are long pods, representative data along the entire length is necessary for each fruit to establish a model for predicting its chemical content. Measuring spectral NIR-HSI images for each whole fruit is challenging. Also, NIR-HSI combined with deep learning and chemometrics for assessing sweet tamarind fruit has not been reported. Therefore, the objective of this research was to test tamarind fruit using NIR-HSI to nondestructively determine its TSS, TA, and TSS/TA ratio and classify standard and off standard intact fruit for commercial quantification and qualification of its quality.
2. Materials and Methods
2.1. Tamarind
A total of 115 samples of the sweet tamarind fruit cultivar ‘Si Thong’ grown in Petchabun Province, Thailand, were used in this study. All samples were commercial grade, i.e., without cracks and defects. They were stored in an air-conditioned room at 25°C for one day before measurements to avoid temperature effects.
2.2. Spectral and Spatial Data Acquisition
Each sweet tamarind fruit was individually scanned using a push-broom hyperspectral camera (Specim FX17e, Spectral Imaging Ltd., Oulu, Finland) in a reflectance mode over the wavelength range of 935–1720 nm and an interval of 3.46 nm (Figure 1). Each fruit was placed in a moving tray with a scanning speed of 15 mm/s, with an exposure time of 5.5 ms. A black reference was obtained when the light source was switched off, and a black cap covered the lens. The white reference was obtained directly from the Spectralon bar. Additionally, each whole sweet tamarind fruit was separated into its pulp, seeds, and shells. All the parts were individually scanned to acquire their spectral information.
2.3. Chemical Analyses
After each sweet tamarind fruit was nondestructively scanned using the NIR-HSI system, it was peeled, and the pulp was separated from its seeds and shell. Five grams of the pulp was added to 45 g of distilled water and homogenized (IKA, T25 digital ULTRA-TURRAX®, Germany). It was then passed through a filter cloth to obtain a filtrate. The dilution factor (D) was calculated using Eq. 1.
The TSS of the filtrate was measured using a digital refractometer (PR101, Palette Series, Atago Co., Ltd., Tokyo, Japan) as outlined by Ref. [51]. Initially, the TSS of sweet tamarind pulp was calculated as the measured TSS multiplied by D. The average value from triplicate measurements was reported.
TA was determined by titration as outlined by Ref. [51]. The filtrate was titrated against 0.1 N sodium hydroxide (NaOH) using phenolphthalein as an indicator until the color changed to pink. The average titer volume used for titration was recorded, and the value of the titratable acidity was calculated using Eq. 2 as the percentage of tartaric acid equivalent with an acid correction factor (CF) of 0.0075.
where N is the normality of NaOH, T is the volume of NaOH for titration, D is the dilution factor, and S is the sample mass. Each determination for TSS and TA was done three times, and the average value was reported. The TSS/TA ratio of each sample that was an index of the fruit quality and maturity [52] was calculated.
2.4. Data Analysis
The procedure for data quantification and qualification analyses of sweet tamarind fruit in this study is presented in the block diagram shown in Figure 2. The spectral information obtained from NIR-HSI in each scan contained both the spectral data of sweet tamarind and its background. Background data had to be removed from the spectra to obtain only the spectral data of sweet tamarind fruit. This was done using principal component analysis (PCA). Spectral data represented the effects of the environment, instruments, and sample attributes such as light scattering, natural variability in shape and fruit size, and variations in effective path length [53]. Therefore, algorithmic spectral pre-treatment methods were applied, including Savitzky-Golay smoothing to eliminate noise, the first and second derivatives to correct baseline drifts, the multiplicative scatter correction (MSC), and the standard normal variate (SNV) to correct for signal scattering. The spectral data were varied to identify the optimal spectral pretreatment method for both quantitative and qualitative analyses [54,55].
For quantification analysis, the spectral data of samples in the 935–1720 nm wavelength range were used as independent variables, while TSS, TA, and the TSS/TA ratio were the dependent variables. All samples were divided into calibration and prediction sets. Calibration set samples were used to establish the calibration model. By comparison, the optimal spectral pretreatment method was selected based on the lowest root mean square error of cross-validation (RMSECV) and the highest correlation coefficient of cross-validation (Rcv). Calibration models using the spectral pretreatment methods were developed using PLSR and SVMR. The best-performing models were selected. The accuracy of the calibration models was determined by testing samples in the prediction set, considering the correlation coefficient of prediction (Rp), and root mean square error of prediction (RMSEP).
For qualification analysis, samples were categorized into a group of acceptable sweet tamarind fruits (TA ≤ 4%), designated as standard (-1), and a group of unacceptable sweet tamarind fruits (TA > 4%) was designated as off-standard (1). PLS-DA and SVMC were used for classifying groups of sweet tamarind fruit. Samples in the calibration set were used to establish the classification model, while those in the prediction set were employed for testing this model. The optimal spectral pretreatment method was also selected for the best classification. The performance of classification was evaluated by considering accuracy (Eq. 3) as the overall percentage of correct classification, specificity (Eq. 4) yielding the percentage of correct classification for the group of acceptable sweet tamarind fruit, sensitivity (Eq. 5) which is the percentage of correct classification for the group of unacceptable sweet tamarind fruit, and error rate (Eq. 6) yielding the overall percentage of incorrect classification [56].
where TN, TP, FN, and FP are the numbers of true negative, true positive, false negative, and false positive samples, respectively. Unscrambler X software (Version 10.4, CAMO Software AS, Oslo, Norway) and UmBio Evince hyperspectral image analysis software (Prediktera Evince, Version 2.7.5, Sweden) were used for statistical analysis.
Accuracy (%) = [(TP+TN)/Total] ×100
Specificity (%) = [TN/(TN+FP)] ×100
Sensitivity (%) = [TP/(TP+FN)] ×100
Error rate (%) = [(FP+FN)/Total] ×100
3. Results and Discussion
3.1. Spectral Data
All spectral images in the wavelength range of 935–1720 nm from 115 scans were acquired. The spectral image of each scan was separated into data for the sweet tamarind fruit and background using PCA. The background spectral image was removed, leaving only spectral data for the sweet tamarind fruit. The spectral image of each sweet tamarind fruit was defined as the region of interest (ROI). Since each pixel of the spectral image contained spectral information, the spectral data from each ROI were averaged. Average spectra of ROIs (N=115) were acquired as shown in Figure 3, and used as independent variables establishing calibration models in this study. The average spectra of the sweet tamarind fruit showed two main broad peaks at around 1180–1220 and 1400–1470 nm. This implied that there were combined peaks of various components in the sweet tamarind fruit. Then, the acquired original absorbance spectra presented overlapping overtone bands of components [57].
The average original absorbance spectra of pulp, seeds, shell, and whole fruit in the wavelength range of 935–1720 nm were acquired, as shown in Figure 4a. Baseline drift was observed in the average spectra of pulp, seed, shell, and whole fruit. The main peaks of the average spectra of the shell and whole fruit were not distinct compared to those of pulp and seed. Therefore, normalization was applied to the spectra (Figure 4b). The normalized absorbance spectra of pulp, seed, shell, and whole fruit showed similar features. The main peaks of pulp, seed, shell, and whole fruit were also at around 1200 and 1425 nm. Two main peaks presented the absorption band of the C-H second overtone at around 1180–1220 nm and the O-H first overtone at around 1400–1470 nm [58]. The results showed the absorption band of the second stretching peak of the C-H bonds at around 1200 nm, which was associated with the carbohydrate and sugar content [59,60]. An absorption band of the first stretching peak of the O-H bonds appeared at around 1425 nm, which was associated with water [61]. This is in agreement with reports that the carbohydrate content and moisture were high in the pulp, seeds, and shells of tamarind fruit [62,63].
The second derivative spectral pretreatment was applied for separating the overlapping peaks to determine the individual peaks of the components [64]. Using the second derivative spectrum enabled the separation of overlapping peaks. Peaks of other components were ascribed to the vibrational behavior of organic molecules, as previously reported by Ref. [65,66]. The average second derivative spectrum of the sweet tamarind fruit exhibited component peaks at wavelengths of negative peaks, as shown in Figure 5. The negative peaks of the second derivative spectrum of the sweet tamarind fruit showed wavelengths at the optimum absorbance for specific components such as moisture, crude fiber, and carbohydrates. Peaks at around 980 and 1425 nm corresponded to the O-H stretching overtones of water or moisture [4,61]. The peak at around 1170 nm corresponded to the stretching of the C-H second overtone of the fiber [67]. The peak at around 1208 nm was attributed to the C-H stretching second overtone of carbohydrates [68].
3.2. Models for TSS, TA, and TSS/TA Ratio of Sweet Tamarind Fruit
For quantification, samples were partitioned into a 70:30 ratio for training and testing, which was acceptable for establishing calibration models [69]. Samples were divided into two sets: a calibration set (N = 80) and a prediction set (N = 35). The characteristics of the dependent variables, TSS, TA, and the TSS/TA ratio of sweet tamarind fruit in the calibration and prediction sets are shown in Table 1. The distribution ranges of TSS (59.67–80.33%), TA (0.62–5.55%), and the TSS/TA ratio (11.64–147.04) in the calibration set were wider than those of TSS (64–80.33%), TA (0.71–5.46%), and the TSS/TA ratio (14.31–114.36) in the prediction set. The values of dependent variables in the calibration set coincided with those in the prediction set. The mean values of TSS (75.17%), TA (3.17%), and the TSS/TA ratio (37.84) in the calibration set were similar to those of TSS (75.31%), TA (3.10%), and the TSS/TA ratio (36.42) in the prediction set. The SD of TSS (3.46%), TA (1.26%), and the TSS/TA ratio (30.08) in the calibration set were also similar to those of TSS (3.63%), TA (1.30%), and the TSS/TA ratio (26.25) in the prediction set. The distribution of values in both sets was much the same, which would be acceptable for establishing and testing the models.
PLSR and SVMR were used to establish calibration models for predicting TSS, TA, and the TSS/TA ratio in sweet tamarind fruit. The spectra of 80 samples in the calibration set were preprocessed using various spectral pretreatment methods to obtain the optimal conditions for PLSR and SVMR models. The prediction accuracy of PLSR and SVMR models was tested using 35 samples.
The performance of the PLSR models for predicting TSS, TA, and the TSS/TA ratio of sweet tamarind fruit varied due to differences in the spectral pretreatment methods. This data is shown in Table 2. The smoothing spectral pretreatment method obtained the optimal performance of the PLSR model for TSS (Rcv = 0.882, RMSECV = 1.810%). The original spectra with no preprocessing yielded optimal performance for TA (Rcv = 0.794, RMSECV = 0.767%). Also, the original spectra with no preprocessing gave optimal performance for the TSS/TA ratio (Rcv = 0.824, RMSECV = 16.995).
Spectral data in the calibration set were preprocessed by various spectral pretreatments to establish SVMR models for predicting TSS, TA, and the TSS/TA ratio of sweet tamarind fruit, as shown in Table 3. A combination of the 1st derivative and SNV spectral pretreatment yielded the optimal performance for the SVMR model for TSS (Rcv = 0.966, RMSECV = 1.242%). The MSC spectral pretreatment method showed optimal performance for TA (Rcv = 0.973, RMSECV = 0.339%). The 1st derivative spectral pretreatment method presented optimal performance for the TSS/TA ratio (Rcv = 0.962, RMSECV = 11.103).
The performance of PLSR and SVMR models for predicting TSS, TA, and the TSS/TA ratio of sweet tamarind fruit was compared in both the calibration and prediction sets. These results are shown in Table 4. They clearly demonstrated that the performance of SVMR models was better than that of PLSR models. The SVMR model for TSS prediction created using a combination of 1st derivative and SNV spectral pretreatment achieved Rp = 0.959 and RMSEP = 1.102%, while the PLSR model created using a smoothing spectral pretreatment method obtained Rp = 0.730, RMSEP = 11.877%. The SVMR model for TA prediction developed using the MSC spectral pretreatment method achieved Rp = 0.961 and RMSEP = 0.369%, while the PLSR model formulated using the original spectra yielded Rp = 0.684, RMSEP = 11.877%. The SVMR model for predicting the TSS/TA ratio created using the 1st derivative spectral pretreatment method achieved Rp = 0.956, RMSEP = 11.282, while the PLSR model employing the original spectra obtained an Rp = 0.772, RMSEP = 18.298. From these results, it can be concluded that the accuracy and robustness of the SVMR models for predicting TSS, TA, and the TSS/TA ratio in sweet tamarind fruit were better than those of the PLSR models.
Scatter plots of actual values versus predicted values of TSS, TA, and the TSS/TA ratio for the SVMR models in the calibration and prediction sets are presented in Figure 6. Visual distribution of actual and predicted values in the calibration and prediction sets by the SVMR models for TSS (Figure 6a), TA (Figure 6b), and the TSS/TA ratio (Figure 6c) were close to a 45° line, indicating that the performance of the SVMR models was acceptable for predicting the quality of sweet tamarind fruit.
Overall, the results indicate that the NIR-HSI technique has potential applications as a non-destructive, reliable, and accurate technique for predicting tamarind quality attributes.
3.3. Classification of Standard and Off-Standard Sweet Tamarind Fruit
For qualitative analyses, the TA values of sweet tamarind fruit (N=115) samples were considered based on an acceptable acidity level (standard, ≤ 4%) and an unacceptable level (off-standard, > 4%). There were 89 acceptable samples (standard, -1) and 26 unacceptable samples (off-standard, 1). The samples were divided into a calibration set (N = 80) and a prediction set (N = 35). The statistical characteristics of the sample distribution in the calibration and prediction sets are presented in Table 5. The results showed that the mean value of acceptable and unacceptable samples was similar (-0.55 and 0.54, respectively). Also, the SD of acceptable and unacceptable samples was similar (0.84 and 0.85, respectively), indicating that the distribution of acceptable and unacceptable samples in both sets was similar.
The performance of classification based on cross-validation of the classification models by various spectral pretreatment methods using PLS-DA in the calibration set is shown in Table 6. SNV spectral pretreatment yielded optimal results for establishing a classification model using PLS-DA. It had an 82.50% accuracy, 90.32% specificity, 55.56% sensitivity, and a 17.50% error rate. Table 7 shows the classification performance based on cross-validation of the classification models by various spectral pretreatment methods using the SVMC calibration set. These results revealed that the SNV spectral pretreatment yielded the optimal classification model with an 88.75% accuracy, 88.71% specificity, 88.89% sensitivity, and an 11.25% error rate.
The classification performance using PLS-DA and SVMC was compared by analyzing the calibration and prediction sets (Table 8). SVMC obtained better classification performance than PLS-DA. Therefore, SVMC with the SNV spectral pretreatment method was selected for classifying groups of standard and off-standard sweet tamarind fruit based on the allowed TA.
Figure 7 illustrates the confusion matrices of actual and predicted values using SVMC for classification between standard (-1) and off-standard (1) sweet tamarind fruit. The classification results in the calibration set (Figure 7a) obtained 88.75% (71/80)x100 accuracy, 88.71% (55/62)x100 specificity, 88.89% (16/18)x100 sensitivity, and 11.25% (9/80)x100 error rate. Classification results for the prediction set (Figure 8b) obtained 82.86% (29/35)x100 accuracy, 81.48% (22/27)x100 specificity, 87.5% (7/8)x100 sensitivity, and a 17.14% (6/35)x100 error rate. These results indicate that SVMC with the SNV spectral pretreatment method can be used to classify the quality of sweet tamarind fruit based on the commercial standard for TA.
4. Conclusions
This study demonstrated the potential of near-infrared hyperspectral imaging (NIR-HSI) techniques for predicting key quality attributes of sweet tamarind fruit, including TSS, TA, and the TSS/TA ratio, as well as for classifying the quality of sweet tamarind fruit under a commercial standard based on TA. For the quantification study, the spectral pretreatment methods were optimized to develop calibration models, including the 1st derivative combined with SNV as a spectral pretreatment method for establishing the SVMR model for TSS, the MSC as a spectral pretreatment method for establishing the SVMR model for TA, and the 1st derivative as a spectral pretreatment method for establishing the SVMR model for the TSS/TA ratio. The results clearly indicate that the prediction accuracy of SVMR models is acceptable for use with sweet tamarind fruit. Also, for the qualification study, SVMC with the SNV spectral pretreatment method was optimized to be used for classifying sweet tamarind fruit based on the commercial standard related to TA. It is therefore concluded that NIR-HSI can be developed into a system for quality assessment of sweet tamarind fruit. It is a rapid, non-destructive, accurate, and reliable technique that yields information about a long-pod fruit like sweet tamarind in a one-pass measurement. It can be commercially developed for grading and classifying individual intact sweet tamarind fruits.
Author Contributions
Conceptualization, S.T.; methodology, W.S., W.D.A. and A.T.; validation, S.T.; formal analysis, W.S.; data curation, W.D.A., A.T., R.S. and S.W.; writing—original draft preparation, W.S.; writing—review and editing, S.T. and A.K.T.; supervision, S.T. All authors have read and agreed to the published version of the manuscript.
Funding
This research was funded by King Mongkut ’s Institute of Technology Ladkrabang Research Fund, grant number KREF116901.
Data Availability Statement
The data presented in this study is available on request from the corresponding author.
Acknowledgments
The authors thank Professor Dr. Panmanas Sirisomboon for valuable technical assistance.
Conflicts of Interest
The authors declare no conflicts of interest.
References
- Devi, B.; Boruah, T. Tamarind (Tamarindus indica). In Antioxidants in Fruits: Properties and Health Benefits; Nayik, G.A., Gull, A., Eds.; Springer: Singapore, 2020; pp. 325–342. [Google Scholar] [CrossRef]
- Swamy, K.R.M. Origin, taxonomy, botanical description, genetics and cytogenetics, genetic diversity, breeding and cultivation of tamarind. Int. J. Curr. Res. 2025, 17(07), 33996–34040. [Google Scholar] [CrossRef]
- Reis, P.M.C.L.; Dariva, C.; Vieira, G.Â.B.; Hense, H. Extraction and evaluation of antioxidant potential of the extracts obtained from tamarind seeds (Tamarindus indica), sweet variety. J. Food Eng. 2016, 173, 116–123. [Google Scholar] [CrossRef]
- Ali, M.Z.; Seehanam, P.; Naksavi, D.; Maniwara, P. Mold Detection in Sweet Tamarind During Storage Performed by Near-Infrared Spectroscopy and Chemometrics. Horticulturae 2026, 12, 462. [Google Scholar] [CrossRef]
- Tridge. Fresh Sweet Tamarind Market Overview 2026. Available online: https://www.tridge.com/market-overview/fresh-sweet-tamarind (accessed on 23 April 2026).
- Pal, D.; Mukherjee, S. Tamarind (Tamarindus indica) Seeds in Health and Nutrition. In Nuts and Seeds in Health and Disease Prevention, 2nd ed.; Preedy, V.R., Watson, R.R., Eds.; Academic Press: San Diego, CA, USA, 2020; pp. 171–182. [Google Scholar] [CrossRef]
- Chaturvedi, K.; Karunakaran, G.; Satisha, G.C.; Singh, P.; Nag, S.K.; Kumar, P. Nutritional characterization and identification of sweet tamarind (Tamarindus indica L.) accessions from the Bastar region of Chhattisgarh, India. Plant Genet. Resour. Characterisation Util. 2024, 23(3), 174–183. [Google Scholar] [CrossRef]
- Wanjau, R.W.; Luvanda, A.; Okeyo, M.; Cheboiwo, J. Ecological distribution and commercial exploitation of Tamarindus Indica in Kenya A Review. J. Innov. Technol. Sustain. 2025, 3(1), 44–62. [Google Scholar] [CrossRef]
- Sulieman, A.M.E.; Alawad, S.M.; Osman, M.A.; Abdelmageed, E.A. Physicochemical characteristics of local varieties of tamarind (Tamarindus indica L), Sudan. Int. J. Plant Res. 2015, 5(1), 13–18. [Google Scholar] [CrossRef]
- Suktanarak, S.; Teerachaichayut, S. Quantitative analysis of total soluble solids and titratable acidity of sweet tamarind by SW-NIRS. Int. J. Biosci. Biochem. Bioinforma. 2013, 3(4), 328–331. [Google Scholar] [CrossRef]
- Prasanna, V.; Prabha, T.N.; Tharanathan, R.N. Fruit ripening phenomena–An Overview. Crit. Rev. Food Sci. Nutr. 2007, 47(1), 1–19. [Google Scholar] [CrossRef] [PubMed]
- Kamruzzaman, M.; Makino, Y.; Oshita, S. Non-invasive analytical technology for the detection of contamination, adulteration, and authenticity of meat, poultry, and fish: A review. Anal. Chim. Acta 2015, 853, 19–29. [Google Scholar] [CrossRef] [PubMed]
- Mia, N.; Hashem, A.; Halim, A.; Tariq, S.; Ahamed, Z. Application of NIR spectroscopy with machine learning in the food industry: A comprehensive review. Food Phys. 2026, 3, 100089. [Google Scholar] [CrossRef]
- Vicente, J.; Kist, V.; Mega, C.P.; Rossato, O.B.; Veloso, O.; Carvalho, M.G. Spectroscopy-driven authentication of agro-industrial products: A comprehensive review of NMR, FT-IR, NIR and Chemometric workflows. Food Chem. 2026, 513, 148982. [Google Scholar] [CrossRef] [PubMed]
- Hasanzadeh, B.; Abbaspour-Gilandeh, Y.; Soltani-Nazarloo, A.; Cruz-Gámez, E.D.L.; Hernández-Hernández, J.L.; Martínez-Arroyo, M. Non-Destructive Measurement of Quality Parameters of Apple Fruit by Using Visible/Near-Infrared Spectroscopy and Multivariate Regression Analysis. Sustainability 2022, 14(22), 14918. [Google Scholar] [CrossRef]
- Funsueb, S.; Thanavanich, C.; Theanjumpol, P.; Kittiwachana, S. Development of new fruit quality indices through aggregation of fruit quality parameters and their predictions using near-infrared spectroscopy. Postharvest Biol. Technol. 2023, 204, 112438. [Google Scholar] [CrossRef]
- Li, S.; Gong, C.; Bu, Y.; Liu, H.; Guo, X.; Guo, W. Detection of SSC in ‘Shine Muscat’ grapes using Vis/NIR and NIR spectra with characteristic wavelengths. Spectrochim. Acta A Mol. Biomol. Spectrosc. 2026, 358, 127865. [Google Scholar] [CrossRef] [PubMed]
- Rungchang, S.; Saeys, W.; Sringarm, C.; Numthuam, S.; Intanon, S.; Kittiwachana, S.; Jiamyangyuen, S. Near infrared spectroscopy for sustainable non-destructive classification and quantitative prediction of quality traits of seed size, pest damage, and quality traits in lychee (Litchi chinensis). Appl. Food Res. 2025, 5(2), 101553. [Google Scholar] [CrossRef]
- Wang, J.; Fu, D.; Hu, Z.; Chen, Y.; Li, B. Nondestructive Determination of Epicarp Hardness of Passion Fruit Using Near-Infrared Spectroscopy during Storage. Foods 2024, 13, 783. [Google Scholar] [CrossRef] [PubMed]
- Ali, M.Z.; Seehanam, P.; Theanjumpol, P.; Sonthiya, K.; Suksai, K.; Maniwara, P. Utilization of near infrared spectroscopy coupled with chemometrics for non-destructive detection of mold in sweet tamarind. Appl. Food Res. 2025. 5, 101241. [CrossRef]
- Srivichien, S.; Terdwongworakul, A.; Teerachaichayut, S. Quantitative prediction of nitrate level in intact pineapple using Vis–NIRS. J. Food Eng. 2015, 150, 29–34. [Google Scholar] [CrossRef]
- Bilgin, A.-B.; Vega-Castellote, M.; Entrenas, J.-A.; Torres-Rodríguez, I.; Aykas, D.-P.; Basaran, P.; Pérez-Marín, D. Comparative Evaluation of Portable and Benchtop NIR Spectroscopy and Hyperspectral Imaging for Detecting Honey Adulteration. Sensors 2026, 26, 2750. [Google Scholar] [CrossRef] [PubMed]
- Zhang, A.; Li, Z.; Huang, X.; Xu, H.; Liang, Y.; Han, X.; Dong, N.; Xia, Z.; Shi, J.; Zou, X. Applications and Advances in Hyperspectral Imaging for Detecting Three Major Natural Plant Pigments in Food: A Review. Anal. Chem. 2026, 98(5), 3387–3412. [Google Scholar] [CrossRef] [PubMed]
- Huang, L.; Zhou, Y.; Meng, L.; Wu, D.; He, Y. Comparison of different CCD detectors and chemometrics for predicting total anthocyanin content and antioxidant activity of mulberry fruit using visible and near infrared hyperspectral imaging technique. Food Chem. 2017, 224, 1–10. [Google Scholar] [CrossRef] [PubMed]
- Munera, S.; Amigo, J.M.; Aleixos, N.; Talens, P.; Cubero, S.; Blasco, J. Potential of VIS-NIR hyperspectral imaging and chemometric methods to identify similar cultivars of nectarine. Food Control 2018, 86, 1–10. [Google Scholar] [CrossRef]
- Miao, Y.-H.; Zong, L.-Y.; Su, W.-H. Machine learning in VIS/NIR spectroscopy and hyperspectral imaging for rapid detection of staple foods quality and safety: A review. J. Food Compos. Anal. 2025, 148, 108422. [Google Scholar] [CrossRef]
- Pan, T.-T.; Sun, D.-W.; Cheng, J.-H.; Pu, H. Regression algorithms in hyperspectral data analysis for meat quality detection and evaluation. Compr. Rev. Food Sci. Food Saf. 2016, 15(3), 529–541. [Google Scholar] [CrossRef] [PubMed]
- Williams, P.J.; Geladi, P.; Britz, T.J.; Manley, M. Near-infrared (NIR) hyperspectral imaging and multivariate image analysis to study growth characteristics and differences between species and strains of members of the genus Fusarium. Anal. Bioanal. Chem. 2012, 404(6), 1759–1769. [Google Scholar] [CrossRef] [PubMed]
- Du, K.L.; Jiang, B.; Lu, J.; Hua, J.; Swamy, M.N.S. Exploring kernel machines and support vector machines: Principles, techniques, and future directions. Mathematics 2024, 12(24), 3935. [Google Scholar] [CrossRef]
- Kok, Z.H.; Shariff, A.R.M.; Alfatni, M.S.M.; Khairunniza-Bejo, S. Support Vector Machine in Precision Agriculture: A review. Comput. Electron. Agric. 2021, 191, 106546. [Google Scholar] [CrossRef]
- Rashid, N.A.; Nasaruddin, N.; Kassim, K.; Hazwani, A.; Rahim, H.A. Comparison Analysis: Large Data Classification Using PLS-DA and Decision Trees. Math. Methods Stat. 2019, 8, 100–105. [Google Scholar]
- Hussain, M.; Wajid, S. K.; Elzaart, A.; Berbar, M. A Comparison of SVM Kernel Functions for Breast Cancer Detection. In Proceedings of the 2011 Eighth International Conference on Computer Graphics, Imaging and Visualization, Washington, DC, USA, 17–19 August 2011; IEEE, 2011; pp. 145–150. [Google Scholar]
- Long, T.; Xie, Z.; Luo, Y.; He, M.; Liu, D.; Chen, X.; Guan, M.; Zhao, J.; Lan, Y.; Long, Y. VIS-NIR transmittance hyperspectral image reconstruction for litchi fruits. Comput. Electron. Agric. 2026, 246, 111541. [Google Scholar] [CrossRef]
- Ding, H.; Zhao, J.; Wang, W.; Ding, R.; Yun, Y.; Liu, Y.; Tu, K.; Lan, W.; Pan, L. Toward trustworthy non-destructive mango quality prediction using hyperspectral imaging and explainable AI. Food Control 2026, 184, 112026. [Google Scholar] [CrossRef]
- Dai, Y.; Ding, H.; Zhao, S.; Liu, Z. Robust provenance classification of curcumae radix (Yujin) using nir-hsi: Preprocessing, nested CV and morphology effects. Microchem. J. 2026, 222, 117170. [Google Scholar] [CrossRef]
- Song, Y.; Zheng, Y.; Xin, J.; Zhang, F.; Qi, H.; Yu, F.; Wang, X.; Chen, L.; Cao, C.; Yu, Y.; Li, Z. Simultaneous detection of water content and ferulic acid content in Angelica sinensis using NIR-HSI and multi-task hierarchical attention CNN. Spectrochim. Acta A Mol. Biomol. Spectrosc. 2026, 358, 127829. [Google Scholar] [CrossRef] [PubMed]
- Akter, T.; Faqeerzada, M.A.; Kim, Y.; Pahlawan, M.F.R.; Aline, U.; Kim, H.; Kim, H.; Cho, B.-K. Hyperspectral imaging with multivariate analysis for detection of exterior flaws for quality evaluation of apples and pears. Postharvest Biol. Technol. 2025, 223, 113453. [Google Scholar] [CrossRef]
- Zhao, Z.; Cao, W.; Liu, X.; Chen, M.; Qiu, J. Rapid determination of soluble solids and water-soluble sugar contents in Mopan persimmon based on hyperspectral imaging and chemometrics. Infrared Phys. Technol. 2025, 150, 106042. [Google Scholar] [CrossRef]
- Ezenarro, J.; Saouabi, I.; García-Pizarro, A.; Schorn-García, D.; Mestres, M.; Amigo, J.M.; Busto, O.; Boqu, R. NIR-HSI for the non-destructive monitoring of in-bag hazelnut oxidation. Spectrochim. Acta A Mol. Biomol. Spectrosc. 2025, 333, 125906. [Google Scholar] [CrossRef]
- Wang, Y.; Jing, L.; Liu, J.; Cao, X.; Zhang, K.; Zhang, H.; Wang, J. Classification of kiwifruit storage day based on hyperspectral imaging and convolutional neural networks. J. Food Compos. Anal. 2026, 149, 108774. [Google Scholar] [CrossRef]
- Khamsopha, D.; Woranitta, S.; Teerachaichayut, S. Utilizing near infrared hyperspectral imaging for quantitatively predicting adulteration in tapioca starch. Food Control 2021, 123(1), 107781. [Google Scholar] [CrossRef]
- Sricharoonratana, M.; Thompson, A.K.; Teerachaichayut, S. Use of near infrared hyperspectral imaging as a nondestructive method of determining and classifying shelf life of cakes. LWT-Food Sci. Technol. 2021, 136(1), 110369. [Google Scholar] [CrossRef]
- Kabir, A.; Lee, I.; Singh, C.B.; Mishra, G.; Panda, B.K.; Lee, S.-H. Aflatoxin B1 contamination level detection in almond kernels through short wave infrared hyperspectral image analysis. Adv. Agrochem. 2025, 4, 363–372. [Google Scholar] [CrossRef]
- Ismail, A.; Park, S.; Kim, H.-J.; Choi, M.; Kim, H.-J.; Hong, H.; Kim, G.; Jo, C. Evaluation of biomarkers that influence the freshness of beef during storage using VIS/NIR hyperspectral imaging. LWT-Food Sci. Technol. 2025, 216, 117302. [Google Scholar] [CrossRef]
- Teerachaichayut, S.; Ho, H.T. Non-destructive prediction of total soluble solids, titratable acidity and maturity index of limes by near infrared hyperspectral imaging. Postharvest Biol. Technol. 2017, 133(1), 20–25. [Google Scholar] [CrossRef]
- Zhang, J.; Zhang, Q.; Zhao, R.; Yu, J. Advances in hyperspectral imaging-based non-destructive assessment of tomato quality attributes. Smart Agr. Technol. 2025, 12, 101534. [Google Scholar] [CrossRef]
- Yao, K.; Wang, K.; Zhang, Y.; Zhang, B.; Sun, J.; Du, X.; Li, Y. Nondestructive detection of heavy metal lead in eggs using hyperspectral imaging combined with deep learning-based feature extraction method. J. Food Compos. Anal. 2025, 146, 107994. [Google Scholar] [CrossRef]
- Suktanarak, S.; Teerachaichayut, S. Non-destructive quality assessment of hens' eggs using hyperspectral images. J. Food Eng. 2017, 215, 97–103. [Google Scholar] [CrossRef]
- Yang, K.; Argyropoulos, D. Explainable deep learning combined with hyperspectral imaging for early detection of browning in mushrooms. Smart Agr. Technol. 2026, 13, 101833. [Google Scholar] [CrossRef]
- ASEAN Trade Repository. ASEAN standard for sweet tamarind (ASEAN Stan 39:2014). Available online: https://asean.org/wp-content/uploads/2012/05/39-ASEAN-standard_sweet-tamarind.pdf (accessed on 2 June 2026).
- AOAC. Official Methods of Analysis, 17th ed.; Association of Official Analytical Chemists: Arlington, VA, USA, 2000. [Google Scholar]
- Reid, M.S. Chapter 6 maturation and maturity indices In Postharvest Technology of Horticultural Crops,, 3rd ed.; Kader, A.A.E., Ed.; University of California, Agriculture and Natural Resources: Publication 3311, California, USA, 2002. [Google Scholar]
- Esquerre, C.; Gowen, A.A.; Burger, J.; Downey, G.; O'Donnell, C.P. Suppressing sample morphology effects in near infrared spectral imaging using chemometric data pre-treatments. Chemom. Intell. Lab. Syst. 2012, 117(1), 129–137. [Google Scholar] [CrossRef]
- Liu, Y.; Liu, Y.; Chen, Y.; Zhang, Y.; Shi, T.; Wang, J.; Hong, Y.; Fei, T. The influence of spectral pretreatment on the selection of representative calibration samples for soil organic matter estimation using Vis-NIR reflectance spectroscopy. Remote Sens. 2019, 11(1), 450. [Google Scholar] [CrossRef]
- Zhou, X.; Zhang, Z.; Li, J.; Chen, S.; Liu, D. Rapid and non-destructive identification of walnut varieties based on near-infrared spectroscopy combined with chemometric methods. Appl. Food Res. 2026, 6, 102019. [Google Scholar] [CrossRef]
- Brasil, Y.L.; Cruz-Tirado, J.D.; Barbin, D.F. Fast online estimation of quail eggs freshness using portable NIR spectrometer and machine learning. Food Control 2022, 131, 108418. [Google Scholar] [CrossRef]
- Rieppo, L.; Saarakkala, S.; Närhi, T.; Helminen, H.J.; Jurvelin, J.S.; Rieppo, J. Application of second derivative spectroscopy for increasing molecular specificity of Fourier transform infrared spectroscopic imaging of articular cartilage. Osteoarthr. Cartil. 2012, 20(5), 451–459. [Google Scholar] [CrossRef] [PubMed]
- Dahiya, P.; Kucha, C.; Olaniyi, E.; Sial, A. Assessment of chemometric and deep learning models for blueberry authentication using visible and near-infrared spectral imaging. Food Control 2026, 184, 112027. [Google Scholar] [CrossRef]
- Huang, H.; Hu, X.; Tian, J.; Peng, X.; Luo, H.; Huang, D.; Zheng, J.; Wang, H. Rapid and nondestructive determination of sorghum purity combined with deep forest and near-infrared hyperspectral imaging. Food Chem. 2022, 377, 131981. [Google Scholar] [CrossRef] [PubMed]
- Altieri, G.; Laveglia, S.; Rashvand, M.; Genovese, F.; Matera, A.; Mininni, A.N.; Calabritto, M.; Di Renzo, G.C. Portable NIR Spectroscopy Combined with Machine Learning for Kiwi Ripeness Classification: An Approach to Precision Farming. Appl. Sci. 2025, 15, 6233. [Google Scholar] [CrossRef]
- Cheng, J.; Guo, W.; Zhang, Z.; Zeng, S.; Wang, Z. Optical properties of ‘Gala’ (Malus pumila) apple pulp and their relationship with internal quality. Infrared Phys. Technol. 2022, 123, 104210. [Google Scholar] [CrossRef]
- Rana, M.; Sharma, P. Proximate and phytochemical screening of the seed and pulp of Tamarind indica. J. Med. Plants Stud. 2018, 6(2), 111–115. [Google Scholar] [CrossRef]
- Dávila-Hernández, G.; Delgadillo-Arévalo, C.S.; Sánchez-Pardo, M.E.; Necoechea-Mondragon, H.; Ortiz-Moreno, A. Pretreatment of tamarind pericarp to increase antioxidant availability and its application in a functional food. J. Food Sci. Technol. 2020, 58(6), 2385–2394. [Google Scholar] [CrossRef] [PubMed]
- Ozaki, Y.; McClure, W.F.; Christy, A.A. Near-infrared Spectroscopy in Food Science and Technology. In Near-infrared Spectroscopy in Food Science and Technology; John Wiley & Sons, Inc, New Jersey, 2007. [Google Scholar]
- Posom, J.; Soonnamtiang, N.; Kotethum, P.; Konjun, P.; Sirisomboon, P.; Saengprachatanarug, K.; Wongpichet, S. Two different portables visible-near infrared and shortwave infrared region for on-tree measurement of soluble solid content of marian plum fruit. Eng. J. 2020, 24(1), 227–236. [Google Scholar] [CrossRef]
- Karabchevsky, A.; Kavokin, A.V. Giant absorption of light by molecular vibrations on a chip. Sci. Rep. 2016, 6(1), 21201. [Google Scholar] [CrossRef] [PubMed]
- Yang, X.; Liu, G.; He, J.; Kang, N.; Yuan, R.; Fan, N. Determination of sugar content in Lingwu jujube by NIR–hyperspectral imaging. J. Food Sci. 2021, 86(4), 1201–1214. [Google Scholar] [CrossRef] [PubMed]
- Caporaso, N.; Whitworth, M.B.; Fowler, M.S.; Fisk, I.D. Hyperspectral imaging for non-destructive prediction of fermentation index, polyphenol content and antioxidant activity in single cocoa beans. Food Chem. 2018, 258, 343–351. [Google Scholar] [CrossRef] [PubMed]
- Hbirkou, C.; Patzold, S.; Mahlein, A.K.; Welp, G. Airborne hyperspectral imaging of spatial soil organic carbon heterogeneity at the field-scale. Geoderma 2012, 175-176, 21–28. [Google Scholar] [CrossRef]
Figure 1.
Schematic of the NIR-HSI system for measuring sweet tamarind fruit.
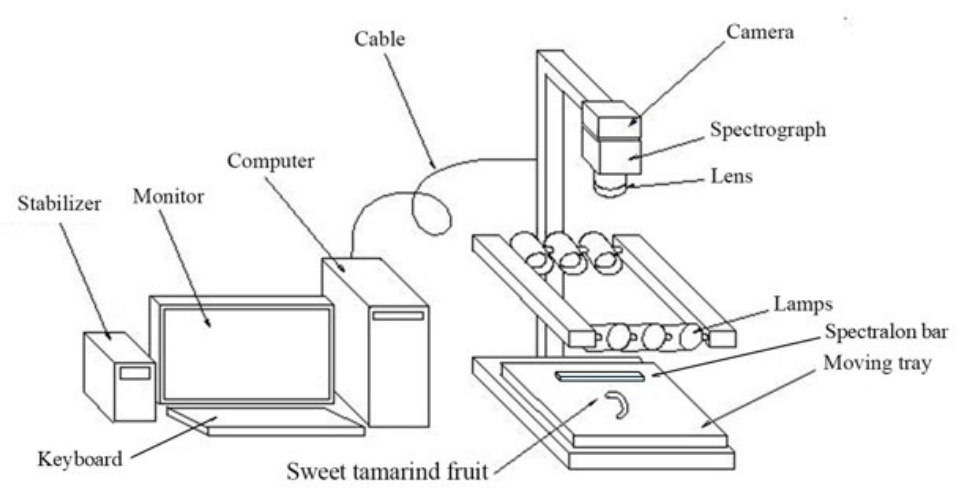
Figure 2.
Block diagram for quantitative and qualitative analyses of sweet tamarind fruit.
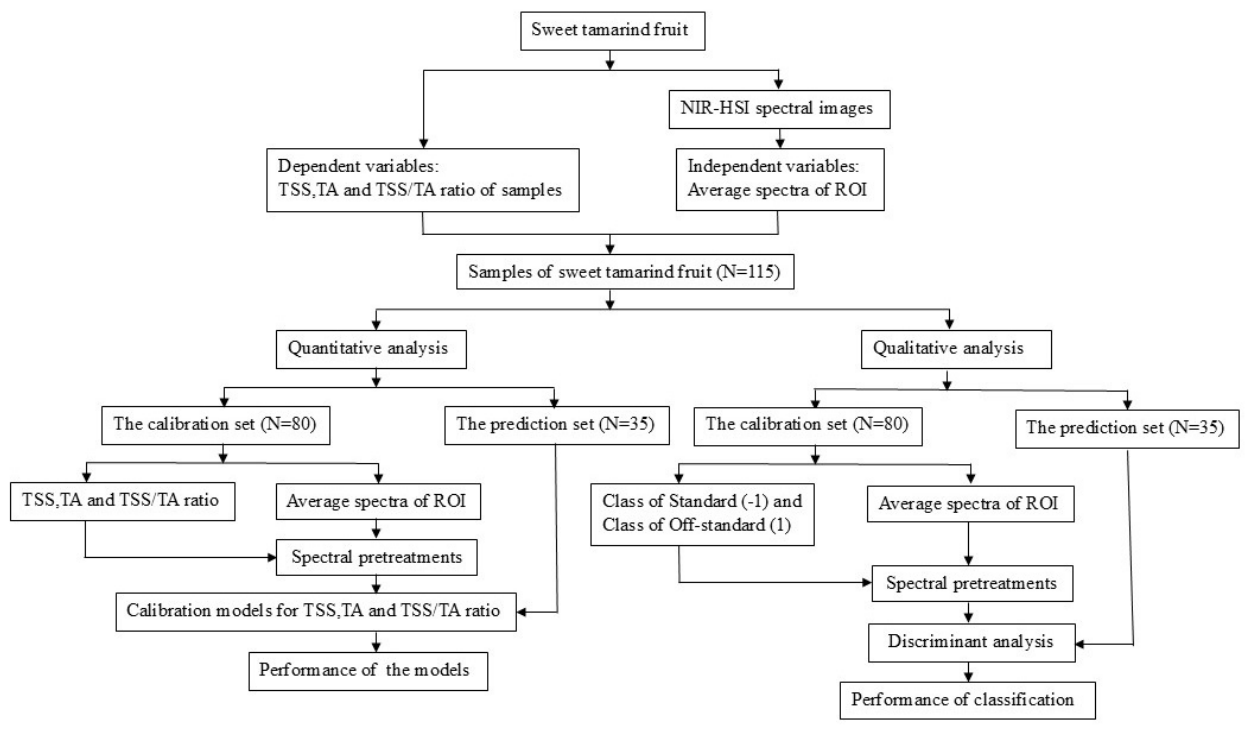
Figure 3.
The average original absorbance spectra of sweet tamarind fruit in the wavelength range of 935–1720 nm.
Figure 3.
The average original absorbance spectra of sweet tamarind fruit in the wavelength range of 935–1720 nm.
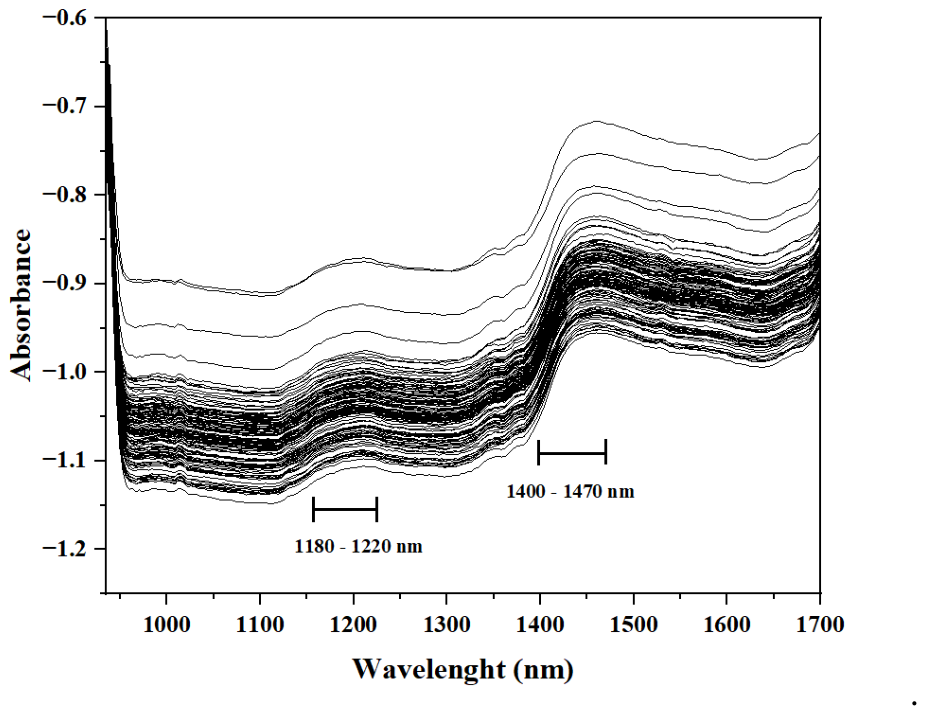
Figure 4.
Average absorbance spectra of pulp, seed, shell, and whole fruit of sweet tamarind fruit in the wavelength range of 935–1720 nm: (a) original spectra and (b) normalized original spectra.
Figure 4.
Average absorbance spectra of pulp, seed, shell, and whole fruit of sweet tamarind fruit in the wavelength range of 935–1720 nm: (a) original spectra and (b) normalized original spectra.
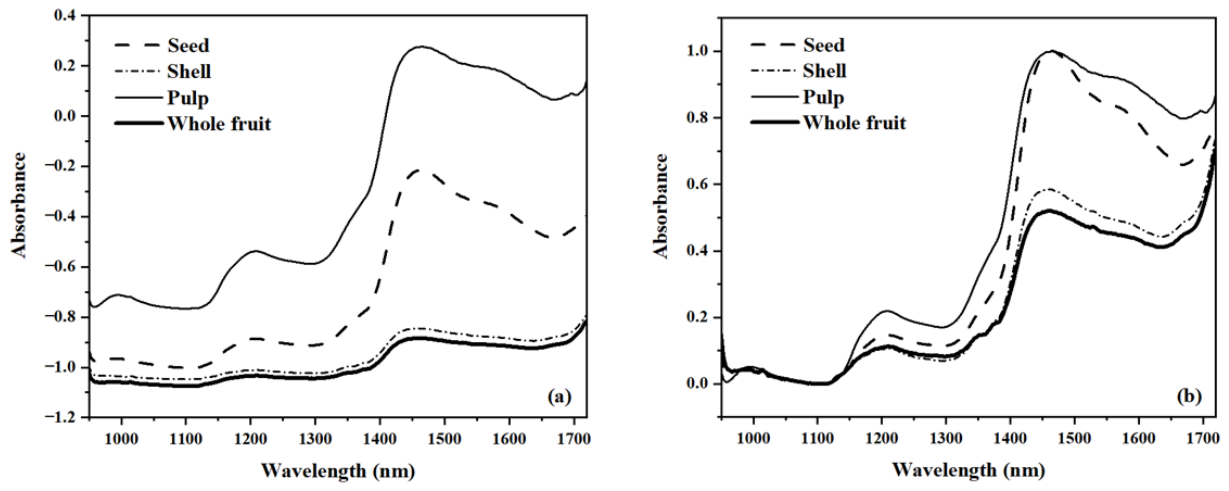
Figure 5.
The average second derivative spectrum of sweet tamarind fruit.
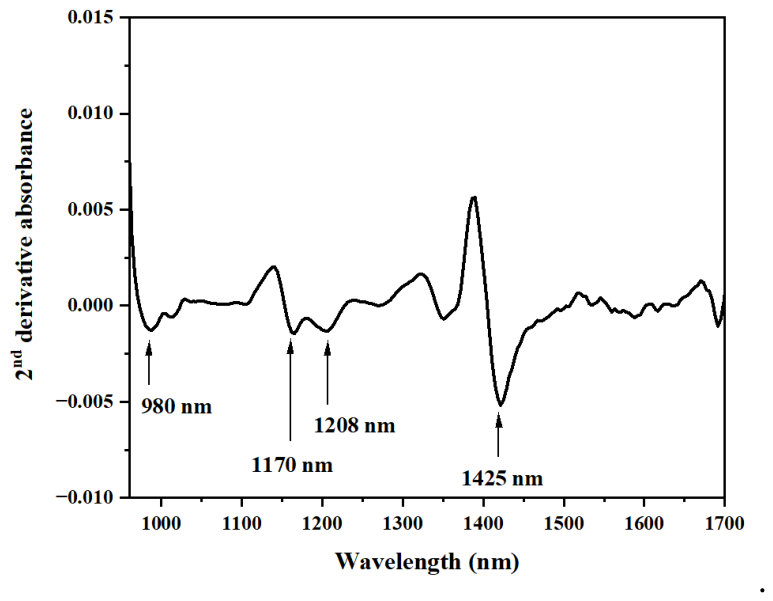
Figure 6.
Scatter plots of actual versus predicted values obtained from the SVMR models for predicting quality of sweet tamarind fruit: (a) TSS, (b) TA, and (c) the TSS/TA ratio.
Figure 6.
Scatter plots of actual versus predicted values obtained from the SVMR models for predicting quality of sweet tamarind fruit: (a) TSS, (b) TA, and (c) the TSS/TA ratio.
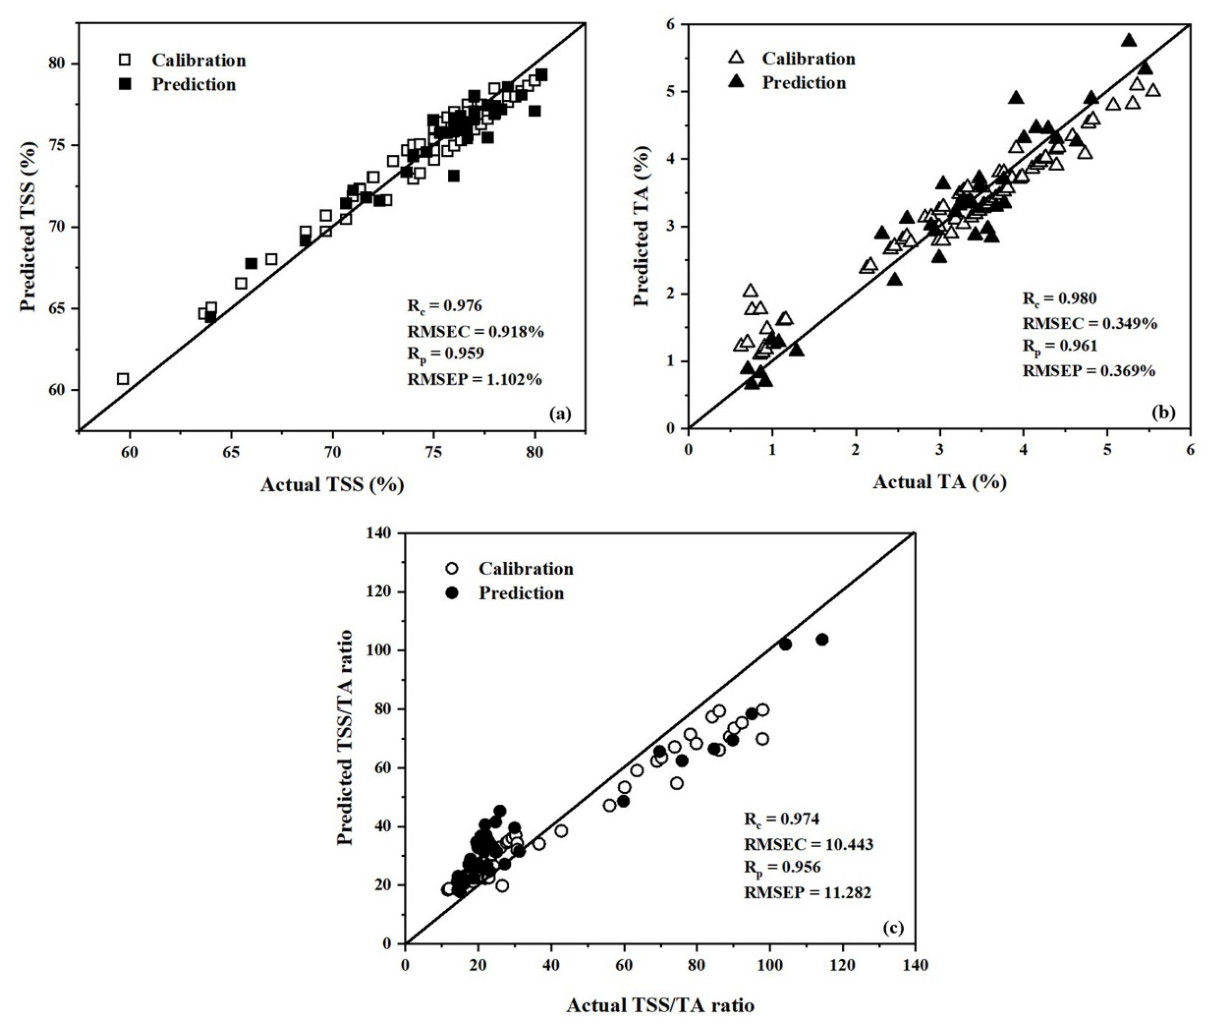
Figure 7.
Confusion matrices of actual versus predicted values for standard sweet tamarind fruit (-1) and off-standard sweet tamarind fruit using SVMC (1) in the calibration set (a), and in the prediction set (b).
Figure 7.
Confusion matrices of actual versus predicted values for standard sweet tamarind fruit (-1) and off-standard sweet tamarind fruit using SVMC (1) in the calibration set (a), and in the prediction set (b).
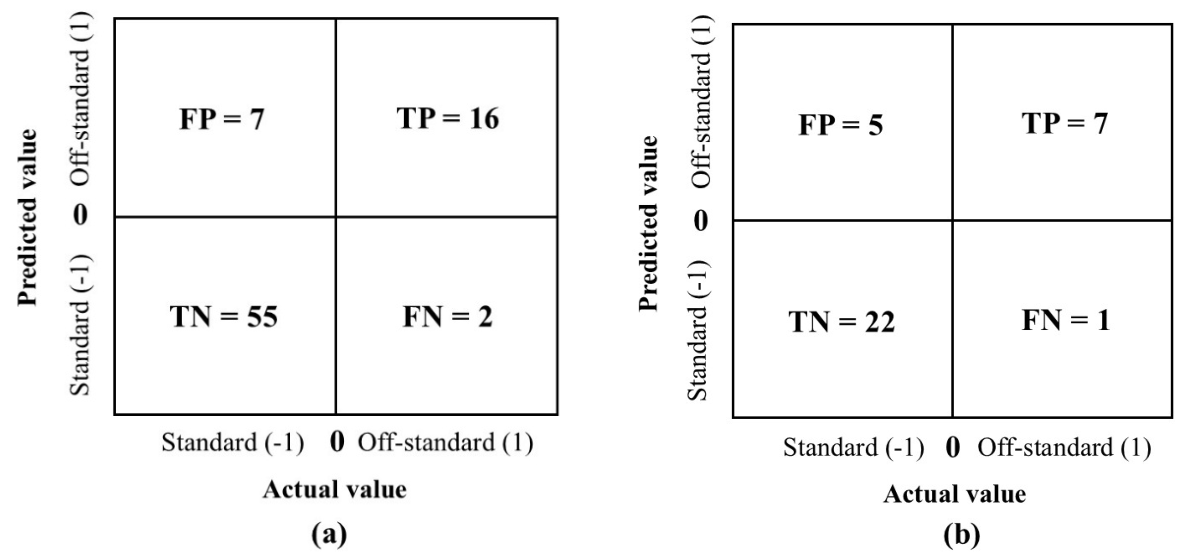

Table 1.
Characteristics of TSS, TA, and the TSS/TA ratio of sweet tamarind fruit in the calibration and prediction sets.
Table 1.
Characteristics of TSS, TA, and the TSS/TA ratio of sweet tamarind fruit in the calibration and prediction sets.
| Attribute | Sample Set | Number of samples | Minimum | Maximum | Average | Standard deviation |
|---|---|---|---|---|---|---|
| TSS 1 | Calibration | 80 | 59.67% | 80.33% | 75.17% | 3.46% |
| Prediction | 35 | 64% | 80.33% | 75.31% | 3.63% | |
| TA 2 | Calibration | 80 | 0.62% | 5.55% | 3.17% | 1.26% |
| Prediction | 35 | 0.71% | 5.46% | 3.10% | 1.30% | |
| TSS/TA ratio 3 | Calibration | 80 | 11.64 | 147.04 | 37.84 | 30.08 |
| Prediction | 35 | 14.31 | 114.36 | 36.42 | 26.25 |
1 TA = titratable acidity; 2 TSS = total soluble solids; 3 TSS/TA ratio = fruit quality and maturity index.
Table 2.
Performance of PLSR 1 models based on different spectral pretreatments for predicting TSS, TA, and the TSS/TA ratio of sweet tamarind fruit.
Table 2.
Performance of PLSR 1 models based on different spectral pretreatments for predicting TSS, TA, and the TSS/TA ratio of sweet tamarind fruit.
| Preprocessing | Factors | TSS 2 (%) | Factors | TA 3 (%) | Factors | TSS/TA ratio 4 | |||
|---|---|---|---|---|---|---|---|---|---|
| Rcv 5 | RMSECV 6 (%) |
Rcv | RMSECV (%) |
Rcv | RMSECV | ||||
| Original | 9 | 0.859 | 1.989 | 5 | 0.794 | 0.767 | 6 | 0.824 | 16.995 |
| Smoothing | 7 | 0.882 | 1.810 | 4 | 0.724 | 0.863 | 4 | 0.787 | 18.421 |
| 1st derivative | 6 | 0.846 | 2.047 | 4 | 0.585 | 1.047 | 5 | 0.569 | 24.933 |
| 2nd derivative | 6 | 0.589 | 3.180 | 3 | 0.437 | 1.145 | 1 | 0.505 | 27.064 |
| MSC 7 | 9 | 0.814 | 2.249 | 3 | 0.698 | 0.902 | 3 | 0.692 | 21.690 |
| SNV 8 | 10 | 0.816 | 2.245 | 3 | 0.707 | 0.893 | 3 | 0.707 | 21.145 |
| 1st derivative + MSC | 6 | 0.814 | 2.237 | 3 | 0.434 | 1.179 | 2 | 0.501 | 26.953 |
| 1st derivative + SNV | 6 | 0.828 | 2.166 | 3 | 0.371 | 1.222 | 2 | 0.496 | 26.149 |
1 PLSR = partial least squares regression ; 2 TSS = total soluble solids; 3 TA = titratable acidity; 4 TSS/TA ratio = fruit quality and maturity index; 5 Rcv = correlation coefficient of cross-validation; 6 RMSECV = root mean square error of cross-validation; 7 MSC = multiplicative scatter correction; 8 SNV = standard normal variate.
Table 3.
Performance of SVMR 1 models based on different spectral pretreatments for predicting TSS, TA, and the TSS/TA ratio of sweet tamarind fruit.
Table 3.
Performance of SVMR 1 models based on different spectral pretreatments for predicting TSS, TA, and the TSS/TA ratio of sweet tamarind fruit.
| Preprocessing | Factors | TSS 2 (%) | Factors | TA 3 (%) | Factors | TSS/TA ratio 4 | ||||||
|---|---|---|---|---|---|---|---|---|---|---|---|---|
| c 5 | γ 6 | Rcv 7 | RMSECV 8 (%) | c | γ | Rcv | RMSECV (%) | c | γ | Rcv | RMSECV | |
| Original | 100 | 0.01 | 0.856 | 2.320 | 1 | 1 | 0.945 | 0.504 | 10 | 0.1 | 0.917 | 13.750 |
| Smoothing | 100 | 0.1 | 0.905 | 2.132 | 100 | 0.1 | 0.937 | 0.529 | 100 | 0.1 | 0.939 | 13.238 |
| 1st derivative | 10 | 0.01 | 0.934 | 2.024 | 1 | 0.01 | 0.907 | 0.593 | 100 | 0.01 | 0.962 | 11.103 |
| 2nd derivative | 100 | 0.01 | 0.933 | 2.025 | 1 | 0.01 | 0.903 | 0.700 | 1 | 0.01 | 0.938 | 12.807 |
| MSC 9 | 100 | 0.01 | 0.964 | 1.265 | 10 | 0.01 | 0.973 | 0.339 | 10 | 0.01 | 0.948 | 12.615 |
| SNV 10 | 100 | 0.01 | 0.937 | 1.583 | 10 | 0.01 | 0.932 | 0.904 | 10 | 0.01 | 0.952 | 12.287 |
| 1st derivative + MSC | 100 | 0.1 | 0.963 | 1.279 | 10 | 0.01 | 0.966 | 0.468 | 10 | 0.01 | 0.939 | 13.347 |
| 1st derivative + SNV | 100 | 0.1 | 0.966 | 1.242 | 10 | 0.01 | 0.971 | 0.449 | 10 | 0.1 | 0.947 | 12.676 |
1 SVMR = support vector machine regression; 2 TSS = total soluble solids; 3 TA = titratable acidity; 4 TSS/TA ratio = fruit quality and maturity index; 5 c = penalty factor; 6 γ = kernel function parameter gamma; 7 Rcv = correlation coefficient of cross-validation; 8 RMSECV = root mean square error of cross-validation; 9 MSC = multiplicative scatter correction; 10 SNV = standard normal variate.
Table 4.
PLSR and SVMR methods for predicting TSS, TA, and the TSS/TA ratio in sweet tamarind fruit.
Table 4.
PLSR and SVMR methods for predicting TSS, TA, and the TSS/TA ratio in sweet tamarind fruit.
| Attribute | Method | Preprocessing | Rc 9 | RMSEC 10 | Rp 11 | RMSEP 12 | |
|---|---|---|---|---|---|---|---|
| TSS 1 (%) | PLSR 4 | Smoothing | 0.919 | 1.510% | 0.730 | 11.877% | |
| Factors = 7 | |||||||
| SVMR5 | 1st derivative + SNV8 | 0.976 | 0.918% | 0.959 | 1.102% | ||
| c6= 100 | γ 7= 0.1 | ||||||
| TA 2 (%) | PLSR | Original | 0.860 | 0.638% | 0.684 | 0.974% | |
| Factors = 5 | |||||||
| SVMR | MSC13 | 0.980 | 0.349% | 0.961 | 0.369% | ||
| c = 10 | γ= 0.01 | ||||||
| TSS/TA Ratio 3 |
PLSR | Original | 0.887 | 13.804 | 0.772 | 18.298 | |
| Factors = 6 | |||||||
| SVMR | 1st derivative | 0.974 | 10.443 | 0.956 | 11.282 | ||
| c = 100 | γ= 0.01 | ||||||
1 TSS = total soluble solids; 2 TA = titratable acidity; 3 TSS/TA ratio = fruit quality and maturity index; 4 PLSR = partial least squares regression; 5 SVMR = support vector machine regression; 6 c = penalty factor; 7 γ = kernel function parameter gamma; 8 SNV = standard normal variate; 9 Rc = correlation coefficient of calibration; 10 RMSEC = root mean square error of calibration; 11 Rp = correlation coefficient of prediction; 12 RMSEP = root mean square error of prediction; 13 MSC = multiplicative scatter correction.
Table 5.
Statistical characteristics of samples: standard (-1) and off-standard (1) in the calibration and prediction sets.
Table 5.
Statistical characteristics of samples: standard (-1) and off-standard (1) in the calibration and prediction sets.
| Statistical parameter | Calibration set | Prediction set |
|---|---|---|
| Number of Samples | 80 | 35 |
| Minimum | -1 | -1 |
| Maximum | 1 | 1 |
| Average | -0.55 | -0.54 |
| Standard deviation | 0.84 | 0.85 |
Table 6.
Performance of classification using PLS-DA 1 by various spectral pretreatment methods in the calibration set.
Table 6.
Performance of classification using PLS-DA 1 by various spectral pretreatment methods in the calibration set.
| Preprocessing | Factors | Standard (-1) | Off-standard (1) | % Accuracy |
% Specificity |
% Sensitivity |
% Error rate |
||
|---|---|---|---|---|---|---|---|---|---|
| TN 2 | FP 3 | TP 4 | FN 5 | ||||||
| Original | 4 | 58 | 4 | 4 | 14 | 77.50 | 93.55 | 22.22 | 22.50 |
| Smoothing | 5 | 59 | 3 | 6 | 12 | 81.25 | 95.16 | 33.33 | 18.75 |
| 1st derivative | 1 | 61 | 1 | 1 | 17 | 77.50 | 98.39 | 5.56 | 22.50 |
| 2nd derivative | 1 | 61 | 1 | 1 | 17 | 77.50 | 98.39 | 5.56 | 22.50 |
| MSC 6 | 4 | 57 | 5 | 7 | 11 | 80.00 | 91.94 | 38.89 | 20.00 |
| SNV7 | 5 | 56 | 6 | 10 | 8 | 82.50 | 90.32 | 55.56 | 17.50 |
| 1st derivative + MSC | 9 | 48 | 14 | 5 | 13 | 66.25 | 77.42 | 27.78 | 33.75 |
| 1st derivative + SNV | 1 | 62 | 0 | 1 | 17 | 78.75 | 100.00 | 5.56 | 21.25 |
1 PLS-DA = partial least squares-discriminant analysis; 2 TN = True negative ; 3 FP = False positive; 4 TP = True positive ; 5 FN = False negative; 6 MSC = multiplicative scatter correction; 7 SNV = standard normal variate.
Table 7.
Classification performance using SVMC 1 by various spectral pretreatment methods in the calibration set.
Table 7.
Classification performance using SVMC 1 by various spectral pretreatment methods in the calibration set.
| Preprocessing | Factors | Standard (-1) |
Off-standard (1) | % Accuracy |
% Specificity |
% Sensitivity |
% Error rate |
|||
|---|---|---|---|---|---|---|---|---|---|---|
| Nu 2 | γ 3 | TN | FP | TP | FN | |||||
| Original | 0.255 | 0.1 | 23 | 39 | 10 | 8 | 41.25 | 37.10 | 55.56 | 58.75 |
| Smoothing | 0.255 | 1 | 37 | 25 | 4 | 14 | 51.25 | 59.68 | 22.22 | 48.75 |
| 1st derivative | 0.01 | 1 | 45 | 17 | 10 | 8 | 68.75 | 72.58 | 55.56 | 31.25 |
| 2nd derivative | 0.01 | 1 | 42 | 20 | 11 | 7 | 66.25 | 67.74 | 61.11 | 33.75 |
| MSC 8 | 0.255 | 1 | 56 | 6 | 8 | 10 | 80.00 | 90.32 | 44.44 | 20.00 |
| SNV9 | 0.255 | 10 | 55 | 7 | 16 | 2 | 88.75 | 88.71 | 88.89 | 11.25 |
| 1st derivative + MSC | 0.01 | 0.01 | 31 | 31 | 14 | 4 | 56.25 | 50.00 | 77.78 | 43.75 |
| 1st derivative + SNV | 0.01 | 10 | 43 | 19 | 12 | 6 | 68.75 | 69.35 | 66.67 | 31.25 |
1 SVMC = support vector machine classification; 2 nu = nu parameter; 3 γ = kernel function parameter gamma; 4 TN = true negative; 5 FP = false positive; 6 TP = true positive; 7 FN = false negative; 8 MSC = multiplicative scatter correction; 9 SNV = standard normal variate.
Table 8.
Classification performance using PLS-DA and SVMC in the calibration and prediction sets.
| Methods | Data sets | Preprocessing | Factors | Standard (-1) | Off-standard (1) | % Accuracy |
% Specificity |
% Sensitivity | % Error rate |
|||
|---|---|---|---|---|---|---|---|---|---|---|---|---|
| TN 1 | FP 2 | TP 3 | FN 4 | |||||||||
| PLS-DA 5 | Cal 7 | SNV 9 | 5 | 56 | 6 | 14 | 4 | 87.50 | 90.32 | 77.78 | 12.50 | |
| Pre 8 | 23 | 4 | 4 | 4 | 77.14 | 85.19 | 50.00 | 22.86 | ||||
| SVMC 6 | Cal | SNV | Nu 10 | γ11 | 55 | 7 | 16 | 2 | 88.75 | 88.71 | 88.89 | 11.25 |
| Pre | 0.255 | 10 | 22 | 5 | 7 | 1 | 82.86 | 81.48 | 87.50 | 17.14 | ||
1 TN = true negative ; 2 FP = false positive; 3 TP = true positive ; 4 FN = false negative; 5 PLS-DA = partial least squares–discriminant analysis ; 6 SVMC = support vector machine classification; 7 Cal = calibration set; 8 Pre = prediction set; 9 SNV = standard normal variate; 10 nu = nu parameter; 11 γ = kernel function parameter gamma.
Disclaimer/Publisher’s Note: The statements, opinions and data contained in all publications are solely those of the individual author(s) and contributor(s) and not of MDPI and/or the editor(s). MDPI and/or the editor(s) disclaim responsibility for any injury to people or property resulting from any ideas, methods, instructions or products referred to in the content. |
© 2026 by the authors. Licensee MDPI, Basel, Switzerland. This article is an open access article distributed under the terms and conditions of the Creative Commons Attribution (CC BY) license (http://creativecommons.org/licenses/by/4.0/).
Copyright: This open access article is published under a Creative Commons CC BY 4.0 license, which permit the free download, distribution, and reuse, provided that the author and preprint are cited in any reuse.