

Submitted:
24 June 2026
Posted:
26 June 2026
You are already at the latest version
Abstract
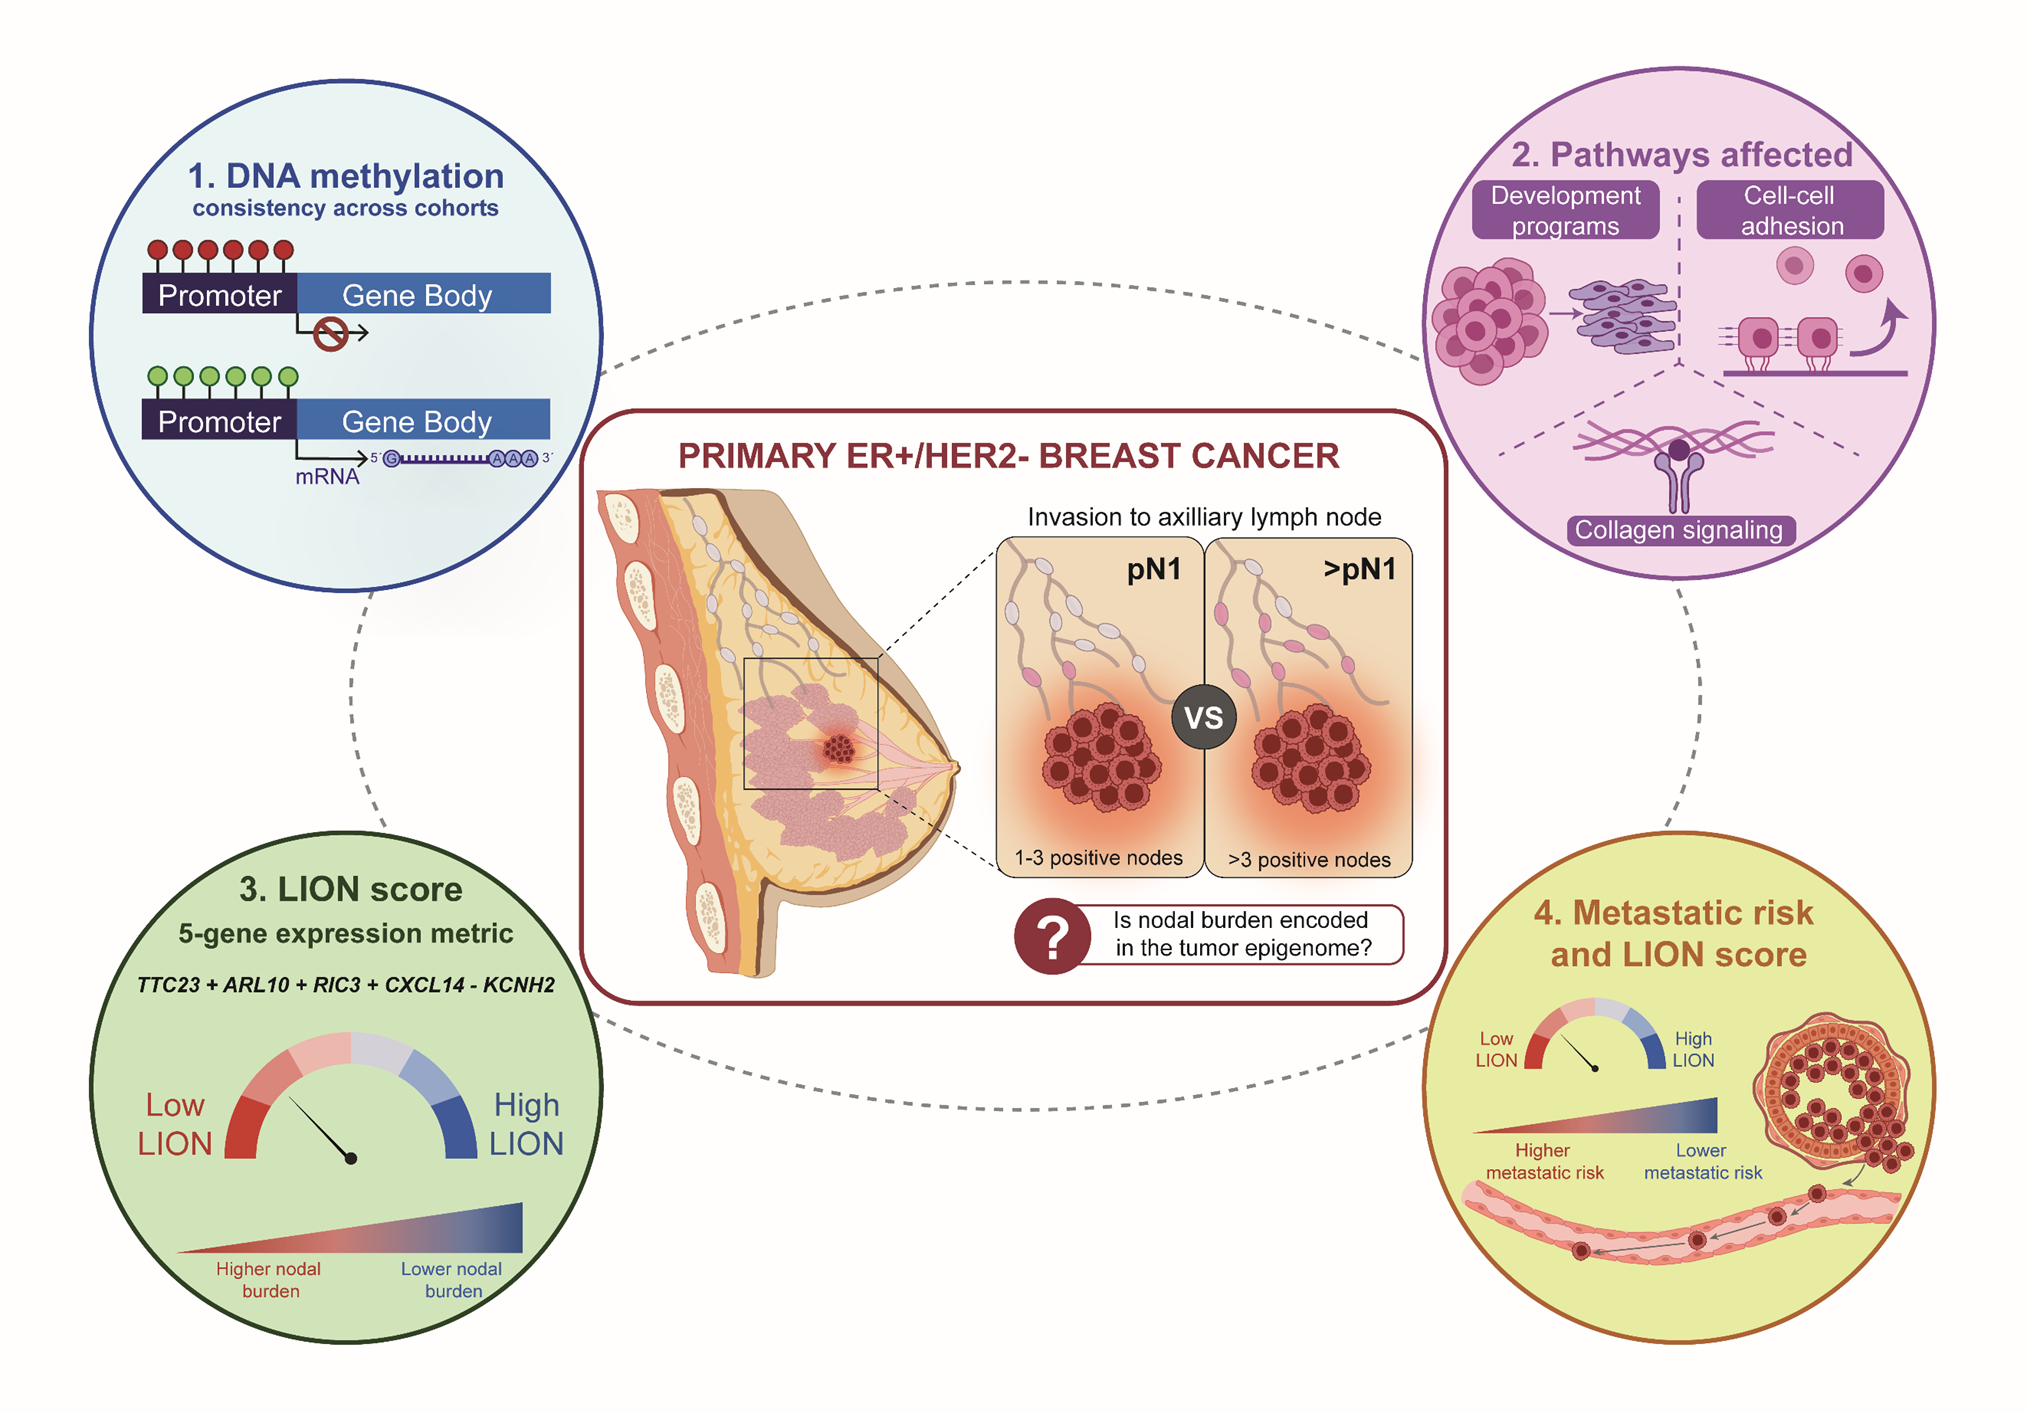
De-escalation of axillary surgery in breast cancer (BC) reduces surgical morbidity but limits pathological assessment of nodal burden, a key determinant of prognosis and adjuvant therapy in estrogen receptor-positive (ER+)/HER2- BC. Tumor-intrinsic biomarkers that reflect the extent of lymph node disease may help bridge this gap. We performed genome-wide DNA methylation profiling of primary tumors from patients with ER+/HER2- BC stratified by pathological nodal stage (1-3 positive nodes, pN1; 4 or more positive nodes, >pN1). Findings were validated across multiple independent cohorts (TCGA-BRCA, SCAN-B, AURORA US), integrating molecular and clinical data. Forty-seven tumors passed EPIC quality control (pN1: n=29; >pN1: n=18). Tumors with >pN1 disease showed epigenetic reprogramming, including promoter hypermethylation and suppression of genes in pathways related to development and cell adhesion. Across datasets, five genes (TTC23, ARL10, RIC3, CXCL14, KCNH2) were consistently associated with nodal involvement and outcomes. Based on these genes, we developed the LION (Lymph-node Involvement Outcome Numerator) score, which distinguishes tumors with >pN1 disease and is associated with worse distant metastasis-free survival across cohorts. The LION score represents a biologically informed molecular metric associated with nodal involvement in ER+/HER2- BC. These findings provide insight into tumor-intrinsic epigenetic programs linked to dissemination.
Keywords:
breast cancer
; ER+/HER2-
; epigenetics
; lymph node metastasis
; nodal burden
; DNA methylation
1. Introduction
Deeper insights into the biological heterogeneity of breast cancer (BC) and the rise of effective targeted therapies have fundamentally changed how we approach the axilla in patients with early-stage disease. Several randomized controlled trials have demonstrated that completion axillary lymph node dissection (ALND) in early-stage BC patients with minimal nodal disease identified on sentinel lymph node biopsy does not improve locoregional control or overall survival [1,2,3,4]. As a result, omission of ALND has become standard in selected patients, reducing the risk of lymphedema and functional morbidity without compromising oncologic outcomes [2].
For patients with clinically node-positive disease at diagnosis, neoadjuvant chemotherapy (NAC) has resulted in nodal pathologic complete response (pCR) rates as high as 70% in certain BC subtypes [5,6], enabling the omission of ALND in these cohorts. However, for patients with ER+/HER2- disease, pCR rates are significantly lower, typically not exceeding 35% [7,8]. Many of these patients continue to undergo ALND for residual nodal disease. Ongoing prospective randomized studies, including Alliance 11202 (NCT01901094) [9] and TAXIS (NCT03513614) [10], are evaluating whether ALND can be safely omitted in patients with residual nodal disease after NAC. The TAXIS study is also evaluating the omission of ALND in patients with clinically positive nodes who undergo upfront surgery [10], a group composed almost entirely of ER+/HER2- BC patients. Notably, retrospective data suggest that a substantial proportion of clinically node-positive patients with ER+/HER2- BC harbor limited nodal disease, even in the setting of palpable adenopathy [11,12].
This continued shift toward less extensive axillary surgery, while beneficial for reducing surgical morbidity, creates a critical information gap. Unlike the triple-negative and HER2+ BC subtypes, in which response to NAC guides prognosis and adjuvant therapies, nodal stage remains a key driver of prognosis and adjuvant therapy decision-making for ER+/HER2- BC. For example, genomic assays such as Oncotype DX are validated for patients with 1-3 positive nodes [13]; similarly, the selection of adjuvant CDK4/6 inhibitors relies in part on precise nodal staging [14]. Based on recent guidelines, extensive nodal disease (4 or more positive nodes) justifies the prioritized use of abemaciclib [15], whereas patients with limited nodal burden (1-3 positive nodes) are appropriately considered for ribociclib [16]. As axillary surgery is de-escalated, clinicians are increasingly forced to make systemic therapy decisions without granular nodal data. This evolving landscape raises important questions regarding whether primary tumors harbor molecular programs associated with the extent of nodal involvement and metastatic dissemination. Epigenetic alterations, particularly DNA methylation (DNAm) changes, represent a promising tumor-intrinsic approach [17], as they reflect coordinated regulatory programs associated with tumor progression and lymph node metastases.
In this study, we investigated whether primary ER+/HER2- BC harbor epigenetic programs associated with the extent of lymph node involvement. We performed genome-wide DNAm profiling of primary tumors from patients with limited (pN1) versus extensive (>pN1) nodal disease and integrated these data across independent cohorts. We further sought to determine whether tumor-intrinsic epigenetic features could be summarized into a molecular metric associated with nodal involvement and metastatic outcomes. We hypothesized that these features may capture coordinated biological programs linked to tumor dissemination.
2. Results
2.1. Clinicopathological Characteristics of the Study Cohort
A total of 51 female patients met the inclusion criteria and had tumors of sufficient purity for methylation analysis (pN1, n=31; >pN1, n=20). After DNA extraction and quality control, 47 cases yielded analyzable material and comprised the final study cohort (pN1, n=29; >pN1, n=18; Table 1 and Supplementary Table 1). Median age at diagnosis was 60 years (IQR: 49.5–70). Most tumors were pure invasive ductal carcinomas (75.5%), with the remainder showing mixed ductal and lobular histology.
Overall, the two groups showed no significant differences in age (p=0.45) or tumor histology (p=0.74). As expected, a higher tumor category was associated with a higher nodal stage (p=0.03) [12,18]. Most patients were White (68.1%), with fewer Black (17.0%) and other races (14.9%) included. While not statistically significant (p=0.09), a slightly higher proportion of Black patients was observed in the >pN1 group. This study population formed the basis for subsequent analyses on epigenetic alterations and their role in tumor nodal progression.
2.2. Distinct DNA Methylation Patterns Distinguish Tumors with High Nodal Burden
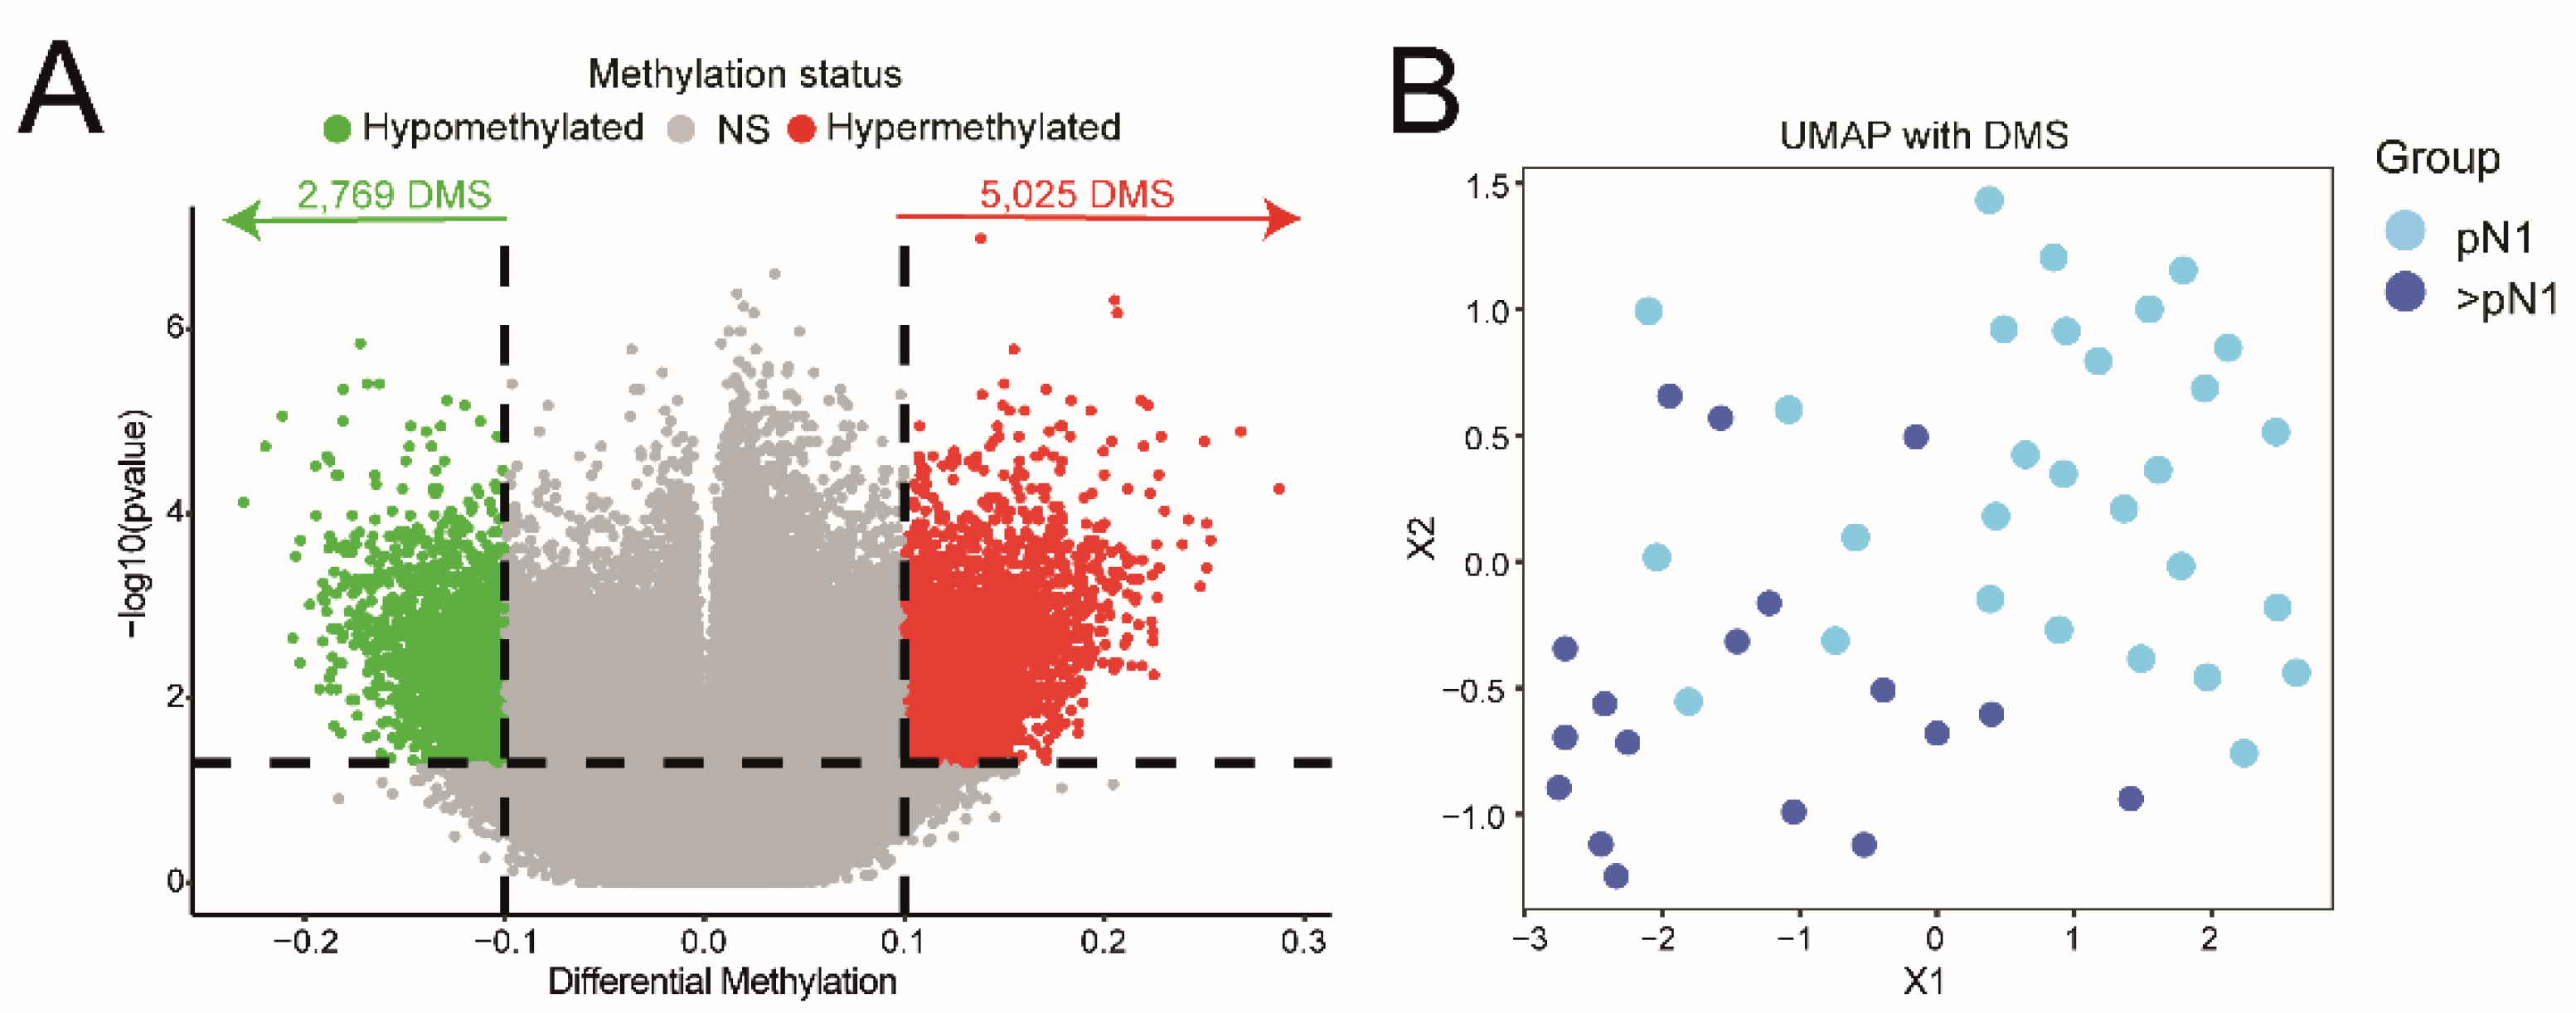
We identified widespread epigenetic differences between pN1 and >pN1 tumors (p<0.05; A), with a predominance of hypermethylation in >pN1 tumors. These methylation patterns robustly separated tumors by nodal status (B), indicating that primary tumors harbor intrinsic epigenetic differences associated with the extent of lymph node involvement. Given the inherent heterogeneity of CpG methylation in bulk tumor tissue, we assessed potential bias from tumor purity using the LUMP estimator [19], which showed no significant differences between the groups (p=0.714, Table 1).
Tumors with higher nodal burden were characterized by promoter-associated hypermethylation alongside widespread hypomethylation in non-promoter regions, consistent with an epigenetically reprogrammed landscape linked to tumor progression (Supplementary A). Stratification by CpG island context revealed that hypermethylation was predominantly enriched within CpG islands, whereas hypomethylation was mainly distributed across open sea and shelf regions (Supplementary B). Detailed analyses of genomic distribution and regulatory context of DNAm changes associated with increased lymph node involvement are provided in Supplementary C-D.
Together, these findings indicate that advanced nodal involvement is associated with a distinct methylation profile defined by promoter and CpG island hypermethylation, supporting a potential role for these alterations in tumor progression and metastatic dissemination. Importantly, these tumor-intrinsic epigenetic differences might be associated with clinically relevant outcomes.
Figure 1.
Epigenetic landscape, genomic distribution, and regulatory context of differentially methylated sites associated with lymph node involvement in primary breast tumors. (A) Volcano plot of the DMS between pN1 and >pN1 tumors (p<0.05; β-value >10%). 7,794 DMS of which 5,025 were hypermethylated (red) and 2,769 hypomethylated (green). (B) Uniform Manifold Approximation and Projection (UMAP) representation of the DNAm landscape of DMS, illustrating overall epigenetic changes that distinguish patients based on nodal involvement.
Figure 1.
Epigenetic landscape, genomic distribution, and regulatory context of differentially methylated sites associated with lymph node involvement in primary breast tumors. (A) Volcano plot of the DMS between pN1 and >pN1 tumors (p<0.05; β-value >10%). 7,794 DMS of which 5,025 were hypermethylated (red) and 2,769 hypomethylated (green). (B) Uniform Manifold Approximation and Projection (UMAP) representation of the DNAm landscape of DMS, illustrating overall epigenetic changes that distinguish patients based on nodal involvement.
2.3. Promoter Hypermethylation Correlates with Gene Expression Alterations in Higher Node Involvement
Promoter DNAm is a well-established mechanism of gene regulation and tumor progression [20]. To assess whether epigenetic alterations contribute to transcriptional changes associated with nodal burden, we analyzed promoter-associated DMS in tumors with pN1 versus >pN1 disease.
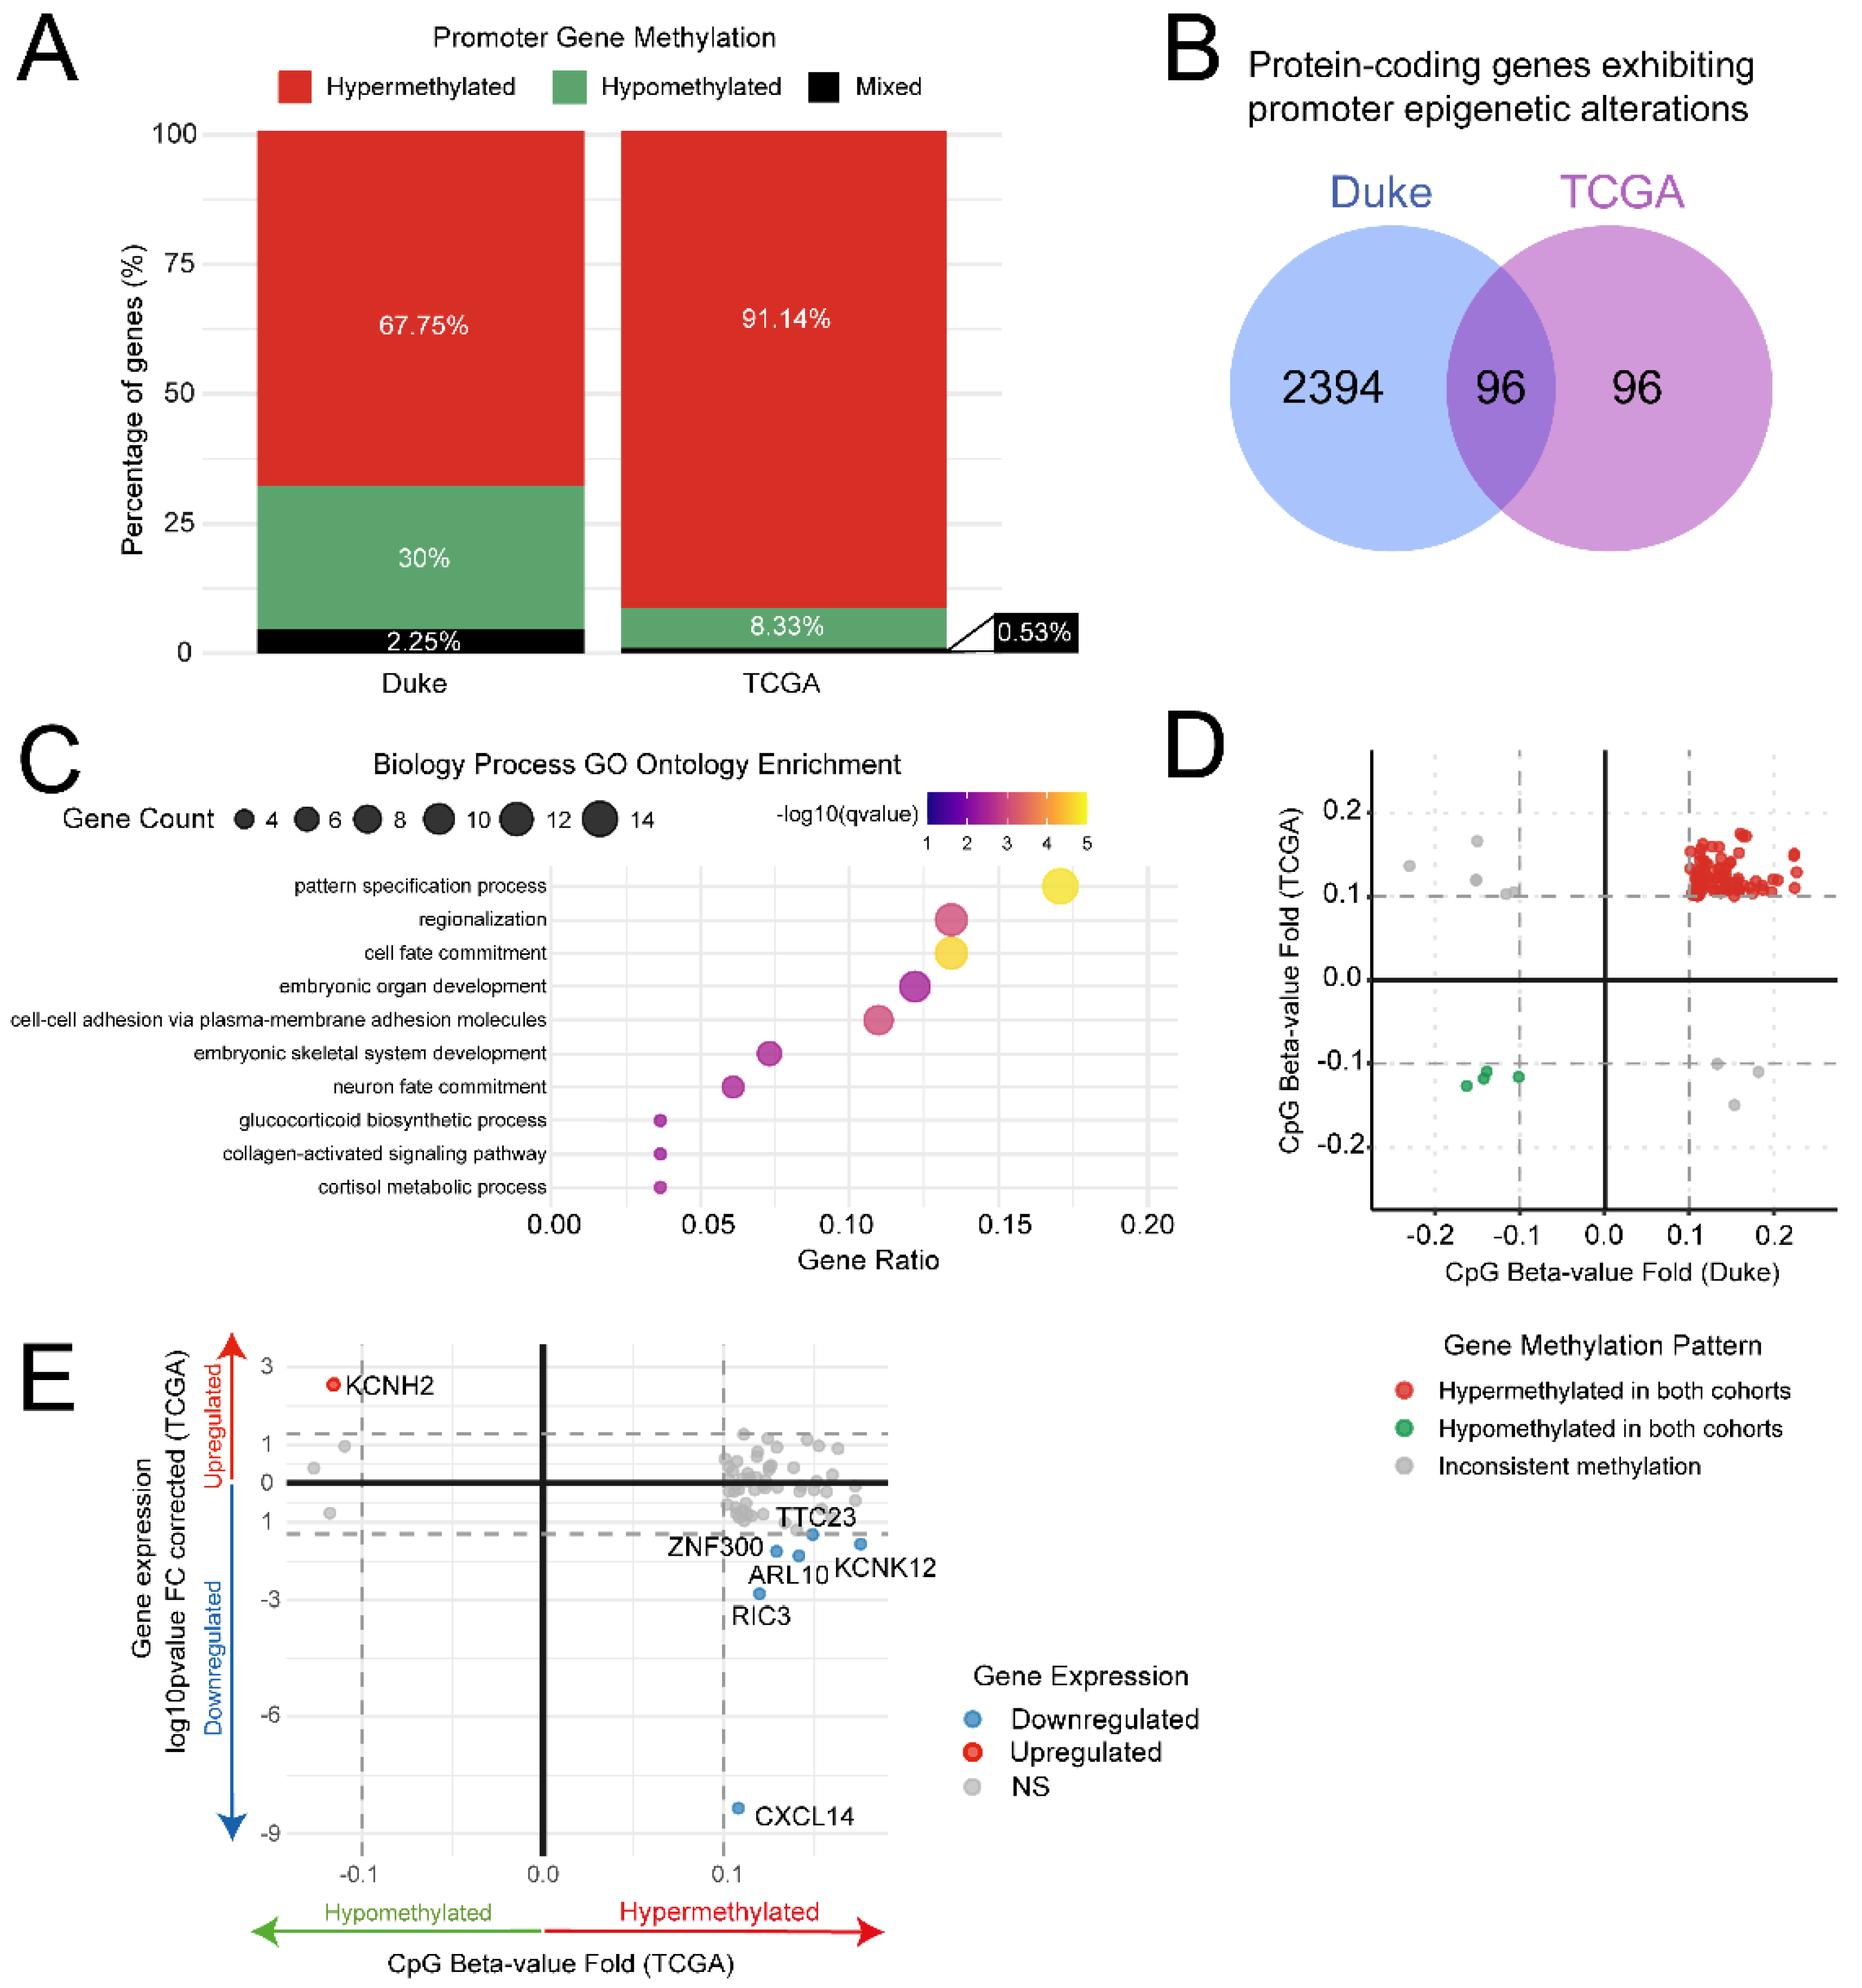
In the Duke cohort, 2,490 protein-coding genes exhibited promoter-associated methylation changes in association with higher nodal involvement, most of which (n=1,687; 67.25%) were characterized by promoter hypermethylation (A). To evaluate reproducibility, we analyzed the TCGA-BRCA cohort, specifically tumor samples from patients with ER+/HER2- disease that presented matched DNAm and transcriptomics data (n=148, Table 2, Supplementary Table 2, Supplementary A). Comparison of DNAm profiles confirmed consistent epigenetic differences between nodal groups (p<0.05; Supplementary B), with 522 differentially hypermethylated and 86 hypomethylated sites. Hypermethylated DMS tended to localize in promoters (Supplementary C) and in CpG islands (Supplementary D). Analysis of TCGA protein-coding genes with promoter-associated DMS confirmed these patterns, with 192 differentially methylated genes, 91.14% of them exhibiting promoter hypermethylation (A). Across both cohorts, 96 genes showed consistent promoter-associated methylation changes (B). These alterations were located in genes associated with pathways related to development and cell adhesion, processes implicated in tumor progression (adjusted p<0.05, C), supporting a role for epigenetic reprogramming in tumor progression.
Of these, 88 genes showed concordant methylation patterns across datasets (D); integration with transcriptomic data identified seven genes with both differential methylation and gene expression (ARL10, CXCL14, KCNK12, KCNH2, RIC3, TTC23, ZNF300). Six genes demonstrated promoter hypermethylation with reduced expression, whereas KCNH2 showed hypomethylation with increased expression (E). Gene-level methylation in the promoters and expression patterns are detailed in Supplementary Figure 3 and Supplementary Table 3.
Figure 2.
Epigenetic remodeling of promoter regions influences gene expression patterns linked to high nodal involvement. (A) Stacked bar plot showing the proportion of gene promoters with hypermethylated DMS (red), hypomethylated DMS (green), or an equal mix of both (black) in the Duke and TCGA datasets. (B) Venn diagram showing the overlap of protein-coding genes with at least one DMS in promoter regions (TSS1500, TSS200, 5`UTR, and 1st Exon) exhibiting epigenetic alterations in both the Duke and TCGA cohorts of ER+/HER2- BC. (C) The top 10 enriched Gene Ontology (GO) biological processes among 96 genes with promoter epigenetic modifications shared between cohorts. The x-axis shows the gene ratio, defined as the proportion of input genes associated with each GO term relative to total annotated genes for that term. (D) Scatter plot showing gene methylation patterns in Duke and TCGA cohorts. Each point represents the CpG site with the highest fold in each altered gene. Genes located in the upper right quadrant (red) exhibit consistent hypermethylation across both cohorts, whereas genes in the lower left quadrant (green) display consistent hypomethylation. Genes in grey have inconsistent methylation. (E) Scatter plot showing gene methylation and expression of the genes with the same methylation pattern in both cohorts. Genes located in the lower right quadrant (blue) are downregulated, and the genes in the upper left quadrant (red) are upregulated. The x-axis is the CpG site with the highest fold in each altered gene in the TCGA cohort, and the y-axis is the log10pvalue of the corrected fold change.
Figure 2.
Epigenetic remodeling of promoter regions influences gene expression patterns linked to high nodal involvement. (A) Stacked bar plot showing the proportion of gene promoters with hypermethylated DMS (red), hypomethylated DMS (green), or an equal mix of both (black) in the Duke and TCGA datasets. (B) Venn diagram showing the overlap of protein-coding genes with at least one DMS in promoter regions (TSS1500, TSS200, 5`UTR, and 1st Exon) exhibiting epigenetic alterations in both the Duke and TCGA cohorts of ER+/HER2- BC. (C) The top 10 enriched Gene Ontology (GO) biological processes among 96 genes with promoter epigenetic modifications shared between cohorts. The x-axis shows the gene ratio, defined as the proportion of input genes associated with each GO term relative to total annotated genes for that term. (D) Scatter plot showing gene methylation patterns in Duke and TCGA cohorts. Each point represents the CpG site with the highest fold in each altered gene. Genes located in the upper right quadrant (red) exhibit consistent hypermethylation across both cohorts, whereas genes in the lower left quadrant (green) display consistent hypomethylation. Genes in grey have inconsistent methylation. (E) Scatter plot showing gene methylation and expression of the genes with the same methylation pattern in both cohorts. Genes located in the lower right quadrant (blue) are downregulated, and the genes in the upper left quadrant (red) are upregulated. The x-axis is the CpG site with the highest fold in each altered gene in the TCGA cohort, and the y-axis is the log10pvalue of the corrected fold change.
2.4. Development of a Five-Gene Expression Score Associated with Nodal Involvement and Distant Metastasis
To explore their clinical relevance, we assessed the association between this gene set and clinical outcomes in an independent multi-institutional cohort, as single-gene analyses showed inconsistent associations (Supplementary A). Notably, ZNF300 did not show significant associations with any clinical parameter, whereas KCNK12 showed an association with RFS in the opposite direction to that expected from our DNA methylation-expression analysis. Overall, prognostic value varied across genes, potentially due to inter-patient differences and disease heterogeneity [21]. Therefore, we focused on the five genes that showed at least one significant clinical association and were directionally consistent with our integrative methylation-expression findings (Supplementary B).
Given the heterogeneity of single-gene associations, we evaluated whether the combination of various epigenetically regulated genes associated with nodal burden could provide a more robust summary of coordinated molecular alterations associated with nodal involvement. This strategy integrates tumor-intrinsic biology into a quantitative molecular framework. Using genes with concordant methylation and expression changes across cohorts, we developed the Lymph-node Involvement Outcome Numerator (LION) score, incorporating five genes (KCNH2, TTC23, ARL10, RIC3, and CXCL14) whose expression patterns were directionally consistent with promoter methylation changes and showed significant associations with clinical outcomes (A). A higher LION score corresponded to lower nodal burden.
In the TCGA cohort, the LION score was significantly lower in tumors with >pN1 disease than in those with pN1 disease (p<0.001). However, pN0 and pN1 tumors did not have significant differences in the LION score (p=0.94), suggesting that its relevance emerges specifically once nodal infiltration has been established (B). This finding was independently validated in the SCAN-B cohort, where the LION score was significantly higher in pN1 than in >pN1 tumors (p<0.001; C).
To assess its relationship with disease progression, we evaluated the LION score in the AURORA US cohort [22] (n =17 primary; n = 28 metastatic ER+/HER2- BC). Scores were significantly lower in metastatic tumors compared to primary tumors (p<0.001; D), supporting an association with systemic dissemination as well.
We further evaluated the prognostic value of the LION score in an independent cohort of 1,154 patients with ER+/HER2- BC from the KM plotter dataset [23]. Lower LION scores were associated with significantly worse relapse-free survival (HR=0.73; 95% CI: 0.59–0.91; p <0.001; E, left panel). No significant association was observed with overall survival, although a trend toward poorer outcomes was noted (HR=0.63; 95% CI: 0.40–1.01; p =0.052; E, middle panel). Notably, lower LION scores were strongly associated with inferior distant metastasis–free survival (HR=0.39; 95% CI: 0.23–0.64; p<0.001; E, right panel), indicating that the score reflects tumor biology linked to systemic disease progression.
Together, these findings demonstrate that the LION score captures tumor-intrinsic biology associated with both higher nodal burden and distant metastasis.
3. Discussion
The clinical management of lymph node metastases in BC is undergoing a fundamental shift. Axillary lymph node dissection, once standard for patients with nodal involvement, is now increasingly omitted given the lack of demonstrated survival benefit and substantial risk of long-term morbidity. As axillary surgery is increasingly de-escalated, understanding the biological determinants of nodal involvement becomes increasingly relevant. This evolving landscape provides an opportunity to investigate whether primary tumors harbor molecular programs associated with regional dissemination.
In this study, we demonstrate that primary ER+/HER2- tumors harbor epigenetically regulated transcriptional programs associated with higher nodal stage. Across independent cohorts, tumors with greater nodal involvement exhibited consistent patterns of promoter-associated hypermethylation and gene expression alterations, supporting the presence of tumor-intrinsic regulatory programs linked to regional lymphatic spread. These findings suggest that nodal involvement is not solely an anatomic phenomenon but may also reflect tumor-intrinsic regulatory programs detectable in the primary tumor.
At the gene level, integrative DNAm and transcriptomic analyses identified a subset of epigenetically regulated genes involved in developmental pathways, cellular identity, and cell adhesion, processes often reactivated during tumor progression to confer plasticity and adaptability [24]. While the mechanistic role of individual genes requires further study, the reproducibility of these patterns across datasets is consistent with developmental reprogramming accompanying nodal involvement and metastatic progression in ER+/HER2- BC.
These findings support the concept that nodal involvement reflects active tumor-microenvironment interactions rather than solely passive anatomical spread [25,26,27]. Emerging therapeutic strategies targeting lymphatic signaling pathways, such as VEGF-C/VEGFR-3 inhibition [28,29], as well as approaches aimed at normalizing the nodal immune microenvironment, including restoration of dendritic cell function or reversal of chronic interferon signaling, may offer opportunities to intercept metastatic progression [26]. In addition, nanoparticle-based platforms designed to deliver therapeutics directly to lymph nodes represent a promising, though investigational, strategy to modulate lymph node microenvironments directly [30,31]. Although still exploratory, these strategies underscore that nodal involvement is not merely a marker of progression but also a biologically active site where therapeutic intervention may be possible.
Our results suggest that nodal dissemination is associated, at least in part, with tumor-intrinsic programs detectable in the primary tumor, providing a rationale for developing molecular metrics that summarize biology related to nodal disease. Accordingly, we developed the LION score, a five-gene expression metric derived from epigenetically regulated genes and transcriptionally affected genes associated with nodal burden (TTC23, ARL10, RIC3, CXCL14, and KCNH2). Unlike the EpiSig classifier we previously reported [32], which was specifically trained via machine learning and subsequently validated to predict nodal stage, the LION score was not developed as a classifier of nodal stage, nor was it optimized for patient-level prediction or clinical decision-making. Instead, it was designed to summarize coordinated transcriptional consequences of epigenetically regulated genes associated with nodal involvement. Evaluated collectively, these genes may help summarize coordinated molecular alterations despite inter-patient and intra-tumoral heterogeneity, without implying immediate clinical application.
While these findings support the existence of tumor-intrinsic programs linked to dissemination, future studies specifically designed to evaluate their performance alongside established clinicopathologic variables will be required before any clinical application can be considered. Recent changes to BC staging already integrate prognostic variables, and scores based on mechanistically relevant genes may advance molecularly informed risk stratification. Current treatment paradigms in ER+/HER2- disease remain closely tied to nodal burden, including the use of genomic assays and CDK4/6 inhibitors [33,34]. In this context, molecular metrics such as LION may provide a framework for future studies aimed at complementing clinicopathologic risk assessment, pending formal validation.
Limitations
This study has limitations. First, the discovery cohort was modest in size and derived from retrospective data. Although the identified patterns were reproduced across multiple independent cohorts, larger studies will be required to further assess their robustness. The sample size and available clinical annotations also limited our ability to perform sufficiently powered multivariable analyses adjusting for tumor size, lymphovascular invasion, grade, proliferation, and other clinicopathologic covariates. Therefore, whether the LION score provides information independent of established clinicopathologic risk factors remains to be determined.
Second, nodal burden is influenced by multiple factors beyond tumor-intrinsic biology, including host immune responses, lymphatic anatomy, and stochastic aspects of metastatic dissemination. Consequently, the molecular alterations identified should not be interpreted as deterministic predictors of nodal involvement, but rather as biological features associated with patterns of nodal dissemination observed across patient populations.
Third, the LION score was not developed as a classifier of nodal stage, nor was it optimized for patient-level prediction or clinical decision-making. Instead, it was designed as a biologically informed molecular metric summarizing coordinated transcriptional alterations associated with epigenetically regulated genes linked to nodal involvement. Therefore, its clinical utility remains unknown and should not be inferred from the present analyses.
Finally, pure invasive lobular carcinomas were intentionally excluded to minimize biological and epigenetic heterogeneity within this pilot discovery cohort. Given the distinct molecular characteristics and metastatic patterns of invasive lobular carcinoma, the applicability of the LION score to this subtype remains uncertain and warrants dedicated investigation in future studies.
4. Materials and Methods
4.1. Inclusion and Ethics Statement
This study was conducted in accordance with the Declaration of Helsinki and was approved by the Duke Institutional Review Board (Pro00112216). Publicly available datasets were sourced from publicly available repositories and did not require IRB approval or patient-informed consent per the Code of Federal Regulations (45 CFR §46.104). All newly generated data were collected and analyzed in compliance with institutional and ethical guidelines.
4.2. Patient Selection and Inclusion Criteria of the Duke Cohort
We retrospectively identified a cohort of patients with ER+/HER2- BC and clinically positive lymph nodes at diagnosis who underwent ALND at Duke University between 2014 and 2023. Patients were stratified into two groups based on pathological nodal stage: pN1 (1-3 positive nodes) and >pN1 (4 or more positive nodes). Patients with clinically negative nodes who underwent sentinel lymph node biopsy, those who received NAC, or patients with pure invasive lobular carcinoma were excluded to minimize heterogeneity. Estrogen receptor positivity and HER2 negativity were defined according to ASCO/CAP guidelines [35].
4.3. Tissue Processing and DNA Isolation from Paraffin Tissue Sections
Homogeneous tumor sections (10 µm thick) from untreated surgical specimens of primary BC were microdissected using a needle to extract genomic DNA, minimizing contamination from peritumoral tissue. DNA was isolated using the Quick-DNA FFPE Kit (ZYMO Research, Cat. No: D3067) following the manufacturer’s instructions. DNA concentration and purity were assessed by using a Qubit 3 Fluorometer (Q33216; Thermo Fisher Scientific, CA) with the Qubit™ dsDNA HS Assay Kit (Q32851, Invitrogen).
4.4. Genome-Wide DNA Methylation Profiling and Data Processing
Genome-wide DNAm profiling was carried out at the Duke Molecular Physiology Institute’s Molecular Genomics Core facility. DNAm was assessed using the Infinium Methylation EPIC v1.0 BeadChip (Illumina, Inc.) following the manufacturer’s protocol. Data normalization and quality control were conducted using the R package ChAMP (v.2.36.0) [36]. Samples that failed to meet quality control criteria were excluded. Batch effects were evaluated and corrected using the ComBat function in ChAMP.
Differentially methylated sites (DMS) were identified as CpG sites with a differential mean β-value >10% and a p<0.05. Probes with a detection p-value above 0.05 were excluded, as well as those targeting non-CG dinucleotides, single-nucleotide polymorphisms, and probes with off-target binding to ensure data reliability and accuracy.
4.5. Characterization of Gene Regulatory Elements
Enhancer elements annotations were obtained from the FANTOM5 database [37]. CTCF motifs identified using the genome-wide position weight matrix scanner (PWMScan) of the JASPAR CORE 2020 vertebrate motif library [38] were classified as Insulator Elements (IE). Genomic region annotations were retrieved using the annotatePeak function from ChIPseeker (Galaxy Version 1.28.3) [39], categorizing regions into promoter (≤1kb, 1-2kb, 2-3kb), 5’ UTR, 3’ UTR, Exon, Intron, Downstream, and Intergenic. Accordingly, the distribution of genomic regions was analyzed, considering the following categories: i) Distal intergenic; ii) Intragenic (Exon, Intron, 5’ UTR, 3’ UTR, Downstream); iii) Promoter (Promoter ≤1kb, Promoter 1-2kb, Promoter 2-3kb); iv) Insulators; v) Enhancers. BED files were processed using Bedtools (v2.30.0) [40] within the Galaxy open-source platform [41].
4.6. Public Data Access and Processing
To validate our findings, clinical and molecular data from the TCGA-BRCA project were obtained via the National Cancer Institute's Genomic Data Commons portal using the TCGAbiolinks R package (v2.28.4) [42]. Only patients with ER+/HER2- tumors, identified by immunohistochemistry subtyping, were included. Patients with positive lymph nodes and either Invasive Ductal Carcinoma or Mixed Ductal and Lobular Carcinoma were selected to match the Duke cohort. Patients were included if they had both DNAm data (Illumina HumanMethylation450 array) and RNA sequencing (RNA-seq) data available for integrative molecular analysis. Patients who received NAC were excluded.
4.7. Lymph-Node Involvement Outcome Numerator Score Calculation and Validation
Genes with consistent differential methylation across datasets and concordant changes in gene expression were identified. The Lymph-node Involvement Outcome Numerator (LION) score was constructed by normalizing the raw expression counts of selected genes using size factors with the DESeq2 R package (v1.42.1) [43], and then scaling the normalized values with the minMax function from the Biobase (v2.62.0) R package. The LION score was then obtained by summing the individual scores of four genes (TTC23, ARL10, RIC3, and CXCL14), which were hypermethylated at their promoter regions and downregulated in >pN1 tumors, and subtracting the individual score of KCNH2, the only gene found to be hypomethylated and upregulated in the same group.
We analyzed the robustness of the LION score distribution across different gene expression datasets of ER+/HER2- BC patients (Supplementary Table 4). Specifically, in the TCGA-BRCA cohort, we compared normal breast tissue with BC samples stratified by nodal status (pN0, pN1, >pN1). Furthermore, clinical and gene expression data from the SCAN-B cohort [44] were downloaded from the Mendeley repository (DOI: 10.17632/yzxtxn4nmd.4). Data from the AURORA US Metastasis cohort were retrieved from the NCBI GEO (GSE209998) [22]. Survival analyses were performed using the gene expression data from the GeneChip platform available in the Kaplan–Meier plotter database [23]. We specifically selected datasets in which BC was classified as ER+/HER2- by array, and patients were dichotomized using the median expression level of each gene in the dataset. The cutoff for survival analysis was set at 120 months of follow-up.
4.8. Data Processing, Bioinformatic Analyses, and Visualization
Data processing and visualization were performed using multiple R packages. The Uniform Manifold Approximation and Projection for Dimension Reduction (UMAP) technique was used to visualize the distribution of groups according to their DMS using the M3C R package (v1.24.0). Forest plots were generated using the forestploter (v1.1.3) R package. Heatmaps were generated using the pheatmap (v1.0.12) R package. RNA-seq data from TCGA were analyzed using the DESeq2 R package (v1.42.1) [43]. Genes with a base mean of 25 reads or fewer were excluded. Differentially expressed genes (DEGs) were defined by an absolute log2 fold change (FC) >0.2 and an adjusted p-value <0.05. Gene ontology (GO) enrichment analysis of 96 epigenetically altered genes was performed using the clusterProfiler (v4.10.1) R package [45]. Kaplan-Meier curves were generated using the Kaplan-Meier plotter tool [23], and the log-rank test was applied to assess the statistical significance of differences in survival rates. Data transformation was carried out using the tidyverse (v2.0.0) R package. For data manipulation and visualization, the ggplot2 (v3.4.4) and Upset (v1.4.0) R packages were used.
4.9. Statistics and Reproducibility
All statistical analyses were performed using R software (v.4.3.1). Clinicopathologic categorical variables were analyzed with Fisher’s exact test or Student's t-test. Age was reported as median Interquartile Range (IQR) and mean Standard Deviation (SD), with comparisons using the two-sided Wilcoxon rank-sum test. The normality of continuous data was assessed using the Shapiro-Wilk test. Statistical differences between pN1 and >pN1 at each CpG site in methylation data were assessed using the two-sided Wilcoxon rank-sum test. Odds ratios (ORs) with 95% confidence intervals (CIs) were calculated using the questionR (v.0.7.8) R package with derived p-values obtained using Fisher’s exact test. For DEGs, p-values were corrected for multiple comparisons using the Benjamini-Hochberg False Discovery Rate method. The log-rank test was applied to assess the statistical significance of differences in survival rates.
5. Conclusions
BC management is increasingly moving toward axillary de-escalation, resulting in reduced availability of pathologic nodal staging. While this minimizes morbidity, it also limits a key determinant of prognosis and treatment selection. In this study, we demonstrate that ER+/HER2- BC harbor tumor-intrinsic epigenetic programs associated with nodal burden and metastatic risk. Leveraging these findings, we developed the LION score, a biologically informed gene expression metric associated with nodal involvement and worse distant metastasis-free survival. In this evolving clinical context, the LION score provides a biologically informed summary of these molecular alterations and may facilitate future studies aimed at understanding the mechanisms underlying tumor dissemination. Further biological and clinical validation will be required to determine its broader translational relevance.
Supplementary Materials
The following supporting information can be downloaded at the publisher’s website. Supplementary Table 1-4 and Supplementary Figures 1–4.
Author Contributions
R.F.: Resources, Investigation, Pathology review. S.Í.M.: Formal analysis, Data curation, Methodology, Validation, Visualization. S.A.: Investigation, Methodology. A.F.B.L., M.E.M., and P.L.A.: Formal analysis, Software, Data curation, Validation, Writing – review & editing. M.L.D., S.A., and R.F.: Interpretation of results, Writing – review & editing. M.L.D. and D.M.M.: Conceptualization, Methodology, Supervision, Project administration. S.Í.M., D.M.M., and M.L.D.: Writing – original draft. All authors reviewed, revised, and approved the final version of the manuscript.
Funding
This work was supported by the Department of Defense Breast Cancer Research Program under Award Number [HT9425-23-1-0030]. The views, opinions, and/or findings expressed are those of the author(s) and should not be construed as an official Department of the Army position, policy, or decision unless so designated by other documentation. We acknowledge the Duke University BioRepository & Precision Pathology Center (Duke BRPC; supported by P30CA014236) and the National Cancer Institute’s Cooperative Human Tissue Network (CHTN; RRID: SCR_004446), supported at Duke University by UM1CA239755, for providing biospecimens and associated services used in this study. This study was also supported by the Vicenç Mut postdoctoral contract funded by the Government of the Balearic Islands (CAIB, #POSTDOC001 to P.L.A.), 2024 postdoctoral call, and co-funded by the European Social Fund Plus (ESF+), the Scientific Foundation of the Spanish Association Against Cancer (PRDPM246418BEDO to A.F.B.L), the Balearic Islands Government FPI program (#FPI/037/2021 to S.Í.M), and the CEP/EDUIB-Santander mobility grant for official postgraduate study stays at the University of the Balearic Islands (UIB, 2023, to S.Í.M.).
Institutional Review Board Statement
This study was approved by the Duke Institutional Review Board and included a waiver of informed consent for the retrospective analysis of clinicopathologic data and tissue samples from Duke (Pro00112216). Additional data for this study, which were acquired from publicly available datasets, including The Cancer Genome Atlas (TCGA), the Sweden Cancerome Analysis Network – Breast (SCAN-B), and NCBI-Gene Expression Omnibus (GEO), did not require IRB approval or patient-informed consent per the Code of Federal Regulations (45 CFR §46.104).
Informed Consent Statement
Not applicable.
Data Availability Statement
The newly generated methylation data from the Duke cohort are deposited in NCBI-GEO (submission number GSE307770). TCGA methylation and gene expression data can be accessed from the National Cancer Institute GDC Data Portal (https://portal.gdc.cancer.gov/). Gene expression data from the SCAN-B cohort are available from the Mendeley repository (DOI: 10.17632/yzxtxn4nmd.4) [44]. Data from the AURORA US Metastasis cohort were retrieved from the NCBI GEO (GSE209998) [22]. No specific code was generated for this project. All code used for the R scripts was adapted from the standard scripts provided in the packages mentioned in the Methods section.
Conflicts of Interest
The authors declare that they have no competing interests.
Abbreviations
The following abbreviations are used in this manuscript:
| ALND | Axillary Lymph Node Dissection |
| BC | Breast Cancer |
| CDK4/6 | Cyclin-Dependent Kinase 4 and 6 |
| CI | Confidence Interval |
| DEGs | Differentially Expressed Genes |
| DMFS | Distant Metastasis-Free Survival |
| DMS | Differentially Methylated Sites |
| DNAm | DNA Methylation |
| EPIC | Infinium MethylationEPIC BeadChip |
| EE | Enhancer Elements |
| ER+ | Estrogen Receptor-Positive |
| FC | Fold Change |
| FFPE | Formalin-Fixed Paraffin-Embedded |
| GEO | Gene Expression Omnibus |
| GO | Gene Ontology |
| HER2− | Human Epidermal Growth Factor Receptor 2-negative |
| HR | Hazard Ratio |
| IE | Insulator Elements |
| IQR | Interquartile Range |
| IRB | Institutional Review Board |
| KM | Kaplan–Meier |
| LION | Lymph-node Involvement Outcome Numerator |
| LUMP | Leukocytes Unmethylation for Purity |
| NAC | Neoadjuvant Chemotherapy |
| OR | Odds Ratio |
| OS | Overall Survival |
| pCR | Pathologic Complete Response |
| pN1 | Pathological Nodal Stage 1 |
| >pN1 | Pathological Nodal Stage with ≥4 Positive Lymph Nodes |
| RFS | Relapse-Free Survival |
| RNA-seq | RNA Sequencing |
| SCAN-B | Sweden Cancerome Analysis Network–Breast |
| SD | Standard Deviation |
| TCGA | The Cancer Genome Atlas |
| TSS | Transcription Start Site |
| UMAP | Uniform Manifold Approximation and Projection |
References
- Giuliano, A.E.; Hunt, K.K.; Ballman, K. V.; Beitsch, P.D.; Whitworth, P.W.; Blumencranz, P.W.; Leitch, A.M.; Saha, S.; McCall, L.M.; Morrow, M. Axillary dissection vs no axillary dissection in women with invasive breast cancer and sentinel node metastasis: a randomized clinical trial. JAMA 2011, 305, 569--575. [Google Scholar] [CrossRef] [PubMed]
- Donker, M.; van Tienhoven, G.; Straver, M.E.; Meijnen, P.; van de Velde, C.J.H.; Mansel, R.E.; Cataliotti, L.; Westenberg, A.H.; Klinkenbijl, J.H.G.; Orzalesi, L.; et al. Radiotherapy or surgery of the axilla after a positive sentinel node in breast cancer (EORTC 10981-22023 AMAROS): a randomised, multicentre, open-label, phase 3 non-inferiority trial. Lancet. Oncol. 2014, 15, 1303--1310. [Google Scholar] [CrossRef] [PubMed]
- Galimberti, V.; Cole, B.F.; Zurrida, S.; Viale, G.; Luini, A.; Veronesi, P.; Baratella, P.; Chifu, C.; Sargenti, M.; Intra, M.; et al. Axillary dissection versus no axillary dissection in patients with sentinel-node micrometastases (IBCSG 23-01): a phase 3 randomised controlled trial. Lancet. Oncol. Erratum in Lancet Oncol. 2013 Jun;14(7):e254. 2013, 14, 297--305. [Google Scholar] [CrossRef] [PubMed]
- de Boniface, J.; Filtenborg Tvedskov, T.; Rydén, L.; Szulkin, R.; Reimer, T.; Kühn, T.; Kontos, M.; Gentilini, O.D.; Olofsson Bagge, R.; Sund, M.; et al. Omitting Axillary Dissection in Breast Cancer with Sentinel-Node Metastases. N. Engl. J. Med. 2024, 390, 1163--1175. [Google Scholar] [CrossRef] [PubMed]
- Giuliano, A.E.; Ballman, K. V.; McCall, L.; Beitsch, P.D.; Brennan, M.B.; Kelemen, P.R.; Ollila, D.W.; Hansen, N.M.; Whitworth, P.W.; Blumencranz, P.W.; et al. Effect of Axillary Dissection vs No Axillary Dissection on 10-Year Overall Survival Among Women With Invasive Breast Cancer and Sentinel Node Metastasis: The ACOSOG Z0011 (Alliance) Randomized Clinical Trial. JAMA 2017, 318, 918--926. [Google Scholar] [CrossRef] [PubMed]
- Mattar, A.; Antonini, M.; Cavalcante, F.P.; Zerwes, F.; Millen, E. de C.; Brenelli, F.P.; Frasson, A.L.; Baruel, P.C.; Okumura, L.M.; Soares, L.R.; et al. CADONOT: Comparing axillary dissection or not in breast cancer surgery. Breast 2025, 81, 104453. [Google Scholar] [CrossRef] [PubMed]
- Petruolo, O.A.; Pilewskie, M.; Patil, S.; Barrio, A. V.; Stempel, M.; Wen, H.Y.; Morrow, M. Standard Pathologic Features Can Be Used to Identify a Subset of Estrogen Receptor-Positive, HER2 Negative Patients Likely to Benefit from Neoadjuvant Chemotherapy. Ann. Surg. Oncol. 2017, 24, 2556--2562. [Google Scholar] [CrossRef] [PubMed]
- Boughey, J.C.; McCall, L.M.; Ballman, K. V.; Mittendorf, E.A.; Ahrendt, G.M.; Wilke, L.G.; Taback, B.; Leitch, A.M.; Flippo-Morton, T.; Hunt, K.K. Tumor biology correlates with rates of breast-conserving surgery and pathologic complete response after neoadjuvant chemotherapy for breast cancer: findings from the ACOSOG Z1071 (Alliance) Prospective Multicenter Clinical Trial. Ann. Surg. 2014, 260, 606--608. [Google Scholar] [CrossRef] [PubMed]
- Bougher, J. Alliance for Clinical Trials in Oncology (Responsible Party) Comparison of Axillary Lymph Node Dissection with Axillary Radiation for Patients with Node-Positive Breast Cancer Treated with Chemotherapy A011202. [PubMed]
- Henke, G.; Knauer, M.; Ribi, K.; Hayoz, S.; Gérard, M.-A.; Ruhstaller, T.; Zwahlen, D.R.; Muenst, S.; Ackerknecht, M.; Hawle, H.; et al. Tailored axillary surgery with or without axillary lymph node dissection followed by radiotherapy in patients with clinically node-positive breast cancer (TAXIS): study protocol for a multicenter, randomized phase-III trial. Trials 2018, 19, 667. [Google Scholar] [CrossRef] [PubMed]
- Crown, A.; Sevilimedu, V.; Morrow, M. Palpable Adenopathy Does Not Indicate High-Volume Axillary Nodal Disease in Hormone Receptor-Positive Breast Cancer. Ann. Surg. Oncol. 2021, 28, 6060--6068. [Google Scholar] [CrossRef]
- Angarita, S.; Ye, L.; Rünger, D.; Hadaya, J.; Baker, J.L.; Dawson, N.; Thompson, C.K.; Lee, M.K.; Attai, D.J.; DiNome, M.L. Assessing the Burden of Nodal Disease for Breast Cancer Patients with Clinically Positive Nodes: Hope for More Limited Axillary Surgery. Ann. Surg. Oncol. 2021, 28, 2609--2618. [Google Scholar] [CrossRef] [PubMed]
- Albain, K.S.; Barlow, W.E.; Shak, S.; Hortobagyi, G.N.; Livingston, R.B.; Yeh, I.-T.; Ravdin, P.; Bugarini, R.; Baehner, F.L.; Davidson, N.E.; et al. Prognostic and predictive value of the 21-gene recurrence score assay in postmenopausal women with node-positive, oestrogen-receptor-positive breast cancer on chemotherapy: a retrospective analysis of a randomised trial. Lancet. Oncol. 2010, 11, 55--65. [Google Scholar] [CrossRef] [PubMed]
- Gianni, C.; Nicolò, E.; Cristofanilli, M. Adjuvant CDK4/6 inhibitors in hormone receptor-positive early breast cancer: one fits all? Transl. breast cancer Res. a J. Focus. Transl. Res. breast cancer 2024, 5, 34. [Google Scholar]
- Johnston, S.R.D.; Harbeck, N.; Hegg, R.; Toi, M.; Martin, M.; Shao, Z.M.; Zhang, Q.Y.; Martinez Rodriguez, J.L.; Campone, M.; Hamilton, E.; et al. Abemaciclib Combined With Endocrine Therapy for the Adjuvant Treatment of HR+, HER2-, Node-Positive, High-Risk, Early Breast Cancer (monarchE). J. Clin. Oncol. Off. J. Am. Soc. Clin. Oncol. 2020, 38, 3987--3998. [Google Scholar] [CrossRef] [PubMed]
- Slamon, D.; Lipatov, O.; Nowecki, Z.; McAndrew, N.; Kukielka-Budny, B.; Stroyakovskiy, D.; Yardley, D.A.; Huang, C.-S.; Fasching, P.A.; Crown, J.; et al. Ribociclib plus Endocrine Therapy in Early Breast Cancer. N. Engl. J. Med. 2024, 390, 1080--1091. [Google Scholar] [CrossRef] [PubMed]
- Jardanowska-Kotuniak, M.; Dramiński, M.; Wlasnowolski, M.; Łapiński, M.; Sengupta, K.; Agarwal, A.; Filip, A.; Ghosh, N.; Pancaldi, V.; Grynberg, M.; et al. Unveiling Epigenetic Regulatory Elements Associated with Breast Cancer Development. Int. J. Mol. Sci. 2025, 26. [Google Scholar] [CrossRef] [PubMed]
- Ye, L.; Rünger, D.; Angarita, S.A.; Hadaya, J.; Baker, J.L.; Lee, M.K.; Thompson, C.K.; Attai, D.J.; DiNome, M.L. Higher risk tumor features are not associated with higher nodal stage in patients with estrogen receptor-positive, node-positive breast cancer. Breast Cancer Res. Treat. 2022, 193, 429--436. [Google Scholar] [CrossRef] [PubMed]
- Aran, D.; Sirota, M.; Butte, A.J. Systematic pan-cancer analysis of tumour purity. Nat. Commun. Erratum in Nat Commun. 2016 Feb 5;7:10707. doi: 10.1038/ncomms10707. 2015, 6, 8971. [Google Scholar] [CrossRef] [PubMed]
- Esteller, M. Epigenetic gene silencing in cancer: the DNA hypermethylome. Hum. Mol. Genet. 2007, 16 Spec No, R50–9. [Google Scholar] [CrossRef] [PubMed]
- Karthik, G.-M.; Rantalainen, M.; Stålhammar, G.; Lövrot, J.; Ullah, I.; Alkodsi, A.; Ma, R.; Wedlund, L.; Lindberg, J.; Frisell, J.; et al. Intra-tumor heterogeneity in breast cancer has limited impact on transcriptomic-based molecular profiling. BMC Cancer 2017, 17, 802. [Google Scholar] [CrossRef] [PubMed]
- Garcia-Recio, S.; Hinoue, T.; Wheeler, G.L.; Kelly, B.J.; Garrido-Castro, A.C.; Pascual, T.; De Cubas, A.A.; Xia, Y.; Felsheim, B.M.; McClure, M.B.; et al. Multiomics in primary and metastatic breast tumors from the AURORA US network finds microenvironment and epigenetic drivers of metastasis. Nat. Cancer 2023, 4, 128--147. [Google Scholar] [CrossRef] [PubMed]
- Lánczky, A.; Győrffy, B. Web-Based Survival Analysis Tool Tailored for Medical Research (KMplot): Development and Implementation. J. Med. Internet Res. 2021, 23, e27633. [Google Scholar] [CrossRef] [PubMed]
- Lee, M.Y. Embryonic Programs in Cancer and Metastasis-Insights From the Mammary Gland. Front. Cell Dev. Biol. 2022, 10, 938625. [Google Scholar] [CrossRef] [PubMed]
- Sleeman, J.P. The lymph node pre-metastatic niche. J. Mol. Med. (Berl) . 2015, 93, 1173--1184. [Google Scholar] [CrossRef] [PubMed]
- Li, Y.-L.; Hung, W.-C. Reprogramming of sentinel lymph node microenvironment during tumor metastasis. J. Biomed. Sci. 2022, 29, 84. [Google Scholar] [CrossRef] [PubMed]
- Li, L.; Liu, J.; Wang, W.; Fu, Y.; Deng, Y.; Li, X.; Liu, Z.; Pang, Y.; Xu, Y.; Yan, M.; et al. Cancer stem cells promote lymph nodes metastasis of breast cancer by reprogramming tumor microenvironment. Transl. Oncol. 2023, 35, 101733. [Google Scholar] [CrossRef] [PubMed]
- Alishekevitz, D.; Gingis-Velitski, S.; Kaidar-Person, O.; Gutter-Kapon, L.; Scherer, S.D.; Raviv, Z.; Merquiol, E.; Ben-Nun, Y.; Miller, V.; Rachman-Tzemah, C.; et al. Macrophage-Induced Lymphangiogenesis and Metastasis following Paclitaxel Chemotherapy Is Regulated by VEGFR3. Cell Rep. 2016, 17, 1344--1356. [Google Scholar] [CrossRef] [PubMed]
- Banerjee, K.; Kerzel, T.; Bekkhus, T.; de Souza Ferreira, S.; Wallmann, T.; Wallerius, M.; Landwehr, L.-S.; Agardy, D.A.; Schauer, N.; Malmerfeldt, A.; et al. VEGF-C-expressing TAMs rewire the metastatic fate of breast cancer cells. Cell Rep. 2023, 42, 113507. [Google Scholar] [CrossRef] [PubMed]
- Paholak, H.J.; Stevers, N.O.; Chen, H.; Burnett, J.P.; He, M.; Korkaya, H.; McDermott, S.P.; Deol, Y.; Clouthier, S.G.; Luther, T.; et al. Elimination of epithelial-like and mesenchymal-like breast cancer stem cells to inhibit metastasis following nanoparticle-mediated photothermal therapy. Biomaterials 2016, 104, 145--157. [Google Scholar] [CrossRef] [PubMed]
- He, A.; Li, X.; Dai, Z.; Li, Q.; Zhang, Y.; Ding, M.; Wen, Z.-F.; Mou, Y.; Dong, H. Nanovaccine-based strategies for lymph node targeted delivery and imaging in tumor immunotherapy. J. Nanobiotechnology 2023, 21, 236. [Google Scholar] [CrossRef] [PubMed]
- Ensenyat-Mendez, M.; Rünger, D.; Orozco, J.I.J.; Le, J.; Baker, J.L.; Weidhaas, J.; Marzese, D.M.; DiNome, M.L. Epigenetic Signatures Predict Pathologic Nodal Stage in Breast Cancer Patients with Estrogen Receptor-Positive, Clinically Node-Positive Disease. Ann. Surg. Oncol. 2022, 29, 4716--4724. [Google Scholar] [CrossRef] [PubMed]
- Narvaez, D.P.; Cescon, D.W. Navigating Treatment Sequencing in Advanced HR+/HER2- Breast Cancer After CDK4/6 Inhibitors: Biomarker-Driven Strategies and Emerging Therapies. Int. J. Mol. Sci. 2025, 26. [Google Scholar] [CrossRef] [PubMed]
- Chen, A.; Zheng, Z.-Y.; Anurag, M.; Elkhanany, A.; Chen, N.C.; Chang, E.C. CDK4/6 Inhibitors in Breast Cancer-Who Should Receive Them? Int. J. Mol. Sci. 2025, 26. [Google Scholar] [CrossRef]
- Wolff, A.C.; Somerfield, M.R.; Dowsett, M.; Hammond, M.E.H.; Hayes, D.F.; McShane, L.M.; Saphner, T.J.; Spears, P.A.; Allison, K.H. Human Epidermal Growth Factor Receptor 2 Testing in Breast Cancer: ASCO-College of American Pathologists Guideline Update. J. Clin. Oncol. Off. J. Am. Soc. Clin. Oncol. 2023, 41, 3867--3872. [Google Scholar] [CrossRef]
- Tian, Y.; Morris, T.J.; Webster, A.P.; Yang, Z.; Beck, S.; Feber, A.; Teschendorff, A.E. ChAMP: updated methylation analysis pipeline for Illumina BeadChips. Bioinformatics 2017, 33, 3982--3984. [Google Scholar] [CrossRef] [PubMed]
- Lizio, M.; Harshbarger, J.; Shimoji, H.; Severin, J.; Kasukawa, T.; Sahin, S.; Abugessaisa, I.; Fukuda, S.; Hori, F.; Ishikawa-Kato, S.; et al. Gateways to the FANTOM5 promoter level mammalian expression atlas. Genome Biol. 2015, 16, 22. [Google Scholar] [CrossRef] [PubMed]
- Fornes, O.; Castro-Mondragon, J.A.; Khan, A.; van der Lee, R.; Zhang, X.; Richmond, P.A.; Modi, B.P.; Correard, S.; Gheorghe, M.; Baranašić, D.; et al. JASPAR 2020: update of the open-access database of transcription factor binding profiles. Nucleic Acids Res. 2020, 48, D87--D92. [Google Scholar] [CrossRef] [PubMed]
- Yu, G.; Wang, L.-G.; He, Q.-Y. ChIPseeker: an R/Bioconductor package for ChIP peak annotation, comparison and visualization. Bioinformatics 2015, 31, 2382--2383. [Google Scholar] [CrossRef] [PubMed]
- Quinlan, A.R.; Hall, I.M. BEDTools: a flexible suite of utilities for comparing genomic features. Bioinformatics 2010, 26, 841--842. [Google Scholar] [CrossRef] [PubMed]
- Galaxy Community The Galaxy platform for accessible, reproducible and collaborative biomedical analyses: 2022 update. Nucleic Acids Res. 2022, W345--W351. [CrossRef] [PubMed]
- Colaprico, A.; Silva, T.C.; Olsen, C.; Garofano, L.; Cava, C.; Garolini, D.; Sabedot, T.S.; Malta, T.M.; Pagnotta, S.M.; Castiglioni, I.; et al. TCGAbiolinks: an R/Bioconductor package for integrative analysis of TCGA data. Nucleic Acids Res. 2016, 44, e71. [Google Scholar] [CrossRef] [PubMed]
- Love, M.I.; Huber, W.; Anders, S. Moderated estimation of fold change and dispersion for RNA-seq data with DESeq2. Genome Biol. 2014, 15, 550. [Google Scholar] [CrossRef] [PubMed]
- Saal, L.H.; Vallon-Christersson, J.; Häkkinen, J.; Hegardt, C.; Grabau, D.; Winter, C.; Brueffer, C.; Tang, M.-H.E.; Reuterswärd, C.; Schulz, R.; et al. The Sweden Cancerome Analysis Network - Breast (SCAN-B) Initiative: a large-scale multicenter infrastructure towards implementation of breast cancer genomic analyses in the clinical routine. Genome Med. 2015, 7, 20. [Google Scholar] [CrossRef] [PubMed]
- Yu, G.; Wang, L.-G.; Han, Y.; He, Q.-Y. clusterProfiler: an R package for comparing biological themes among gene clusters. OMICS 2012, 16, 284--287. [Google Scholar] [CrossRef] [PubMed]
Figure 3.
LION score, a combined 5-gene epigenetics and expression metric correlating with lymph node involvement and metastatic progression in primary ER+/HER2- breast tumors. (A) Schematic illustration of the LION score (Lymph-node Involvement Outcome Numerator score), integrating the expression of five genes. Higher LION scores correspond to lower lymph node involvement. (B) Boxplots comparing the LION score distribution between normal breast tissue and ER+/HER2- breast tumors stratified by lymph node involvement categories in the TCGA-BRCA cohort. (C) Boxplots comparing the LION score distribution between ER+/HER2- breast tumors stratified by lymph node involvement categories in the SCAN-B cohort. (D) Violin plots showing the LION score distribution in primary versus metastatic ER+/HER2- BC in the AURORA-US cohort. (E) Kaplan-Meier survival curves illustrating differences in RFS (left), OS (middle), and DMFS (right) in ER+/HER2- BC patients stratified by the LION score.
Figure 3.
LION score, a combined 5-gene epigenetics and expression metric correlating with lymph node involvement and metastatic progression in primary ER+/HER2- breast tumors. (A) Schematic illustration of the LION score (Lymph-node Involvement Outcome Numerator score), integrating the expression of five genes. Higher LION scores correspond to lower lymph node involvement. (B) Boxplots comparing the LION score distribution between normal breast tissue and ER+/HER2- breast tumors stratified by lymph node involvement categories in the TCGA-BRCA cohort. (C) Boxplots comparing the LION score distribution between ER+/HER2- breast tumors stratified by lymph node involvement categories in the SCAN-B cohort. (D) Violin plots showing the LION score distribution in primary versus metastatic ER+/HER2- BC in the AURORA-US cohort. (E) Kaplan-Meier survival curves illustrating differences in RFS (left), OS (middle), and DMFS (right) in ER+/HER2- BC patients stratified by the LION score.
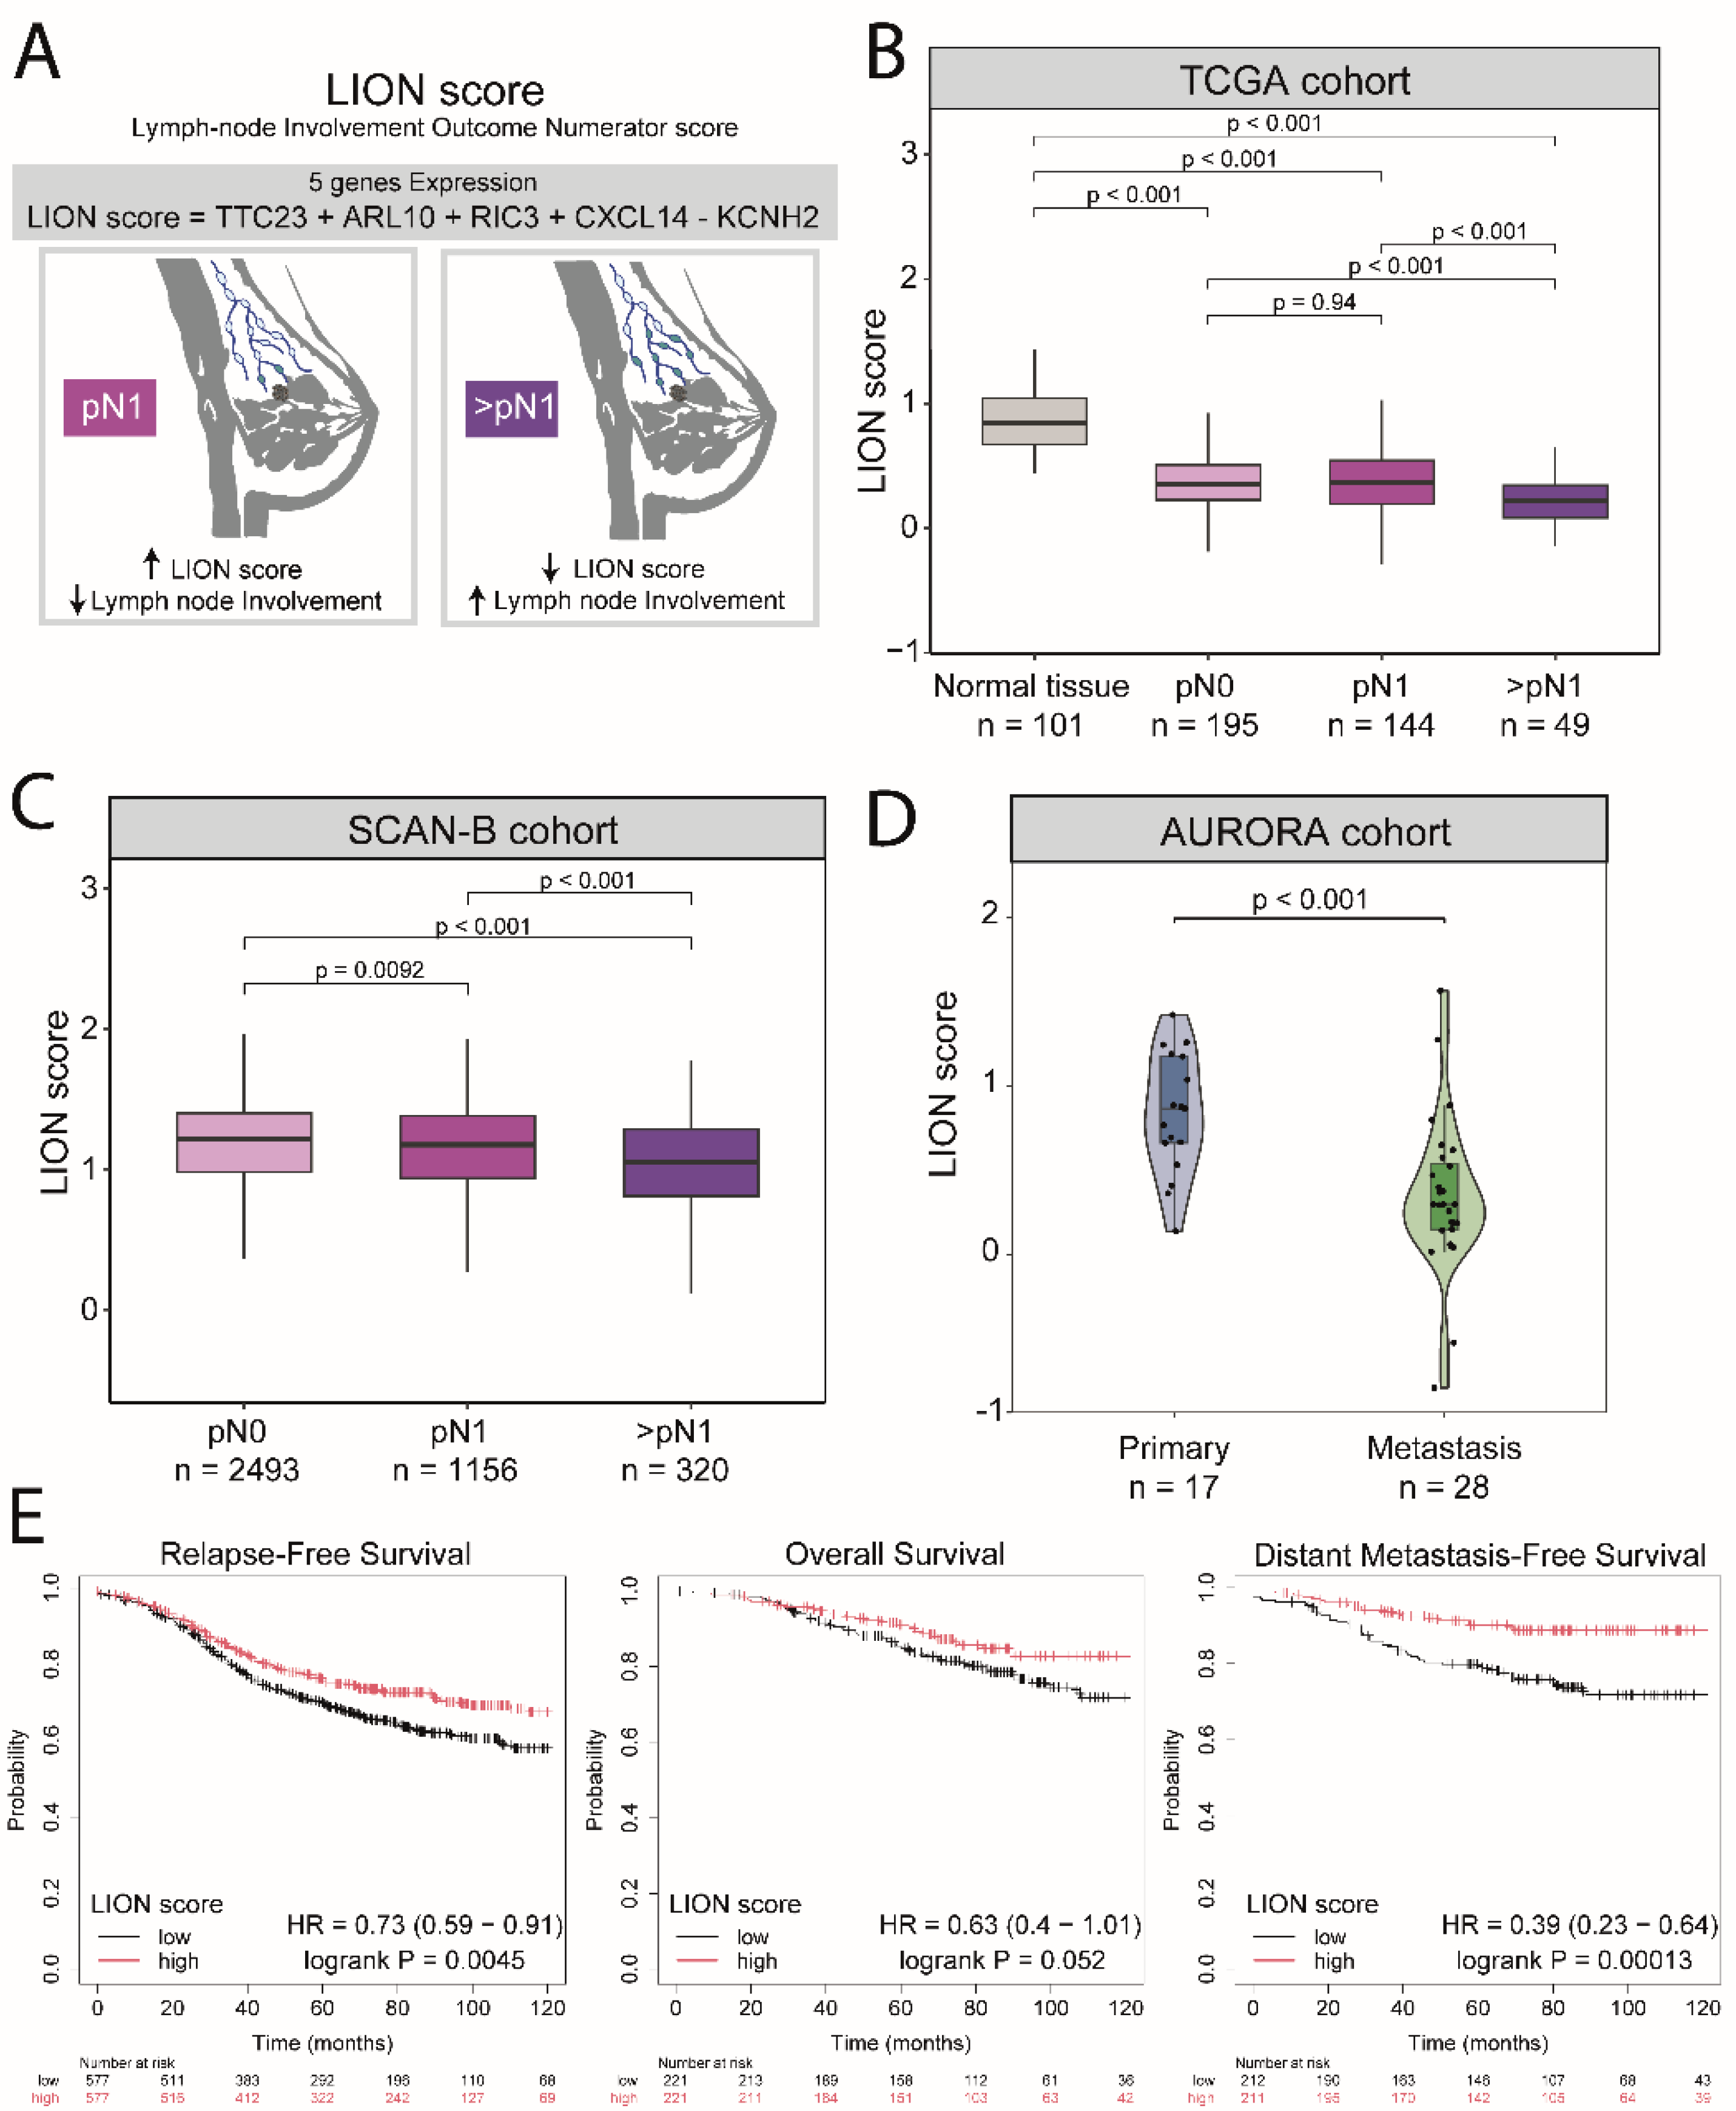

Table 1.
Demographic and clinicopathologic features of the Duke cohort according to pN category.
|
All Patients (n = 47) |
ER+ HER2- pN1 (n = 29) |
ER+ HER2- >pN1 (n = 18) |
|
| Age (Years) | p=0.448 (a) | ||
| Median (IQR) | 60 (49.5 - 70) | 57 (49 - 69) | 60.5 (52.5 - 71) |
| Mean (SD) | 58.74 (14.18) | 57.52 (14.72) | 60.72 (13.42) |
| Race | p=0.091 (b) | ||
| White | 32 (68.09%) | 22 (75.86%) | 10 (55.55%) |
| Black | 8 (17.02%) | 2 (6.89%) | 6 (33.33%) |
| Others | 7 (14.89%) | 5 (17.24%) | 2 (11.11%) |
| Tumor Histology | p=0.744 (b) | ||
| Ductal | 35 (74.47%) | 21 (75.86%) | 14 (77.78%) |
| Mixed | 12 (25.53%) | 8 (24.13%) | 4 (22.22%) |
| cT category | p=0.024 (b) | ||
| T1 | 8 (17.02%) | 7 (24.14%) | 1 (5.56%) |
| T2 | 29 (61.70%) | 18 (62.07%) | 9 (50.00%) |
| T3 | 13 (27.66%) | 3 (10.34%) | 8 (44.44%) |
| T4 | 1 (2.13%) | 1 (3.45%) | 0 (0%) |
| LUMP purity | p=0.714 (a) | ||
| Median (IQR) | 0.65 (0.11) | 0.65 (0.11) | 0.64 (0.1) |
| Mean (SD) | 0.63 (0.58-0.73) | 0.64 (0.58-0.74) | 0.62 (0.6-0.69) |
(a) Student’s t-test; (b) Fisher’s exact test.
Table 2.
Demographic and clinicopathologic features of the TCGA ER+/HER2- BC cohort according to pN category.
Table 2.
Demographic and clinicopathologic features of the TCGA ER+/HER2- BC cohort according to pN category.
|
All Patients (n = 148) |
ER+ HER2- pN1 (n = 108) |
ER+ HER2- >pN1 (n = 40) |
|
| Age (Years) | p=0.706 (a) | ||
| Median (IQR) | 56 (47 - 63) | 56 (47 - 63) | 53.5 (46.5 - 64.25) |
| Mean (SD) | 55.32 (12.99) | 55.06 (12.33) | 56.05 (14.79) |
| Race | p=0.456 (b) | ||
| White | 110 (74.32%) | 83 (76.85%) | 27 (67.5%) |
| Black | 31 (20.95%) | 20 (18.52%) | 11 (27.5%) |
| Others | 7 (4.73%) | 5 (4.63%) | 2 (5%) |
| Tumor Histology | p=0.612 (b) | ||
| Ductal | 143 (96.62%) | 105 (97.22%) | 38 (95%) |
| Mixed | 5 (3.38%) | 3 (2.78%) | 2 (5%) |
| cT category | p=0.045 (b) | ||
| T1 | 37 (25%) | 32 (29.63%) | 5 (12.5%) |
| T2 | 95 (64.19%) | 67 (62.04%) | 28 (70%) |
| T3 | 16 (10.81%) | 9 (8.33%) | 7 (17.5%) |
(a) Student’s t-test; (b) Fisher’s exact test.
Disclaimer/Publisher’s Note: The statements, opinions and data contained in all publications are solely those of the individual author(s) and contributor(s) and not of MDPI and/or the editor(s). MDPI and/or the editor(s) disclaim responsibility for any injury to people or property resulting from any ideas, methods, instructions or products referred to in the content. |
© 2026 by the authors. Licensee MDPI, Basel, Switzerland. This article is an open access article distributed under the terms and conditions of the Creative Commons Attribution (CC BY) license (http://creativecommons.org/licenses/by/4.0/).
Copyright: This open access article is published under a Creative Commons CC BY 4.0 license, which permit the free download, distribution, and reuse, provided that the author and preprint are cited in any reuse.


