
Submitted:
24 June 2026
Posted:
25 June 2026
You are already at the latest version
Abstract
Adulteration of freshly milled rice with rice from older sources is a fraudulent and illegal practice that exploits consumers. The purpose of this study was to develop a rapid and non-destructive technique that can detect this adulteration of milled rice, using near-infrared hyperspectral imaging (NIR-HSI) in the wavelength range of 935–1720 nm. Adulterated samples were prepared by adding old and freshly milled rice at different levels, scanning the mixed samples, and comparing the results with 100% freshly milled rice samples. All samples were divided into a calibration set and a prediction set to establish classification and calibration models. Spectral pretreatment methods were tested to develop the optimum models. For qualitative prediction, the best results for differentiation between freshly milled rice and adulterated samples using support vector machine classification (SVMC) yielded 92.31% accuracy, a 7.69% error rate, 88.89% sensitivity, and 96.55% specificity. For quantitative prediction, the best calibration model for determining the percentage of mixing with old rice using support vector machine regression (SVMR) gave results of coefficient of determination of prediction (R2p) = 0.95, and root mean square errors of prediction (RMSEP) = 6.75%. These results indicated that NIR-HSI could be successfully used in both qualitative and quantitative analyses to detect adulteration of freshly milled rice with old rice. It can be used as a rapid, nondestructive technique for assessing the authenticity of milled rice.
Keywords:
rice adulteration
; prediction model
; qualification
; quantification
; multivariate analysis
1. Introduction
Rice (Oryza sativa L.) is one of the most important staple foods, providing the main source of carbohydrates and protein for more than half of the world’s population, especially in Asia and Africa [1]. Global production of rice in 2025 was 542.02 million metric tons. The top producing countries were India (28%), China (27%), Bangladesh (7%), Indonesia (6%), Vietnam (5%), and Thailand (4%) [2,3]. Rice quality is therefore one of the most important factors affecting consumer health. The standards for rice quality have become stricter over time. This is driven by economic advancements and improvements in the quality of life [4]. However, the increasing commercialization of rice has led to various forms of adulteration. One of the most common illicit practices is mixing old rice with freshly milled rice. Older rice stocks are sold at lower prices, prompting adulteration. Consumers cannot visually assess adulteration. This fraudulent action is profitable but often degrades the quality, freshness, and nutritional value of the product. Adulterated rice is risky and undermines consumer confidence [5].
Rice exhibits changes in its physicochemical properties upon aging, including increased hardness, darker color, reduced aroma, and lower cooking quality due to protein denaturation, starch retrogradation, and lipid oxidation during storage [6,7,8]. In addition to economic concerns, consumption of old rice may be hazardous. Storage under unsuitable environmental conditions, particularly elevated humidity and temperature, can increase the risk of microbial contamination, including aflatoxin-producing molds [9]. Temperature, water activity (aw), and moisture content (MC) are the most critical factors affecting aflatoxin production in rice. Rice contamination by aflatoxins is caused by mold growth arising from improper drying and storage conditions [10,11]. Prolonged storage may lead to biochemical changes such as lipid oxidation, resulting in the formation of rancid compounds that negatively affect both sensory attributes and nutritional quality [6,8]. These risks depend on the conditions and duration of rice storage. When old rice is blended with freshly milled rice, these changes are difficult to visually detect [12,13]. Detecting adulteration of freshly milled rice requires traditional techniques such as chemical assays, sensory evaluation, and chromatography, but these methods are time-consuming, destructive, and impractical for routine or large-scale screening [14]. Therefore, developing rapid, accurate, and non-destructive analytical techniques to classify and identify adulteration of freshly milled rice is essential for maintaining consumer confidence, quality assurance, trade transparency, and food safety.
Recent advances in hyperspectral imaging (HSI) technology have made it a rapid, non-destructive, and high-throughput method for food quality and safety determination [15,16]. HSI can be used to simultaneously acquire spatial and spectral information of food products, offering a viable alternative to traditional, labor-intensive, and destructive assessment methods [17]. This technology significantly enhances food quality and safety. It is also used in areas such as disease detection and quality assessment [15,18,19,20]. Unlike conventional NIR spectroscopy, which analyzes a single point, NIR HSI collects a spectral image from a sample, enabling visualization of spatial variations and chemical compositions at each pixel [21,22,23]. NIR-HSI has been successfully applied to determine food authenticity and detect adulteration in numerous food and agricultural products. These include milk adulterated with chemical adulterants such as boric acid, salicylic acid, glucose, and formalin [24]; whey protein powder adulterated with inexpensive proteins and non protein nitrogen sources such as maltodextrin, wheat flour and milk powder [25]; whey protein powder contaminated by five adulterants, soy protein powder, corn flour, wheat flour, rice flour, and maltodextrin [26]; wheat flour adulterated with peanuts, walnuts, or benzoylperoxide [27]; tapioca starch adulterated with limestone powder [28]; turmeric powder contaminated with multiple adulterants including corn flour, rice flour, starch, wheat flour, and zedoary [29]. Hashemi rice was adulterated with different varieties of Shiroodi, Fajr, and Neda [30]; Amorphophallus muelleri blume flour was adulterated with suweg [Amorphophallus paeoniifolius (Dennst.)] and taro (Colocasia esculenta) flour [31], arabica coffee was adulterated with robusta coffee [32], and beef was adulterated with lymphatic meat [33]. There is no research demonstrating the potential of NIR-HSI combined with chemometric algorithms for the classification and quantification of freshly milled rice adulterated with old rice. Therefore, the objective of this study was to use NIR-HSI to detect old rice in freshly milled rice. To achieve this objective, freshly milled rice samples were mixed with different quantities of old rice samples. Then, freshly milled and combined samples were evaluated using NIR-HSI. Additionally, the integration of hyperspectral imaging and chemometric analysis was investigated to establish both classification and quantification models. A rapid, reliable, and non-destructive NIR-HSI technique could be useful for industrial quality monitoring, authenticity verification, and regulatory control within the rice supply chain.
2. Materials and Methods
2.1. Sample Preparation
All jasmine milled rice grain used in the current study was purchased from a local market in Thailand and packaged in heat-sealed polyethylene bags. The samples designated “old rice” were grown, harvested, milled, and stored at ambient temperature since 2012. Freshly milled rice was grown, harvested, and milled in 2025. Random samples of the old rice were added to freshly milled rice at different proportions from 1 to 99% (w/w). Each mixed sample was placed in a separate zip-lock polyethylene bag and then gently shaken to ensure homogeneity. All samples were stored at 25 °C before measurements.
2.2. Sample Properties
Several old and freshly milled rice sample properties were evaluated. These are discussed below.
2.2.1. Color
The color of each sample was measured using a colorimeter (Konica Minolta CR 400, Japan). Color values were recorded in the CIE L*a*b* system, where L* represents lightness (0 = black, 100 = white), a* represents the red/green axis, and b* represents the yellow/blue axis. Each sample was measured three times, and the results were averaged. The mean values ± standard deviation (SD) of samples in each group were used for comparison.
2.2.2. Moisture Content
The moisture content of each sample was measured using the method described in [34] using a hot-air oven (BINDER FD 115, Germany). Approximately 5 g of milled rice was weighed (W1), dried at 105 °C to a constant weight (W2). The percentage of moisture of each group was calculated using Equation (1). The data are reported as mean values ± standard deviation (SD) of both groups.
where: W1 = weight of sample before drying (g)
W2 = weight of sample after drying (g)
2.2.3. Water Activity Measurement
Water activity (aw) of each sample was measured using a water activity meter (Lab Touch-aw, Novasina AG, Switzerland). The average aw of each sample was calculated from three measurements at room temperature (25 ± 1 °C), and the mean values ± standard deviation (SD) of samples from both groups were compared.
2.2.4. Total Starch Content Determination
The total starch content was determined using the method described by [35]. In this analysis, 5 mg of each sample was mixed with 1 mL of 90% dimethyl sulfoxide (DMSO) and heated at 95 °C for 60 min with vortex mixing every 10 min. After cooling, 100 µL of the solution was transferred into a 96-well microplate and mixed with 100 µL of an iodine solution (3.04 g/L in 90% DMSO). The mixture was shaken for 2 min, and 20 µL was diluted with 180 µL of deionized water in a new microplate. Absorbance was measured at 620 nm using a microplate reader. The total starch content was determined using a standard calibration curve and expressed as percent starch (%). The total starch content was determined, and the mean values ± standard deviation (SD) of the samples from both groups were compared.
2.2.5. Protein Determination
The total nitrogen content of each sample was determined using Equation (2) in an automatic nitrogen analyzer LECO FP528 (Leco Corp., St. Joseph, MI, USA). The total protein content of each sample was calculated by multiplying the nitrogen content by a conversion factor, 5.95 [35]. All determinations were performed in triplicate, and the mean values ± standard deviation (SD) of samples from both groups were compared.
2.2.6. Amylose Content Determination
The amylose content of samples was determined following a modified method of [36]. One-hundred milligrams of milled rice was combined with 1 mL of 95% ethanol and 9 mL of 1 M NaOH before incubation for 24 hours at ambient temperature. Each sample was then diluted with distilled water to achieve a final volume of 100 mL. One milliliter of 1 M acetic acid and 2 mL of iodine solution were then added to each 5-mL sample. Distilled water was added to obtain a final 100 mL volume. The mixture was agitated and permitted to rest for 20 minutes before measuring its UV-absorbance at 620 nm. The amylose content of each sample was determined using a standard curve of amylose absorbance. The mean values ± standard deviation (SD) of samples from both groups were compared.
2.3. NIR-HSI Measurement
Each sample was filled into a sample cell and then scanned using a near-infrared hyperspectral imaging unit with a Specim Fx17e hyperspectral camera (Spectral Imaging Ltd., Oulu, Finland) over the 935–1720 nm wavelength range. The light source was comprised of six halogen lamps (three on each side, positioned at a 45° angle to the sample). Each sample was laid on a table moving at 20 mm·s−1, as depicted in Figure 1. A dark reference (Rb) image was acquired while the shutter was closed and the lens was covered. A white reference (Rw) was obtained using a Spectralon bar before every scan.
2.4. Data Analysis
The spectral image of each scan obtained information about the sample and its background. However, only the spectral image of each sample was required for analysis, so the spectral images of the sample cell and the background were removed. A region of interest (ROI) was defined as the spectral image of each sample. The spectral information used for each sample was acquired by averaging a spectral image of the ROI.
2.4.1. Qualitative Analysis
Principal component analysis (PCA) was applied as an unsupervised multivariate technique to reduce the dimensionality of the spectral data while preserving maximal variance. As reported by [38], PCA transforms correlated variables into a new set of principal components (PCs), enabling visualization of patterns and group separation. PCA is widely used as a preliminary step before classification. The spectral data of freshly milled and adulterated rice was analyzed using PCA.
Partial least squares (PLS) was employed as a supervised multivariate technique. Partial least squares discriminant analysis (PLS-DA) was used to evaluate sample classification performance [39,40]. The support vector machine (SVM) method is a powerful supervised machine learning technique that finds an optimal hyperplane that maximizes the margin between different classes in the feature space. This makes it especially suitable for handling high-dimensional, nonlinear, and complex datasets. Kernel functions are commonly employed to transform input data into a higher-dimensional space where linear separation is feasible [41]. Support vector machine classification (SVMC) was employed. In this study, PLS-DA and SVMC were used to classify differences between the freshly milled and adulterated rice samples.
The procedure for the classification of freshly milled and adulterated rice is shown in Figure 2. Freshly milled and adulterated rice samples were referenced as -1 and 1, respectively. Both samples were used for the calibration and prediction sets. The precision of the classification models was evaluated by considering predictive values compared at a cut-off value of 0. If predicted values of samples were less than 0 (negative), they were considered freshly milled rice samples. When the values were equal to or greater than 0 (positive), they were classified as adulterated rice samples. Spectral pretreatment methods, including smoothing, 1st derivative, 2nd derivative, standard normal variate (SNV), multiplicative scatter correction (MSC), and combined methods, were investigated using sample cross-validation in the calibration set to select the optimal spectral pretreatment method for classification. The performance of the classification was considered using several key metrics, including accuracy, error rate, sensitivity, and specificity [42]. These metrics provide a comprehensive evaluation of the classification capability in both the calibration and prediction sets.
In this study, accuracy was defined as the proportion of correctly classified samples (both true positives and true negatives) to the total number of samples. An accuracy value close to 100% implies a low error rate, indicating that the classification model performed well in correctly classifying the samples according to Equation (3):
The error rate was defined as the proportion of incorrectly classified samples, as presented in Equation (4):
Specificity (true negative rate) was used to measure whether the classification could be used to correctly identify negative samples (freshly milled rice) and was calculated as:
2.4.2. Quantitative Analysis
The quantification procedure establishing a calibration model for determining the percentage of old rice mixed with freshly milled rice is shown in Figure 3. Partial least squares regression (PLSR) and support vector machine regression (SVMR) were used to develop calibration models to predict the percentage of the adulterant. Freshly milled rice samples mixed with old rice in various ratios were divided into calibration and prediction sets. The spectral pretreatment methods, including smoothing, 1st derivative, 2nd derivative, MSC, SNV, and combined methods, were investigated using sample cross-validation in the calibration set. This was done to select the optimum spectral pretreatment method for establishing the calibration model. The performance of the calibration models was evaluated using the coefficient of determination (R2) and root mean square error (RMSE). High R2 values and low RMSE (%) values in both the calibration and prediction sets indicate that the calibration model accurately predicts the percentage of the adulterant (old rice).
Statistical analysis of the data was performed using SPSS software (Version 24.0, IBM Corp., Armonk, NY, USA), and the Unscrambler X Version 10.5.1 (CAMO, Oslo, Norway).
3. Results and Discussion
Color (L*, a*, and b*), protein and moisture content of freshly milled and old rice samples showed significant differences (p ≤ 0.05), while water activity, total starch content, and amylose were not significantly different (p > 0.05) (Table 1). Although the sample color slightly changed during storage, this was impossible to visually identify.
The original absorbance spectra of freshly milled and old rice were averaged (Figure 4a), revealing that the large peaks at around 1200 and 1450 nm were influenced by the chemical composition. The peak at 1200 nm corresponds to the second overtone of N-H, O-H and C-H stretching, and the peak at 1450 nm is associated with the first overtone of O-H stretching [43,44]. The 2nd derivative absorbance spectra of freshly milled and old rice were used to identify the main chemical components (Figure 4b), showing peaks at 1200, 1273, 1360, 1440, 1540, and 1585 nm. The peak at 1200 nm reflects the presence of water, corresponding to the second overtone of O-H stretching [43]. The peak at 1273 nm indicates the second overtone of the C-H stretching, which is linked to CH groups in both freshly milled and old rice [45].
The peak at 1360 nm arises from C-H combinations, indicating the presence of methyl groups (CH3) [46]. The peak at 1440 nm is related to the first overtone of O-H stretching, which is a fundamental structural feature of both water and carbohydrate molecules [45]. The peak at 1540 nm corresponds to the first overtone of the O-H stretching, indicating the presence of starch [46]. Also, the peak at 1585 nm is associated with the first overtone of O-H stretching, indicating the presence of starch and glucose molecules [44].
3.1. Qualitative Analysis for Differentiating Freshly Milled and Adulterated Rice
The 3D score plot of the first component (PC1), the second component (PC2) and the third component (PC3) showed two clusters that were separated, with the variation for PC1 and PC2 as 99 and 1%, respectively. This result showed that group separation using the spectral information of freshly milled and adulterated rice is possible (Figure 5). Therefore, spectral data were used for categorical classification using PLS-DA and SVMC in the next step.
Freshly milled (N = 98) and adulterated rice samples (N = 118) were combined for analysis using PLS-DA and support vector machine classification (SVMC). All samples (N = 216) were divided into a calibration set (N = 151) and a prediction set (N = 65). The standard deviation and the mean value of dependent variables of the freshly milled (-1) and adulterated rice samples (1) in the calibration and prediction sets are similar (Table 2).
Both MSC and SNV spectral pretreatments provided optimal result accuracy, error rate, sensitivity and specificity for PLS-DA (Table 3) as well as optimal accuracy, error rate, sensitivity and specificity using the 1st derivative + SNV spectral pretreatment for SVMC (Table 4). MSC or SNV spectral pretreatment could be employed for discriminant analysis using PLS-DA. Also, the 1st derivative + SNV spectral pretreatment was selected for discriminant analysis using SVMC. The optimal spectral pretreatments for classification were compared by analyzing samples in the calibration and prediction sets using PLS-DA and SVMC. These results are shown in Table 5. PLS-DA yielded 87.69% accuracy, a 12.31% error rate, 80.56% sensitivity, and 96.55% specificity, while SVMC showed 92.31% accuracy, a 7.69% error rate, 88.89% sensitivity, and 96.55% specificity. SVMC yielded better results than PLS-DA for classifying the samples into either freshly milled or adulterated rice. A comprehensive evaluation of the classification using SVMC was presented by the confusion matrices in both the calibration and prediction sets, as shown in Figure 6.
3.2. Quantitative Analysis for Establishing a Calibration Model for Determining the Percentage of Old Rice Mixed with Freshly Milled Rice
The adulterated rice samples (N = 118), including two freshly milled samples (N = 2) and two old samples (N = 2) were used for quantitative analysis to establish the calibration model. These samples (N = 122) were divided into calibration (N = 85) and prediction (N = 37) sets. The proportion of old rice added to freshly milled rice varied from 0 to 100% in the calibration set. This covered the range of samples in the prediction set (2 to 98). The standard deviation in the calibration set was similar to that of the prediction set (Table 6). In this study, PLSR and SVMR were used to develop calibration models from 85 samples in the calibration set to predict the mixing percentage with old rice. Various spectral pretreatment methods were investigated to select the optimum calibration models. The optimal calibration models, PLSR and SVMR, were evaluated on 37 samples from the prediction set. The results showed that the optimum root mean square error of cross-validation (RMSECV) by PLSR models was 9.40% using the 1st derivative spectral pretreatment method (Table 7). Also, the optimal RMSECV by SVMR models was 8.44% using the 1st derivative spectral pretreatment method (Table 8).
Based on the above discussion, the 1st derivative spectral pretreatment yielded optimal results for both the PLSR and SVMR models. So, it was selected to establish the calibration models for both. The resulting PLSR and SVMR models were then retested to compare their performance and robustness using samples from both the calibration and prediction sets. These results are shown in Table 9. More accurate results were obtained from the SVMR model. So, it was selected as the best model for predicting the percentage of old rice (Figure 7a,b).
These results agree with [47] and show that NIR-HSI can be successfully applied for detecting adulteration in food products, both quantitatively and qualitatively.
4. Conclusions
Near-infrared hyperspectral imaging can be used for detecting adulteration of freshly milled rice with old milled rice in both qualitative and quantitative analyses. From the techniques for prediction testing, the 1st derivative combined with the SNV spectral pretreatment method yielded the best discrimination results with support vector machine classification, presenting an accuracy of 92.31%, an error rate of 7.69%, sensitivity of 88.89%, and a specificity of 96.55%. The support vector machine regression model with 1st derivative spectral pretreatment yielded the best results for predicting the percentage of old rice mixed with freshly milled rice, R2p of 0.95 and RMSEP of 6.75%. Near-infrared hyperspectral imaging has potential as a non-destructive technique for use in monitoring the authenticity of freshly milled rice.
Author Contributions
Conceptualization, S.T.; methodology, S.W. and W.S.; validation, S.T.; formal analysis, S.W. and W.S.; data curation, R.S.; writing—original draft preparation, S.W.; writing—review and editing, S.T. and A.K.T.; supervision, S.T. All authors have read and agreed to the published version of the manuscript.”.
Funding
This research was funded by King Mongkut ’s Institute of Technology Ladkrabang Research Fund, grant number KREF116901.
Institutional Review Board Statement
Not applicable.
Informed Consent Statement
Not applicable.
Data Availability Statement
The data presented in this study are available on request from the corresponding author.
Acknowledgments
The authors thank Professor Dr. Panmanas Sirisomboon for valuable technical assistance.
Conflicts of Interest
The authors declare no conflicts of interest.
References
- Sen, S.; Chakraborty, R.; Kalita, P. Rice - not just a staple food: A comprehensive review on its phytochemicals and therapeutic potential. Trends Food Sci. Technol. 2020, 97, 265–285. [Google Scholar] [CrossRef]
- Food and Agriculture Organization of the United Nations (FAO). Cereal supply and demand brief. Available online: https://www.fao.org/worldfoodsituation/csdb/en (accessed on 22 May 2026).
- United States Department of Agriculture (USDA). Rice outlook reports. Available online: https://www.ers.usda.gov/topics/crops/rice/ (accessed on 22 May 2026).
- Boonkong, A.; Jiang, B.; Kassoh, F.S.; Srisukwatanachai, T. Chinese and Thai consumers’ willingness to pay for quality rice attributes: a discrete choice experiment method. Front. Sustain. Food Syst. 2023, 7. [Google Scholar] [CrossRef]
- Śliwińska-Bartel, M.; Burns, D. T.; Elliott, C. Rice fraud a global problem: A review of analytical tools to detect species, country of origin and adulterations. Trends Food Sci. Technol. 2021, 116, 36–46. [Google Scholar] [CrossRef]
- Scariot, M.A.; Karlinski, L.; Dionello, R.G.; Radünz, A.L.; Radünz, L.L. Effect of drying air temperature and storage on industrial and chemical quality of rice grains. J. Stored Prod. Res. 2020, 89, 101717. [Google Scholar] [CrossRef]
- Miao, X.X.; Miao, Y.; Tao, S.H.; Liu, D.B.; Chen, Z.W.; Wang, J.M.; Huang, W.D.; Yu, Y.Y. Classification of rice based on storage time by using near infrared spectroscopy and chemometric methods. Microchem. J. 2021, 171, 106841. [Google Scholar] [CrossRef]
- Hu, H.; Li, S.; Pan, D.; Wang, K.; Qiu, M.; Qiu, Z.; Liu, X.; Zhang, J. The Variation of Rice Quality and Relevant Starch Structure during Long-Term Storage. Agriculture. 2022, 12(8), 1211. [Google Scholar] [CrossRef]
- Ndiaye, A.; Traore, A.; Gueye, P.S.; Senwo, Z.; Ndiaye, M.; Diop, A. Metal and Pesticide Assessments of Imported and Locally Cultivated Rice (Oryza sativa) in Senegal. Appl. Sci. 2024, 14(7), 2876. [Google Scholar] [CrossRef]
- Santos, A.R.; Carreir’o, F.; Freitas, A.; Barros, S.; Brites, C.; Ramos, F.; Sanches-Silva, A. Mycotoxins contamination in rice: Analytical methods, occurrence and detoxification strategies. Toxins. 2022, 14(9), 647. [Google Scholar] [CrossRef] [PubMed]
- Naeem, I.; Ismail, A.; Riaz, M.; Aziz, M.; Akram, K.; Shahzad, M.A.; Ameen, M.; Ali, S.; Oliveira, C.A. Aflatoxins in the rice production chain: A review on prevalence, detection, and decontamination strategies. Food Res. Int. 2024, 188, 114441. [Google Scholar] [CrossRef] [PubMed]
- Huang, F.; Peng, Y.; Li, L.; Ye, S.; Hong, S. Near-Infrared spectroscopy combined with machine learning methods for distinguishment of the storage years of rice. Infrared Phys. Technol. 2023, 133, 104835. [Google Scholar] [CrossRef]
- Sun, X.; Zhou, X.; Liu, C.; Li, C.; Zhang, S.; Zheng, D. Rapid and nondestructive identification of rice storage year using hyperspectral technology. Food Control. 2024, 168, 110850. [Google Scholar] [CrossRef]
- Li, C.; Li, B.; Ye, D. Analysis and identification of rice adulteration using Terahertz spectroscopy and pattern recognition algorithms. IEEE Access. 2020, 8, 26839–26850. [Google Scholar] [CrossRef]
- Liang, Y.; Li, Z.; Shi, J.; Zhang, N.; Qin, Z.; Du, L.; Zhai, X.; Shen, T.; Zhang, R.; Zou, X.; Huang, X. Advances in Hyperspectral Imaging Technology for grain quality and Safety Detection: A review. Foods. 2025, 14(17), 2977. [Google Scholar] [CrossRef] [PubMed]
- Miao, Y.; Zong, L.; Su, W. Machine learning in VIS/NIR spectroscopy and hyperspectral imaging for rapid detection of staple foods quality and safety: A review. J. Food Compos. Anal. 2025, 148, 108422. [Google Scholar] [CrossRef]
- Kheiralipour, K.; Sajadipour, F.; Nadimi, M. A review of nut quality assessment using hyperspectral imaging technique. J. Food Compos. Anal. 2025, 148, 108184. [Google Scholar] [CrossRef]
- Ezenarro, J.; Saouabi, I.; García-Pizarro, Á.; Schorn-García, D.; Mestres, M.; Amigo, J.M.; Busto, O.; Boqué, R. NIR-HSI for the non-destructive monitoring of in-bag hazelnut oxidation. Spectrochim. Acta-A Mol. Biomol. Spectrosc. 2025, 333, 125906. [Google Scholar] [CrossRef] [PubMed]
- Yao, L.; Rongyao, Z.; Yingzhe, L.; Xuefeng, L.; Bingqian, H.; Zhanhua, S.; Qinglu, Y.; Yinfa, Y. Nondestructive detection of deoxynivalenol in wheat kernels using VNIR-HSI supported by spatial heterogeneity analysis with SEM and SR-FTIR. Food Control. 2026, 184, 112016. [Google Scholar] [CrossRef]
- Song, Y.; Zheng, Y.; Xin, J.; Zhang, F.; Qi, H.; Yu, F.; Wang, X.; Chen, L.; Cao, C.; Yu, Y.; Li, Z. Simultaneous detection of water content and ferulic acid content in Angelica sinensis using NIR-HSI and multi-task hierarchical attention CNN. Spectrochim. Acta-A Mol. Biomol. Spectrosc. 2026, 358, 127829. [Google Scholar] [CrossRef] [PubMed]
- Priya, T.S.R.; Manickavasagan, A. Characterising corn grain using infrared imaging and spectroscopic techniques: a review. J. Food Meas. Charact. 2021, 15(4), 3234–3249. [Google Scholar] [CrossRef]
- Yan, L.; Liu, C.; Zain, M.; Cheng, M.; Huo, Z.; Sun, C. Estimation of Rice Protein Content Based on Unmanned Aerial Vehicle Hyperspectral Imaging. Agronomy. 2024, 14(11), 2479. [Google Scholar] [CrossRef]
- Jin, C.; Zhou, L.; Zhao, Y.; Qi, H.; Wu, X.; Zhang, C. Classification of rice varieties using hyperspectral imaging with multi-dimensional fusion convolutional neural networks. J. Food Compos. Anal. 2025, 148, 108389. [Google Scholar] [CrossRef]
- Aqeel, M.; Sohaib, A.; Iqbal, M.; Ullah, S.S. Milk adulteration identification using hyperspectral imaging and machine learning. J. Dairy Sci. 2024, 108(2), 1301–1314. [Google Scholar] [CrossRef] [PubMed]
- Song, W.; Yun, Y.; Lv, Y.; Zhang, C.; Tang, X.; Wang, H.; Wang, Z. Authentication and quality assessment of whey protein-based sports supplements using portable near-infrared spectroscopy and hyperspectral imaging. Food Res. Int. 2025, 203, 115807. [Google Scholar] [CrossRef] [PubMed]
- Tan, A.; Zhang, Z.; Zhao, Y.; Su, H.; Wang, H.; Zhao, R. Application of hyperspectral super-resolution reconstruction based on multi-scan clustering-guided Mamba for adulteration detection of whey protein powder. Eng. Appl. Artif. Intell. 2026, 177, 114923. [Google Scholar] [CrossRef]
- Zheng, L.; Bao, Q.; Weng, S.; Tao, J.; Zhang, D.; Huang, L.; Zhao, J. Determination of adulteration in wheat flour using multi-grained cascade forest-related models coupled with the fusion information of hyperspectral imaging. Spectrochim. Acta-A Mol. Biomol. Spectrosc. 2021, 270, 120813. [Google Scholar] [CrossRef] [PubMed]
- Khamsopha, D.; Woranitta, S.; Teerachaichayut, S. Utilizing near infrared hyperspectral imaging for quantitatively predicting adulteration in tapioca starch. Food Control. 2021, 123, 107781. [Google Scholar] [CrossRef]
- Hashemi-Nasab, F.S.; Talebian, S.; Parastar, H. Multiple adulterants detection in turmeric powder using Vis-SWNIR hyperspectral imaging followed by multivariate curve resolution and classification techniques. Microchem. J. 2022, 185, 108203. [Google Scholar] [CrossRef]
- Dehbasteh, M.; Tehrani, N.N.; Parastar, H. Multivariate curve resolution followed by partial least squares-discriminant analysis combined with Vis-NIR hyperspectral imaging for rice authentication. Food Res. Int. 2025, 221, 117266. [Google Scholar] [CrossRef] [PubMed]
- Amanah, H.Z.; Hernanda, R.A.P.; Lee, H.; Cho, B.; Masithoh, R.E.; Harmayani, E.; Rahayoe, S. Detection of adulteration in Amorphophallus muelleri blume flour using hyperspectral imaging: Toward a green analytical approach. Microchem. J. 2026, 225, 118231. [Google Scholar] [CrossRef]
- Malavi, D.; Raes, K.; Van Haute, S. Hyperspectral imaging, chemometrics, feature selection, and machine learning for rapid, non-destructive detection and quantification of Robusta adulteration in ground and instant Arabica coffee. Food Control. 2026, 183, 111955. [Google Scholar] [CrossRef]
- Liu, T.; Zhang, W.; Xu, H.; Yu, J.; Sang, T.; Wang, Y.; Wang, S. Non-destructive quantitative detection of lymphatic meat adulterated in beef by hyperspectral imaging combined with interpretable deep learning. Food Control. 2026, 181, 111742. [Google Scholar] [CrossRef]
- AOAC International. Official methods of analysis, 17th ed.; The Association of Official Analytical Chemists: Gaithersburg, MD, USA, 2000. [Google Scholar]
- Ndiaye, A.; Traore, A.; Gueye, P. S.; Senwo, Z.; Ndiaye, M.; Diop, A. Metal and Pesticide Assessments of Imported and Locally Cultivated Rice (Oryza sativa) in Senegal. Appl. Sci. 2024, 14(7), 2876. [Google Scholar] [CrossRef]
- Kaufman, R.; Wilson, J.; Bean, S.; Herald, T.; Shi, Y. Development of a 96-well plate iodine binding assay for amylose content determination. Carbohydr. Polym. 2015, 115, 444–447. [Google Scholar] [CrossRef] [PubMed]
- Isnaini, C.; Pathomrungsiyounggul, P.; Konsue, N. Effect of preparation method on chemical property of different Thai rice variety. J. Food Nutr. Res. 2019, 7(3), 231–236. [Google Scholar] [CrossRef]
- McKenzie, J. S.; Donarski, J. A.; Wilson, J. C.; Charlton, A. J. Analysis of complex mixtures using high-resolution nuclear magnetic resonance spectroscopy and chemometrics. Prog. Nucl. Magn. Reson. Spectrosc. 2011, 59(4), 336–359. [Google Scholar] [CrossRef] [PubMed]
- Barker, M.; Rayens, W. Partial least squares for discrimination. J. Chemom. 2003, 17(3), 166–173. [Google Scholar] [CrossRef]
- Wang, H.; Wang, K.; Zhu, X.; Zhang, P.; Yang, J.; Tan, M. Integration of partial least squares regression and hyperspectral data processing for the nondestructive detection of the scaling rate of carp (Cyprinus carpio). Foods 2020, 9, 500. [Google Scholar] [CrossRef] [PubMed]
- Vapnik, V. The nature of statistical learning theory, 2nd ed.; Springer, 2000. [Google Scholar]
- Sokolova, M.; Lapalme, G. A systematic analysis of performance measures for classification tasks. Inf. Process. Manag. 2009, 45(4), 427–437. [Google Scholar] [CrossRef]
- Workman, J.; Weyer, L. Practical Guide to Interpretive Near-Infrared Spectroscopy, 1st ed.; Taylor and Francis Group LLC: Boca Raton, FL, USA, 2008. [Google Scholar]
- Osborne, B.G.; Fearn, T. Near infrared spectroscopy in food analysis; Longman Scientific & Technical: New York, 1986; pp. 36–40. [Google Scholar]
- Sirisomboon, C.D.; Wongthip, P.; Sirisomboon, P. Potential of near infrared spectroscopy as a rapid method to detect aflatoxins in brown rice. J. Near Infrared Spectrosc. 2019, 27(3), 232–240. [Google Scholar] [CrossRef]
- Aenugu, H.P.R.; Kuma, D.S.; Srisudharson; Parthiban, N.; Ghosh, S.S.; Banji, D. Near Infrared Spectroscopy- An Overview. Int. J. Chemtech Res. 2011, 3(2), 825–836. [Google Scholar]
- Workhwa, S.; Jamjuree, J.; Opatworakitkun, C.; Rungsawang, C.; Sahachairungrueng, W.; Thompson, A.K.; Teerachaichayut, S. Identification of adulterated white pepper powder with roasted rice by using near-infrared hyperspectral imaging. Edelweiss Appl. Sci. Technol. 2026, 10(1), 1–15. [Google Scholar] [CrossRef]
Figure 1.
Schematic of the near-infrared hyperspectral imaging unit for evaluating rice samples.
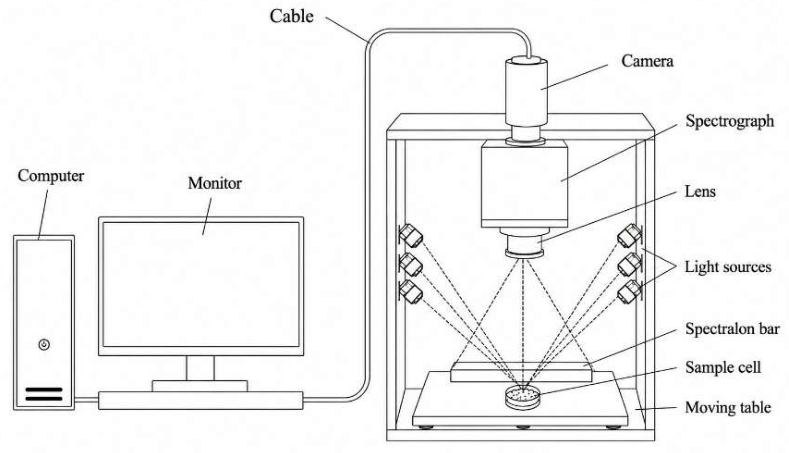
Figure 2.
Flow diagram for differentiating freshly milled and adulterated rice.
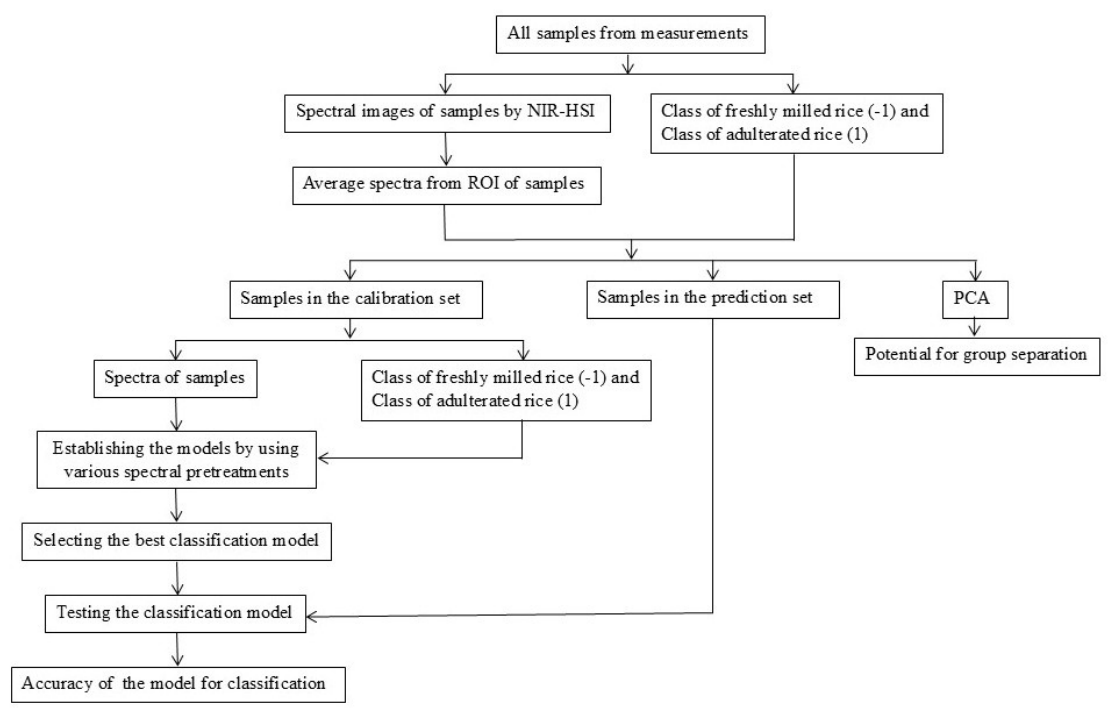
Figure 3.
Flow diagram of a calibration model for determining the percentage of old rice in adulterated samples.
Figure 3.
Flow diagram of a calibration model for determining the percentage of old rice in adulterated samples.
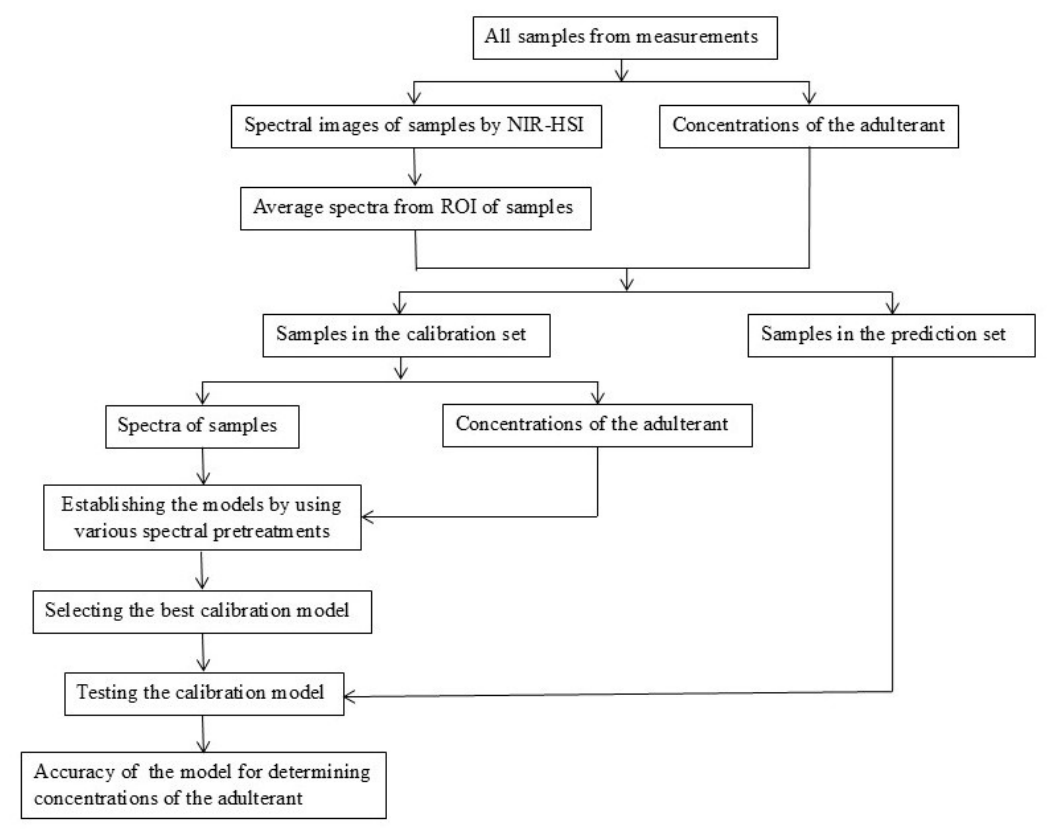
Figure 4.
The average absorbance spectra of freshly milled and old rice: (a) original absorbance spectra, and (b) 2nd derivative absorbance spectra.
Figure 4.
The average absorbance spectra of freshly milled and old rice: (a) original absorbance spectra, and (b) 2nd derivative absorbance spectra.
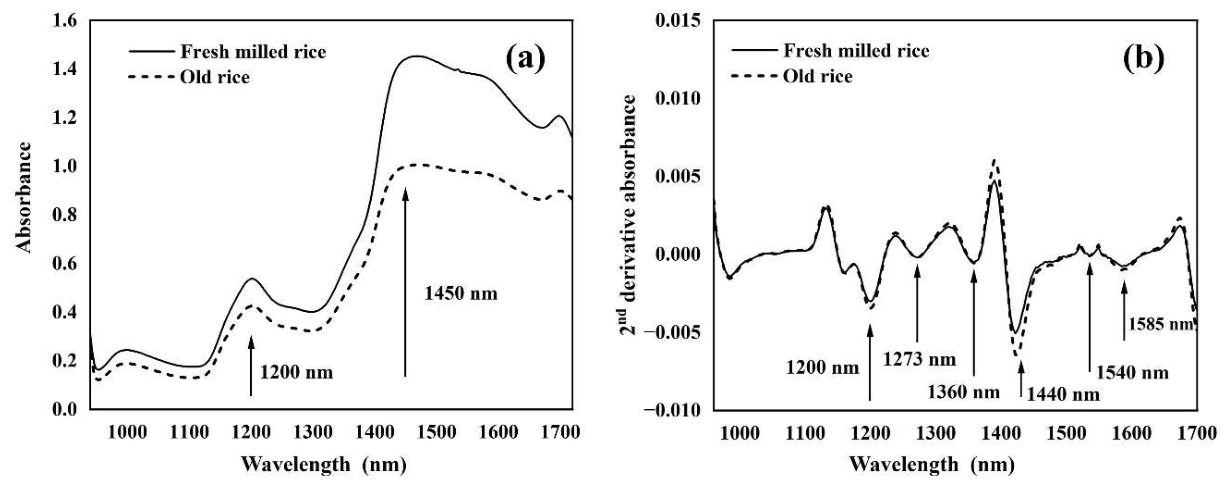
Figure 5.
Principal component analysis using the spectral data of freshly milled and adulterated rice.
Figure 5.
Principal component analysis using the spectral data of freshly milled and adulterated rice.
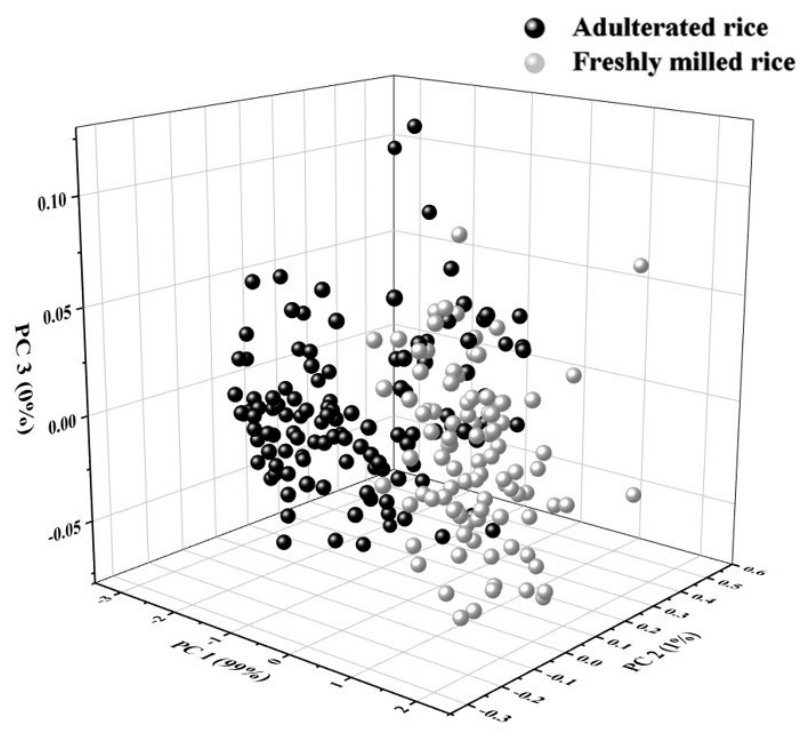
Figure 6.
Confusion matrices of classification using SVMC: Class -1 is freshly milled rice, Class 1 is adulterated rice in the calibration set (a), and the prediction set (b).
Figure 6.
Confusion matrices of classification using SVMC: Class -1 is freshly milled rice, Class 1 is adulterated rice in the calibration set (a), and the prediction set (b).
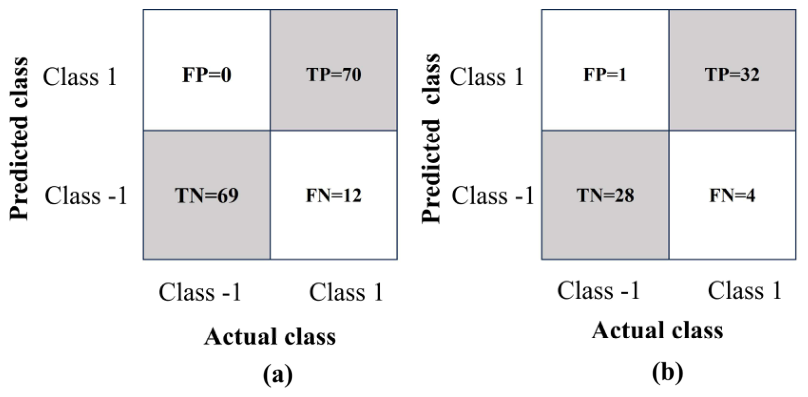
Figure 7.
Scatter plots of experimental versus predicted values of the percentage of old rice by the SVMR model in the calibration (a), and prediction (b) sets.
Figure 7.
Scatter plots of experimental versus predicted values of the percentage of old rice by the SVMR model in the calibration (a), and prediction (b) sets.
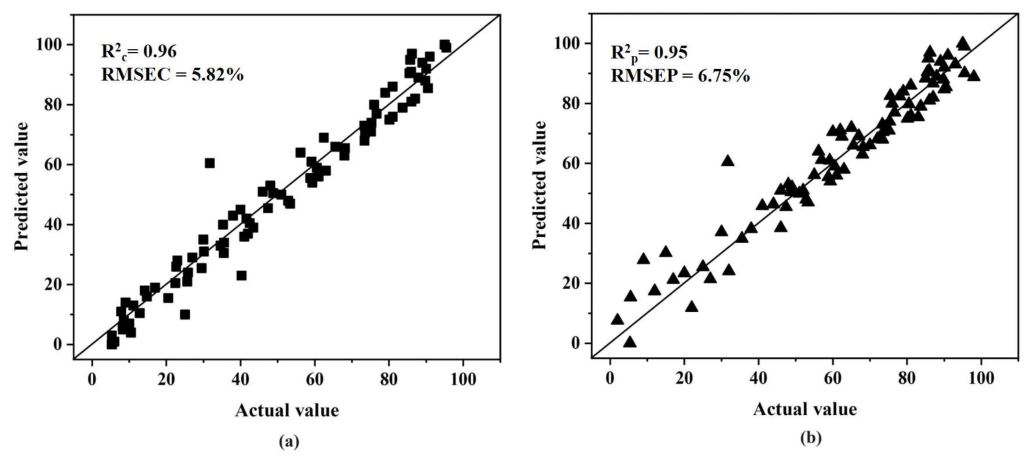

Table 1.
Properties of freshly milled and old rice samples.
| Parameter | Color | Moisture content (%) |
Water activity | Total starch content (%) |
Protein (%) |
Amylose content (%) |
||
| L* | a* | b* | ||||||
| Freshly milled rice |
74.04 ±0.5a |
1.03 ±0.65a |
21.47 ±0.23a |
11.43 ±0.42a |
0.36 ±0.23a |
16.37 ±0.45 a |
7.50 ±0.15b |
11.56 ±0.43a |
| Old rice | 71.47 ±0.53b |
6.29 ±0.82b |
26.84 ±1.46b |
10.35 ±0.23b |
0.33 ±0.00a |
15.57 ±0.49 a |
6.46 ±0.44a |
11.31 ±0.17a |
Values are presented as mean ± standard deviation. Different letters (a, b) in the same column of each parameter indicate significant differences (p ≤ 0.05).
Table 2.
Characteristics of samples based on dependent variables (-1 and 1) in the calibration and prediction sets for classification analysis using PLS-DA and SVMC.
Table 2.
Characteristics of samples based on dependent variables (-1 and 1) in the calibration and prediction sets for classification analysis using PLS-DA and SVMC.
| Set | Number of samples | Number of freshly milled rice (-1) | Number of adulterated rice (1) | Mean (%) |
Standard Deviation (%) |
|---|---|---|---|---|---|
| Calibration | 151 | 69 | 82 | 0.09 | 1.00 |
| Prediction | 65 | 29 | 36 | 0.11 | 1.00 |
Table 3.
Comparison of spectral pretreatments for classifying freshly milled and adulterated rice using a PLS-DA method.
Table 3.
Comparison of spectral pretreatments for classifying freshly milled and adulterated rice using a PLS-DA method.
| Pre- treatment |
Factors | PLS-DA 1 method | |||||||
|---|---|---|---|---|---|---|---|---|---|
| Freshly milled rice | Adulterated rice | Accuracy (%) |
Specificity (%) |
Sensitivity (%) |
Error rate (%) |
||||
| True (TN) 4 |
False (FP) 5 |
True (TP) 6 |
False (FN) 7 |
||||||
| Original | 4 | 65 | 4 | 73 | 9 | 91.39 | 94.20 | 89.02 | 8.61 |
| Smoothing | 4 | 67 | 2 | 71 | 11 | 91.39 | 97.10 | 86.59 | 8.61 |
| 1st derivative | 3 | 66 | 3 | 72 | 10 | 91.39 | 95.65 | 87.80 | 8.61 |
| 2nd derivative | 1 | 69 | 0 | 66 | 16 | 89.40 | 100.00 | 80.49 | 10.60 |
| MSC 2 | 4 | 67 | 2 | 72 | 10 | 92.05 | 97.10 | 87.80 | 7.95 |
| SNV 3 | 4 | 67 | 2 | 72 | 10 | 92.05 | 97.10 | 87.80 | 7.95 |
| 1st derivative + MSC |
3 | 67 | 2 | 71 | 11 | 91.39 | 97.10 | 86.59 | 8.61 |
| 1st derivative + SNV |
3 | 66 | 3 | 71 | 11 | 90.73 | 95.65 | 86.59 | 9.27 |
1 PLS-DA = partial least squares discrimination analysis. 2 MSC = multiplicative scatter correction. 3 SNV = standard normal variate. 4 TN = true negative. 5 FP = false positive. 6 TP = true positive. 7 FN = false negative.
Table 4.
Cross-validation for classifying freshly milled and adulterated rice using an SVMC method.
| Pre- treatment |
Optimization parameters | SVMC 1 method | ||||||||
|---|---|---|---|---|---|---|---|---|---|---|
| Freshly milled rice | Adulterated rice | Accuracy (%) |
Specificity (%) |
Sensitivity (%) |
Error rate (%) |
|||||
| Nu 4 | γ 5 | True (TN) 6 |
False (FP) 7 |
True (TP) 8 |
False (FN) 9 |
|||||
| Original | 0.5 | 10 | 69 | 0 | 65 | 13 | 91.16 | 100.00 | 83.33 | 8.61 |
| Smoothing | 0.5 | 1 | 69 | 0 | 65 | 17 | 88.74 | 100.00 | 79.27 | 11.26 |
| 1st derivative |
0.5 | 0.1 | 69 | 0 | 65 | 17 | 88.74 | 100.00 | 79.27 | 11.26 |
| 2nd derivative |
0.5 | 0.005 | 69 | 0 | 66 | 16 | 89.40 | 100.00 | 80.49 | 10.60 |
| MSC 2 | 0.5 | 0.005 | 69 | 0 | 64 | 19 | 87.50 | 100.00 | 71.11 | 12.50 |
| SNV 3 | 0.5 | 0.005 | 69 | 0 | 64 | 11 | 92.36 | 100.00 | 85.33 | 7.64 |
| 1st derivative + MSC |
0.5 | 0.005 | 68 | 0 | 63 | 18 | 87.92 | 100.00 | 77.78 | 12.08 |
|
1st derivative + SNV |
0.5 | 0.005 | 69 | 0 | 65 | 9 | 93.71 | 100.00 | 87.84 | 6.92 |
1 SVMC = support vector machine classification. 2 MSC = multiplicative scatter correction. 3 SNV = standard normal variate. 4 Nu = Nu parameter. 5 γ = kernel function parameter gamma. 6 TN = true negative. 7 FP = false positive. 8 TP = true positive. 9 FN = false negative.
Table 5.
Comparison of classification using PLS-DA and SVMC in the calibration and prediction sets.
| Method | Pre- treatment |
Factors/ Optimization parameters |
Data set | Freshly milled rice (-1) |
Adulterated rice (1) |
Accuracy (%) |
Specificity (%) |
Sensitivity (%) |
Error Rate (%) |
||
|---|---|---|---|---|---|---|---|---|---|---|---|
| True (TN) |
False (FP) |
True (TP) |
False (FN) |
||||||||
| PLS-DA 1 | MSC or SNV | F 3 = 4 | Cal Pred |
67 28 |
2 1 |
72 29 |
10 7 |
92.05 87.69 |
87.80 96.55 |
97.10 80.56 |
7.95 12.31 |
| SVMC 2 |
1st derivative + SNV |
Nu 4 = 0.5 γ5= 0.005 |
Cal Pred |
69 28 |
01 |
70 32 |
12 4 |
92.05 92.31 |
100 96.55 |
85.37 88.89 |
7.95 7.69 |
1 PLS-DA = partial least squares discrimination analysis. 2 SVMC = support vector machine classification. 3 F= factor. 4 Nu = Nu parameter. 5 γ = kernel function parameter gamma.
Table 6.
Characteristics of the dependent variables (the percentage of old rice) in the calibration and prediction sets.
Table 6.
Characteristics of the dependent variables (the percentage of old rice) in the calibration and prediction sets.
| Set | Number of Samples | Minimum (%) | Maximum (%) | Mean (%) | Standard Deviation (%) |
|---|---|---|---|---|---|
| Calibration | 85 | 0 | 100 | 49.58 | 30.02 |
| Prediction | 37 | 2 | 98 | 51.23 | 28.53 |
Table 7.
Cross-validation results for predicting the percentage of old rice using the PLSR model.
| Pretreatment | Factors | PLSR method | |
|---|---|---|---|
| R2cv 3 | RMSECV 4 (%) | ||
| Original | 1 | 0.90 | 9.66 |
| Smoothing | 1 | 0.90 | 9.63 |
| 1st derivative | 2 | 0.90 | 9.40 |
| 2nd derivative | 4 | 0.90 | 9.65 |
| MSC 1 | 1 | 0.90 | 9.83 |
| SNV 2 | 1 | 0.89 | 9.78 |
| 1st derivative+MSC | 1 | 0.89 | 9.86 |
| 1st derivative+SNV | 1 | 0.89 | 9.69 |
1 MSC = multiplicative scatter correction. 2 SNV = standard normal variate. 3 R2cv = coefficient of determination of cross-validation. 4 RMSECV = root mean square error of cross-validation.
Table 8.
Cross-validation results for predicting the percentage of old-rice contamination using the SVMR model.
Table 8.
Cross-validation results for predicting the percentage of old-rice contamination using the SVMR model.
| Pretreatment | Optimization parameters | NIR hyperspectral imaging | ||
|---|---|---|---|---|
| c 5 | γ 6 | R2cv 3 | RMSECV 4 (%) | |
| Original | 1 | 0.1 | 0.91 | 8.82 |
| Smoothing | 1 | 0.01 | 0.91 | 8.87 |
| 1st derivative | 1 | 0.01 | 0.92 | 8.44 |
| 2nd derivative | 100 | 0.01 | 0.90 | 9.51 |
| MSC 1 | 1 | 0.01 | 0.90 | 9.44 |
| SNV 2 | 1 | 0.01 | 0.90 | 9.43 |
| 1st derivative+MSC | 1 | 0.005 | 0.91 | 9.09 |
| 1st derivative+SNV | 1 | 0.005 | 0.919 | 9.07 |
1 MSC = multiplicative scatter correction. 2 SNV = standard normal variate. 3 R2cv = coefficient of determination of cross-validation. 4 RMSECV = root mean square error of cross-validation. 5 c = penalty factor. 6 γ = kernel function parameter gamma.
Table 9.
Performance of the PLSR and SVMC models in the calibration and prediction sets.
| Method | Pretreatment | Factors/ Optimization parameters | R2c 5 | R2p 7 | RMSEC 6 (%) |
RMSEP 8 (%) |
|---|---|---|---|---|---|---|
| PLSR 1 | 1st derivative | F = 2 | 0.91 | 0.93 | 8.76 | 7.55 |
| SVMR 2 | 1st derivative | C 3 = 1 γ 4 = 0.01 |
0.96 | 0.95 | 5.82 | 6.75 |
1 PLSR= partial least squares regression. 2 SVMR= support vector machine regression. 3 c = penalty factor. 4 γ = kernel function parameter gamma. 5 R2c = coefficient of determination of calibration. 6 RMSEC = root mean square error of calibration. 7 R2p = coefficient of determination of prediction. 8 RMSEP = root mean square error of prediction.
Disclaimer/Publisher’s Note: The statements, opinions and data contained in all publications are solely those of the individual author(s) and contributor(s) and not of MDPI and/or the editor(s). MDPI and/or the editor(s) disclaim responsibility for any injury to people or property resulting from any ideas, methods, instructions or products referred to in the content. |
© 2026 by the authors. Licensee MDPI, Basel, Switzerland. This article is an open access article distributed under the terms and conditions of the Creative Commons Attribution (CC BY) license (http://creativecommons.org/licenses/by/4.0/).
Copyright: This open access article is published under a Creative Commons CC BY 4.0 license, which permit the free download, distribution, and reuse, provided that the author and preprint are cited in any reuse.