
Submitted:
24 June 2026
Posted:
25 June 2026
You are already at the latest version
Abstract
Innovation systems are commonly analysed through indicators of investment, performance, output, and technological capacity. However, less attention has been paid to the composition of the research workforce as a structural dimension of system organisation. This article examines the relationship between innovation system capacity and workforce composition, focusing on the share of women among researchers as an empirically observable indicator of participation within national R&D systems.
The study develops a configurational systems perspective in which innovation systems are understood as multidimensional arrangements rather than linear rankings. System capacity is operationalised through a synthetic coordinate combining R&D intensity, innovation performance, and R&D expenditure per researcher, while workforce composition is treated as a separate analytical dimension. Using comparative cross-national data, the article combines correlation analysis, coordinate-based mapping, and quadrant-based interpretation to examine whether participation patterns are systematically related to the structural capacity of national innovation systems.
The findings indicate a recurrent inverse association between innovation system capacity and the relative share of women among researchers. Higher-capacity systems are more frequently positioned in configurations characterised by narrower participation, while broader participation is more often observed in lower- or intermediate-capacity systems. The results also suggest the presence of a transition zone at intermediate levels of system capacity, where participation patterns become more differentiated and system trajectories diverge.
The article does not interpret this relationship as a deterministic causal law. Rather, it identifies a recurrent structural regularity that deserves further theoretical and empirical investigation. The contribution of the study is threefold: first, it integrates workforce composition into the systems analysis of innovation; second, it shows how configurational methods can reveal structural relationships that remain obscured in composite rankings; and third, it highlights the need to assess innovation systems not only by their capacity and performance, but also by the participation structures through which knowledge production is organised.
Keywords:
innovation systems
; workforce composition
; R&D systems
; configurational analysis
; systems theory
; women researchers
; research workforce
; innovation capacity
; participation structures
; socio-technical systems
; Kauzon Quadrant Model
1. Introduction
Innovation systems are complex socio-technical systems composed of institutions, firms, universities, research organisations, policy frameworks, labour markets, and knowledge infrastructures. They are usually evaluated through indicators such as R&D intensity, innovation performance, patenting activity, technological outputs, and research expenditure. These measures are valuable for assessing system capacity and for comparing national innovation performance. However, they provide only a partial view of how innovation systems are organised.
One dimension remains insufficiently integrated into mainstream systems analysis: the composition of the research workforce. Innovation systems do not only generate knowledge, technologies, and economic outputs. They also organise participation. They structure who enters research activity, who remains within it, how research careers develop, and how opportunities are distributed across fields, sectors, and institutional settings. Workforce composition is therefore not external to innovation system development. It is part of the system’s internal organisation.
This article focuses on the share of women among researchers as one observable indicator of workforce composition. In policy and statistical reports, this indicator is usually treated as a descriptive or equality-related measure. It is used to assess gender balance, inclusion, or underrepresentation. While this interpretation is important, it is analytically incomplete. From a systems perspective, workforce composition may also reveal how participation is structured within national R&D systems. It may indicate the degree to which research activity is broadly distributed, concentrated, selective, or linked to particular sectoral and institutional arrangements.
The starting point of the article is an empirical pattern observed across national R&D systems: countries with higher levels of innovation system capacity often display lower relative shares of women among researchers. This pattern appears counterintuitive if innovation development is understood as a linear process in which modernisation, investment, technological advancement, and inclusion expand together. However, from a configurational systems perspective, this relationship may indicate a structural tension between system capacity and participation breadth.
The aim of the article is not to claim that higher innovation capacity directly causes lower participation of women in research. Such a causal interpretation would require longitudinal and sectorally disaggregated evidence beyond the scope of the present study. Instead, the article asks a more modest but theoretically significant question: can workforce composition be understood as a structural dimension of innovation systems, and is it systematically associated with the capacity configuration of those systems?
To address this question, the article develops a configurational analytical framework. Innovation system capacity is represented as a multidimensional coordinate combining R&D intensity, innovation performance, and R&D expenditure per researcher. Workforce composition is represented as a separate dimension, measured by the share of women among researchers. National systems are positioned within a coordinate space that allows the relationship between capacity and participation to be analysed without reducing either dimension to a single ranking.
This approach builds on a broader systems logic. Complex systems are not adequately understood by examining isolated indicators. Their properties emerge from the alignment, tension, and interaction between multiple dimensions. A country may perform strongly in R&D intensity and innovation output while displaying a narrower participation structure. Conversely, another country may have lower innovation capacity but broader workforce participation. Such configurations are analytically important because they show that innovation systems can be strong in one dimension and constrained in another.
The article contributes to innovation systems research in three ways. First, it integrates workforce composition into the structural analysis of innovation systems. Rather than treating the share of women among researchers only as an equality indicator, the article examines it as a system-level participation dimension.
Second, the article advances a configurational method for analysing the relationship between capacity and participation. By positioning national R&D systems within a coordinate-based space, it identifies patterns that may remain invisible in conventional composite rankings or linear benchmarking approaches.
Third, the article introduces the concept of a capacity–participation tension. This concept refers to the observation that higher innovation system capacity may be associated with more selective participation structures. The term does not imply a deterministic trade-off or an inevitable exclusionary mechanism. Rather, it describes a recurrent structural pattern that requires further explanation.
The article is structured as follows. Section 2 reviews the literature on innovation systems, workforce composition, gender participation in science, and configurational approaches. Section 3 develops the theoretical framework, focusing on workforce composition as a system dimension and on the concept of capacity–participation tension. Section 4 presents the methodology, including data, indicators, coordinate construction, quadrant interpretation, and robustness strategy. Section 5 presents the empirical results. Section 6 discusses the implications for systems theory, innovation policy, and the analysis of inclusive knowledge production. Section 7 concludes by outlining the contribution, limitations, and directions for future research.
2. Literature Review
2.1. Recent Evidence on Workforce Composition in Research and Innovation Systems
Recent research and policy evidence shows that participation in research and innovation remains uneven across countries, sectors, disciplines, and career stages. The European Commission’s She Figures 2024 report demonstrates that gender equality in research and innovation cannot be assessed only through access to higher education or entry into research employment. It must be examined across the full research trajectory, including doctoral training, employment conditions, career progression, leadership, decision-making, research outputs, and innovation activity [1]. This perspective is important for innovation systems analysis because it shows that participation is not a single descriptive variable, but a system-wide process shaped by institutional pathways, sectoral structures, and career progression mechanisms.
Recent global evidence leads to similar conclusions. Elsevier’s 2024 review of gender equality in research and innovation shows that women’s participation varies substantially across disciplines, seniority levels, publication output, grant activity, patenting, and policy visibility [2]. Large-scale bibliometric research also demonstrates that gender disparities in science differ by country, field, age cohort, and career stage [3,4].. These findings indicate that aggregate national indicators may conceal considerable internal variation. A national research system may appear relatively balanced at the aggregate level while remaining highly selective in particular sectors, disciplines, or senior career positions.
This evidence supports the argument that workforce composition should be analysed as a structural dimension of research and innovation systems. The share of women among researchers is not a complete measure of equality, inclusion, or diversity. It does not capture seniority, contract type, field of science, leadership, research funding, publication impact, or patenting activity. However, it is an internationally comparable indicator that can reveal how participation in knowledge production is organised within national R&D systems. For this reason, the present article treats the share of women among researchers not only as an equality indicator, but also as an observable measure of participation structure.
Recent evidence also suggests that gendered participation patterns are closely connected to technological specialisation and labour-market demand. The OECD Digital Economy Outlook 2024 shows that women remain underrepresented in ICT, artificial intelligence, digital entrepreneurship, and ICT-related innovation activities [5]. WIPO’s report on the global gender gap in innovation and creativity similarly shows that women’s participation in international patenting remains limited and varies strongly across technological fields and industrial sectors [6]. Women are more represented in areas such as biotechnology, food chemistry, and pharmaceuticals, but less represented in mechanical engineering and several technology-intensive domains. These patterns are directly relevant for the present article because high-capacity innovation systems are often oriented toward technologically intensive sectors where participation structures may be narrower and more selective.
Studies on diversity and innovation also show that representation alone is insufficient. Gender diversity contributes to knowledge production and innovation only when it is supported by inclusive organisational structures, access to resources, and meaningful participation in decision-making [7]. This is consistent with broader research showing that gender inequalities in science persist through publication patterns, authorship, recognition, funding, career progression, and institutional evaluation practices [3,8,9,10,11]. Therefore, the composition of the research workforce should not be treated as external to innovation system performance. It is part of the way innovation systems organise knowledge production.
The present article builds on this recent evidence by shifting the analytical focus from individual careers and organisational barriers to the structural configuration of national innovation systems. Much of the gender equality literature explains how inequalities emerge within scientific careers, institutions, and disciplines. This article asks a complementary systems-level question: whether women’s participation among researchers is systematically associated with the capacity configuration of national R&D systems. In this sense, workforce composition becomes analytically relevant not only for equality policy, but also for innovation systems analysis.
2.2. Innovation Capacity, System Structure, and Structural Selectivity
Innovation systems research provides the theoretical foundation for analysing the relationship between capacity and participation. Classical innovation systems theory rejected linear models of innovation and conceptualised innovation as an interactive, institutionally embedded, and structurally conditioned process. National innovation systems are shaped by relationships among firms, universities, public research organisations, labour markets, financial institutions, policy frameworks, and knowledge infrastructures [12,13,14,15]. This tradition remains important because it shows that innovation capacity depends not only on R&D expenditure or technological output, but also on the organisation of institutions, knowledge flows, learning processes, and system interactions.
At the same time, contemporary innovation policy analysis increasingly shows that innovation systems cannot be adequately understood through aggregate performance indicators alone. Countries are frequently compared through R&D intensity, patenting activity, high-technology exports, scientific output, innovation performance, and composite innovation indices [16,17]. Such indicators are useful for benchmarking and policy evaluation, but they may conceal internal asymmetries. Two countries may obtain similar innovation scores while differing substantially in sectoral structure, resource intensity, labour-market organisation, institutional coordination, and workforce composition. This problem has long been discussed in the literature on composite indicators, which shows that aggregation can obscure tensions between dimensions and mask different development pathways [18,19,20,21].
A systems-oriented approach therefore requires attention not only to how much capacity a system has, but also to how that capacity is organised. R&D intensity, innovation performance, and R&D expenditure per researcher capture important dimensions of system capacity, but they do not reveal who participates in the production of knowledge or how participation is distributed across the research workforce. Human capital has long been recognised as a key element of innovation capacity and absorptive capacity [22,23,24]. Yet researchers are often treated as a quantitative input into innovation processes, while the internal composition of the research workforce remains insufficiently theorised as a system-level dimension.
This is a significant limitation. Innovation systems do not simply use researchers as resources; they structure who becomes a researcher, which career pathways are supported, which sectors demand particular competences, and which forms of participation are rewarded. Workforce composition therefore reveals something about the internal architecture of national R&D systems. From this perspective, the share of women among researchers can be interpreted as one indicator of how open, selective, concentrated, or differentiated participation is within a given innovation system.
The relationship between innovation capacity and workforce composition may be especially important in advanced innovation systems. Knowledge economies are characterised by increasing technological complexity, stronger specialisation, higher demand for advanced skills, and greater concentration of research resources [25,26]. Sectoral systems of innovation research shows that technological development is unevenly distributed across industries and that different sectors generate different knowledge bases, skill requirements, and career structures [27,28]. Political economy approaches similarly show that national systems differ in skill formation, labour-market coordination, institutional complementarities, and sectoral specialisation [29,30]. These insights suggest that higher innovation capacity may be associated with more selective participation structures. Selectivity does not necessarily mean direct exclusion. It may emerge through the internal organisation of advanced R&D systems: technological specialisation, competitive funding structures, resource concentration, mobility expectations, narrow definitions of excellence, and career models based on continuous productivity. These mechanisms can influence workforce composition even when formal equality rules and inclusion policies are present.
Gender inequality research helps explain how such selectivity may operate. Earlier concepts such as the Matilda effect, cumulative disadvantage, and the leaky pipeline remain useful because they show how recognition, evaluation, career filtering, and institutional expectations can reproduce inequality over time [31,32,33]. More recent studies extend this perspective by showing that gender disparities persist across scientific productivity, seniority, funding, authorship, disciplinary fields, and international career trajectories [3,4,10,34,35]. The present article does not replace these explanations. Instead, it integrates them into a systems-level perspective by examining whether women’s participation among researchers is related to the broader capacity configuration of national innovation systems.
The concept of structural selectivity is useful in this context. It refers to participation being filtered not only through explicit exclusion, but also through system-level conditions such as sectoral demand, technical specialisation, funding competition, institutional prestige, mobility expectations, and evaluation regimes. In high-capacity innovation systems, these conditions may produce strong innovation outputs while simultaneously narrowing participation in the research workforce. This possibility makes workforce composition relevant for innovation systems analysis.
2.3. Configurational Systems Analysis and the Research Gap
Configurational approaches provide a methodological basis for analysing the relationship between innovation capacity and workforce composition. Instead of treating variables as isolated predictors or reducing countries to a single ranking, configurational analysis examines how outcomes emerge from combinations of interdependent conditions [36,37]. This logic is especially relevant for innovation systems, where capacity, institutions, resources, sectors, labour markets, and participation structures interact.
In innovation studies, configurational thinking is useful because systems may reach similar performance levels through different combinations of conditions. Some countries may combine high R&D intensity with strong innovation performance and broad participation. Others may combine high capacity with narrow participation, or lower capacity with broader participation. These configurations cannot be fully captured by conventional rankings or composite indicators. A ranking may show which systems perform better or worse, but it does not show how capacity and participation are aligned within each system.
The present article follows this configurational logic by positioning national R&D systems within a coordinate-based analytical space. Innovation system capacity is represented as a multidimensional coordinate combining R&D intensity, innovation performance, and R&D expenditure per researcher. Workforce composition is represented separately through the share of women among researchers. This separation is methodologically important. If women’s participation were included as one more component of a composite innovation index, the relationship between capacity and participation would be hidden. By treating workforce composition as an independent system dimension, the analysis can examine whether participation varies systematically with innovation capacity.
The Kauzon Quadrant Model provides the analytical framework for this interpretation. It allows systems to be positioned relative to a benchmark and interpreted through quadrant-based configurations. These configurations distinguish between systems that combine higher capacity with broader participation, higher capacity with narrower participation, lower capacity with broader participation, and lower capacity with narrower participation. The quadrants are not treated as fixed developmental stages. Rather, they represent alternative system states that reveal how capacity and participation are structurally aligned. The model is grounded in Kauzonė’s broader configurational systems framework, where complex systems are analysed through the structural alignment of multidimensional coordinates rather than through scalar aggregation [38,39]. This framework is particularly relevant for the present study because it allows innovation system capacity and workforce composition to be analysed as distinct but structurally related dimensions.
This approach responds to a clear gap in the literature. Recent reports and empirical studies document persistent gender gaps in research and innovation, especially across disciplines, sectors, career stages, digital technologies, patenting, and research leadership [1,2,3,4,5,6]. Innovation systems research provides strong tools for analysing capacity, performance, institutions, and knowledge flows [12,13,14,15,40]. Gender inequality research explains individual, organisational, and disciplinary mechanisms of exclusion and unequal progression [10,31,32,33]. However, these literatures are rarely integrated into a systems-level analysis of workforce composition as part of innovation system structure.
This article addresses that gap by treating the share of women among researchers as an observable indicator of participation structure within national R&D systems. The contribution is threefold. First, it extends innovation systems analysis by integrating workforce composition into the study of system structure. Second, it contributes methodologically by applying coordinate-based configurational mapping to the relationship between capacity and participation. Third, it introduces the concept of capacity–participation tension, understood as a recurrent structural pattern in which higher innovation system capacity may be associated with more selective participation structures.
The article does not claim that higher innovation capacity directly causes lower participation of women in research. Such a causal claim would require longitudinal and sectorally disaggregated evidence. Instead, the article examines whether a recurrent structural association can be observed and interpreted configurationally. This framing is consistent with a systems perspective: the aim is not only to estimate isolated effects, but to understand how multiple dimensions of innovation systems are organised together.
3. Theoretical Framework
3.1. Workforce Composition as A System Dimension
The central theoretical assumption of this article is that workforce composition can be analysed as a structural dimension of innovation systems. In conventional innovation studies, researchers are often treated as part of the human capital base of the system. However, the internal composition of this human capital base is less frequently incorporated into systems-level analysis. This limits the ability to understand how innovation systems organise participation.
From a systems perspective, workforce composition is not merely a demographic characteristic. It reflects how research activity is distributed, how opportunities are structured, and how labour-market demand interacts with institutional arrangements. The share of women among researchers is one observable indicator of this composition. Although it does not capture all dimensions of participation, it provides a comparable measure that allows national R&D systems to be analysed in relation to their participation structures.
This article therefore treats workforce composition as analytically distinct from innovation capacity. It is not included as one more component of a composite innovation index. Instead, it is positioned as a separate system dimension. This separation is important because it allows the relationship between capacity and participation to be examined directly. A system may have high R&D capacity but narrow participation, or lower capacity but broader participation. These configurations are theoretically meaningful because they reveal different ways in which innovation systems are organised.
The aim is not to reduce gender inequality to a systems variable. Rather, the article uses the share of women among researchers as an entry point for analysing how participation is structured within national R&D systems. Gender remains socially and institutionally meaningful, but in this study it is examined at the systems level as part of workforce composition. This approach complements, rather than replaces, institutional and feminist explanations of inequality in science.
3.2. Capacity as A Multidimensional Property of Innovation Systems
Innovation system capacity is also treated as a multidimensional property. It cannot be adequately captured by a single indicator such as R&D intensity. While R&D intensity is important, system capacity also depends on innovation performance, resource intensity, expenditure per researcher, absorptive structures, and the institutional organisation of knowledge production.
The present framework operationalises system capacity through three indicators: R&D intensity, innovation performance, and R&D expenditure per researcher. These indicators capture different but related dimensions of capacity. R&D intensity reflects the scale of investment relative to the economy. Innovation performance reflects the broader effectiveness of the system in generating innovation outcomes. R&D expenditure per researcher reflects the resource environment in which research work is performed.
Taken together, these indicators provide a synthetic view of system capacity. However, the purpose is not to produce a universal ranking of national innovation systems. Rather, the capacity coordinate is used to position systems relative to a common benchmark and to analyse their relationship with workforce composition. This is consistent with a configurational systems approach, where the interest lies in system alignment and structural positioning rather than in ranking alone.
3.3. Capacity–Participation Tension
The article introduces the concept of capacity–participation tension to describe the observed association between innovation system capacity and workforce composition. The term refers to a recurrent pattern in which higher-capacity innovation systems are more often associated with narrower participation structures, while broader participation is more frequently observed in lower- or intermediate-capacity systems.
The concept of tension is intentionally more cautious than the concept of trade-off. A trade-off may imply that capacity and participation are necessarily in conflict. The evidence presented here does not support such a deterministic interpretation. Some systems may combine relatively high capacity with broader participation. However, the recurrence of high-capacity and narrower-participation configurations suggests that capacity-building and participation breadth do not automatically increase together.
The capacity–participation tension can be understood as a systems-level relationship. As innovation systems become more intensive, they may also become more specialised, competitive, and resource-concentrated. These conditions can shape who participates in research activity and under what conditions. Participation may become filtered through more demanding competence requirements, continuous career expectations, sectoral concentration, and competitive funding structures.
This does not mean that higher capacity directly causes lower participation. Rather, it means that high-capacity systems may be organised in ways that are associated with greater selectivity. The concept of capacity–participation tension therefore identifies a structural pattern that requires further empirical and theoretical investigation.
3.4. Structural Selectivity in Research Systems
Structural selectivity refers to the organisation of participation through system-level conditions rather than through explicit exclusion alone. In advanced innovation systems, research careers are often shaped by intense competition, high specialisation, performance measurement, mobility expectations, and concentrated access to resources. These conditions can influence participation even when formal equality rules are present.
Selectivity is not necessarily intentional. It may emerge from the internal logic of the system. For example, when R&D activity becomes concentrated in technologically intensive sectors, participation may depend on specific educational pathways, professional networks, institutional locations, and career patterns. When evaluation systems reward continuous productivity and international mobility, researchers with interrupted or non-linear career trajectories may face disadvantages. When resources are concentrated in highly competitive environments, small differences in access and recognition may accumulate over time.
The concept of structural selectivity therefore connects systems analysis with existing research on inequality in scientific careers. Bias, discrimination, cumulative disadvantage, and recognition asymmetry remain important. However, the systems perspective suggests that these mechanisms operate within broader configurations of capacity, sectoral demand, and institutional organisation. Workforce composition becomes one observable expression of these configurations.
3.5. Transition Zones and Configurational Change
The article also uses the concept of a transition zone to interpret the relationship between capacity and participation. The available evidence suggests that participation patterns do not change uniformly across all levels of system capacity. Instead, systems may pass through intermediate configurations where participation becomes more differentiated and trajectories begin to diverge.
A transition zone should not be understood as a precisely estimated universal breakpoint. It is not treated here as a mathematically fixed threshold. Rather, it is an empirically observed interval within the configurational space where the relationship between capacity and participation appears to change. In this interval, some systems maintain broader participation, while others move toward more selective participation structures.
This interpretation is consistent with systems theory, where qualitative changes may occur through shifts in configuration rather than through linear movement along a single scale. Innovation systems may not develop by improving all dimensions simultaneously. They may instead reorganise internally, producing new alignments between capacity, performance, resources, and participation. The transition zone captures this possibility.
In the present study, the transition zone is used as a heuristic concept. It helps interpret the distribution of systems within the coordinate space, but it does not imply deterministic prediction. Further longitudinal and sectorally disaggregated analysis would be needed to test whether systems move through such zones over time.
3.6. Research Propositions
The theoretical framework leads to four research propositions.
Proposition 1.
Workforce composition can be analysed as a structural dimension of innovation systems, rather than only as a descriptive equality indicator.
Proposition 2.
Innovation system capacity is multidimensional and should be analysed through the alignment of investment intensity, innovation performance, and resource intensity.
Proposition 3.
Higher-capacity innovation systems are expected to be more frequently associated with narrower participation structures, indicating a capacity–participation tension.
Proposition 4.
The relationship between capacity and participation may involve a transition zone at intermediate levels of system capacity, where participation patterns become more differentiated and system configurations diverge.
These propositions guide the empirical analysis. The study does not aim to establish causal effects. Instead, it examines whether a recurrent structural regularity can be observed across national R&D systems and whether configurational mapping provides a useful method for identifying it.
4. Methodology
4.1. Research Design
This study applies a comparative configurational research design to examine the relationship between innovation system capacity and workforce composition. The purpose of the analysis is not to estimate direct causal effects, but to identify whether a recurrent structural association can be observed across national R&D systems.
The methodological approach is based on a systems logic. National innovation systems are treated as multidimensional configurations composed of interrelated dimensions. Instead of reducing systems to a single ranking, the analysis positions each country within a coordinate space defined by capacity and participation. This allows the internal alignment between these dimensions to be examined.
The analysis proceeds in four stages. First, descriptive comparison is used to examine the distribution of countries across core indicators. Second, correlation analysis is used to assess the direction and strength of association between R&D intensity and the share of women among researchers. Third, a multidimensional capacity coordinate is constructed by combining R&D intensity, innovation performance, and R&D expenditure per researcher. Fourth, national systems are mapped within a coordinate-based quadrant structure in order to identify recurrent configurations and possible transition zones.
This design is appropriate for the aims of the study because the research question concerns structural positioning rather than causal estimation. The article asks whether workforce composition varies systematically with innovation system capacity and whether this relationship can be interpreted as a systems-level configuration.
4.2. Data and Country Sample
The empirical analysis is based on harmonised international indicators describing national research and development systems. The dataset includes European countries and selected non-European innovation systems for which comparable data are available. The European subset is analytically important because it provides a relatively coherent institutional and statistical context. Selected non-European systems are included to examine whether the observed pattern extends beyond Europe.
The main country-level indicators are:
- R&D intensity, measured as gross domestic expenditure on R&D as a percentage of GDP;
- innovation performance, measured using the Summary Innovation Index or comparable innovation performance data;
- R&D expenditure per researcher;
- workforce composition, measured as the percentage share of women among researchers.
These indicators were selected because they represent complementary dimensions of national R&D systems. R&D intensity captures the scale of research investment relative to the economy. Innovation performance reflects the broader output and effectiveness of the innovation system. R&D expenditure per researcher captures resource intensity within research activity. The share of women among researchers captures workforce composition and participation structure.
The analysis uses the EU-27 average as the primary reference benchmark. This benchmark is appropriate because the empirical core of the analysis consists of European innovation systems and because EU-level innovation statistics provide a widely used comparative reference. The EU-27 benchmark also allows countries to be positioned relative to a common institutional and statistical baseline. For non-European systems, the benchmark is used not to imply institutional equivalence, but to enable positional comparison within the same analytical space.
4.3. Construction of the Capacity Coordinate
Innovation system capacity is operationalised as a synthetic coordinate, denoted as (X). The coordinate combines three dimensions: R&D intensity, innovation performance, and R&D expenditure per researcher. Each component is expressed as a relative deviation from the reference benchmark.
The capacity coordinate for country (A) is defined as:
where:
RA denotes the R&D intensity of country A (GERD as a percentage of GDP);
IA denotes the innovation performance level of country A;
CA denotes R&D expenditure per researcher in country A;
Rref, Iref, Cref denote the corresponding reference benchmark values;
w1, w2, w3 are weighting coefficients satisfying the condition w1+w2+w3=1, with equal weights (w1=w2=w3=1/3) applied in the baseline specification.
Equal weighting is used as a transparent baseline strategy. The aim of the article is not to produce an optimised performance index, but to construct a positional coordinate that captures three complementary aspects of system capacity. Equal weights reduce the risk of overfitting and avoid imposing a strong normative hierarchy among the components. Alternative weighting schemes may be explored in future research as part of sensitivity analysis.
A positive value of (X) indicates that a country is positioned above the reference benchmark in terms of multidimensional innovation system capacity. A negative value indicates that it is positioned below the benchmark.
4.4. Construction of the Workforce Composition Coordinate
Workforce composition is operationalised as the share of women among researchers. This dimension is denoted as (Y). In the coordinate-based model, the indicator is expressed as a relative deviation from the reference benchmark:
where:
FA denotes the share of women among researchers in country A;
Fref denotes the corresponding reference benchmark value.
A positive value of (Y) indicates that a country has a higher share of women among researchers than the reference benchmark. A negative value indicates a lower share.
The relative coordinate is used for configurational mapping because it allows systems to be compared within a common analytical space. However, the analysis also reports absolute participation levels in percentage terms. This is important because relative positioning is useful for systems comparison, while absolute percentages provide substantive interpretation of participation.
4.5. Coordinate-Based Configurational Mapping
The study uses a coordinate-based analytical framework to position each national R&D system within a two-dimensional space. The horizontal axis represents innovation system capacity (X), while the vertical axis represents workforce composition (Y).
The intersection of the reference axes creates four quadrants:
Quadrant I: higher capacity and broader participation.
This quadrant includes systems that are positioned above the reference benchmark on both capacity and workforce composition.
Quadrant II: higher capacity and narrower participation.
This quadrant includes systems with above-benchmark capacity but below-benchmark participation. This quadrant is particularly important for identifying configurations in which high R&D capacity coexists with narrower workforce composition.
Quadrant III: lower capacity and narrower participation.
This quadrant includes systems that are below the benchmark on both dimensions.
Quadrant IV: lower capacity and broader participation.
This quadrant includes systems with below-benchmark capacity but above-benchmark participation.
The quadrant structure is not interpreted as a developmental hierarchy. Countries are not assumed to move linearly from one quadrant to another. Instead, the quadrants represent alternative configurations of capacity and participation. This is consistent with systems theory, where different combinations of dimensions may produce distinct system states.
4.6. Correlation and Association Analysis
Before applying the multidimensional coordinate model, the study examines the bivariate relationship between R&D intensity and the share of women among researchers. This step is included for transparency and validation. R&D intensity is a widely used and easily interpretable indicator of system capacity. If the relationship between capacity and participation is visible even at this basic level, this provides an initial check on the broader configurational interpretation.
Correlation analysis is conducted for the broader country sample and for the European subset. The European subset serves as a partial comparability check, because European countries share more similar statistical frameworks and policy environments than the full sample.
The correlation results are interpreted cautiously. They are used to identify association, not causation. The analysis does not claim that R&D intensity directly determines workforce composition. Rather, the correlation analysis provides an initial empirical indication of whether capacity-related indicators are systematically associated with participation.
4.7. Identification of the Transition Zone
The article uses the concept of a transition zone to interpret changes in the relationship between capacity and participation across the coordinate space. The transition zone is not treated as a precisely estimated universal threshold. Instead, it is understood as an empirically observed interval where system configurations become more differentiated.
In practical terms, the transition zone is identified by examining the distribution of countries along the capacity coordinate (X). The analysis focuses on the range where systems begin to diverge between broader and narrower participation configurations. This interval is interpreted as a zone of configurational differentiation rather than as a causal breakpoint.
This distinction is important. A causal threshold would require longitudinal evidence and formal breakpoint estimation. The present study does not make that claim. Instead, it uses the transition zone as a heuristic systems concept that helps describe how participation patterns vary across levels of system capacity.
4.8. Robustness and Validation Strategy
Because the analysis uses a constructed coordinate and a configurational framework, robustness and validation are important. The study addresses this issue through several analytical checks.
First, the relationship between capacity and participation is examined using a simple and established indicator: R&D intensity. This provides a transparent baseline before introducing the multidimensional capacity coordinate.
Second, the analysis is repeated for the European subset. This helps assess whether the observed association is driven primarily by the inclusion of non-European high-capacity systems or whether it is also present within a more comparable regional context.
Third, the multidimensional capacity coordinate is constructed from indicators that are widely used in innovation studies and policy analysis: R&D intensity, innovation performance, and R&D expenditure per researcher. The coordinate therefore builds on established measures rather than replacing them with unrelated variables.
Fourth, the results are interpreted configurationally rather than causally. The study does not infer direct causal effects from cross-sectional data. This reduces the risk of overinterpreting the model.
Fifth, the transition zone is presented as an empirically observed pattern within the coordinate space, not as a statistically definitive breakpoint. This makes the interpretation more consistent with the available evidence.
Sixth, the article treats the findings as exploratory and theory-generating. The observed structural regularity should be tested in future research using longitudinal data, sectoral disaggregation, alternative weighting schemes, and formal robustness checks.
4.9. Methodological Limitations
Several limitations must be acknowledged. First, the analysis is based on cross-national secondary data. Such data are useful for identifying broad structural patterns, but they cannot capture all institutional, cultural, sectoral, or organisational mechanisms shaping workforce composition.
Second, the share of women among researchers is an aggregate national indicator. It does not distinguish between sectors, disciplines, seniority levels, contract types, or leadership roles. Future research should disaggregate workforce composition by sector and field, especially distinguishing between higher education, government research, and business enterprise R&D.
Third, the capacity coordinate depends on selected indicators and equal weighting. Although the indicators are conceptually justified and widely used, alternative operationalisations may produce different positional results. Future studies should test the stability of the findings using alternative weighting procedures.
Fourth, the analysis is cross-sectional. It identifies structural association but does not demonstrate temporal causality. Longitudinal research is needed to examine whether systems move through transition zones over time.
Fifth, the benchmark-based coordinate system depends on the selected reference point. The EU-27 average is appropriate for the present comparative purpose, but future research could test alternative benchmarks, such as OECD averages or global sample means.
Despite these limitations, the methodology provides a transparent framework for analysing workforce composition as a system dimension. It allows the relationship between capacity and participation to be examined without reducing innovation systems to linear rankings and without treating participation as external to system structure.
5. Results
5.1. Descriptive Positioning of National R&d Systems
The empirical analysis begins with the descriptive positioning of national R&D systems across the selected indicators: R&D intensity, innovation performance, R&D expenditure per researcher, and the share of women among researchers. These indicators provide the basis for constructing the capacity and workforce composition coordinates.
Table 1 presents the core country-level indicators and the derived coordinate values. The table shows substantial variation across national systems. Some countries are positioned above the reference benchmark in terms of R&D intensity, innovation performance, and expenditure per researcher, while others remain below the benchmark on one or more of these dimensions. Workforce composition also varies considerably, with the share of women among researchers ranging from relatively low levels in some high-capacity systems to substantially higher levels in several lower- or intermediate-capacity systems.
The descriptive distribution provides the first indication that innovation system capacity and participation breadth do not necessarily increase together. Several high-capacity systems, including technologically intensive and resource-rich R&D systems, are associated with below-benchmark shares of women among researchers. Conversely, several systems with lower capacity coordinates display above-benchmark participation.
This pattern should not be interpreted as a simple opposition between advanced and less advanced systems. Rather, it suggests that innovation systems differ in how capacity and participation are aligned. Some systems combine higher capacity with relatively broader participation, while others combine higher capacity with narrower participation. These differences indicate the need for configurational analysis rather than a purely ranking-based interpretation.
5.2. R&d Intensity and Workforce Composition
The first empirical test examines the bivariate relationship between R&D intensity and the share of women among researchers. R&D intensity is used at this stage because it is one of the most widely recognised indicators of innovation system capacity and provides a transparent baseline for comparison.
Figure 1 presents the relationship between R&D intensity and the percentage share of women among researchers for the broader country sample.
The scatterplot shows a negative association between R&D intensity and women’s participation among researchers. Countries with higher R&D intensity tend to display lower shares of women in the research workforce, while countries with lower R&D intensity more often display higher participation levels. The estimated correlation is negative and substantively meaningful, indicating that the association is not random.
This result is important because it shows that the relationship between capacity and participation is visible even before applying the multidimensional coordinate model. The pattern is not produced solely by the constructed capacity coordinate. It is already observable using a standard and widely used innovation indicator.
However, the result should be interpreted cautiously. The correlation does not imply that higher R&D intensity directly causes lower women’s participation. It indicates an association that requires structural interpretation. From a systems perspective, higher R&D intensity may be linked to sectoral concentration, resource intensity, competition, and specialised labour-market demand. These system characteristics may be associated with narrower participation structures.
5.3. European Subset as A Comparability Check
To assess whether the observed association is driven primarily by the inclusion of selected non-European systems, the analysis is repeated for the European subset. This subset provides a more comparable institutional and statistical context because European countries share common data frameworks and overlapping innovation policy environments.
Figure 2 presents the correlation between R&D intensity and the share of women among researchers for European countries.
The negative association remains visible within the European subset, although the strength of the relationship is weaker than in the broader sample. This finding is important for validation. It suggests that the observed capacity–participation association is not only an artefact of including highly intensive non-European systems. A similar pattern can also be observed within a more regionally comparable group of countries.
The persistence of the association within Europe supports the interpretation that workforce composition is related to system structure rather than only to national cultural variation. At the same time, the weaker association indicates that institutional and regional factors matter. European systems display greater variation around the trend line, suggesting that policy, labour-market institutions, sectoral composition, and public research structures may moderate the relationship between capacity and participation.
5.4. Multidimensional Capacity and Workforce Composition
The next stage examines whether the relationship remains visible when innovation system capacity is represented as a multidimensional coordinate rather than through R&D intensity alone. The capacity coordinate combines R&D intensity, innovation performance, and R&D expenditure per researcher. Workforce composition is represented separately through the relative share of women among researchers.
The results show that higher values of the capacity coordinate are more frequently associated with lower values of the workforce composition coordinate. In other words, systems positioned above the reference benchmark in terms of multidimensional capacity are more often positioned below the reference benchmark in terms of women’s participation.
This finding strengthens the systems interpretation of the relationship. The association is not limited to one input indicator. It also appears when capacity is represented as a broader structural property combining investment intensity, performance, and resource conditions. This suggests that workforce composition is related to the overall configuration of national R&D systems.
The multidimensional result supports the concept of capacity–participation tension. Higher-capacity systems may be more intensive, more resource-concentrated, and more specialised. These characteristics can be associated with participation structures that are narrower or more selective. The relationship remains associational, but it is consistent with the theoretical expectation that participation should be analysed as part of system organisation.
5.5. Configurational Mapping of National Systems
The coordinate-based mapping provides the central empirical representation of the study. By positioning each national system within the (X, Y) space, the analysis identifies how capacity and participation are aligned across countries.
Figure 3 presents the configurational map of national R&D systems.
The map reveals a non-random distribution of systems across the coordinate space. High-capacity systems are more frequently located in the quadrant combining above-benchmark capacity with below-benchmark participation. Lower-capacity systems with broader participation form another visible cluster. The quadrant representing both high capacity and broader participation is less densely populated.
This distribution is analytically important because it cannot be captured by a single composite innovation ranking. A ranking would show which systems perform better or worse on capacity-related indicators, but it would not reveal whether high capacity is aligned with broad or narrow participation. The configurational map makes this relationship visible.
The quadrant distribution can be interpreted as follows.
Quadrant I: higher capacity and broader participation.
This quadrant includes systems that combine above-benchmark capacity with above-benchmark women’s participation. These cases are especially important because they show that high capacity and broader participation can coexist. They may represent systems in which institutional, sectoral, or policy conditions moderate the capacity–participation tension.
Quadrant II: higher capacity and narrower participation.
This quadrant includes many high-capacity systems. These systems combine strong capacity indicators with below-benchmark shares of women among researchers. This configuration provides evidence of structural selectivity in advanced R&D systems.
Quadrant III: lower capacity and narrower participation.
This quadrant contains systems that are below the benchmark on both dimensions. These cases show that lower capacity does not automatically imply broader participation. Participation is shaped by multiple structural and institutional conditions.
Quadrant IV: lower capacity and broader participation.
This quadrant includes systems with lower capacity but above-benchmark participation. These cases indicate that broader workforce composition is more frequently found in less intensive R&D configurations.
Overall, the mapping suggests a recurrent structural regularity: capacity and participation are not randomly aligned. Higher-capacity systems are more often associated with narrower participation, while broader participation is more often found in lower- or intermediate-capacity systems.
5.6. Transition Zone and Differentiated System Trajectories
The configurational map also suggests that the relationship between capacity and participation is not simply linear. Instead, the distribution of systems indicates a possible transition zone at intermediate levels of capacity. In this zone, participation patterns become more differentiated and systems begin to diverge.
Figure 4 presents the transition-zone interpretation of the capacity–participation relationship.
The transition zone should be interpreted cautiously. It is not presented as a statistically definitive breakpoint. Rather, it is an observed interval in the coordinate space where systems with similar capacity levels display different participation outcomes. Some systems maintain relatively broader participation, while others move toward narrower participation structures.
This differentiation is theoretically meaningful. It suggests that intermediate capacity levels may be a point at which institutional arrangements, sectoral composition, and policy choices become especially important. Systems may follow different trajectories depending on whether they maintain broad participation structures or become more selective as capacity increases.
At higher levels of capacity, systems more frequently stabilise in configurations characterised by narrower participation. This does not imply inevitability. Rather, it suggests that without countervailing institutional or policy mechanisms, increasing capacity may be associated with more selective participation structures.
5.7. Synthesis of Results
The empirical results provide a coherent pattern across several analytical stages.
First, the descriptive data show substantial variation in both innovation system capacity and workforce composition. High capacity and broad participation do not automatically coincide.
Second, the bivariate correlation between R&D intensity and the share of women among researchers indicates a negative association. This association is visible in the broader sample and remains present within the European subset.
Third, the relationship persists when capacity is represented as a multidimensional coordinate combining R&D intensity, innovation performance, and R&D expenditure per researcher.
Fourth, the configurational mapping shows that national systems cluster in distinct regions of the capacity–participation space. High-capacity systems are more frequently associated with narrower participation, while broader participation is more often found in lower- or intermediate-capacity systems.
Fifth, the distribution suggests a transition zone at intermediate capacity levels, where systems with similar levels of capacity may diverge in participation outcomes.
Taken together, these findings support the main proposition of the article: workforce composition can be analysed as a structural dimension of innovation systems. The observed relationship between capacity and participation should be understood as a recurrent structural regularity, not as a deterministic causal law. The results show that configurational systems analysis can reveal patterns that remain obscured when innovation systems are evaluated only through performance indicators or composite rankings.
6. Discussion
6.1. Workforce Composition and Capacity–participation Tension
The results of this study show that workforce composition should be analysed as part of innovation system structure. Innovation systems are usually assessed through R&D intensity, innovation performance, expenditure, patents, and technological outputs. These indicators are important, but they do not show how participation in knowledge production is organised. The share of women among researchers provides one observable indicator of this participation structure.
The findings are consistent with recent evidence showing that women’s participation in research and innovation remains uneven across countries, sectors, disciplines, and career stages. Reports such as She Figures 2024 and Elsevier’s 2024 review show that gender disparities persist in research employment, seniority, leadership, publication output, funding, patenting, and innovation activity. OECD and WIPO evidence also shows that women remain underrepresented in ICT, artificial intelligence, digital innovation, and patent-intensive technological fields. The present study extends this literature by shifting the analysis from individual careers, organisations, or sectors to the structural configuration of national innovation systems.
The results suggest a capacity–participation tension. Higher-capacity systems are more often positioned in configurations characterised by narrower participation, while broader participation is more frequently observed in lower- or intermediate-capacity systems. This does not mean that innovation capacity and broad participation are incompatible. Some systems may combine higher capacity with broader participation. However, the recurrent pattern indicates that inclusion should not be assumed to follow automatically from innovation system development.
This finding is important because it challenges a linear view of modernisation, according to which higher investment, technological advancement, innovation performance, and social inclusion are expected to progress together. Advanced R&D systems may become more specialised, resource-intensive, competitive, and concentrated in technologically demanding sectors. These conditions can produce structural selectivity: participation is filtered not necessarily through explicit exclusion, but through sectoral demand, technical specialisation, funding competition, mobility expectations, evaluation regimes, and narrow definitions of excellence.
6.2. What the Kqm Adds Beyond Previous Approaches
The Kauzon Quadrant Model provides added explanatory value because it does not merely show that women’s participation is higher or lower. Previous studies already document gender gaps in science, research careers, ICT, AI, patenting, and innovation outputs. However, these studies usually do not show how such gaps are positioned within the broader capacity structure of national innovation systems.
The KQM addresses this limitation by placing innovation capacity and workforce participation in a shared coordinate space. This transforms a descriptive observation into a structural diagnosis. A low share of women among researchers has different meanings depending on whether it occurs in a lower-capacity system, a high-capacity system, or a transition zone. In a lower-capacity system, narrow participation may reflect weak institutional development or limited research opportunities. In a high-capacity system, the same narrow participation may indicate a selective organisation of knowledge production within an advanced and resource-intensive R&D system.
This is the deeper contribution of the model. KQM does not simply identify a problem; it diagnoses the system regime in which the problem occurs. Conventional gender indicators show underrepresentation. Innovation indicators show performance or capacity. Composite rankings show scalar position. KQM shows whether capacity and participation are aligned, misaligned, or structurally in tension. It therefore moves the analysis from measuring magnitude to diagnosing configuration.
For this reason, KQM should be understood as a methodology for assessing structural maturity rather than scalar position. A scalar approach asks whether a system ranks higher or lower. KQM asks how the system is internally organised: whether capacity, resources, performance, and participation are aligned. A system may rank highly on innovation indicators but still be structurally immature if its capacity is concentrated and its participation base is narrow. Conversely, a lower-capacity system may show elements of structural maturity if it combines available resources with broader participation and balanced institutional organisation.
6.3. Workforce Composition, Economy, and Strategic Policy Relevance
Although this article uses the share of women among researchers as the empirical indicator, the broader implication concerns workforce composition as a structural feature of national and regional economies. Research workforce composition is not isolated from the wider labour-market system. It reflects how a country or region distributes human capital across sectors, occupations, technological domains, and institutional settings.
This moves the discussion beyond equality in science. If participation among researchers varies systematically with innovation capacity, then the issue concerns not only research institutions, but also the way national and regional economies allocate talent to knowledge-intensive activities. High-capacity innovation systems may rely on sectors such as ICT, engineering, artificial intelligence, advanced manufacturing, biotechnology, and patent-intensive industries. If participation in these sectors is narrow, then innovation capacity may be built through a selective labour-force configuration that does not fully mobilise the available human-capital base.
The KQM is useful for policy because it links innovation capacity to workforce distribution and economic organisation. It can help policymakers distinguish between different system states: high capacity with broad participation, high capacity with narrow participation, lower capacity with broad participation, and lower capacity with narrow participation. These configurations require different interventions. A high-capacity/narrow-participation system may need reforms in career pathways, funding criteria, sectoral access, and institutional inclusion. A lower-capacity/broad-participation system may need stronger investment, infrastructure, and institutional support to convert participation potential into innovation capacity.
The model also has regional and global relevance. Because it is based on relative positioning and benchmark comparison, it can be applied to regions, country groups, and global comparative settings. It may support strategic policy diagnosis by showing whether innovation capacity is developing in a balanced or selective way. In this sense, KQM is not a geopolitical ranking tool, but a structural diagnostic instrument for strategic governance. It helps governments and international organisations move from scalar comparison to structural policy intelligence.
6.4. Limitations and Future Research
Several limitations must be acknowledged. First, the study uses aggregate cross-national data and does not establish causality. The observed association between innovation system capacity and workforce composition should be interpreted as a recurrent structural regularity rather than proof of direct causal influence.
Second, the share of women among researchers is an important but limited indicator. It does not capture sector, discipline, seniority, leadership, contract type, funding access, or career progression. Future research should disaggregate workforce composition by sector, especially higher education, government research, and business enterprise R&D, and should examine technologically intensive fields such as ICT, AI, engineering, and advanced manufacturing.
Third, the capacity coordinate should be tested through alternative indicators, weighting schemes, and benchmarks. Future studies could include patent intensity, high-technology employment, researcher density, business R&D expenditure, scientific impact, or regional innovation indicators.
Fourth, future research should apply the KQM at regional and subnational levels. Innovation systems often vary strongly within countries, and regional analysis could show whether capacity–participation configurations differ between metropolitan, industrial, and peripheral regions.
Overall, the contribution of this study is not limited to documenting an inverse association between innovation capacity and women’s participation among researchers. Similar participation gaps have already been documented in previous literature. The distinctive contribution of this article is to show that these gaps can be interpreted as part of a broader structural configuration of national innovation systems. By applying the KQM, the article demonstrates that workforce composition functions as a diagnostic indicator of system organisation and structural maturity.
7. Conclusion
This article examined workforce composition as a structural dimension of national innovation systems. It focused on the relationship between innovation system capacity and the share of women among researchers, using a configurational systems framework. The aim was not to establish a deterministic causal relationship, but to identify whether participation patterns are systematically associated with the structural capacity of national R&D systems.
The analysis showed that workforce composition is not randomly distributed across innovation systems. Higher-capacity systems are more frequently associated with narrower participation structures, while broader participation is more often observed in lower- or intermediate-capacity systems. This relationship was visible in descriptive comparison, correlation analysis, multidimensional capacity mapping, and quadrant-based configurational analysis.
The article interpreted this pattern as a recurrent structural regularity rather than as a universal law. The findings suggest that innovation system capacity and participation breadth should not be assumed to increase together. Instead, they may be aligned in different ways across national systems. Some systems combine higher capacity with broader participation, while others combine higher capacity with narrower participation. These configurations are analytically important because they reveal differences in how innovation systems organise knowledge production and research labour.
The main theoretical contribution of the article is the integration of workforce composition into systems-level innovation analysis. Innovation systems are not only arrangements of institutions, resources, outputs, and technological capabilities. They are also arrangements of participation. They structure who enters research activity, how opportunities are distributed, and how research careers are organised. Workforce composition therefore provides a useful indicator of the social organisation of innovation capacity.
The article also contributes methodologically by applying a coordinate-based configurational framework. This framework makes it possible to analyse the relationship between capacity and participation without reducing national systems to a single ranking. By mapping systems within a multidimensional space, the analysis identifies configurations and transition zones that remain less visible in conventional performance-based approaches.
The concept of capacity–participation tension was introduced to describe the observed association between higher innovation capacity and narrower workforce participation. This concept does not imply that capacity and inclusion are incompatible. Rather, it highlights the possibility that advanced innovation systems may become more specialised, competitive, and resource-concentrated in ways that shape participation structures. The presence of systems that combine relatively high capacity with broader participation indicates that this tension can be moderated by institutional, sectoral, or policy conditions.
The findings have implications for innovation policy and system assessment. If workforce composition is structurally related to innovation system capacity, then participation indicators should be integrated into innovation system evaluation. R&D intensity, innovation performance, and expenditure per researcher provide important information about capacity, but they do not show how that capacity is socially organised. A more complete assessment of innovation systems should therefore include both capacity and participation dimensions.
Several limitations must be acknowledged. The study uses aggregate cross-national data and does not establish causality. The share of women among researchers is an important but limited indicator of workforce composition. It does not capture sectoral differences, disciplinary variation, seniority, leadership, contract status, or career progression. The capacity coordinate is also exploratory and should be tested through alternative specifications, weighting schemes, and benchmarks.
Future research should extend the analysis through longitudinal data, sectoral disaggregation, and comparative case studies. Longitudinal research would help determine whether systems move through transition zones over time. Sectoral analysis would clarify whether the observed relationship is strongest in business enterprise R&D, high-technology industries, engineering, or other intensive research domains. Comparative case studies of systems combining high capacity with broader participation could identify institutional mechanisms that moderate structural selectivity.
In conclusion, the article argues that workforce composition should be treated as part of innovation system structure. Participation patterns are not external to system development; they are one way in which the organisation of innovation systems becomes visible. A systems approach to innovation capacity should therefore ask not only how much capacity a system has, but also how that capacity is organised, distributed, and socially sustained.
References
- European Commission. She Figures 2024: Gender in Research and Innovation; Publications Office of the European Union: Luxembourg, 2025. [Google Scholar]
- Elsevier. Progress Toward Gender Equality in Research & Innovation: 2024 Review; Elsevier: Amsterdam, The Netherlands, 2024. [Google Scholar]
- Huang, J.; Gates, A.J.; Sinatra, R.; Barabási, A.-L. Historical comparison of gender inequality in scientific careers across countries and disciplines. Proc. Natl. Acad. Sci. 2020, 117(9), 4609–4616. [Google Scholar] [CrossRef] [PubMed]
- Kwiek, M.; Szymula, L. Young male and female scientists: A quantitative exploratory study of the changing demographics of the global scientific workforce. Quant. Sci. Stud. 2023, 4(4), 902–937. [Google Scholar] [CrossRef]
- OECD. OECD Digital Economy Outlook 2024. In Strengthening Connectivity, Innovation and Trust; OECD Publishing: Paris, France, 2024; Volume 2. [Google Scholar]
- WIPO. The Global Gender Gap in Innovation and Creativity: An International Comparison of the Gender Gap in Global Patenting over Two Decades; World Intellectual Property Organization: Geneva, Switzerland, 2023. [Google Scholar]
- Vedres, B.; Vasarhelyi, O. Inclusion unlocks the creative potential of gender diversity in teams. Sci. Rep. 2023, 13, 13757. [Google Scholar] [CrossRef] [PubMed]
- Larivière, V.; Ni, C.; Gingras, Y.; Cronin, B.; Sugimoto, C.R. Bibliometrics: Global gender disparities in science. Nature 2013, 504, 211–213. [Google Scholar] [CrossRef] [PubMed]
- West, J.D.; Jacquet, J.; King, M.M.; Correll, S.J.; Bergstrom, C.T. The role of gender in scholarly authorship. PLoS ONE 2013, 8(7), e66212. [Google Scholar] [CrossRef] [PubMed]
- Moss-Racusin, C.A.; Dovidio, J.F.; Brescoll, V.L.; Graham, M.J.; Handelsman, J. Science faculty’s subtle gender biases favor male students. Proc. Natl. Acad. Sci. 2012, 109(41), 16474–16479. [Google Scholar] [CrossRef] [PubMed]
- Holman, L.; Stuart-Fox, D.; Hauser, C.E. The gender gap in science: How long until women are equally represented? PLoS Biol. 2018, 16(4), e2004956. [Google Scholar] [CrossRef] [PubMed]
- Freeman, C. Technology Policy and Economic Performance: Lessons from Japan; Pinter: London, UK, 1987. [Google Scholar]
- Lundvall, B.-Å. (Ed.) National Systems of Innovation: Towards a Theory of Innovation and Interactive Learning; Pinter: London, UK, 1992. [Google Scholar]
- Nelson, R.R. (Ed.) National Innovation Systems: A Comparative Analysis; Oxford University Press: Oxford, UK, 1993. [Google Scholar]
- Edquist, C. Systems of innovation: Perspectives and challenges. In The Oxford Handbook of Innovation; Fagerberg, J., Mowery, D.C., Nelson, R.R., Eds.; Oxford University Press: Oxford, UK, 2005. [Google Scholar]
- European Commission. European Innovation Scoreboard 2024; Directorate-General for Research and Innovation: Brussels, Belgium, 2024. [Google Scholar]
- OECD. OECD Science, Technology and Innovation Outlook 2025: Driving Change in a Shifting Landscape; OECD Publishing: Paris, France, 2025. [Google Scholar]
- Nardo, M.; Saisana, M.; Saltelli, A.; Tarantola, S.; Hoffman, A.; Giovannini, E. Handbook on Constructing Composite Indicators: Methodology and User Guide. In OECD Statistics Working Papers; OECD Publishing: Paris, France, 2005. [Google Scholar]
- Archibugi, D.; Coco, A. Measuring technological capabilities at the country level: A survey and a menu for choice. Res. Policy 2005, 34(2), 175–194. [Google Scholar] [CrossRef]
- Saltelli, A. Composite indicators between analysis and advocacy. Soc. Indic. Res. 2007, 81, 65–77. [Google Scholar]
- Grupp, H.; Schubert, T. Review and new evidence on composite innovation indicators for evaluating national performance. Res. Policy 2010, 39(1), 67–78. [Google Scholar] [CrossRef]
- Cohen, W.M.; Levinthal, D.A. Absorptive capacity: A new perspective on learning and innovation. Adm. Sci. Q. 1990, 35(1), 128–152. [Google Scholar] [CrossRef]
- Zahra, S.A.; George, G. Absorptive capacity: A review, reconceptualization, and extension. Acad. Manag. Rev. 2002, 27(2), 185–203. [Google Scholar] [CrossRef]
- Lane, P.J.; Koka, B.R.; Pathak, S. The reification of absorptive capacity: A critical review and rejuvenation of the construct. Acad. Manag. Rev. 2006, 31(4), 833–863. [Google Scholar] [CrossRef]
- Powell, W.W.; Snellman, K. The knowledge economy. Annu. Rev. Sociol. 2004, 30, 199–220. [Google Scholar] [CrossRef]
- Acemoglu, D.; Autor, D. Skills, Tasks and Technologies: Implications for Employment and Earnings. In Handbook of Labor Economics; Ashenfelter, O., Card, D., Eds.; Elsevier: Amsterdam, The Netherlands, 2011; Volume 4B, pp. 1043–1171. [Google Scholar]
- Pavitt, K. Sectoral patterns of technical change: Towards a taxonomy and a theory. Res. Policy 1984, 13(6), 343–373. [Google Scholar] [CrossRef]
- Malerba, F. Sectoral systems of innovation and production. Res. Policy 2002, 31(2), 247–264. [Google Scholar] [CrossRef]
- Hall, P.A.; Soskice, D. (Eds.) Varieties of Capitalism: The Institutional Foundations of Comparative Advantage; Oxford University Press: Oxford, UK, 2001. [Google Scholar]
- Amable, B. The Diversity of Modern Capitalism; Oxford University Press: Oxford, UK, 2003. [Google Scholar]
- Rossiter, M.W. The Matthew Matilda effect in science. Soc. Stud. Sci. 1993, 23(2), 325–341. [Google Scholar] [CrossRef]
- Xie, Y.; Shauman, K.A. Women in Science: Career Processes and Outcomes; Harvard University Press: Cambridge, MA, USA, 2003. [Google Scholar]
- Blickenstaff, J.C. Women and science careers: Leaky pipeline or gender filter? Gend. Educ. 2005, 17(4), 369–386. [Google Scholar] [CrossRef]
- Ceci, S.J.; Williams, W.M. Understanding current causes of women’s underrepresentation in science. Proc. Natl. Acad. Sci. 2011, 108(8), 3157–3162. [Google Scholar] [CrossRef] [PubMed]
- Ginther, D.K.; Kahn, S. Women’s careers in academic social science: Progress, pitfalls, and plateaus. In The Economics of Economists; Lanteri, A., Vromen, J., Eds.; Cambridge University Press: Cambridge, UK, 2014. [Google Scholar]
- Ragin, C.C. Redesigning Social Inquiry: Fuzzy Sets and Beyond; University of Chicago Press: Chicago, IL, USA, 2008. [Google Scholar]
- Fiss, P.C. Building better causal theories: A fuzzy set approach to typologies in organization research. Acad. Manag. J. 2011, 54(2), 393–420. [Google Scholar] [CrossRef]
- Kauzonė, H.M. A multidimensional quadrant-based methodological framework for system assessment: The case of national R&D systems. In Quality & Quantity; 2026a. [Google Scholar] [CrossRef]
- Kauzonė, H.M. A quadrant-based innovation index (KQM) for diagnosing structural maturity. Kybernetes 2026b. [Google Scholar] [CrossRef]
- Fagerberg, J.; Mowery, D.C.; Nelson, R.R. (Eds.) The Oxford Handbook of Innovation; Oxford University Press: Oxford, UK, 2005. [Google Scholar]
Figure 1.
Correlation between R&D intensity and women among researchers, broader sample.
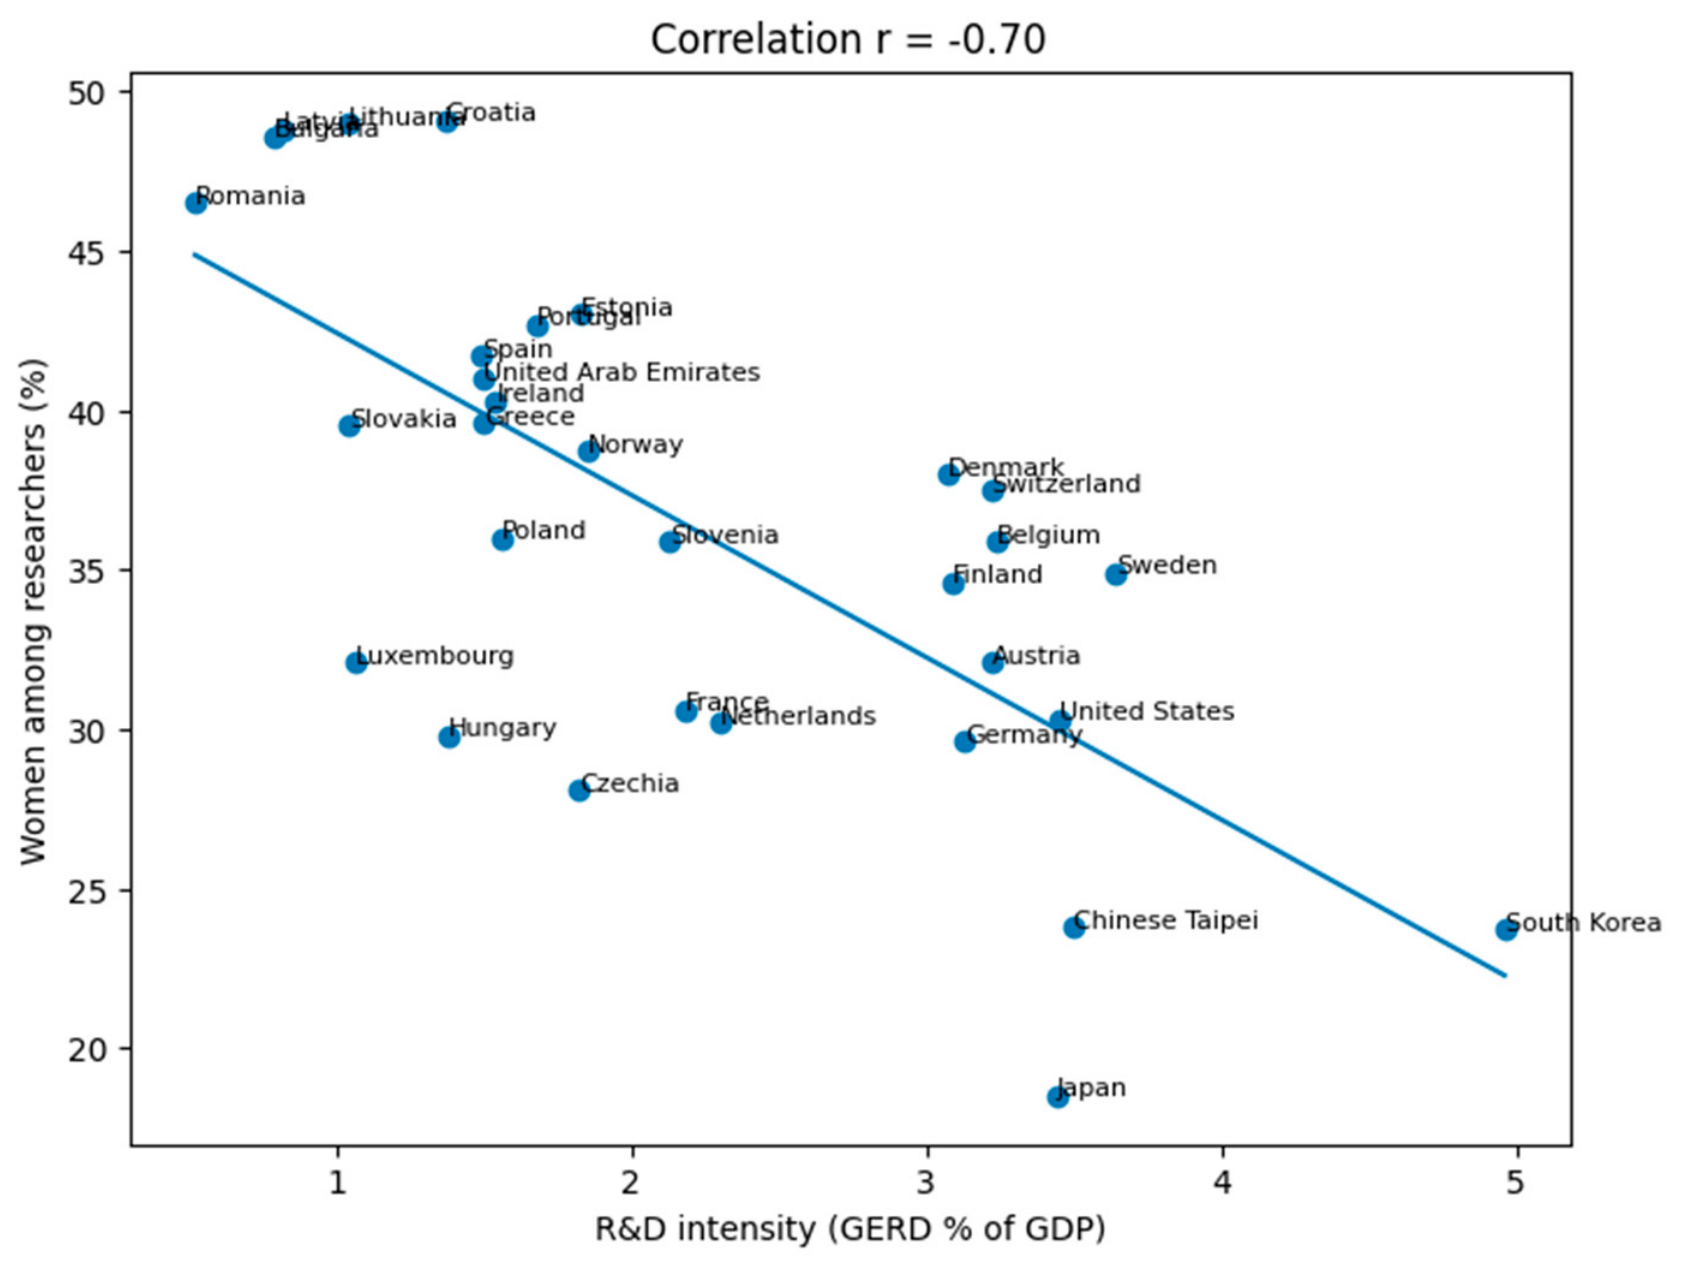
Figure 2.
Correlation between women among researchers (%) and R&D intensity (GERD % of GDP), European countries.
Figure 2.
Correlation between women among researchers (%) and R&D intensity (GERD % of GDP), European countries.
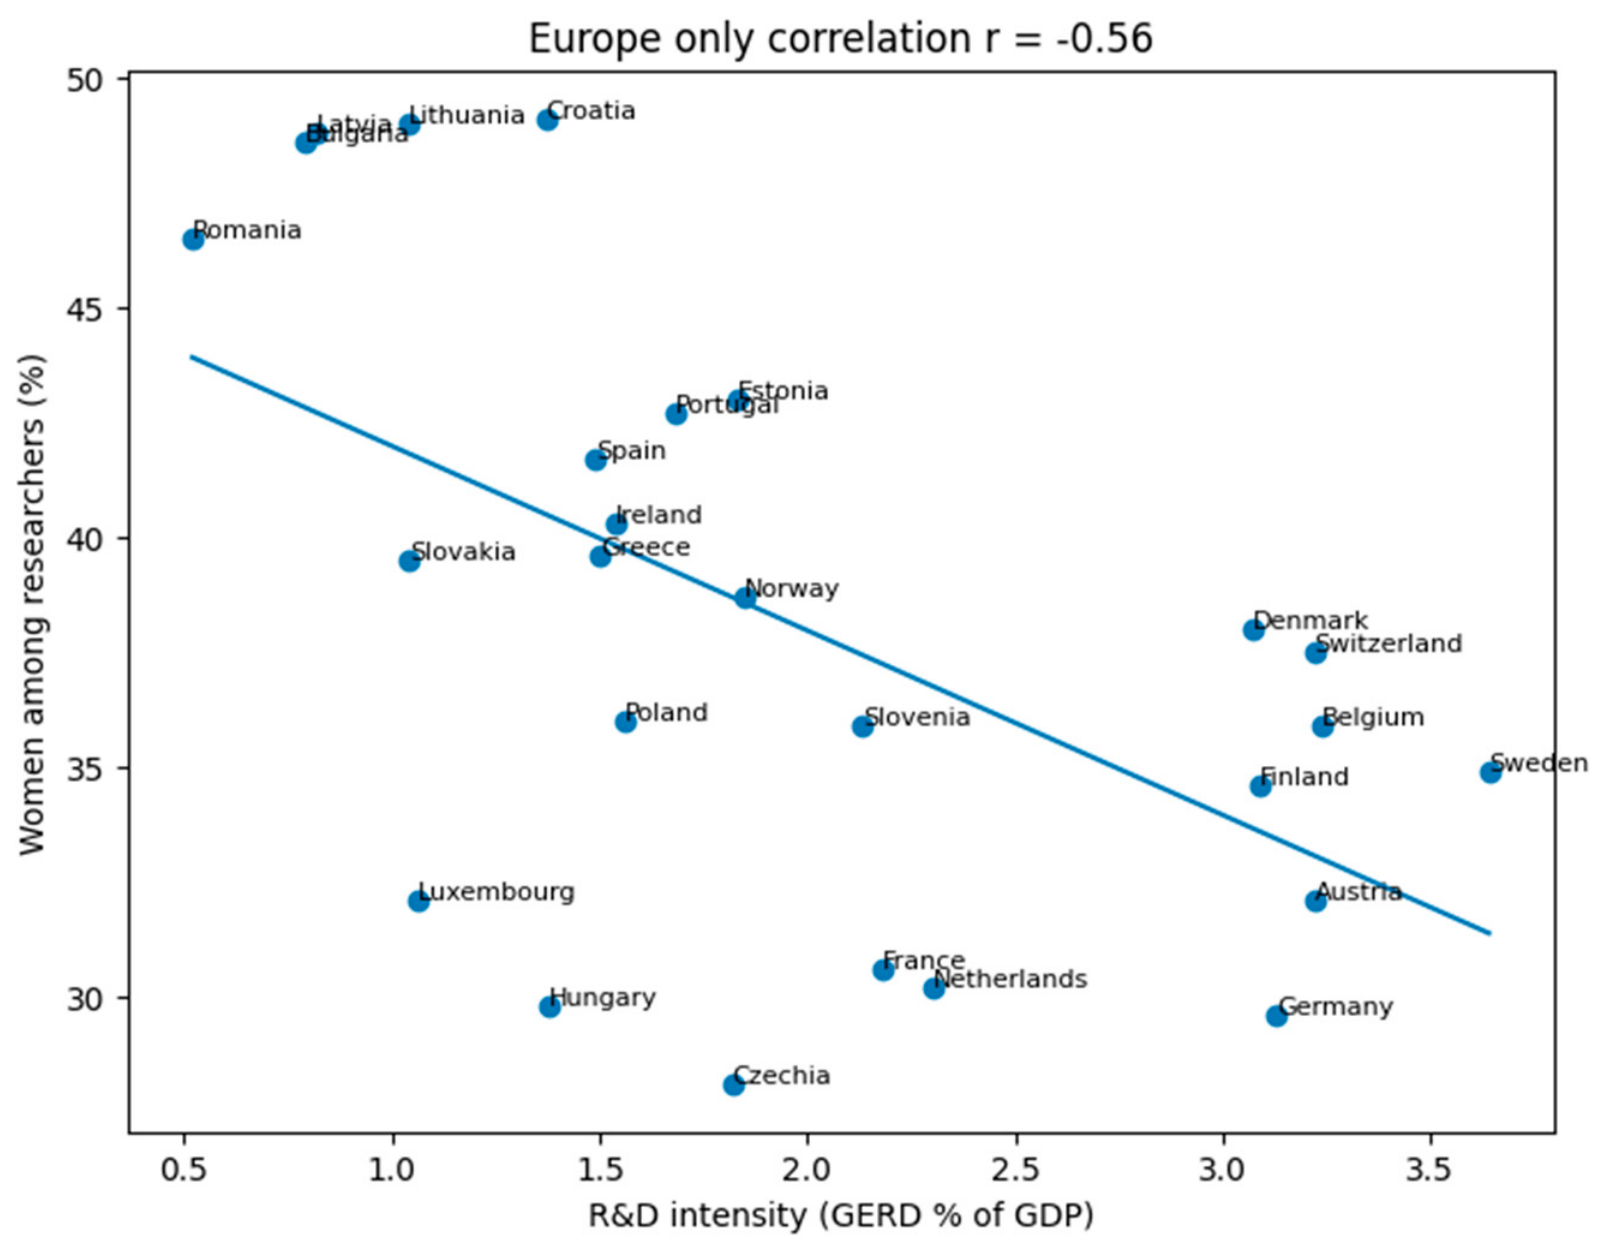
Figure 3.
Configurational mapping of national R&D systems (2023) with correlation gradient.
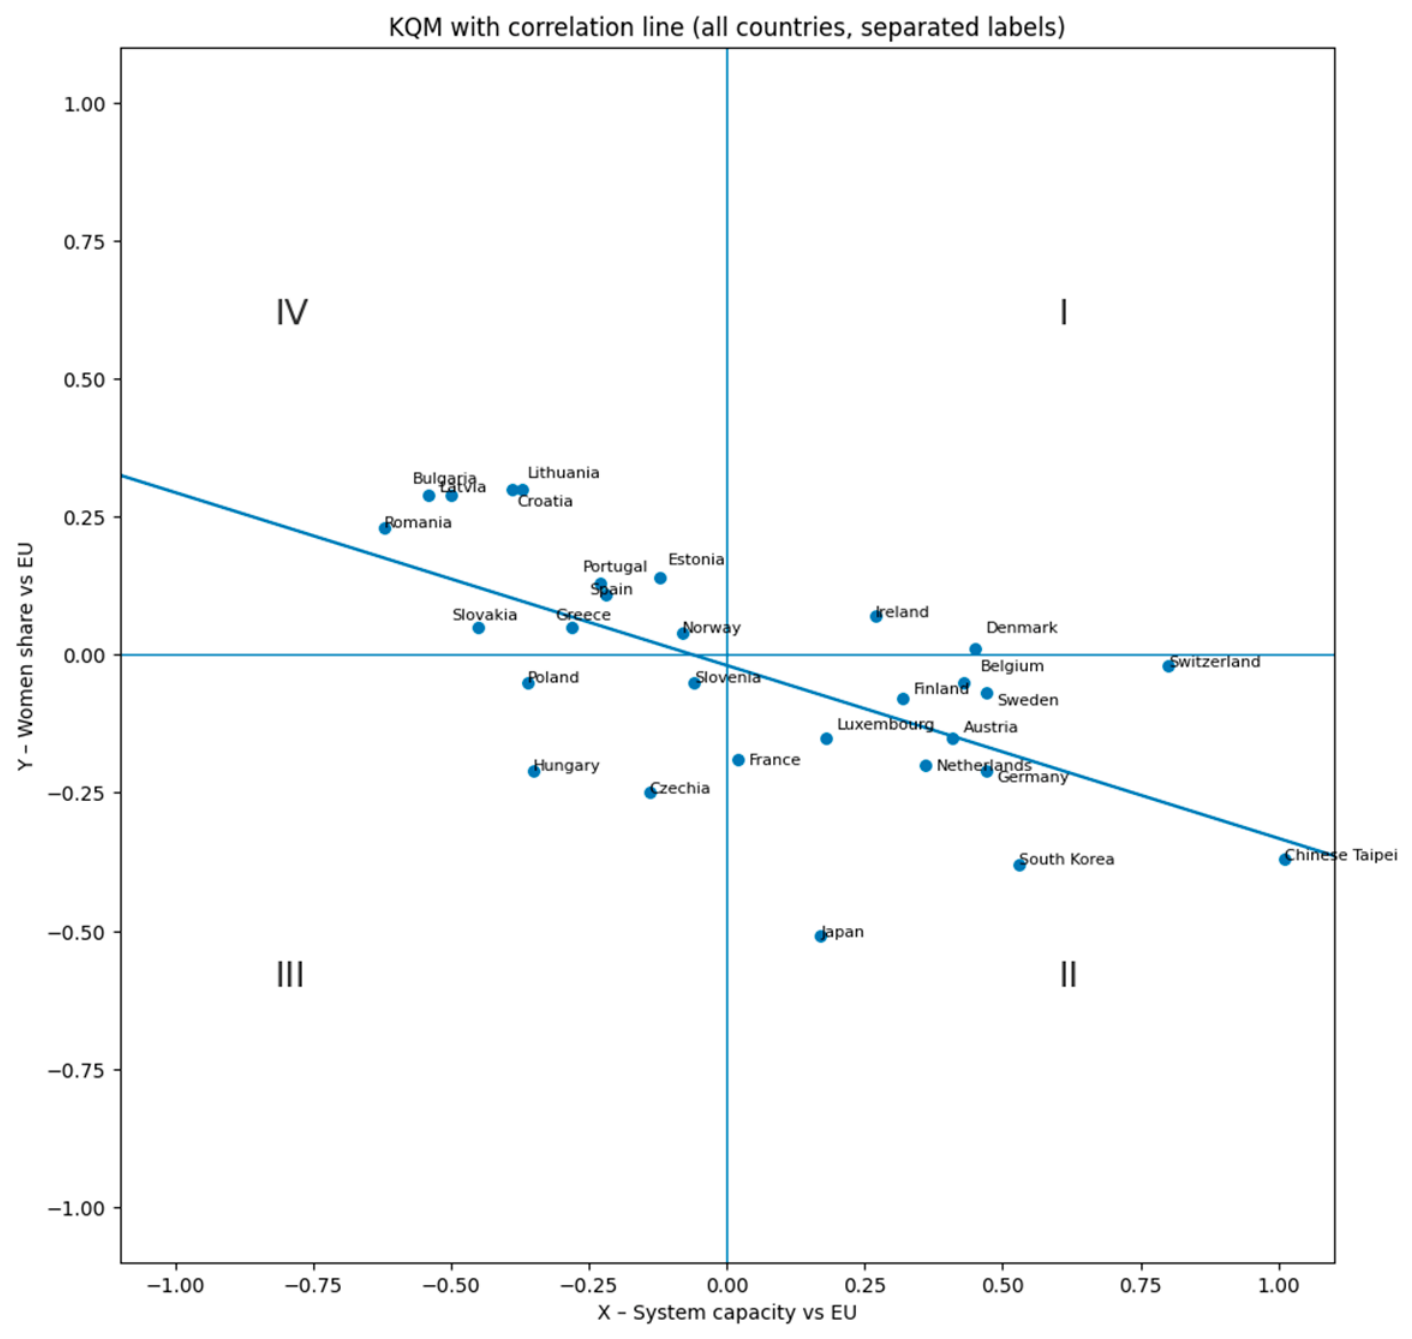
Figure 4.
Threshold Dynamics with Transition Zone and Structural Phases.
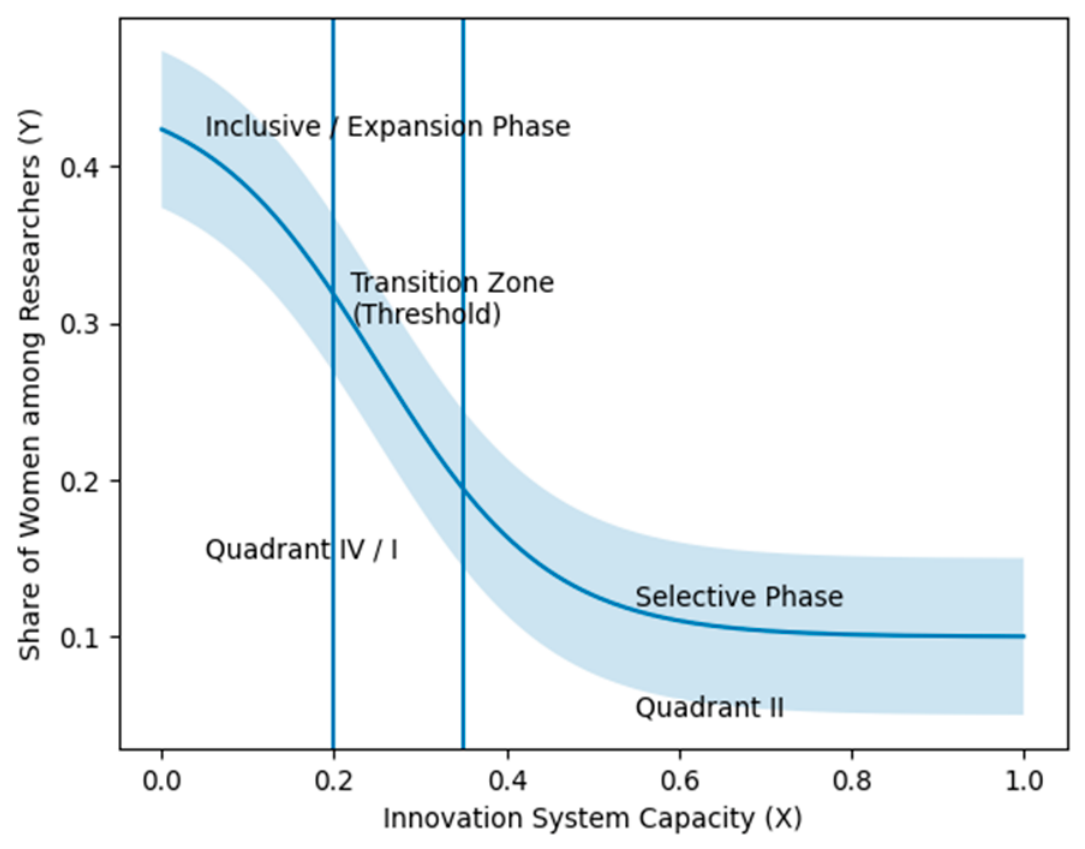

Table 1.
Core indicators and KQM coordinates of national R&D systems (2023).
| Country | Researchers | GERD mln € | R&D expenditure per researcher (kEUR) | R&D intensity (GERD % of GDP) | Innovation performance (SII) | Women among researchers (%) | X | Y | Quadrant |
| EU-27 | 3 179 129 | 389 184 | 122 417 | 2.26 | 100 | 37.7* | 0 | 0 | |
| Belgium | 118 083 | 19 510 | 165 224 | 3.24 | 125.8 | 35.9 | 0.43 | -0.05 | II |
| Bulgaria | 23 489 | 750 | 31 943 | 0.79 | 46.7 | 48.6 | -0.54 | 0.29 | IV |
| Czechia | 71 241 | 5 820 | 81 689 | 1.82 | 94.7 | 28.1 | -0.14 | -0.25 | III |
| Denmark | 73 396 | 11 475 | 156 344 | 3.07 | 137.6 | 38.0 | 0.45 | 0.01 | I |
| Germany | 742 803 | 132 008 | 177 718 | 3.13 | 117.8 | 29.6 | 0.47 | -0.21 | II |
| Estonia | 10 363 | 702 | 67 757 | 1.83 | 98.6 | 43.0 | -0.12 | 0.14 | IV |
| Ireland | 43 645 | 8 100 | 185 574 | 1.54 | 115.8 | 40.3 | 0.27 | 0.07 | I |
| Greece | 89 396 | 3 365 | 37 643 | 1.50 | 79.5 | 39.6 | -0.28 | 0.05 | IV |
| Spain | 276 018 | 22 379 | 81 079 | 1.49 | 89.2 | 41.7 | -0.22 | 0.11 | IV |
| France | 483 383 | 61 482 | 127 191 | 2.18 | 105.3 | 30.6 | 0.02 | -0.19 | II |
| Croatia | 17 013 | 1 082 | 63 590 | 1.37 | 69.6 | 49.1 | -0.39 | 0.30 | IV |
| Italy | 229 079 | 29 399 | 128 338 | 1.37 | 90.3 | : | -0.16 | : | |
| Cyprus | 3 072 | 214 | 69 533 | 0.66 | 105.4 | : | -0.10 | : | |
| Latvia | 8 625 | 324 | 37 597 | 0.82 | 52.5 | 48.8 | -0.50 | 0.29 | IV |
| Lithuania | 19 190 | 775 | 40 367 | 1.04 | 83.8 | 49.0 | -0.37 | 0.30 | IV |
| Luxembourg | 4 186 | 867 | 207 115 | 1.06 | 117.2 | 32.1 | 0.18 | -0.15 | II |
| Hungary | 67 009 | 2 726 | 40 681 | 1.38 | 70.4 | 29.8 | -0.35 | -0.21 | III |
| Malta | 2 023 | 121 | 59 818 | 0.58 | 85.8 | : | -0.35 | : | |
| Netherlands | 157 331 | 24 204 | 153 842 | 2.30 | 128.7 | 30.2 | 0.36 | -0.20 | II |
| Austria | 101 998 | 15 404 | 151 026 | 3.22 | 119.9 | 32.1 | 0.41 | -0.15 | II |
| Poland | 224 934 | 11 694 | 51 989 | 1.56 | 62.8 | 36.0 | -0.36 | -0.05 | III |
| Portugal | 119 750 | 4 541 | 37 921 | 1.68 | 85.6 | 42.7 | -0.23 | 0.13 | IV |
| Romania | 31 182 | 1 676 | 53 735 | 0.52 | 33.1 | 46.5 | -0.62 | 0.23 | IV |
| Slovenia | 17 587 | 1 365 | 77 593 | 2.13 | 95.1 | 35.9 | -0.06 | -0.05 | III |
| Slovakia | 32 274 | 1 280 | 39 656 | 1.04 | 65.6 | 39.5 | -0.45 | 0.05 | IV |
| Finland | 69 017 | 8 439 | 122 282 | 3.09 | 134.3 | 34.6 | 0.32 | -0.08 | II |
| Sweden | 143 042 | 19 481 | 136 193 | 3.64 | 134.5 | 34.9 | 0.47 | -0.07 | II |
| South Korea | 603566 | 84277.52 | 139632.7 | 4.96 | 126,0 | 23.7 | 0.53 | -0.38 | II |
| Norway | 69866 | 8267.234 | 118329.9 | 1.85 | 96.0 | 38.7 | -0.08 | 0.04 | IV |
| Switzerland | 86486 | 26642.57 | 308056.5 | 3.22 | 147.0 | 37.5 | 0.80 | -0.02 | II |
| Japan | 989 223 | 134 016.6 | 135 480 | 3.44 | 87 | 18.5 | 0.17 | -0.51 | II |
| United States | : | 883 730.7 | : | 3.45 | 112 | 30.3 | : | -0.20 | : |
| China except Hong Kong | : | 435 470.9 | : | 2.58 | 75 | : | : | : | : |
| United Arab Emirates | 39 000 | 6 500 | 166.7 | 1.5 | 41.0 |
Disclaimer/Publisher’s Note: The statements, opinions and data contained in all publications are solely those of the individual author(s) and contributor(s) and not of MDPI and/or the editor(s). MDPI and/or the editor(s) disclaim responsibility for any injury to people or property resulting from any ideas, methods, instructions or products referred to in the content. |
© 2026 by the author. Licensee MDPI, Basel, Switzerland. This article is an open access article distributed under the terms and conditions of the Creative Commons Attribution (CC BY) license.
Copyright: This open access article is published under a Creative Commons CC BY 4.0 license, which permit the free download, distribution, and reuse, provided that the author and preprint are cited in any reuse.


