
Submitted:
24 June 2026
Posted:
25 June 2026
You are already at the latest version
Abstract
Electrochemical impedance spectroscopy (EIS), a rapid and non-destructive detection technique, offers a novel technical pathway for monitoring the degradation and assessing the quality of gear oil. This research delves into the electrochemical response characteristics and the underlying evolution mechanism of high-viscosity gear oil specifically formulated for wind turbines during its oxidative degradation process. Utilizing Mobil SHC™ Gear Oil 320 WT as the research subject, oil samples with varying degrees of degradation were prepared through accelerated oxidation experiments. Broadband frequency-sweep EIS testing was employed to acquire impedance spectra. The EIS data were subsequently analyzed using the equivalent circuit (ECM) method to extract electrochemical fingerprint parameters, enabling a systematic analysis of the variation patterns in the electrochemical response of gear oil with respect to oxidation temperature and time. Concurrently, the impact of test temperature on measurement results was evaluated. The findings reveal that EIS can dissect the intricate oxidative degradation process of gear oil into quantifiable interfacial electrochemical responses, with the characteristic parameters derived from ECM demonstrating consistent trends. Through a comprehensive analysis of the evolution patterns of electrochemical fingerprints, the oxidative degradation state of gear oil can be effectively evaluated. This research provides empirical evidence supporting the application of EIS technology in monitoring oxidative degradation and assessing the quality of gear oil for wind turbines.
Keywords:
wind turbine
; gear oil
; oxidative degradation
; electrochemical impedance spectroscopy
; equivalent circuit model
; experimental research
1. Introduction
As a pivotal component within new energy power generation systems, the gearbox of a wind turbine assumes the critical function of transforming the impeller's low rotational speed and high torque into the generator's high rotational speed and low torque [1]. Wind turbine gearboxes are subjected to prolonged operation under stringent conditions characterized by variable loads and a broad temperature spectrum (80–120°C). Gear oil, serving as the "lifeblood" of the gearbox, directly constrains the operational reliability of the equipment owing to its lubrication performance [2,3]. According to 2023 statistics from the International Energy Agency (IEA), gearbox malfunctions constitute 32% of all wind turbine failures, with roughly 70% of these instances being attributable to the deterioration in lubricating performance stemming from the oxidative degradation of gear oil [4,5]. Throughout the oxidation process, base oil molecules engage in chain reactions under the influence of high temperatures and metal catalysis, progressively yielding oxidation byproducts such as carboxylic acids, gums, and asphaltenes. This results in elevated oil viscosity, diminished load-bearing capacity of the oil film, and ultimately, severe failure modes including tooth surface wear and scuffing [6,7].
Traditional approaches for detecting the performance degradation of gear oil can be classified into three categories: physicochemical index analysis, infrared spectroscopic analysis, and simulated oxidation testing, all of which exhibit varying degrees of limitations. Physicochemical analysis assesses oil quality by measuring indicators such as kinematic viscosity [8], acid number [9], moisture content [10], and flash point [11]. Notably, increases in viscosity and acid number serve as primary indicators for evaluating oxidation [12,13]. However, this method pertains to offline detection, characterized by cumbersome operation, time-consuming processes, and the need for expensive equipment, rendering it unsuitable for high-frequency monitoring. More critically, these indicators represent lagging parameters and fail to provide early warnings at the initial stage of additive depletion. Infrared spectroscopy technology [14,15] enables the detection of wear elements, additive depletion, and information pertaining to oxidation products. Fourier transform infrared spectroscopy [16,17] offers a basis for assessing the degree of oxidation by analyzing variations in characteristic peaks. Nevertheless, this method exhibits limited adaptability and also constitutes a form of ex post facto detection, as it measures the accumulated quantity of oxidation products rather than the residual antioxidant capacity. Simulated oxidation tests, including the rotating pressure vessel oxidation test (RPVOT, ASTM D2272) [18], the oxidation tube test (SH/T 0123) [19], and the DKA oxidation test [20], are employed to assess the oxidation stability of gear oils. Nevertheless, these tests are characterized by their time-consuming nature, high costs, and the necessity for specialized supervision. Furthermore, discrepancies exist between laboratory conditions and real-world operational conditions, potentially leading to a lack of correlation between test results and actual field performance. Furthermore, traditional methods often rely on a singular indicator, whereas research indicates that there is no discernible linear correlation between oxidation values and acid number variations across different brands of gear oil, necessitating a comprehensive evaluation using multiple indicators. In summary, traditional detection methods are constrained by their offline and lagging technical attributes, exhibiting notable shortcomings in real-time monitoring, cost-efficiency, and trend forecasting, thereby rendering them inadequate for fulfilling the engineering requirements of early warning and remaining life assessment in the intelligent operation and maintenance of wind turbines.
Electrochemical Impedance Spectroscopy (EIS) serves as a highly sensitive and efficacious detection technique, enabling the swift and non-destructive characterization of materials' electrochemical properties through the application of small-amplitude alternating current perturbations to the system and subsequent recording of its response [21,22]. EIS has found extensive application in the quality monitoring of diverse materials, including cement [23], lithium batteries [24], and concrete [25]. In recent years, the utilization of EIS technology has progressively extended to the realm of condition monitoring and performance evaluation of lubricating oils, demonstrating significant potential for future applications. The relevant research mainly revolves around three dimensions: (1) In terms of correlation modeling between the electrochemical properties and physicochemical performance of lubricating oil. Lvovich et al. [26] dissected the impedance spectrum into parameters including resistance, capacitance, etc, thereby laying the theoretical groundwork for EIS analysis of lubricants. Engmarksgaard et al. [27] integrated experimental and simulation approaches to examine the linear or nonlinear impacts of diesel, water, and activated carbon contamination on the resistance of lubricants. From the tribological standpoint, Delgado et al. [28] discovered that the extent of disparity in impedance spectra between new and degraded oils exhibits a positive correlation with the degree of wear. (2) Regarding the quantitative detection of typical pollutants. Huang Chunsheng et al [29] delineated the relationship between oil/water two-phase flow parameters, water content, and flow rate by leveraging impedance characteristics. Liu Haitao et al. [30] and Wang et al. [31] separately validated the feasibility of employing impedance microsensors for detecting water content in engine oil and the bulk resistance of engine oil containing ethylene glycol. Zhang Guoxin et al. [32] implemented EIS sensors in industrial settings and established an online monitoring system for the sealing status of roll boxes through water content monitoring. Zhu Xiaoliang et al. [33] integrated electrochemical sensor arrays with BP-ANN to facilitate multi-parameter quantitative analysis of water content, total acid value, soot, and sulfur content, with prediction errors remaining within acceptable bounds. (3) Regarding the integration of degradation critical point identification with intelligent algorithms. Zhang Feng et al. [34] and Liu Minglei et al. [35] monitor moisture variations and aging failure thresholds in lubricating oil via impedance spectroscopy, thereby providing an early warning basis for predictive maintenance. As artificial intelligence advances, machine learning has been progressively incorporated into EIS data processing: Chowdhury et al. [36] integrates equivalent circuit fitting parameters with raw impedance data, employing SVM and ANN to achieve high-precision discrimination (with an accuracy rate ranging from 98% to 100%) between new and in-service oils; Zhu Xiaoliang et al. [33] leverages neural networks to accomplish quantitative inversion of multiple performance parameters. Zabara et al. [37] provides an overview of electrochemical impedance spectroscopy tomography technology and examines its potential applications in multiphase medium analysis, offering novel insights for spatial distribution imaging monitoring in the lubrication domain.
In summary, EIS, characterized by its rapidity, non-destructive nature, and the ability to provide rich information, exhibits promising application prospects in the realm of lubrication performance monitoring for mechanical equipment. Nevertheless, there remains a dearth of systematic research on the evolution patterns of electrochemical characteristics in high-viscosity gear oil specifically formulated for wind turbines during the process of oxidative degradation. To address this gap, this research selected Mobil SHC™ 320 WT gear oil, which is extensively employed in wind turbine gearboxes, as the focal point of investigation. Accelerated oxidation experiments were carried out utilizing a lubricant oxidation tester to generate degraded oil samples with varying degrees of oxidation. Electrochemical workstations were employed to conduct broadband frequency sweep tests, thereby collecting EIS spectra at different oxidation stages. The EIS data were subsequently analyzed through equivalent circuit modeling (ECM) techniques to extract electrochemical characteristic parameters. Based on the experimental findings, this research systematically explores the influence of oxidation temperature, oxidation duration, and measurement temperature on the electrochemical response behavior of gear oil, thereby furnishing a reliable experimental foundation for EIS-based monitoring of oxidative degradation and performance degradation assessment for gear oil in wind turbine generators.
2. Mechanism and Experiment
2.1. Oxidation Mechanism of Gear Oil
The essence of gear oil oxidation in wind turbine units is the irreversible chemical degradation of the molecular structure of the base oil, which is primarily governed by free radical chain reactions. This process involves four kinetic stages: initiation, propagation, transfer, and termination of the chain [38,39,40,41]. It results in modifications to the chemical composition and molecular configuration of the lubricating oil, precipitating typical performance deterioration phenomena such as increased viscosity, elevated acid value, and sediment formation [42,43]. An in-depth analysis of this oxidation mechanism facilitates the elucidation of the fundamental nature of high-temperature degradation in lubricating oils, thereby offering theoretical underpinnings for the preparation of oil samples for high-temperature oxidation tests and the analysis of electrochemical response characteristics.
- (1)
- Chain initiation
Chain initiation is the process where initial free radicals are generated for hydrocarbon formation. When subjected to external energy sources, such as heat or mechanical shear, the weaker C-H bonds within oil molecules undergo cleavage, resulting in the formation of highly reactive alkyl radicals and hydrogen atoms .
- (2)
- Chain growth
Chain growth represents the process wherein new radicals are generated. During this process, the radical initially reacts with oxygen to form a peroxyl radical . Subsequently, the peroxyl radical abstracts a hydrogen atom from another oil molecule, yielding a hydroperoxide and a new , thereby perpetuating the chain reaction.
- (3)
- Chain transfer
Chain transfer represents a process characterized by an increase in the number of free radicals. In this phase, stable products are not directly formed; instead, the reactivity of free radicals is transferred to new molecules, thereby markedly expediting the oxidation process and yielding a greater quantity of products containing oxygen-functional groups.
- (4)
- Chain termination
Chain termination refers to the process wherein all free radicals are neutralized. When the concentration of free radicals reaches a sufficiently high level, they interact to form stable, non-reactive products, including alcohols, ketones, aldehydes, organic acids, and so forth. These products ultimately polymerize into macromolecular substances such as paint films, oil sludge, and other polymeric compounds. Throughout the chain reaction process, chain transfer and chain termination are in competition with each other. Specifically, when the rate of chain termination reactions is slower than that of chain transfer reactions, oxidation processes accelerate, and the converse is also true. The reaction equation for the chain termination stage is presented as follows:
The demanding operating conditions of wind turbines expedite the aforementioned free radical chain reaction through three primary mechanisms: thermally, the superimposition of high-temperature shocks and medium-temperature operations effectively initiates autocatalytic oxidation; mechanically, the application of high torque and shear forces induces the fragmentation of oil molecules into reactive species; chemically, the catalytic action of metal wear debris and condensed water on oxidation, coupled with the formation of a detrimental "oxidation-corrosion" cycle with acidic byproducts, culminates in the rapid degradation of the oil.
2.2. Experiment Materials and Equipment
2.2.1. Mobil SHC™ Gear Oil 320 WT
ISO VG 320 gear oil denotes an industrial gear oil with a central kinematic viscosity value of 320 mm2/s measured at 40℃, as specified by the viscosity classification standards of the International Organization for Standardization (ISO). This type of oil finds extensive application in heavy-duty industrial sectors, including wind power, mining, cement, and steel industries. Its primary function is to establish a sufficiently thick elastohydrodynamic lubrication film under conditions of medium to low speed and heavy load, thereby mitigating typical failure mechanisms such as tooth surface wear, micro-pitting, and scuffing [44].
Mobil SHC™ Gear Oil 320 WT is a fully synthetic polyalphaolefin (PAO) lubricant specifically developed by ExxonMobil for wind turbine gearboxes. This oil meets the IEC 61400-4 design standards for wind turbine gearboxes and is typically representative in industrial practice [45,46]. In this study, Mobil SHC™ Gear Oil 320 WT was selected as the experimental subject to investigate the electrochemical response characteristics during oxidative degradation. The main rationale is as follows:
In this research, Mobil SHC™ Gear Oil 320 WT was chosen as the experimental subject to carry out an experimental study on the electrochemical response characteristics during the oxidative degradation process. The primary justification is outlined as follows:
- (1)
- The broad operating temperature range of this oil product, spanning from -35℃ to 120℃, lays the foundational groundwork for conducting temperature gradient experiments as discussed in this paper.
- (2)
- This oil product employs a new-generation PAO base oil along with a specialized additive package. The consumption and transformation mechanism of the composite additive system during oxidation is relatively intricate, facilitating the investigation into the dynamic evolution patterns of electrochemical impedance spectroscopy response characteristics in relation to varying oxidation levels.
- (3)
- The outstanding oxidation stability, micro-pitting resistance, and demulsibility of this oil product offer a stable initial condition for research involving varied oxidation temperatures and extended oxidation durations.
2.2.2. Oxidation Characteristic Tester
The primary testing approaches for assessing the oxidation stability of gear oil encompass the rotary oxygen bomb method, oxidation tube test, DKA oxidation test, and high-temperature static oxidation test. Among these, the high-temperature static oxidation test stands out for its ability to more authentically replicate the prolonged, gradual oxidation process that gear oil undergoes under real-world operational conditions. This method effectively recreates the oxidative aging conditions encountered by wind turbine gearboxes operating under variable loads and across a broad temperature spectrum by continuously introducing air or oxygen at a predetermined temperature and incorporating a metal catalyst [47].
In this research, the high-temperature static oxidation testing approach was utilized to prepare gear oil samples with varying degrees of oxidation, with the objective of systematically investigating the intrinsic relationship between their oxidative degradation processes and electrochemical responses. The experimental apparatus employed is the KD-H1395 Lubricant Oxidation Characteristics Tester, produced by Katun Haecker Instrument Co., Ltd. (Changsha, China), as depicted in Figure 1 [48]. The KD-H1395 lubricant oxidation characteristic tester is engineered in compliance with SH/T 0123-93 and ASTM D2893 standards, specifically for assessing the oxidation stability of extreme-pressure lubricants. Utilizing either a metal bath or an oil bath for heating, this instrument achieves a precise temperature control accuracy of 150 ± 0.1℃. It is equipped with eight independent working units, enabling the simultaneous conduct of multiple parallel tests. The operational principle entails the continuous introduction of dry air at a constant pressure into the sample at a predetermined temperature over a continuous test duration of 312 hours. The oxidation stability of the oil is quantitatively characterized by measuring the increment in kinematic viscosity and alterations in the sedimentation value at 100℃ both before and after the test. This apparatus is well-suited for investigating the oxidation characteristics of extreme-pressure lubricants, such as those used in wind turbine gearboxes, thereby offering a standardized testing approach for evaluating the aging trajectory of lubricants.
2.2.3. Electrochemical Analyzer
In this research, the CHI60E4E electrochemical workstation (depicted in Figure 2), manufactured by Shanghai Chen Hua Instrument Co., Ltd., China, was employed to perform EIS broadband frequency sweep tests on oxidized oil samples. CHI60E4E integrates the functions of potentiostat and galvanostat, supports multiple electrochemical impedance spectroscopy testing techniques, and features high sensitivity and a wide frequency range, thus meeting the diverse needs of research on the electrochemical properties of lubricating oil systems. The principal technical parameters of this workstation are detailed in Table 1 [49].
Cyclic voltammetry (CV) entails the application of a cyclically varying potential to the working electrode, which induces the electroactive substance to undergo sequential reduction and oxidation reactions within a characteristic potential window, thereby generating Faraday currents and yielding a current-potential curve (cyclic voltammogram). Through the analysis of characteristic parameters, including peak potential, peak current, and peak potential difference, it is feasible to ascertain the reaction reversibility, reaction mechanism, and kinetic parameters [50,51]. In this research, CV is employed to characterize the electrochemical behavior of the gear oil/metal interface system, thereby providing fundamental electrochemical data for equivalent circuit modeling and the assessment of oxidative degradation extent.
2.3. Experimental Program Design
2.3.1. Oxidized Oil Samples Preparation
Accelerated oxidation test was carried out utilizing the KD-H1395 lubricant oxidation characteristic analyzer to generate a series of oil samples of Mobil SHC™ Gear Oil 320 WT under diverse combinations of oxidation temperatures and durations. The experimental steps are as follows:
(1) Following thorough agitation of the base oil, precisely measure the specified volume and transfer it into a clean glass test tube. Subsequently, introduce the processed metal catalyst (comprising a combination of copper and iron sheets) in accordance with standard protocols, ensuring complete immersion within the oil sample.
(2) Position the test tube within the instrument's heating bath, establish the ventilation pipeline connection, and calibrate the precision flow-meter to maintain a continuous flow of dry air into each test unit at the flow rate stipulated by the standard.
(3) Configure the target oxidation temperature on the control panel of the oxidation characteristic tester, and initiate timing upon achieving temperature stability.
(4) Sequentially extract the corresponding test tubes at predetermined time intervals, cease heating and aeration, and transfer the oil samples into sealed sample bottles after allowing them to cool naturally. Clearly indicate the oil type, oxidation temperature, oxidation duration, and parallel sample identifier.
(5) Upon completion of the experiment, categorize and store all prepared oxidized oil samples as standard specimens for electrochemical impedance spectroscopy testing, facilitating a systematic investigation into the evolution of electrochemical response characteristics of oils under varying degrees of oxidation.
During experimental operations, safety protocols must be strictly adhered to, ensuring that the gas pathways of each experimental unit are unobstructed and the gas flow rate remains consistent to avoid introducing additional errors due to uneven ventilation. Simultaneously, the oxidation time should be precisely controlled to the minute, and samples should be taken punctually to ensure the comparability of experimental data.
2.3.2. EIS Broadband-Frequency Sweep Experiment
To accommodate the high-impedance properties of Mobil SHC™ Gear Oil 320 WT, an oil impedance characteristic testing system was designed and fabricated utilizing the CHI60E4E electrochemical workstation, as depicted in Figure 3. A three-electrode configuration was employed to conduct EIS broadband frequency sweep measurements on oxidized oil specimens. The working electrode consisted of a steel electrode (10 mm in diameter, sequentially polished with 400#, 800#, and 1200# sandpaper prior to use, followed by ultrasonic cleaning with ethanol for 10 minutes and subsequent drying), the reference electrode was an Ag/AgCl electrode, and the counter electrode was a platinum plate electrode.
The steps of EIS broadband frequency sweep experiment are as follows:
- (1)
- Approximately 50 mL of the prepared oil sample should be taken and transferred into a dedicated test bottle. Subsequently, position the bottle in a precision digital constant-temperature oil bath (with a temperature fluctuation of ≤ ±0.2°C) and let it equilibrate for a minimum of 30 minutes prior to initiating the test, thereby eliminating any influence of temperature gradient on the impedance spectrum.
- (2)
- Testing was conducted utilizing a three-electrode system: the working electrode was submerged into the oil sample to an approximate depth of 5 mm, while the distance between the reference electrode and the working electrode was precisely maintained within the range of 2–3 mm.
- (3)
- To explore the influence of test temperature on the dielectric properties of oil products, multiple temperature gradients were set, covering the actual temperature range of wind turbine gear oil from shutdown room temperature to heavy-load operation. The tests were carried out sequentially from low to high temperatures. After measurements were completed at each temperature point, the oil bath was adjusted to the subsequent target temperature, and testing resumed following a 30-minute stabilization period for the oil sample.
- (4)
- EIS measurements were performed utilizing a CHI660E electrochemical workstation, with the principal parameter configurations set as follows: a frequency span of 0.01Hz to 1MHz, an excitation amplitude of 50mV, and 97 test points distributed evenly on a logarithmic scale. Nyquist diagram and Bode diagram were documented at each designated temperature point.
- (5)
- For each temperature condition, measurements are conducted in triplicate. Should the results demonstrate good consistency (with impedance spectra largely coinciding), the mean value is adopted as the final outcome. In the event of notable anomalies, the electrode condition and temperature stability are inspected prior to conducting the test again. All data are systematically classified and archived according to oil sample number, oxidation temperature, oxidation duration, and test temperature, facilitating subsequent equivalent circuit modeling and parameter extraction.
2.4. Equivalent Circuit Model
Equivalent Circuit Model (ECM) is a widely used method for analyzing impedance spectroscopy data [52]. ECM employs various electronic components and their combinations to construct specific circuit models, enabling the electrical system under investigation to exhibit response patterns similar to those of lubricating oils. This approach allows for the simulation of electrochemical behaviors and reaction processes within lubricating oils, and the extraction of electrochemical response parameters.
2.4.1. Randles Model
The Randles model is a widely adopted equivalent circuit model for interpreting impedance spectroscopy data of lubricating oils [53], encompassing two variants: one incorporating Warburg impedance (denoted as )) and the other excluding it (denoted as ), as depicted in Figure 4. The fundamental architecture of this model comprises base resistance , charge transfer resistance , double-layer capacitance , and Warburg impedance . Collectively, these components constitute an electrochemical signature employed to assess the electrical insulation properties, corrosion inhibition efficacy, aging condition, and additive action mechanisms of lubricating oils [54,55,56].
In Figure 4, reflects the hindering ability of lubricating oil to ionic current. A higher value indicates better insulation of the oil, purer base oil, and more evenly dispersed additives. reflects the ease of electrochemical corrosion reaction of the oil on metal surfaces. A higher value indicates a stronger ability of the oil film to inhibit charge transfer and prevent corrosion, and is a core indicator to measure its anti-corrosion performance. originates from a capacitor-like structure formed by the directional arrangement of polar molecules and ions at the oil-metal interface. Its change can sensitively indicate the aging, pollution, or additive adsorption/depletion of the oil product. reflects the mass-transfer process of electroactive substances within the diffusion layer at the lubricant/electrode interface, originating from the semi-infinite linear diffusion behavior of ions or molecules driven by concentration gradients. Its definition is provided as follows:
Where, is the Warburg impedance coefficient, with the unit being . is the imaginary unit and represents angular frequency.
2.4.2. Rs-(Rct//CPE) Model
Mobil SHC™ Gear Oil 320 WT employs high-purity PAO base oil, characterized by a highly ordered molecular structure and extremely low levels of polar impurities. It demonstrates exceptional anti-foaming and water separation capabilities, ensuring uniformity of the oil phase and excellent ion migration performance. The additives in this oil predominantly operate through interfacial adsorption and reaction mechanisms, effectively suppressing concentration polarization. Consequently, in the low-frequency range, the oil's behavior is primarily governed by charge transfer processes, with negligible diffusion effects and no discernible Warburg impedance features. Based on these observations, this research adopts the Randles model, excluding Warburg elements, for the analysis.
However, as gear oil experiences oxidative degradation, the polar oxides, insoluble substances, and particulate matter generated within the oil will adhere to the electrode surface, thereby increasing surface roughness and inducing non-uniform ion distribution. This, in turn, causes the electrical double layer to deviate from its ideal capacitive behavior, resulting in a frequency dispersion effect. To accurately characterize this non-ideal behavior, a constant phase element (CPE) is introduced as a substitute for pure capacitance, with its impedance expression presented in Equation (2):
Where, Q represents the admittance constant of CPE, and n denotes the dispersion index (). When , CPE degenerates into an ideal capacitor; when , it behaves as a pure resistor; and when , it typically reflects factors such as the roughness of the electrode surface, porosity, or uneven distribution of the adsorption layer. CPE can effectively characterize the capacitive dispersion behavior resulting from alterations in the surface state at the electrode/solution interface during the oxidative degradation process, thereby improving the fitting precision and enhancing the physical interpretability of ECM for experimentally measured EIS data.
Based on the aforementioned analysis, this research employs an equivalent circuit model, which comprises a fundamental resistance connected in series with a branch consisting of a charge transfer resistance in parallel with a CPE, denoted as , as illustrated in Figure 5. This model is utilized to conduct fitting analysis on the EIS spectra of gear oil at various stages of oxidative degradation. The ECM analysis software employed is ZView 2, and the fitting accuracy is quantitatively assessed using the coefficient of determination (R²) [57] for the impedance amplitude., as indicated in Equation (3).
Where, N denotes the total number of samples, with and representing the actual and predicted values of the i-th sample, respectively, and indicating the sample mean. The maximum value of R² is 1, and the closer R² approaches 1, the higher the fitting accuracy of the model.
3. Experiment Results and Analysis
3.1. Oil Samples at Different Oxidation Temperatures but with the Same Oxidation Time
High temperature represents the most pivotal external factor expediting the oxidative degradation of gear oil. In accordance with Arrhenius's law [58], the oxidation reaction rate approximately doubles with every 10°C rise in temperature. Elevated temperatures supply the requisite activation energy for the free radical chain reactions of base oil molecules, hastening both the chain initiation and chain propagation processes, while also facilitating the swift depletion of additives. In order to simulate the high-temperature degradation behavior of gear oil in wind turbines over a prolonged service period within a relatively short time-frame, this research established four high-temperature accelerated oxidation conditions at 90℃, 100℃, 110℃, and 120℃. Figure 6 illustrates the fresh oil sample of Mobil SHC™ Gear Oil 320 WT and the degraded oil samples after being oxidized for 50 hours at the above four temperatures, respectively.
3.1.1. EIS Spectrum
Figure 7 and Figure 8 respectively present the Nyquist and Bode diagrams for fresh oil and four oxidized oil samples.
In Figure 7, the Nyquist diagram for all oil samples display a single, symmetric capacitive semicircle, devoid of Warburg impedance or multiple relaxation features. This indicates that an elevation in oxidation temperature does not modify the homogeneous and single-relaxation-dominated characteristics of the gear oil electrochemical system, but instead results in a monotonic increase in the semicircle radius. The amplitude spectrum depicted in Figure 8(a) illustrates that the amplitudes of all oil samples coincide entirely within the frequency range of 1Hz to 10⁶Hz, and exhibit a linear and positive correlation with increasing oxidation temperature in the ultra-low frequency range of ≤1Hz. In the phase spectrum shown in Figure 8(b), the phase angles of all oil samples within the 10² ~ 10⁶Hz frequency range are approximately -90°, demonstrating ideal capacitive behavior with overlapping curves. Conversely, in the ultra-low frequency range of ≤1Hz, the phase angles demonstrate a linear and negative correlation with rising oxidation temperature, approaching 0° at elevated temperatures, indicative of ideal resistive behavior.
3.1.2. Electrochemical Characteristics
The crux of interpreting EIS data through equivalent circuits resides in the selection of an appropriate model that precisely mirrors the electrochemical response characteristics of lubricating oils and thoroughly delineates their behaviors and reaction mechanisms. In this research, the model was utilized to examine the electrochemical response of accelerated oxidation oil samples. To validate its efficacy, the model and model were additionally applied to analyze the identical dataset. The fitting outcomes of these three models are exhibited in Table 2.
Based on the analysis of the fitting results in Table 2, Mobil SHC™ Gear Oil 320 WT forms a lubricating film characterized by homogeneity, density, and a smooth interface. The dispersion effect at the electrode/solution interface is negligible, and the double-layer behavior closely approximates that of an ideal capacitor. Therefore, for fresh oil samples, the model demonstrates the optimal fitting performance. As the oxidation temperature rises, polar oxides, oil sludge, and gums progressively accumulate in the gear oil. These substances adsorb unevenly onto the electrode surface, resulting in increased interfacial roughness and non-uniform charge distribution, thereby generating a pronounced dispersion effect. Under such circumstances, the CPE provides a more precise description of this non-ideal interfacial behavior, allowing the model to exhibit superior fitting accuracy and more accurately simulate the electrochemical response during the oxidative degradation of the gear oil. Among the three models examined, the model exhibits the poorest fitting performance, further suggesting that on a clean electrode surface, the gear oil solely forms a physically adsorbed double-layer structure without any diffusion-controlled processes.
Figure 9 depicts the variation trends of four electrochemical fingerprint parameters, extracted based on the model, in relation to thermal oxidation temperature. To ensure numerical equilibrium, both and are represented in logarithmic form with a base of 10 in the figure.
According to the analysis of Figure 9, it can be known that as the oxidation temperature rises, each parameter undergoes a distinct monotonic change: decreases monotonically, with the most pronounced decline observed between new oil and oil oxidized at 90°C, suggesting that the slight enhancement in the oil sample's conductivity stems from the formation of a minor quantity of polar products at lower temperatures; increases monotonically, implying that a higher oxidation temperature results in a denser or thicker oxide product film on the electrode surface, thereby exerting a stronger inhibitory effect on charge transfer and enhancing the electrochemical stability of the interface. increases monotonically, albeit with a relatively minor magnitude, reflecting a slight augmentation in the equivalent capacitance of the interface; decreases monotonically while remaining close to 1, indicating that although high-temperature oxidation induces roughness and uneven charge distribution at the interface, the primary structure of the high-impedance oil film retains good insulation and structural integrity. The distribution of double-layer time constants remains relatively concentrated, approximating ideal capacitive behavior overall. Concurrently, as oxidation intensifies, the non-ideal characteristics of the interface (such as unevenness or microscopic roughness) gradually become more pronounced. Notably, when the oxidation temperature escalates from 110°C to 120°C, experiences a substantial increase, while n undergoes a precipitous decline. This abrupt transition signifies a turning point in the oxidation reaction kinetics within this temperature range, where a multitude of active sites are rapidly generated on the electrode surface, leading to the formation of a rougher and more heterogeneous oxide film structure. This, in turn, results in a dramatic surge in the equivalent capacitance of the interface and a marked enhancement in the dispersion effect of current distribution, manifesting in the electrochemical response as a concurrent jump in admittance constant and drop in dispersion index. Overall, the most prominent electrochemical response characteristic of high-temperature oxidation is the significant elevation in , indicating the high sensitivity of this parameter to the thermal oxidation process.
3.2. Oil Samples with Different Oxidation Times at the Same Oxidation Temperature
Oxidation time stands as one of the pivotal factors influencing the extent of oxidative degradation in gear oil. With the prolongation of oxidation time, base oil molecules continuously undergo radical chain reactions under the sustained influence of thermal oxidation, resulting in the gradual accumulation of oxidation products and a progressive decline in oil performance [59]. In this research, various oxidation time intervals—specifically, 50 hours, 75 hours, 100 hours, 125 hours, 150 hours, and 175 hours—were established to elucidate the evolving electrochemical response characteristics of Mobil SHC™ gear oil 320 WT throughout its transition from fresh oil to a state of advanced aging. Figure 10 illustrates the degraded oil samples subjected to varying oxidation times at oxidation temperature of 90℃.
3.2.1. EIS Spectrum
Figure 11 and Figure 12 illustrate the Nyquist and Bode diagrams, respectively, for six oil samples subjected to varying oxidation durations. As evident from the figures, the Nyquist diagram for all oil samples display a single, symmetric capacitive semicircle, suggesting that the oxidation duration has no impact on the dielectric response of gear oil, which is predominantly governed by a single relaxation process. As the oxidation duration extends from 50h to 175h, there is a consistent increase in the radius of the semicircle. In the Bode diagram, the amplitude spectra of the different oil samples largely coincide within the frequency range of 1Hz to 10⁶Hz, and exhibit a linear positive correlation with prolonged oxidation duration in the ultra-low frequency range of ≤1Hz. The phase spectra remain close to -90° and overlap within the frequency range of 10² ~ 10⁶Hz, whereas they demonstrate a linear negative correlation, decreasing towards 0° as the oxidation duration increases in the ultra-low frequency range of ≤1Hz.
3.2.2. Electrochemical Characteristics
Table 3 presents a summary of the fitting results obtained from three equivalent circuit models applied to oil samples subjected to varying oxidation times. Figure 13 depicts the variation trends of electrochemical fingerprint parameters extracted using the model as a function of oxidation time. As depicted in the figure, all parameters demonstrate a monotonic trend with prolonged oxidation time: exhibits a continuous decline, with the most pronounced decrease observed between the 50h and 75h intervals, suggesting that the accumulation of polar oxidation products enhances the system's conductivity; increases in an approximately linear and monotonic fashion, reflecting the ongoing thickening or densification of the oxide product film, which in turn intensifies the resistance to charge transfer and bolsters the electrochemical stability of the interface; rises linearly, albeit with a limited magnitude, indicating a slight increase in the equivalent capacitance of the interface; decreases linearly, signifying that the non-ideal characteristics of the interface (such as microscopic roughness and inhomogeneity) gradually intensify with extended oxidation time. In summary, under high-temperature oxidation conditions, the persistent and substantial increase in stands out as the most notable electrochemical feature, further corroborating its high sensitivity to thermal oxidation duration and serving as a pivotal electrochemical metric for assessing the extent of thermal oxidative degradation in gear oil.
3.3. The Influence of Temperature on ESI Testing
Temperature represents a pivotal environmental variable affecting the electrochemical response analysis of gear oil [60]. Using fresh oil as a case study, broadband frequency Sweep tests were performed across a range of temperatures, specifically 40℃, 50℃, 60℃, 70℃, 80℃, and 90℃, to comprehensively assess the influence of temperature on the outcomes of EIS measurements.
3.3.1. EIS Spectrum
Figure 14 and Figure 15 illustrate the Nyquist and Bode diagrams, respectively, of the fresh oil measured at various test temperatures. As observed from the diagrams, the Nyquist diagram display a single, symmetric capacitive semicircle, devoid of Warburg impedance or multiple relaxation features. This indicates that the gear oil preserves a homogeneous state, predominantly governed by single bulk relaxation, across the range of test temperatures. Furthermore, the radius of the semicircle exhibits a monotonic decrease as the test temperature rises. In the Bode diagram, the amplitude responses at high frequencies (10Hz–10⁶Hz) coincide entirely across all temperatures, with phase angles approximating -90°. Conversely, in the low-frequency domain (≤10Hz), the amplitude demonstrates a linear, negative correlation with increasing test temperature, while the phase angle shows a linear, positive correlation.
3.3.2. Electrochemical Characteristics
Table 4 presents a summary of the fitting results obtained from various equivalent circuit models applied to EIS spectra measured at different test temperatures. The data indicate that the model consistently demonstrates superior performance across all tested temperatures, suggesting that although variations in test temperature can induce changes in the electrochemical response, they do not affect the double-layer behavior of the new oil. Concurrently, the model exhibits fitting performance only marginally inferior to that of the former, maintaining a high degree of fitting accuracy and effectively capturing the electrochemical response characteristics of the new oil under varying test temperatures.

Table 5.
ECM fitting results for EIS data of fresh oil sample with different test temperatures.
| Test temperatures | |||
| 40℃ | 0.9902 | 0.9998 | 0.7923 |
| 50℃ | 0.9878 | 0.9991 | 0.7918 |
| 60℃ | 0.9876 | 0.9989 | 0.7898 |
| 70℃ | 0.9871 | 0.9990 | 0.7687 |
| 80℃ | 0.9877 | 0.9988 | 0.7684 |
| 90℃ | 0.9875 | 0.9987 | 0.7676 |
Figure 16 depicts the variation trends of electrochemical fingerprint parameters extracted using the Rs-(Rct//CPE) model as the test temperature rises. General, , , and all demonstrate a monotonic decline as temperature increases, whereas exhibits a monotonic rise. This suggests that elevated temperatures intensify ionic thermal motion and accelerate migration rates, consequently reducing ohmic resistance and charge transfer activation energy, and mitigating the interface's obstruction to charge transfer. Concurrently, the equivalent capacitance at the interface increases, and despite a slight decrease in , it remains near unity, indicating a marginal enhancement in non-ideal characteristics. Hence, it is clear that the testing temperature exerts a significant regulatory influence on electrochemical parameters. Notably, in contrast to the trend where increased oxidation results in a higher , a temperature rise leads to its decrease, highlighting the facilitating effect of temperature on charge transfer. This temperature dependency offers a crucial reference baseline for the electrochemical diagnosis of oil products across various operational conditions.
4. Discussion
4.1. Mechanism Analysis of Experimental Phenomena
A comprehensive analysis of the experimental results demonstrates that the high-temperature oxidative degradation behavior of gear oil in wind turbines exhibits a high degree of consistency with its EIS response. As the oxidation temperature rises or the oxidation duration lengthens, the radius of the capacitive reactance arc in the Nyquist plot increases monotonically. This phenomenon is attributed to the progressive adsorption, thickening, and densification of polar products on the electrode surface, which in turn elevate the charge transfer resistance and reinforce physical barriers. The presence of a single, symmetric semicircle indicates that the system remains homogeneous throughout, without undergoing phase separation. The Bode plot further elucidates disparities in the reaction stages: within the mid-to-high frequency range (10²~10⁶ Hz), the phase angle approximates -90°, and the amplitudes overlap, reflecting ideal capacitive behavior and suggesting that the polar products have not yet modified the intrinsic dielectric properties. Conversely, in the ultra-low frequency range (≤1 Hz), the amplitude increases linearly, and the phase angle shifts from -90° towards 0°, indicating that the interfacial film progressively governs the slow relaxation process. Equivalent circuit fitting corroborates the gradual transition from capacitive-dominated to resistive-dominated behavior, with more thorough oxidation bringing the interfacial behavior closer to that of pure resistance. Temperature and time, as pivotal external factors, respectively facilitate the entire process—from chain initiation and chain growth to product accumulation and film formation—by supplying activation energy and extending the reaction window. In conclusion, EIS enables the decomposition of complex aging processes into quantifiable interfacial responses: mid-to-high frequencies mirror intrinsic capacitance, whereas ultra-low frequencies are sensitive to film growth and resistance variation behavior. The decoupling capability of this frequency range confers EIS with the advantages of clarity, high sensitivity, and in-situ non-destructive monitoring, thereby providing a robust physicochemical foundation for the quantitative assessment of gear oil oxidation degree and the prediction of remaining life based on electrochemical parameters such as charge transfer resistance.
4.2. Electrochemical Characterization of Oxidation Mechanism
In this research, the improved Randles model (Rs-(Rct//CPE)) was employed to fit the electrochemical impedance spectroscopy (EIS) data, thereby constructing an electrochemical fingerprint parameter system for characterizing the degradation state of gear oil. Each parameter exhibits differentiated response characteristics to the oxidative degradation process of gear oil:
(1) indicates the ionic conductivity of the oil sample, a property governed by the concentration of polar oxidation products. During the initial oxidation phase, even trace amounts of polar molecules can precipitate a marked reduction in . This pronounced decline renders a highly sensitive early warning indicator for detecting the onset of the reaction. Nevertheless, as aging progresses, the rate of decrease diminishes along with its sensitivity, thereby restricting its practical utility primarily to assessments made during the initial stage.
(2) serves as a metric for the ease of charge transfer at the electrode/oil sample interface, and is directly affected by the thickness and density of the interfacial film. With an increase in oxidation temperature or an extension of oxidation time, demonstrates a monotonic, nearly linear growth, directly reflecting the cumulative effect of radical chain reactions and effectively quantifying variations in the thickness of the interfacial film. Consequently, not only stands as a pivotal indicator for assessing the extent of oxidation but also functions as a fundamental parameter for establishing aging kinetic models, predicting residual lifespan, and determining oil change thresholds, thereby assuming paramount importance in engineering monitoring.
(3) is equivalent to the interfacial capacitance and is correlated with the double-layer capacitance as well as the dielectric characteristics of the film. As oxidation progresses, exhibits a monotonic increase with a relatively small magnitude, potentially attributable to an elevation in the dielectric constant or a reduction in the effective thickness. alone should not be employed as a criterion for oxidation assessment; however, when utilized in conjunction with , it can aid in elucidating the mechanism underlying interfacial film alterations and offer supplementary insights.
(4) characterizes the degree to which a component deviates from an ideal capacitor, with approaching 1 indicating that the interface behavior tends towards that of an ideal capacitor. For new oil and lightly oxidized oil samples, is close to 1, indicating a smooth and uniform interface; as oxidation deepens, monotonically decreases but still remains close to 1, reflecting the introduction of microscopic heterogeneity into the film layer and an increase in surface roughness. The variation of is limited, making it unsuitable as the primary criterion, but it can serve as an auxiliary indicator of interface degradation. When combined with and , it provides a more comprehensive characterization of interface evolution.
It is noteworthy that, in this research, leveraging the electrochemical characteristics of Mobil SHC™ gear oil 320 WT, the model was utilized to analyze the EIS Broadband-frequency sweep data, yielding a relatively satisfactory fitting effect. Nevertheless, in the industrial field applications involving wind turbine gearboxes, variables such as gear oil type, additive formulation, deployment strategy of the EIS monitoring unit, and ambient environmental conditions can all exert an influence on the impedance response. Consequently, it becomes imperative to develop a more rational equivalent circuit model that aligns with the actual engineering conditions. Taking, for instance, EIS monitoring conducted via an insertion sensor, oxidation aging byproducts may accumulate to form a heterogeneous film on the sensor probe's surface. The interfacial reaction between this film and the oil will then introduce supplementary polarization processes characterized by distinct kinetic properties. To address this scenario, an additional set of RC parallel circuits (or R//CPE branches) should be incorporated in series with the original model to accurately depict this supplementary interfacial behavior, thereby facilitating the acquisition of more comprehensive electrochemical fingerprint information and enabling a thorough characterization of the oil degradation state.
5. Conclusions and Prospects
This research centers on Mobil SHC™ Gear Oil 320 WT. Through accelerated oxidation experiments, oil samples with different oxidation levels were prepared and subjected to EIS broadband-frequency sweep tests. This approach systematically unveiled the evolution patterns of the EIS of gear oil in response to varying oxidation temperatures and durations. Furthermore,the impact of ambient temperature on the outcomes of EIS measurements was examined. Building upon these findings, an electrochemical fingerprint was developed using equivalent circuit modeling for the purpose of monitoring and assessing the oxidative degradation of gear oil. This fingerprint establishes a direct link between electrochemical response signals and the physicochemical processes underlying the performance deterioration of gear oil, thereby significantly enhancing the thoroughness and reliability of condition diagnosis.
It is important to note that this study has preliminarily verified the considerable potential of combining Electrochemical Impedance Spectroscopy (EIS) technology with the Equivalent Circuit Model (ECM) method for monitoring oxidative degradation and assessing deterioration in wind turbine gear oil. This verification was achieved through the preparation of oxidatively degraded oil samples and frequency sweep experiments conducted under limited conditions. To facilitate the transition of this method from theoretical research to practical engineering applications, extensive systematic experiments must be carried out in subsequent research. On the one hand, it is essential to establish a standardized database that includes various deterioration modes and mixed pollution conditions, encompassing a range of temperatures, oxidation levels, and base oil/additive systems. On the other hand, further investigation is required into the interaction patterns among various electrochemical parameters when multiple deterioration modes coexist, with the aim of enhancing the engineering applicability and reliability of this method.
Author Contributions
Conceptualization, M.W. and G.Q.; methodology, M.W. and G.Q.; validation, M.W. and G.Q.; investigation, M.W. and M.L.; data curation, M.W. and M.L.; writing—original draft preparation, M.W.; writing—review and editing, M.W. and G.Q.; supervision, M.L. All authors have read and agreed to the published version of the manuscript.
Funding
This research is funded by the National Key R&D Program (2022YFF0608700), the Open Fund of the National Key Laboratory for Offshore Wind Power Equipment and High-Efficiency Utilization of Wind Energy (HFQZS2025-06), and the Scientific Research Startup Fund for High-Level Talents of Shandong Xiehe University (SDXHQD2025044).
Data Availability Statement
Data are contained within the article.
Conflicts of Interest
The authors declare no conflicts of interest.
References
- Meng, D.B.; Nie, P.; Yang, S.Y.; Su, X.Y.; Liao, C.B. Reliability analysis of wind turbine gearboxes: past, progress and future prospects. Int. J. Struct. Integr. 2025, 16, 4–38. [Google Scholar] [CrossRef]
- Zhang, M.; Wei, J.J.; Sui, Z.L.; Xu, K.; Yuan, W.Y. Temperature prediction and fault warning of high-speed shaft of wind turbine gearbox based on hybrid deep learning model. J. Mar. Sci. Eng. 2025, 13, 1137. [Google Scholar] [CrossRef]
- Guan, S.; Li, J.N.; Shi, M.Y. Research on wind turbine gearbox fault diagnosis method based on multi-kernel wavelet denoising network and contrastive learning. Measurement 2026, 257, 118982. [Google Scholar] [CrossRef]
- IEA. Wind energy report 2023. In International Energy Agency; 2023. [Google Scholar]
- Peng, H.; Li, S.Y.; Shangguan, L.J.; Fan, Y.S.; Zhang, H. Analysis of wind turbine equipment failure and intelligent operation and maintenance research. Sustainability 2023, 15, 8333. [Google Scholar] [CrossRef]
- Han, H.H.; Zhao, Y.; Jiang, H.; Chen, M.X.; Zhou, S.; Lin, Z.H.; Wang, X.; Mao, B.M.; Yang, X.Y.; Li, Y.C. A novel diagnosis methodology of gear oil for wind turbine combining Stepwise multivariate regression and clustered federated learning framework. Sci. Rep. 2025, 6 15, 22841. [Google Scholar]
- Liu, M.Y.; Bayer, G.; Reimers, M.; Schünemann, W.; König, F.; Jacobs, G.; Schelenz, R.; Bader, N.; Poll, G.; Marian, M. Towards lifetime lubrication of wind turbine gearboxes: Technical and physical investigations on used oils. Wear 2025, 571, 205760. [Google Scholar] [CrossRef]
- Pu, C.G.; Kang, Z.; Hai, Y. Analysis of the wind power gear oil during operation. Synth. Lubr. 2024, 51, 22–25. [Google Scholar]
- Liu, J.X.; Wang, S.Y.; Chen, L.; Yang, C.; Liu, H.L. Analysis of the status of wind turbine oil in gearbox. Lubr. Oil 2024, 39, 17–20. [Google Scholar]
- Guo, X.Y.; Hu, Z.L.; Zhang, B.; Yuan, X.N.; Jin, J.R. State maintenance of the gearbox wind turbines based on oil detection and endoscopic inspection. Lubr. Eng. 2025, 50, 181–186. [Google Scholar]
- Sheng, C.X.; Hu, A.Q.; Wu, D.H.; Liu, D.; Rao, X. The influence of deterioration of physical and chemical properties of lubricating oil on tribological properties. Lubr. Eng. 2025, 50, 8–14. [Google Scholar]
- Bo, Y.F.; Zeng, X.J.; Yang, M.; Zhu, Y. Anomaly detection for wind turbine gearbox oil pressure difference based on SCADA data. IOP Conf. Ser. Earth Environ. Sci. 2019, 354, 012115. [Google Scholar] [CrossRef]
- DU, J.Y.; Cao, Z.; Ren, X.; Liu, J.C.; Wang, Q.T.; Wang, Y.J. Indicator analysis and localization research of lubricating oil for wind turbine gearbox. Therm. Power Gener. 2025, 54, 42–50. [Google Scholar]
- Chetteti, R.R.; Sweta, K.; Janapatla, P. Entropy optimization in multigrade motor oil based nanofluid: a spectral and sensitivity analysis with particle shape and dispersion effects. Int. J. Numer. Methods Heat Fluid Flow 2024, 34, 3659–3683. [Google Scholar] [CrossRef]
- Zhang, H.C.; Liu, Y.P.; Chen, Q. Analysis and research on oil injection lubrication of variable tooth thickness gear based on CFD method. Appl. Sci.-Basel 2025, 15, 45–41. [Google Scholar]
- Ge, C.H.; Liu, Y.J.; Chen, M.S.; Yang, C.; Liang, P.P.; Yao, Z.X.; Zhang, K. Prediction of wind turbine lubricating oil’s acid value by ordinary least square method based on attenuated total reflectance- fourier transform infrared spectroscopy through higher- order derivative combined with angular metric. Chin. J. Anal. Chem. 2024, 52, 1254–1265. [Google Scholar]
- Liu, L.X.; Huang, H.T.; Mandelis, A.; Shao, X.P. Multiple dissolved gas analysis in transformer oil based on fourier transform infrared photoacoustic spectroscopy. Spectrosc. Spectr. Anal. 2020, 40, 684–687. [Google Scholar]
- Zhang, S.J.; Gu, L.Z.E.; Meng, M.; Zhang, X.J. Evaluation of semi-synthetic lubebase oil’s oxidative stability by rotating pressure vessel method. Petrochem. Technol. Appl. 2022, 40, 20–22. [Google Scholar]
- Chokelarb, W.; Sriprom, P.; Permana, L.; Assawasaengrat, P. Assessment of overall remaining useful life of lubricants by integrating oil quality and performance. Heliyon 2024, 18, e37486. [Google Scholar] [CrossRef]
- Lei, L.; Zhang, G.R.; Li, Cheng. Prediction of lubrication oil life for electric vehicle reducer based on arrhenius equation. Pet. Process. Petrochem. 2023, 54, 125–130. [Google Scholar]
- Delahay, P. New Instrumental methods in electrochemistry. J. Electrochem. Soc. 1955, 102, 46–47. [Google Scholar] [CrossRef]
- Mansfeld, F.; Jeanjaquet, S.L.; Kendig, M.W. An electrochemical impedance spectroscopy study of reactions at the metal/coating interface. Corros. Sci. 1986, 26, 735–742. [Google Scholar] [CrossRef]
- Zhu, P.F.; Yu, Y.; Shi, Y.R.; Yang, H.; He, Y.; Xu, F.; Jiang, L.H.; Chu, H.Q.; Xu, T.L.; Xu, N. Pore structure evolution of limestone powder hardened cement slurry based on electrochemical impedance spectroscopy. Bull. Chin. Ceram. Soc. 2024, 43, 35–43. [Google Scholar]
- He, Z.F.; Tao, Y.Z.; Hu, Y.G.; Wang, Q.C.; Yang, Y. Machine learning-enhanced electrochemical impedance spectroscopy for lithium-ion battery research. Energy Storage Sci. Technol. 2024, 13, 2933–2951. [Google Scholar]
- Liu, X.G. Exploration of application of electrochemical impedance spectroscopy technology in durability testing of high-performance concrete. Sci. Technol. Information. 2024, 22, 182–184. [Google Scholar]
- Lvovich, V.F.; Smiechowski, M.F. Impedance characterization of industrial lubricants. Electrochimica Acta 2006, 51, 1487–1496. [Google Scholar] [CrossRef]
- Engmarksgaard, M.E. Electrical impedance spectroscopy for use in oil quality assessment. Master’s Thesis in Physics and Technology, University of Southern Denmark, June 2021. [Google Scholar]
- Delgado, E.; Aperador, W.; Hernandez, A. Impedance spectroscopy as a tool for the diagnosis of the state of vegetable oils used as lubricants. Int. J. Electrochem. Sci. 2015, 10, 8190–8199. [Google Scholar] [CrossRef]
- Huang, C.H.; Hu, J.M.; Liu, X.B.; Song, C.G.; Cai, J.G.; Shan, F.J. Experimental study on impedance characteristics of oil/water in two-phase flow. Pet. Instrum. 2012, 26, 49–51. [Google Scholar] [CrossRef]
- Liu, H.T.; Tang, X.C.; Lu, H.; Xie, W.G.; Hu, Y.M.; Xue, Q.N. An interdigitated impedance microsensor for detection of moisture content in engine oil. Nanotechnol. Precis. Eng. 2020, 3, 75–80. [Google Scholar] [CrossRef]
- Wang, S.S.; Lee, H.S. The application of AC impedance technique for detecting glycol contamination in engine oil. Sens. Actuators 1997, B40, 193–197. [Google Scholar] [CrossRef]
- Zhang, G.X.; Liu, J.; Yan, S.B.; Zhang, F. Research on the eis sensor based online monitoring system for the sealing state of finishing mill roll box. Metall. Power 2020, 2, 68–71. [Google Scholar]
- Zhu, X.L.; Du, L.; Liu, B.D.; Zhe, J. A microsensor array for quantification of lubricant contaminants using a back propagation artificial neural network. J. Micromechanics Microengineering 2016, 26, 065005. [Google Scholar] [CrossRef]
- Zhang, F.; Zhao, X.; He, J.C. A novel electrochemical impedance spectroscopy sensor for on-line measurement of water content in oil. Lubr. Eng. 2011, 5, 116–118. [Google Scholar]
- Liu, M.L.; Wang, Z.H. Research on the application characteristics of electrochemical impedance spectroscopy oil condition sensor. Lubr. Eng. 2024, 49, 203–208. [Google Scholar]
- Chowdhury, S.R.; Kumar, R.; Kaur, R. Quality assessment of engine oil: an impedance spectroscopy based approach. 2016 IEEE Uttar Pradesh Section International Conference on Electrical, Computer and Electronics Engineering, 2016. [Google Scholar]
- Zabara, M.A.; Katırcı, G.; Ülgüt, B. Non-linear harmonics in EIS of batteries with lithium anodes: proper controls and analysis. Electrochimica Acta 2022, 429, 140969. [Google Scholar] [CrossRef]
- Zhang, X.J.; Huang, X.; Li, J.; Tang, Z.P.; Wang, J.B. Thermal oxidation of aviation lubricating oil: mechanism, influencing factors, evaluation methods, and antioxidants. Asia-Pac. J. Chem. Eng. 2024, 19, e3114. [Google Scholar] [CrossRef]
- Wu, N.; Zong, Z.M.; Fei, Y.W.; Ma, J.; Guo, F. Thermal oxidation stability of poly-α-olefin lubricating oil. Asia-Pac. J. Chem. Eng. 2017, 12, 813–817. [Google Scholar] [CrossRef]
- Wu, N.; Zong, Z.M.; Fei, Y.W.; Ma, J. Studies on thermal oxidation stability of aviation lubricating oils. EPD Sci. 2017, 114, 02002. [Google Scholar] [CrossRef]
- Yao, T.; Hao; J.T. Guo, L. The relationship between structure and property about poly-α-olefin aviation lubricating base oil at high temperature condition. Lubr. Eng. 2016, 41, 91–95,106. [Google Scholar]
- Oscar, L.A.; Marie, H.R.; Corinne, L.B. Characterization of base oil and additive oxidation products from formulated lubricant by ultra-high resolution mass spectrometry. Lubricants 2023, 11, 345. [Google Scholar] [CrossRef]
- Saїd, A.E.; Mekelleche, S.M. Antioxidant activity of trolox derivatives toward methylperoxyl radicals: thermodynamic and kinetic theoretical study. Theor. Chem. Acc. 2021, 140, 128. [Google Scholar] [CrossRef]
- 360 Baike - Gear oil. Available online: https://baike.so.com/doc/3517572-3700099.html (accessed on 20 March 2026).
- 360 Baike - Mobil Gao 320 Gear Oil. Available online: https://baike.so.com/doc/7082410-7305322.html (accessed on 20 March 2026).
- ExxonMobil. Mobil SHC™ Gear 320 WT Advanced Turbine Gear Oil Now Approved for Use in GE Wind Turbines Worldwide. In Business Wire (English); 2019. [Google Scholar]
- Chen, Z.Z.; Zhang, Y.; Liu, J.; Duan, K.H.; Liang, Y.L. Research on the oxidation stability of synthetic base oil by different evaluation methods. Pet. Refin. Eng. 2025, 55, 57–60. [Google Scholar]
- Instruction Manual for KD-H1395 Lubricant Oxidation Characteristic Tester. Available online: https://fanyi.baidu.com/mtpe-individual/transText?query=Instruction (accessed on 20 March 2026).
- CHI Electrochemical Workstation User Manual. Available online: https://fanyi.baidu.com/mtpe-individual/transText?User (accessed on 20 March 2026).
- Ardila-Rey, J.; González, D.S.; Muñoz, D.N. Electrochemical fingerprinting of dielectric oil via cyclic voltammetry to characterize thermal and electrical faults in power transformers. Measurement 2026, 258, 119457. [Google Scholar] [CrossRef]
- Agarwa, R. A Corrected Gileadi Method for Accurate determination of standard rate constants from cyclic voltammetry. J. Electroanal. Chem. 2026, 1002, 119750. [Google Scholar]
- Plank, C.; Rüther, T.; Jahn, L.; Schamel, M.; Schmidt, J.P.; Ciucci, F.; Danzer, M.A. A Review on the distribution of relaxation times analysis: a powerful tool for process identification of electrochemical systems. J. Power Sources 2024, 261, 233845. [Google Scholar] [CrossRef]
- Adeleke, Maradesa.; Baptiste, P.; Emanuele, Q.; Francesco, C. The Probabilistic deconvolution of the distribution of relaxation times with finite gaussian processes. Electrochimica Acta 2022, 413, 140119. [Google Scholar] [CrossRef]
- Yang, G.; Wang, Q.L.; Zhuo, W.Y.; Li, G.; Niu, Y.H.; Li, G.X. Oxidation of lubricating oil and its influence on the aging behaviors of fluorine rubber. J. Appl. Polym. Sci. 2023, 140, e53402. [Google Scholar]
- Cao, C.N.; Zhang, J.Q. Introduction to electrochemical impedance spectroscopy, 1st ed.; Science Press: Beijing, China, 2017; pp. 20–24. [Google Scholar]
- Shi, M.L. AC impedance spectroscopy principles and applications, 1st ed.; National Defense Industry Press: Beijing, China, 2007; pp. 52–61. [Google Scholar]
- Wang, M.; Qin, G.J.; Liao, Y.F. Fault feature extraction method of diesel engine cylinder based on AWMMD. J. Vib. Shock. 2023, 42, 333–340. [Google Scholar]
- Wang, M.; Qin, G.J.; Zheng, H.; Tan, G.; Qin, Z.X.; Zhu, M.X. Design and application of oil online monitoring system based on EIS sensor and WLAN. 2025 International Conference on Equipment Intelligent Operation and Maintenance (ICEIOM), 2025. [Google Scholar]
- Wang, J.; Wang, M.; Qin, G.J.; Zhang, X.F. Research on the prediction method of lubricating oil degradation based on electrochemical impedance monitoring. Processings of the 3rd International Conference on Sensing, Measurement, Communication and Internet of Things Technologies (SMC-IoT), 2024. [Google Scholar]
- Qin, G.J.; Yu, Y.Z.; Wang, M.; Zhang, X.F. Temperature compensation of lubricating oil impedance based on random forest regression. 2024 International Conference on Sensing, Measurement & Data Analytics in the era of Artificial Intelligence (ICSMD), 2024. [Google Scholar]
Figure 1.
KD-H1395 lubricant oxidation characteristics tester.
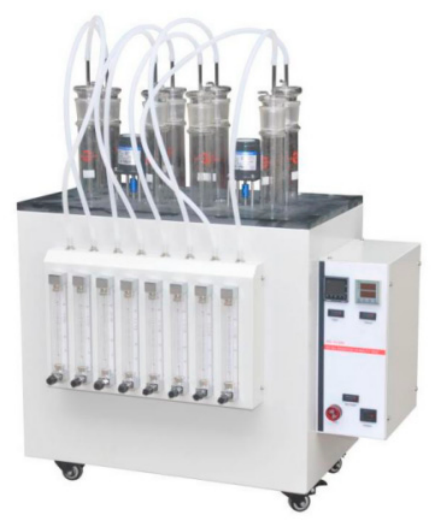
Figure 2.
CHI60E4E electrochemical workstation.
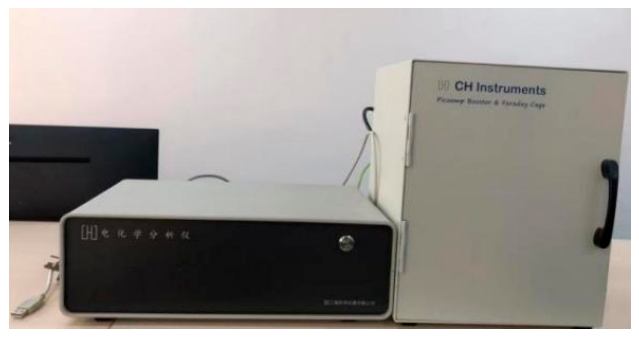
Figure 3.
Structural diagram of oil impedance characteristic testing system.
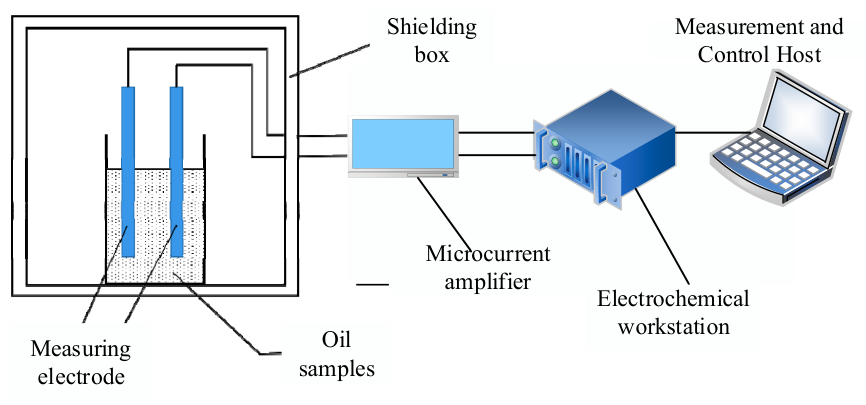
Figure 4.
Schematic diagram Randles model. (a) ; (b) .
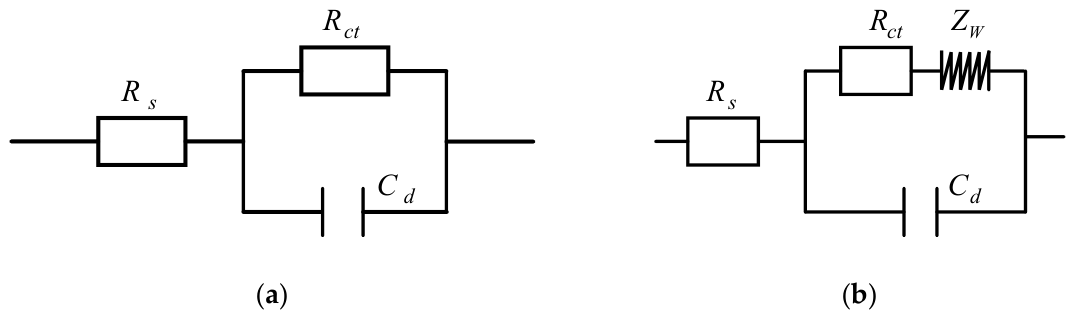
Figure 5.
Schematic diagram of model.
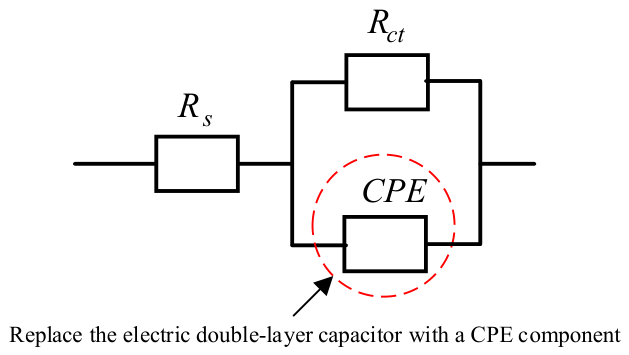
Figure 6.
Fresh oil and four types of high-temperature oxidized oil samples. (a) Fresh oil; (b) 90℃-oxidized oil; (c) 100℃-oxidized oil; (d) 110℃-oxidized oil; (e) 120℃-oxidized oil.
Figure 6.
Fresh oil and four types of high-temperature oxidized oil samples. (a) Fresh oil; (b) 90℃-oxidized oil; (c) 100℃-oxidized oil; (d) 110℃-oxidized oil; (e) 120℃-oxidized oil.
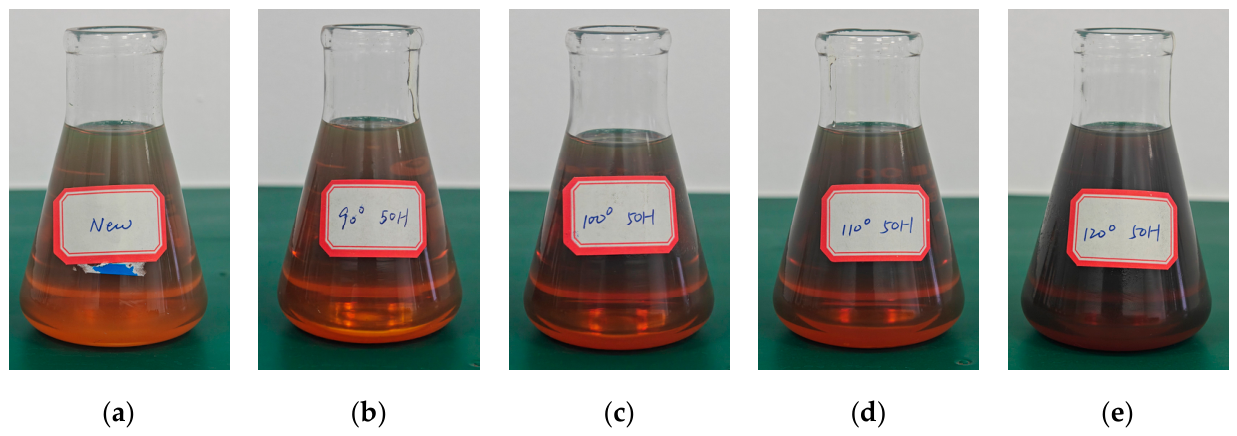
Figure 7.
Nyquist diagram of oil samples at different oxidation temperatures.
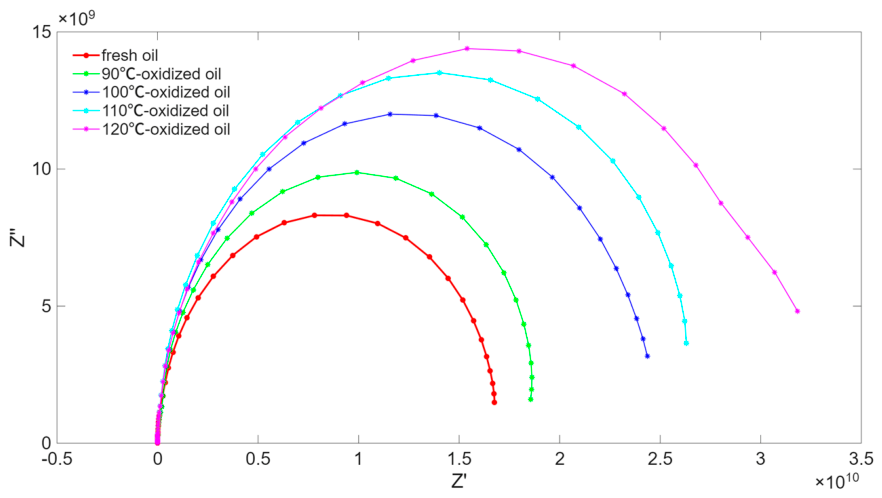
Figure 8.
Bode diagram of oil samples at different oxidation temperatures.
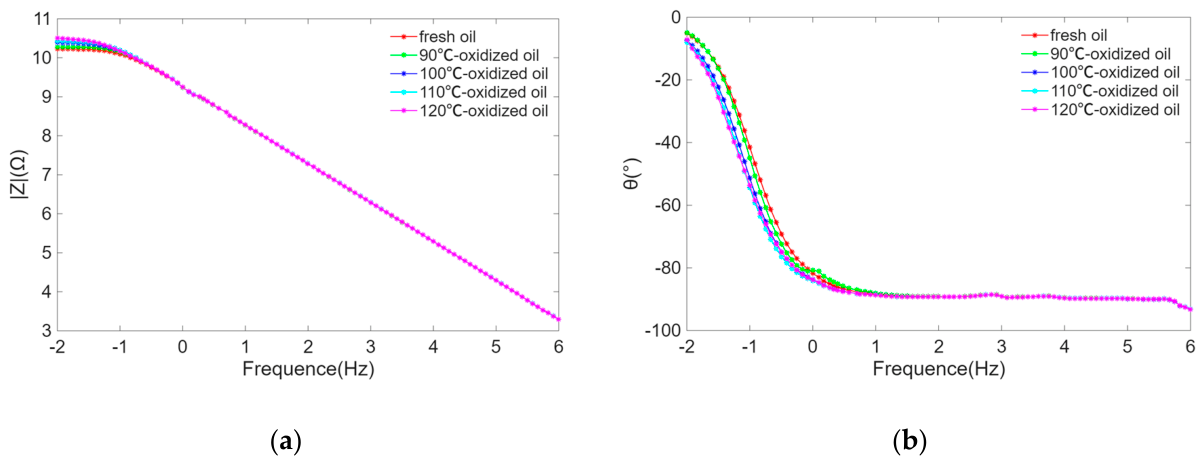
Figure 9.
Electrochemical characteristics of oil samples at different oxidation temperatures. (a) Base resistance; (b) Charge transfer resistance; (c) CPE admittance constant; (d) CPE dispersion index.
Figure 9.
Electrochemical characteristics of oil samples at different oxidation temperatures. (a) Base resistance; (b) Charge transfer resistance; (c) CPE admittance constant; (d) CPE dispersion index.
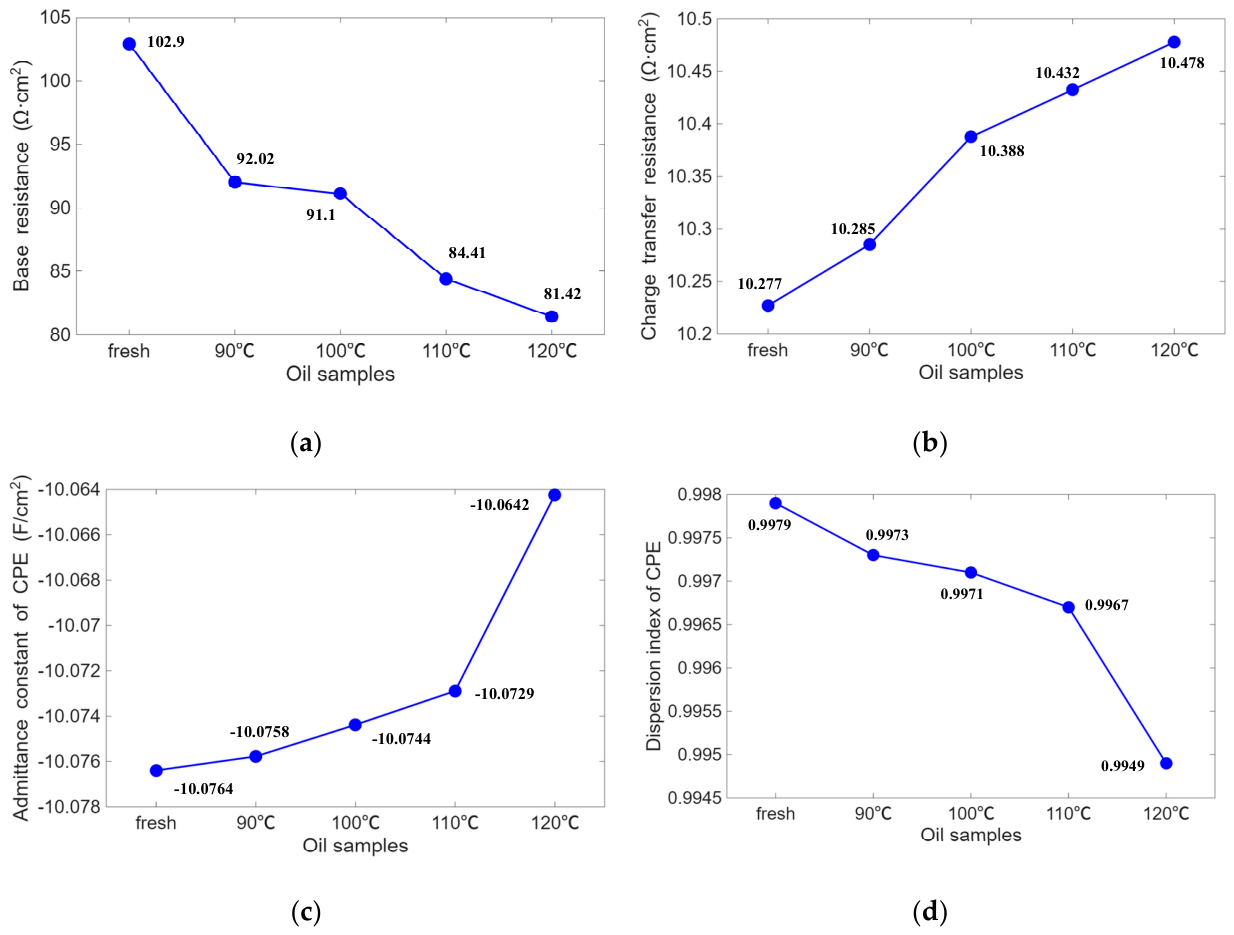
Figure 10.
Oil samples subjected to varying oxidation times at oxidation temperature of 90℃. (a) 50h-oxidized oil; (b) 75h-oxidized oil; (c) 100h-oxidized oil; (d) 125h-oxidized oil; (e) 150h-oxidized oil; (f) 175h-oxidized oil.
Figure 10.
Oil samples subjected to varying oxidation times at oxidation temperature of 90℃. (a) 50h-oxidized oil; (b) 75h-oxidized oil; (c) 100h-oxidized oil; (d) 125h-oxidized oil; (e) 150h-oxidized oil; (f) 175h-oxidized oil.
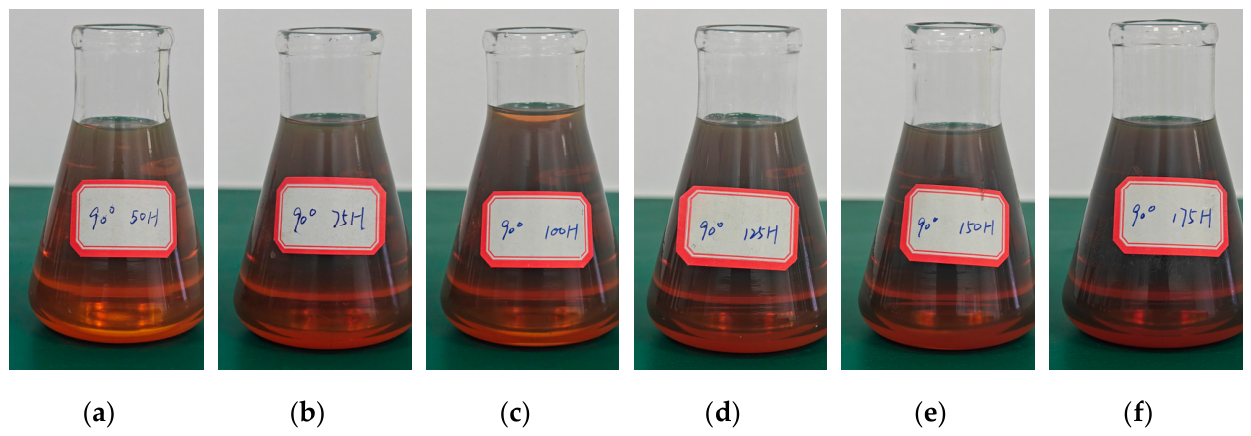
Figure 11.
Nyquist diagram of oil samples with different oxidation times.
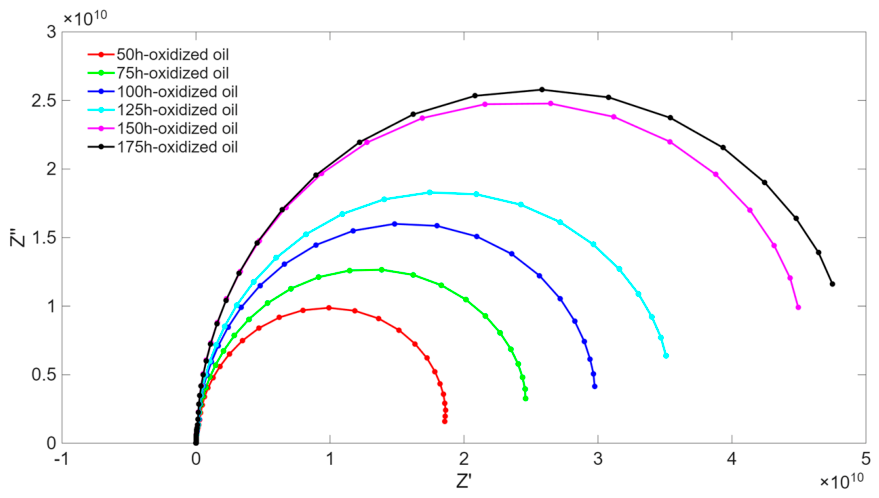
Figure 12.
Bode diagram of oil samples with different oxidation times.
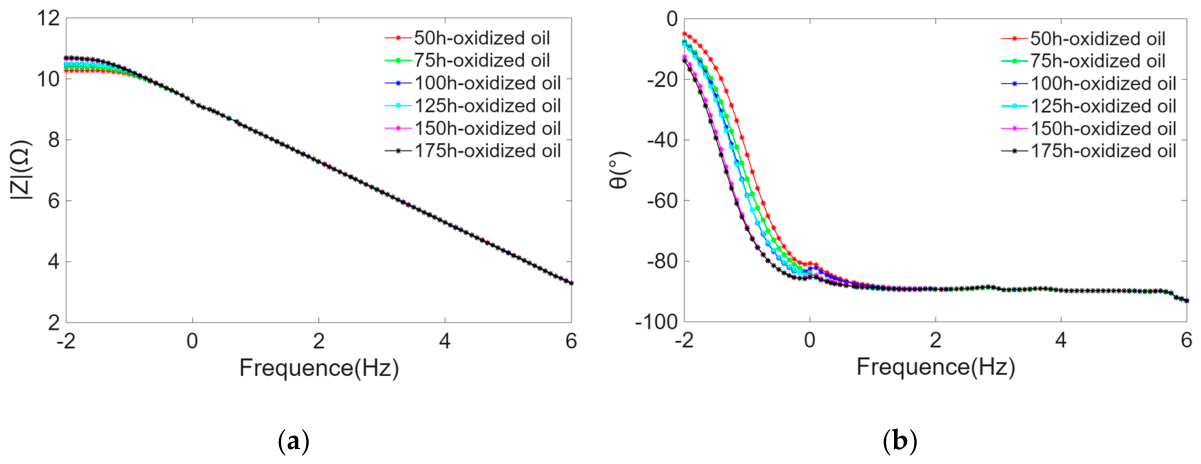
Figure 13.
Electrochemical characteristics of oil samples with different oxidation times. (a) Base resistance; (b) Charge transfer resistance; (c) CPE admittance constant; (d) CPE dispersion index.
Figure 13.
Electrochemical characteristics of oil samples with different oxidation times. (a) Base resistance; (b) Charge transfer resistance; (c) CPE admittance constant; (d) CPE dispersion index.
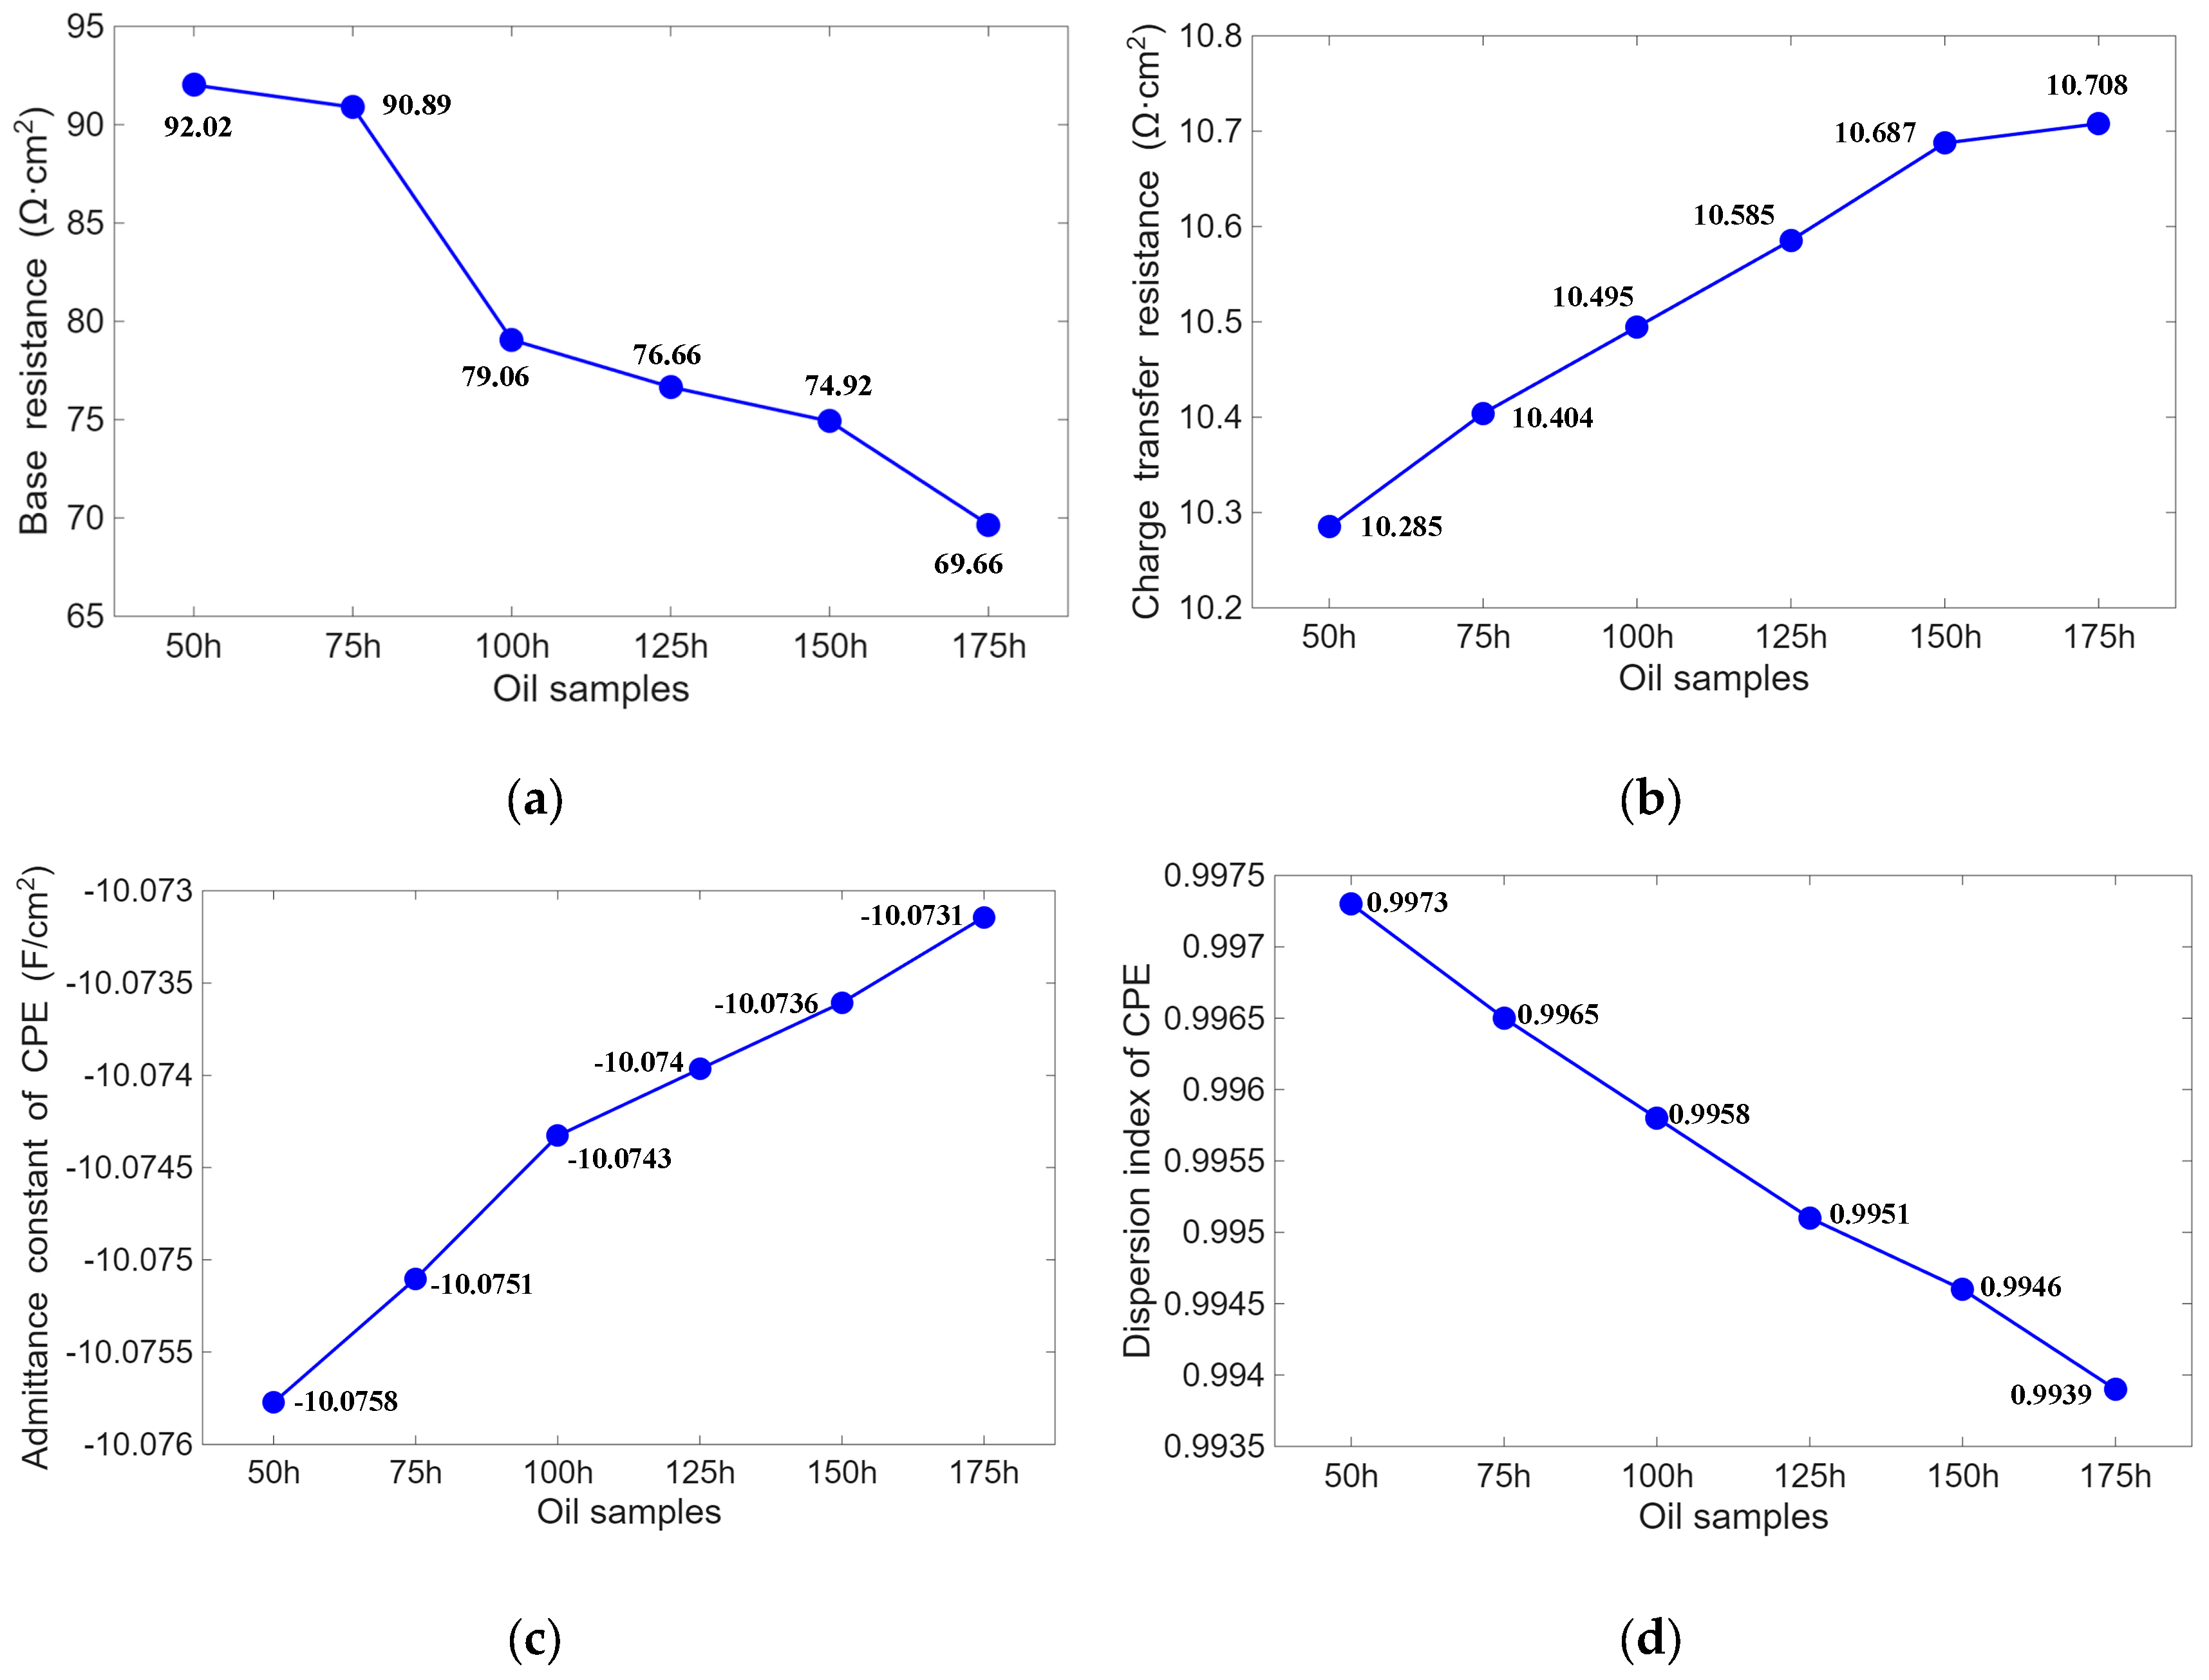
Figure 14.
Nyquist diagram of fresh oil at different test temperatures.
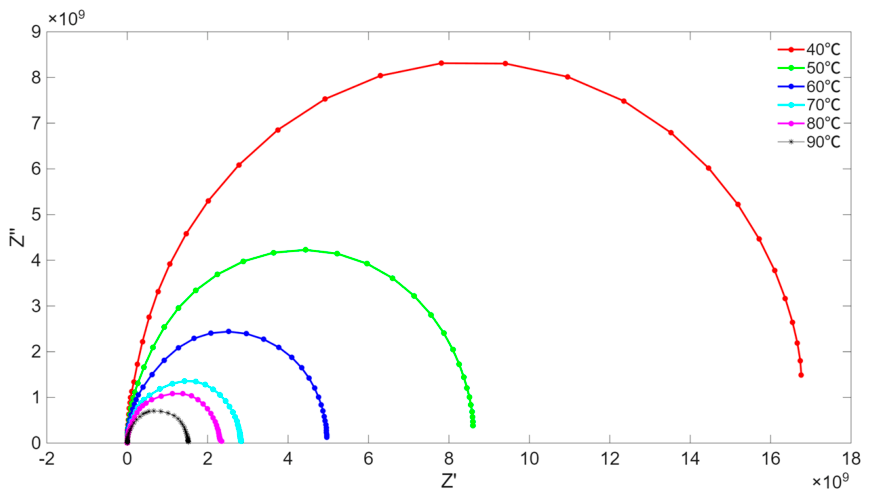
Figure 15.
Bode diagram of of fresh oil at different test temperatures.
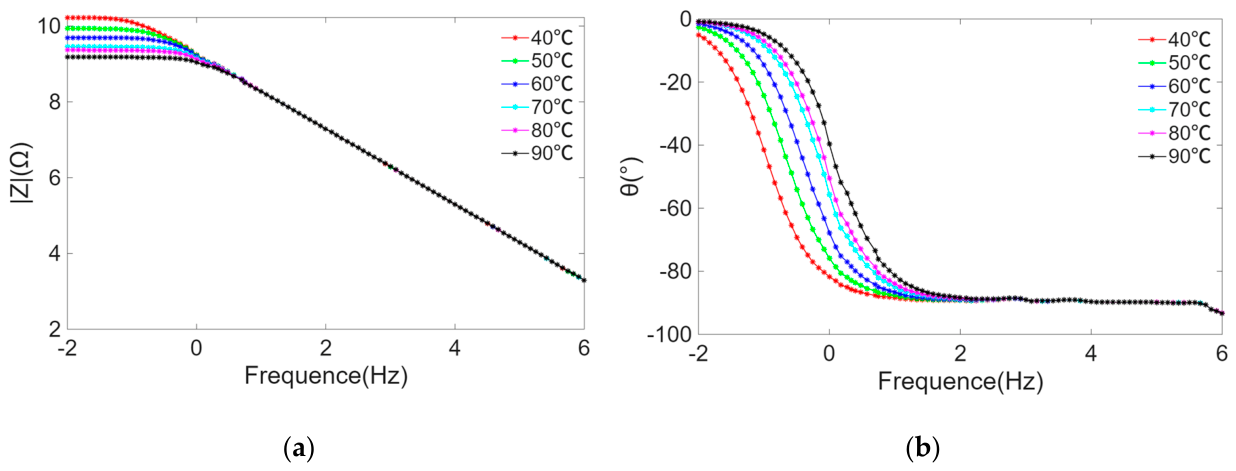
Figure 16.
Electrochemical Characteristics for fresh oil at test temperatures of 40℃, 50℃, 60℃, 70℃, 80℃, and 90℃. (a) Base resistance; (b) Charge transfer resistance; (c) CPE admittance constant; (d) CPE dispersion index.
Figure 16.
Electrochemical Characteristics for fresh oil at test temperatures of 40℃, 50℃, 60℃, 70℃, 80℃, and 90℃. (a) Base resistance; (b) Charge transfer resistance; (c) CPE admittance constant; (d) CPE dispersion index.
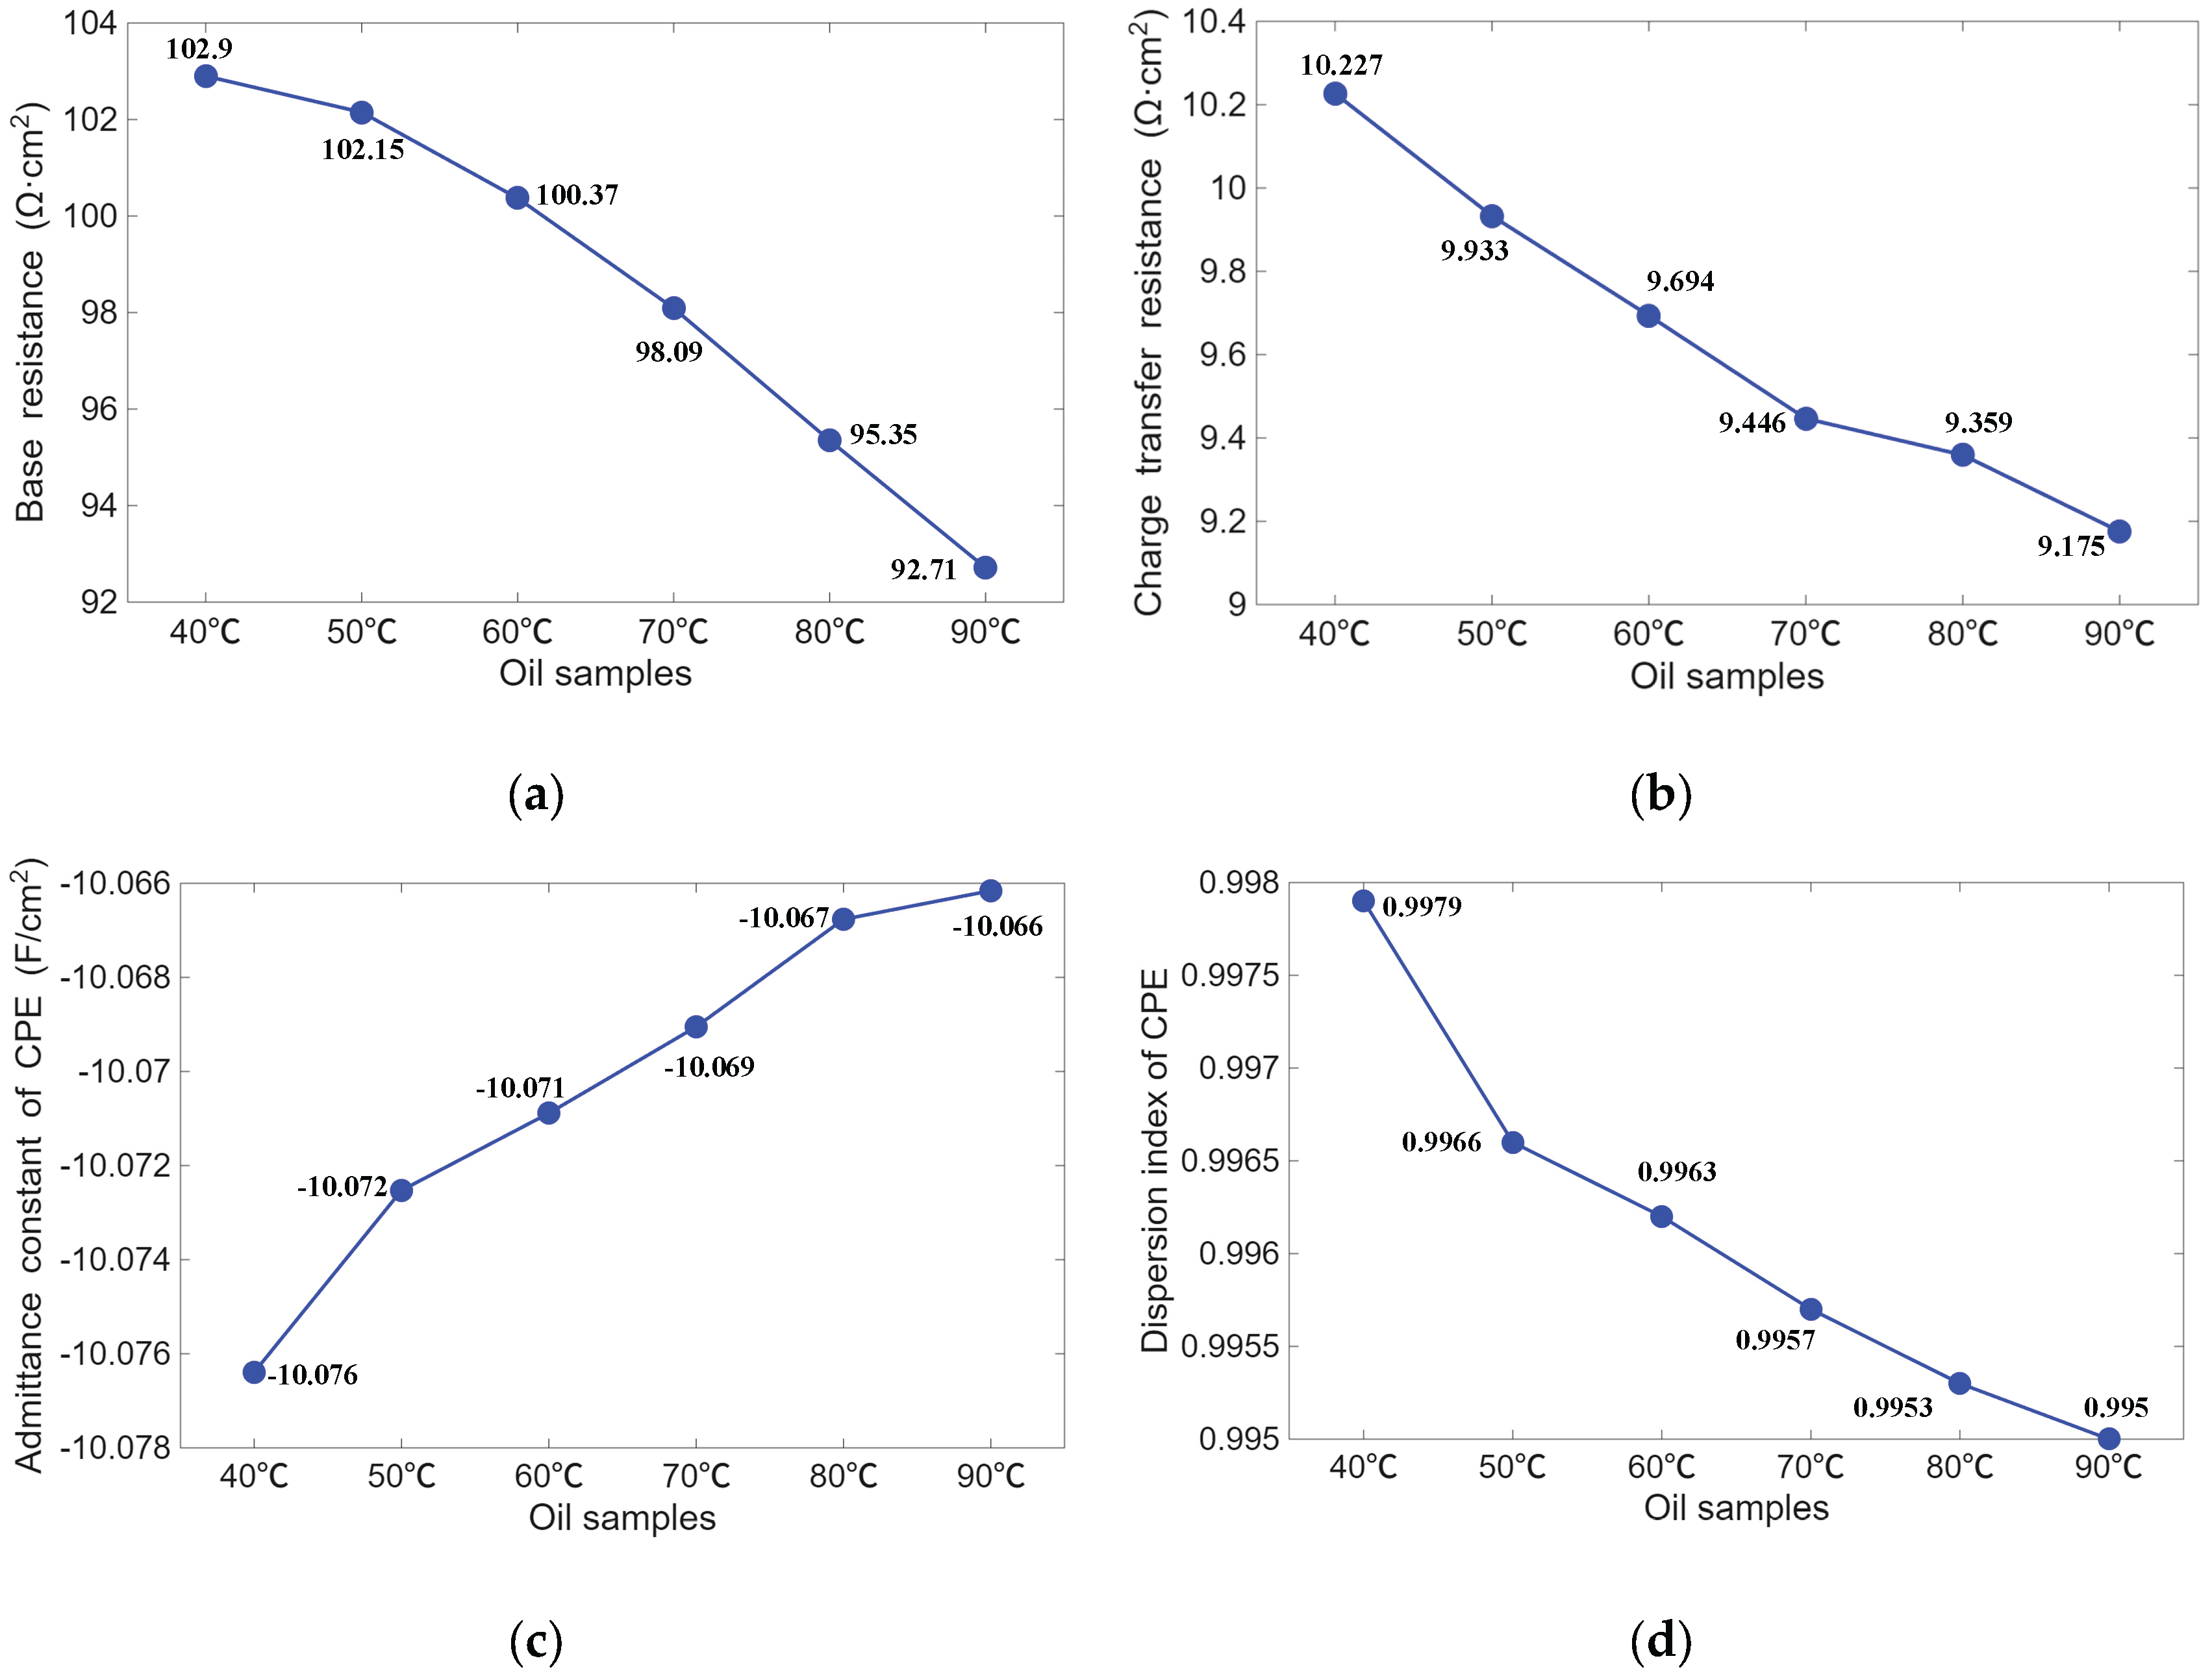
Table 1.
Principal technical parameters of CHI60E4E electrochemical workstation.
| Category | Technical Parameter | Value |
| Potentiostat | Potential range | ±10 V |
| Current range | ±250 mA (Scalable to ±1 A) | |
| Current measurement range | 10 pA ~ 250 mA (10 gears) | |
| Current measurement resolution | 0.0015% of full scale | |
| Input bias current | < 10 pA | |
| Maximum data acquisition rate | 1,000,000 point/s | |
| AC impedance | Frequency range | 10 μHz ~ 1 MHz |
| Impedance measurement accuracy | < 0.5% | |
| Sine wave amplitude | 0.1 mV ~ 1 V (RMS) | |
| Signal generation and data acquisition | Potential scanning rate | 0.000001 ~ 10,000 V/s |
| Potential step time | 1 μs ~ 1000 s | |
| Hardware and Control | Analog filter | 1 Hz ~ 1 MHz (multi-step programmable) |
| Data transmission | USB 2.0 | |
| Power supply | 110/220 V AC,50/60 Hz |
Table 2.
ECM fitting results of of oil samples at different oxidation temperatures.
| Oil Samples | |||
| Fresh oil | 0.9886 | 0.9998 | 0.7923 |
| 90℃-oxidized oil | 0.9902 | 0.9543 | 0.7915 |
| 100℃-oxidized oil | 0.9905 | 0.9487 | 0.7909 |
| 110℃-oxidized oil | 0.9906 | 0.9356 | 0.7891 |
| 120℃-oxidized oil | 0.9908 | 0.9303 | 0.7887 |
Table 3.
ECM fitting results of oil samples with different oxidation times.
| Oil Samples | |||
| 50h-oxidized oil | 0.9902 | 0.9543 | 0.7915 |
| 75h-oxidized oil | 0.9911 | 0.9423 | 0.7899 |
| 100h-oxidized oil | 0.9912 | 0.9354 | 0.7909 |
| 125h-oxidized oil | 0.9909 | 0.9312 | 0.7921 |
| 150h-oxidized oil | 0.9915 | 0.9284 | 0.7878 |
| 175h-oxidized oil | 0.9915 | 0.9246 | 0.7905 |
Disclaimer/Publisher’s Note: The statements, opinions and data contained in all publications are solely those of the individual author(s) and contributor(s) and not of MDPI and/or the editor(s). MDPI and/or the editor(s) disclaim responsibility for any injury to people or property resulting from any ideas, methods, instructions or products referred to in the content. |
© 2026 by the authors. Licensee MDPI, Basel, Switzerland. This article is an open access article distributed under the terms and conditions of the Creative Commons Attribution (CC BY) license (http://creativecommons.org/licenses/by/4.0/).
Copyright: This open access article is published under a Creative Commons CC BY 4.0 license, which permit the free download, distribution, and reuse, provided that the author and preprint are cited in any reuse.