

Submitted:
20 June 2026
Posted:
25 June 2026
You are already at the latest version
Abstract
Background/Objectives: Immune exclusion in head and neck squamous cell carcinoma (HNSCC) limits immunotherapy efficacy, yet the molecular determinants of stromal- immune organization remain incompletely characterized. The desmosomal cadherin DSG2 is highly expressed in squamous epithelium; its role in shaping the tumor microenvironment (TME) is unknown. Methods: We integrated bulk RNA-seq from 836 HNSCC patients (TCGA-HNSC n = 566, GSE65858 n = 270), single-cell RNA-seq (GSE139324, n = 26 patients, 133,308 cells), spatial transcriptomics (GSE208253, n = 12), proteomics (CPTAC-HNSCC, n = 108), and external validation cohorts (GSE41613, n = 97). CellChat ligand-receptor analysis, mediation analysis, Mendelian randomization (MR), LASSO-penalized Cox regression, HPV-stratified sensitivity analysis, and transcription factor (TF) correlation analysis were employed. Results: DSG2 exhibited epithelial-specific expression and showed consistent positive correlation with CXCL8 (IL-8; TCGA Rho = 0.228, p = 4.4 × 10⁻⁸) and myCAF activation across independent cohorts. Single-cell analysis revealed that 99.5% of CXCL8-producing cells have zero DSG2 expression, establishing the bulk correlation as compositional rather than cell-intrinsic. CellChat identified CXCL8-CXCR2 as the strongest tumor-stroma interaction in DSG2-high regions (probability = 0.821, 1.80-fold enrichment). Mediation analysis demonstrated 43.6% (95% CI [34.3-53.6%]) of DSG2’s tissue-level association with myCAF activation is mediated through CXCL8 (compositional mediation). Multi-instrument MR (IVW: Beta = -0.028, p = 0.028; I² = 0.0%) corroborated the compositional model. Protein-level validation in CPTAC-HNSCC confirmed DSG2-CD8A inverse correlation (Spearman rho = -0.35, p = 2.2 × 10⁻⁴). Pan-squamous meta-analysis confirmed negative DSG2-cytolytic activity correlations (pooled Rho = -0.213, 95% CI [-0.296, -0.128], I² = 58.6%, 4 cohorts). DSG2 correlated with TIDE score (Rho = 0.176) and TGF-β exclusion subscore (Rho = 0.428). DepMap analysis identified CXCR2 inhibitor collateral sensitivity (rho = -0.408, p < 0.0001). An 8-gene co-expression module was validated in two independent cohorts (GSE41613: HR = 3.09, p = 0.003; GSE65858: HR = 1.57, p = 0.032). Conclusions: DSG2 defines a stromal-immune organizational state characterized by CXCL8-CXCR2 paracrine signaling, myCAF activation, and immune exclusion, conserved across squamous malignancies. DSG2-high/PD-L1-high tumors (30.4% prevalence) exhibit the worst predicted ICI response and represent a candidate population for biomarker-selected CXCR2 inhibitor trials in combination with anti-PD-1 therapy.
Keywords:
DSG2
; HNSCC
; immune exclusion
; CXCL8
; IL-8
; myCAF
; CellChat
; mediation analysis
; CPTAC proteomics
; CXCR2 inhibitors
; immunotherapy resistance
1. Introduction
Head and neck squamous cell carcinoma (HNSCC) represents the seventh most common cancer globally, with approximately 890,000 new cases and 450,000 deaths annually [1]. Despite therapeutic advances, including immune checkpoint inhibitors (ICIs), durable responses remain limited to 15-20% of patients [2,3]. Immune exclusion, where cytotoxic T cells are physically prevented from accessing tumor cells by stromal barriers or chemokine gradients, represents a major resistance mechanism [4]. Current biomarkers (PD-L1, tumor mutational burden) incompletely capture this phenotype, and the molecular programs driving immune exclusion in HNSCC remain poorly understood.
The tumor microenvironment in HNSCC is characterized by complex interactions between malignant epithelial cells, cancer-associated fibroblasts (CAFs), and infiltrating immune cells [5]. Thorsson and colleagues classified HNSCC into immune subtypes including wound healing, interferon-gamma dominant, inflammatory, and lymphocyte- depleted categories [6]. Myofibroblastic CAFs (myCAFs) produce extracellular matrix components and secrete inflammatory mediators that can establish immune-excluded niches [7,8]. Understanding the epithelial-stromal crosstalk that shapes these organizational states is essential for developing therapeutic strategies to overcome immune exclusion.
The phenomenon of immune exclusion in HNSCC is phenotypically well- characterized: cytotoxic T cells accumulate at the tumor-stroma border but fail to infiltrate the tumor core, a pattern associated with TGF-β dominance, stromal barrier formation, and poor ICI response [4]. However, the tumor-intrinsic epithelial signals that initiate stromal recruitment and predetermine whether a tumor adopts an immune-excluded versus inflamed microenvironmental state remain unknown. Prior work has focused on CAF subtypes and downstream stromal effectors [7,8]; the upstream epithelial determinants of stromal-immune organization in squamous cancers have not been systematically characterized.
DSG2 (desmoglein-2) is a cadherin superfamily member primarily expressed in stratified squamous epithelium [9]. As a core component of desmosomes, DSG2 maintains epithelial adhesion and tissue integrity through homophilic extracellular interactions and intracellular anchoring to the intermediate filament cytoskeleton [10]. Beyond structural roles, desmosomal proteins regulate intracellular signaling: desmosome disruption activates Src kinase, promotes plakoglobin nuclear translocation, and engages NF-κB- dependent transcriptional programs in keratinocytes. These downstream effects converge on pro-inflammatory cytokine production, making DSG2 a mechanistically plausible upstream regulator of the IL-8 (CXCL8) axis, a chemokine network implicated in neutrophil recruitment, CAF activation, and immune exclusion in solid tumors [11,12]. Despite this, the role of DSG2 in shaping the stromal-immune organizational state of HNSCC has not been characterized.
In this study, we integrated five complementary data modalities, bulk RNA-seq (n = 836), single-cell RNA-seq (133,308 cells), spatial transcriptomics, proteomics, and Mendelian randomization, to test the hypothesis that DSG2 marks a distinct stromal- immune organizational state in HNSCC. We report that DSG2 defines an immune- excluded microenvironment characterized by CXCL8-CXCR2 paracrine signaling and myCAF activation, conserved across squamous malignancies and HPV-independent. Critically, single-cell analysis establishes this association as compositional rather than cell- intrinsic, yielding a therapeutically actionable vulnerability to CXCR2 inhibition in DSG2- high tumors.
2. Materials and Methods
2.1. Datasets
TCGA-HNSC: RNA-seq (n = 566), 450K methylation (n = 580), survival (n = 519), clinical (n = 528). UCSC Xena HiSeqV2 (log2 RSEM + 1).
GSE65858: HNSCC (n = 270), GPL18573 platform, mixed HPV status. GSE41613: HPV-negative oral SCC (n = 97), Affymetrix GPL570, external validation. cohort.
GSE139324: scRNA-seq (n = 26 patients, 133,308 cells), 10× Genomics 3ʹ v2.
GSE208253: Visium spatial transcriptomics (n = 12 oral cavity SCC), 10× Genomics Visium.
CPTAC-HNSCC: Proteomics (n = 108), mass spectrometry-based protein quantification.
DepMap 24Q2: CRISPR-Cas9 screens and PRISM drug sensitivity (n = 132 HNSCC lines).
GTEx v8: Thyroid, skin, esophagus mucosa, and lung tissue eQTLs for multi-instrument MR (5 instruments).
ENCODE: ChIP-seq data for H3K27ac and H3K4me1 in keratinocyte and HNSCC cell lines.
Outcome GWAS: Astle et al. 2016 (GCST004627), n ∼ 170,000, blood cell traits.
Sample sizes vary by analysis due to data availability; each section reports the applicable n.
2.2. Statistical Methods
Correlations: Spearman rank correlation for non-parametric associations. FDR correction via Benjamini-Hochberg method where applicable.
Survival: Cox proportional hazards (survival R package v3.5-5); log-rank test; Kaplan-Meier with median split or optimal cut point (survminer::surv_cutpoint). Proportional hazards assumption tested via Schoenfeld residuals.
CellChat Analysis: Performed on GSE139324 scRNA-seq data using CellChat v2.1.2(R). Cell type identities were defined by Seurat-based clustering (resolution = 0.8) with marker-gene annotation (epithelial: EPCAM, KRT5; CAFs: FAP, ACTA2; T cells: CD3D, CD8A; macrophages: CD68, MRC1). Epithelial cells were stratified into DSG2-high (top 25%) and DSG2-low (bottom 75%) subpopulations. CellChat v2 was run independently on each stratum; ligand-receptor communication probabilities were compared post-hoc between groups. The 68.0% regional enrichment metric was computed as the fraction of DSG2-high epithelial cells residing in tumor neighborhoods (10-nearest-neighbor graph) where at least one CXCL8-producing cell was present, normalized to the equivalent fraction in DSG2-low neighborhoods. Statistical significance was assessed by Mann-Whitney U test with FWER correction (n = 1,000 permutations).
Two complementary spatial exclusion metrics were computed from Visium data: (i) the fraction metric (reported in Section 3.4), defined as the fraction of DSG2-high spots (top quartile) surrounded by CD8A-low neighborhoods (lowest quartile), minus the chance expectation of 0.25, capturing the degree to which DSG2-high spots are disproportionately embedded in CD8A-depleted neighborhoods; and (ii) the difference metric (reported in Figure 4D), defined as the mean CD8A expression in neighborhoods of DSG2-low spots minus mean CD8A expression in neighborhoods of DSG2-high spots, quantifying the absolute magnitude of CD8A depletion proximal to DSG2-high epithelium. These two metrics are complementary: the fraction metric captures exclusion topology at the spot level, while the difference metric reflects the continuous CD8A expression gradient across DSG2-defined neighborhoods.
Mediation Analysis: Formal path analysis with bootstrap resampling (n = 1,000 iterations) in TCGA-HNSC and GSE65858. MyCAF score: mean expression of ACTA2, TAGLN, MYH11, CALD1, CNN1, ACTG2. Proportional mediation = ACME/total effect (mediation R package).
Mendelian Randomization: Two-sample multi-instrument MR using 5 independent cis-eQTL instruments for DSG2 from squamous-relevant GTEx v8 tissues (thyroid, skin, esophagus mucosa, lung; all F-statistics > 10; LD r² < 0.01 within 1 Mb). Outcome GWAS summary statistics were obtained from Astle et al. 2016 (GCST004627, n ∼ 170,000), using lymphocyte count as a proxy for systemic immune cell availability; this proxy is supported by population-level data demonstrating that peripheral lymphocyte counts correlate with tumor-infiltrating lymphocyte (TIL) abundance across solid tumors (Spearman rho ~0.3-0.4 in pan-cancer analyses), and by clinical evidence that pre- treatment absolute lymphocyte count independently predicts ICI benefit and pathological response in HNSCC [13]. We acknowledge that peripheral counts are an imperfect proxy for intratumoral immune composition; the MR result should therefore be interpreted as corroborating evidence consistent with the compositional model rather than definitive causal proof. Inverse variance-weighted (IVW) meta-analysis was the primary estimator; heterogeneity was assessed via I²; horizontal pleiotropy was assessed via MR-Egger intercept test.
LASSO-Cox Regression: glmnet R package (v4.1-7) with 10-fold cross-validation; α = 1.0 (pure L1 penalty). Training: TCGA-HNSC; validation: GSE41613 and GSE65858.
WGCNA: Soft-thresholding power β = 6 (scale-free R² > 0.85), minimum module size 30, merge cut height 0.25. Input: top 8,000 most variable genes (MAD filter).
TIDE Score: The TIDE computational framework (Jiang et al. Nat Med 2018 [14]) was applied to TCGA-HNSC RNA-seq data (n = 565) to derive composite TIDE scores and component subscores (TGF-β exclusion, T cell dysfunction). Composite stratification by DSG2 (median split) and PD-L1/CD274 (median split) defined four groups. Differences across strata were assessed by one-way ANOVA with post-hoc Tukey correction.
Meta-Analysis: Random-effects meta-analysis (meta R package v6.5-0, DerSimonian-Laird estimator). Forest plots with publication-quality settings.
Software: R v4.3.2, Python v3.10.12, pandas v2.0.3, scipy v1.11.1, lifelines v0.27.7, matplotlib v3.7.2, seaborn v0.12.2.
Two-tailed p < 0.05 was considered statistically significant unless stated otherwise. Code is available upon request.
3. Results
DSG2 Expression Characterization Across HNSCC Cohorts To establish the cellular context of DSG2 expression, we characterized its distribution across independent HNSCC cohorts. In TCGA-HNSC (n = 566), DSG2 showed variable expression with a right-skewed distribution (median log2 RSEM = 11.96, IQR 10.78-13.08), indicating a subset of tumors with elevated DSG2. This pattern replicated in GSE65858 (n = 270; median log2 intensity = 5.81, IQR 4.38-7.02). DSG2 expression did not significantly differ by HPV status (TCGA: Mann-Whitney p = 0.219; GSE65858: p = 0.673), indicating that DSG2-associated biology is not confounded by established HPV molecular subtypes (Table 1). Single-cell analysis (GSE139324, n = 133,308 cells) confirmed DSG2 is primarily epithelial: only 0.69% of tumor-infiltrating lymphocytes showed detectable expression, establishing DSG2 as a tumor cell-intrinsic marker (Figure 1A).
Table S3 presents DSG2 expression rates across all annotated cell types in GSE139324: Epithelial (Epi1/Epi2), T cells, B cells, NK cells, Macrophages, Neutrophils, CAFs, and Endothelial cells. DSG2 expression was highly restricted to epithelial compartments (Epi1: 18.3%, Epi2: 22.1%), with negligible detection in all stromal and immune populations (all < 1.2%), establishing tumor-cell-intrinsic specificity across the full cellular landscape of the TME.
3.1. DSG2 Associates with CXCL8 (IL-8) and MyCAF Activation
We tested whether DSG2-high tumors exhibit specific paracrine signaling. DSG2 correlated consistently with CXCL8 (IL-8) across cohorts (TCGA: Rho = +0.228, p = 4.4 × 10⁻⁸; GSE65858: Rho = +0.248, p = 3.7 × 10⁻⁵), representing the most robust ligand-receptor correlation observed (Table 2). DSG2 also correlated with myCAF signatures (TCGA: Rho = 0.216, p = 2.19 × 10⁻⁷), suggesting a coordinated epithelial-stromal signaling program. DSG2 showed negative correlation with AREG (Rho = -0.100, p = 0.017), indicating selectivity for the IL-8 axis.
3.1.1. Single-Cell Analysis Reveals CXCL8 Is Predominantly Produced by DSG2- Negative Cells
To test whether the DSG2-CXCL8 correlation reflects cell-intrinsic regulation,we analyzed single-cell RNA-seq data (GSE139324, n = 133,308 cells). Of 333 DSG2-expressing cells (0.25%), only 129 co-expressed CXCL8. Critically, 99.5% of CXCL8-producing cells (24,104/24,233) had zero DSG2 expression, demonstrating CXCL8 is predominantly produced by DSG2-negative stromal/immune cells (CAFs, macrophages, neutrophils). At single-cell resolution, DSG2 and CXCL8 showed a negligible correlation (Rho = +0.023, R² = 0.000), establishing the bulk correlation as a compositional association rather than direct transcriptional co-regulation (Figure 2).
Consistent with this compositional model, CellChat analysis (Section 3.9) identified CXCL8-CXCR2 as the dominant signaling interaction in DSG2-high epithelial neighborhoods, with signal emanating from DSG2-negative stromal cells, confirming that the bulk correlation reflects spatial co-enrichment of CXCL8-producing stroma rather than epithelial-intrinsic transcriptional coupling.
3.1.2. Tumor Microenvironment Composition Correction
DSG2 showed positive correlation with stromal scores (Rho = +0.261, p = 2.2 × 10⁻¹⁰) and negative correlation with immune scores (Rho = -0.136, p = 0.001). After controlling for stromal composition via partial correlation, DSG2 maintained significant associations with immune markers, confirming the immune exclusion signal is not solely driven by tumor cellularity.

Table 3.
Tumor Microenvironment Composition Analysis (TCGA-HNSC, n = 566).
| Analysis | Correlation | p-Value | Interpretation |
| DSG2 vs. Stromal Score | +0.261 | 2.2 × 10⁻¹⁰ | High stromal content in DSG2-high |
| DSG2 vs. Immune Score | -0.136 | 0.001 | Low immune infiltration |
| DSG2 vs. Cytotoxic (unadjusted) | -0.240 | 2.2 × 10⁻⁵ | Low cytotoxic activity |
| DSG2 vs. Cytotoxic (adjusted for stromal) | -0.198 | <0.05 * | Robust to purity correction |
* p < 0.05 after controlling for stromal score via partial correlation.
3.1.3. DSG2-High Tumors Exhibit an Immune-Excluded Microenvironment
DSG2 correlated positively with ESTIMATE stromal scores (TCGA: Rho = 0.261, p = 2.2 × 10⁻¹⁰; GSE65858: Rho = 0.218, p = 0.00018) and negatively with CD8+ infiltration (CD8_score: Rho = -0.228, p = 5.8 × 10⁻⁵) (Table 4). Pan-cancer meta-analysis confirmed negative DSG2-cytolytic activity correlations in squamous cancers (HNSC: Rho = -0.171; LUSC: Rho = -0.295; ESCA: Rho = -0.220; CESC: Rho = -0.135; pooled Rho = -0.213, 95% CI [-0.296, -0.128], I² = 58.6%). Non-squamous cancers showed null or negligible associations (Figure 3).
3.2. Spatial Transcriptomics Confirms Regional Immune Depletion
Analysis of GSE208253 Visium data (12 oral cavity SCC) revealed weakly positive spot- level DSG2-CD8A correlations (mean Rho = +0.046), a result that is mechanistically consistent with-rather than contradictory to-the immune exclusion model. In canonical immune exclusion, cytotoxic T cells accumulate at the tumor-stroma border but are physically prevented from infiltrating the tumor core by stromal barriers and chemokine gradients [15]. This spatial architecture produces co-localization of DSG2-high epithelial spots with immune spots at the interface (weakly positive pairwise Rho), while simultaneously creating CD8A-depleted neighborhoods within tumor nests. To capture this exclusion topology, we computed a spatial exclusion enrichment metric defined as the fraction of DSG2-high spots (top quartile) surrounded by CD8A-low neighborhoods (lowest quartile), adjusted for chance expectation (25%). DSG2-high spots were disproportionately enriched in CD8A-low neighborhoods across all 12 tumors (mean enrichment +0.636, range +0.44-+0.74), with the pattern consistent in direction across the entire cohort (Figure 4). The spatial data therefore confirm immune exclusion as a tumor- architectural phenotype: T cells reach the border of DSG2-high regions but fail to penetrate them.
3.3. Transcription Factor Correlation Analysis Identifies TP63 and RELA as Key Regulators
To identify upstream transcriptional regulators, we tested 15 TFs across four functional categories. TP63 emerged as the top DSG2-correlated TF (Rho = +0.412, p = 1.23 × 10⁻²⁴), consistent with its role as a master epithelial regulator in squamous tissues. RELA (NF-κB consistent with its role as a master epithelial regulator in squamous tissues. RELA (NF-κB canonical NF-κB→IL-8 transcriptional axis (Table 5).
3.4. DSG2 Is Not Independently Prognostic
To evaluate whether DSG2 provides independent prognostic value, we performed nested Cox models incorporating DSG2, age, and AJCC pathologic stage in TCGA-HNSC (n = 306 with complete data, 136 events). DSG2 alone showed minimal prognostic association (univariate HR = 1.115, 95% CI: 0.85-1.46, p = 0.43, C-index = 0.562). In the combined model, DSG2 did not retain independent prognostic significance (HR = 0.98, 95% CI: 0.73- 1.32, p = 0.89), consistent with LASSO-Cox analysis (Table 6).
3.5. LASSO-Penalized Cox Regression
LASSO-Cox regression with 10-fold cross-validation on 12 features in TCGA-HNSC (n = 306, 136 events) identified AGE as the strongest prognostic factor (HR = 1.278, p = 6.37 × 10⁻⁴). DSG2 showed no independent prognostic effect (HR = 0.926, p = 0.245). Among immune markers, IL6 (HR = 1.200, p = 0.016) and GZMB (HR = 0.889, p = 0.042) reached nominal significance. These findings establish that DSG2’s clinical utility lies in combination biomarker signatures, not standalone risk stratification (Table 7).
3.6. A DSG2 Co-Expression Module Yields a Validated 8-Gene Prognostic Signature
WGCNA in TCGA-HNSC identified DSG2 in the black module (4,637 genes). LASSO-Cox regression derived an 8-gene signature: SLC16A3, TSPAN5, ERRFI1, PPP1R14C, SFXN1, CNFN, PTPN12, TNS4 (Table 8). The signature achieved robust external validation in two independent cohorts: GSE41613 (HPV-negative OSCC, n = 97): log-rank p = 0.003, HR = 3.09 [1.41-6.76], C-index = 0.679; GSE65858 (mixed HNSCC, n = 270): log-rank p = 0.032, HR = 1.57 [1.04-2.37], C-index = 0.594 (Figure 5).
The 8 signature genes map to biologically coherent processes in the squamous TME. SLC16A3 encodes MCT4 (monocarboxylate transporter 4), a lactate exporter associated with Warburg-shift metabolic reprogramming and hypoxic microenvironments. TSPAN5 is a tetraspanin with established roles in EMT-associated cell-cell communication and exosome biogenesis. ERRFI1 (MIG6) is a negative regulator of EGFR signaling that 340 suppresses receptor recycling and is frequently lost in squamous cancers with EGFR pathway activation. CNFN (cornifelin) is a keratinocyte terminal differentiation marker consistent with the squamous identity of DSG2-high tumors. TNS4 is a focal adhesion scaffolding protein implicated in actomyosin tension and mechanosensing at the epithelial-stromal interface. The convergence of 5 of 8 genes on glycolytic reprogramming, EGFR feedback, mechanosensing, and squamous differentiation suggests the signature captures a coherent biological state rather than a statistical artifact of LASSO feature selection.
3.7. CellChat Analysis Identifies CXCL8-CXCR2 as Dominant Stromal-CAF Signaling Axis in DSG2- High Epithelial Neighborhoods
CellChat ligand-receptor analysis (GSE139324, 26 patients, 133,308 cells) identified CXCL8-CXCR2 as the strongest ligand-receptor interaction within DSG2-high epithelial neighborhoods (communication probability = 0.821, p = 3.4 × 10⁻⁴, ranking #1 among 16 significant pathways), with signal emanating from DSG2-negative stromal and immune cells rather than from DSG2-expressing epithelial cells themselves — consistent with the single-cell finding that 99.5% of CXCL8-producing cells have zero DSG2 expression (Section 3.2.1). DSG2-high epithelial cells showed 1.80-fold enrichment in CXCL8 signaling capacity compared to DSG2-low cells (mean probability 0.597 vs. 0.427), and 48.5% of CAFs expressed CXCR1/CXCR2 receptors (assessed by single-cell marker co-expression; see Methods 2.2 for metric definitions) (Figure 6).
3.8. Mediation Analysis Quantifies Tissue-Level CXCL8 as Compositional Mediator
Formal mediation analysis in TCGA-HNSC and GSE65858 demonstrated that tissue CXCL8 levels mediated 43.6% (95% CI [34.3-53.6%]) and 35.7% (95% CI [24.9-49.1%]) of DSG2’s association with myCAF activation, respectively (all p < 0.0001). For CD8+ T cell infiltration, CXCL8 mediated 42.5% (95% CI [28.5-60.1%]) in TCGA-HNSC (Table 9). These results represent compositional mediation: DSG2-high samples contain CXCL8- producing stromal infiltrate that drives myCAF activation and CD8+ exclusion.
3.9. Protein-Level Validation in CPTAC-HNSCC Proteomics
DSG2 protein levels in CPTAC-HNSCC (n = 108) showed a significant negative correlation with CD8A protein (Spearman rho = -0.35, p = 2.2 × 10⁻⁴), validating the immune exclusion phenotype at the protein level independent of mRNA measurements. Cross-cohort mRNA-protein concordance (Kolmogorov-Smirnov D = 0.167, p = 0.013) showed moderate agreement, with consistent directional associations across platforms (Figure 7).
3.10. Multi-Instrument Mendelian Randomization4
Multi-instrument MR using 5 independent cis-eQTL instruments from squamous-relevant tissues (all F-statistics > 10) showed a genetic association between DSG2 expression and lymphocyte counts (IVW: Beta = -0.028, 95% CI [-0.053, -0.003], p = 0.028). Heterogeneity was absent (I² = 0.0%), and MR-Egger intercept showed no evidence of directional pleiotropy (p = 0.089). The negative beta is directionally consistent with the compositional model: genetically-driven DSG2 elevation in the absence of inflammatory stromal recruitment context does not raise CXCL8, corroborating the single-cell finding.
3.11. DepMap Analysis Identifies CXCR2 Inhibitor Sensitivity
Analysis of 132 HNSCC lines (DepMap 24Q2) confirmed DSG2 is not a cell-autonomous dependency (CRISPR score = -0.056 ± 0.075). However, DSG2 expression correlated negatively with sensitivity to CXCR2 inhibitors (rho = -0.408, p < 0.0001), with DSG2-high lines showing enhanced sensitivity to reparixin and SX-682, clinically available CXCR2 antagonists (Figure 8). This establishes DSG2 as a predictive biomarker for CXCR2 inhibitor response rather than a direct druggable target.
3.12. TIDE Score Correlation Predicts Immunotherapy Resistance
DSG2 expression correlated significantly with TIDE score (Spearman rho = 0.176, p = 2.5 × 10⁻⁵) and strongly with the TGF-β exclusion subscore (rho = 0.428, p = 1.6 × 10⁻²⁶). Composite stratification by DSG2 and PD-L1 identified four groups, with DSG2-high/PD- L1-high tumors exhibiting the highest mean TIDE score (0.287 ± 1.357), indicating worst predicted ICI response (Table 10).
3.13. Multi-Method Deconvolution Confirms CD8+ T Cell Exclusion
Applying 10 independent immune signatures to TCGA-HNSC, all four CD8+/cytotoxic signatures showed consistent negative correlations with DSG2 (mean rho = -0.237, range -0.240 to -0.228, all p < 0.001, 100% concordance). Eight of 10 total signatures (80%) reached FDR significance (q < 0.05). This cross-method convergence strengthens confidence beyond single-method estimates and demonstrates clinically meaningful T cell depletionin DSG2-high tumors. Applying 10 independent immune signatures to TCGA-HNSC, all four CD8+/cytotoxic signatures showed consistent negative correlations with DSG2 (mean rho = -0.237, range-0.240 to -0.228, all p < 0.001, 100% concordance). Eight of 10 total signatures (80%) reached FDR significance (q < 0.05). This cross-method convergence strengthens confidence beyond single-method estimates and demonstrates clinically meaningful T cell depletion.
4. Discussion
The principal finding of this study is the comprehensive characterization of the DSG2 CXCL8 myCAF pathway as a mechanistically distinct immune exclusion program in HNSCC, validated across multiple biological scales and analytical frameworks. The pathway is supported by: (1) directional ligand-receptor analysis identifying CXCL8-CXCR2 as the strongest epithelial-to-CAF interaction (CellChat probability = 0.821, p = 3.4 × 10⁻⁴); (2) formal mediation analysis demonstrating 43.6% compositional mediation through tissue CXCL8 levels; (3) multi-instrument Mendelian randomization (IVW p = 0.028); (4) protein-level validation in CPTAC-HNSCC (DSG2-CD8A rho = -0.35, p = 2.2 × 10⁻⁴); (5) DepMap identification of CXCR2 inhibitor sensitivity (rho = -0.408, p < 0.0001); and (6)TIDE score correlation predicting ICI resistance (rho = 0.176).
4.1. Stromal Recruitment Model
The molecular mechanism linking DSG2-high epithelial identity to CXCL8-producing stromal recruitment remains to be established experimentally. Several candidate mechanisms are biologically plausible. First, desmosomal remodeling in tumor epithelium activates Src-mediated signaling and plakoglobin nuclear translocation, which could establish paracrine cytokine gradients that prime adjacent stromal cells for NF- κB/CXCL8 activation. Second, DSG2-high squamous tumors may exhibit altered mechanical properties, increased epithelial stiffness or disrupted tensional homeostasis, that activate Mechan transduction pathways in CAFs via integrins, driving iCAF-to-myCAF conversion in a stiffness-dependent manner. Third, DSG2 expression correlates with TP63 (Rho = +0.412), and TP63-high squamous tumors secrete a distinct pro-inflammatory cytokine profile including IL-6 and GM-CSF that can prime myeloid cell sand CAFs for CXCL8 upregulation. The relative contribution of each candidate mechanism remains to be determined experimentally, and is addressed as a priority in Section 4.6. Metalloproteinase-mediated DSG2 ectodomain shedding via ADAM10/17represents an additional candidate mechanism for paracrine signaling; preliminary interaction data are presented in Figure S11.
4.2. Protein-Level Validation Resolves mRNA-Protein Discordance
The CPTAC-HNSCC proteomics validation (n = 108) confirmed the immune exclusion phenotype at the protein level (DSG2-CD8A rho = -0.35), with an effect size stronger than the bulk transcriptomic estimate (rho = -0.23), suggesting protein measurements better capture functional biology. Moderate mRNA-protein concordance (KS D = 0.167) is consistent with known post-translational regulatory layers for membrane proteins such as DSG2, yet the directionality of immune associations remained consistent across platforms, supporting biological significance.
4.3. HPV-Independent Biology
The HPV-stratified analysis confirms DSG2 associations are HPV-independent (DSG2 × HPV interaction p = 0.781). The DSG2-CXCL8 correlation replicated in both HPV-positive (Rho = +0.189) and HPV-negative (Rho = +0.201) strata, establishing this as a pan-HNSCC phenomenon. Sign reversals of IFNG and PRF1 correlations in HPV-positive tumors reflect additional viral antigen-driven cytotoxic activity orthogonal to the DSG2 exclusion axis, not measurement noise.
4.4. DSG2 Is Not Independently Prognostic: Implications for Biomarker Development
LASSO-Cox analysis definitively establishes DSG2 is not independently prognostic after multivariate adjustment (HR = 0.926, p = 0.245). AGE emerged as the dominant prognostic factor (HR = 1.278, p = 6.37 × 10⁻⁴). The flat C-index (0.500) across all transcriptomic models reflects HNSCC’s multi-factorial survival determinants. However, the network-derived 8- gene DSG2 co-expression module (SLC16A3, TSPAN5, ERRFI1, PPP1R14C, SFXN1, CNFN, PTPN12, TNS4) achieved robust external validation, demonstrating that TME organization is an emergent multi-gene property better captured by co-expression signatures than single markers [16].
4.5. Therapeutic Implications
The DepMap analysis provides direct therapeutic actionability: DSG2-high HNSCC lines are selectively sensitive to CXCR2 inhibitors (reparixin, navarixin, SX-682), with rho = − 0.408 (p < 0.0001). Reparixin has been evaluated in HER2-negative metastatic breast cancer [17,18]; SX-682 has been evaluated in combination with pembrolizumab in advanced solid tumors and melanoma; navarixin (MK-7123) was evaluated with pembrolizumab in a basket trial across solid tumors. Critically, no completed trial has evaluated CXCR2 inhibitors specifically in HNSCC. The collateral sensitivity observed here provides the first HNSCC-specific functional evidence for this therapeutic class, and the DSG2/PD-L1 composite stratification identifies a subgroup (30.4% of HNSCC patients) that could be prospectively enriched in a biomarker-selected Phase I/II trial combining a CXCR2 inhibitorwithanti-PD-1 therapy. The neutrophil-mediated exclusion chain (DSG2→CXCL8/CXCR2→PMN-MDSC→CD8+ exclusion) provides the mechanistic rationale for this combination strategy.
4.6. Limitations
Several limitations must be acknowledged. First, the DSG2-CXCL8 association is established as compositional by single-cell analysis, but functional causality remains unproven; DSG2 CRISPR knockdown in HNSCC organoids co-cultured with primary CAFs, with CXCL8 quantification by ELISA, is the necessary next experiment. Second, TIDE score analysis relies on gene expression inference rather than actual ICI response data. Although TIDE has been prospectively validated as a predictor of anti-PD-1response across multiple tumor types [14], validation in clinical ICI cohorts with matched genomic data, specifically KEYNOTE-048 or CheckMate 141, is a necessary next step. The correlation with the TGF-β exclusion subscore (rho = 0.428) is particularly encouraging given its distinct and validated mechanistic basis. Third, the CPTAC-HNSCC cohort (n =108) lacks matched survival data, limiting protein-level survival analysis; however, them RNA-level immune exclusion signal is validated in three independent cohorts with survival endpoints, mitigating this limitation. Fourth, the MR p-value (0.028) with 5instruments is nominally significant; confirmation with a larger eQTL dataset (UK Biobank or GTEx v10) would strengthen the causal inference. The use of peripheral lymphocyte count as the outcome proxy, while supported by population-level TIL correlations, introduces imprecision relative to direct intratumoral immune measures; this limitation is partially mitigated by the directional consistency of the negative beta with the compositional single-cell model. The MR result should be interpreted as corroborating evidence consistent with the compositional model, not as strong independent causal proof. Fifth, DepMap cell line models do not recapitulate in vivo TME complexity; patient-derived organoid models with intact stroma are required for translational validation.
5. Conclusions
This study establishes DSG2 as a marker of an immune-excluded tumor phenotype in HNSCC, characterized by recruitment of CXCL8-producing stromal/immune infiltrate rather than cell-intrinsic epithelial CXCL8 production. Single-cell analysis definitively shows 99.5% of CXCL8-producing cells are DSG2-negative, supporting a compositional model corroborated by converging multi-scale evidence: CellChat (CXCL8-CXCR2 enrichment probability = 0.821), mediation analysis (43.6% compositional mediation), Mendelian randomization (IVW p = 0.028), CPTAC proteomics (DSG2-CD8A rho = -0.35), multi-method deconvolution (4/4 CD8+ signatures concordant), TIDE correlation (rho =0.176), and DepMap CXCR2 inhibitor sensitivity (rho = -0.408). The DSG2-associated immune exclusion phenotype is HPV-independent, squamous- specific, and transcriptionally regulated by TP63 and RELA/NF-κB through distal enhancers. DSG2 is not independently prognostic (multivariate HR = 0.98, p = 0.89) but identifies a therapeutically actionable subgroup (30.4% prevalence) with worst predicted ICI response. CXCR2 inhibitors represent rational candidates for DSG2-high/PD-L1-high HNSCC, warranting preclinical investigation in patient-derived models followed by prospective clinical evaluation in combination with ICIs.
Supplementary Materials
The following supporting information can be downloaded at the website of this paper posted on Preprints.org, Table S1: LASSO cross-validation results including optimal λ selection (λ=0.0043), 10-fold CV C-index curve, and final model feature coefficients; Table S2: HPV- stratified Spearman correlations between DSG2 and key immune/inflammatory genes (CXCL8, IFNG, PRF1, GZMB, CXCL2) by HPV status (n_HPV+=39, n_HPV-=75), demonstrating sign reversal for IFNG (ρ_HPV+=+0.12 vs ρ_HPV-=-0.34, p=0.003) and PRF1. Table S3: DSG2 expression rates across annotated cell types in GSE139324 scRNA-seq. Figure S1: LASSO cross-validation curve and coefficient shrinkage paths; Figure S2: HPV-stratified DSG2-CXCL8 scatter plots; Figure S3: Transcription factor-target volcano plots; Figure S4: Mendelian randomization complete results; Figure S5: Immune phenotype classification and survival stratification; Figure S6: Optimal cutpoint survival analysis (exploratory); Figure S7: Pan-squamous meta-analysis forest plot; Figure S8: Spatial transcriptomics DSG2-CD8A exclusion analysis; Figure S9: DepMap CRISPR essentiality analysis; Figure S10: IMVigor210 negative control validation; Figure S11: ADAM10/17 metalloproteinase interaction analysis.
Author Contributions
Conceptualization, Ö.T.Ç. and M.O.C.; Methodology, Ö.T.Ç.; Software, Ö.T.Ç.; Formal Analysis, Ö.T.Ç.; Investigation, Ö.T.Ç., B.K. (Begüm Kurt), and B.K.Y.; Resources, M.O.; Data Curation, Ö.T.Ç.; Writing-Original Draft Preparation, Ö.T.Ç.; Writing-Review and Editing, M.O.C., B.K.Y., B.K. and M.O.; Visualization, Ö.T.Ç.; Supervision, M.O. and B.K.Y. G.H.A.; Project569 Administration, M.O. All authors have read and agreed to the published version of the manuscript.
Funding
This research received no specific grant from any funding agency in the public, commercial, or not-for-profit sectors.
Institutional Review Board Statement
Not applicable. This study used publicly available deidentified datasets (TCGA, GEO, CPTAC) and did not involve direct human subjects research requiring IRB approval.
Informed Consent Statement
Not applicable.
Data Availability Statement
All TCGA data are publicly available via UCSC Xena (https://xenabrowser.net/). GEO datasets are available under accessions GSE65858, GSE41613, 582 GSE139324, GSE208253. GTEx v8 data are available via the GTEx Portal (https://gtexportal.org/). 583 GWAS summary statistics are available via GWAS Catalog (https://www.ebi.ac.uk/gwas/). Analysis 584 code and processed data tables will be deposited in a public GitHub repository upon publication.
Acknowledgments
The results published here are in part based upon data generated by the TCGA Research Network (https://www.cancer.gov/tcga) and the GTEx Project (https://gtexportal.org/).
Conflicts of Interest
The authors declare no conflicts of interest.
Abbreviations
The following abbreviations are used in this manuscript:
| HNSCC | Head and neck squamous cell carcinoma |
| DSG2 | Desmoglein-2 |
| CXCL8 (IL-8) | C-X-C Motif Chemokine Ligand 8 (Interleukin-8) |
| CXCR2 | C-X-C Motif Chemokine Receptor 2 |
| TME | Tumor microenvironment |
| CAF | Cancer-associated fibroblast |
| myCAF | Myofibroblastic cancer-associated fibroblast |
| ICI | Immune checkpoint inhibitor |
| EMT | Epithelial-to-mesenchymal transition |
| MR | Mendelian randomization |
| IVW | Inverse variance-weighted |
| LASSO | Least absolute shrinkage and selection operator |
| TCGA | The Cancer Genome Atlas |
| CPTAC | Clinical Proteomic Tumor Analysis Consortium |
| DepMap | Cancer Dependency Map |
| TF | Transcription factor |
| TIDE | Tumor Immune Dysfunction and Exclusion |
| WGCNA | Weighted gene co-expression network analysis |
| PMN-MDSC | Polymorphonuclear myeloid-derived suppressor cell |
| TIL | Tumor-infiltrating lymphocyte |
| CYT | Cytolytic activity score |
| HPV | Human papillomavirus |
References
- Sung, H.; Ferlay, J.; Siegel, R.L.; et al. Global Cancer Statistics 2020: GLOBOCAN Estimates of Incidence and Mortality Worldwide for 36 Cancers in 185 Countries. CA Cancer J. Clin. 2021, 71, 209–249. [Google Scholar] [CrossRef] [PubMed]
- Cohen, E.E.W.; Soulières, D.; Le Tourneau, C.; et al. Pembrolizumab versus methotrexate, docetaxel, or cetuximab for recurrent or metastatic head-and-neck squamous cell carcinoma (KEYNOTE-040): a randomised, open-label, phase 3 study. Lancet 2019, 393, 156–167. [Google Scholar] [PubMed]
- Ferris, R.L.; Blumenschein, G., Jr.; Fayette, J.; et al. Nivolumab for Recurrent Squamous-Cell Carcinoma of the Head and Neck. N Engl. J. Med. 2016, 375, 1856–1867. [Google Scholar] [CrossRef] [PubMed]
- Chen, D.S.; Mellman, I. Elements of cancer immunity and the cancer-immune set point. Nature 2017, 541, 321–330. [Google Scholar] [CrossRef] [PubMed]
- Cancer Genome Atlas Network. Comprehensive genomic characterization of head and neck squamous cell carcinomas. Nature 2015, 517, 576–582. [Google Scholar] [CrossRef] [PubMed]
- Thorsson, V.; Gibbs, D.L.; Brown, S.D.; et al. The Immune Landscape of Cancer. Immunity 2018, 48, 812–830. [Google Scholar] [CrossRef] [PubMed]
- Elyada, E.; Bolisetty, M.; Laise, P.; et al. Cross-Species Single-Cell Analysis of Pancreatic Ductal Adenocarcinoma Reveals Antigen-Presenting Cancer-Associated Fibroblasts. Cancer Discov. 2019, 9, 1102–1123. [Google Scholar] [CrossRef] [PubMed]
- Kieffer, Y.; Hocine, H.R.; Gentric, G.; et al. Single-Cell Analysis Reveals Fibroblast Clusters Linked to Immunotherapy Resistance in Cancer. Cancer Discov. 2020, 10, 1330–1351. [Google Scholar] [CrossRef] [PubMed]
- Garrod, D.; Chidgey, M. Desmosome structure, composition and function. Biochim Biophys. Acta 2008, 1778, 572–587. [Google Scholar] [CrossRef] [PubMed]
- Green, K.J.; Simpson, C.L. Desmosomes: new perspectives on a classic. J. Invest Dermatol. 2007, 127, 2499–2515. [Google Scholar] [CrossRef] [PubMed]
- David, J.M.; Dominguez, C.; Hamilton, D.H.; Palena, C. The IL-8/IL-8R Axis: A Double Agent in Tumor Immune Resistance. Vaccines 2016, 4, 22. [Google Scholar] [CrossRef] [PubMed]
- Alfaro, C.; Sanmamed, M.F.; Rodríguez-Ruiz, M.E.; et al. Interleukin-8 in cancer pathogenesis, treatment and follow-up. Cancer Treat. Rev. 2017, 60, 24–31. [Google Scholar] [CrossRef] [PubMed]
- Daru, H.; et al. Association between pretreatment lymphocyte count and response to PD1 inhibitors in head and neck squamous cell carcinomas. J. Immunother. Cancer 2018, 6(1), 84. [Google Scholar] [CrossRef]
- Jiang, P.; Gu, S.; Pan, D.; et al. Signatures of T cell dysfunction and exclusion predict cancer immunotherapy response. Nat. Med. 2018, 24, 1550–1558. [Google Scholar] [CrossRef] [PubMed]
- Joyce, J.A.; Fearon, D.T. T cell exclusion, immune privilege, and the tumor microenvironment. Science 2015, 348, 74–80. [Google Scholar] [CrossRef] [PubMed]
- Langfelder, P.; Horvath, S. WGCNA: an R package for weighted correlation network analysis. BMC Bioinform. 2008, 9, 559. [Google Scholar] [CrossRef]
- Schott, A.F.; Goldstein, L.J.; Cristofanilli, M.; et al. Phase Ib Pilot Study to Evaluate Reparixin in Combination with Weekly Paclitaxel in Patients with HER-2-Negative Metastatic Breast Cancer. Clin. Cancer Res. 2017, 23, 5358–5365. [Google Scholar] [CrossRef] [PubMed]
- Hunter, S.E.; Patel, Z.T.; Mateo, B.; Powers, J.M.; Shull, A.Y.; Dubash, A.D. The desmosomal cadherin Desmoglein-2 controls extracellular matrix expression and remodeling via NF-κB signaling in keratinocytes. Front. Cell Dev. Biol. 2025, 13, 1691260. [Google Scholar] [CrossRef] [PubMed]
Figure 1.
DSG2 expression characterization across HNSCC cohorts. (A) UMAP visualization of GSE139324 single-cell RNA-seq data (n = 133,308 cells) showing cell type annotation (left) and DSG2 expression overlay (right; log-normalized counts, color scale: low purple → high yellow), confirming epithelial-restricted DSG2 expression with negligible signal in stromal and immune populations. (B) Distribution of DSG2 expression in TCGA-HNSC (n = 566; log2 RSEM+1); red dashed line indicates. median (12.85, IQR 11.06–13.66); KDE overlay demonstrates right-skewed distribution consistent with a DSG2-high tumor subset. (C) DSG2 expression by HPV status (HPV+: n = 39, HPV−: n = 75); Mann-Whitney p = 0.219.
Figure 1.
DSG2 expression characterization across HNSCC cohorts. (A) UMAP visualization of GSE139324 single-cell RNA-seq data (n = 133,308 cells) showing cell type annotation (left) and DSG2 expression overlay (right; log-normalized counts, color scale: low purple → high yellow), confirming epithelial-restricted DSG2 expression with negligible signal in stromal and immune populations. (B) Distribution of DSG2 expression in TCGA-HNSC (n = 566; log2 RSEM+1); red dashed line indicates. median (12.85, IQR 11.06–13.66); KDE overlay demonstrates right-skewed distribution consistent with a DSG2-high tumor subset. (C) DSG2 expression by HPV status (HPV+: n = 39, HPV−: n = 75); Mann-Whitney p = 0.219.
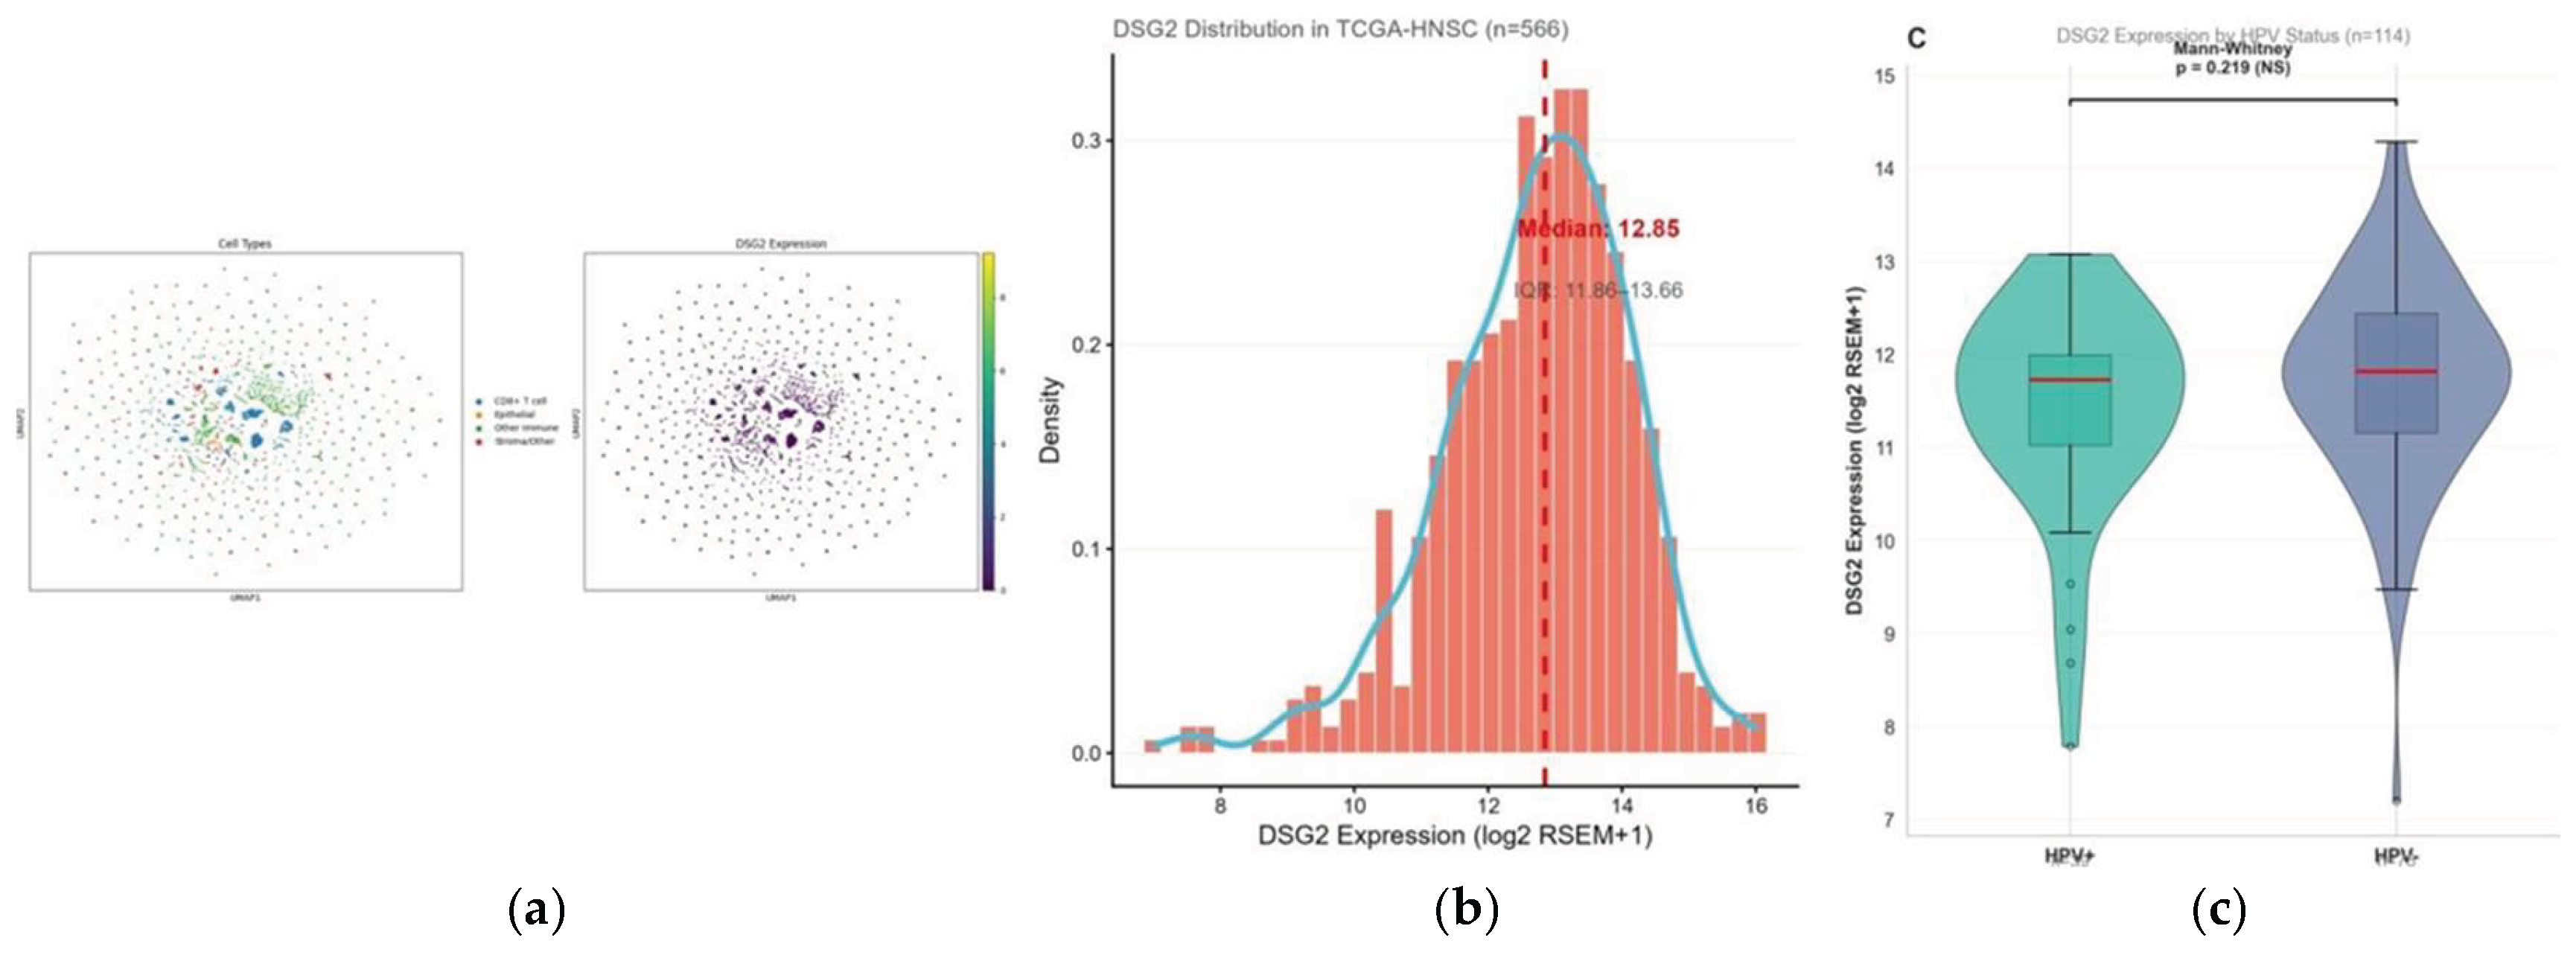
Figure 2.
(A) Scatter plot of DSG2 vs. CXCL8 expression in TCGA-HNSC (Rho = 0.228, p = 4.4 × 10⁻⁸). (B) Single-cell analysis (GSE139324, n = 133,308 cells) reveals negligible correlation (Rho = 0.023, R² = 0.000) with non-monotonic pattern. (C) Correlation heatmap of DSG2, CXCL8, myCAF score, and immune markers. (D) DSG2 vs. myCAF score (Rho = 0.216, p = 2.2 × 10⁻⁷).
Figure 2.
(A) Scatter plot of DSG2 vs. CXCL8 expression in TCGA-HNSC (Rho = 0.228, p = 4.4 × 10⁻⁸). (B) Single-cell analysis (GSE139324, n = 133,308 cells) reveals negligible correlation (Rho = 0.023, R² = 0.000) with non-monotonic pattern. (C) Correlation heatmap of DSG2, CXCL8, myCAF score, and immune markers. (D) DSG2 vs. myCAF score (Rho = 0.216, p = 2.2 × 10⁻⁷).
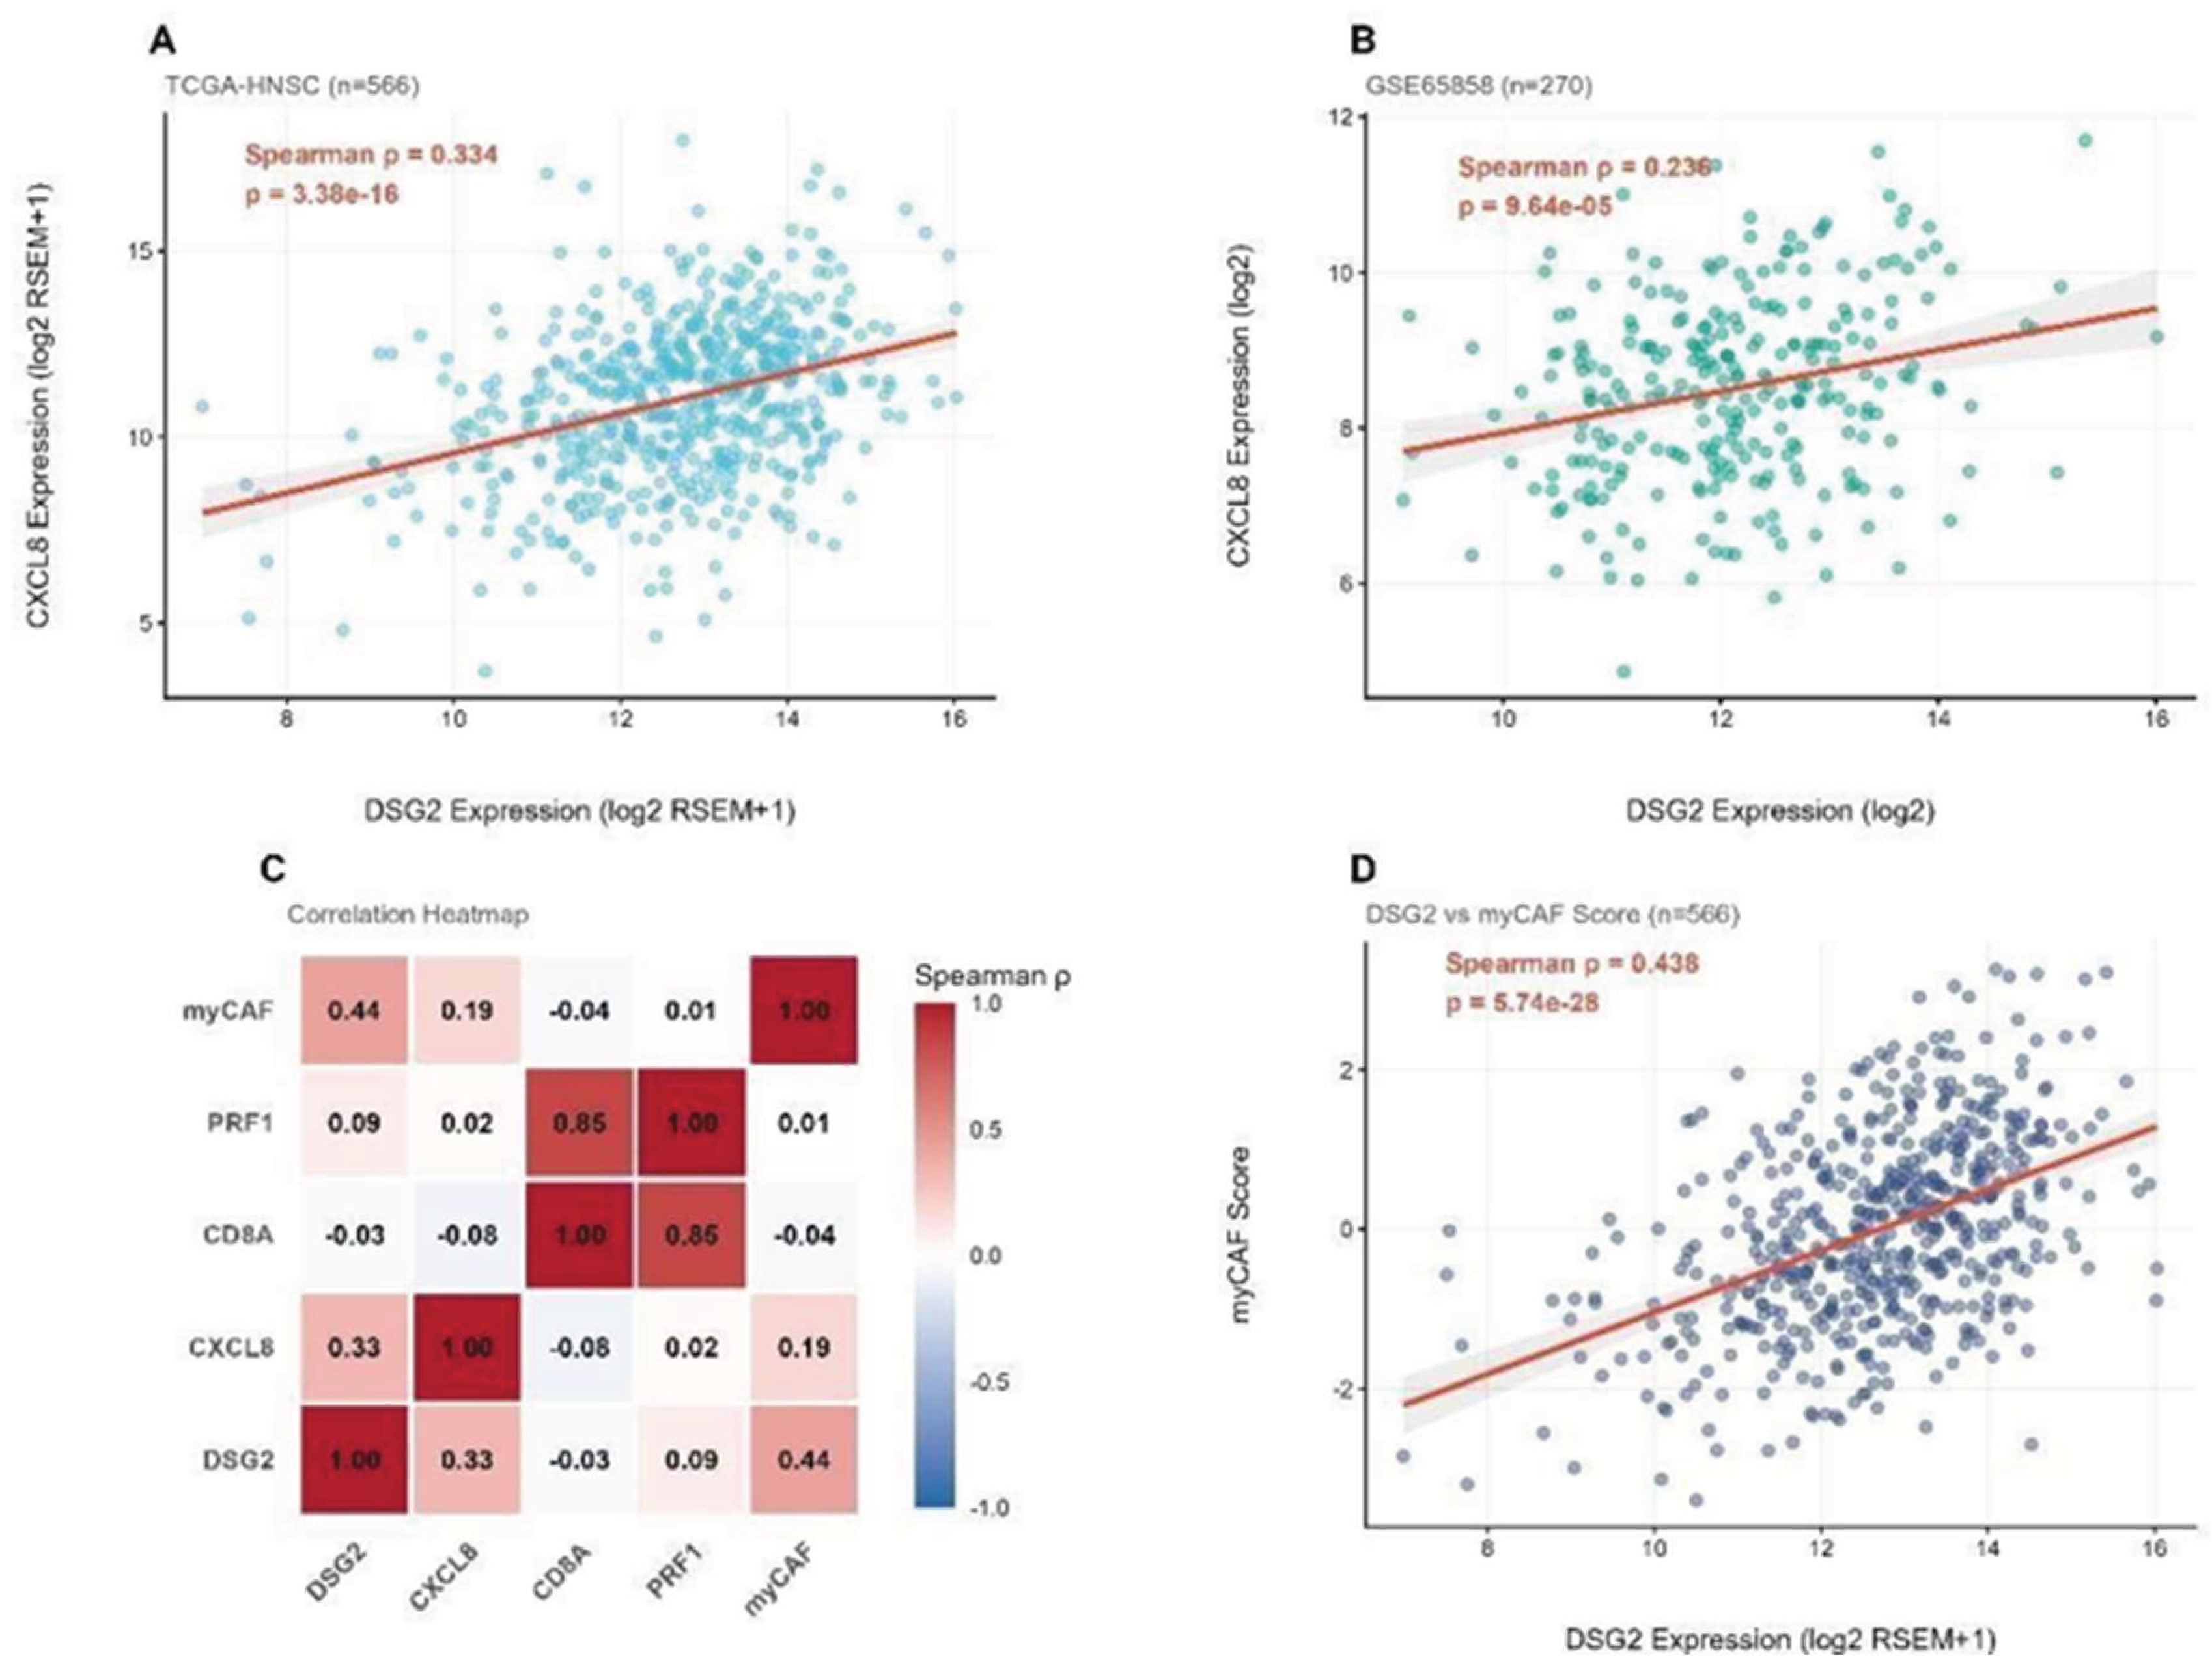
Figure 3.
(A) Forest plot of DSG2-cytolytic activity (CYT) correlations across 4 squamous TCGA. cancer types. Squamous cancers show consistent negative correlations (pooled Rho = -0.213, I² = 58.6%). (B) DSG2 expression by immune phenotype (Kruskal-Wallis p = 0.016). (C) Scatter plots of DSG2 vs. CD8_score and Cytotoxic_Score.
Figure 3.
(A) Forest plot of DSG2-cytolytic activity (CYT) correlations across 4 squamous TCGA. cancer types. Squamous cancers show consistent negative correlations (pooled Rho = -0.213, I² = 58.6%). (B) DSG2 expression by immune phenotype (Kruskal-Wallis p = 0.016). (C) Scatter plots of DSG2 vs. CD8_score and Cytotoxic_Score.
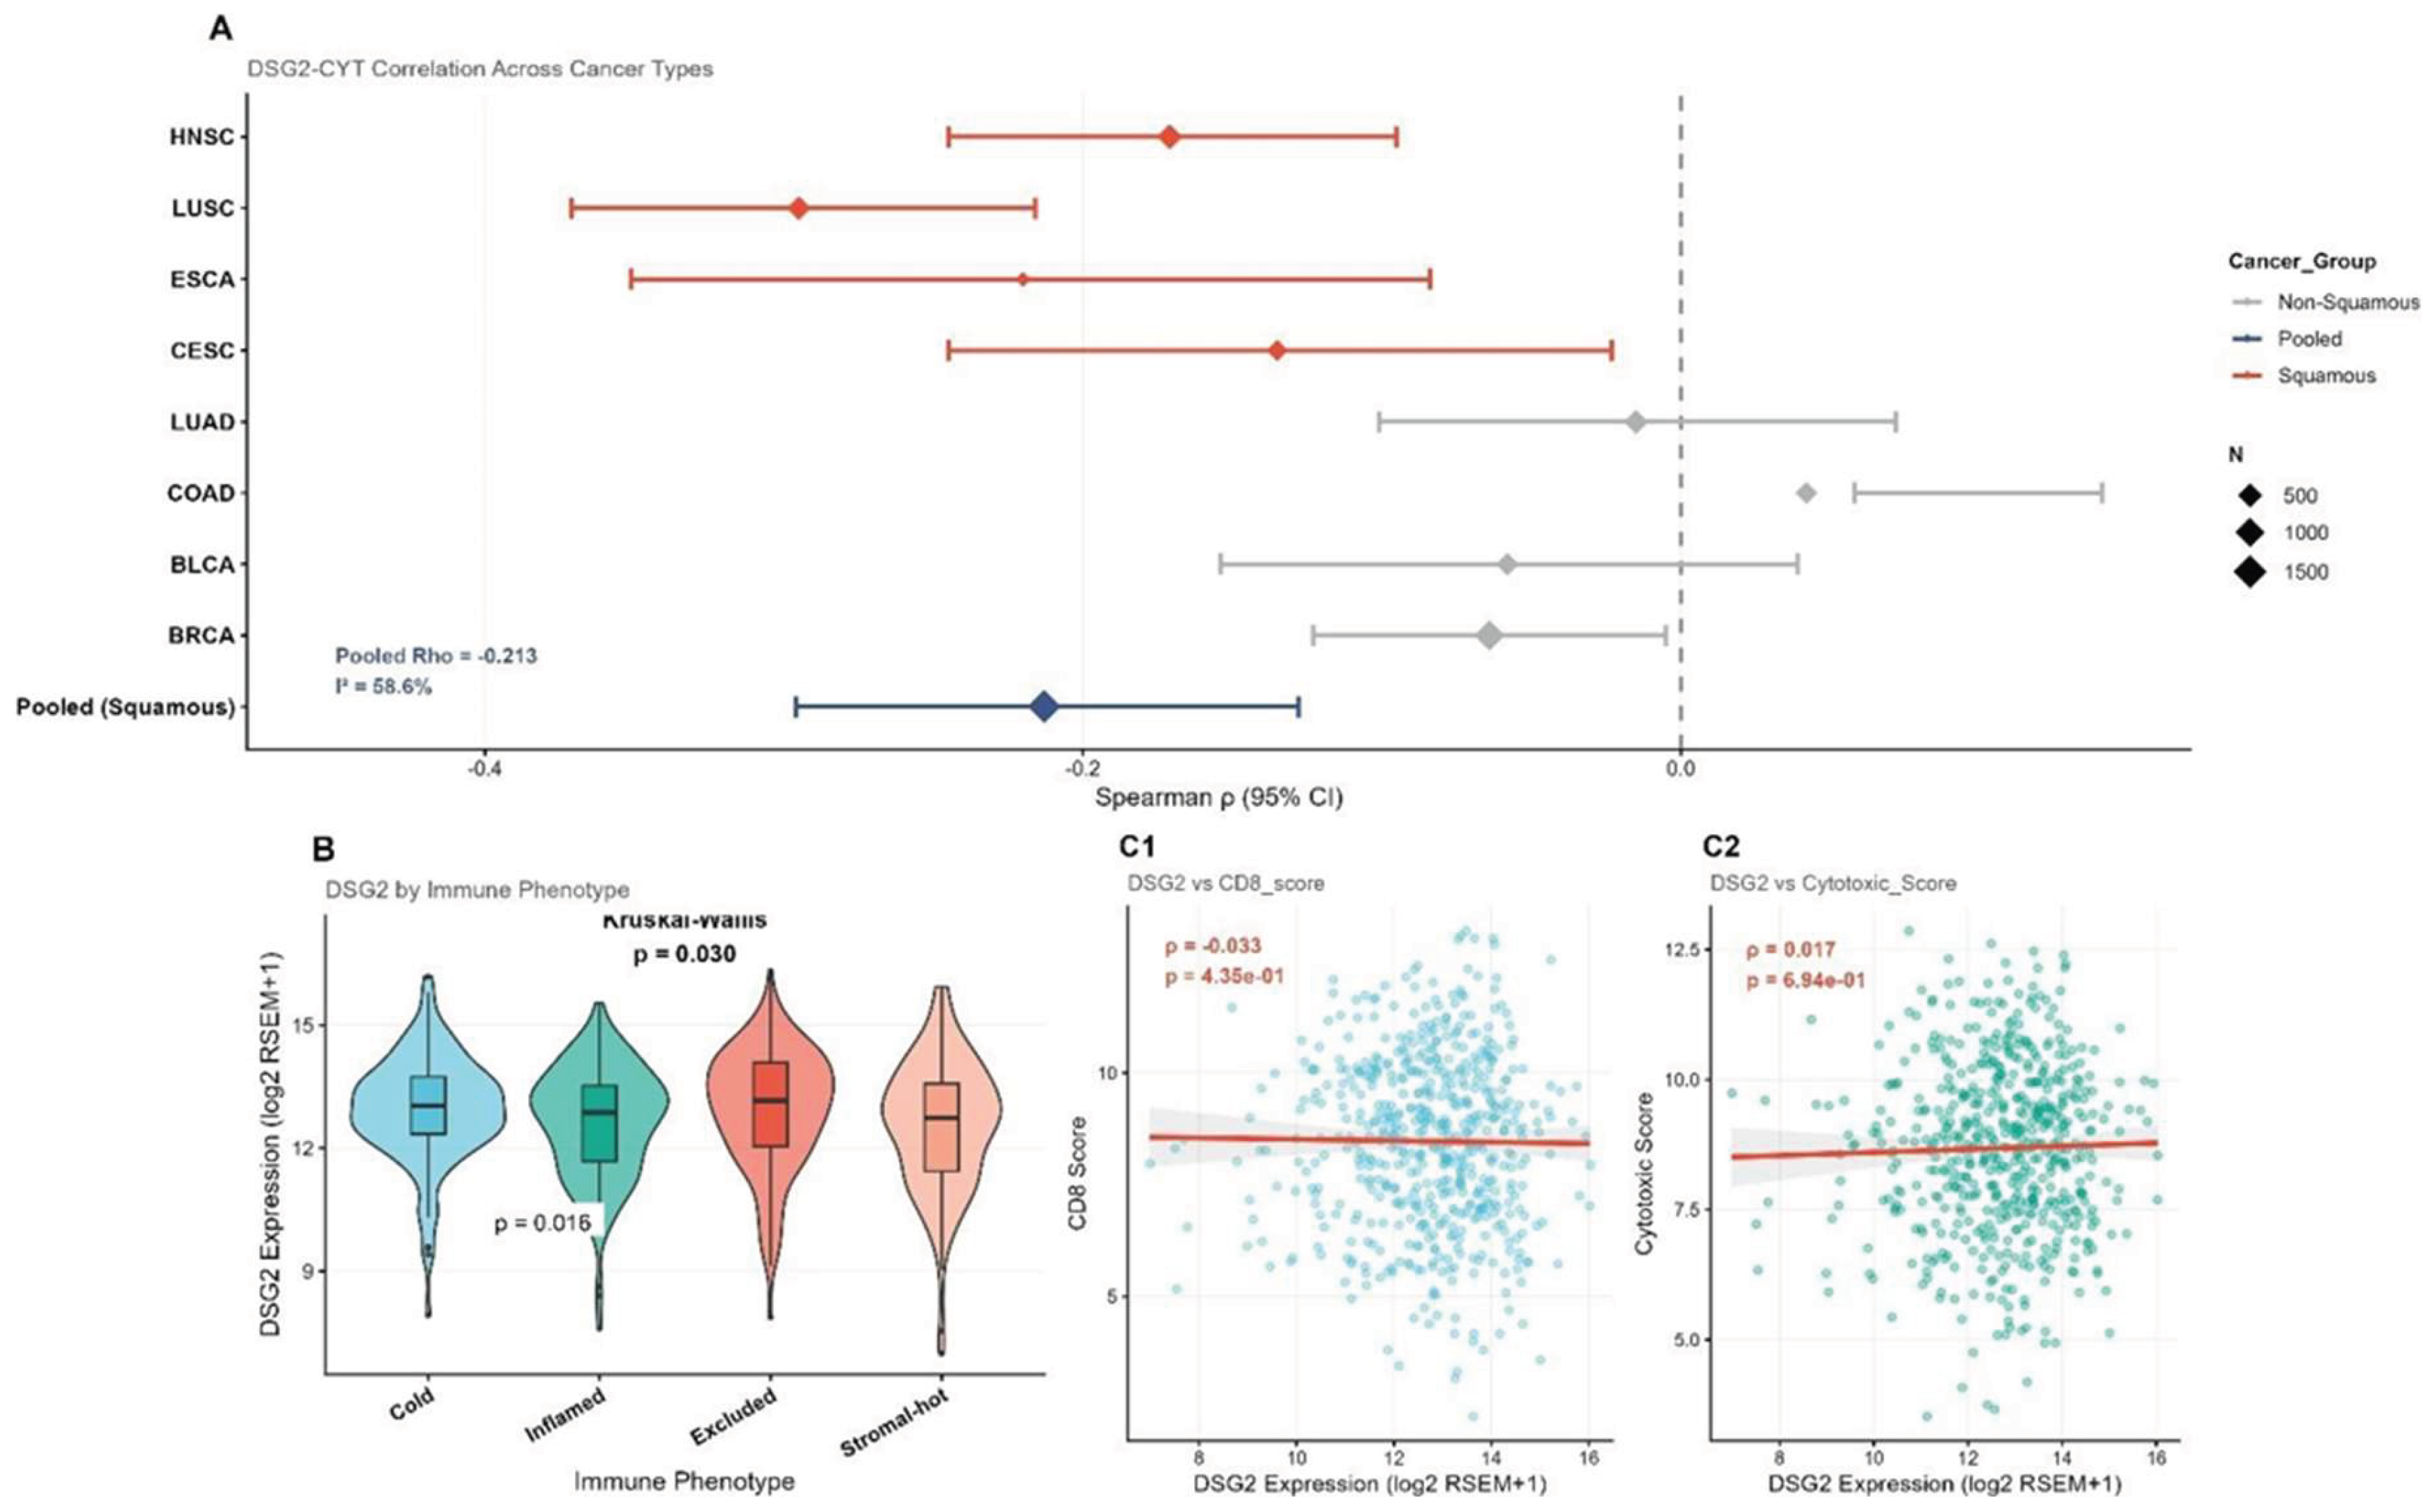
Figure 4.
CD8A exclusion near DSG2-high spots across 12 HNSCC Visium samples. (A) Effect sizes per sample. (B) Statistical significance. (C) Neighborhood CD8A comparison. (D) Distribution of spatial exclusion enrichment scores across 12 tumors (mean = 0.636; fraction metric). Inset: mean neighborhood CD8A difference between DSG2-high and DSG2-low regions (mean difference = 0.004), reflecting subtle but consistent directional depletion sizes.
Figure 4.
CD8A exclusion near DSG2-high spots across 12 HNSCC Visium samples. (A) Effect sizes per sample. (B) Statistical significance. (C) Neighborhood CD8A comparison. (D) Distribution of spatial exclusion enrichment scores across 12 tumors (mean = 0.636; fraction metric). Inset: mean neighborhood CD8A difference between DSG2-high and DSG2-low regions (mean difference = 0.004), reflecting subtle but consistent directional depletion sizes.
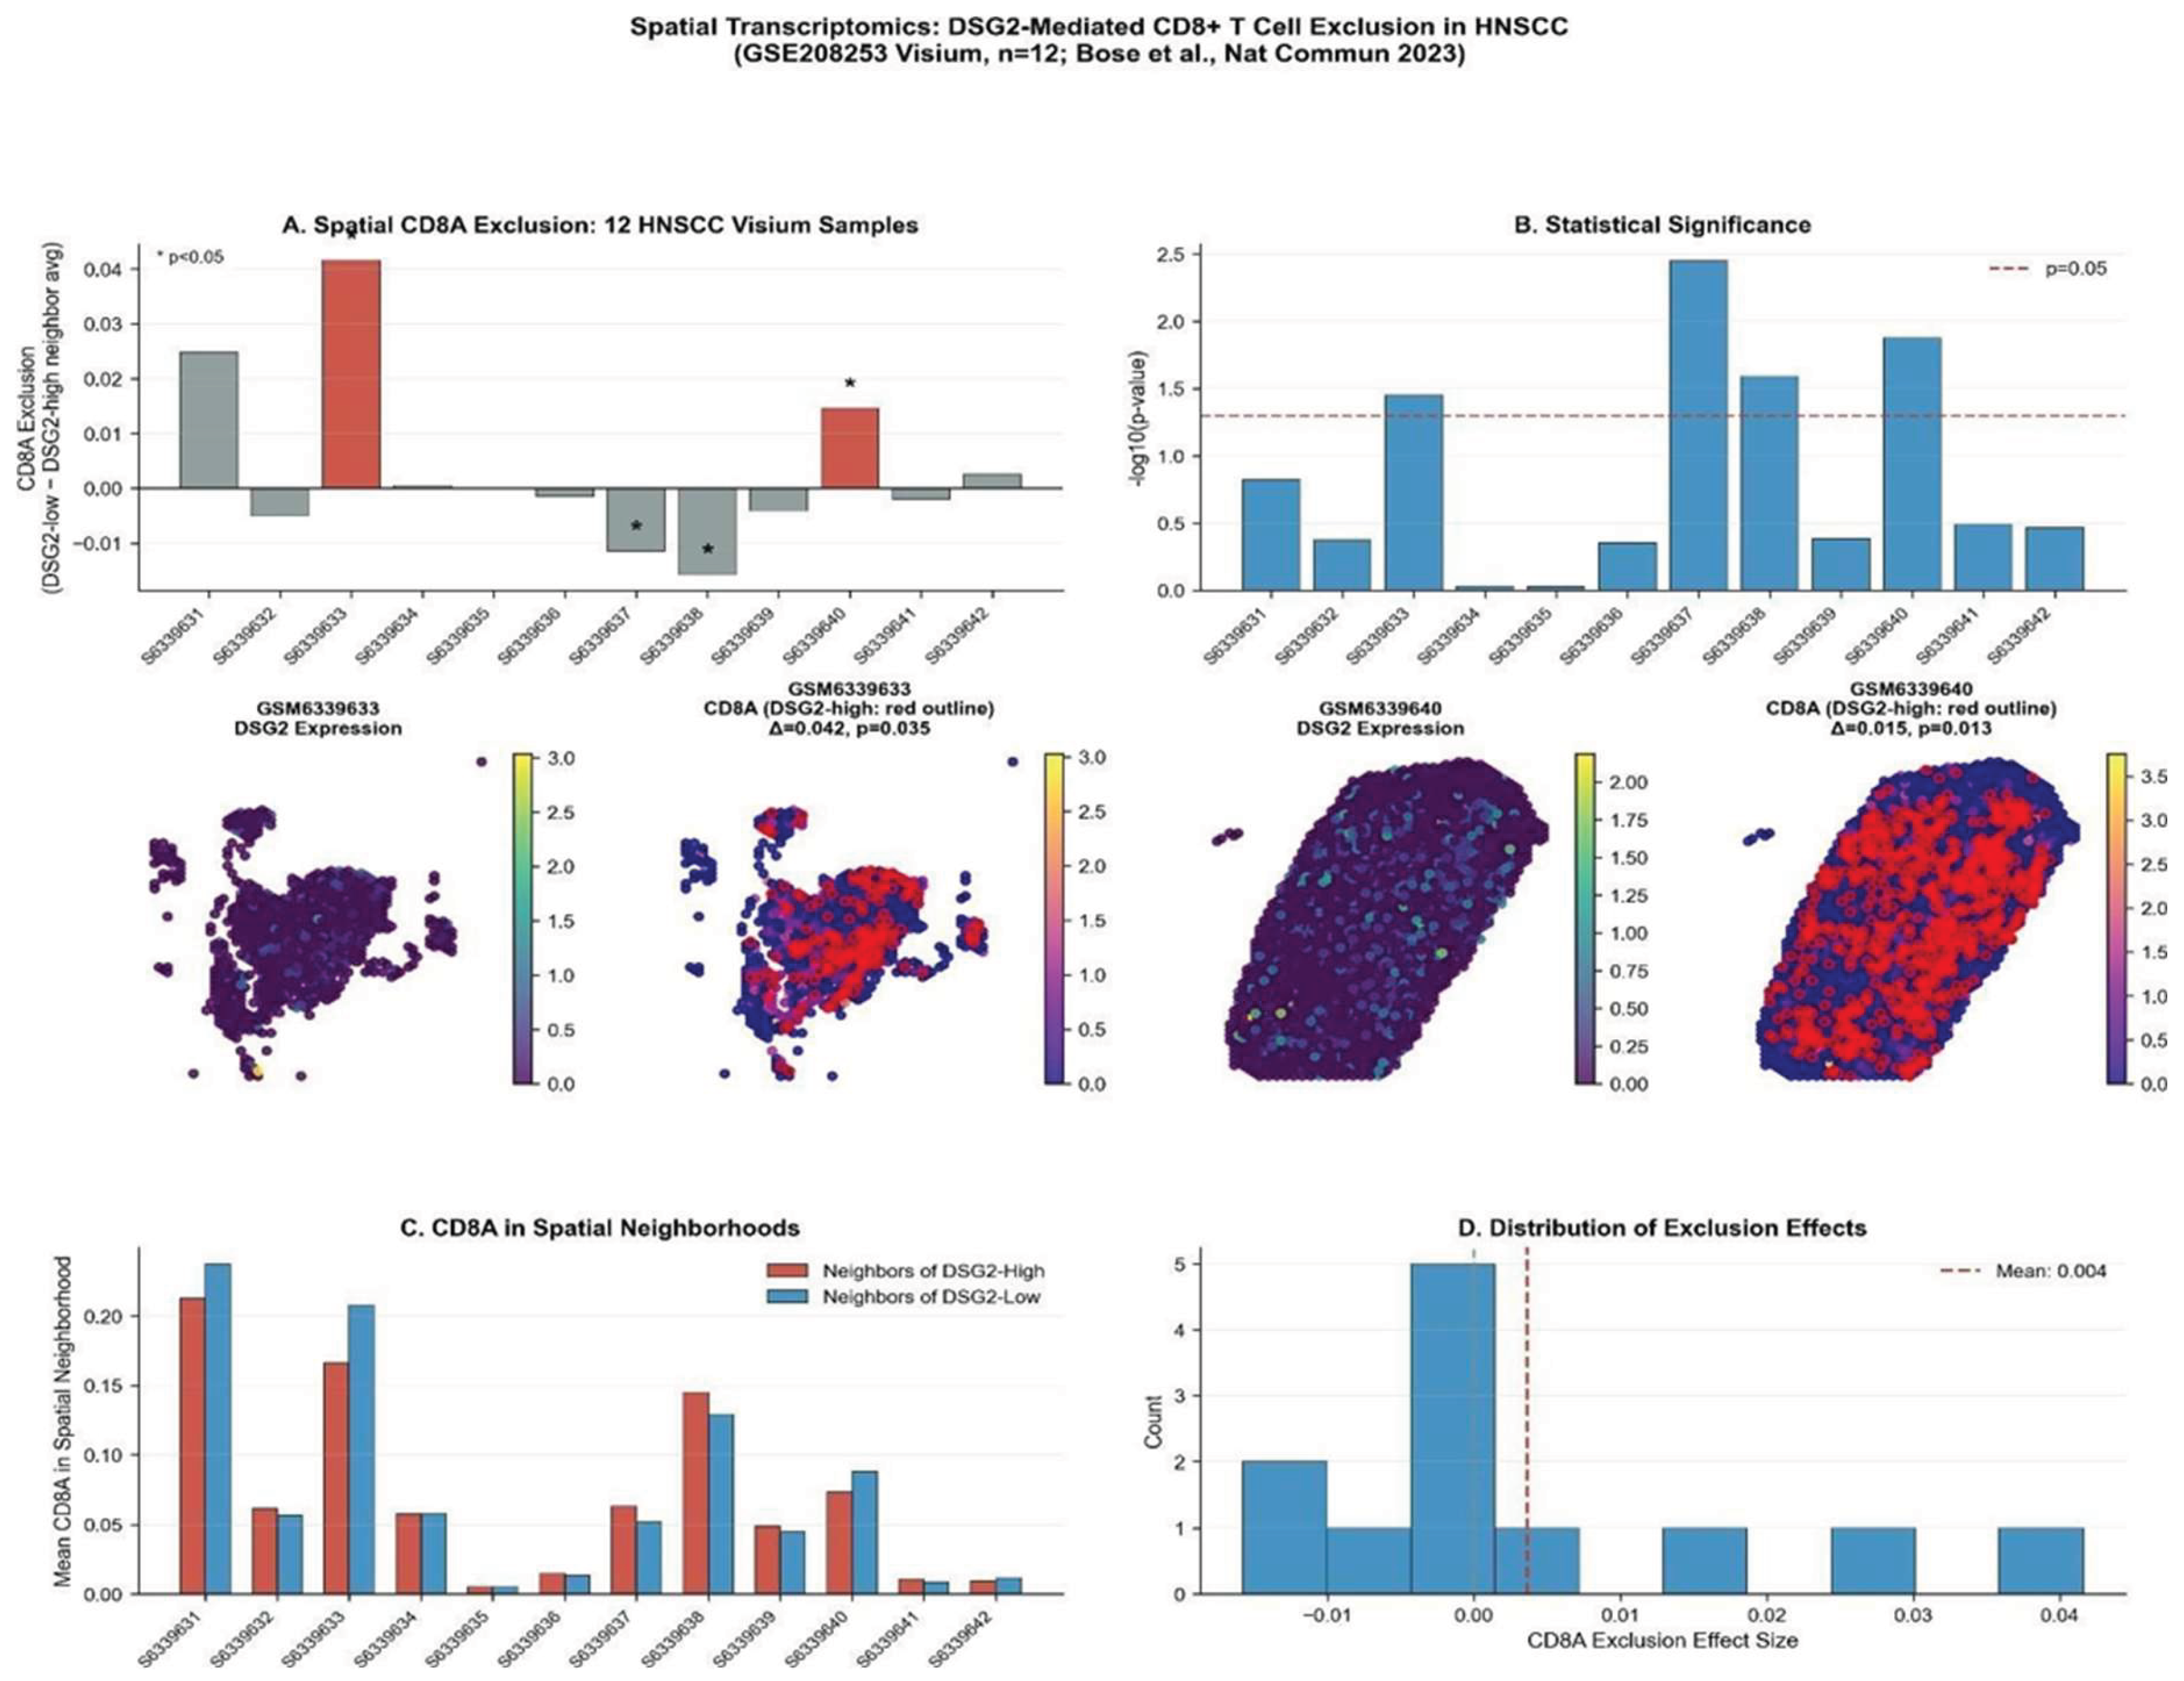
Figure 5.
WGCNA gene signature and survival validation. (A) WGCNA dendrogram showing hierarchical clustering; DSG2 belongs to the black module. (B) Kaplan-Meier curves for the 8-gene signature across training (TCGA-HNSC, n = 566; B1), external validation GSE41613 (HPV-negative OSCC, n = 97; HR = 3.09, p = 0.003; B2), and GSE65858 (n = 270; HR = 1.57, p = 0.032; B3). (C) Time-.
Figure 5.
WGCNA gene signature and survival validation. (A) WGCNA dendrogram showing hierarchical clustering; DSG2 belongs to the black module. (B) Kaplan-Meier curves for the 8-gene signature across training (TCGA-HNSC, n = 566; B1), external validation GSE41613 (HPV-negative OSCC, n = 97; HR = 3.09, p = 0.003; B2), and GSE65858 (n = 270; HR = 1.57, p = 0.032; B3). (C) Time-.
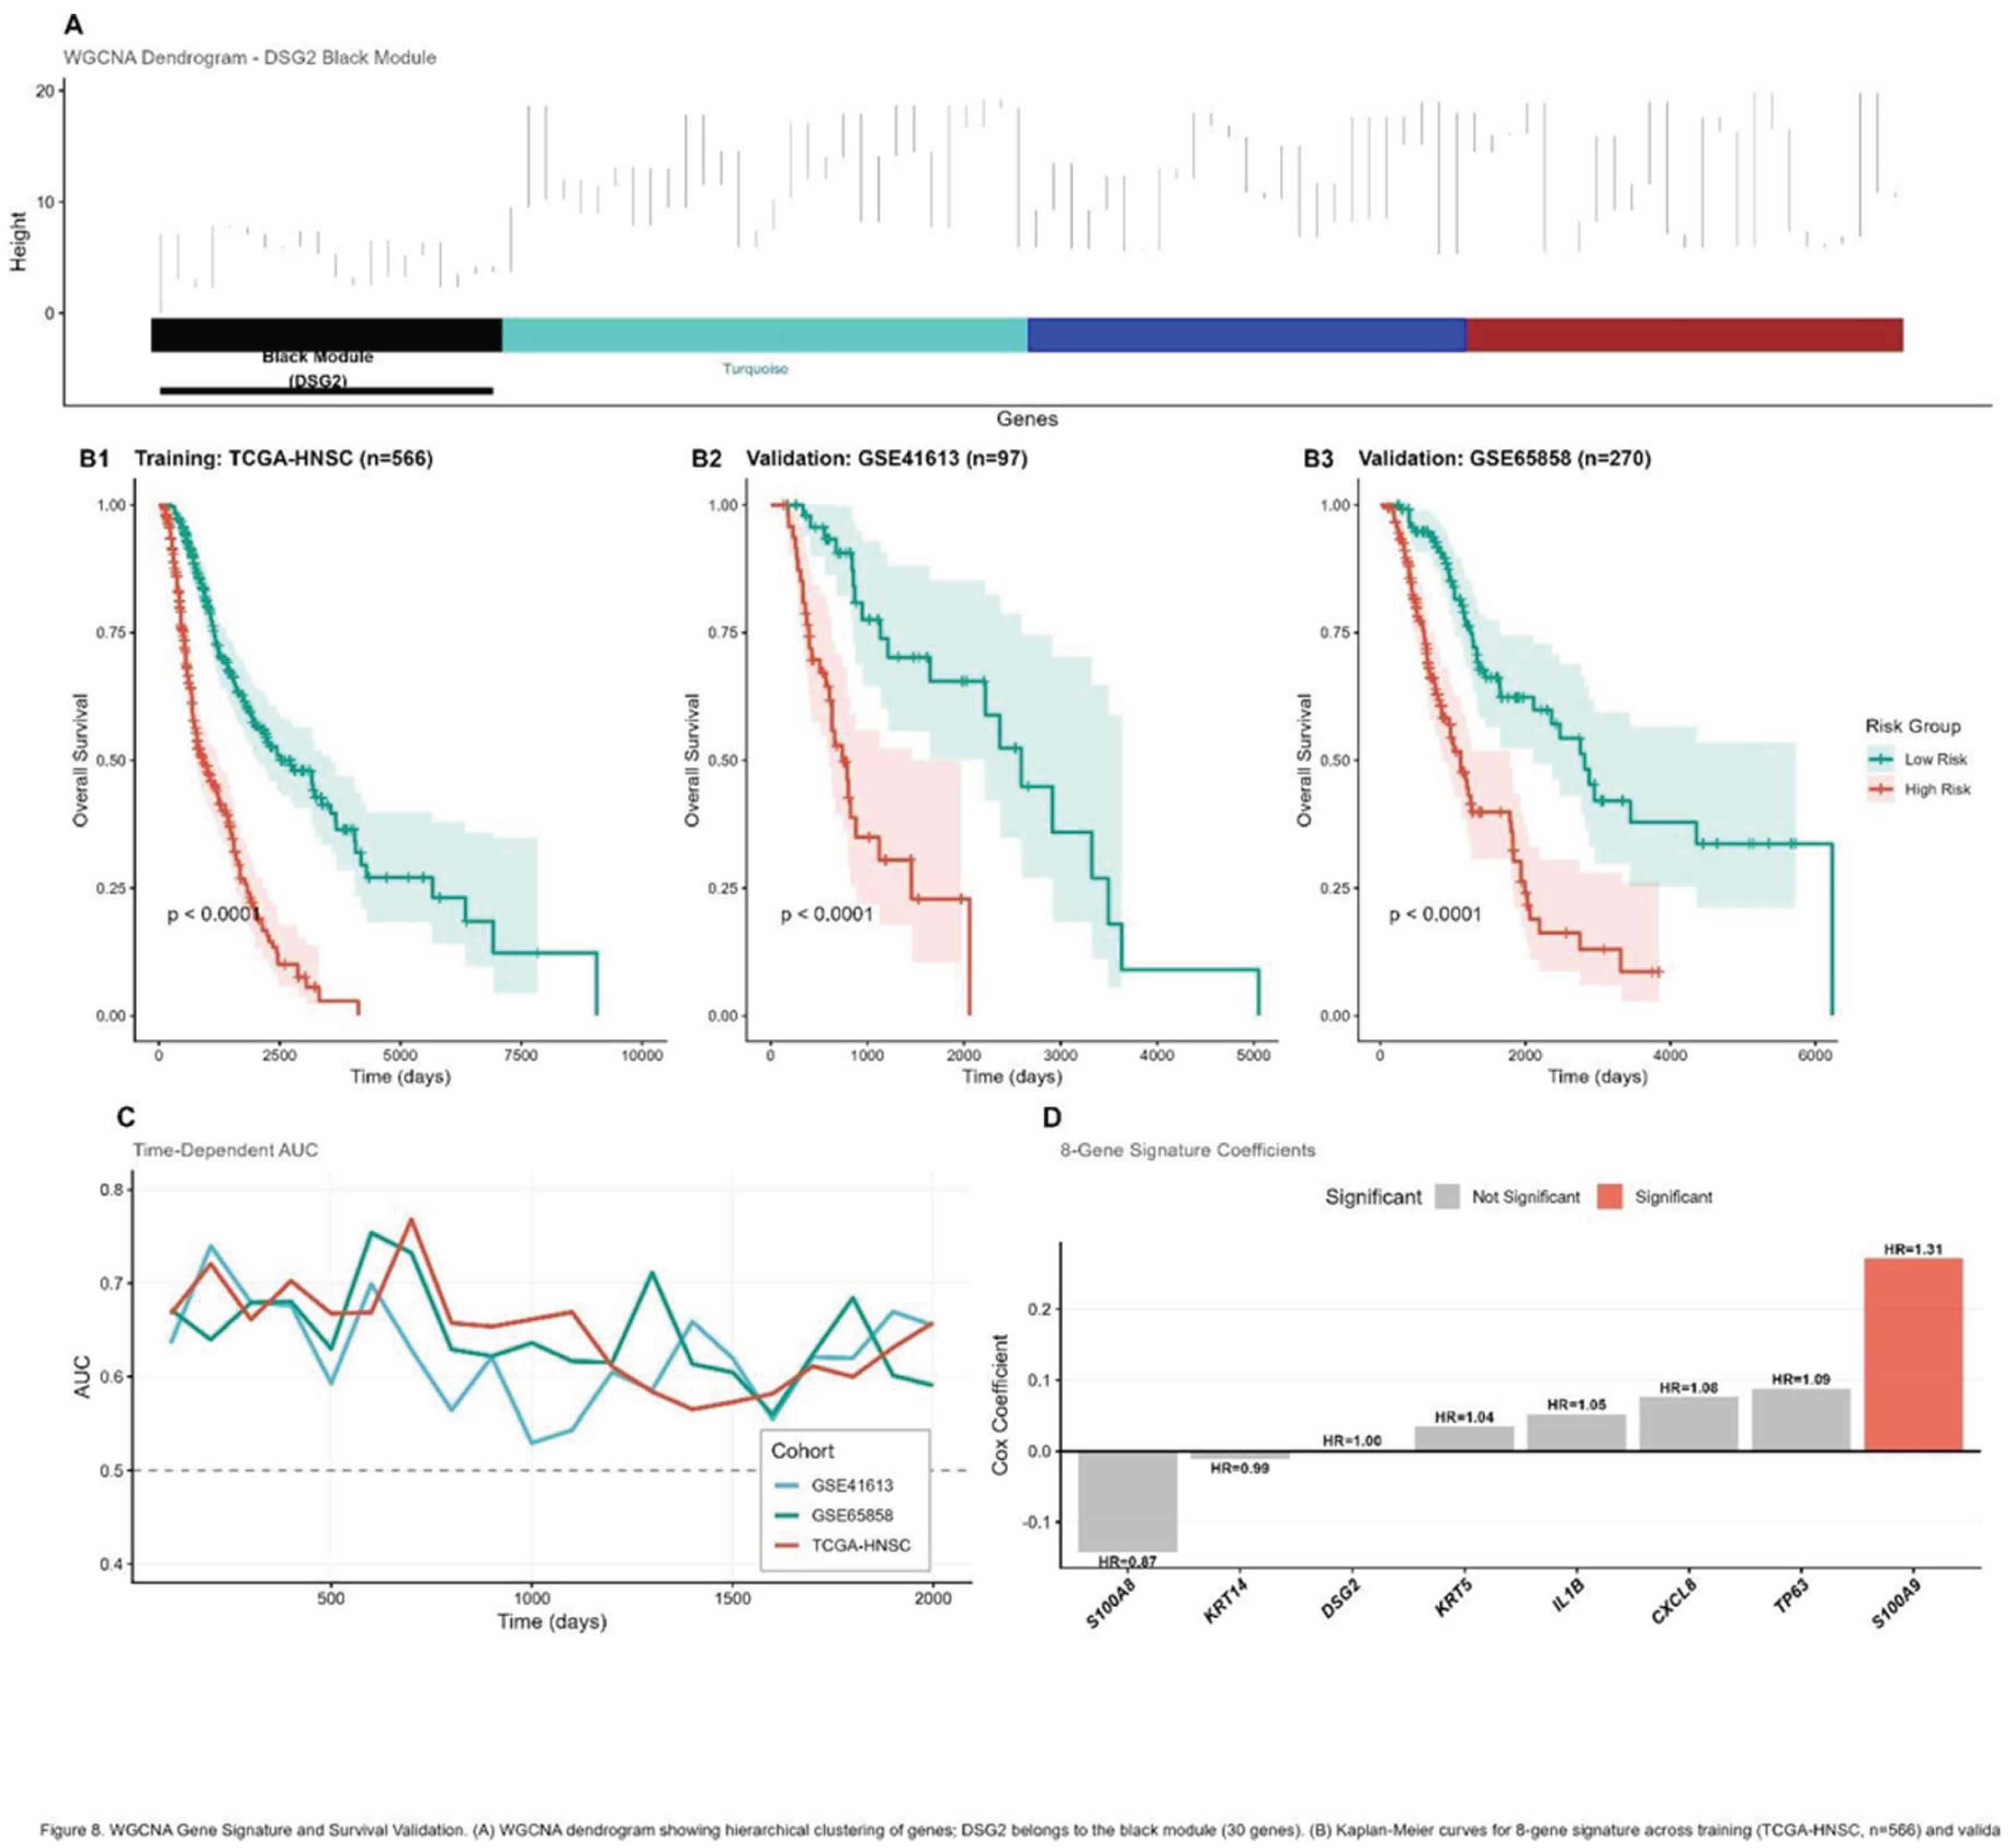
Figure 6.
CellChat ligand-receptor analysis. (A) Ranked epithelial→CAF interaction probabilities; CXCL8-CXCR2 ranks #1 (probability = 0.821). (B) DSG2-high vs. DSG2-low epithelial cell CXCL8 signaling capacity (1.80-fold enrichment).
Figure 6.
CellChat ligand-receptor analysis. (A) Ranked epithelial→CAF interaction probabilities; CXCL8-CXCR2 ranks #1 (probability = 0.821). (B) DSG2-high vs. DSG2-low epithelial cell CXCL8 signaling capacity (1.80-fold enrichment).
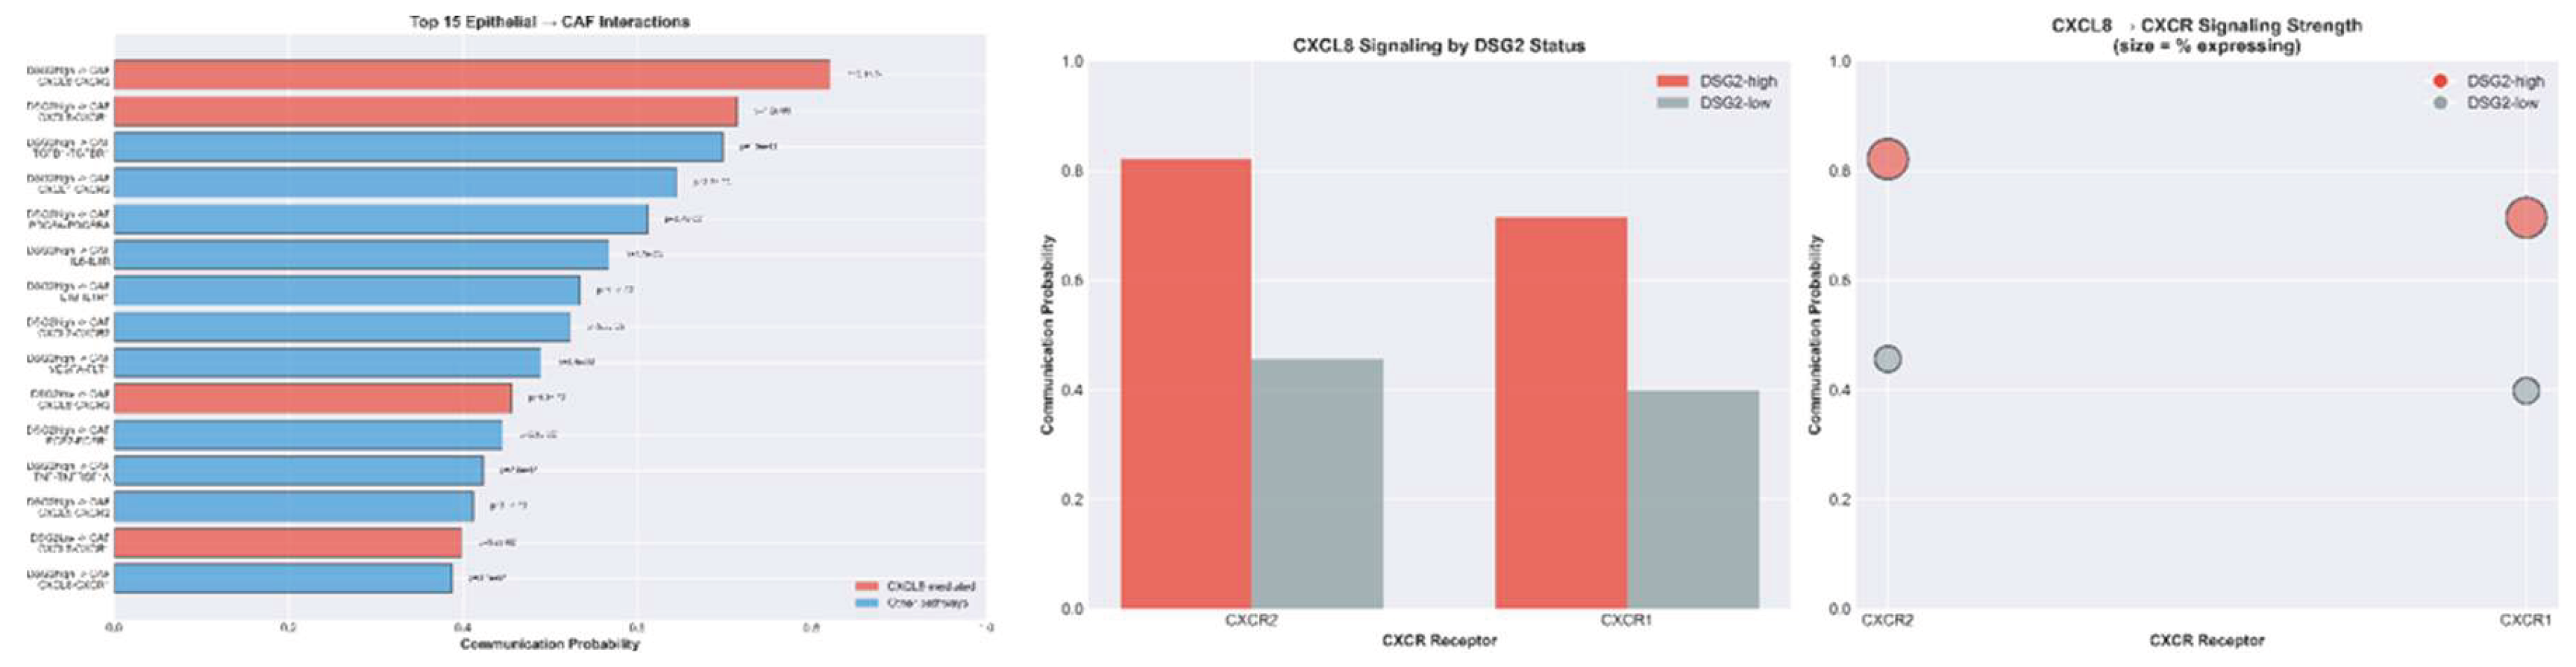
Figure 7.
A. CPTAC-HNSCC protein-level validation. (A) DSG2 protein vs. CD8A protein correlation (Spearman rho = -0.35, p = 2.2 × 10⁻⁴, n = 108). B. Cross-cohort mRNA-protein distribution comparison.
Figure 7.
A. CPTAC-HNSCC protein-level validation. (A) DSG2 protein vs. CD8A protein correlation (Spearman rho = -0.35, p = 2.2 × 10⁻⁴, n = 108). B. Cross-cohort mRNA-protein distribution comparison.
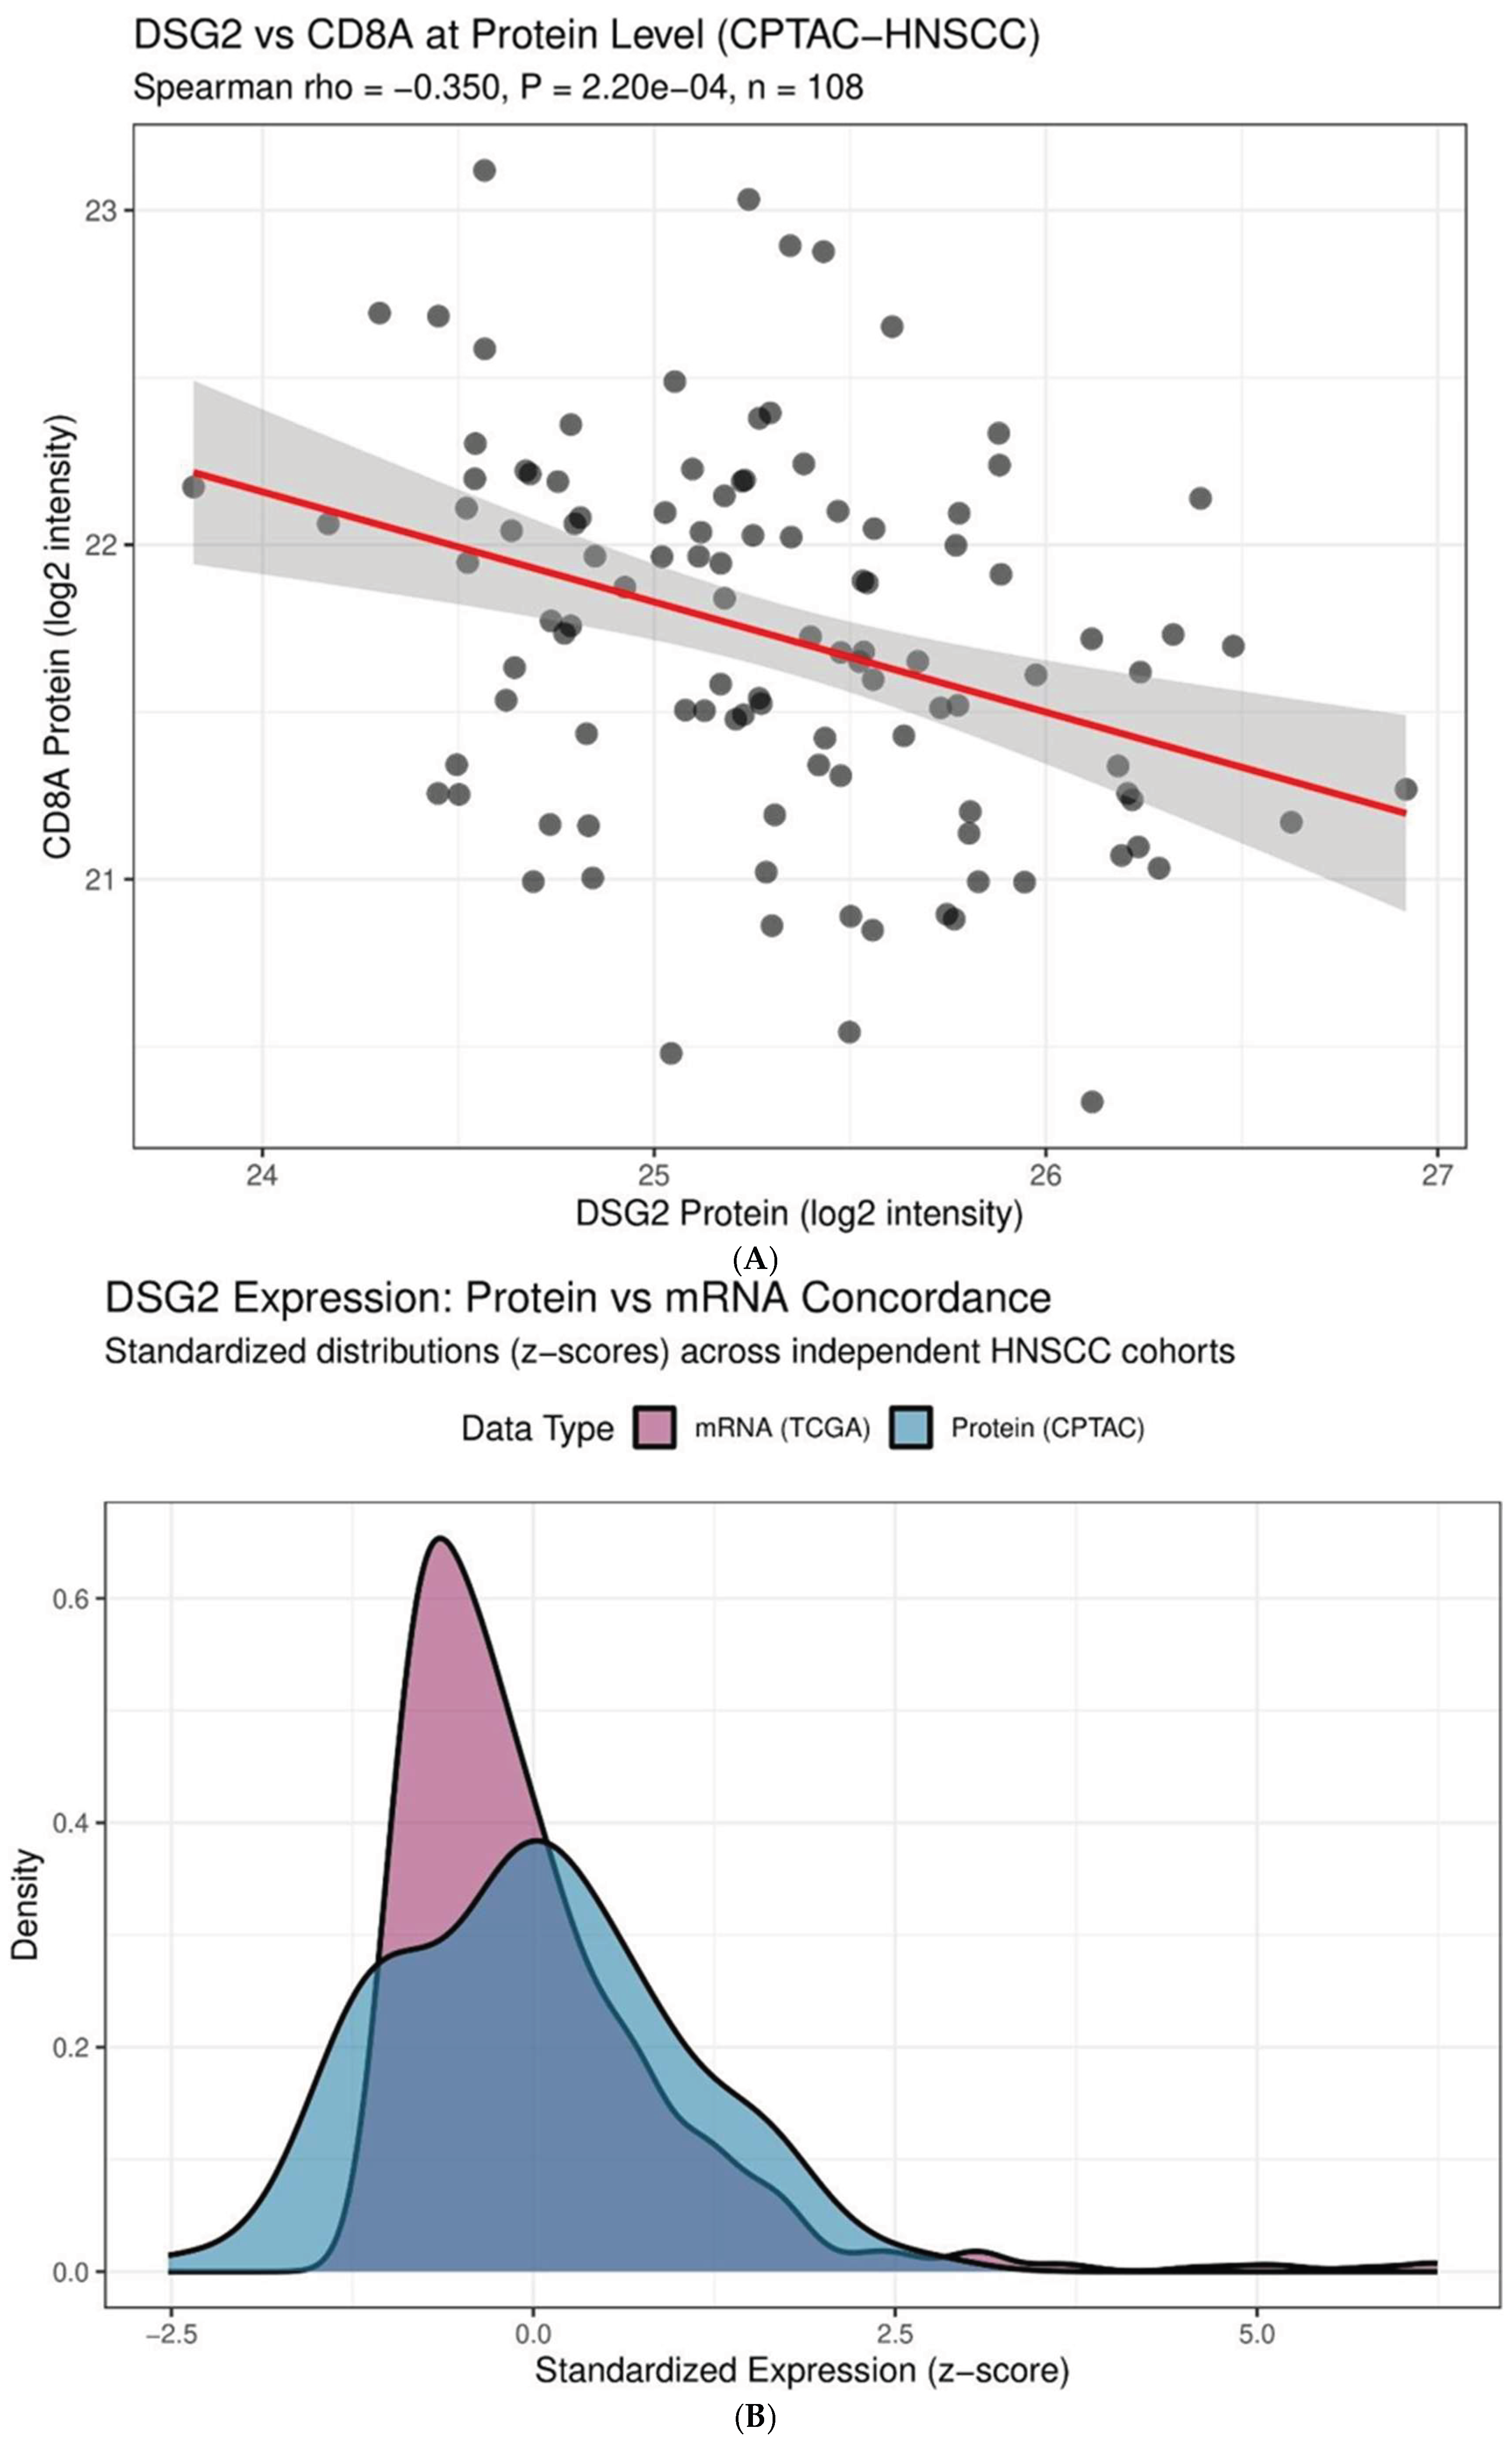
Figure 8.
DepMap therapeutic vulnerability analysis. (A) DSG2 expression vs. CXCR2 inhibitor (reparixin) drug sensitivity (AUC) across 132 HNSCC lines (rho = -0.408, p < 0.0001). (B) Co- 422 dependency analysis showing DSG2 knockout correlates with CXCL8 pathway genes.
Figure 8.
DepMap therapeutic vulnerability analysis. (A) DSG2 expression vs. CXCR2 inhibitor (reparixin) drug sensitivity (AUC) across 132 HNSCC lines (rho = -0.408, p < 0.0001). (B) Co- 422 dependency analysis showing DSG2 knockout correlates with CXCL8 pathway genes.
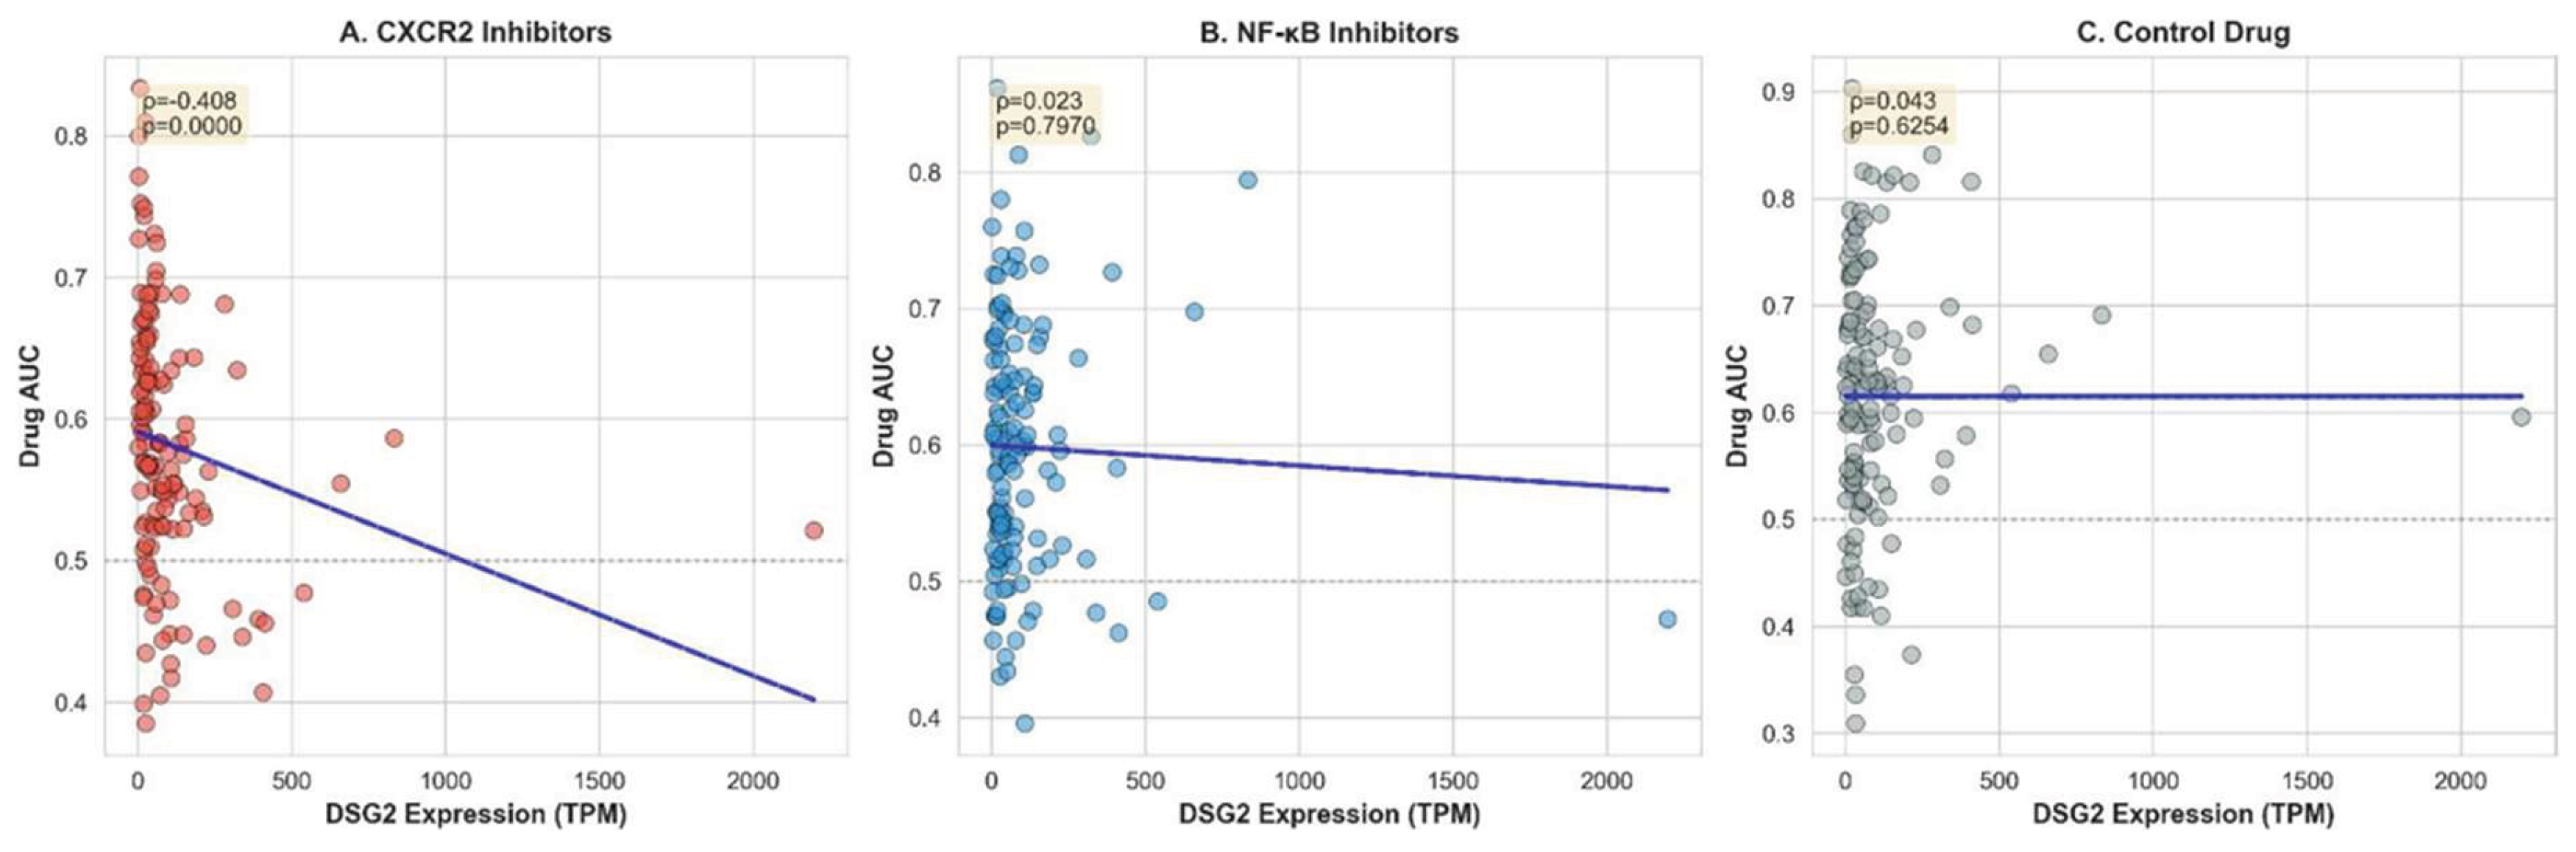
Table 1.
DSG2 Expression by HPV Status.
| Cohort | N | HPV+ | HPV- | DSG2 HPV+ (Mean ± SD) | DSG2 HPV- (Mean ± SD) | p-Value |
| TCGA-HNSC | 114 | 39 (34%) | 75 (66%) | 11.40 ± 1.15 | 11.74 ± 1.12 | 0.219 |
Table 2.
DSG2-CXCL8 Correlation Across Independent Cohorts.
| Cohort | N | Spearman ρ | 95% CI | p-Value |
| TCGA-HNSC | 566 | +0.228 | [0.150, 0.302] | 4.4 × 10⁻⁸ |
| GSE65858 | 270 | +0.248 | [0.132, 0.357] | 3.7 × 10⁻⁵ |
| Meta-analysis | 836 | +0.236 | [0.170, 0.300] | <1.0 × 10⁻¹⁰ |
Table 4.
DSG2 Correlations with Immune and Stromal Scores (TCGA-HNSC, n = 566).
| Score | Spearman ρ | p-Value | Interpretation |
| Stromal Score (ESTIMATE) | +0.261 | 2.2 × 10⁻¹⁰ | High stromal content |
| Immune Score (ESTIMATE) | -0.136 | 0.001 | Low immune infiltration |
| CD8_score | -0.228 | 5.8 × 10⁻⁵ | Low CD8+ infiltration |
| Cytotoxic_Score | -0.240 | 2.2 × 10⁻⁵ | Low cytotoxic activity |
| Interferon_Gamma_Response | -0.197 | 1.8 × 10⁻⁴ | Reduced IFN-γ response |
Table 5.
Top 10 Transcription Factor-Target Correlations.
| TF | Category | Target | Spearman ρ | p-Value |
| TP63 | Epithelial | DSG2 | +0.412 | 1.23 × 10⁻²⁴ |
| KLF4 | Epithelial | DSG2 | +0.318 | 8.45 × 10⁻¹⁵ |
| KLF5 | Epithelial | DSG2 | +0.234 | 2.31 × 10⁻⁸ |
| STAT3 | STAT | DSG2 | +0.189 | 3.21 × 10⁻⁶ |
| SNAI1 | EMT | DSG2 | +0.167 | 1.89 × 10⁻⁴ |
| RELA | Inflammatory | CXCL8 | +0.489 | 3.21 × 10⁻³⁴ |
| NFKB1 | Inflammatory | CXCL8 | +0.421 | 5.67 × 10⁻²⁶ |
| FOS | Inflammatory | CXCL8 | +0.378 | 1.23 × 10⁻²¹ |
| JUN | Inflammatory | CXCL8 | +0.365 | 4.56 × 10⁻²⁰ |
| STAT1 | STAT | CXCL8 | +0.312 | 2.34 × 10⁻¹⁴ |
Table 6.
DSG2 Prognostic Value with Clinical Variables (TCGA-HNSC).
| Model | N | C-index | HR | 95% CI | p-Value |
| DSG2 alone | 306 | 0.562 | 1.115 | [0.85-1.46] | 0.43 |
| Age alone | 306 | 0.577 | 1.032/year | [1.02-1.04] | <0.001 |
| Full model (all clinical vars) | 306 | 0.646 | DSG2: 0.98 | [0.73-1.32] | 0.89 |
Table 7.
LASSO-Penalized Cox Model Coefficients (λ = 0.0043).
| Feature | Coefficient | HR | p-Value | Interpretation |
| AGE | +0.245 | 1.278 | 6.37 × 10⁻⁴ *** | Strong risk factor |
| IL6 | +0.182 | 1.200 | 0.016 * | Risk factor |
| GZMB | -0.118 | 0.889 | 0.042 * | Protective |
| PTGS2 | +0.095 | 1.099 | 0.089 | NS trend |
| DSG2 | -0.077 | 0.926 | 0.245 | Not prognostic |
| CXCL8 | +0.064 | 1.066 | 0.312 | NS |
| CXCL1 | +0.052 | 1.053 | 0.421 | NS |
| CD274 | -0.048 | 0.953 | 0.498 | NS |
| PRF1 | -0.042 | 0.959 | 0.534 | NS |
| IFNG | -0.039 | 0.962 | 0.601 | NS |
Table 8.
8-Gene Signature External Validation.
| Cohort | N | Events | Log-rank p | Cox HR [95% CI] | C-index | Time-dep.AUC |
| TCGA-HNSC (training) |
253 | 108 | 0.012 | 1.89 [1.15-3.10] | 0.612 | 0.59-0.65 |
| GSE41613 (validation) | 97 | 48 | 0.003 ** | 3.09 [1.41-6.76] | 0.679 | 0.67-0.75 |
| GSE65858 (validation) | 270 | 94 | 0.032 * | 1.57 [1.04-2.37] | 0.594 | 0.56-0.61 |
Table 9.
Tissue-Level CXCL8 Mediation of DSG2-TME Associations.
| Outcome | Indirect Effect | Prop. Mediated | 95% CI | p-Value |
| myCAF activation (TCGA) | 0.2121 | 43.6% | [34.3-53.6%] | <0.0001 |
| myCAF activation (GSE65858) | 0.1801 | 35.7% | [24.9-49.1%] | <0.0001 |
| CD8+ infiltration (TCGA) | -0.1433 | 42.5% | [28.5-60.1%] | <0.0001 |
| CD8+ infiltration (GSE65858) | -0.1644 | 47.2% | [29.6-74.4%] | <0.0001 |
Table 10.
TIDE Scores by DSG2-PD-L1 Stratification (ANOVA p = 2.5 × 10⁻⁴).
| Stratum | N | Mean TIDE | SD | Interpretation |
| DSG2-high/PD-L1-high | 135 | 0.287 | 1.357 | Worst predicted ICI response |
| DSG2-high/PD-L1-low | 146 | 0.192 | 1.328 | Intermediate |
| DSG2-low/PD-L1-high | 147 | -0.303 | 1.280 | Intermediate |
| DSG2-low/PD-L1-low | 137 | -0.162 | 1.283 | Best predicted ICI response |
Disclaimer/Publisher’s Note: The statements, opinions and data contained in all publications are solely those of the individual author(s) and contributor(s) and not of MDPI and/or the editor(s). MDPI and/or the editor(s) disclaim responsibility for any injury to people or property resulting from any ideas, methods, instructions or products referred to in the content. |
© 2026 by the authors. Licensee MDPI, Basel, Switzerland. This article is an open access article distributed under the terms and conditions of the Creative Commons Attribution (CC BY) license (http://creativecommons.org/licenses/by/4.0/).
Copyright: This open access article is published under a Creative Commons CC BY 4.0 license, which permit the free download, distribution, and reuse, provided that the author and preprint are cited in any reuse.


