

Submitted:
23 June 2026
Posted:
25 June 2026
You are already at the latest version
Abstract
Sulfur is the third most prevalent mineral in the human body, after phosphorus and calcium. It is a key inorganic element having biological significance across species. Ogi is a typical Nigerian traditional food in the form of a fermented cereal porridge, made from grains including maize, sorghum, and millet. In West Africa, ogi is a crucial meal essential for weaning infants and a nutritional meal for adults. In this study, the effect of elemental sulfur on the fermentation of sorghum-based slurry (ogi) was investigated. Two-hundred grams (200 g) of sorghum were prepared in four different batches with an increasing quantity of elemental sulfur at 0.5 g, 1.0 g, and 1.5 g levels of additions to prepare the study samples. Total moisture, ash, protein content and microbial load of the fermenting steep liquor and slurry were determined using standard methods. The pH, temperature and total titratable acidity were also determined using standard methods. The results of the moisture, ash and crude protein of sorghum-based ogi were 62.79%, 0.50%, and 57.89% respectively. pH results showed a decrease in the pH of the fermenting medium resulting in an increase in the total titratable acidity. The results of the pH, temperature and total titratable acidity (TTA) of the sulfur ogi slurry ranged from 3.40 to 6.36, 26 °C to 29 °C, and 0.3 to 3.9 respectively. The microbial load of the sulfur ogi slurry showed an increase in the total plate count from 6.20 Log CFU/mL to 11.25 Log CFU/mL, a decrease in the fungal count from 6.10 Log CFU/mL to 3.70 Log CFU/mL, a decrease in the enteric bacteria count from 5.90 Log CFU/mL to 1.20 Log CFU/mL and an increase in the lactic acid bacteria count from 5.90 Log CFU/mL to 10.50 Log CFU/mL. This study shows that elemental sulfur can improve the physico-chemical properties of sorghum-based ogi, hence increasing the protein content and further inhibiting the growth of enteric bacteria in food, hence its beneficial effect. The high cost of sulfur drugs and deficiency of sulfur compounds in diets necessitates the incorporation of sulfur into the fermentation of an indigenous food. Further studies on the effects of elemental sulfur and the metabolic product of sorghum-based fermented ogi for prophylactic and therapeutic purposes on the microbiota are strongly advocated.
Keywords:
synthesis
; biological investigation
; elemental sulfur
; fermentation
; sorghum-based slurry
1. Introduction
Elemental sulfur is a bright yellowish crystalline non-toxic compound. Because of its incorporation into various compounds such as amino acids, proteins, enzymes, vitamins, and more [1]. Methionine and cysteine are sulfur-containing amino acids that provide majority of dietary sulfur, with an estimated need of 14 mg/day per kg body weight. Proteins constitute dietary sulfur, however out of the 20 amino acids available only two amino acids contains sulfur [1]. Sulfur is a non-metal element in the second row of the periodic table, belonging to the oxygen (O) or chalcogen group (group 16). As a result, sulfur resembles oxygen chemically and physically, which is beneficial biologically. Sulfur has special properties that set it apart from oxygen and allow for unique biochemistry that is essential to life [2]. There are two types of sulfur compounds: organic sulfur compounds and inorganic sulfur compounds, according to research [3].
Sulfur-containing natural substances are called organosulfur compounds (OSCs). Organosulfur compounds can be found in both plants and animals in their natural state. They are essential to life because they aid in the prevention and treatment of a variety of life-threatening illnesses, including cardiovascular disease, diabetes, cancer, neurodegenerative disorders, and viral, fungal, bacterial, and infections [4]. The natural world has abundant of OSCs such as Garlic (Allium sativum) [5], Ginger (Zingiber Officinale) [6], and Onion (Allium cepa) [7]. However, some dietary supplement containing organic sulfur compounds are Methylsulfonylmethane (MSM) supplement [8] and dimethyl sulfoxide (DMSO) supplement [9]. Living organisms are capable of utilizing sulfur metabolites. Humans, for instance, are unable to fix inorganic sulphur and must instead rely on already-formed organic sulphurous compounds to meet their sulphur needs. On the other hand, they are also capable of creating new sulfur-containing chemical entities from plant organosulfur precursors [10]. Sulfur can be used to promote a strong muscle skeletal system and it also helps in body homeostasis. Sulfur has been utilised in Western medicine to treat local irritants, constipation, haemorrhoids, and skin conditions. Prior to the invention of antibiotics, it was also used to treat dysentery, cholera, and typhoid because it hinders the growth of pathogenic microbes [11].
Elemental sulfur is easy-to-handle and inexpensive, it is the most effective soil acidity correcting material. In order to develop crops that require acidic soil for growth, elemental sulphur reduced soil acidity. Sulfuric acid microorganisms in the soil slowly metabolise elemental sulphur to make sulfuric acid. Therefore, if the soil is treated with an adequate amount of elemental sulphur, soil acidity can be reduced while maintaining an acidity that is good for crop growth [12].
The most well-known species of the Sorghum genus, which belongs to the tribe Andropogoneae of the family Poaceae, is Sorghum bicolor, which is grown commercially [13]. Sorghum is a cereal that doesn’t contain gluten and is grown all over the world, primarily in tropical, subtropical, and warm temperate settings. Sorghum comes in a wide variety, including red and white kinds. Sorghum is employed in the food business even though it is mostly farmed for animal feed. As a high source of antioxidants like polyphenols and carotenoids as well as micro- and macronutrients, sorghum grain has health-promoting qualities [14].
Through the action of microbes, the process of fermentation helps break down complex organic compounds into simpler ones. Yeast enzymes, for instance, change proteins into peptides and amino acids while converting sugars and starches into alcohol. Foods are often fermented as a result of microbial or enzymatic activity on their constituent parts, which causes the desired biochemical transformations that result in the substantial alteration of the meal. Fermentation is a natural method of enhancing vitamins, vital amino acids, anti nutrients, proteins, food appearance, tastes, and increased flavour. In addition to making a product safer, fermentation also lowers the amount of energy required for cooking [15].
All living cells require sulphur to function. It is about equivalent to potassium in abundance and somewhat more than chlorine and sodium, making it the eighth most abundant element in the human body. A human body weighing 70 kg (150 lb) has 140 gramme of sulphur on average. It is necessary for the synthesis of collagen, keratin, and insulin. Sulfur has a long history of usage in the treatment of skin conditions such acne and poor skin appearance, the healing of wounds, and acute radioactive material exposure [16]. Sulfur performs the following functions in humans which include DNA methylation and repair, protein synthesis, metal transport, free radical scavenging, gene expression regulation, tissue, enzyme functionality, lipid metabolism, and xenobiotic detoxification [16]. Sulphur is found in several amino acids, glycoprotein, glutathione, and collagen, and it is required for the synthesis of some growth factors and steroid hormones [17]. Proteins found in the extracellular matrix (ECM), such as glycosaminoglycans (GAGs) and hyaluronic acids (HA), as well as connective tissue including skin, tendons, and ligaments, require sulphur for proper cross-linking [1]. Sulfur supports liver detoxification across the body [1].
Ogi is a typical Nigerian traditional food in form of a fermented cereal porridge. In West Africa, ogi is a crucial meal for newborn weaning and a nutritional food for adults. It is made from grains including maize, sorghum, and millet. A significant number of nutrients, including proteins and minerals, are lost during the production of sorghum ogi, lowering the nutritional content of the meal. Sorghum based ogi is generally low in dietary fiber, minerals and proteins [18]. This therefore causes a deficiency in the nutritional requirements of infants and adults. This type of nutritional losses can no be avoided because the majority of the protein and other bioactives in cereal grains are present in the testa and germ, which are usually removed during the traditional processing of grains prior to fermentation to produce ogi [19]. Quite a number of studies have been done to improve the nutritional value of sorghum ogi through fortification [20]. Fermentation processing technologies that boost mineral availability might be introduced to local populations to improve mineral intake in families [21]. This has led to the exploration of sorghum-based ogi as a method of preventing the development of various illnesses, particularly those caused by an inadequate, insufficient, or excessive intake of sulphur compounds required by the human body for a variety of critical processes.
2. Materials and Methods
2.1. Collection of Sorghum
Red variety of sorghum (Sorghum bicolor) was obtained from Omu-Aran community market, Kwara State, Nigeria and transported to Landmark University, Omu-Aran Kwara State, Nigeria.
2.2. Cleaning and Weighing of Sorghum Samples
The sorghum grains were carefully hand-picked to get rid of the husk, sand, stone, and any other polluting particle matter. It was then divided into four batches of 200 g each, done in triplicate.
2.3. Sorghum Fermentation
The procedure described by [22] was adopted for fermentation of sorghum to obtain the ogi slurry. The sorghum grains were steeped in 400 mL of distilled water for 48 hours then the grained were further washed with distilled water and then it was wet-milled together with the elemental sulfur using a Blender (Ken Wood, Germany). The ogi slurry was then stored in a clean container covered and allowed to undergo fermentation for 72 hours.
2.4. Incorporation of Elemental Sulfur
Each batch of steeped sorghum grains (200 g per batch) were wet-milled with different proportions of elemental sulfur. The amount of sulfur added was in these proportions:
- CONTROL: 200 g of sorghum only.
- SAMPLE A: 200 g of sorghum + 0.5 g of elemental sulfur.
- SAMPLE B: 200 g of sorghum + 1.0 g of elemental sulfur.
- SAMPLE C: 200 g of sorghum + 1.5 g of elemental sulfur.
2.5. Proximate Analysis of the Fermented Sorghum
Using the Association of Official Analytical Chemists’ recommended procedures, the proximate composition of the fermented sorghum was ascertained [23]. On a dry matter basis, the contents of ash, crude protein, nitrogen, and moisture were determined.
2.6. Determination of Moisture Content
The moisture content was determined by the Association of Official Analytical Chemists’ oven-drying method [23]. Weighing a dry, clean Petri plate, we recorded the weight (W1). Using a sensitive weighing scale (Ohaus, UK), two grammes of the dried ogi sample was measured into the Petri dish. The combined weight of the Petri dish and sample was recorded as W2. The Petri dish containing the sample was placed in an oven (Gen Lab, Germany) set at 105 °C for 24 hours before drying for three hours. After cooling in the desiccator, the Petri dish was moved there, and its weight was recorded. The procedure was carried out repeatedly until the weight (W3) became constant. The percentage moisture content was assumed to be the weight loss that occurred as a result of drying.
% Moisture content = Weight lossWeight of sample×100
% Moisture content = W2-W3W2-W1×100
2.7. Determination of Ash Content
Using the process outlined in AOAC, the ash content was calculated [23]. A finely ground sample weighted two grammes (2 g) was placed into crucibles that had been cleaned, dried, and pre-weighed (W1). By lighting the sample over a low flame (without the lid on) and burning it until it became charred, the organic matter was burned off. The crucibles were then moved to the muffle furnace (Carbolite RHF1603-208) for 3 hours at 550 °C. Afterward, the crucibles were dried in a desiccator, cooled, and weighed (W2). The ash content was determined by the formula:
% Ash = W2-W1Weight of sample×100
2.8. Determination of Total Crude Protein Content
A micro-Kjeldahl digestion flask was filled with one gramme (1.0 g) of the sample, one tablet of selenium catalyst, and 15 mL of concentrated H2SO4. Until a clear solution was visible, the mixture was digested on an electro thermal heater. After allowing the flask to cool, distilled water was used to dilute the solution to 50 mL. The distillation device received 5 mL of this. Four drops of screened methyl red indicator and 50 mL of 2 percent boric acid were pipetted into a 100 mL conical flask (the receiver flask). To the digested sample, 50 percent NaOH was continuously added until the mixture turned murky, a sign that it had become alkaline. In the receiver flask, where the delivery tube was positioned below the acid level, distillation was performed into a solution of boric acid. The pink solution in the receiver flask shifted to blue while the distillation process was still ongoing, indicating the presence of ammonia. Following the delivery of the condenser being washed with distilled water, the distillation was maintained until the round bottom flask’s capacity was approximately 50 mL. A titration with 0.1 M HCl was then performed on the resultant solution in the conical flask [24].
Formulas for reactions and estimation of crude protein:
Digestion:
Protein+H2SO4 (Heat, catalyst) = ( NH4)2SO4
Neutralization and distillation:
(NH4)2SO4 + 2NaOH = 2NH3 + Na2SO4 + 2H2O
NH3 + H3BO3 (boric acid) = NH4 + H2BO3 _ (borate ion)
Titration: Borate anion (proportional to the amount of nitrogen) is titrated with standardized HCL.
H2BO3 _ + H+ = H2BO3
Calculations:
Moles HCL =Moles NH3 = Moles N in the sample
A reagent blank should be run to subtract reagent nitrogen from the sample nitrogen
% N = N HCL × Corrected acid volumeg of sample14 gNmole×100
Where: N HCL= Normality of HCL in moles/1000 mL
Corrected acid vol. = (mL std. acid for sample) – (mL std. acid for blank)
14 = Atomic weight of nitrogen
A factor is used to convert percent N to percent crude protein. Most proteins contain 16 percent N, so the conversion factor is 6.25 (100/16= 6.25)
% Protein = % N0.16 or % N × 6.25
2.9. Spontaneous Fermentation of Sorghum
The sorghum grains were continually rinsed with tap water until they were clean. They were then immersed for an additional 48 hours in 400 mL of distilled water. They were all precisely measured, wet-milled with the elemental sulphur powder using a clean Ken Wood Blender, and each received 200 mL of distilled water while the blender was running to create an ogi-sulfur slurry that was homogeneous and smooth. For 72 hours, the sulfur-ogi slurry was left to naturally ferment at room temperature (28 °C ± 2). Samples were collected for physicochemical and microbiological investigation at intervals of 0, 24, and 48 hours during the steeping and fermentation process [25].
2.10. Physico-chemical Analyses of Steep Liquor and Ogi Slurry
2.10.1. Temperature
The temperature of the steeping water and ogi slurry was determined at the following time intervals: 0 hours, 24 hours, 48 hours, 72 hours, and 96 hours by dipping the thermometer’s electrode into 10 mL of the steeping water. For the fermented ogi slurry, one gramme of the fermenting ogi slurry was homogenised in distilled water (9 mL) then the probe was inserted into this solution. This was done in triplicates [22].
2.10.2. pH Determination
Using a typical pH metre with a reference glass electrode, the pH variations as the fermentation progressed were calculated. 10 mL aliquots of the fermenting steep liquor were measured and added to a 100 mL beaker. A pH probe was then inserted into the steep liquor. To measure the pH of the fermenting ogi slurry, 1 mL was homogenised in distilled water (9 mL). A pH probe was then put into the homogenised solution to measure the pH, following a modified way of [26]. For each sample, triplicate values of the pH values were recorded. pH 4.0 and pH 9.0 buffers were used to calibrate the pH metre.
2.10.3. Analysis of Total Titratable Acidity (TTA)
In order to obtain the total titratable acidity, 10 mL aliquots of the steep liquor were measured and added to a 100 mL beaker along with a couple drops of phenolphthalein. The TTA throughout the fermentation period at 0, 24, 48, 72, and 96 hours was then measured by titrating it against 0.1 M NaOH until the end point (a pink colour appeared). During the fermentation period at the intervals of 0, 24, 48, 72, and 96 hours, 1 mL of the fermenting ogi slurry was homogenised in 9 mL of sterile distilled water with the addition of 2-3 drops of phenolphthalein. It was then titrated against 0.1 M NaOH until the end point. The volume of the sodium hydroxide was then multiplied by 0.09 to give the percentage (%) of total titratable acidity as lactic acid [27].
2.11. Microbiological Analysis of Sorghum Based Ogi Slurry
At intervals of 0, 24, and 48 hours, the fermenting slurry was microbiologically examined. In 9 mL of sterile peptone water, 1 gramme of the fermented ogi slurry was homogenised for approximately 30 seconds. Sterile peptone water was used to serially dilute the mixture. 1.0 mL of each dilution factor 10-7 and 10-8 of the appropriate 10-fold dilutions were plated using the pour-plate method on Nutrient Agar (NA) (Alpha Bioscience, USA) for aerobic bacteria, MacConkey agar (Hi Media, India) for the isolation of pathogenic bacteria, Potato Dextrose Agar (Oxoid, UK) was used for yeast and mould determination, and de Mann Rogosa and Sharpe (MRS) agar (Hi Media, India) for the isolation of lactic acid bacteria (LAB) count. MRS plates were incubated anaerobically for 24 to 48 hours at 37 °C, PDA plates were incubated aerobically for 48 to 72 hours at 25 to 27 °C, and NA and MAC agar were incubated aerobically for 24 to 48 hours at 37 °C. On the appropriate media, counts of bacteria, yeasts, and moulds were made. During the steeping process and fermentation of the ogi slurry with various amounts of sulphur, the microbiological enumeration of microorganisms was done at 24-hour intervals.
2.12. Extraction of Sulfur Metabolites
Gas chromatography-mass spectrometry (GC-MS) was employed to extract sulphur metabolites from the sample [28]. This was done to find out what sulphur metabolites, like cysteine, methionine, cystine, homocysteine, homocystine, and taurine, were produced when fermenting microorganisms were converting elemental sulphur. Using Gas Chromatography-Mass Spectrometry, sulphur metabolites, other volatile compounds (VOCs), and related microorganisms of ogi were identified at various stages of fermentation (GC-MS).
2.13. Statistical Analysis
The experiment was performed twice in triplicate. Experimental data were subjected to statistical analyses using SPSS version 20. Data were expressed as mean ± SD. Differences among groups were compared with the one-way Analysis of Variance (ANOVA), with statistical significance set at p < 0.05. Graphs were plotted using GraphPad Prism 8 software.
3. Results
3.1. Proximate Analysis of the Sulfur-Ogi Slurry
The moisture content of the batch with the highest sulfur inclusion had the lowest moisture content. In contrast, the ash content was lowest in the batch with the lowest sulfur inclusion. Similarly, the protein levels increased with the level of sulfur inclusion as shown in Table 1.
3.2. Physico-Chemical Analysis During Spontaneous Fermentation
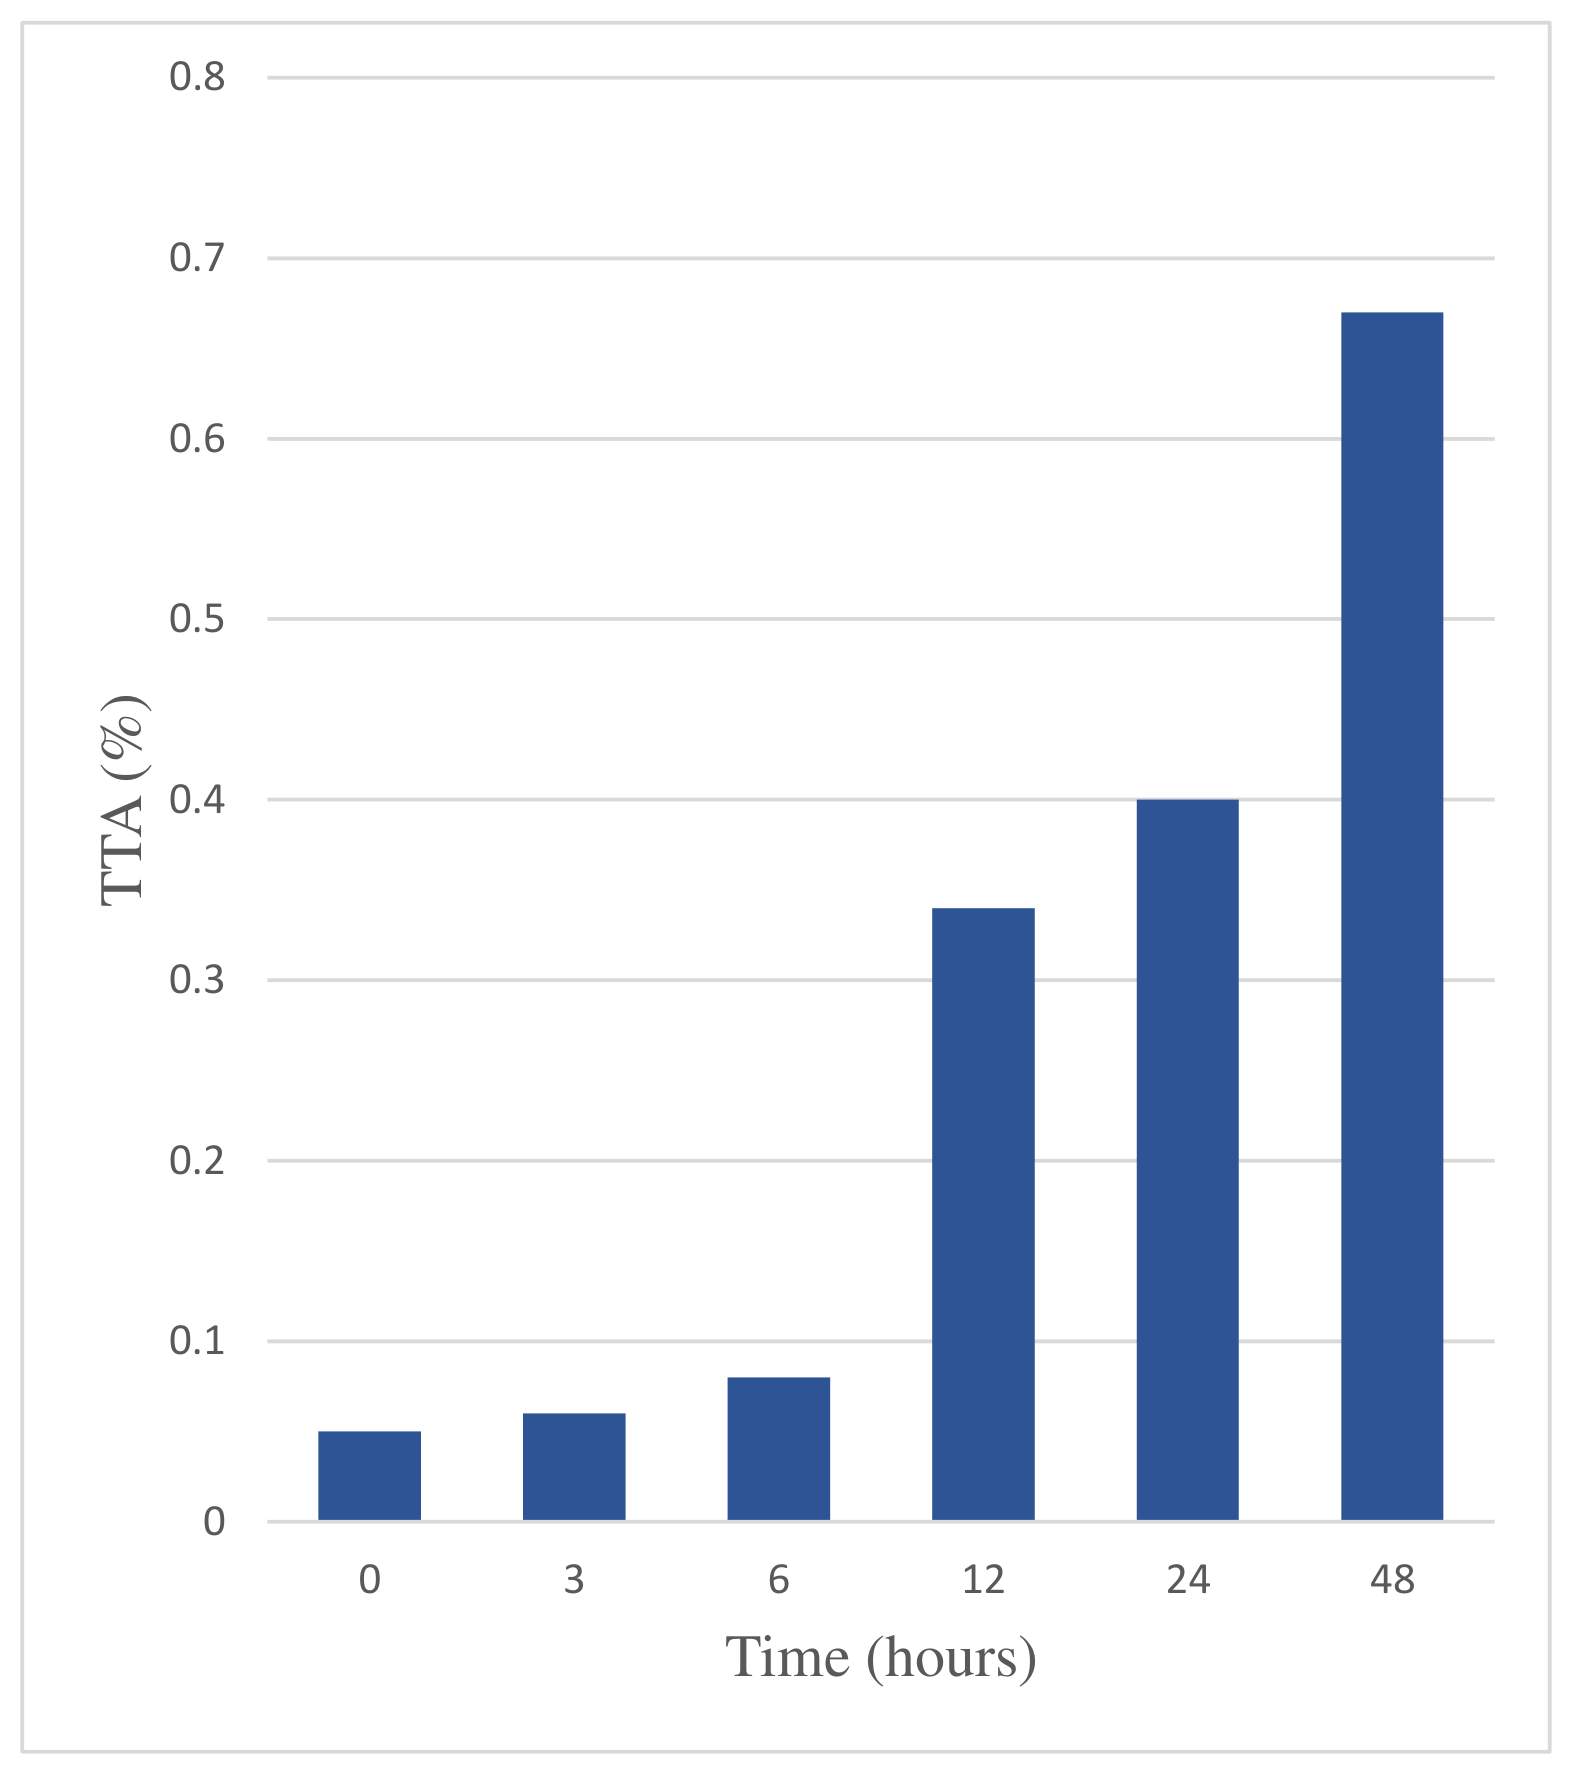
Figure 2 shows the temperature, total titratable acidity and pH of the steep liquor during spontaneous fermentation. The temperature increased from 27 °C at the beginning of the fermentation to 29 °C after 24 hours and at the end of the fermentation, there was a decrease in temperature to 26 °C at the end of the fermentation. Also, there was a decrease in pH at the beginning of the fermentation through the end from 6.6 to 5.8, and there was a slight increase in the amount of lactic acid produced from 0.1 to 0.7 at (0 hour) to (48 hour), respectively as shown in Figure 2.
Figure 3. and 4 shows the pH and total titratable acidity respectively, of the sulfur-ogi slurry during secondary fermentation. It was observed that the pH decreased from 6.36 at (0 hour) to 3.40 at 96 hours. However, the total titratable acidity increased from 0.3 at (0 hour) to 3.9 at (96 hour) as shown in Figure 4.
Figure 2.
Changes in Temperature of fermenting Steep Liquor.
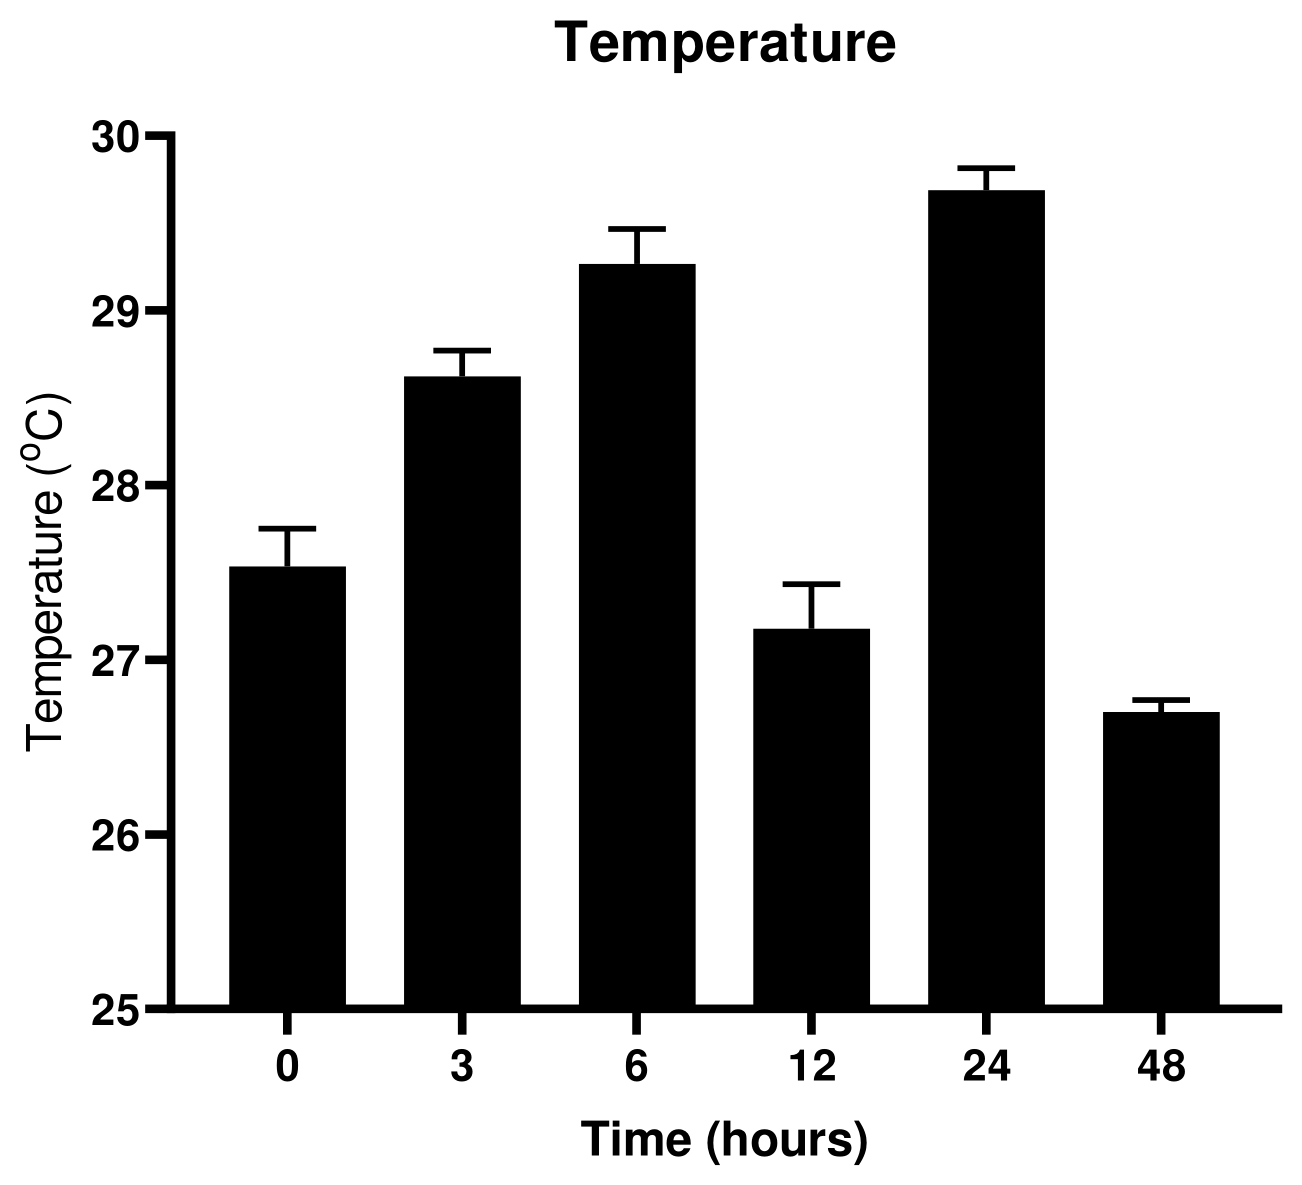
Figure 3.
Changes in pH of Fermenting Steep Liquor.
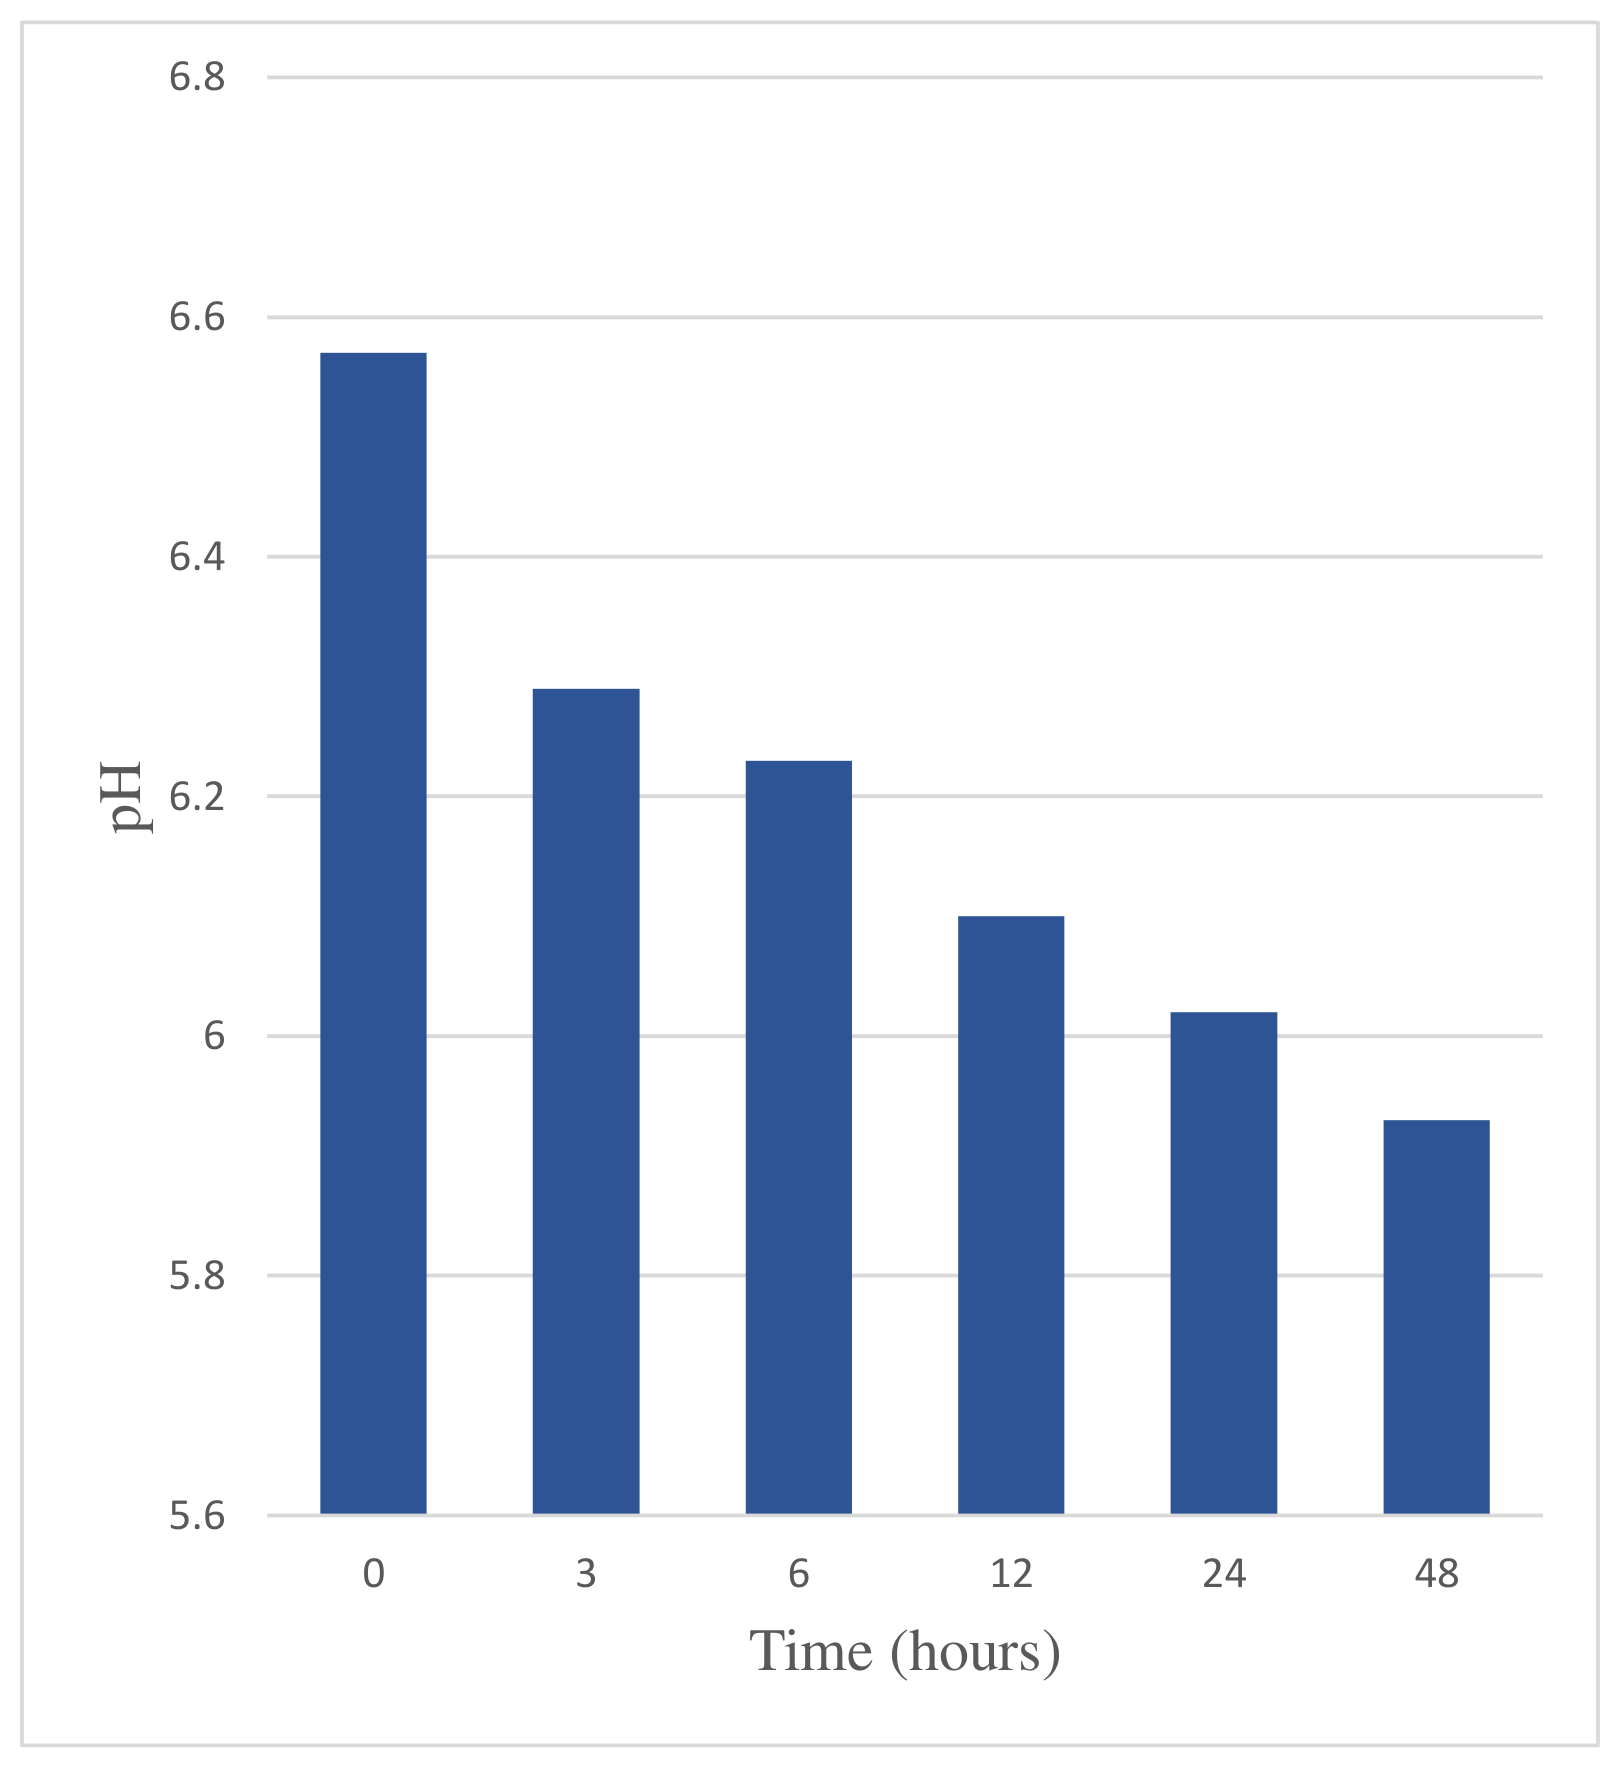
Figure 4.
Changes in Total Titratable Acidity of fermenting Steep Liquor.
3.3. Microbiological Analysis during Spontaneous Fermentation
Figure 5 and Figure 6 shows an appreciable increase in the total viable count of the fermenting medium of both the steep liquor and the sulfur ogi slurry. In the fermenting steep liquor, the microbial count increased from 8.50 Log CFU/mL at 0 hour to 9.20 Log CFU/mL at 48 hours while the microbial count of the sulfur ogi slurry increased and the highest number of colonies were observed at 48 hours for the control samples when compared. The increase observed was from 6.20 Log CFU/mL to 11.25 Log CFU/mL. Figure 5 also shows that during the fermentation of the steep liquor, fungi load was the lowest present as the fungal count progressively decreased.
During the first stage of fermentation (steeping period), there was no growth of lactic acid bacteria at 0 hour however, as the fermentation progressed, an increase in the lactic acid bacteria growth was observed as shown in Figure 5, while the total bacteria count ranged from 8.30 to 9.80 Log CFU/mL.
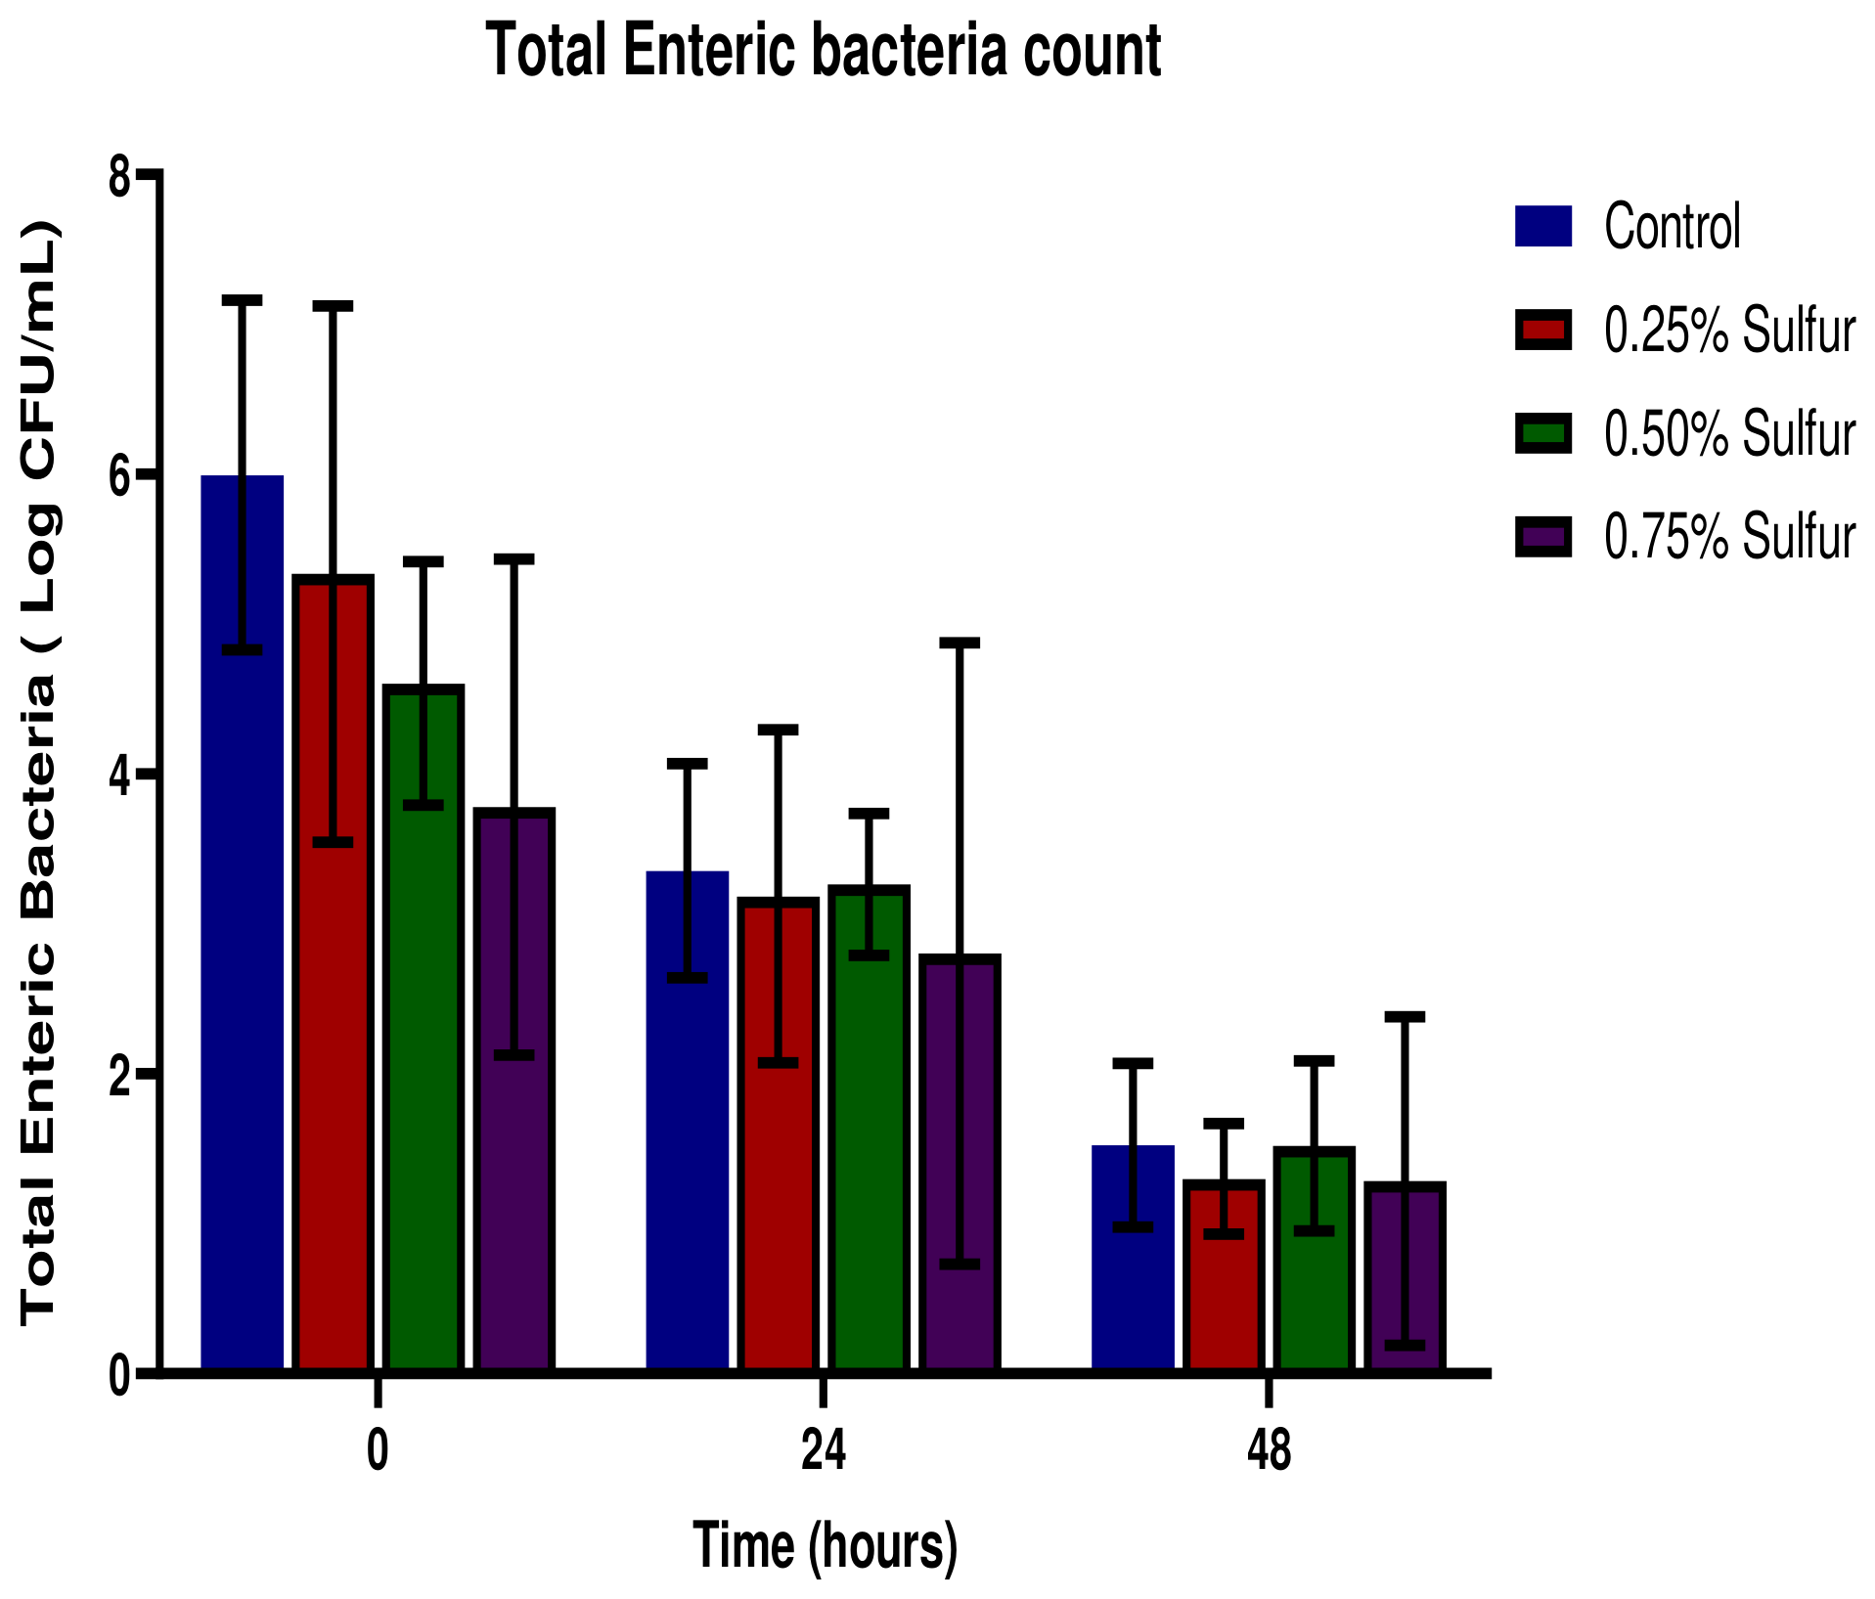
Total Fungal and Enteric Bacteria Count:Figure 8 shows that the fungal load decreased however there was little significant change in the fungal load amongst the various samples. The fungal load ranged from 3.70 Log CFU/mL to 6.10 Log CFU/mL. Figure 9 shows a very significant decrease in the total enteric bacteria count from 5.90 Log CFU/mL to 1.20 Log CFU/mL and the lowest enteric microbial count was observed for sample 4 (Ogi Slurry + 0.75% Elemental Sulfur) containing the highest concentration of sulfur.
Figure 5.
Changes in pH during Fermentation of Sulfur-Ogi Slurry.
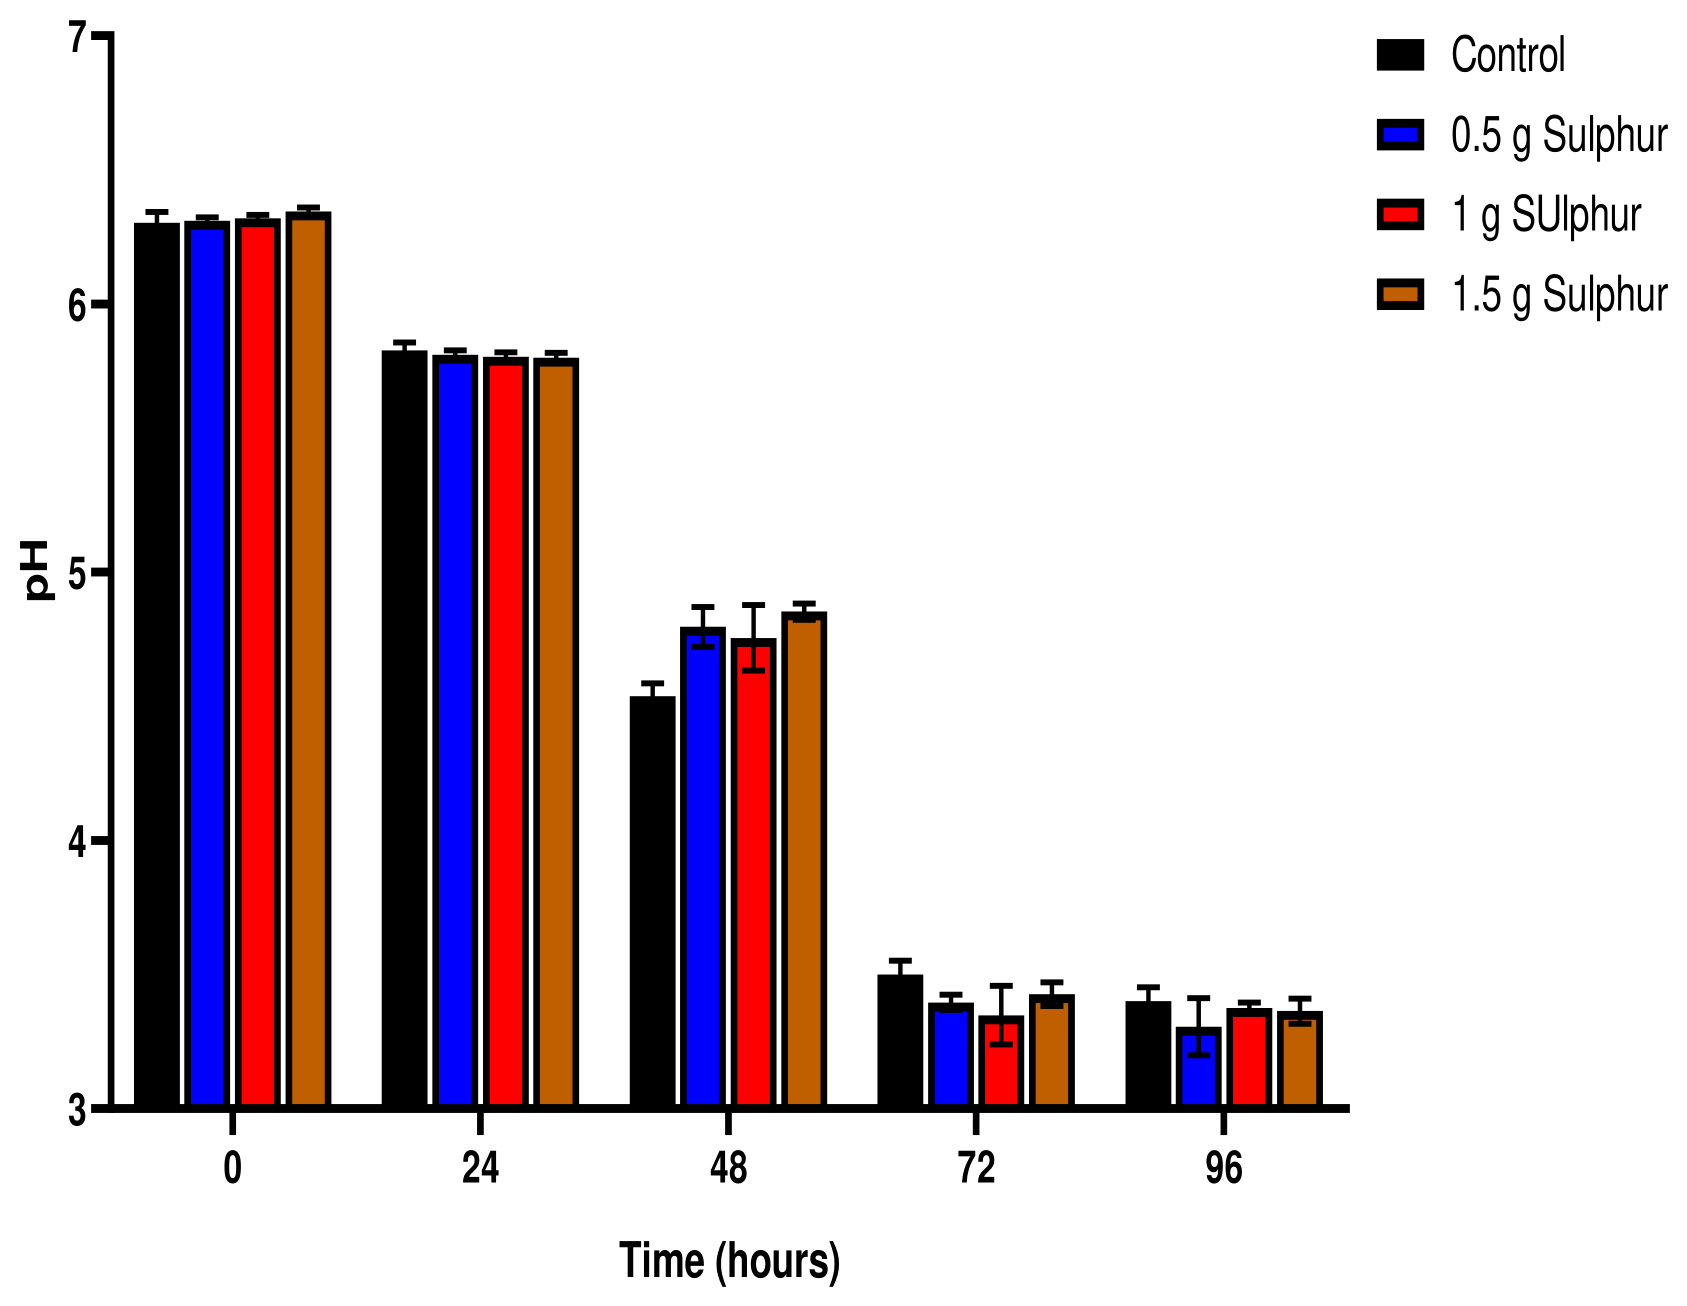
Figure 6.
Changes in Total Titratable Acidity during fermentation of Sulfur-Ogi Slurry.
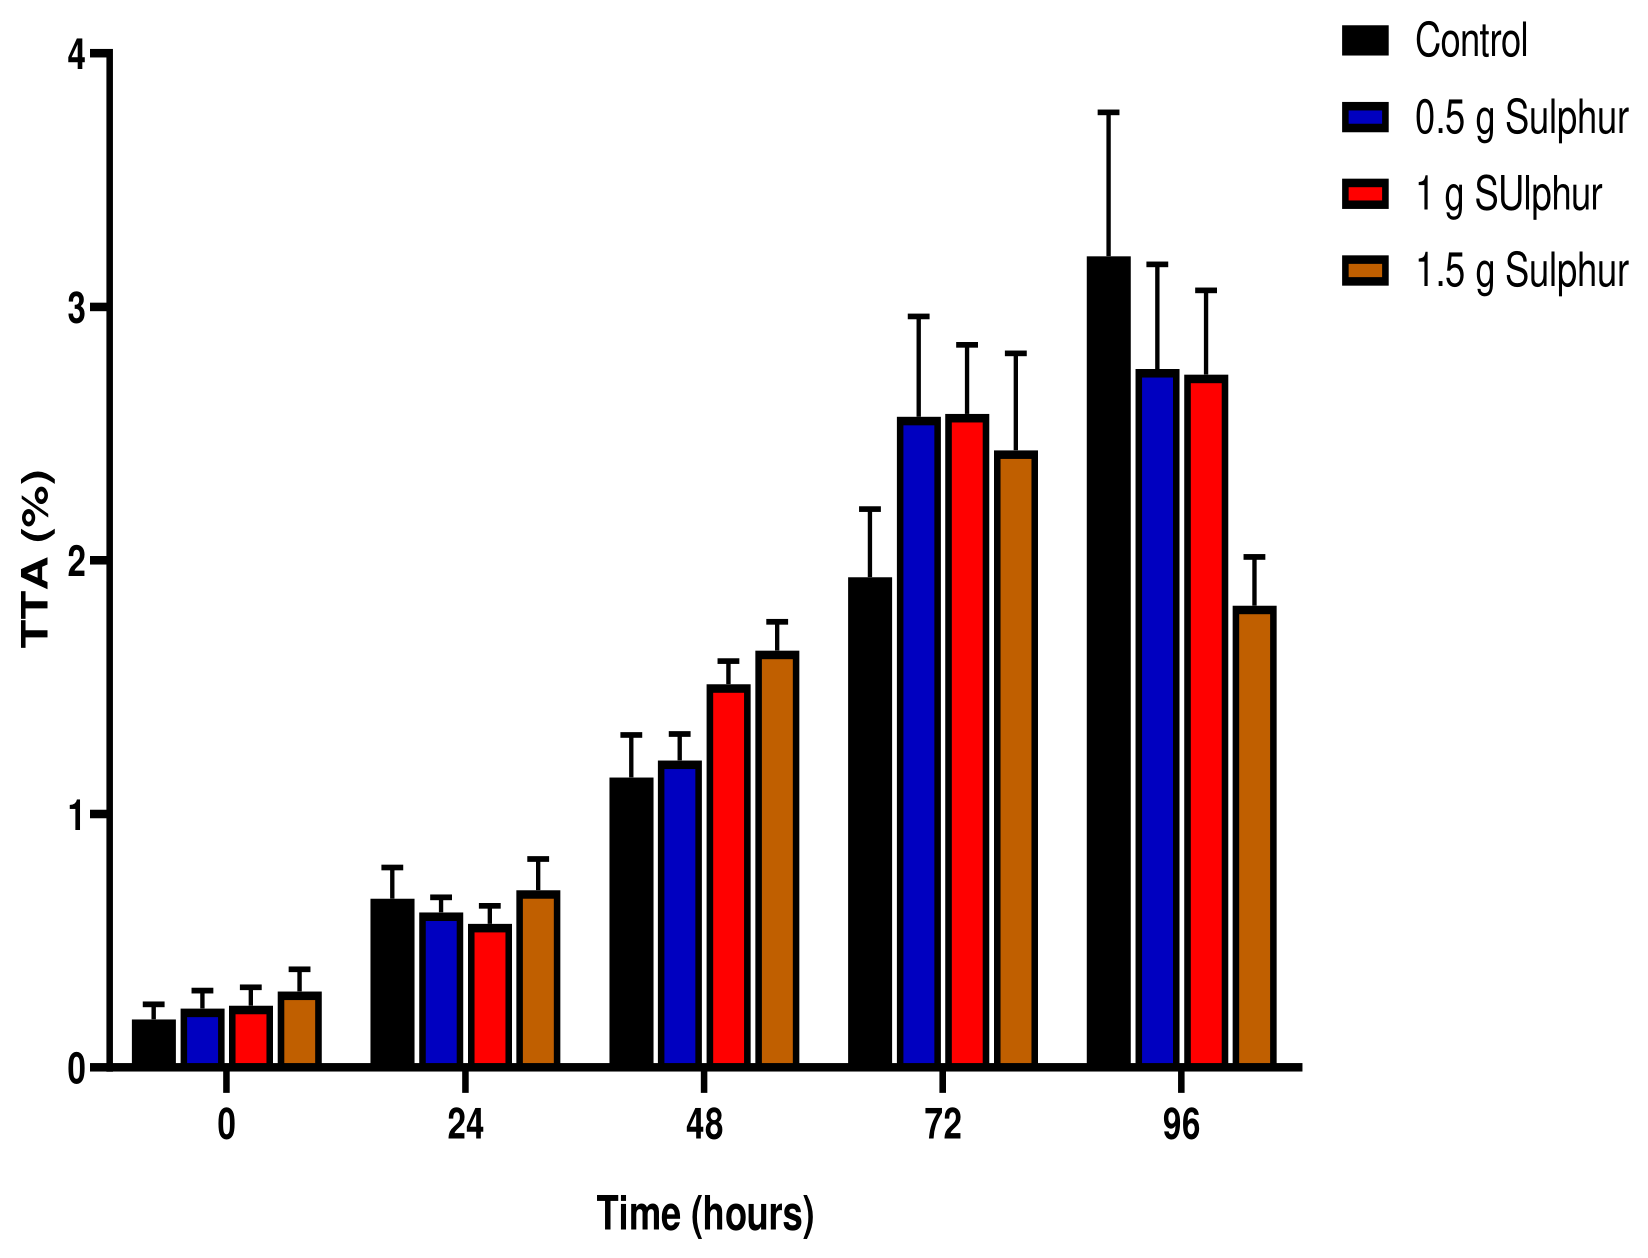
Figure 7.
shows that at the second stage of fermentation (Souring stage), the total lactic acid bacteria increased from 5.90 to 10.50 Log CFU/mL.The Total bacteria count, fungi and lactic acid bacteria count of fermenting steep liquor is also shown.
Figure 7.
shows that at the second stage of fermentation (Souring stage), the total lactic acid bacteria increased from 5.90 to 10.50 Log CFU/mL.The Total bacteria count, fungi and lactic acid bacteria count of fermenting steep liquor is also shown.
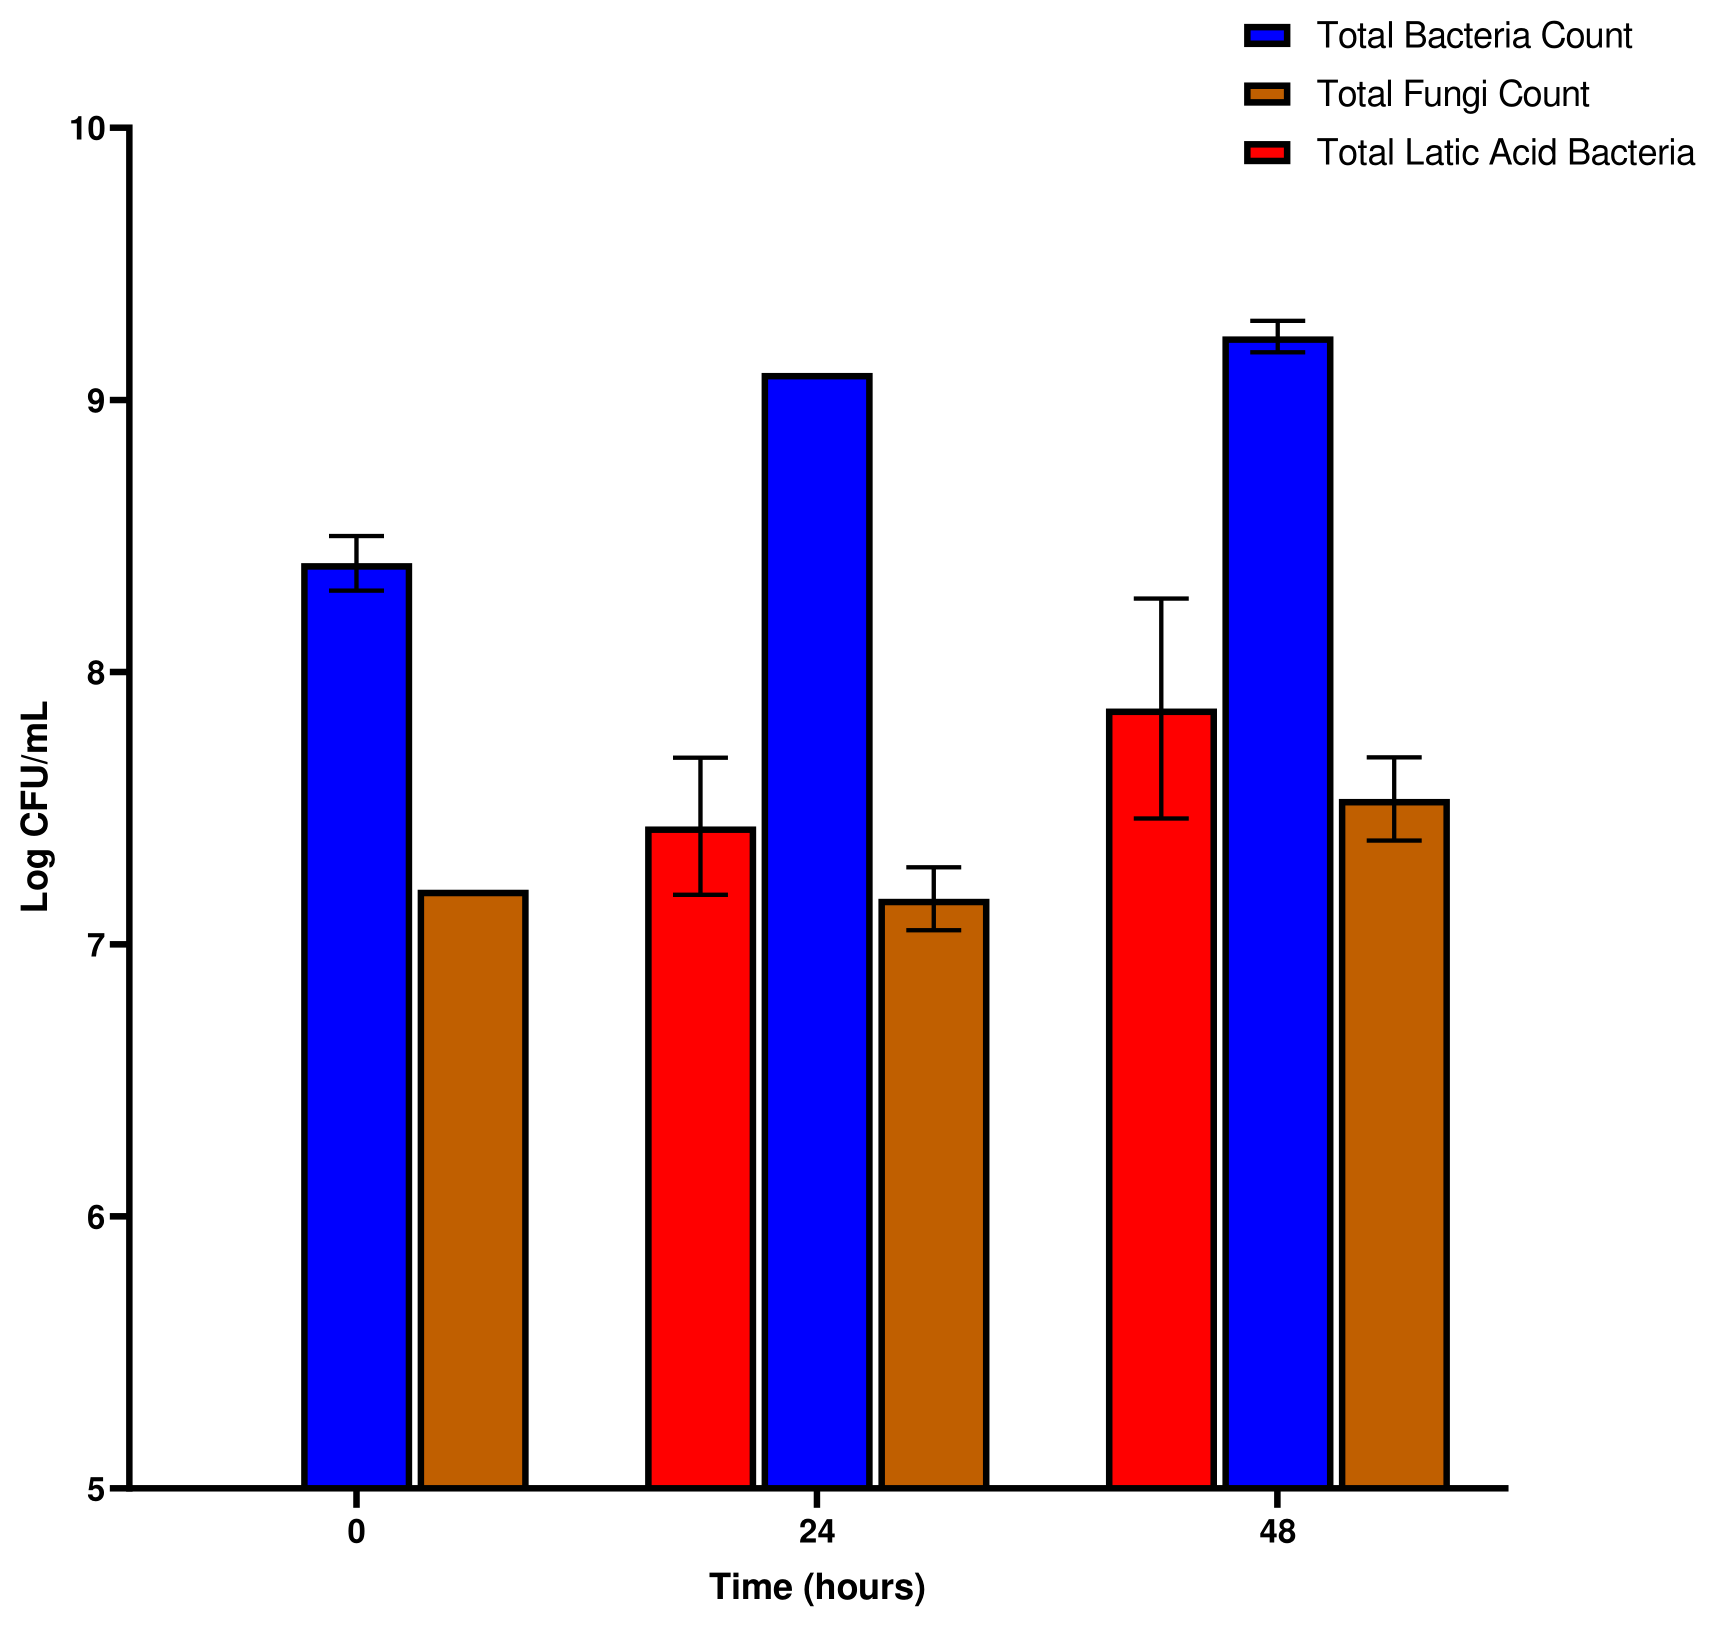
Figure 8.
Total Viable Count of Sulfur-Ogi Slurry.
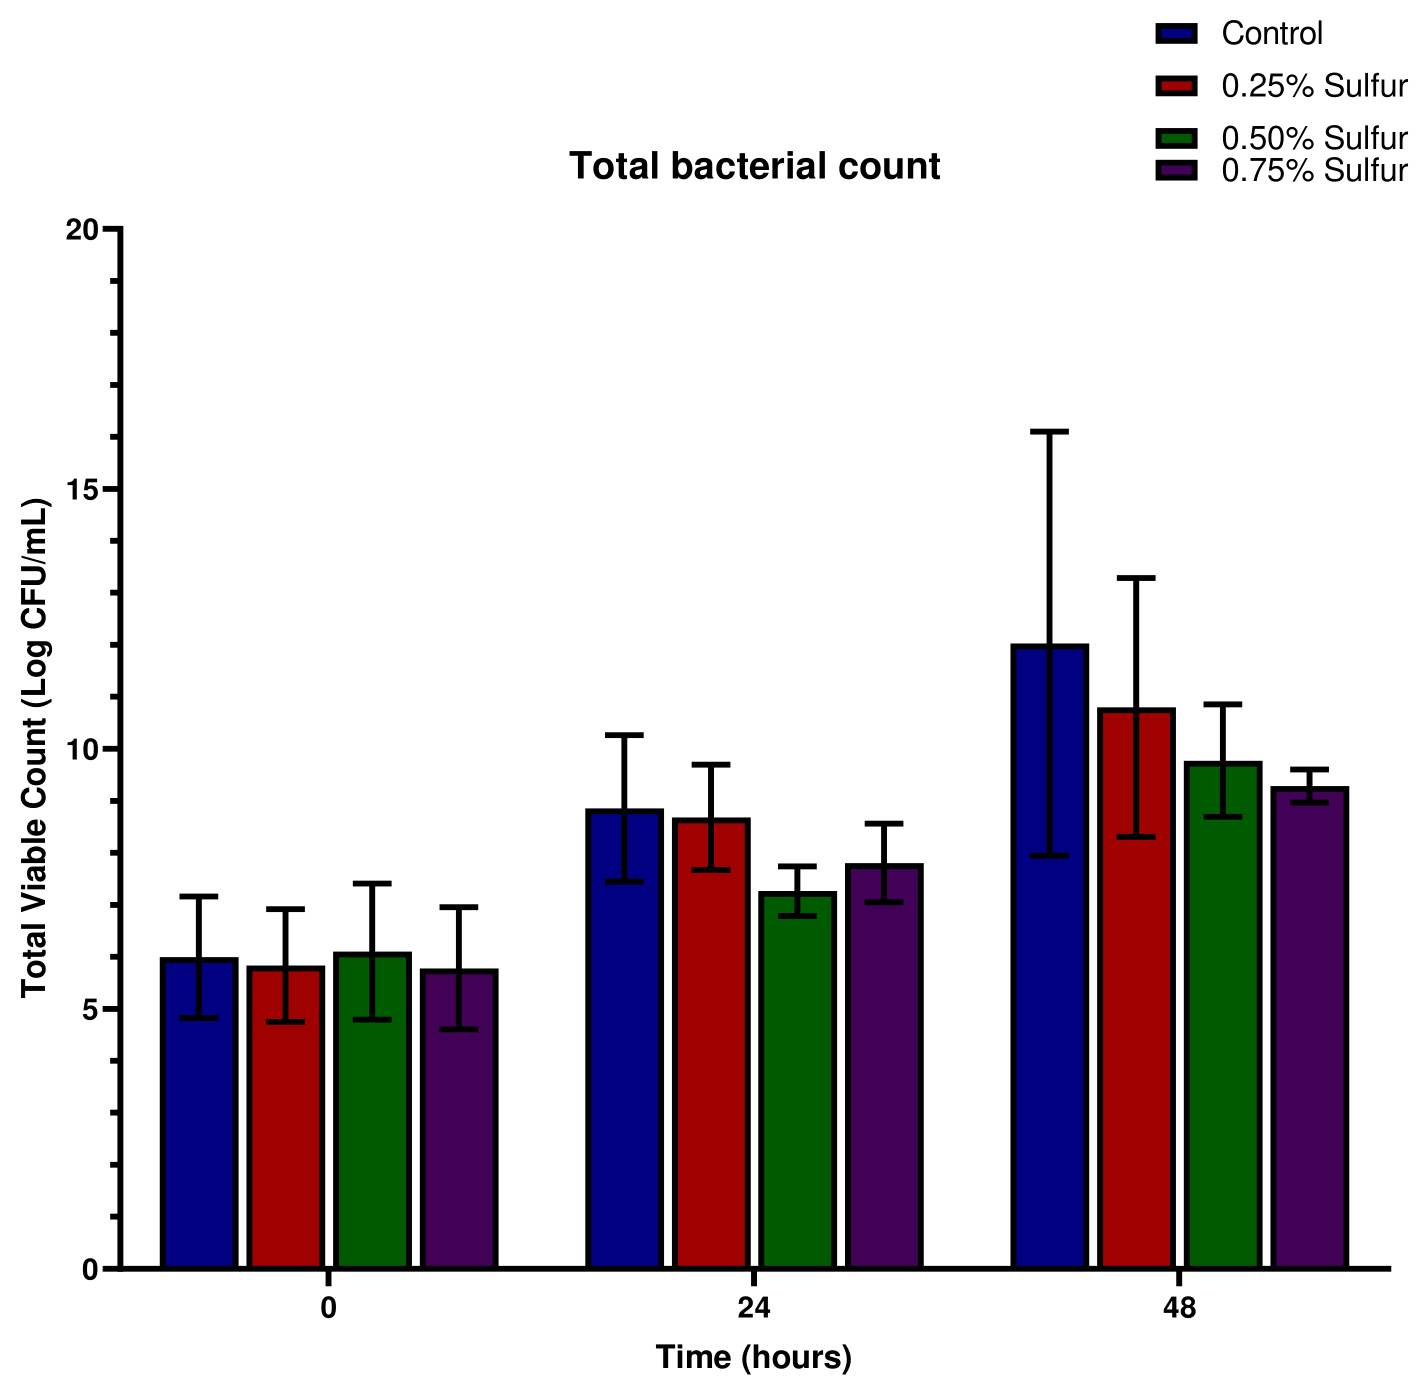
Figure 9.
Total Lactic Acid Bacteria of Sulfur-Ogi Slurry.
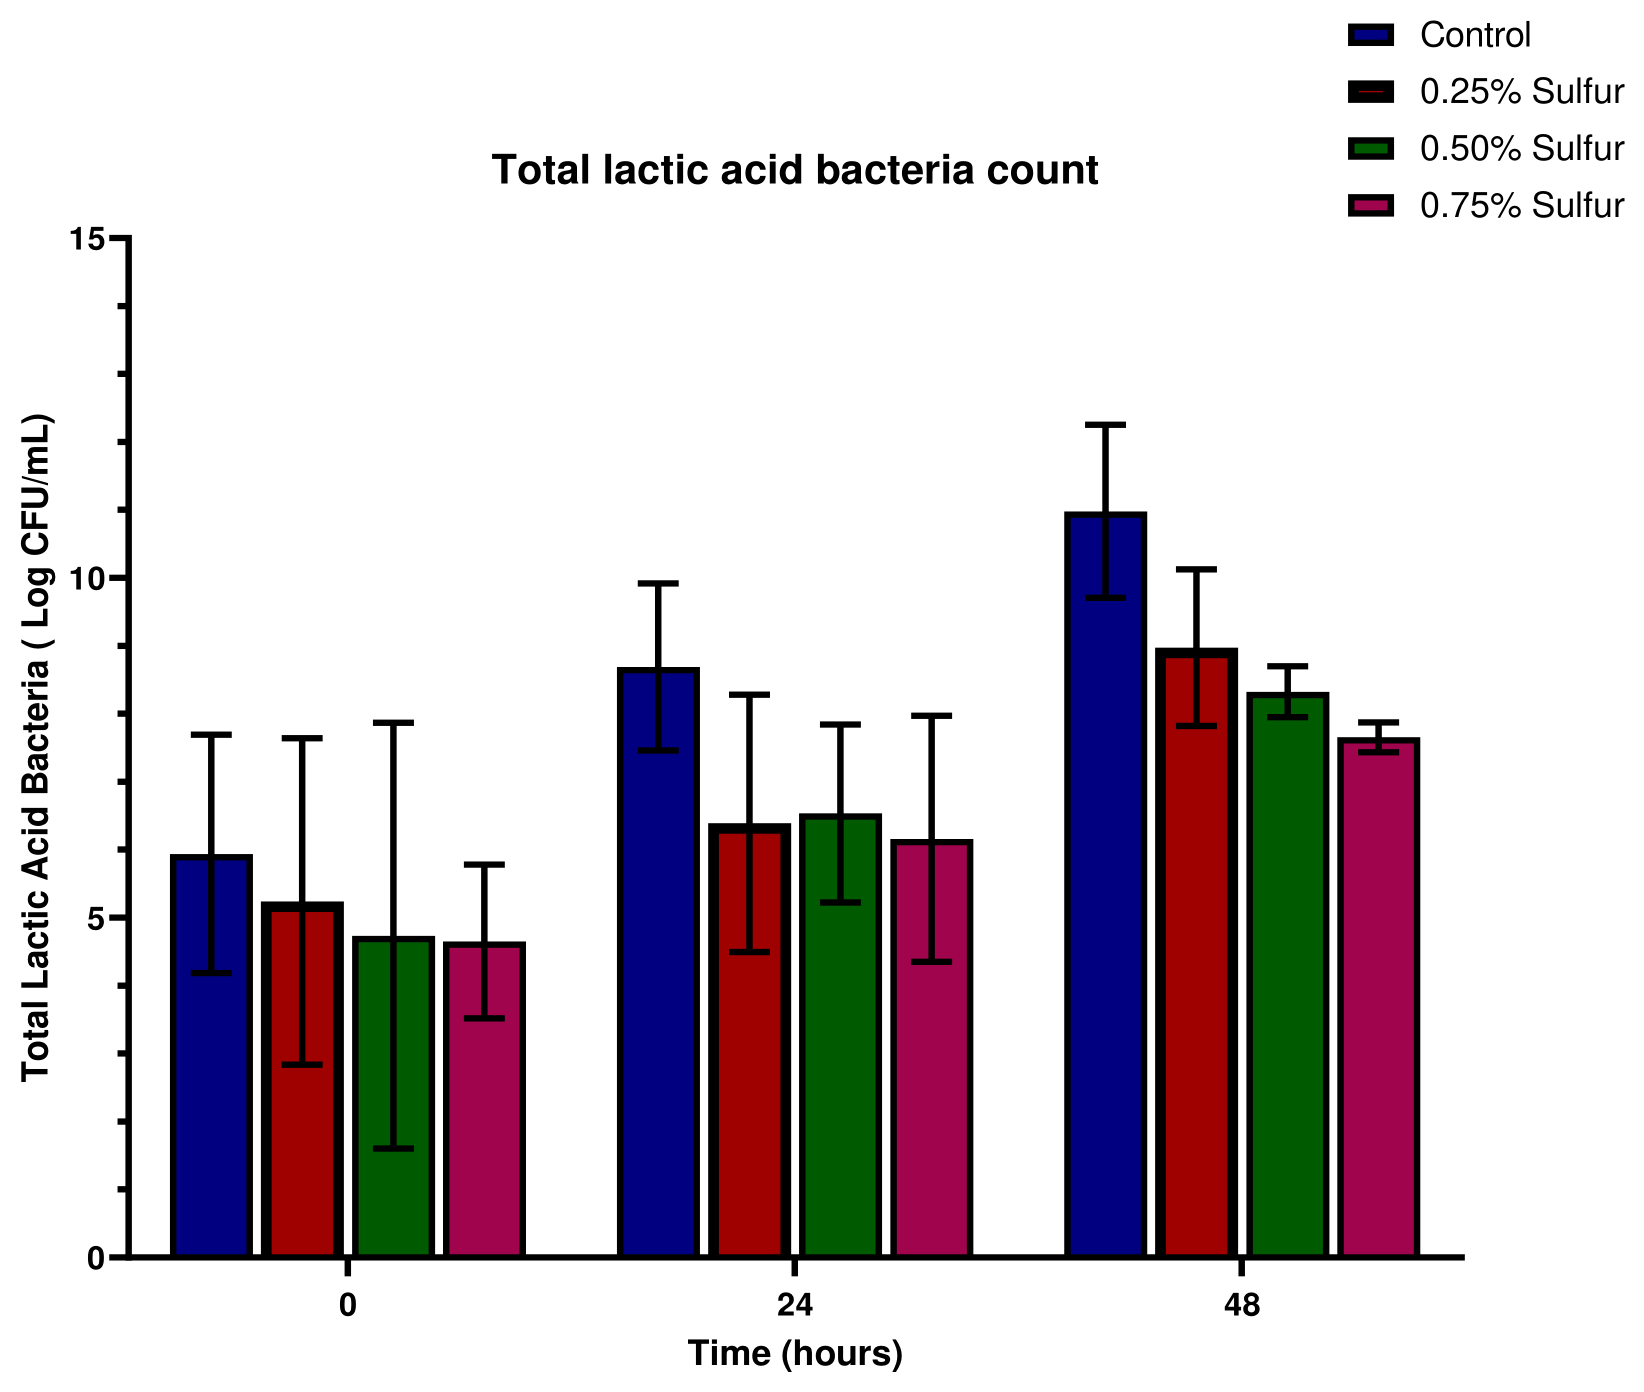
Figure 10.
Total Fungal Count of Sulfur-Ogi Slurry.
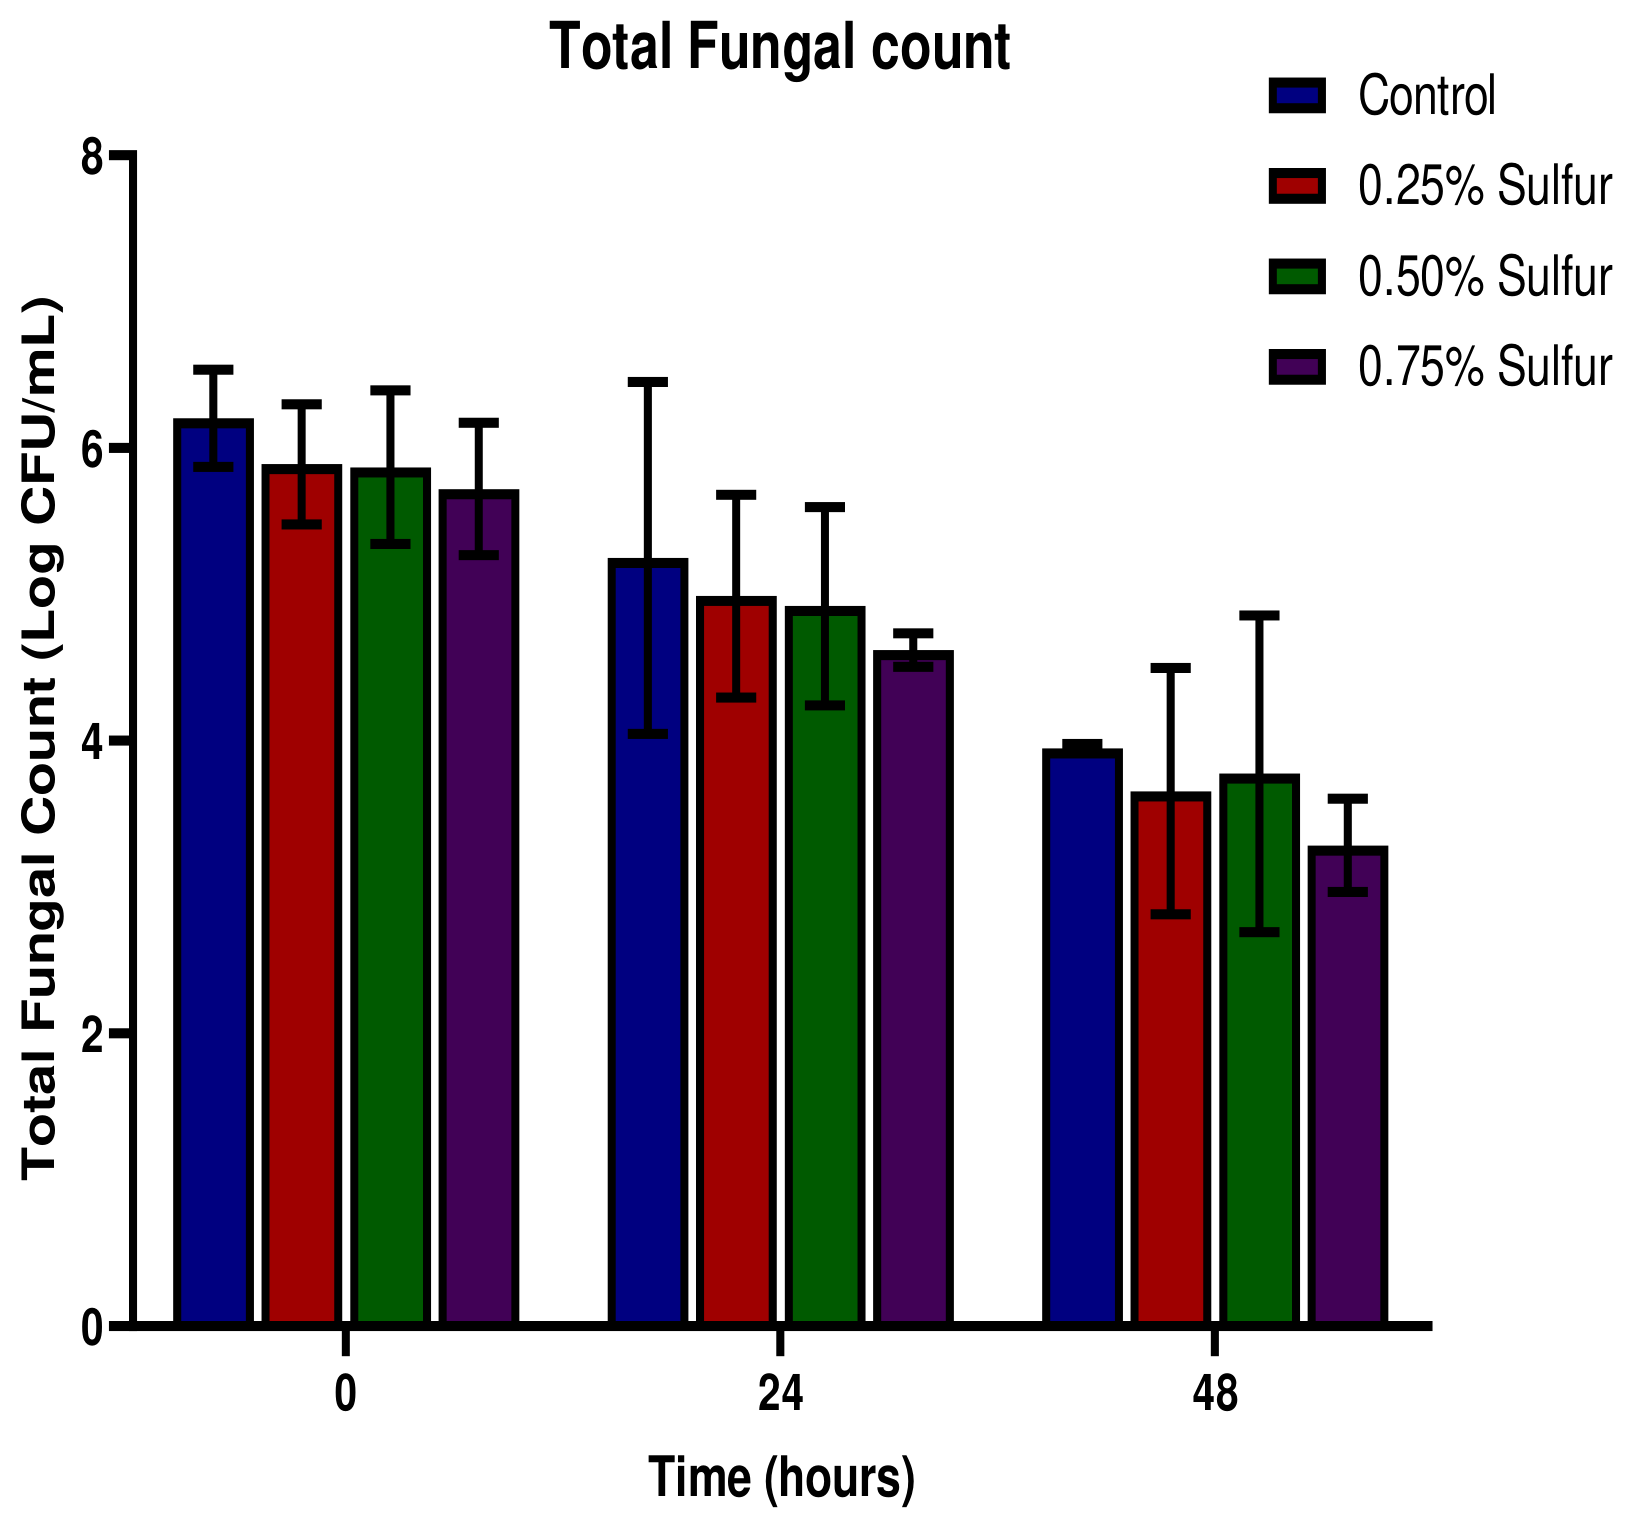
Figure 11.
Total Enteric Bacteria Count of Sulfur-Ogi Slurry.
3.4. Fourier Transform Infrared Spectroscopy (FTIR) Analysis of the Sulfur-Ogi Slurry
The functional groups in the sulfur-ogi slurry was determined using Fourier Transform-Infrared (FT-IR) spectrophotometer. Figure 12. shows the FTIR spectra for the control sample having a broad absorption within the range of 526.01 cm-1 to 3382.17 cm-1. Figure 13, Figure 14 and Figure 15 shows a spectrum which reveals the presence of the functional group Alkane, Alkene, alkyl aryl ether, Sulfonamide, Sulfate, Imine/ Oxime, Nitro Compound and Halo compound in the samples with sulfur inclusions.
4. Discussion
This research was aimed at investigating the effect of elemental sulfur on the microbiota and the metabolic product of Sorghum-based fermented “ogi” for prophylactic and therapeutic purposes. From the results observed, the proximate composition of the sulfur-ogi was 62.79% moisture, 0.50% ash, 57.89% crude protein. The proximate composition of the ogi samples is higher compared to the result reported in literature. Oluseyi et al. [29] reported 42.37% moisture content, 1.37% ash, 10.28% crude protein. The effect of the elemental sulfur in the ogi samples may have led to increase in the mineral constituents of the samples thereby leading to an increase in the proximate composition amongst the various samples.
Effect of sulfur inclusion on the moisture content of ogi: Among the various samples, sample 1 which has the highest concentration of elemental sulfur had the lowest moisture content and the highest protein content. Moisture is vital to microbial activities. Thus, that low moisture content is associated with highest sulfur inclusion indicates that the added sulfur improved the vibrance of the fermenting microbes, making them use up the moisture content of the culture. Thus, the low moisture content of the batch with the highest sulfur inclusion indicates that adding an appropriate amount of sulfur at the fermentation stage can improve the storage shelf-life of fermented food products.
Effect of sulfur inclusion on ash content in the cultures: The low ash content is associated with low sulfur inclusion. Ash is an aggregate of non-combustible mineral cations left behind when all carbon sources have been oxidized off. This result therefore suggests that sulfur inclusion stimulated the vibrance of the fermenting microbes and their ability to acquire and store up cations in the fermenting culture.
Effect of sulfur inclusion on protein utilization in the sulfur ogi slurry: Similarly, the inhibitory effect of sulfur on the microbes reduced the microbial utilization of the proteins in the ogi, leading to increasing protein contents with the level of S-inclusion.
Effect of sulfur on pH and TTA profile of the sulfur ogi slurry: The pH of the fermenting steep liquor had a range of 5.80 to 6.60, while a substantial decrease in the pH of the sulfur ogi slurry was observed and it decreased from 6.36 to 3.40 and this therefore confirms the work done by these authors Anumudu et al. [30]. There were variations in temperature of the fermenting medium at different time intervals and it ranged between 26 °C to 29 °C. The decrease in the pH of the fermenting medium led to an increase in the total titratable acidity [29].
The hyperbolic drop in pH profile during the first 24 hours of fermentation. Sulfur added at the beginning, being an antibiotic killed off cell wall deficient microbes in the culture, which were essentially the spoilage microbes. This left behind pro-aerobic fermenters that made use of the oxygen in the culture to produce acidic products, lactic and some acetic acids. The pattern of drop in pH is hyperbolic, indicating a decelerative rate of fermentation, this deceleration suggests that the metabolic power of the sulfur added reduces with time as it is being converted to some metabolite.
The TTA profile was sigmoid. This suggests that the rate of acid production accelerated initially, up to the twelfth hour, but from there became almost linear. The accelerative phase may have been stimulated by the presence of the sulfur which was at the same time being converted to some S-metabolite. When sulfur was completely converted, the acid fermentation became linear.
Effect of level of sulfur inclusion on pH changes during fermentation of ogi: The different levels of inclusion of sulfur did not significantly affect pH profile within the first 24 hours of fermentation. But at 24 hours sulfur inclusion caused more acid formation (lactic acid production) than the control culture. in the first 24 hours the level of acidity (pH above 5.5 and below 7) suggests that lactic acid bacteria (LAB) were the most active microbes producing lactic acid. Beyond 24 hours the LAB were probably succeeded by acetic acid bacteria (AAB) causing the reduction of pH to high acidity between pH 3-4. This latter environment is inimical to the growth of pathogenic and spoilage microbes. It can therefore be envisaged as a storage environment for ogi products. It however has the disadvantage of being very, if not too, sour for ordinary consumers of ogi. Yet it is the most healthful as it is the range of vinegar. The acetic acid formed is easy to biochemically bind to co-enzyme A to form acetyl CoA which, in turn, readily reacts with oxaloacetate coming from Krebs cycle. Acetyl coA and oxaloacetate produce citric acid, thus keeps the Krebs tricarboxylic acid cycle going. The net effect of this is production of about 32 ATP units from a glucose molecule, instead of the 2 ATP from fermentation. Thus, this result suggests that inclusion of sulfur in the fermentation of ogi is likely to boost the health of the consumers of the ogi.
Effect of sulfur inclusion on total titratable acidity (TTA) during fermentation of ogi slurry: The accelerative pattern of TTA development (Figure 4) suggests that all levels of sulfur-inclusion within the range studied here (0.25-0.75%) support vibrant growth and activity of the fermenting microbes. In general, in the first 48 hours higher sulfur inclusion produced better acidic fermentation than control. But beyond 72 hr inclusion higher than 0.25% were less stimulatory. This suggests that inclusion at 0.25% produced optimal acidic fermentation effect.
Effect of sulfur inclusion on total bacteria, fungi and lactic-acid-bacteria counts of fermenting ogi: In general, total bacteria count, LAB count and fungal count decreased with time (Figure 5). And from Figure 6 the 0.25% sulfur inclusion is optimal, beyond which higher inclusion are less stimulatory than that optimal on the total bacterial count. A similar pattern exists for the LAB count (Figure 7). The increase in the bacteria count can be as a result of the growth of indigenous microorganisms present in the materials used for the production of the sorghum-based ogi and may also be due to microbial contamination during processing, storage, handling or from the water used for the fermentation as reported in the literature work of the experiment carried out by Ogodo et al. [31]. The decrease in the pH of the fermenting medium created an acidic and anaerobic medium for the growth and proliferation of lactic acid bacteria and aciduric or facultative anaerobic microorganisms and this resulted in a substantial increase in the colony count of lactic acid bacteria from 5.90 to 10.50 Log CFU/mL with the control sample having the highest colony count. This result agrees with that of Catherine et al. [32].
The effect of S-inclusion on fungal count is linearly negative; as the level of inclusion increases, fungal count decreases (Figure 8) Moreover, the fungal counts decrease with time. This suggests that sulfur has a strong anti-fungal effect, and supports the common practice to use sulfur ointments to treat skin fungal infections. It also suggests the possibility of using appropriate inclusion of sulfur in meals to inhibit enteric fungi such as Candida albican. But more experimentation is required for this possible application. The decrease in the fungal count may also be due to the inhibitory effect of lactic acid and other organic acids present in the fermenting medium. This was also corroborated by reports of Omemu et al. [33].
Effect of sulfur inclusion on total enteric bacteria count in ogi slurry: In general, the inclusion of sulfur decreased enteric bacteria counts (Figure 9). And the counts further decrease with time. This again suggests that sulfur inhibits enteric bacteria. It suggests that, after appropriate confirmatory experimentation, including appropriate level of sulfur in meals can mitigate enteric bacteria growth and thereby improve human health. This shows that elemental sulfur is capable of inhibiting pathogenic microorganisms present in food. It may also be due to the fact that enteric microorganisms are acid intolerant and are incapable of surviving in an acidic environment as reported by Omemu et al. [33].
The FTIR analysis detected the presence of Alkane, Alkene, alkyl aryl ether, Sulfonamide, Sulfate, Imine/ Oxime, Nitro Compound and Halo compound in the samples containing different inclusions of elemental sulfur. The functional group region (4000–1500) of the FTIR spectra shows slight modification of the elemental sulfur fermentation treatments compared to the control. The spectrum at the fingerprint region was relatively similar across groups.
5. Conclusions
The incorporation of elemental sulfur in the fermentation of sorghum-based ogi increased the crude protein content, showed a decrease in the moisture content of the ogi samples compared to the control sample and also inhibited the growth of enteric bacteria in the sulfur ogi sample. Due to the metabolic activities of the microorganisms present during the spontaneous fermentation of the sorghum based ogi, metabolites necessary for specific body functions were produced. Further studies on the toxicology of elemental sulfur in humans should be carried out to determine the appropriate dose safe for human consumption for therapeutic purposes.
References
- Hewlings, S.; Kalman, D. Sulfur in human health. EC Nutr. 2019, 14, 785–791. [Google Scholar]
- Ward, N.P.; DeNicola, G.M. Sulfur metabolism and its contribution to malignancy. Int. Rev. Cell Mol. Biol. 2019, 347, 39–103. [Google Scholar] [CrossRef] [PubMed]
- Tang, Q.; Yin, X.; Kuchukulla, R.R.; Zeng, Q. Recent Advances in Multicomponent Reactions with Organic and Inorganic Sulfur Compounds. Chem. Rec. 2021, 21, 893–905. [Google Scholar] [CrossRef] [PubMed]
- Walag, A.M.P.; Ahmed, O.; Jeevanandam, J.; Akram, M.; Ephraim-Emmanuel, B.C.; Egbuna, C.; Uba, J.O. Health Benefits of Organosulfur Compounds. In Functional Foods and Nutraceuticals; Springer: Cham, Switzerland, 2020; pp. 445–472. [Google Scholar]
- Yan, J.K.; Zhu, J.; Liu, Y.; Chen, X.; Wang, W.; Zhang, H.; Li, L. Recent advances in research on Allium plants: functional ingredients, physiological activities, and applications in agricultural and food sciences. Crit. Rev. Food Sci. Nutr. 2022, 1–29. [Google Scholar]
- Oluwafemi, R.A.; Lawal, A.O.; Adetope, A.S.; Alagbe, J.O. Effects of Dietary Inclusion of Ginger (Zingiber Officinale) and Garlic (Allium Sativum) Oil (GGO) Mixtures on Carcass Characteristics and Sensory Evalaution of Broiler Chickens. J. La. Medihealtico 2021, 2, 22–31. [Google Scholar] [CrossRef]
- Ajao, B.H.; Ola, S.I. Effects of dietary supplementation of ginger, garlic and onion on semen profile, haematological and serum antioxidant status of rabbit bucks raised in the dry season of the humid tropic. J. Agric. Sciences–Sri Lanka 2022, 17. [Google Scholar] [CrossRef]
- Butawan, M.; Benjamin, R.L.; Bloomer, R.J. Methylsulfonylmethane: applications and safety of a novel dietary supplement. Nutrients 2017, 9, 290. [Google Scholar] [CrossRef] [PubMed]
- Kılıç, S.C. Does glucosamine, chondroitin sulfate, and methylsulfonylmethane supplementation improve the outcome of temporomandibular joint osteoarthritis management with arthrocentesis plus intraarticular hyaluronic acid injection. A randomized clinical trial. J. Cranio-Maxillofac. Surg. 2021. [Google Scholar] [CrossRef]
- Francioso, A.; Baseggio Conrado, A.; Mosca, L.; Fontana, M. Chemistry and Biochemistry of Sulfur Natural Compounds: Key Intermediates of Metabolism and Redox Biology. In Oxidative Medicine and Cellular Longevity 2020; 2020. [Google Scholar]
- Yang, C.; Tang, H.; Wang, L.; Peng, R.; Bai, F.; Shan, Y.; Cong, Y. Dimethyl sulfoxide prevents radiation-induced oral mucositis through facilitating dna double-strand break repair in epithelial stem cells. Int. J. Radiat. Oncol. Biol.* Phys.* 2018, 102, 1577–1589. [Google Scholar]
- Lee, S.Y.; Kim, E.G.; Park, J.R.; Ryu, Y.H.; Moon, W.; Park, G.H.; Kim, K.M. Effect on chemical and physical properties of soil each peat moss, elemental sulfur, and sulfur-oxidizing bacteria. Plants 2021, 10, 1901. [Google Scholar] [CrossRef] [PubMed]
- Ananda, G.K.; Myrans, H.; Norton, S.L.; Gleadow, R.; Furtado, A.; Henry, R.J. Wild sorghum as a promising resource for crop improvement. Front. Plant Sci. 2020, 11, 1108. [Google Scholar] [CrossRef] [PubMed]
- Przybylska-Balcerek, A.; Frankowski, J.; Stuper-Szablewska, K. Bioactive compounds in sorghum. Eur. Food Res. Technol. 2019, 245, 1075–1080. [Google Scholar]
- Sharma, R.; Garg, P.; Kumar, P.; Bhatia, S.K.; Kulshrestha, S. Microbial fermentation and its role in quality improvement of fermented foods. Fermentation 2020, 6, 106. [Google Scholar] [CrossRef]
- Michalak, M.; Pierzak, M.; Kręcisz, B.; Suliga, E. Bioactive compounds for skin health: A review. Nutrients 2021, 13, 203. [Google Scholar] [CrossRef] [PubMed]
- Joo, H. Effect of Dietary supplementation of Allium hookeri root and processed sulfur on the growth performance of guinea pigs. Int. J. Anim. Vet. Sci. 2017, 11, 614–617. [Google Scholar]
- Abioye, V.F.; Aka, M.O. Proximate composition and sensory properties of moringa fortified maize-ogi. J. Nutr. Food Sci. 2015, S12, 1–4. [Google Scholar] [CrossRef]
- Banwo, K.; Oyeyipo, A.; Mishra, L.; Sarkar, D.; Shetty, K. Improving phenolic bioactive-linked functional qualities of traditional cereal-based fermented food (Ogi) of Nigeria using compatible food synergies with underutilized edible plants. NFS J. 2022, 27, 1–12. [Google Scholar]
- Odunlade, T.V.; Taiwo, K.A.; Adeniran, H.A. Fortifying effects of sorghum ogi with cocoa powder on nutritional, pasting and organoleptic properties. Ann. Food Sci. Technol. 2019, 20, 42–55. [Google Scholar]
- Samtiya, M.; Aluko, R.E.; Puniya, A.K.; Dhewa, T. Enhancing micronutrients bioavailability through fermentation of plant-based foods: A concise review. Fermentation 2021, 7, 63. [Google Scholar] [CrossRef]
- Temilade, O.P.; Festus, F.I.; Oluwabunmi, A.A. Physicochemical, Microbiologically Nutritional and Sensory Evaluation of Ogi (A Traditonal Cereal Based Beverage in Nigeria) Produced from Two Varieties of Sorghum. Int. J. Biotechnol. 2020, 9, 38–49. [Google Scholar] [CrossRef]
- AOAC. Official Methods of Analysis, 19th ed.; Association of Official Analytical Chemists: Washington, DC, USA, 2005. [Google Scholar]
- Ogodo, A.C.; Ugbogu, O.C.; Onyeagba, R.A.; Okereke, H.C. Microbiological quality, proximate composition and in vitro starch/protein digestibility of Sorghum bicolor flour fermented with lactic acid bacteria consortia. Chem. Biol. Technol. Agric. 2019, 6, 1–9. [Google Scholar] [CrossRef]
- Umokaso, M.M.; Efiuvwevwere, B.J.; Ire, F.S. Microbiological dynamics involved in cereal-porridge production using maize and sorghum. GSC Biol. Pharm. Sci. 2022, 18, 014–026. [Google Scholar] [CrossRef]
- Hleba, L.; Císarová, M.; Glinushkin, A.; Laishevtcev, A.; Derkanosova, A.; Igor, P.; Shariati, M.A. Physicochemical, functional and sensory properties of acha-tamba based ogi enriched with hydrolysed soy peptides. J. Microbiol. Biotechnol. Food Sci. 2021, 823–830. [Google Scholar]
- Adesokan, I.A.; Ekanola, Y.A.; Onifade, D.A.; Bolarinwa, O.O. Influence of Saccharomyces cerevisiae (Baker’s Yeast) on the Fermentation of Ogi-A Nigerian Fermented Food. Microbiol. Res. J. Int. 2017, 1–7. [Google Scholar] [CrossRef]
- Timothy, B.O.; Olasupo, A.Z.; Ibukun, O.T. Volatile Compounds Determination by GC-MS and Identification of Dominant Microorganism at Varying Fermentation Period of Ogi Slurry. J. Food Stab. 2020, 3, 38–56. [Google Scholar] [CrossRef]
- Oluseyi, A.K.; Theresa, A.O.; Abisola, M.; Oluwatoyin, A.C.; Iyabo, O.G.; Funmi, A.O.; Oluwakayode, A.S. Nutritive assessment of sorghum-ogi plantain flour weaning food. IOP Conf. Ser. Mater. Sci. Eng. 2019, 509, 012006. [Google Scholar] [CrossRef]
- Anumudu, C.K.; Omeje, F.I.; Obinwa, G.N. Microbial succession pattern in Ogi fermentation. Int. J. Adv. Res. Biol. Sci. 2018, 5, 247–251. [Google Scholar]
- Ogodo, A.C.; Ugbogu, O.C.; Agwaranze, D.I.; Ihiabe, F.U. Some studies on the bacteriological quality of sorghum-based commercially prepared fermented Ogi (Akamu) in Wukari, Nigeria. Am. J. Food Sci. Nutr. 2017, 4, 48–51. [Google Scholar]
- Catherine, A.O.B.; Okechi, K.I. Evaluation of OGI (CORN CARAMEL) from maize and sorghum for isolation and characterisation of Lactic Acid Bacteria (LAB). Biochem Mol. Biol. 2019, 4, 28–34. [Google Scholar] [CrossRef]
- Omemu, A.M.; Okafor, U.I.; Obadina, A.O.; Bankole, M.O.; Adeyeye, S.A.O. Microbiological assessment of maize ogi cofermented with pigeon pea. Food Sci. Nutr. 2018, 6, 1238–1253. [Google Scholar] [CrossRef] [PubMed]
Figure 12.
FTIR Spectra of the Control Sample (0% Sulfur).
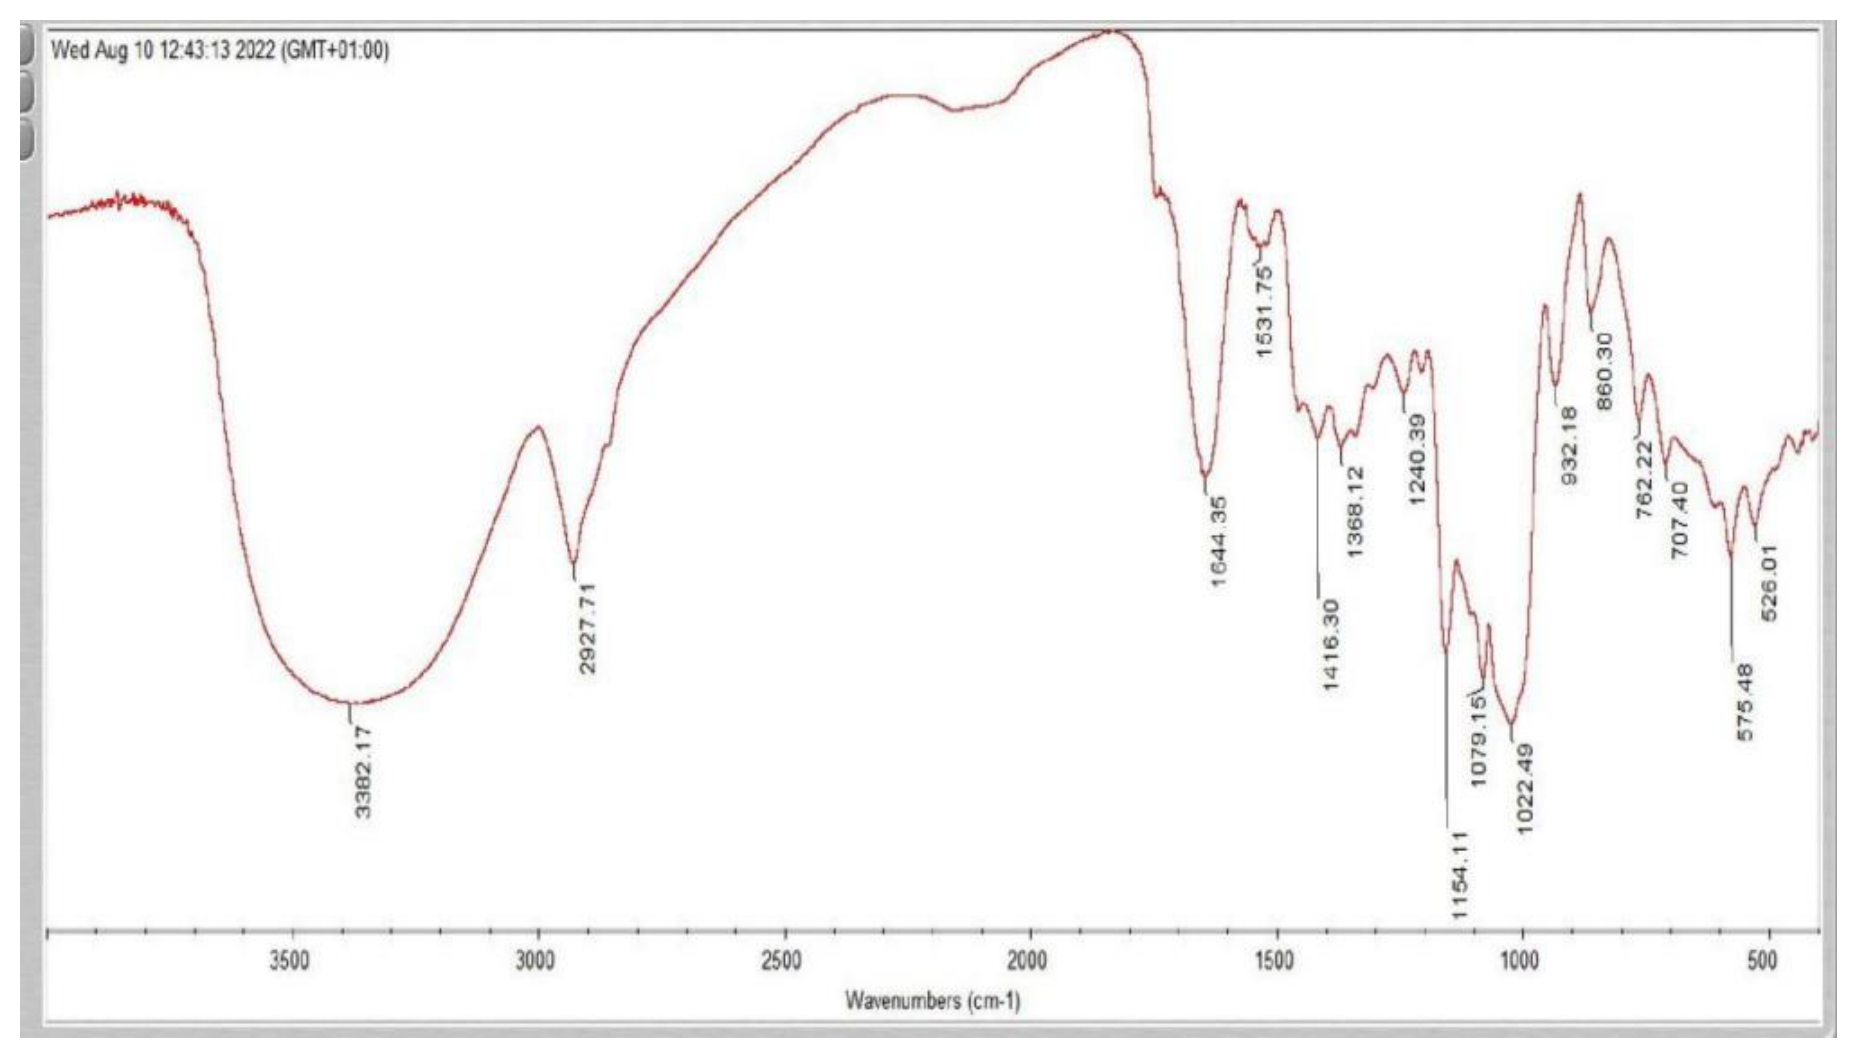
Figure 13.
FTIR Spectra for Sample A (0.5% Sulfur Inclusion).
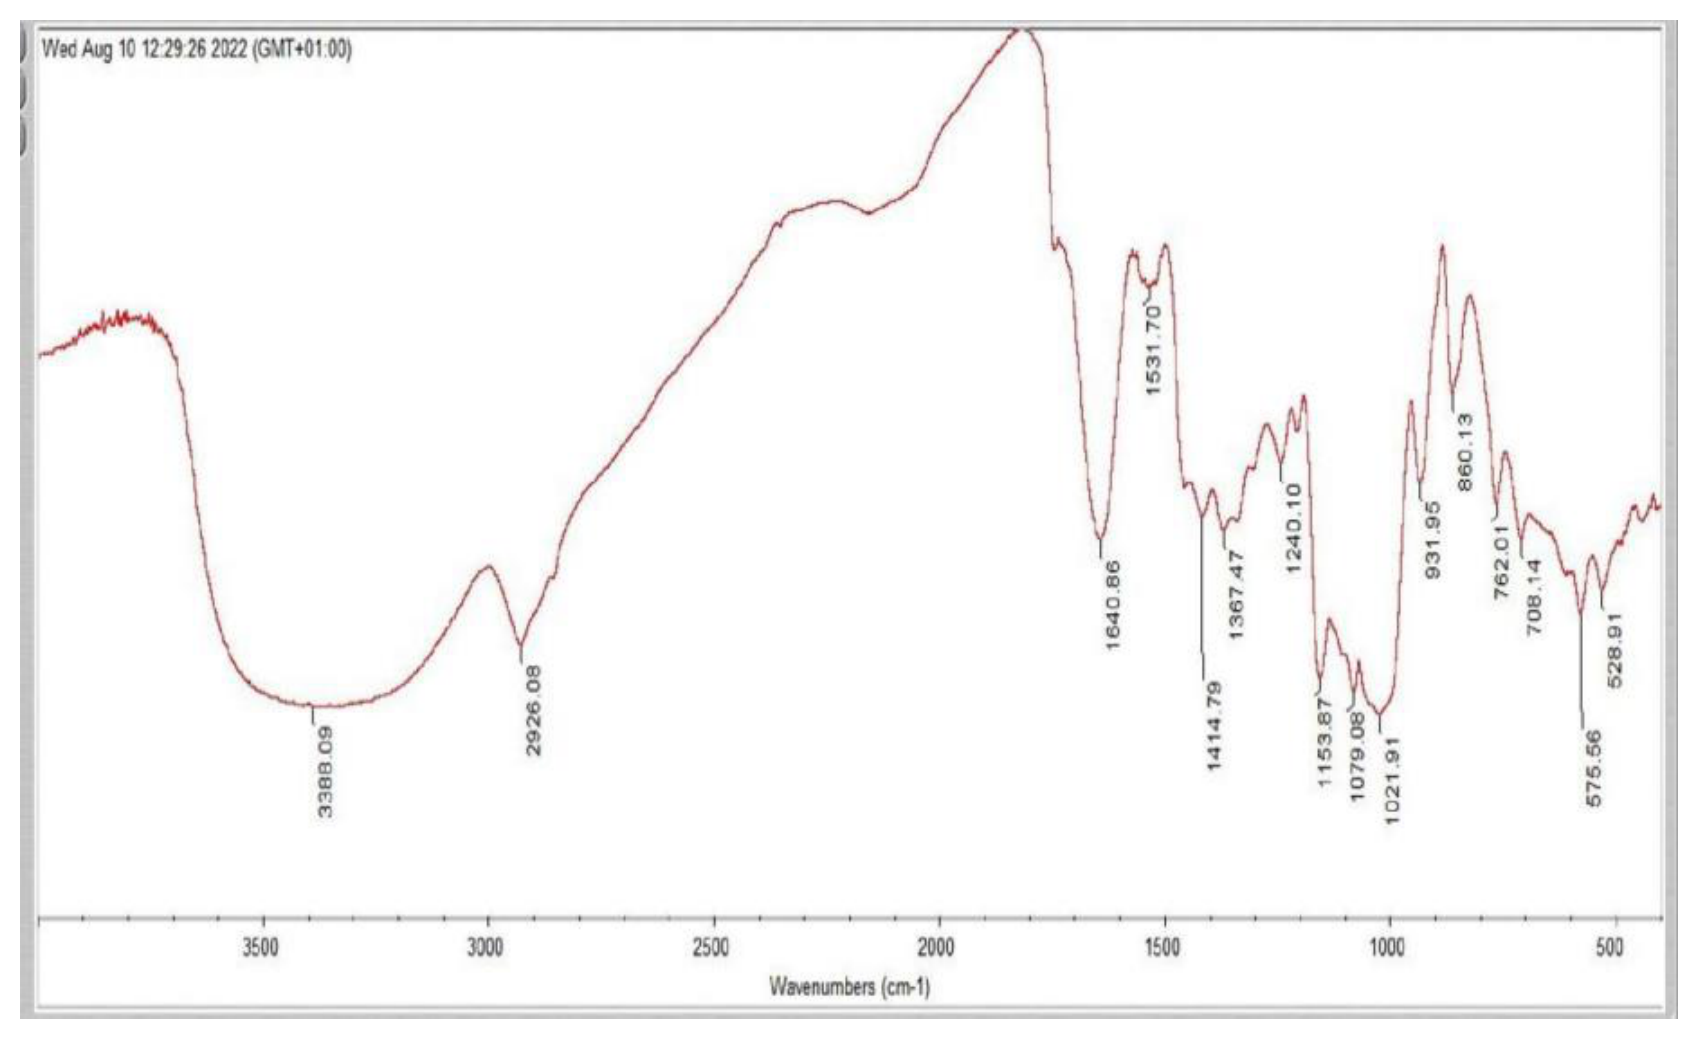
Figure 14.
FTIR Spectra for Sample B (1% Sulfur Inclusion).
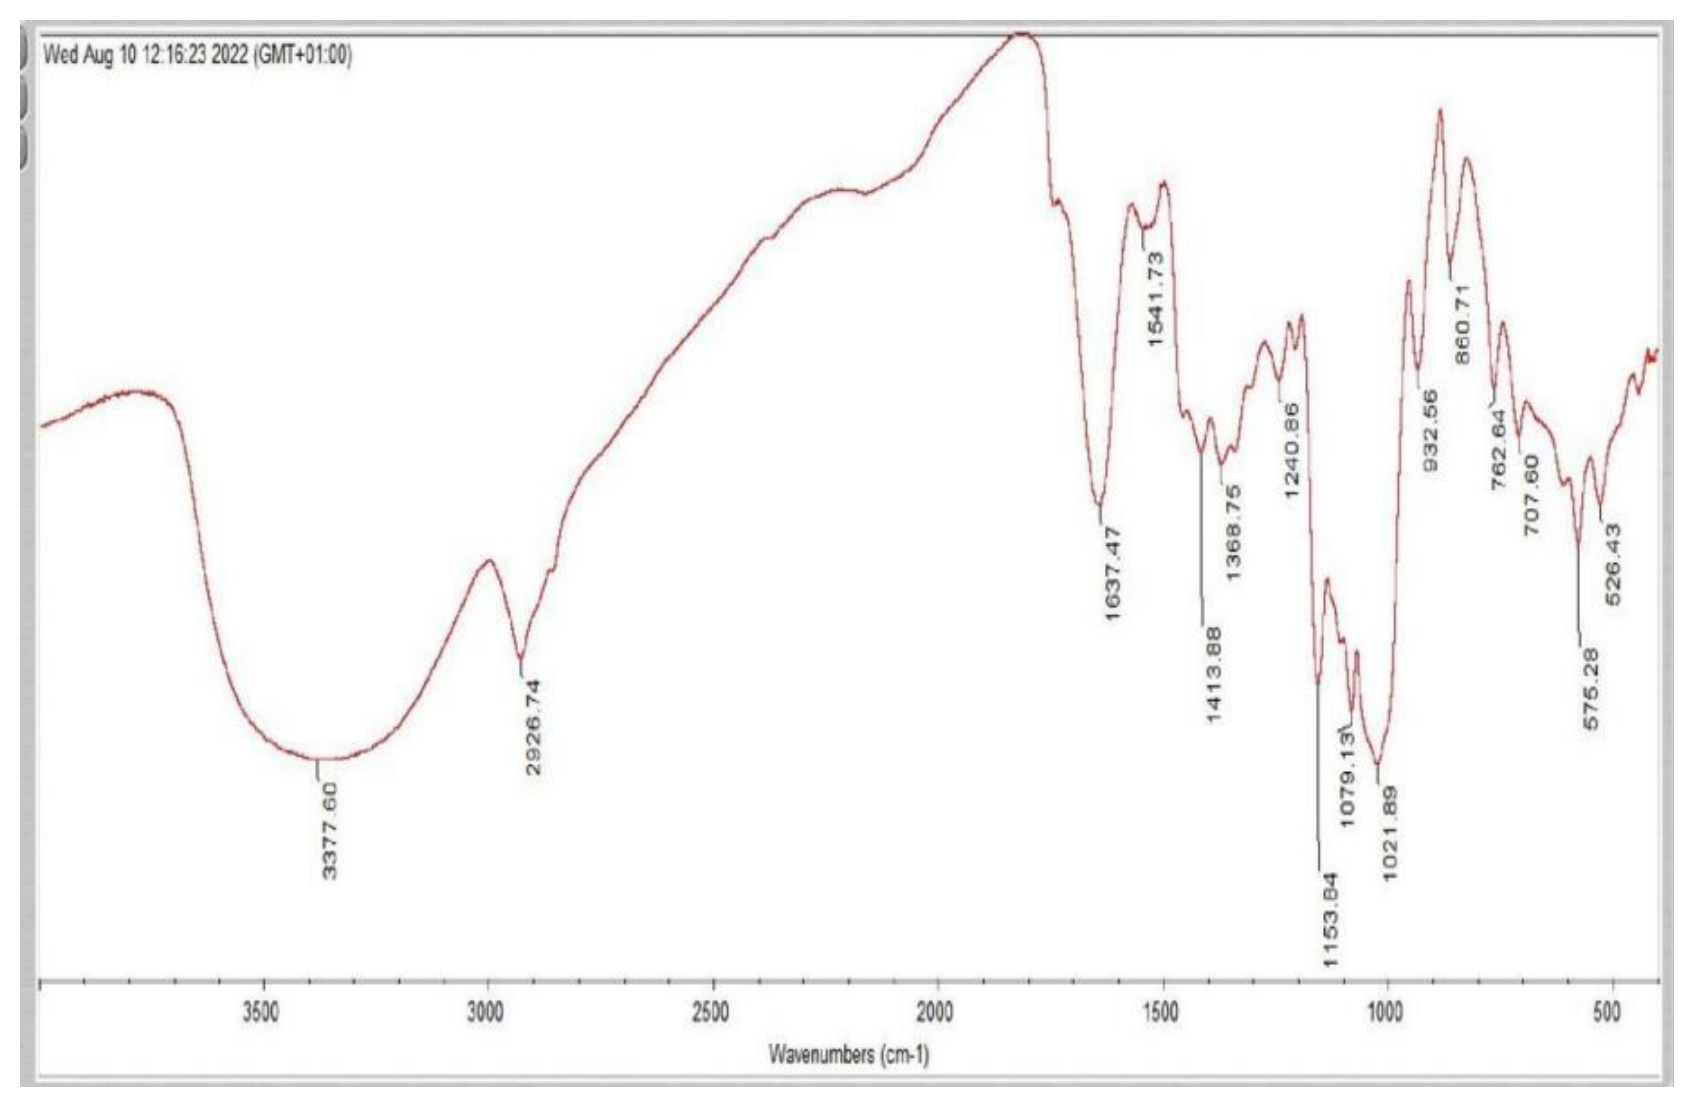
Figure 15.
FTIR Spectra for Sample C (1.5% Sulfur Inclusion).
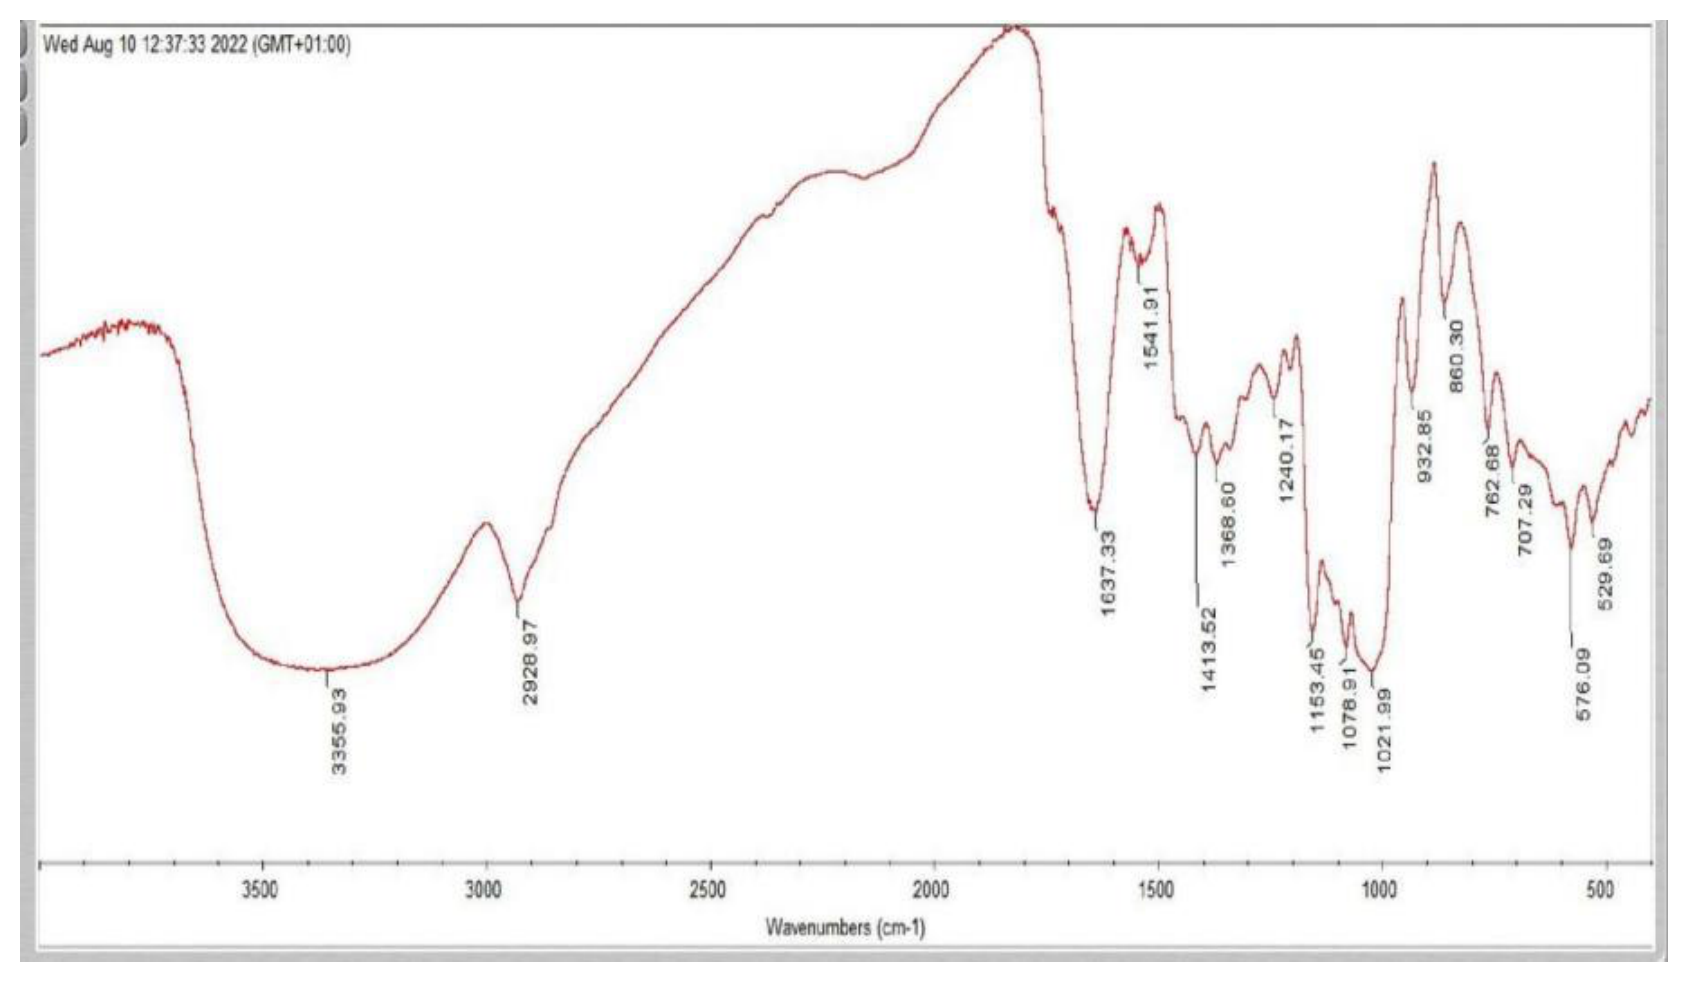

Table 1.
Dietary protein, Moisture and Ash composition of Sorghum Based Ogi with Elemental Sulfur.
| Parameter (%) | Control (zero S inclusion) | 0.25% S inclusion | 0.5% S inclusion | 0.75% S inclusion |
|---|---|---|---|---|
| Moisture | 63.00±0.82 | 62.33±1.70 | 64.50±1.87 | 61.33±1.70 |
| Ash | 0.33±0.58 | 0.50±0.50 | 0.67±0.29 | 0.50±0.50 |
| Protein | 46.83±2.67 | 57.25±15.33 | 58.83±21.32 | 68.63±3.97 |
Data are means of three independent experiments ± standard deviation (n=2); sample 1: Ogi Slurry (control), Sample 2: Ogi Slurry + 0.25% Elemental Sulfur, Sample 3: Ogi slurry + 0.5% Elemental Sulfur, Sample 4: Ogi Slurry + 0.75% Elemental Sulfur.
Disclaimer/Publisher’s Note: The statements, opinions and data contained in all publications are solely those of the individual author(s) and contributor(s) and not of MDPI and/or the editor(s). MDPI and/or the editor(s) disclaim responsibility for any injury to people or property resulting from any ideas, methods, instructions or products referred to in the content. |
© 2026 by the authors. Licensee MDPI, Basel, Switzerland. This article is an open access article distributed under the terms and conditions of the Creative Commons Attribution (CC BY) license (http://creativecommons.org/licenses/by/4.0/).
Copyright: This open access article is published under a Creative Commons CC BY 4.0 license, which permit the free download, distribution, and reuse, provided that the author and preprint are cited in any reuse.


