
Submitted:
12 June 2026
Posted:
24 June 2026
You are already at the latest version
Abstract
The World Health Organization (WHO) highlights the need of equitable hospital allocation and accessibility in achieving universal health coverage (WHO, 2023). Nigeria has several healthcare providers, both public and private, who provide healthcare services. As of November 2024, Nigeria had 51022 healthcare facilities spread throughout all 36 states and the Federal Capital Territory. The need for spatial analysis of health care facility location and accessibility has become increasingly important owing to rapid population growth and persistent inequalities in healthcare delivery. This study employs geospatial analysis to assess the distribution, accessibility, and spatial clustering of 51,022 health facilities across Nigeria using the GRID3 National Health Facilities Database. We integrated health facility data with state-level population estimates and administrative boundaries in QGIS. Spatial analyses included choropleth mapping of facility density, calculation of facility-to-population ratios per 100,000 people, 5-kilometer buffer analysis for geographic coverage, and Global Moran's I statistic for spatial autocorrelation assessment. The analysis revealed 88% of facilities are primary level, with only 10.3% secondary and 0.9% tertiary facilities. Facility-to-population ratios ranged from 9 to 59 per 100,000 people across states. States in the South-East (Cross-River, Ebonyi) demonstrated the highest facility to population ratios (37-59 per 100,000), while northwestern and northeastern states showed significantly lower ratios (9-14 per 100,000). Global Moran's I revealed statistically significant positive spatial autocorrelation (I = 0.352, z = 3.63, p = 0.003), confirming non-random geographic clustering of health facility distribution. Buffer analysis identified substantial underserved populations, particularly in northern Nigeria, with pronounced gaps between facility coverage zones.
Keywords:
geospatial analysis
; healthcare accessibility
; spatial autocorrelation
; GRID3
; health facility distribution
; Nigeria
; spatial equity
Introduction
The World Health Organization (WHO) highlights the need of equitable hospital allocation and accessibility in achieving universal health coverage (WHO, 2023). According to Abah 2023, health is a fundamental human right, and access to healthcare facilities is crucial in determining population well-being. Hospitals have a critical role in providing therapeutic, preventive, and emergency treatments, hence their equal distribution is a crucial factor influencing healthcare results. Health is a comprehensive condition of well-being that allows people to live productive lives, acting as a means to a goal and offering resources to attain the highest level of mental, emotional, and physical stability (World Health Organization, 2023).
The World Health Organization stresses fair access, especially for vulnerable groups such as ethnic minorities, women, children, and people with disabilities, many of whom live in rural areas. The global movement for Universal Health Coverage (UHC) is consistent with the Sustainable Development Goals (SDGs), which seek to assure healthcare access for all. Healthcare systems, particularly in low- and middle-income countries, face accessibility and service quality challenges (WHO, 2017).
Nigeria has several healthcare providers, both public and private, who provide healthcare services. As of November 2024, Nigeria had 51022 healthcare facilities spread throughout all 36 states and the Federal Capital Territory. The majority of these facility (88%) were primary healthcare facilities, 10.3% were secondary and only 1% were tertiary healthcare facilities while the remaining 0.7% status are unknown.
Nigeria’s National Health Policy stresses healthcare equity and acknowledges health as a fundamental human right. Population health outcomes are a crucial indication of sustainable development. As stated by Joachim, Osibanjo, and Abioro (2020), healthcare planning in low- and middle-income countries can be intellectually difficult. Nigeria faces significant healthcare accessibility challenges, compounded by its large population of over 200 million and a complex spatial configuration that renders uniform service delivery particularly difficult. Healthcare facilities are disproportionately concentrated in cities, leaving rural and peri-urban areas neglected.
Despite the extensive research on healthcare access in Nigeria, the most of them are limited to the local or state level and frequently employ out-of-date data. This remains a serious need in national-scale geospatial assessment with high resolution datasets. The study’s goal is to detect spatial inequities, evaluate accessibility and trends, and provide evidence-based recommendations for health planning and resource allocation.
Study area.
Nigeria is located in West Africa and comprises 36 states and the Federal Capital Territory (FCT), Abuja. With over 200 million population, Nigeria is the most populous nation in the sub-Saharan African. Nigeria shares borders with Benin Republic to the west, Niger to the north, Chad to the northeast, and Cameroon to the east, while its southern coast is bounded by the Atlantic Ocean (Gulf of Guinea).
Literature Review
Mukhtar et al. (2018), have also suggested that the spatial distribution of healthcare facilities is not evenly distributed in Benue State, Jigawa State, Kano State and Delta State respectively. However, most of these studies solely focus on the spatial distribution of healthcare facilities without analyzing the inequalities, assess accessibility, patterns and evident-based recommendation for health planning and resource allocation.
Nigeria presents a unique case, as the healthcare system is a three-tier structure comprising primary, secondary, and tertiary facilities. While primary health centers are widespread, hospitals providing secondary and tertiary care are fewer and often concentrated in urban centers (Akinwumi et al., 2022). This uneven distribution results in overcrowding in some hospitals and underutilization in others, thereby undermining the efficiency and equity of healthcare delivery (Ishaq et al., 2024).
The spatial arrangement of healthcare facilities is not only a question of availability but also of accessibility, which is influenced by distance, transportation networks, travel time, and socio-economic conditions (Amoah Nuamah et al., 2023). Jaro & Ibrahim (2012) opined that accessibility to HCFs has physical, time, economic and social dimensions. The physical dimension deals with the condition of the road, the time dimensions refer to the time spent on a journey, the economic dimension deals with money spent on a journey and the social dimension has to do with the culture and values of the people, which determines the use of particular facility. For any facility to be utilized in any region, the accessibility has to be considered and this is mainly hinged on the transport, which serves as a medium by which movement from one place to the other is made possible (Jaro & Ibrahim, 2012).
This study investigates the spatial distribution of national healthcare facilities amid ongoing health crise as a result of Lassa fever and suspected recurrence of Ebola virus.
The findings will equip planners and public health officers with spatial intelligence on facility locations, enabling evidence-based preparedness and response to epidemic outbreaks.
Research Database
Three primary datasets were integrated for this analysis:
| Dataset | Source | Description | Year |
| Health Facilities | GRID3 National Health Facilities Database | Geocoded locations of 51,022 facilities with attributes including name, type, ownership, and coordinates | 2024 |
| Population | GRID3 Nigeria Population (v3.0) | Gridded population estimates at 100m resolution | 2023 |
| Administrative Boundaries | GADM (Global Administrative Areas) | State and LGA boundary shapefiles for Nigeria | 2024 |
Data Analysis
To achieve analytical rigor, data cleansing included several steps:
Coordinate Validation: All facility coordinates were validated to be within Nigeria’s geographic boundaries (4.2°-13.9°N, 2.7°-14.7°E). To ensure uniformity, floating-point precision flaws in coordinates were discovered and rounded to seven decimal places (about 1cm).
Missing Data Assessment: Approximately 32.3% of facilities (16,481 data) lacked national health facility registration (NHFR) codes, indicating that they were unregistered or informal. These were included in the analysis and marked as ’unregistered’ to represent the entire health facility landscape.
Facility Classification: Facilities were classified as Primary, Secondary, Tertiary, or Unknown based on their type attributes. Text discrepancies in facility type names were normalized using the TRIM function and manually verified.
Projection Harmonization: All spatial layers were reprojected to EPSG:26393 (Minna / Nigeria Mid Belt) to ensure precise area and distance computations. This projection method is designed for Nigeria’s geographic area and uses meters as its measuring unit.
4.3. Spatial Analysis Techniques
4.3.1. Facility Distribution Mapping
Choropleth maps were created to depict facility numbers by state using the Natural Breaks (Jenks) classification with five classes. This approach optimizes class borders to increase between-class variance while decreasing within-class variance.
4.3.2. Population Integration
The GRID3 population raster was aggregated to the state level using QGIS’s Zonal Statistics (sum). This resulted in total population estimates for each of Nigeria’s 37 administrative entities (36 states plus FCT).
4.3.3. Facility-to-People Ratio Calculation
Facility density was computed as facilities per 100,000 people using the formula (facility count/state population) × 100,000. This standardized metric allows for direct comparison across states with different population sizes.
4.3.4. Buffer Analysis
A 5-kilometer Euclidean distance buffer was created around each facility site to approximate the WHO’s recommended maximum distance for primary healthcare access. Buffer zones were used to identify geographic gaps in coverage.
4.3.5. Spatial Autocorrelation Analysis
The global Moran’s I statistic was calculated using GeoDa software and Queen contiguity spatial weights (states that share borders or corners are considered neighbors). The statistical significance was determined after 999 permutations. The Moran’s I statistic has a range of -1 (complete dispersion), 0 (random), and +1 (perfect clustering), with positive values suggesting geographical grouping.
4.4. Software & Tools
All spatial analyses were carried out using QGIS 3.4 (an open-source GIS software). Microsoft Excel was used to clean data and calculate attribute values. Spatial autocorrelation analysis was carried out using GeoDa 1.20 (spatial statistics program). Final maps were created using QGIS Print Layout and exported at 300 DPI for publishing quality.
- Result and Discussion
5. Types of Healthcare Facilities in Nigeria
Figure 1 shows the healthcare facilities count in Nigeria as at November 2024. The data revealed that 88% of all healthcare facilities are primary health centres, the most basic tier of the Nigerian healthcare system. It is essential to understand the nature of primary healthcare in Nigeria, the equipment’s available and the service that can be rendered. Secondary healthcare category stood slightly above 10% while tertiary account for just 0.9%. This distribution reflects the intended healthcare system structure but raises questions about secondary and tertiary capacity relative to population burden. Absolute facility counts varied substantially across states. Lagos state have the highest facilities in the country with a total of 2,798 while Kastina have a total of 2,296 facilities, Benue with a total of 2,284. States with the lowest counts included Bayelsa (422), Yobe (633), and Ekiti (772). However, these raw counts do not account for population differences and therefore provide limited insight into actual service adequacy.
Figure 1.
Type of facilities. Source: GRID3 National Health Facilities Database, 2024.
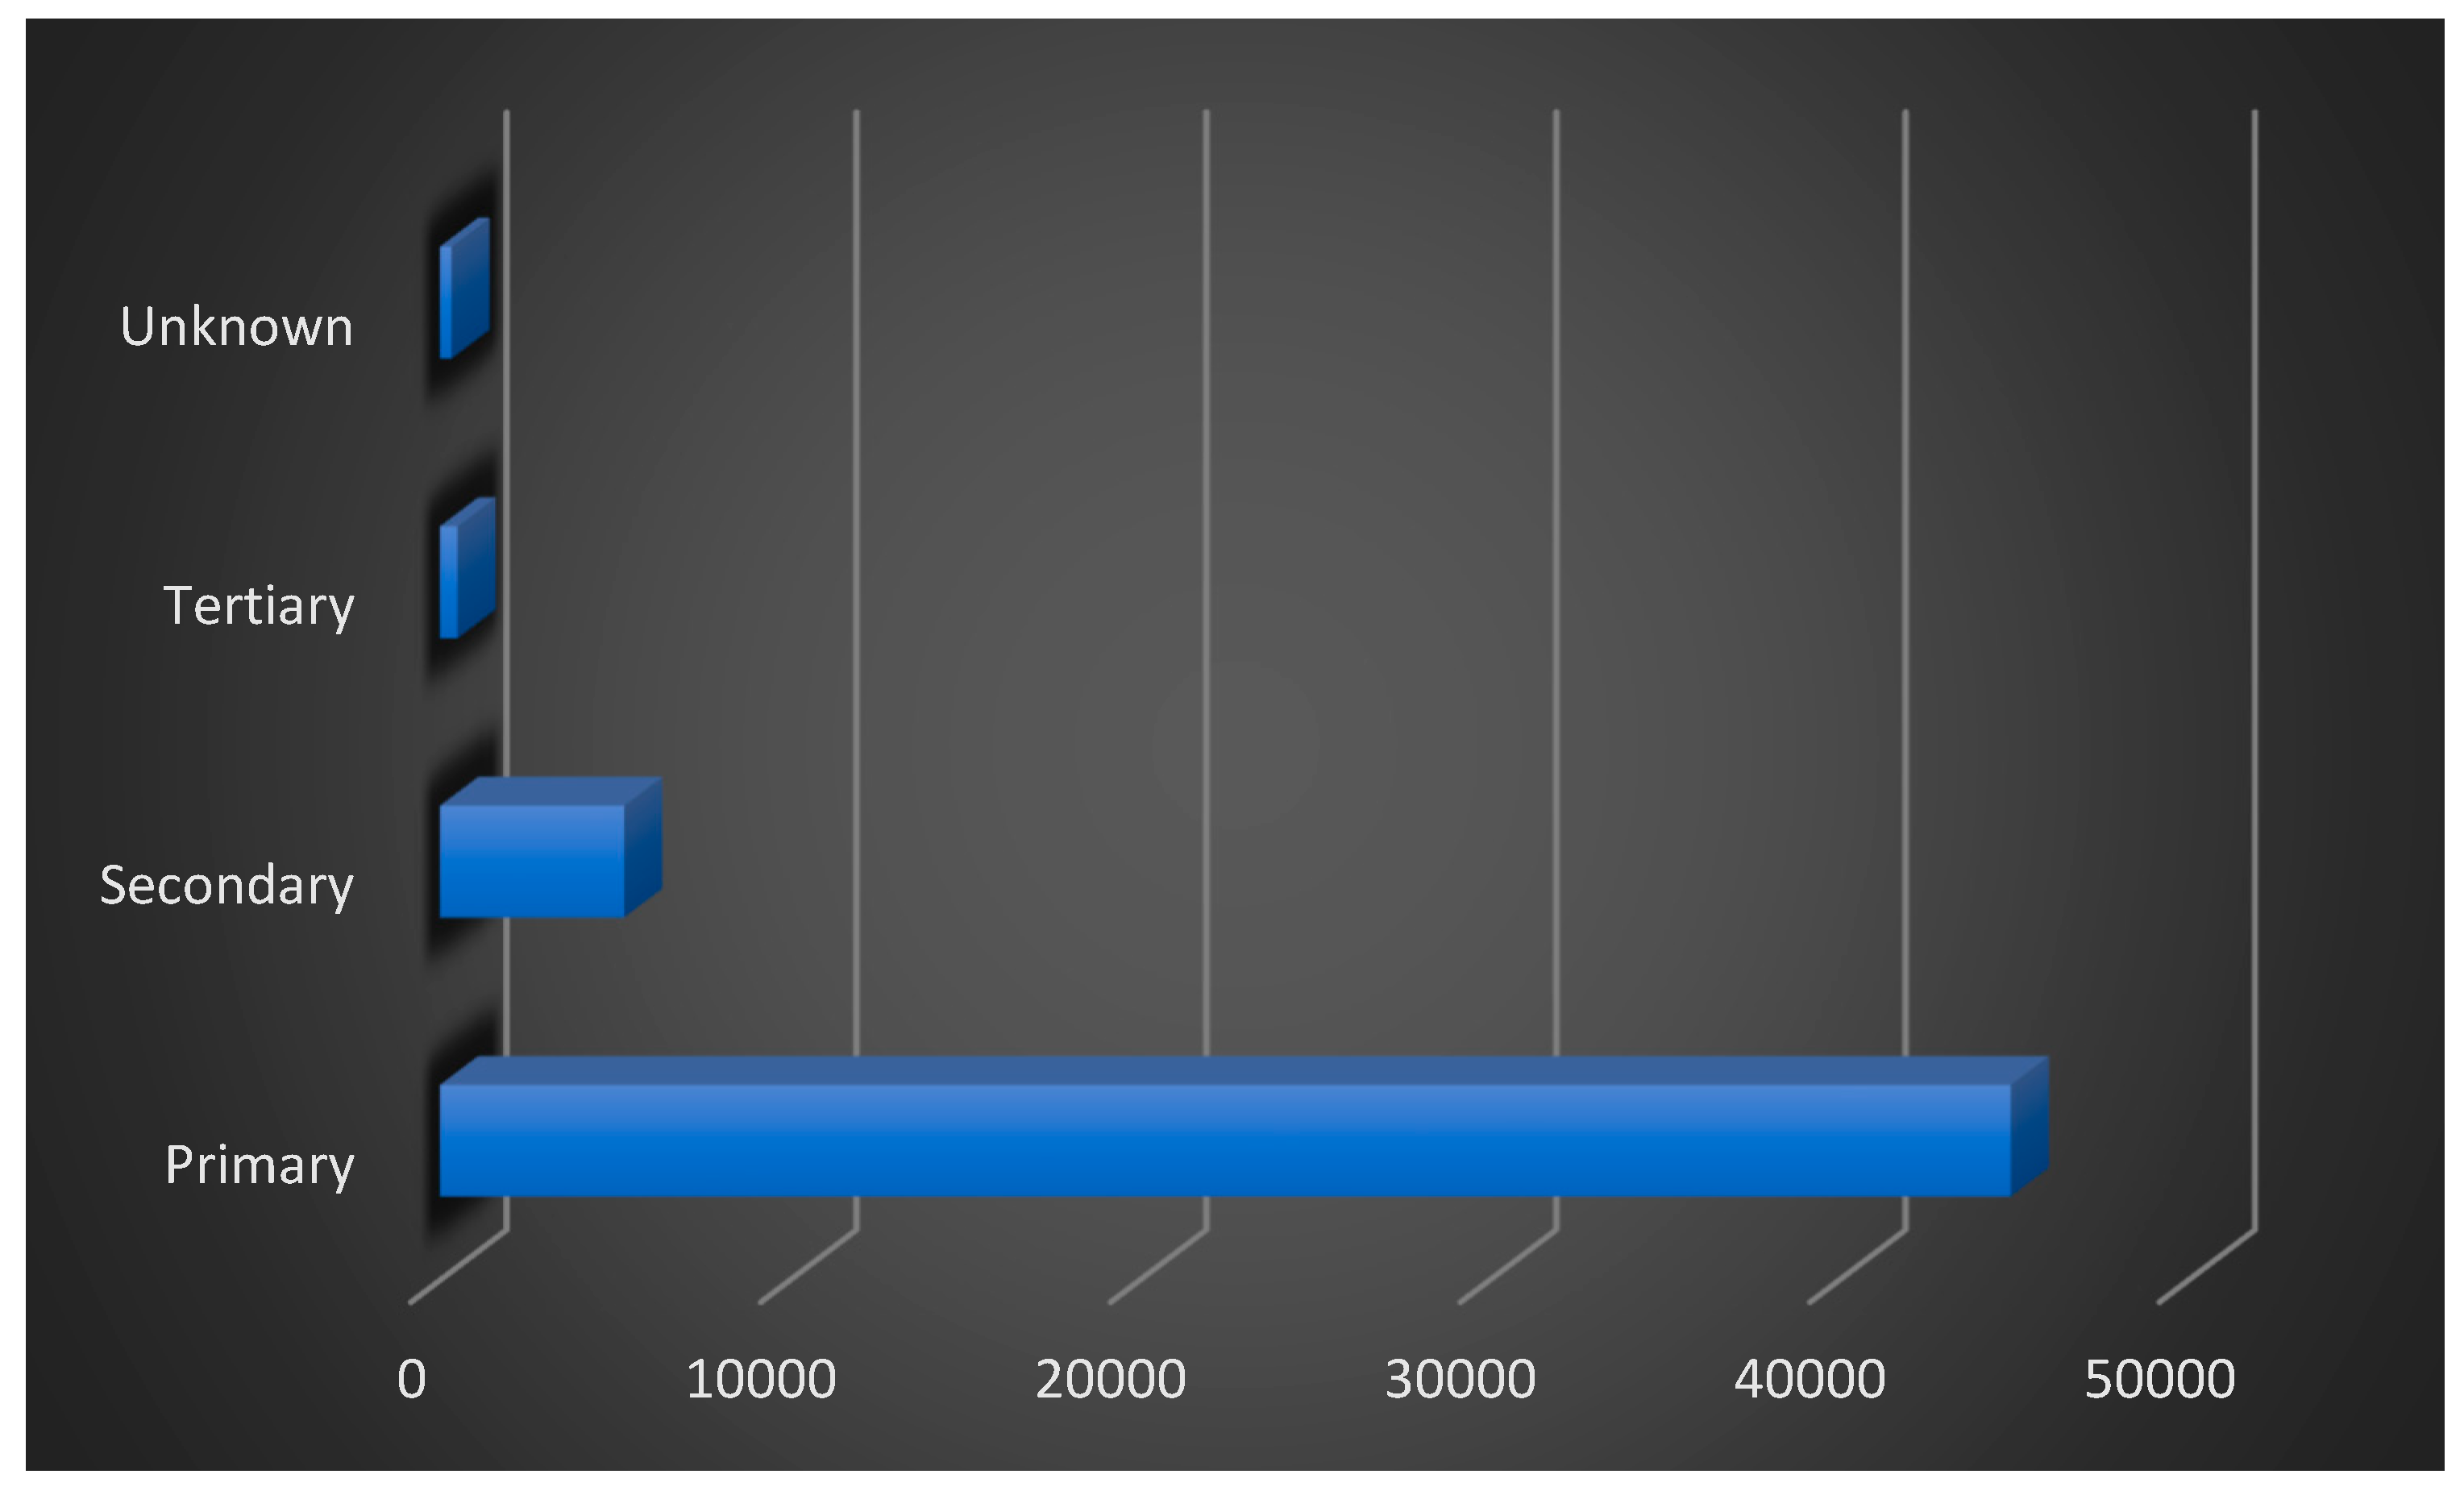
The dominance of primary facilities is consistent with Nigeria’s three-tier healthcare policy and broadly mirrors facility type distribution in other sub-Saharan African countries (Amoah-Nuamah et al, 2023). However, the low proportion of secondary and tertiary facilities raise concern particularly with over 70% of secondary facilities in Nigeria are privately owned. A wide primary based with a narrow and largely privatized secondary tier create a gap for patients that want to access beyond basic care. Patient must either pay for more or travel a far distance to access public secondary tier facility. Similar dynamics have been documented in Ghana and across rural sub-Saharan Africa (Florio etal, 2023), where physical proximity to facility does not translate into effective access when the facility tyoe and ownership determine whether services are affordable.
5.1. Health Facilities Ownership Status
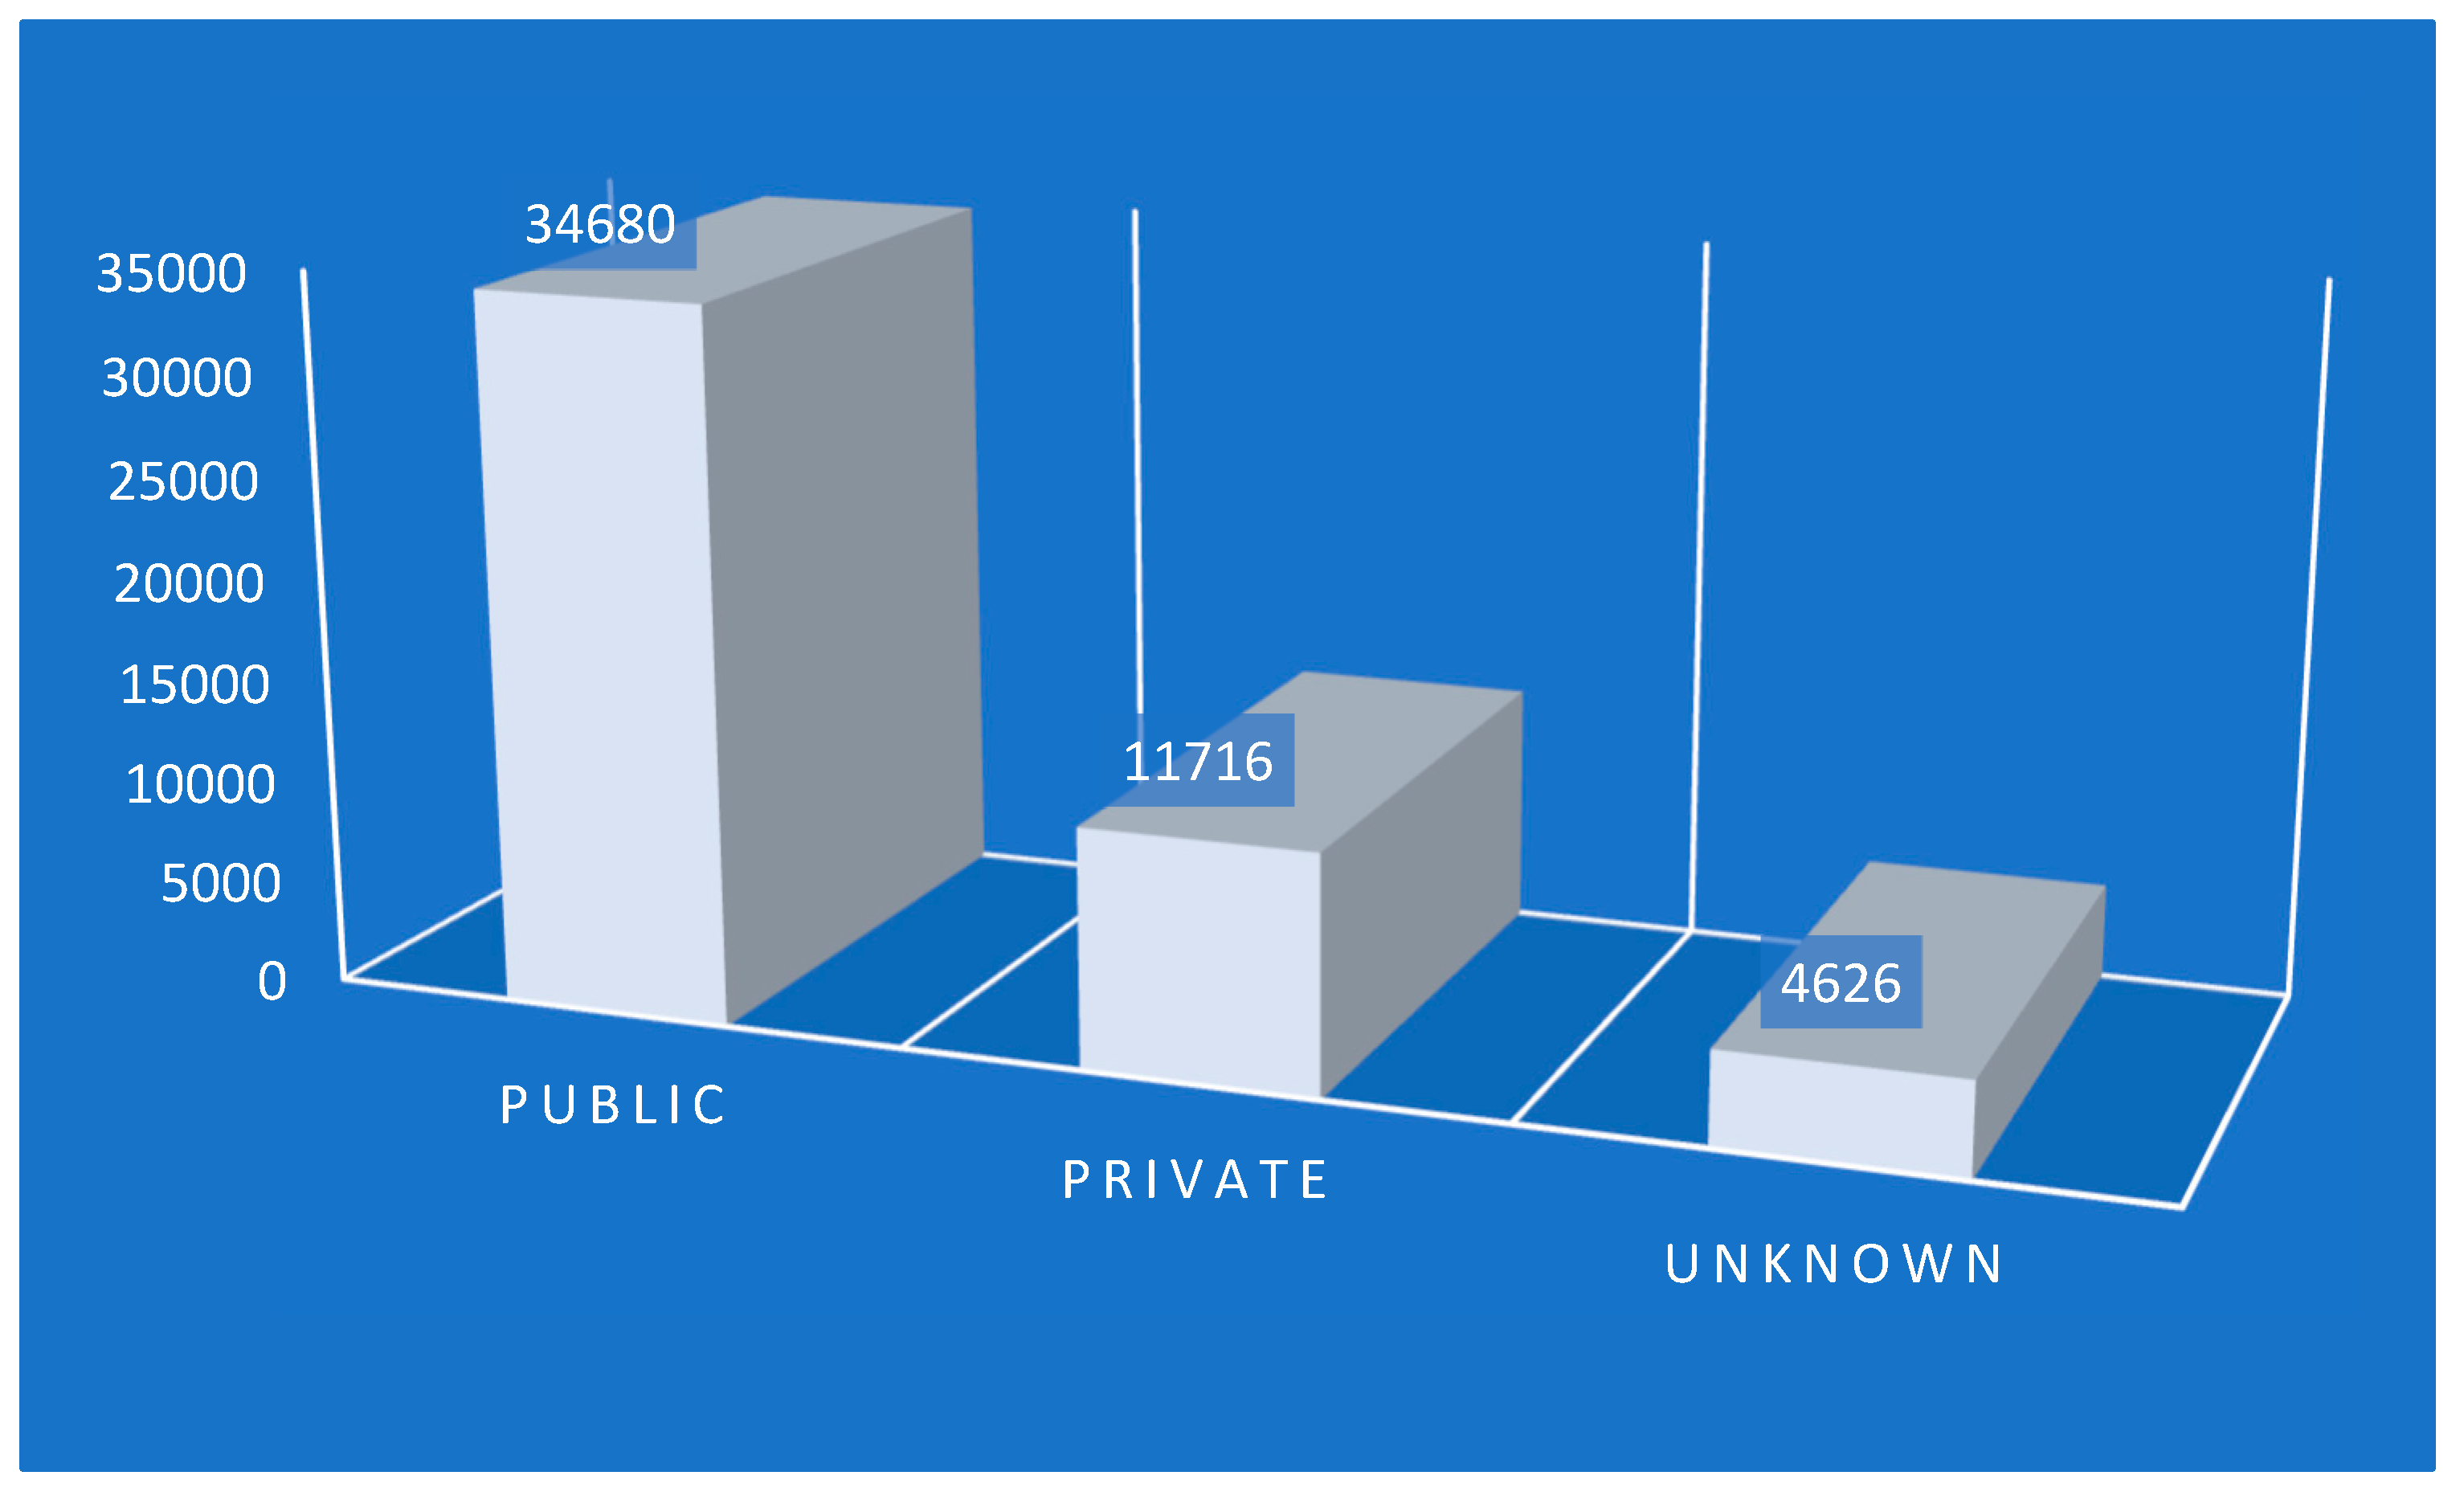
The data shows a significant government interest in the healthcare sector with over 67% contribution to the healthcare system in the country. The private sector account for approximately 23% while the remaining status of the percentages are unknown. Further analysis shows that only 8% contribution towards the primary healthcare come from the private sector while 91.7% spread across the federal government, local government, state government and non-profit organization. The 8% contribution from the private institution towards the primary healthcare facilities most in the villages and towns show little from private investors towards basic healthcare facilities which might be attributed to the income level of rural and town dweller. The local government contribute to over 52% of the primary health facilities showing a good effort from the respective local government authorities. This percentage shows that financial contribution of local government authority is paramount to sustainable healthcare delivery in the local environment. Data analysis shows that over 70% of the secondary healthcare facilities are owned by private investors with around 24% owned by public. This issue raises affordability to better healthcare may not be available to locals and low-income earner because private establishment always comes with higher price however with improved care.
Figure 2.
Health Facilities Ownership Status.
5.2. Facilities to Population Ratio
Population-adjusted analysis revealed stark disparities. Facility-to-population ratios ranged from 9 to 59 facilities per 100,000 people across states, representing more than six-fold variation. High facility to population ratios were observed in states such as Cross River (59) and Ebonyi (51), while many southwestern states, including Lagos and Ogun, maintained lower ratios (15-22 per 100,000) despite their high absolute facility counts.

Table 1.
.
| State | Population | Health Facilities | Facility/100,000 Persons |
| Abia | 3,972,828 | 1,321 | 33 |
| Adamawa | 5,550,726 | 1,561 | 28 |
| Akwa Ibom | 4,300,545 | 934 | 22 |
| Anambra | 5,764,448 | 1,867 | 32 |
| Bauchi | 8,657,827 | 1,468 | 17 |
| Bayelsa | 2,5107,22 | 422 | 17 |
| Benue | 9,153,260 | 2,284 | 25 |
| Borno | 6,022,991 | 804 | 13 |
| Cross River | 2,663,048 | 1,522 | 57 |
| Delta | 7,660,894 | 1,059 | 14 |
| Ebonyi | 2,451,571 | 1,243 | 51 |
| Edo | 6,712,267 | 1,069 | 16 |
| Ekiti | 2,981,072 | 772 | 26 |
| Enugu | 5,098,108 | 1,457 | 29 |
| Fct | 3,488,788 | 652 | 19 |
| Gombe | 4,936,821 | 897 | 18 |
| Imo | 6,617,273 | 1,779 | 27 |
| Jigawa | 7,868,010 | ,904 | 11 |
| Kaduna | 11,070,389 | 1,545 | 14 |
| Kano | 18,757,365 | 1,723 | 9 |
| Katsina | 10,472,755 | 2,296 | 22 |
| Kebbi | 3,920,280 | 1,207 | 31 |
| Kogi | 4,613,825 | 1,644 | 36 |
| Kwara | 4,780,488 | 1,097 | 23 |
| Lagos | 13,395,636 | 2,798 | 21 |
| Nasarawa | 3,840,957 | 1,207 | 31 |
| Niger | 7,440,220 | 2,201 | 30 |
| Ogun | 12,013,758 | 1,993 | 17 |
| Ondo | 5,162,945 | 1,096 | 21 |
| Osun | 6,033,559 | 1,729 | 29 |
| Oyo | 8,984,693 | 2,045 | 23 |
| Plateau | 5,880,231 | 1,643 | 28 |
| Rivers | 6,674,497 | 791 | 12 |
| Sokoto | 4,337,857 | 937 | 22 |
| Taraba | 4,561,228 | 1,464 | 32 |
| Yobe | 5,307,150 | 663 | 12 |
| Zamfara | 3,541,933 | 928 | 26 |
Source: GRIDS, 2024.
Figure 3.
Facilities to Population Ratio.
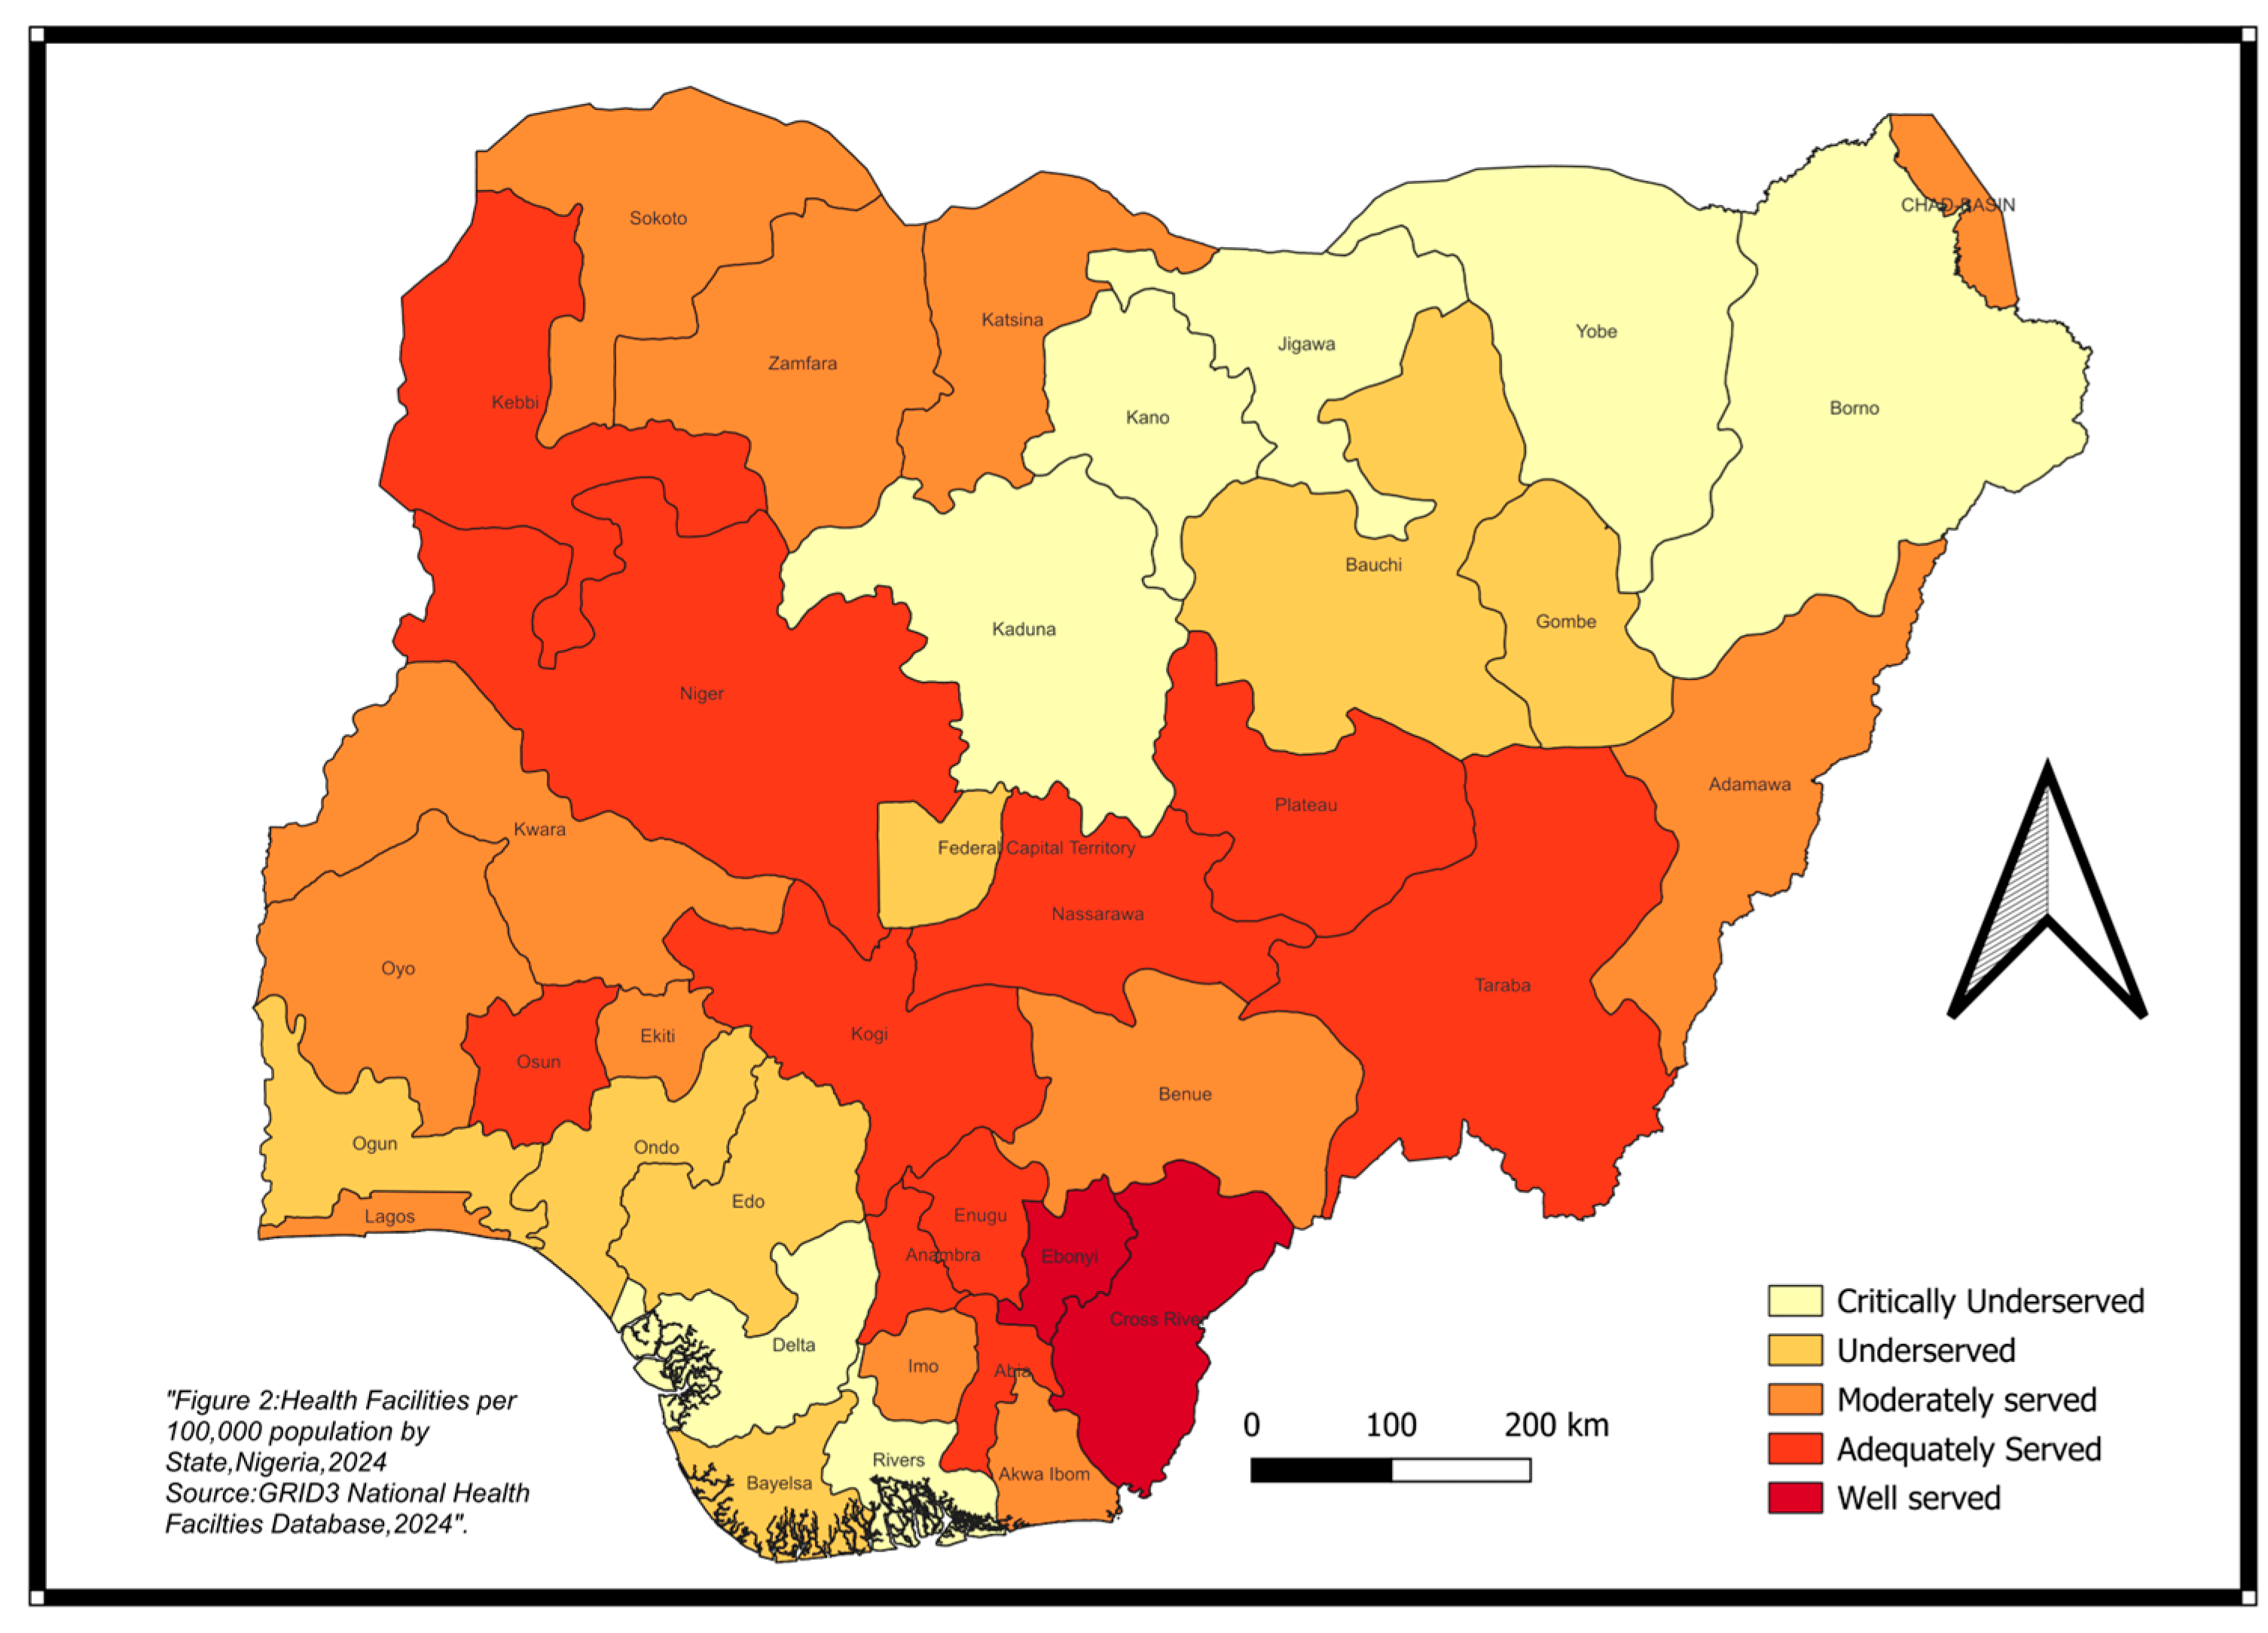
This pattern diverges significantly from raw facility counts. Kano, despite having the 1,723, ranked among the lowest in facility-to-population ratio (approximately 9 per 100,000) due to its large population (18.8 million). This finding underscores the critical importance of population-adjusted metrics in assessing health system equity.
The wide north-south disparity in facility to population ratio reflects a deeply embedded structural inequalities rater than recent policy failures. The concentration of colonial-era infrastructure investment in southern Nigeria, combined with the historically lower presence of missionary founded health institutions in the predominantly Muslim north, has produced a spatial legacy that persists in the current distribution of facilities (Abah, 2023). This finding is consistent with other African nations. In Ethiopia, spatial clustering of health facilities along historic trade and administrative corridors has similarly produced persistent rural-urban gradients that resist short-term policy correction (Florio et al. 2023)
5.3. Coverage Maps
5.3.1. A 5km Buffer Analysis Map
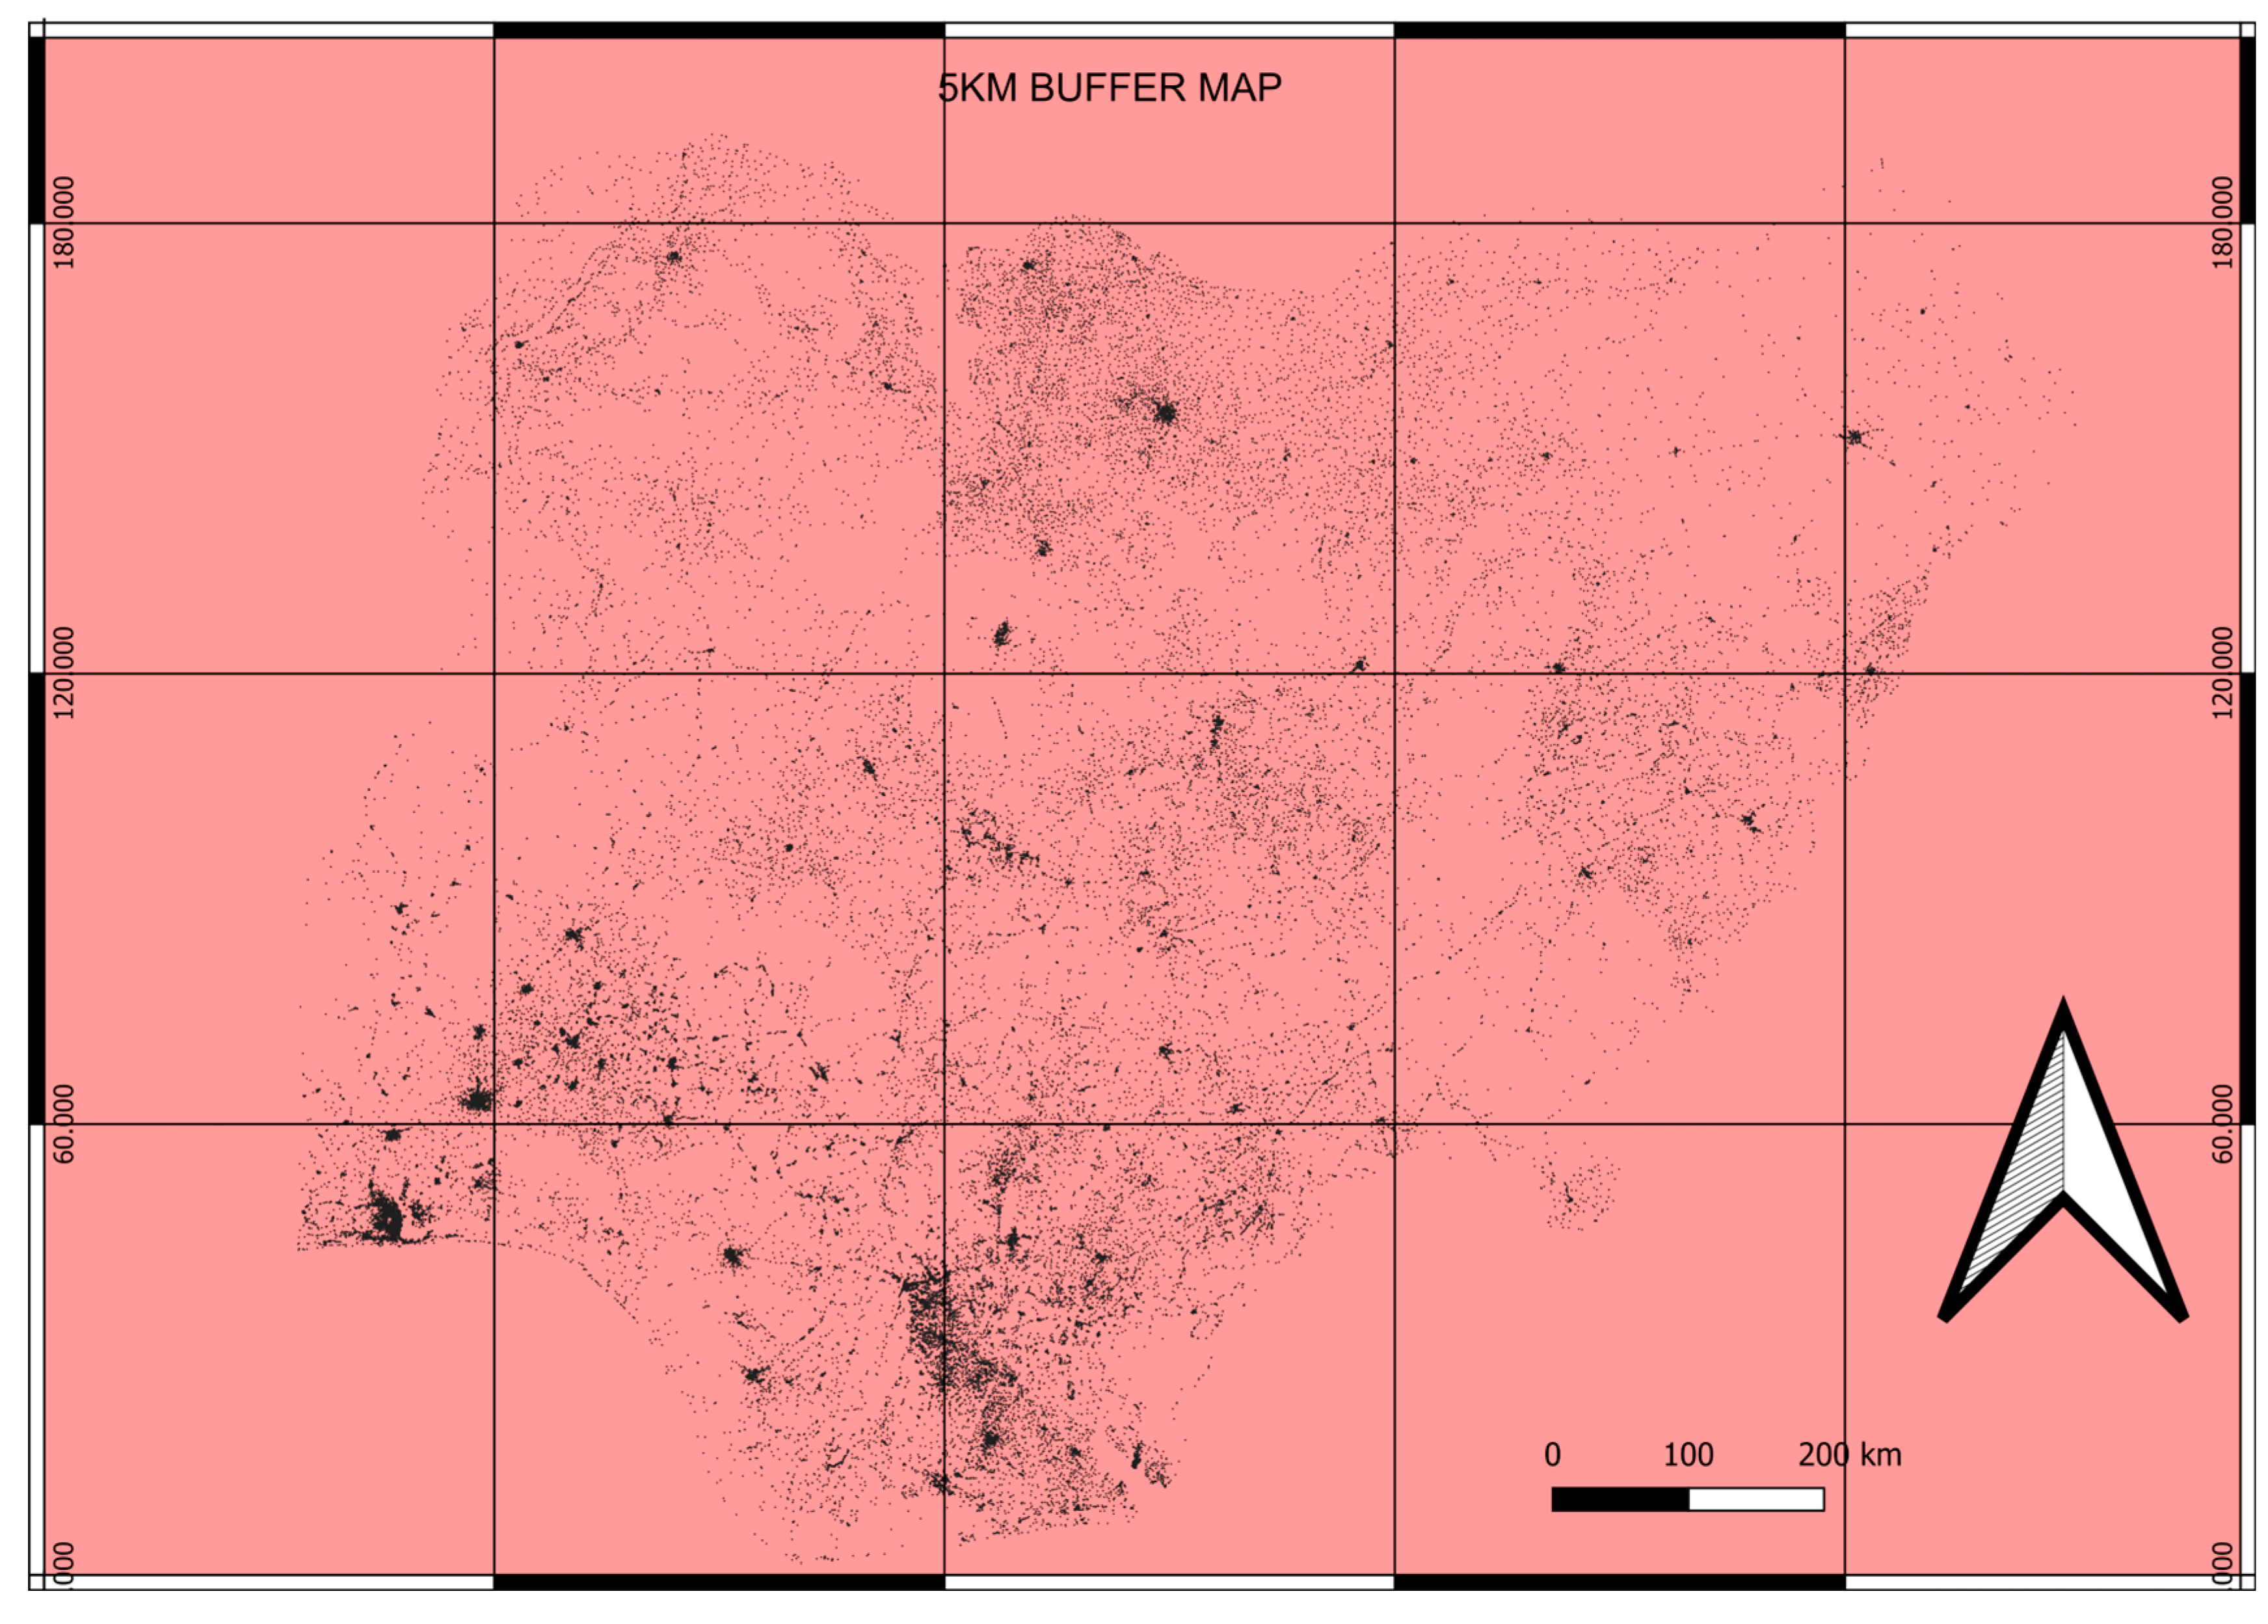
The above map shows a density map at 5km buffer across the country. The southern regions exhibit a high spatial density of facilities, characterized by significant overlap in service buffers, indicating superior geographical accessibility.
The lower density of buffer zones in the north is primarily due to the region’s vast geographical landmass, which results in fewer overlapping service areas compared to the more compact southern states. The large area of land in the northern part of the country account for the spatial analysis result visualization. However, regardless of the population density state with large geographical landmass should invest more in health facilities and geo positioning within reasonable distance to people. The result also underlines challenges face by rural dweller because the urban areas have multiple facilities located within 5 km while the villages only have access to few basic medical center which only perform basic treatments.
The 5km Euclidean buffer analysis reveals significant coverage gaps in northern Nigeria; however, this method is likely to underestimate the severity of inaccessibility in this region." Bihin et al. (2022) found that Euclidean distance measures correlate the least with perceived accessibility in rural locations with sparse road networks across 12 sub-Saharan African countries. In northern Nigeria, where road density is among the lowest in the country and security limitations limit movement in areas such as Borno and Yobe, a health facility’s effective catchment area may be much lower than a 5km Euclidean circle suggests.
Figure 5.
Buffer analysis. Source: Author, 2026.
5.3.2. Nearest Neighbor Analysis
The above table show spatial location of healthcare facilities and pattern of their arrangement within the Nigeria geographical boundaries. 1324.03m distance shows a clustered pattern of health facilities as against the 2612.41m expected mean distance. These statistics raised question of how do people in the underserve region take care of themselves? These regions are predominantly rural areas with poor road networks, light and other basic amenities. 0.507 Nearest Neighbor Index of 0.507 confirms that this clustering pattern did not occur by chance (z=-2.13.11, p<0.001), indicating highly statistically significant spatial clustering of health facilities. The concentration generates ’healthcare deserts’ in rural areas, where the distance to the nearest institution surpasses the average of 1.3km. Rural communities have limited access to basic primary care, requiring them to overcome bad infrastructure to reach the nearest cluster, unlike urban areas with many facilities within a 5km radius. This spatial layout fosters regional inequalities and represents a major hurdle to obtaining Universal Health Coverage (UHC) in Nigeria.
Table 2.
.
| Parameter | Value | Interpretation |
| Observed Mean Distance | 1324.03m | Average distance between healthcare facilities |
| Expected mean distance | 2612.41m | Distance expected under random distribution |
| Nearest Neighbor Index | 0.507 | Clustering pattern of location of facilities indicator |
| Number of Points | 51022 | Total health centers analyzed |
| Z-score | -213.11 | Highly significant clustering |
Source: Author’s analysis, 2026.
5.4. Spatial Autocorrelation
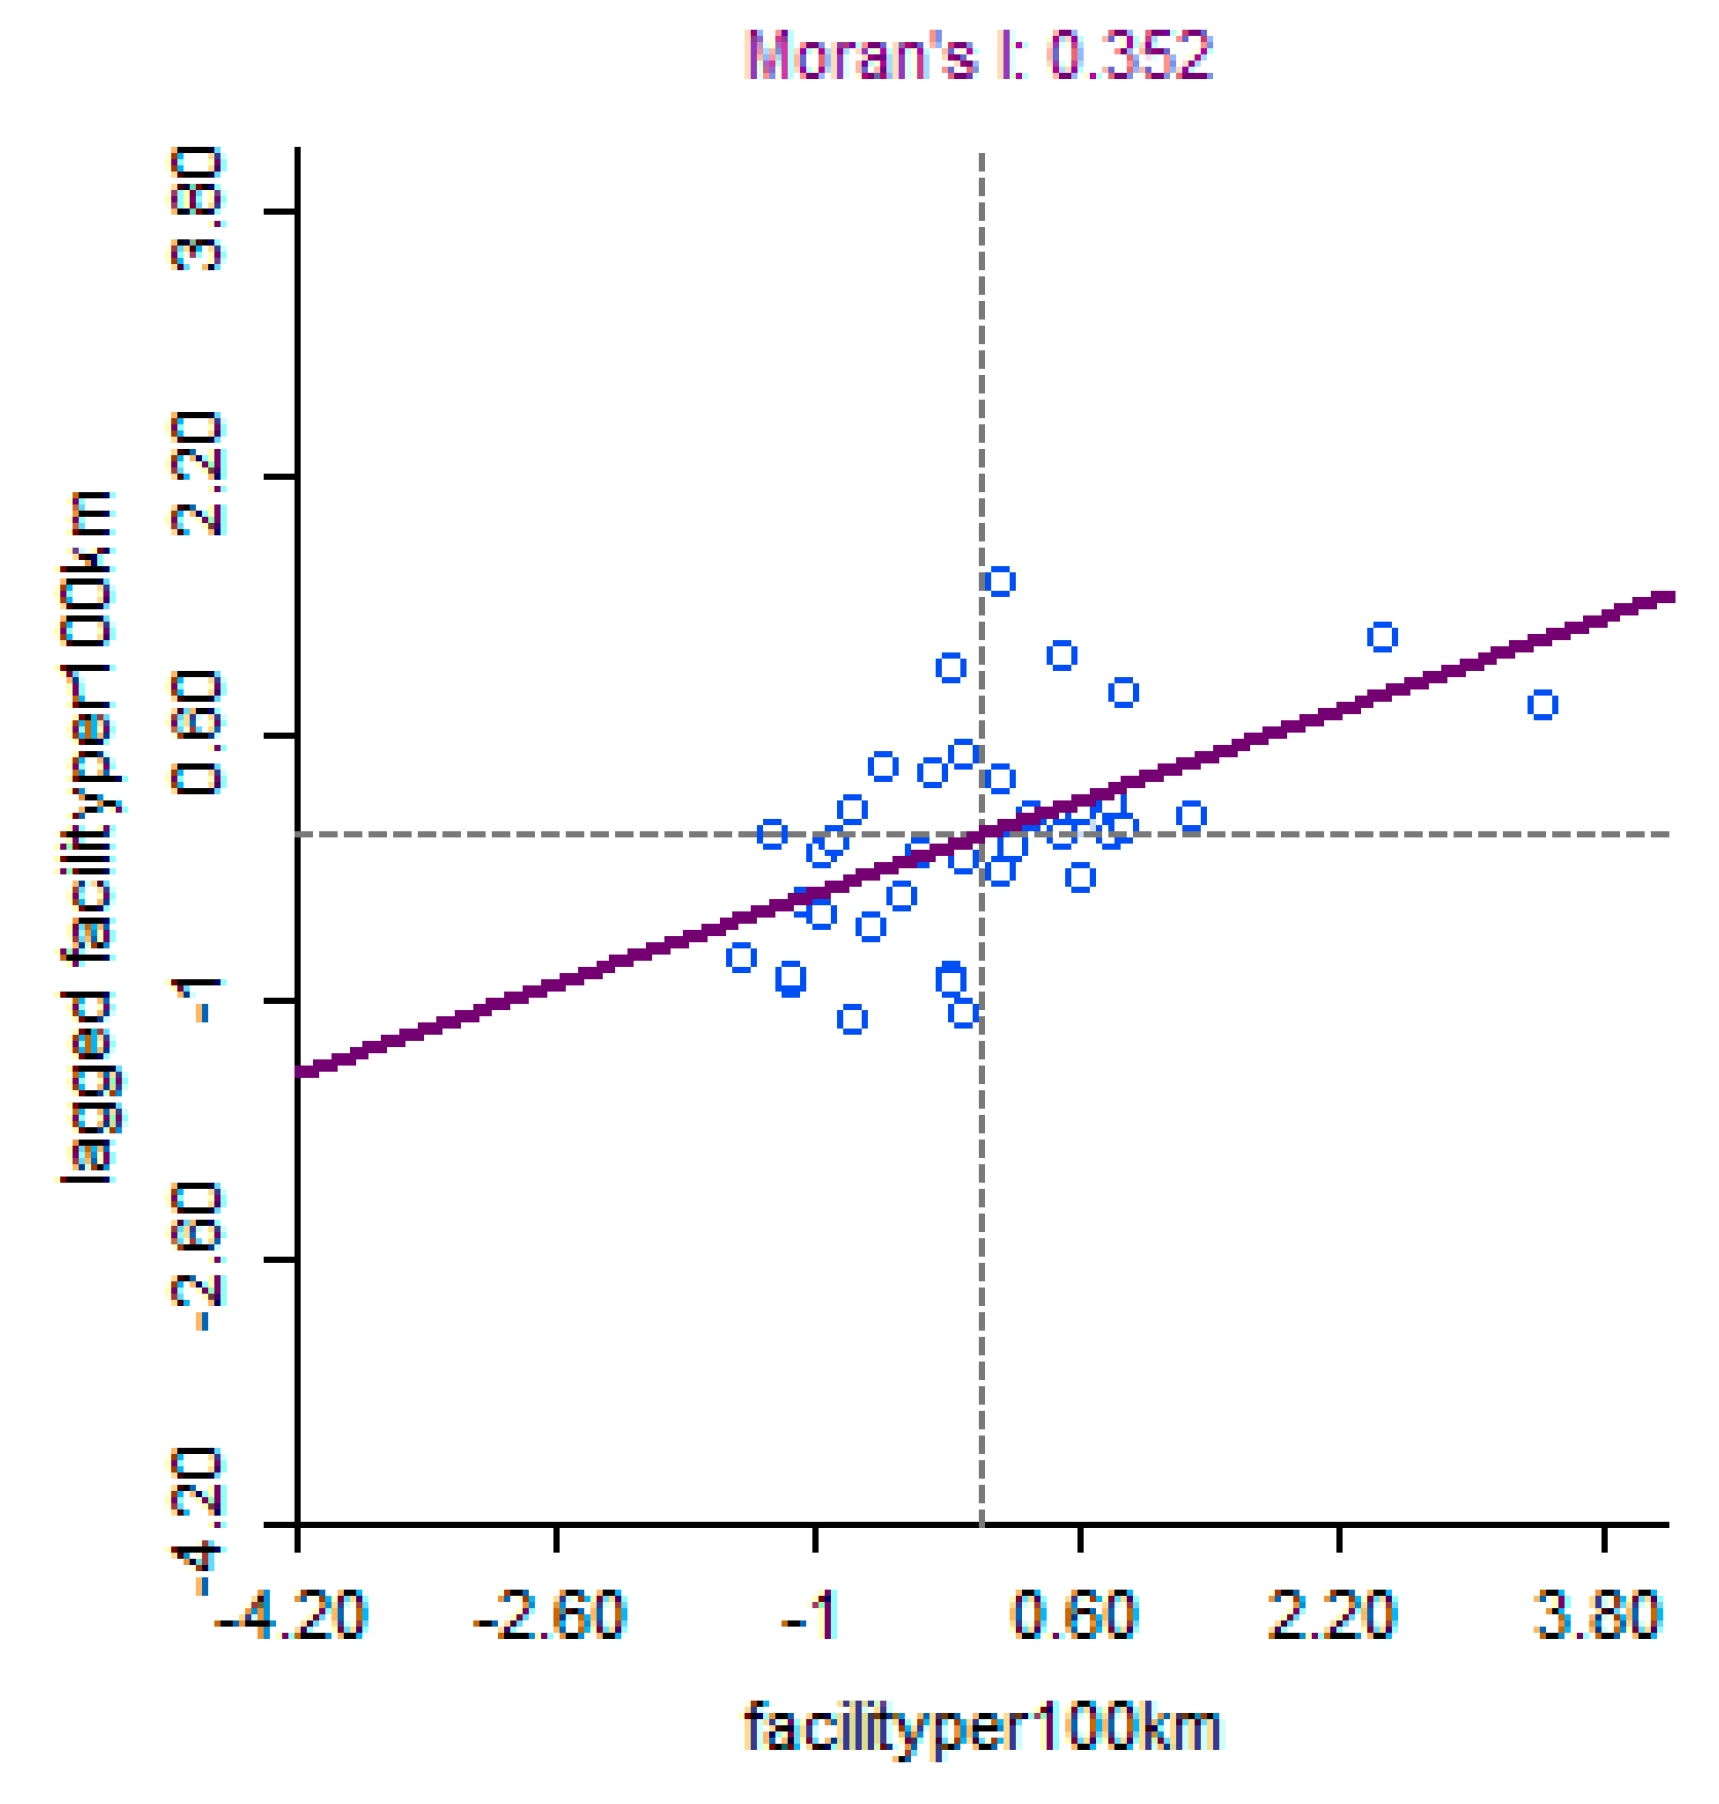
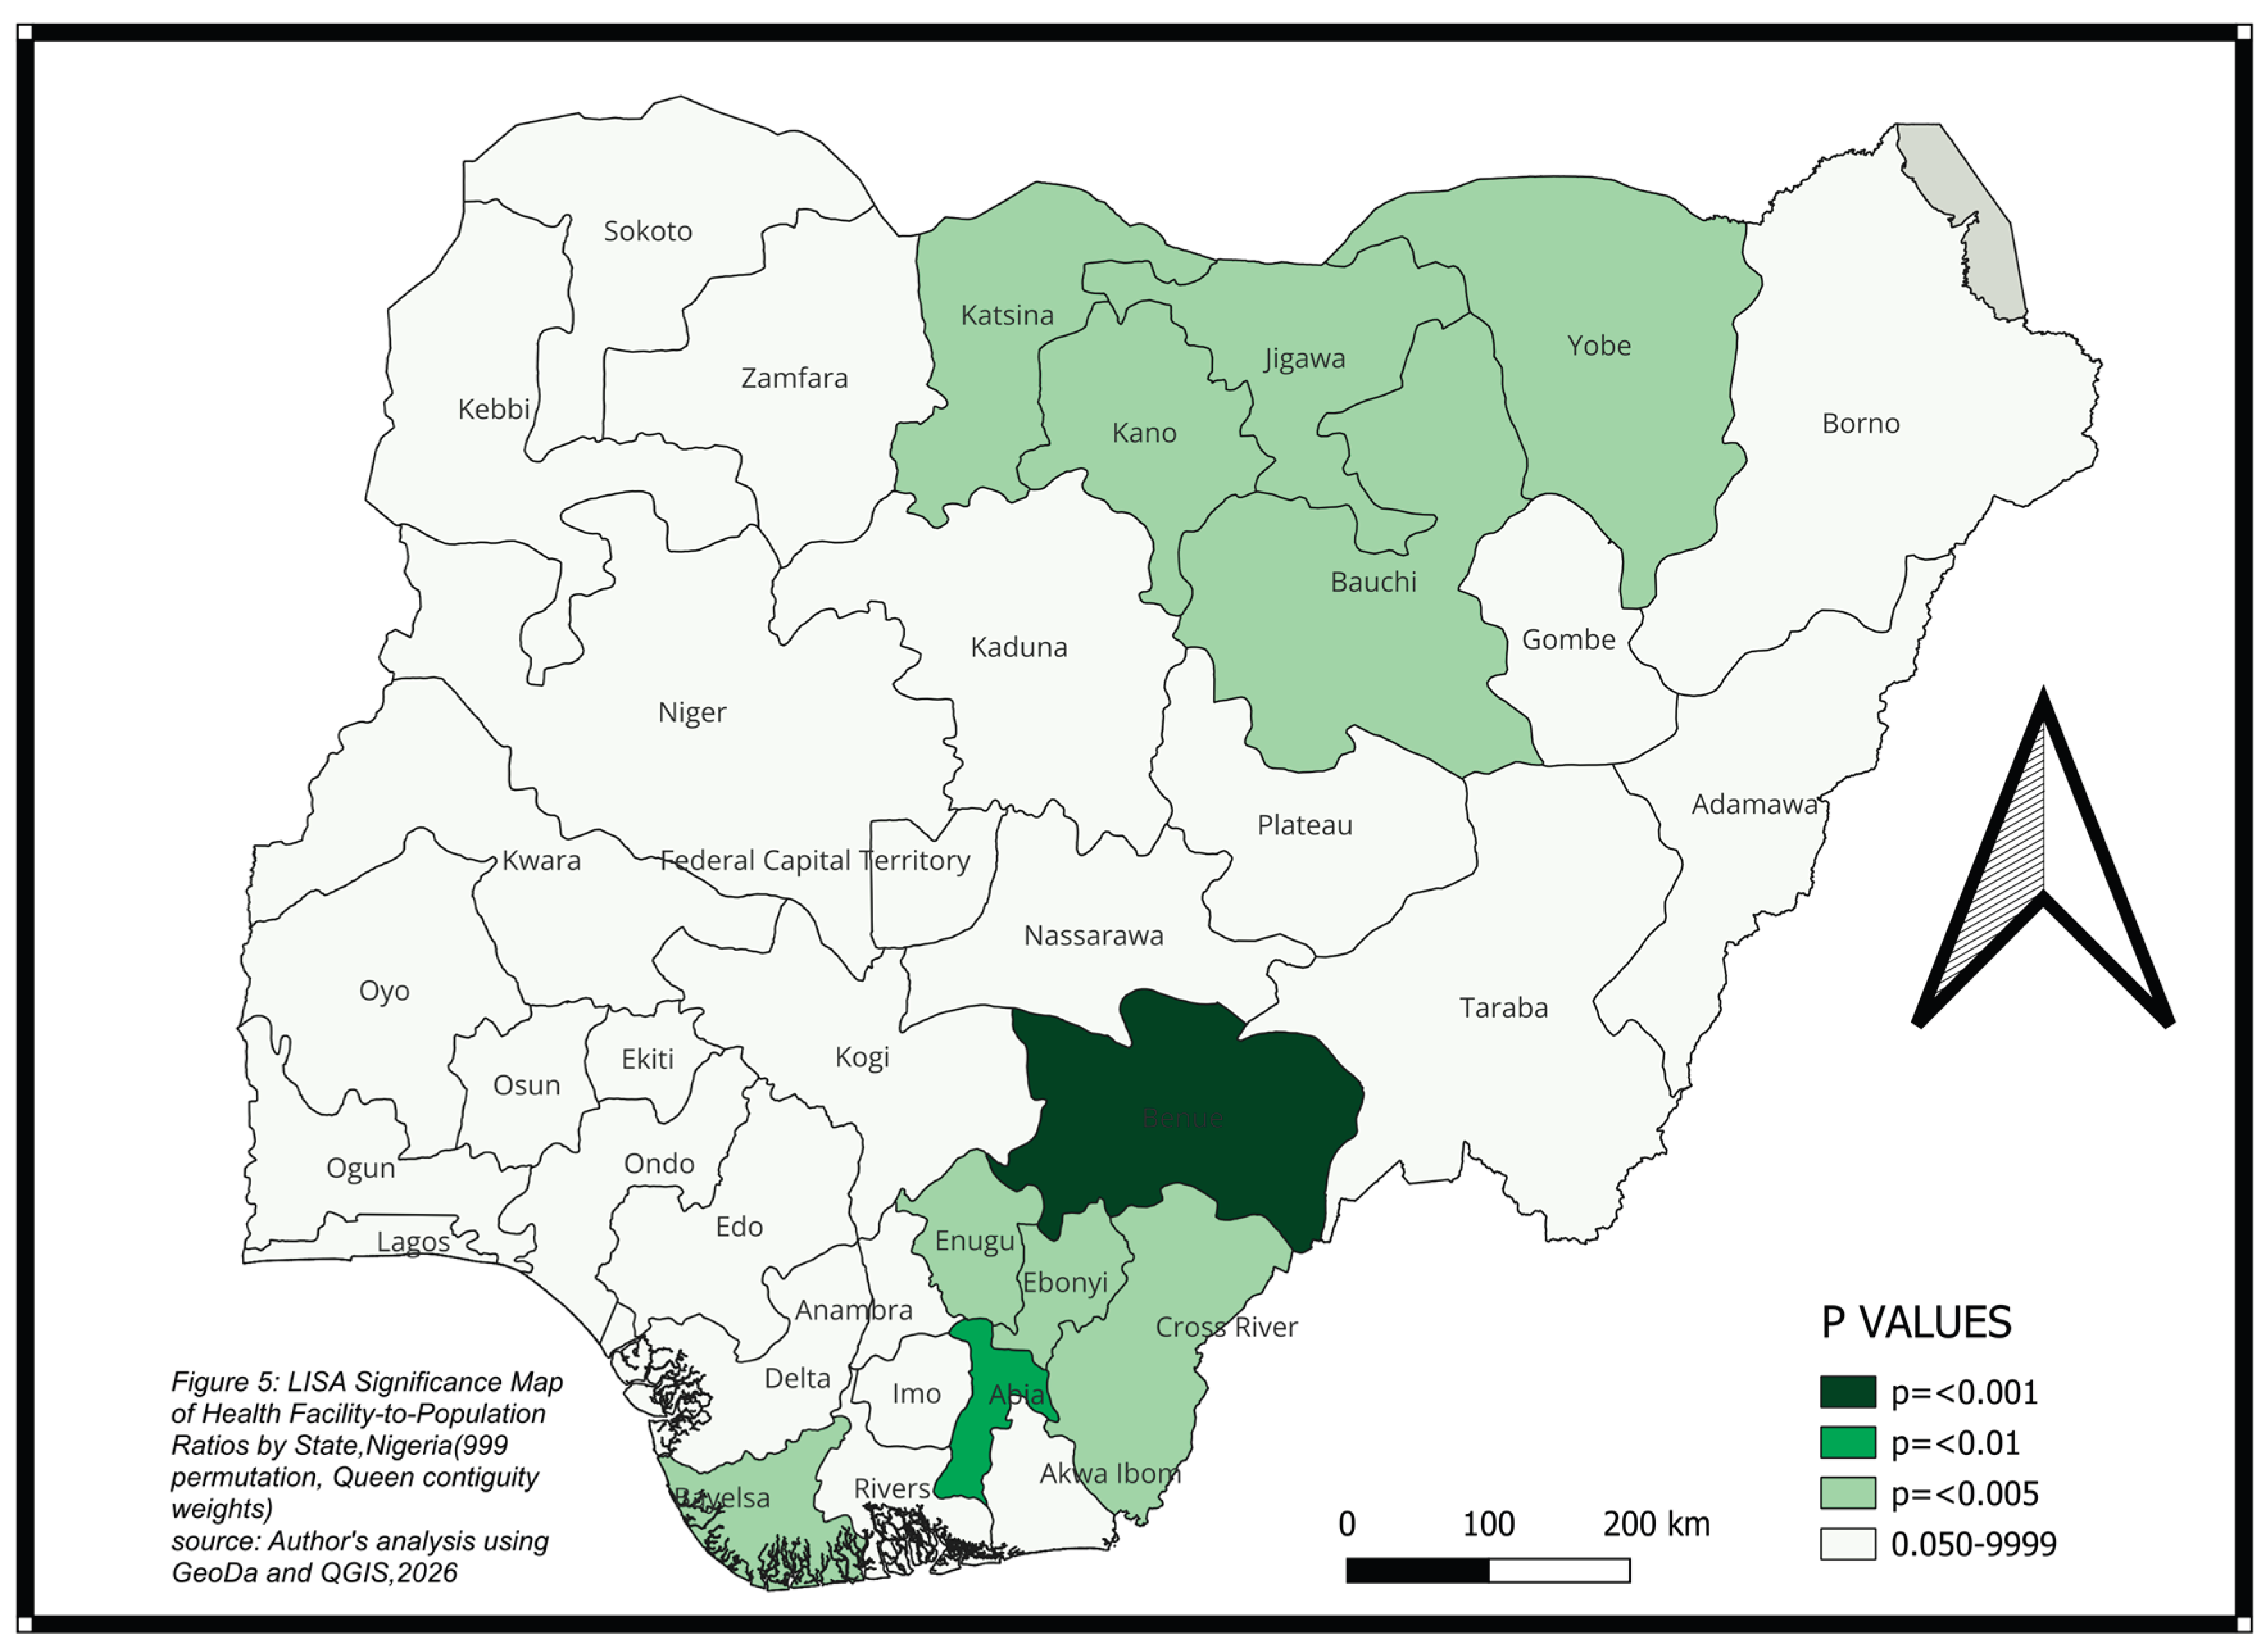
Global Moran’s I analysis of facility-to-population ratios yielded a statistically significant result: I = 0.352 (z = 3.63, p = 0.003). This positive value indicates moderate spatial clustering states with similar facility-to-population ratios tend to be geographically adjacent rather than randomly distributed. The statistical significance (p < 0.01) confirms this pattern is highly unlikely to have occurred by chance. The positive spatial autocorrelation suggests systematic geographic inequality rather than isolated pockets of under-service. Well served states cluster together in the south, while underserved states cluster in the north, creating regional disparities that transcend state boundaries.
The Global Moran’s I of 0.352 (p = 0.003) indicates moderate but statistically significant regional clustering of facility-to-population ratios among Nigerian states. This number is comparable to spatial autocorrelation indices reported in studies of health facility distribution in other African countries, where positive autocorrelation values ranging from 0.28 to 0.45 have been found at the sub-national level (Bihin et al., 2022; Florio et al., 2023). A Moran’s I of 0.352 suggests that geographic proximity is a significant predictor of a state’s healthcare provision level – well-served states are typically surrounded by well-served states, whereas underserved states are physically contiguous with other underserved states. This pattern indicates that health facility distribution follows broader socioeconomic and historical patterns of development in Nigeria.
Figure 7.
Global Moran’s I.
Local Spatial Clustering Analysis
The LISA findings show that healthcare accessibility in Nigeria is characterized by spatially contiguous areas of advantage and disadvantage rather than isolated state-level differences. States classified as High-High clusters are locations with relatively high healthcare facility availability, surrounding by neighboring states with similarly favorable healthcare supply. These places are healthcare hotspots, with residents generally having better geographic access to healthcare services.
Conversely, Low-Low clusters identify healthcare cold spots where states with low facility-to-population ratios are surrounded by equally underserved neighbours. The concentration of these clusters suggests that healthcare deprivation is regional in nature and reflects broader socio-economic and historical development patterns rather than isolated planning deficiencies. Such areas are likely to experience cumulative disadvantages including long travel distances, increased pressure on existing facilities, and poorer health outcomes.
The spatial concentration of Low-Low clusters underscores the need for regionally coordinated health infrastructure policies rather than state-specific interventions. Targeted investments in healthcare facilities, particularly secondary and tertiary institutions, should prioritize these clustered underserved regions to reduce geographic inequalities and improve progress toward Universal Health Coverage (UHC).
Figure 8.
LISA clustered Map.
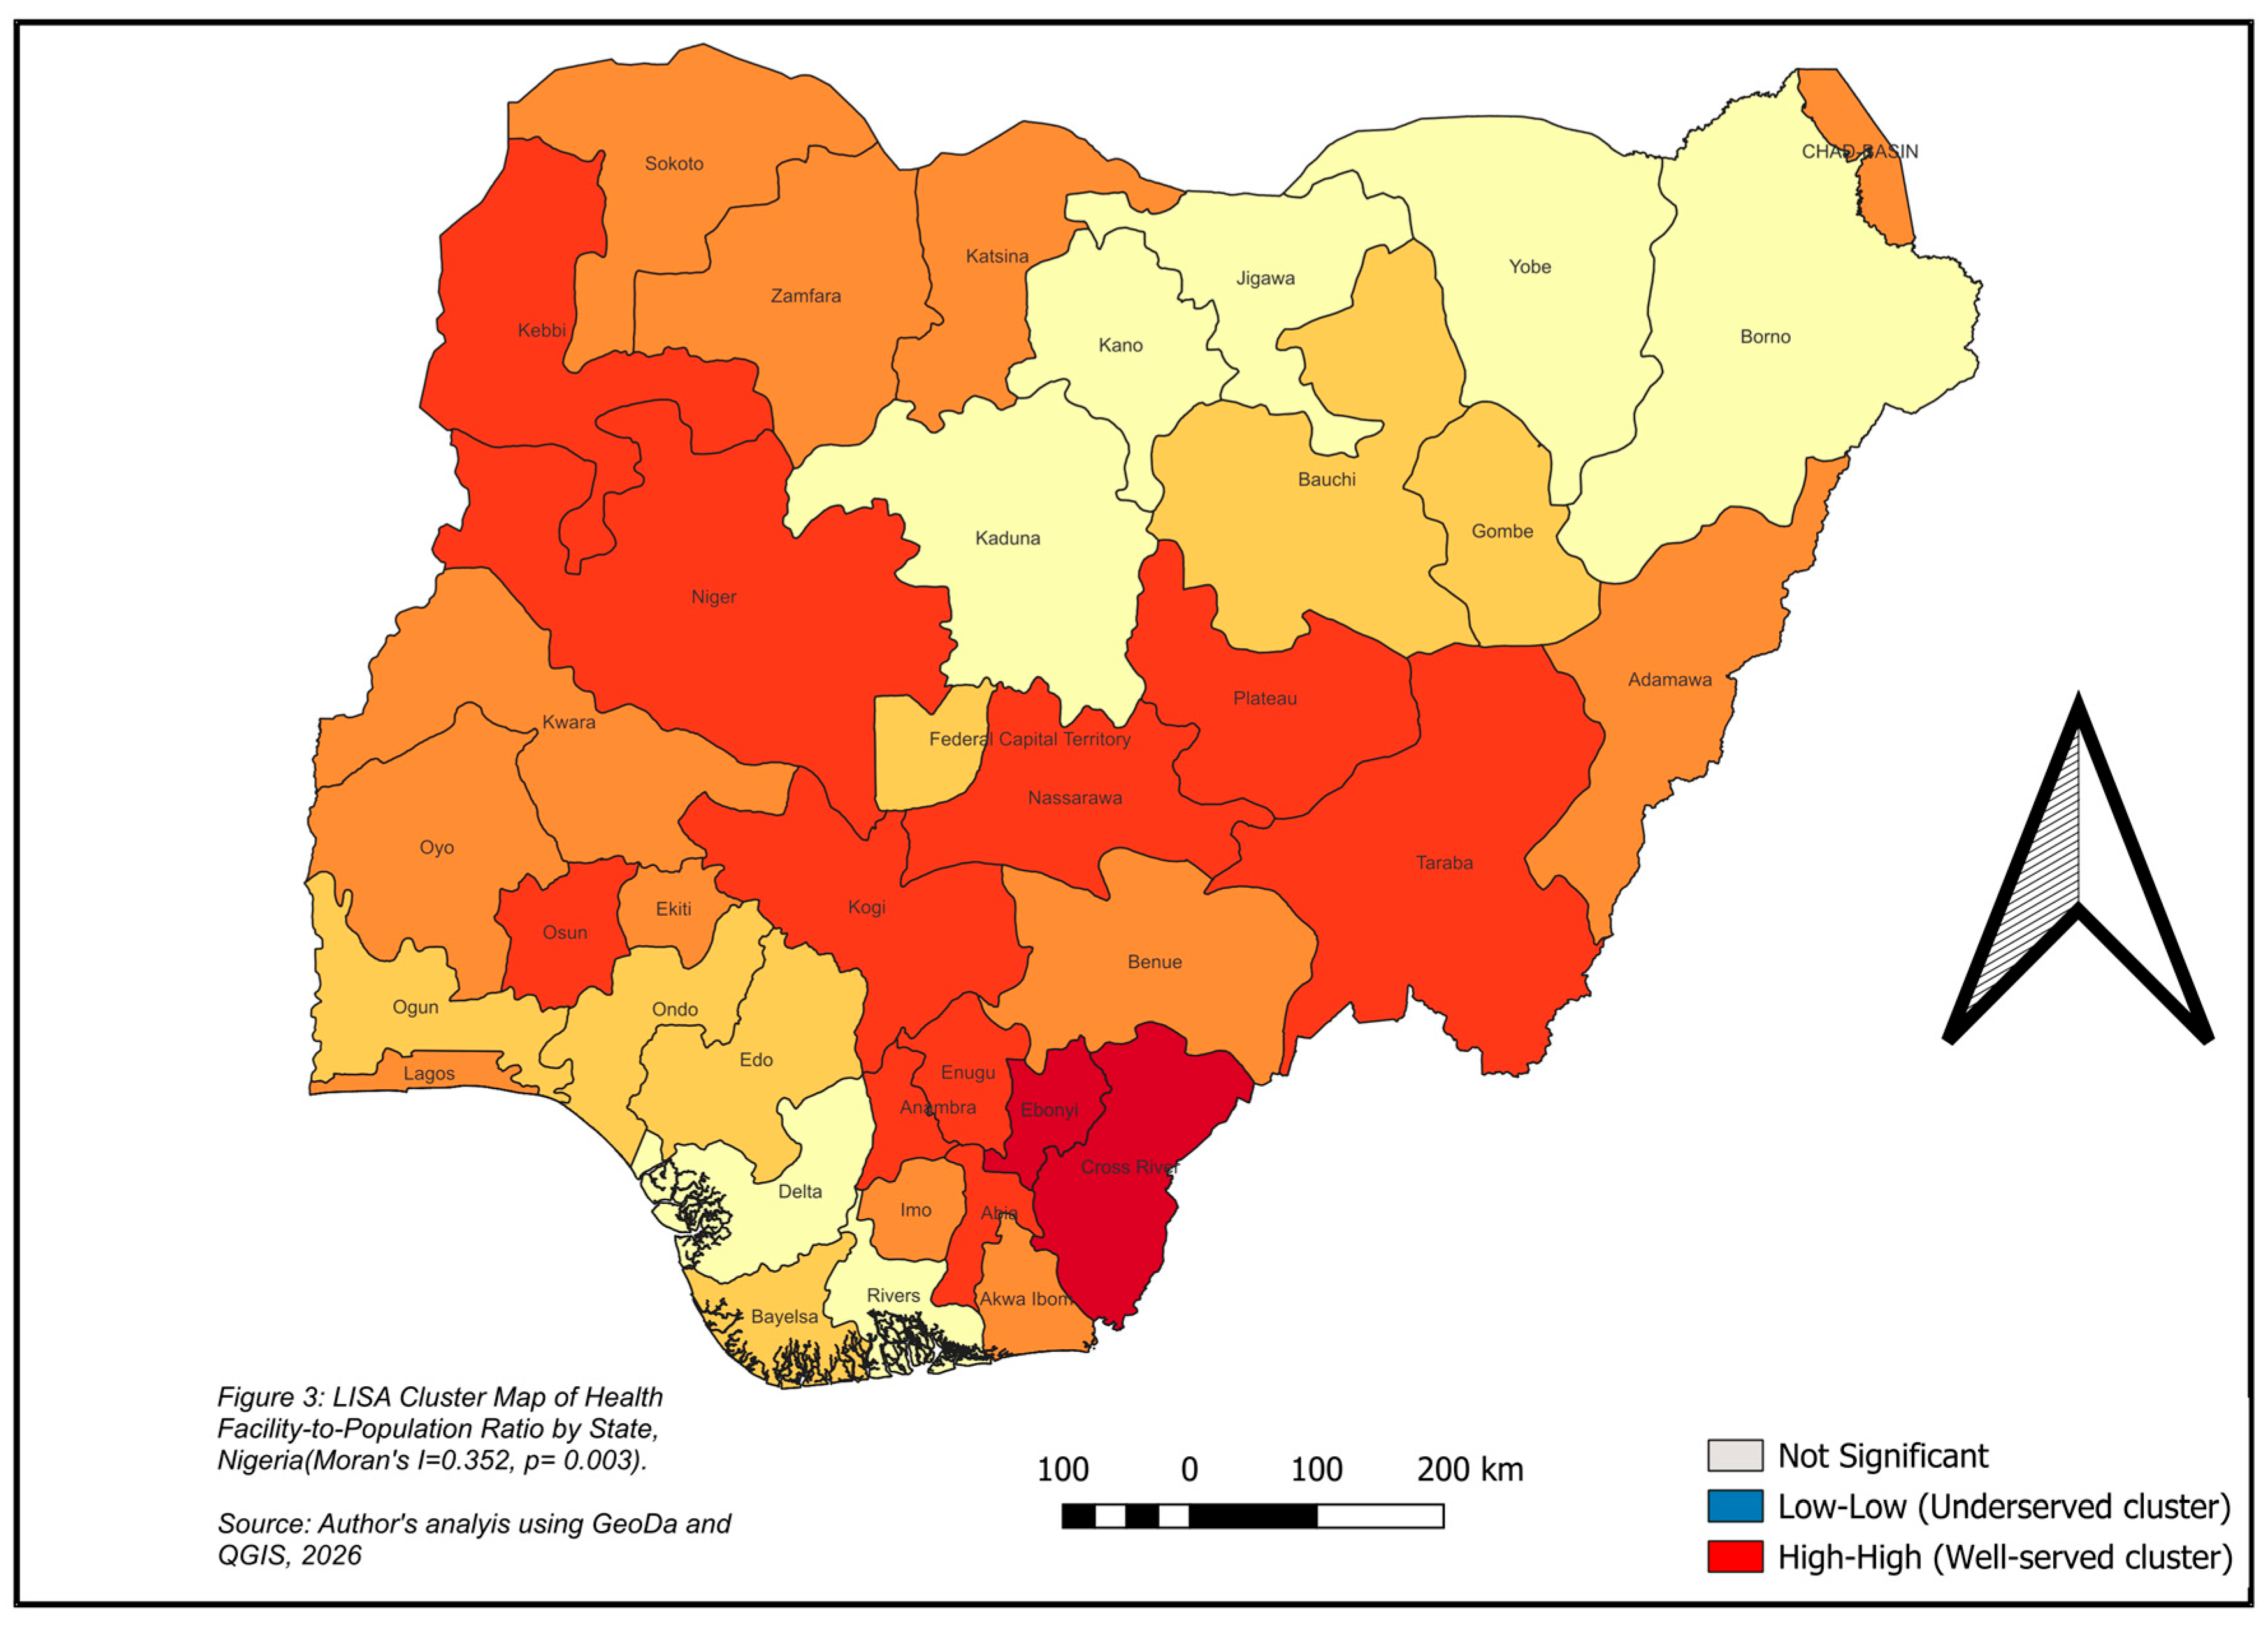
Figure 8.
LISA significant Map.
Summary, recommendation and conclusion.
The study provided a comprehensive national assessment of healthcare facilities geographical location, population to facilities ratio and accessibility. The result shows a significant proportion of the secondary health facilities are owned by private investors, which are mostly concentrated in urban areas, leaving people in rural communities with access only to basic care. The research will recommend an appraisal on location of healthcare facilities that is majorly within the urban areas while rural dwellers are impoverished of access to quality healthcare. Effort should also be geared towards establishing more secondary healthcare institution both in the urban and rural areas by the government or non-governmental organization for advance healthcare program for middle- and low-income earner within each state and local governments. More establishment of facilities to reduce travel time to facilities centers especially in locations with large land mass.
This study is limited to the spatial distribution and geographic accessibility of health facilities. Facility level, data on equipment, staffing, service quality, and operational status were not assessed. Future research should incorporate these dimensions to provide a more comprehensive evaluation of healthcare delivery capacity in Nigeria.
Source: Author, 2026
References
- Abah, V. O. Poor Healthcare Access in Nigeria: A Function of Fundamental Misconceptions and Misconstruction of the Health System. In Healthcare Access - New Threats, New Approaches; IntechOpen, 2023. [Google Scholar] [CrossRef]
- Akinwumi, A. I.; OlaOlorun, A. D.; Adesina, S. A.; Durodola, A. O.; Amole, I. O.; Singer, S. R.; Levine, H. Strong primary care services, an important feature of primary healthcare: What can Nigeria learn from Israel? Frontiers in Public Health 2022, 10. [Google Scholar] [CrossRef] [PubMed]
- Amoah-Nuamah, J.; Agyemang-Duah, W.; Prosper, G.; Borbor, N.; Ekeme, G.; Ninorb, G. P.; Ekeme, B. G. Analysis of Spatial Distribution of Healthcare Facilities and its Effects on Access to Primary Healthcare in Rural Communities in Kpandai District, Ghana. Cogent Public Health 2023, 10(1). [Google Scholar] [CrossRef]
- Ishaq, A. B.; Mukhtar, F.; Odekunle, M. O.; Waziri, A. M.; Ahmed, Y.; Abdulkarim, I. A. Spatial Distribution and Accessibility of Healthcare Facilities in Niger State, Nigeria. African Journal of Health, Safety and Environment 2024, 5(2), 26–35. [Google Scholar] [CrossRef]
- Jaro, I. M.; Ibrahim, A. A. The accessibility problems of primary healthcare to rural people in Jigawa State, Nigeria. Global Advanced Research Journal of Social Science (GARJSS) 2012, 1(4), 072–076. [Google Scholar]
- World Health Organization (WHO). Primary healthcare; 2023. [Google Scholar]
Disclaimer/Publisher’s Note: The statements, opinions and data contained in all publications are solely those of the individual author(s) and contributor(s) and not of MDPI and/or the editor(s). MDPI and/or the editor(s) disclaim responsibility for any injury to people or property resulting from any ideas, methods, instructions or products referred to in the content. |
© 2026 by the author. Licensee MDPI, Basel, Switzerland. This article is an open access article distributed under the terms and conditions of the Creative Commons Attribution (CC BY) license.
Copyright: This open access article is published under a Creative Commons CC BY 4.0 license, which permit the free download, distribution, and reuse, provided that the author and preprint are cited in any reuse.


