

Submitted:
22 June 2026
Posted:
24 June 2026
You are already at the latest version
Abstract
Background: The prognosis of glioblastoma (GBM) patients remains dismal due to chemoresistance and ineffective therapies. This study investigates the anti-tumor potential of combining minor phytocannabinoids, cannabinol (CBN) or cannabigerol (CBG), with melatonin (MLT). Methods: Cytotoxicity, synergy (Bliss model), and selectivity were evaluated in U87, T98, and U251 GBM lines and normal fibroblasts. Mechanisms of damage were characterized via Western blot (γ-H2AX), flow cytometry (DCFDA, JC-1, MitoBright , COX IV, BODIPY), and confocal analysis. Results: CBN-MLT and CBG-MLT regimens exerted potent, synergistic cytotoxicity while sparing healthy fibroblasts. The combinations induced necrotic cell death characterized by severe double-strand DNA damage. In T98 and U251 cells, this was driven by an early accumulation of intracellular ROS, which triggered mitochondrial depolarization, loss of organelle mass, and extensive lipid peroxidation. CBN combinations consistently achieved better results than CBG-based treatments. Conversely, U87 cells delayed this oxidative-mitochondrial cascade, despite a drop in late-stage cytotoxicity. Conclusions: This study provides a strong basis for combining minor cannabinoids and MLT to treat GBM. By a selective, p53-independent necrotic mechanism driven, these findings evidenced a potential novel therapeutic strategy against GBM.
Keywords:
cannabigerol
; cannabinol
; glioblastoma
; melatonin
; minor cannabinoids
; phytocannabinoid
; synergistic cytotoxicity
1. Introduction
Glioblastoma (GBM) remains the most aggressive, lethal, and histologically malignant primary brain tumor in adults, classified as an IDH-wildtype, CNS grade 4 astrocytoma by the World Health Organization. The current standard of care consisting of maximal safe surgical resection followed by radiotherapy and chemotherapy with temozolomide (TMZ) offers limited efficacy [1]. Despite the aggressive therapeutic regimen, the median survival time for GBM patients remains a dismal 12 to 15 months, with a 5-year survival rate of less than 10% [1]. Consequently, there is an urgent clinical need to identify novel, multi-targeted therapeutic strategies that can bypass resistance mechanisms and enhance the efficacy of standard treatments without compounding systemic toxicity.
In recent years, the repurposing of endogenous compounds and natural products has emerged as a promising frontier in neuro-oncology. Among these, the pineal hormone melatonin (MLT) and phytocannabinoids derived from Cannabis sativa, most notably Δ9-tetrahydrocannabinol (THC) and cannabidiol (CBD), have shown strong individual anti-cancer effects [2,3,4,5,6]. While major cannabinoids like THC and CBD have historically dominated oncology research, minor cannabinoids are becoming more interesting due to their unique molecular targets and lack of toxic side effects. Among phytocannabinoids, cannabigerol (CBG) and cannabinol (CBN) are emerging as potent, non-psychoactive agents capable of inhibiting tumor growth, inducing cancer cell death, and modulating the immune microenvironment, as evidenced in GBM and other cell cancer models [7,8]. Crucially, phytocannabinoids have demonstrated a distinct ability to enhance the effectiveness of conventional therapies and sensitize chemotherapeutic treatments, helping to overcome established resistance mechanisms [5].
In the context of GBM, MLT has been shown to inhibit GBM cell proliferation by inducing cell cycle arrest, and modulating key oncogenic pathways [9,10,11]. Furthermore, MLT acts as an antioxidant, protecting healthy neural tissue from therapy-induced toxicity while selectively promoting cell death mechanisms within GBM cells [2,3].
While both MLT and phytocannabinoids have demonstrated independent efficacy in slowing GBM progression, single-agent therapies often fall short due to the redundant, compensatory signaling pathways inherent to GBM. The rationale for combining MLT and phytocannabinoids is in their complementary, non-overlapping mechanisms of action and their shared capacity to cross the blood–brain barrier. Emerging clinical evidence, including a few case reports documenting the off-label co-administration of medical cannabis and high-dose MLT, suggests that the simultaneous administration of these compounds may produce a powerful cooperative effect [12,13,14]. Additionally, both agents have well-documented neuroprotective profiles in healthy tissues, offering the dual benefit of selectively attacking the tumor while shielding adjacent healthy cells from treatment-induced damage [15,16,17,18].
This study aims to investigate the in vitro efficacy of combining MLT with CBN or CBG in human GBM models. We evaluate the impact of this combinatorial approach on cell viability, cytotoxic synergy, and selectivity profiles using a panel of genetically different GBM cell lines and healthy human fibroblasts. Furthermore, we explore cell death and underlying damage pathways. By bypassing conventional apoptotic cascades, this experimental study represents a crucial step in defining a novel, p53-independent necrotic mechanism, providing robust biochemical validation for a promising multi-target therapeutic strategy against glioblastoma.
2. Results
2.1. Synergistic Cytotoxic Interactions of MLT-CBN and MLT-CBG Combinations in GBM Cell Lines
To establish the cytotoxicity of the single agents, U87, T98, and U251 GBM cell lines were treated with increasing concentrations of CBN (0–50 µM), CBG (0–50 µM), or MLT (0–1 mg/mL) for 72 hours (Figure 1). As shown in Figure 1A, single-agent CBN induced a significant dose-dependent reduction in cell viability across all three cell lines. While lower concentrations (up to 20 µM) showed minimal to moderate effects, a drop in viability was observed at higher doses, with 50 µM CBN decreasing cell survival below 20% in U87, T98, and U251 cells (p < 0.0001 vs. Control). A similar dose-response pattern was observed for CBG (Figure 1B). However, CBG demonstrated higher cytotoxic potency at intermediate concentrations compared to CBN. Regarding MLT treatment (Figure 1C), MLT exerted a less pronounced cytotoxic profile at lower doses, particularly in T98 cells, where viability remained close to 100% up to 0.6 mg/mL (equivalent to a high concentration of 2.6 mM). At higher concentrations, MLT induced a statistically significant, dose-dependent decrease in cell survival, confirming its intrinsic anti-tumor activity exclusively at these high, supra-physiological pharmacological doses. Taken together, these data provided the necessary concentration ranges to further investigate potential synergistic interactions and selectivity profiles in subsequent combination assays.
To explore potential therapeutic advantages, we next evaluated the combined effects of CBG or CBN with MLT on U87, T98, and U251 cells (Figure 2). Co-treatment with CBN and increasing doses of MLT induced a dose-dependent decrease in cell viability that significantly outperformed the single drug across all three cell lines (Figure 2A). To characterize the nature of these interactions, 2D synergy landscapes were generated using the Bliss independence model (Figure 2B). This analysis revealed strong synergistic cytotoxicity (Synergy Score > 0, red regions) at intermediate-to-high concentration clusters; notably, the CBN-MLT combination exhibited prominent synergy zones in U87 cells at 0.2–0.4 mg/mL MLT and in T98 cells at 0.6–0.7 mg/mL MLT. Similarly, the combination of CBG and MLT produced a significant reduction in glioblastoma cell survival (Figure 2C). The corresponding Bliss synergy maps (Figure 2D) confirmed a highly potent and extensive synergistic landscape for CBG-MLT, particularly in U87 and T98 lines, where strong positive synergy scores dominated the treatment grid (0.2–0.4 mg/mL and 0.5–0.7 mg/mL MLT, respectively). Conversely, antagonistic or purely additive effects (Synergy Score < 0, green/white regions) were strictly confined to the lowest concentration thresholds. Based on these maps, optimal combinations were selected for subsequent experiments (U87: MLT 0.3 mg/ml and CBN 25 µM; MLT 0.3 mg/m and CBG 15 µM. T98: MLT 0.7 mg/ml and CBN 25 µM; MLT 0.6 mg/ml and CBG 30 µM. U251: MLT 0.4 mg/ml and CBN 20 µM; MLT 0.5 mg/ml and CBG 35 µM).
To confirm whether these synergistic combinations could affect non-malignant cells, the treatments were evaluated on the human fibroblasts (NHF A12) cell line, and the corresponding Net Selectivity Indices (SI) were calculated (Figure 3). In NHF A12 cells, viability was expressed as relative cell viability (%) normalized to the respective MLT-alone baselines to isolate the net impact of the cannabinoids. As shown in Figure 3A, the addition of MLT did not induce any synergistic toxicity in healthy cells. On the contrary, co-treatment with MLT significantly rescued or maintained fibroblasts viability compared to the cannabinoid-alone control in CBN 20 µM (p < 0.001) and CBG 25 µM (p < 0.05) treated cells, while no statistical differences were observed across the CBG combinations. To quantify the specific anti-tumor action, the Net Selectivity Index (SI) was calculated for the most effective synergistic clusters identified in each GBM line (Figure 3B). Of note, all selected combinations yielded SI values above the non-selectivity threshold (SI > 1.0, dashed line). For CBN-MLT combinations, the highest selectivity was achieved in U251 cells (SI = 1.63) treated with 0.4 mg/mL MLT + 20 µM CBN. For CBG-MLT combinations, an even higher selectivity profile was observed in U87 cells, reaching a peak SI value of 2.03 (0.2 mg/mL MLT + 15 µM CBG). Taken together, these data demonstrate that the cytotoxic mechanism of these formulations is preferentially directed toward the GBM phenotype, maintaining a favorable safety profile on normal cell.
2.2. Combined Treatments Induce Necrotic Cell Death and DNA Damage
To evaluate cell death triggered by the synergistic cannabinoid-MLT combinations, we performed flow cytometric analysis using Annexin V and Propidium Iodide (PI) staining after 24 hours of exposure (Figure 4A,B, Figure S1). While Annexin V-staining was negative after 24 hours of exposure (data not shown), co-treatment with CBN and MLT induced a substantial shift in PI fluorescence intensity across all three GBM lines (Figure 4A). Quantification of the Mean Fluorescence Intensity (MFI, expressed as fold change relative to the untreated control) confirmed a statistically significant increase in PI uptake. In U87 cells, the combination (MLT 0.3 mg/mL + CBN 25 µM) led to an approximate 3-fold increase in MFI (p < 0.0001), significantly bettering both single-agent treatments. A similar synergistic trend was observed in T98 cells (MLT 0.7 mg/mL + CBN 20 µM) and U251 cells (MLT 0.4 mg/mL + CBN 20 µM), where the combined groups reached a 2-fold and 1.8-fold increase in MFI, respectively (p < 0.001). Paralleling these findings, the co-administration of CBG and MLT (Figure 4B) maximized PI internalization, leading to a drastic increase in MFI that reached approximately 3-fold in U87, 2-fold in T98, and 2.5-fold in U251 cells compared to their respective single-agent or control counterparts (p < 0.0001).
To further define the intracellular pathways involved, we evaluated key molecular markers via Western blot analysis (Figure 4C). We observed a considerable upregulation of phosphorylated H2AX (γ-H2AX) expression specifically in the groups treated with the CBN-MLT and CBG-MLT combinations. This accumulation of γ-H2AX demonstrates that the combined formulations induce severe, extensive double-strand DNA breaks, which correlate with the cytotoxicity observed. Taken together, the rapid loss of membrane integrity documented by PI influx, combined with severe DNA damage (γ-H2AX -increase), demonstrates that the cannabinoid-MLT combinations drive GBM cells toward a non-apoptotic, necrotic cell death pathway.
2.3. Evaluation of Oxidative Stress and Mitochondrial Homeostasis Disruption Under Single and Combined Treatments
To investigate the mechanisms underlying the observed effects, we evaluated the induction of intracellular oxidative stress by quantifying reactive oxygen species (ROS) production via DCFDA staining and flow cytometry. The three GBM cell lines were analyzed after treatment with MLT alone, cannabinoids alone, or their respective combinations, revealing a time- and dose-dependent response. Regarding the interaction between MLT and CBN (Figure 5A), the results highlighted differences among the lines. In U87 cells after 16 hours of exposure, single treatment with MLT (0.3 mg/ml) significantly decreased basal ROS levels compared to the control, confirming its well-known baseline antioxidant properties. However, this effect was completely reversed when MLT was combined with 25 µM CBN; the co-administration induced a robust and highly significant increase in ROS production, which was significantly higher than both the control and either single treatment. A similar pro-oxidant effect was observed in T98 cells at 6 hours and U251 cells at 12 hours. In T98 cells, while individual treatments with MLT (0.7 mg/ml) or CBN (20 µM) failed to alter ROS production, their combination led to a statistically significant elevation compared to the control. Similarly, in U251 cells, single treatments (MLT, 0.4 mg/ml, or CBN, 20 µM) showed only a slight upward trend, but the combined regimen triggered a significant accumulation of intracellular ROS, markedly exceeding the levels observed with single MLT treatment. An almost identical profile of oxidative stress activation emerged when evaluating the combination of MLT and CBG (Figure 5B). In U87 cells, single MLT (0.3 mg/ml) treatment again exerted a scavenger-like reduction in baseline ROS, but the co-administration with 15 µM CBG switched this response toward a potent pro-oxidant action, significantly driving up ROS levels compared to all other experimental groups. In T98 cells, the combination of MLT (0.6 mg/ml) and 25 µM CBG promoted a statistically significant upregulation of oxidative stress, clearly bettering both single compounds. Lastly, in the U251 line, the combination of MLT (0.5 mg/ml) and 35 µM CBG induced a significant shift in ROS levels relative to the control. Taken together, these findings demonstrate that despite the initial antioxidant behavior of MLT seen in specific settings like the U87 line, its combination with either CBN or CBG shifts the cellular environment toward a strong pro-oxidant state across all tested GBM cell lines, suggesting that these combinations trigger specific intracellular oxidative stress pathways.
To determine whether the observed pro-oxidant effects were associated with mitochondrial dysfunction, we evaluated changes in mitochondrial membrane potential (Δψm), and mitochondrial dynamics across the GBM cell lines after 24 hours of treatment. Mitochondrial membrane potential was assessed by calculating the FL2/FL1 fluorescence ratio of JC-1. When examining the combination of MLT and CBN (Figure 6A), a distinct line-dependent pattern of depolarization emerged. In U87 cells, single treatments with either MLT (0.3 mg/ml) or CBN (25 µM) led to an increase in the FL2/FL1 ratio compared to the control, whereas their combination significantly reduced this ratio, indicating an induction of mitochondrial stress with the co-administration. In T98 and U251 cells, single treatments did not induce depolarization; however, the combined administration of MLT and CBN triggered a highly significant collapse of Δψm in both lines (p < 0.001). In all experimental settings, the uncoupler CCCP was utilized as a positive control, confirming effective mitochondrial depolarization. A partially overlapping trend was observed when evaluating the combination of MLT and CBG (Figure 6B). While U87 cells remained resistant to depolarization under these specific conditions, T98 cells exposed to the combination showed a significant decrease in the JC-1 ratio compared to the single CBG treatment (p < 0.05). Notably, U251 cells exhibited a highly sensitive response to the MLT and CBG combination, resulting in a statistically significant reduction in Δψ relative to both the untreated control and the single agents (p < 0.001). To further characterize these mitochondrial alterations, we monitored changes in mitochondrial mass or dynamics using MitoBright staining (Figure 6C,D). In T98 cells, single treatments with MLT (0.7 mg/ml) caused a modest increase in MitoBright fluorescence, but CBN (20 µM) or the combination significantly suppressed this signal. A similar and more pronounced effect was observed in U251 cells, where the combined treatment led to a reduction in mitochondrial staining (p < 0.05), suggesting an acceleration of mitochondrial degradation or a severe impairment of mitochondrial biogenesis. In U87 cells, CBN (20 µM) was able to markedly decrease the MitoBright fluorescence; however, the combination did not improve the reduction. Moreover in U251 and T98 cells, the combination CBG and MLT strongly reduces the MitoBright signal more than single treatments (p < 0.001), whereas in U87 cells CBG did not induce significant mitochodnrial alterations in accordance with the JC-1 assay.
Finally, we investigated whether this mitochondrial impairment correlated with the expression of Cytochrome c Oxidase (Figure 6, Figure S2). Flow cytometric analysis of COX subunit IV (COX-IV) expression (Figure 6E) revealed a significant downregulation following the combined treatments with both CBN and CBG in T98 and U251 cells, confirming the previous results. To visually validate these findings, confocal microscopy was performed to confirm COX-IV expression and localization in T98 cells (Figure 6E), which qualitatively confirmed a distinct reorganization and reduction of the mitochondrial metabolic enzyme under combined treatment conditions. Taken together, U87 cells demonstrated a marked resistance to combination-induced mitochondrial dysfunction, showing no significant alterations in membrane potential, organelle mass, or COX-IV expression. Conversely, T98 and U251 lines proved highly susceptible to mitochondrial impairment, leading to severe bioenergetic collapse.
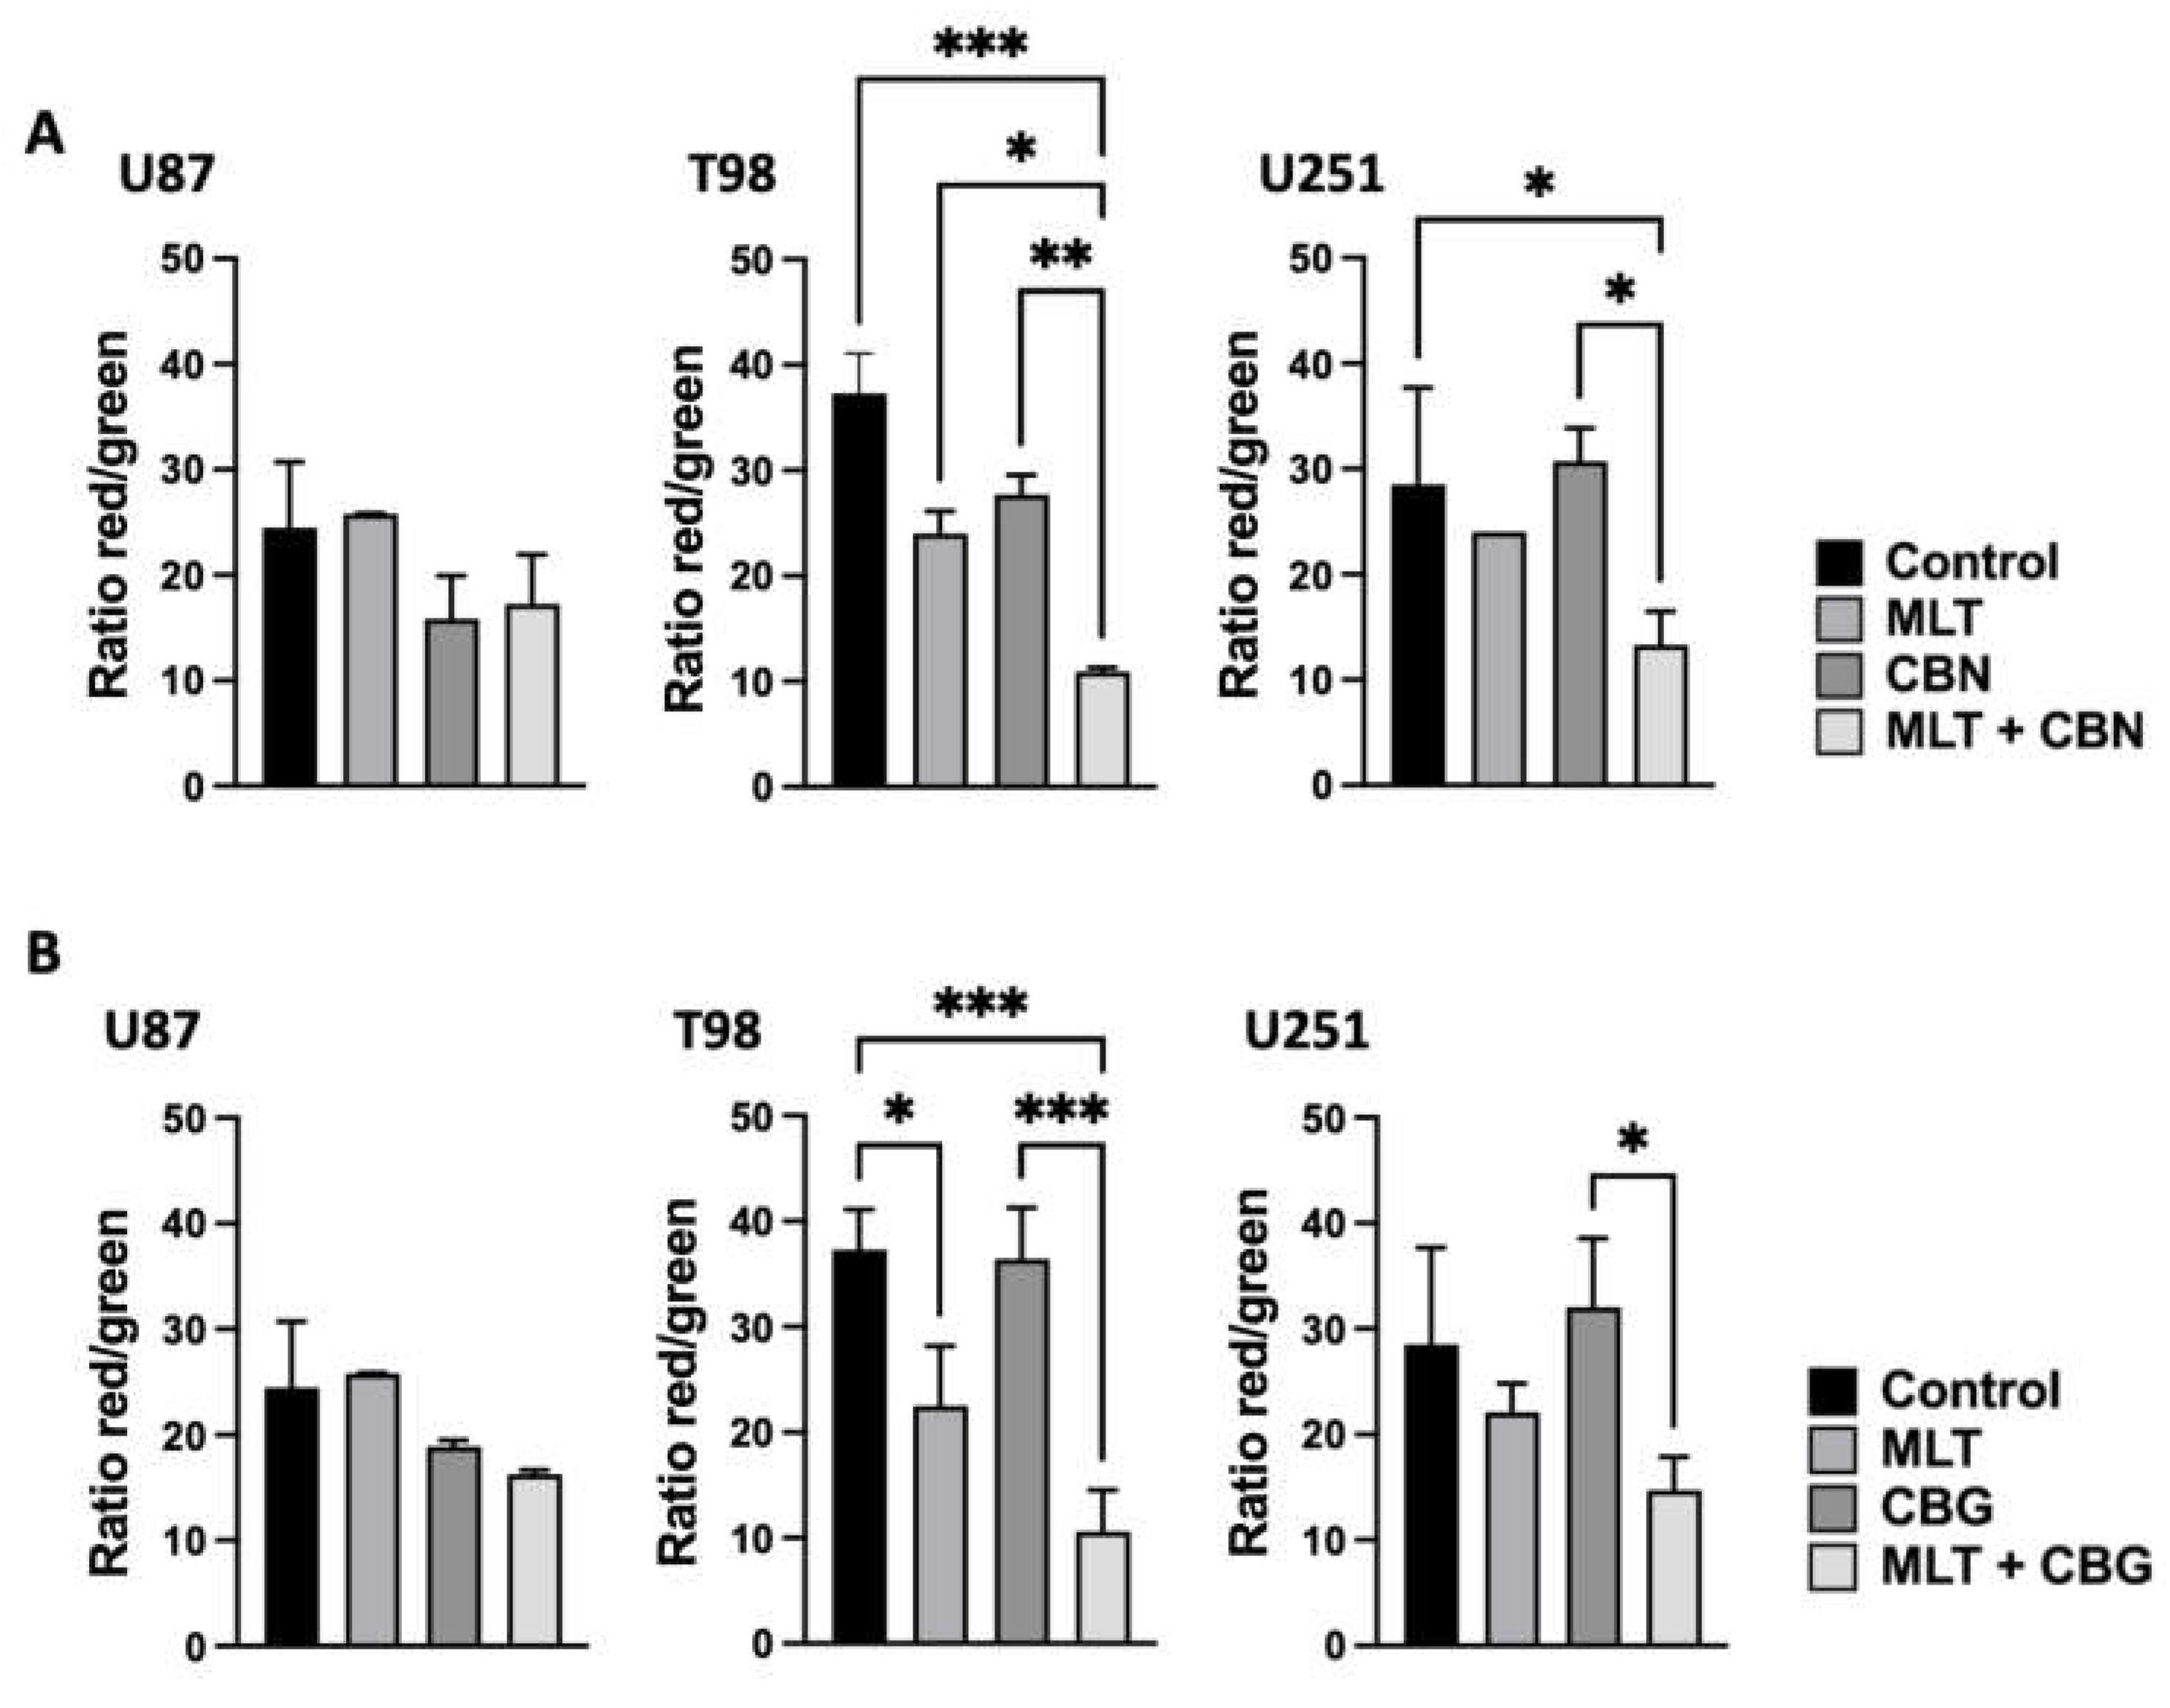
To evaluate whether the intracellular ROS accumulation led to structural membrane damage, we investigated lipid peroxidation levels across the three GBM cell lines after 24 hours of treatment using the fluorescent dye Bodipy (Figure 7). The analysis revealed a strong, line-dependent susceptibility to lipid peroxidation that closely mirrored the mitochondrial damage profile. Consistent with their general resistance, U87 cells did not display any significant alterations in the Bodipy red/green ratio under single or combined treatments with either CBN (25 µM) or CBG (15 µM). Conversely, both T98 and U251 cell lines were highly sensitive to treatment-induced lipid oxidation. When exposed to the combination of MLT (0.7 mg/ml) and CBN (20 µM), T98 cells exhibited a significant decrease in the red/green ratio compared to the untreated control (p < 0.001) and to the single CBN treatment. A similar significant drop was observed in U251 cells treated with the MLT (0.4 mg/ml) and CBN (20 µM) in combination compared to both the control and single cannabinoid exposure (p < 0.05). When evaluating the MLT-CBG combination, the co-administration with MLT triggered lipid peroxidation in T98 (p < 0.001) and U251 cells relative to their respective single cannabinoid treatments. In conclusion, while U87 cells remain protected against lipotoxic injury, the combination of MLT with cannabinoids causes loss of lipid membrane integrity in T98 and U251 lines.
3. Discussion
Despite decades of research, the clinical management of GBM remains one of the most challenges in oncology. Since the introduction of the Stupp regimen with TMZ, therapeutic progress has slowed down, and the prognosis for GBM patients remains dismal due to intrinsic drug resistance and tumor heterogeneity. In this context, exploring novel, multi-targeted therapeutic strategies are essential. The present study introduces a potential innovative approach by investigating the anti-tumor effects of the combination of MLT and minor phytocannabinoids. While major cannabinoids like Δ⁹-THC and CBD have been well investigated in neuro-oncology, scientific literature regarding minor cannabinoids in GBM remains scarce [19,20,21]. Nevertheless, preliminary clinical evidence, including sparse case reports documenting the off-label use of medical cannabis in combination with high-dose MLT, has hinted at an unexploited translational potential [13,22]. Our work provides the in vitro mechanistical validation supporting these clinical observations in GBM.
A key finding of our study is the ability of both MLT-CBN and MLT-CBG formulations to exert synergistic cytotoxicity across three genetically distinct GBM cell lines. Crucially, this cytotoxic efficacy bypassed the p53 status of the tumors, triggering a collapse in cell viability in both p53 wild-type (U87) and p53-mutated/deficient (T98 and U251) backgrounds. Given that p53 mutations commonly drive resistance to conventional alkylating agents like TMZ, the ability to induce cell death regardless of p53 status underscores the translational relevance of these combinations in overcoming standard chemoresistance [23]. It is worth underlining that this aggressive anti-tumor action did not translate into off-target toxicity. In NHF A12, MLT actively shielded healthy cells from cannabinoid-induced injury, resulting in a favorable Net Selectivity Indices (SI up to 2.03). In pharmacology, an in vitro SI benchmark between 1.1 and 2.0 is often considered moderate. However, within the context of GBM, where conventional alkylating agents like temozolomide impose severe, dose-limiting systemic toxicities, even a modest preferential target is highly significant. Because both phytocannabinoids and MLT are well-tolerated in vivo, this net selectivity validates a safe therapeutic window capable of targeting the tumor phenotype without inducing collateral damage to normal surrounding tissues, highlighting a favorable safety profile essential for future in vivo translation [24,25].
Mechanistically, our data demonstrate that these combinations do not rely on apoptotic pathway. While Annexin V-staining was negative after 24 hours of exposure, co-treatments induced a rapid, massive influx of PI. The significant upregulation of phosphorylated γ-H2AX demonstrated that the combined treatments induce extensive double-strand DNA damage. Taken together, the rapid loss of membrane integrity documented by PI influx, combined with severe DNA damage, demonstrates that the MLT-cannabinoid combinations drive GBM cells toward a non-apoptotic, necrotic cell death pathway.
In the context of GBM therapy, driving cells toward a p53-independent necrotic pathway represents a highly advantageous clinical trait. Mutations in the TP53 gene are among the most frequent alterations in GBM, driving aggressive tumor progression and conferring profound resistance to conventional pro-apoptotic chemotherapies, such as TMZ, which rely on functional p53 signaling to trigger cell death [23]. By bypassing the apoptotic cascades and triggering necrotic cell death irrespective of p53 mutations, the MLT-CBN and MLT-CBG combinations offer a powerful strategy to overcome intrinsic drug resistance. This allows the formulations to bypass the p53 status of the tumors, triggering a decrease in cell viability in both p53 wild-type (U87) and p53-mutated/deficient (T98 and U251) backgrounds, reinforcing their potential as promising multi-target candidates for future pre-clinical validation [23].
To dissect the upstream triggers of this necrotic death, we investigated the interplay between oxidative stress, mitochondrial homeostasis, and membrane integrity. Our results unraveled a line-dependent response. In the T98 and U251 cells, the co-administration of MLT with CBN or CBG induced an early, massive accumulation of ROS. This overwhelming oxidative burst directly targeted the mitochondria, prompting a highly significant collapse of the mitochondrial membrane potential (Δψm), and a depletion of mitochondrial mass. These events culminated in extensive lipotoxicity, as documented by a severe drop in the Bodipy PE-A/FITC-A ratio, indicating widespread lipid peroxidation of structural membranes. Within these responsive cells, CBN-containing regimens consistently overtaken CBG-based treatments, identifying CBN as a significantly more potent driver of mitochondrial structural and functional dismantling.
In contrast, the U87 cell line established a resistance profile. While the combinations successfully triggered cytotoxicity and necrotic death in U87 cells, these cells remained entirely protected against mitochondrial depolarization, loss of mitochondrial mass, and lipid peroxidation at earlier time points. This intriguing divergence can be explained by the superior baseline antioxidant and scavenger capacity characterizing the U87 line [26]. Indeed, our baseline ROS assays revealed that single MLT treatment significantly reduced basal ROS levels strictly in U87 cells, confirming a robust endogenous antioxidant machinery capable of buffering early oxidative insults. Consequently, while T98 and U251 cells subject to an oxidative-mitochondrial-lipotoxic cascade, U87 cells successfully delay early mitochondrial injury, suggesting that the combinations eventually eliminate this cell line through distinct, alternative necrotic pathways or delayed alternative organelle stress.
In summary, this study provides a strong foundation for combining minor cannabinoids and MLT to treat GBM. These findings bridge the gap between empirical case reports and rigorous molecular oncology, offering a promising alternative to conventional GBM regimens.
4. Materials and Methods
Cell Lines
Human GBM cell lines U87, T98, and U251 (European Collection of Cell Cultures, Salisbury, UK) were maintained in Eagle’s Minimum Essential Medium (EMEM; S.I.A.L., Milan, Italy) enriched with 10% (v/v) heat-inactivated fetal bovine serum (FBS), penicillin (100 IU/mL), streptomycin (100 μg/mL), 2 mmol/L L-glutamine, 10% (v/v) nonessential amino acids, and 10% (v/v) sodium pyruvate. The non-tumoral primary human fibroblast cell line NHF A12 (ATCC, LGC Standards, Milan, Italy) was cultured in Dulbecco’s Modified Eagle’s Medium (DMEM, S.I.A.L.) supplemented with 10% (v/v) FBS, penicillin (100 IU/mL), and streptomycin (100 μg/mL). All cultures were incubated at 37 °C under humidified conditions with 5% CO₂.
Compounds
Melatonin (Cayman Chemical, Ellsworth, MI, USA) was prepared fresh by dissolving in 70% ethanol at 40 mg/mL. Pharmaceutical-grade CBG and CBN crystals were purchased from Cayman Chemical and solubilized in 70% ethanol at 50 mM. Aliquots were prepared and stored at−20°C; each aliquot was used at one time point.
Cell Viability Assay
GBM and NHF A12 cells (3 x 10⁴ cells/ml) were seeded in 96-well plates, in a final volume of 100 μL/well, and after one day of incubation, CBG, CBN, MLT alone or in combination were added. At least six replicates in each experiment were used for each treatment. After 72 h, cell viability was assessed by adding 0.8 mg/mL of 3-[4,5-dimethylthiazol-2-yl]- 2,5 diphenyl tetrazolium bromide (MTT) (Sigma-Aldrich, Milan, Italy) to the media. The absorbance of samples, solubilized in dimethyl sulfoxide (DMSO), compared to a control (medium only) was measured at 540 nm using the Spectra Max ID3 microplate reader (Molecular Devices, München, Germany).
ROS Production
Intracellular oxidative stress levels in GBM cells were evaluated using the fluorescent probe 20,70-dichlorofluorescein (DCFDA). Cells (5 x 10⁴ cells/ml) were treated with CBG, CBN, MLT alone or in combination for up to 72 h. Hydrogen peroxide 6 µL/mL was used as a positive control. At the end of each incubation period, cells were incubated with DCFDA at 37 °C for 20 min. Quantitative measurements were performed by flow cytometry using a BD Accuri C6 Plus system and related software (BD Biosciences, San Jose, CA, USA).
Mitochondrial Transmembrane Potential
The mitochondrial transmembrane potential (ΔΨm) was evaluated by 5,5′,6,6′- tetrachloro-1,1′,3,3′-tetraehylbenzimidazolylcarbocyanineiodide (JC1) staining. GBM cell lines (5 x 10⁴ cells/ml) were seeded into 24-well plates, treated with CBG, CBN, MLT alone or in combination or vehicle. Subsequently, cells were incubated with JC-1 (10 μg/mL). Carbonyl cyanide chlorophenylhydrazone protonophore (CCCP, 50 μM, Sigma-Aldrich), a mitochondrial uncoupler known to dissipate ΔΨm, was used as a positive control. Quantitative analysis was performed by flow cytometry using a BD Accuri C6 Plus system (BD Biosciences).
Determination of Lipid ROS
Intracellular lipid peroxidation and lipid reactive oxygen species (ROS) levels were quantified using the fluorescent probe BODIPY™ 581/591 C11 (Thermo Fisher Scientific, Waltham, MA, USA) according to the manufacturer’s instructions. Briefly, GBM cells were seeded in 24-well plates at a density of 5 x 10⁴ cells/ml and allowed to adhere. Following 24 h of treatment with MLT, CBN, or CBG alone, or in their respective combinations, the culture medium was removed. The cells were washed with phosphate-buffered saline (PBS) and incubated with 10 μM C11 BODIPY for 30 min at 37 °C in the dark. After incubation, cells were washed twice with PBS, harvested, and immediately analyzed using a BD Accuri C6 Plus flow cytometer equipped with its analysis software (BD Biosciences). To monitor the shifting fluorescence during lipid oxidation, C11 BODIPY was excited at 561 nm to measure the red fluorescence intensity (associated with the unoxidized dye, collected in the red channel) and at 488 nm to measure the green fluorescence intensity (associated with the oxidized dye, collected in the green channel). Lipid peroxidation was expressed as the relative shift in the red/green fluorescence ratio compared to the untreated control group.
Cell Death Assay
GBM cells (5 x 10⁴ cells/ml) were treated with CBG, CBN, MLT alone or in combination for up to 72 h. Then cells were incubated with 5 μL/well Annexin V-FITC and 2 µg/mL PI for 10 min at room temperature. After washing, fluorescence was analyzed by BD Accuri C6 Plus flow cytometer and its software (BD Biosciences).
Western Blot
Lysates from glioma cells were extracted using a lysis buffer containing a protease-inhibitor cocktail (EuroClone, Milan, Italy). Proteins were separated on 12% SDS/polyacrylamide gels using a Mini-PROTEAN Tetra Cell system (Bio-Rad, Milan, Italy). Protein transfer to a nitrocellulose membrane was performed using a Mini Trans-Blot Turbo RTA system (Bio-Rad). Non-specific binding sites were blocked with low-fat dry milk or BSA in PBS containing 0.1% Tween 20. Membranes were incubated with phospho-histone H2A.X (#9718, 1:1000; Cell Signaling Technology, Milan, Italy), and GAPDH (sc-47 724, 1:1000; Santa Cruz Biotechnology, Dallas, TX, USA) antibodies overnight at 4°C, followed by incubation with HRP-conjugated secondary antibodies (anti-rabbit Ab, 1:2000; anti-mouse, 1:2000; Cell Signaling Technology). Analysis was performed using LiteAblot PLUS or Turbo kits (EuroClone), ChemiDocTM XRS+ with Image LabTM Software version 6.1.0 (Bio-Rad). GAPDH was used as loading control.
Determination of Mitochondrial Mass
To determine mitochondrial mass by flow cytometry, the MitoBright LT-Green dye was used according to the manufacturer’s instructions. (Dojindo Molecular Technologies, MD, USA). Briefly, glioma cells seeded in 24-well plates at a density of 5 x 10⁴ cells/ml were treated with CBG, CBN, MLT alone or in combination for 24 h and then incubated with MitoBright LT-Green dye (1:1000) for 30 min at 37 °C in the dark. After washing, cells were analyzed by BD Accuri C6 Plus flow cytometer and its software.
The impairment of mitochondrial mass and integrity was also assessed by COX IV staining. Cells, treated as above described, were fixed in paraformaldehyde 4% and permeabilized with permeabilization solution (1% FBS, 0.1% saponin, 0.1%, sodium azide in PBS). The cells were incubated with mouse anti-human COX IV Antibody (Ab) (1:200, Cell Signaling Technology, MA, USA) followed by Alexa fluor 488-conjugated secondary Ab (1:2000, Cell Signaling). Cells were then analyzed by BD Accuri C6 Plus flow cytometer and its software.
Confocal Microscopy
T98 glioma cells (4x10⁴/ml) were plated on µ-Slide 8 Well (Cat.No: 80826, IBIDI, Gräfelfing, Germany) and treated with CBG, CBN, MLT alone or in combination for 24 h. After treatment, cells were fixed 10 min with 2% paraformaldehyde in 0.1% of Tween-20 in PBS followed by 10 minutes with 4% paraformaldehyde in 0.1% of Tween-20. Then cells were incubated with 5% of BSA and 0.1% of Tween-20 in PBS for 1 hour at room temperature. After, cells were labeled with mouse anti-human COX IV Ab (1:200, Cell Signaling Technologies) over-night at 4°C followed by Alexa fluor 488 -conjugated secondary Ab (1:2000, Cell Signaling Technologies) for 1 h at 37°C. Nuclei were stained with DAPI. Slides were analyzed with C2 Plus confocal microscope (Nikon Instruments). Magnification=100×.
Statistical Analysis
GraphPad Prism 9.0.0(121) software (GraphPad Software, San Diego, CA, USA) was used for statistical analysis. The results represent the mean ± Standard Deviation (SD) of three experiments. One-way or two-way analysis of variance (ANOVA) was performed followed by Tukey’s multiple comparison test, Dunnett’s comparisons, or Šidák's comparisons. *p < 0.05, **p < 0.01, ***p < 0.001, ****p < 0.0001. No statistically significant differences were found between untreated (control) with vehicle- treated cells.
5. Conclusions
This study evidences a synergistic interaction between minor phytocannabinoids, CBN or CBG, and MLT against GBM. These combined formulations offer a promising alternative to overcome the intrinsic chemoresistance that has long slowed down the clinical progress of standard GBM therapies since the introduction of TMZ. Crucially, the discovery that the MLT-CBN and MLT-CBG co-administration selectively trigger cytotoxicity in malignant cells, while maintaining a safe therapeutic window in healthy tissue counterparts, provides the first rigorous biochemical validation for clinical observations and case reports. Ultimately, this work shifts the GBM treatment from traditional, evasion-prone apoptotic targeting toward a novel, multi-target death, establishing a foundation for future preclinical testing and targeted translational interventions.
Supplementary Materials
The following supporting information can be downloaded at the website of this paper posted on Preprints.org, Figure S1: Flow cytometric analysis of cell death in glioblastoma cell lines following single and combined treatments.
Author Contributions
Conceptualization, M.N., M.L. and M.B.M.; methodology, M.B.M. and C.A.; software, M.B.M. and G.C.; validation, M.N., M.L. and A.C.; formal analysis, M.B.M. and G.C.; investigation, M.B.M., C.A. and G.C.; resources, M.N., C.A. and M.B.M.; data curation, M.B.M., C.A. and G.C.; writing—original draft preparation, M.N., C.A. and M.B.M.; writing—review and editing, M.G. and L.Z.; visualization, M.B.M.; supervision, M.N. and C.A.; project administration, M.N. and M.B.M.; funding acquisition, M.N., C.A. and M.B.M. All authors have read and agreed to the published version of the manuscript.
Funding
This research was funded by MUR, Next Generation EU – PRIN 2022, grant number 2022488T5S, 2020Z73J5A_005, PRIN2022, and 20223ABZ82; Prin PNRR 2022, grant number P2022X5ESC_002.
Institutional Review Board Statement
Not applicable.
Informed Consent Statement
Not applicable.
Data Availability Statement
The original contributions presented in this study are included in the article/supplementary material. Further inquiries can be directed to the corresponding authors.
Acknowledgments
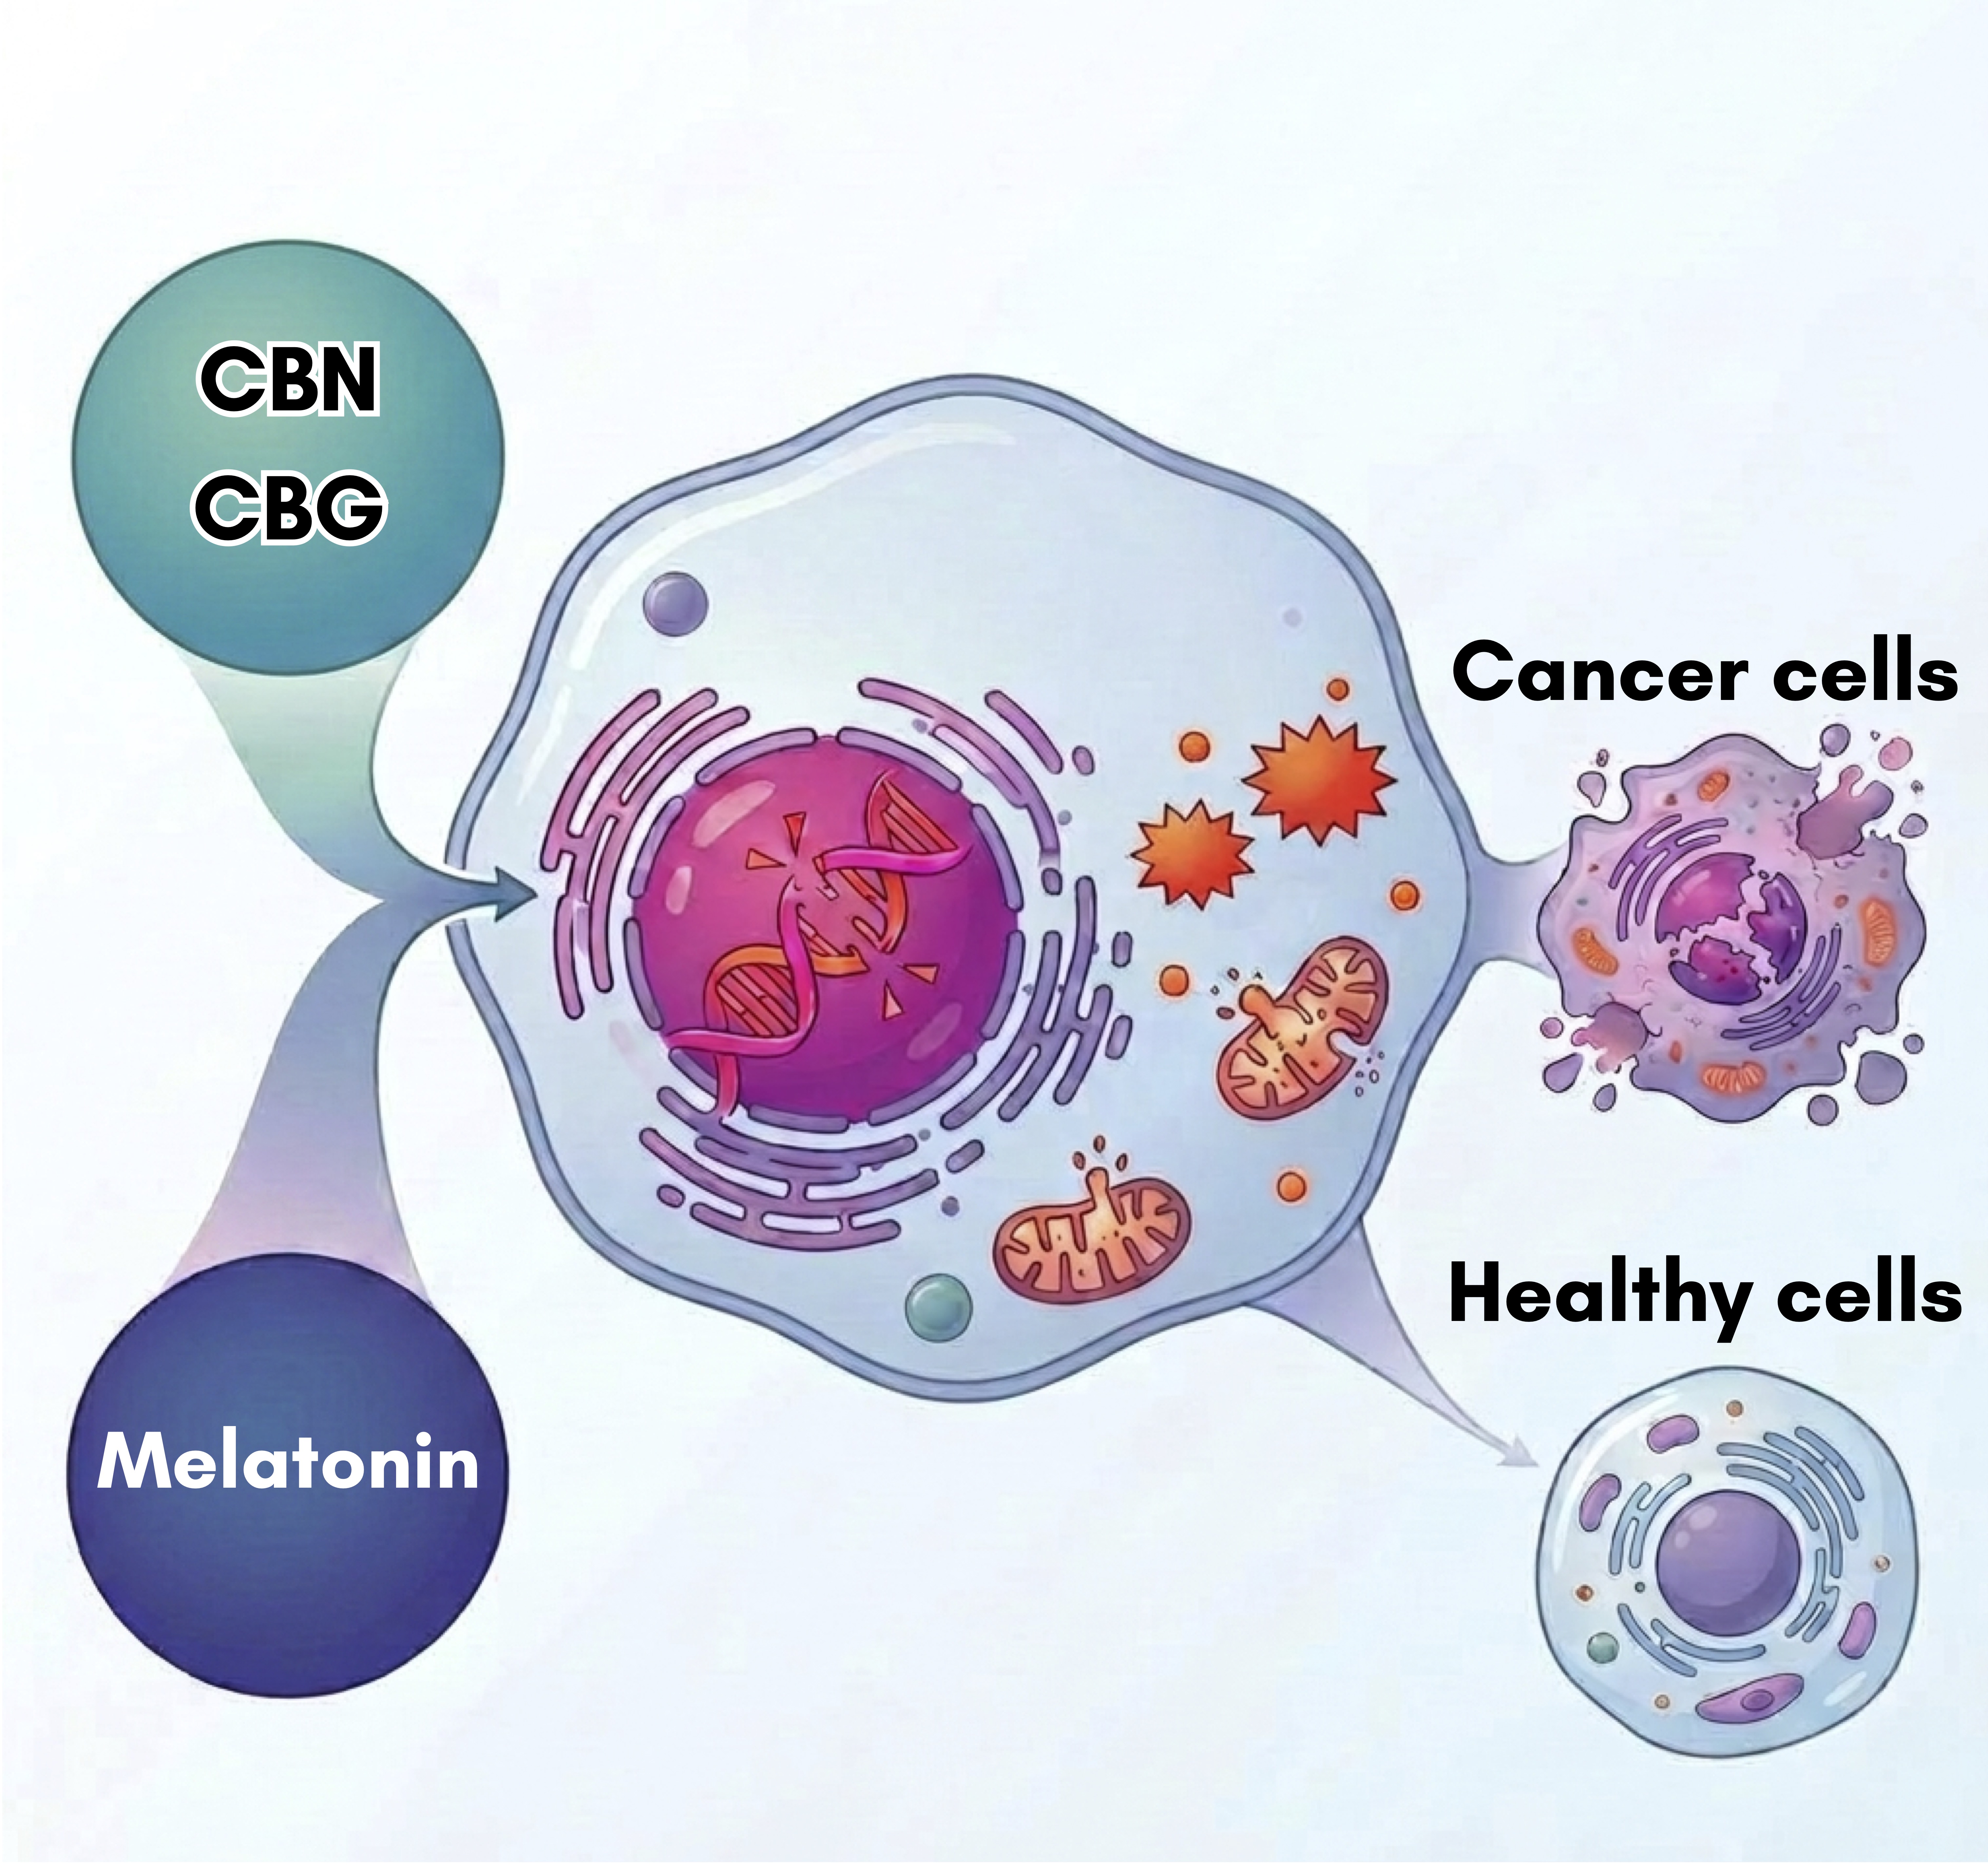
GenAI has been used for Graphical Abstract generation (Notebook).
Conflicts of Interest
The authors declare no conflicts of interest.
Abbreviations
The following abbreviations are used in this manuscript:
| GBM | Glioblastoma |
| TMZ | Temozolomide |
| MLT | Melatonin |
| THC | Tetrahydrocannabinol |
| CBD | Cannabidiol |
| CBN | Cannabinol |
| CBG | Cannabigerol |
| NHF A12 | Normal human fibroblast A12 |
| PI | Propidium Iodide |
| SI | Selectively Index |
| MFI | Mean Fluorescence Intensity |
| γ-H2AX | phosphorylated γ-H2AX |
| SD | Standard Deviation |
| ROS | Reactive oxygen species |
| DCFDA | 20,70-dichlorofluorescein |
| Δψm | mitochondrial membrane potential |
| JC1 | 5,5′,6,6′- tetrachloro-1,1′,3,3′-tetraehylbenzimidazolylcarbocyanineiodide |
| COX-IV | COX subunit IV |
| MTT | 3-[4,5-dimethylthiazol-2-yl]- 2,5 diphenyl tetrazolium bromide |
| DMSO | dimethyl sulfoxide |
| CCCP | Carbonyl cyanide chlorophenylhydrazone protonophore |
| PBS | phosphate-buffered saline |
References
- Kumari, S.; Misra, J.; Ravi, K.; Kumar, N.; Jha, N.K.; Gupta, R. Integrating Molecular Pathology, Tumor Microenvironment, and Novel Therapies to Overcome Resistance in Glioblastoma. J. Mol. Neurosci. 2026, 76(2), 99. [Google Scholar] [CrossRef] [PubMed]
- Favero, G.; Sulas, F.; Labanca, M.; Scilla, F.; Punzi, C.F.; Lonati, C.; Rezzani, R. Glioblastoma and Melatonin's Effects: A Narrative Review. Cancers 2026, 18(4), 703. [Google Scholar] [CrossRef] [PubMed] [PubMed Central]
- Moretti, E.; Favero, G.; Rodella, L.F.; Rezzani, R. Melatonin's Antineoplastic Potential Against Glioblastoma. Cells 2020, 9(3), 599. [Google Scholar] [CrossRef] [PubMed] [PubMed Central]
- Alomari, O.; Güney, B.; Juhmani, R.A.; Alrabadi, B.; Mokresh, M.E.; Odabas, H.; Alomari, T.; Reiter, R.J. Melatonin in glioblastoma therapy: clinical promise and mechanistic insights from bench to bedside. Neurosurg. Rev. 2026, 49(1), 165. [Google Scholar] [CrossRef] [PubMed]
- Javid, F.A.; Belancic, A.; Kwok, M.K.; Lam, Y.W. Recent Advances in the Therapeutic Potential of Cannabinoids Against Gliomas: A Systematic Review (2022-2025). Pharmacol. Res. Perspect. 2025, 13(4), e70160. [Google Scholar] [CrossRef] [PubMed] [PubMed Central]
- Rejili, M.; Farahani, N.; Alimohammadi, M.; Hushmandi, K. Cannabinoids and the autophagy-related signaling in brain tumors: from mechanistic insights to therapeutic frontiers in glioblastoma. Biochem Pharmacol. 2026, 250 Pt 1, 117781. [Google Scholar] [CrossRef] [PubMed]
- Lah, T.T.; Novak, M.; Pena Almidon, M.A.; Marinelli, O.; Žvar Baškovič, B.; Majc, B.; Mlinar, M.; Bošnjak, R.; Breznik, B.; Zomer, R.; Nabissi, M. Cannabigerol Is a Potential Therapeutic Agent in a Novel Combined Therapy for Glioblastoma. Cells 2021, 10(2), 340. [Google Scholar] [CrossRef] [PubMed] [PubMed Central]
- Giangrossi, M.; Salamone, S.; Camola, A.; Taglialatela-Scafati, O.; Chianese, G.; Gargiulo, E.; Nabissi, M.; Pollastro, F. Biomimetic synthesis of rare cannabigerol-type cannabinoids and evaluation of their cytotoxic effect on human glioblastoma cell lines. Fitoterapia 2025, 181, 106354. [Google Scholar] [CrossRef] [PubMed]
- Tang, H.; Dai, Q.; Zhao, Z.; Ge, W.; Li, D.; Chang, Z.; Pi, P.; Li, J.; Sun, Z. Melatonin Synergises the Chemotherapeutic Effect of Temozolomide in Glioblastoma by Suppressing NF-κB/COX-2 Signalling Pathways. J. Cell Mol. Med. 2025, 29(15), e70778. [Google Scholar] [CrossRef] [PubMed] [PubMed Central]
- Bostanci, A.; Doganlar, O. Melatonin Enhances Temozolomide-Induced Apoptosis In Glioblastoma and Neuroblastoma Cells. Exp. Oncol. 2024, 46(2), 87–100. [Google Scholar] [CrossRef] [PubMed]
- Anderson, G. The effects of melatonin on signaling pathways and molecules involved in glioma: Melatonin and glioblastoma: pathophysiology and treatment. Fundam. Clin. Pharmacol. 2020, 34(2), 189–191. [Google Scholar] [CrossRef] [PubMed]
- Zeppa, L.; Aguzzi, C.; Morelli, M.B.; Marinelli, O.; Amantini, C.; Giangrossi, M.; Santoni, G.; Fanelli, A.; Luongo, M.; Nabissi, M. In Vitro and In Vivo Effects of Melatonin-Containing Combinations in Human Pancreatic Ductal Adenocarcinoma. J. Pineal Res. 2024, 76(5), e12997. [Google Scholar] [CrossRef] [PubMed]
- Antonini, M.; Aguzzi, C.; Fanelli, A.; Frassineti, A.; Zeppa, L.; Morelli, M.B.; Pastore, G.; Nabissi, M.; Luongo, M. The Effects of a Combination of Medical Cannabis, Melatonin, and Oxygen-Ozone Therapy on Glioblastoma Multiforme: A Case Report. Reports (MDPI) 2023, 6(2), 22. [Google Scholar] [CrossRef] [PubMed] [PubMed Central]
- Saleska, J.L.; Bryant, C.; Kolobaric, A.; D'Adamo, C.R.; Colwell, C.S.; Loewy, D.; Chen, J.; Pauli, E.K. The Safety and Comparative Effectiveness of Non-Psychoactive Cannabinoid Formulations for the Improvement of Sleep: A Double-Blinded, Randomized Controlled Trial. J. Am. Nutr. Assoc. 2024, 43(1), 1–11. [Google Scholar] [CrossRef] [PubMed]
- Patricio-Martínez, A.; Hernández-Percastegui, S.; Tzompantzi Juarez, N.T.; Patricio, F.; Limón, I.D. Elucidating the putative role of cannabigerol: a hypothesis-generating review of neuroinflammatory and neuroprotective mechanisms with implications for drug-resistant epilepsy. Front Pharmacol. 2026, 17, 1755956. [Google Scholar] [CrossRef] [PubMed] [PubMed Central]
- Blebea, N.M.; Pușcașu, C.; Hancu, G.; Stăniguț, A.M.; Chiriță, C. Recent Preclinical Evidence on Phytocannabinoids in Neurodegenerative Disorders: A Focus on Parkinson's and Alzheimer's Disease. Pharmaceuticals 2025, 18(6), 890. [Google Scholar] [CrossRef] [PubMed] [PubMed Central]
- Feng, Y.; Si, Y.; Pang, X.; Feng, S.; Zhang, Y.; Xue, S.; Guo, T. Melatonin in Circadian Rhythm and Brain Health: Neuroprotective Effects and Therapeutic Potential. Aging Dis. 2026. [Google Scholar] [CrossRef] [PubMed]
- Drăgoi, C.M.; Dumitrescu, I.B.; Nicolae, A.C. Rhythms of life: melatonin, nutrition, sleep, and antioxidant strategies for healthy aging. Front Neurosci. 2026, 20, 1736978. [Google Scholar] [CrossRef] [PubMed] [PubMed Central]
- Nabissi, M.; Morelli, M.B.; Amantini, C.; Liberati, S.; Santoni, M.; Ricci-Vitiani, L.; Pallini, R.; Santoni, G. Cannabidiol stimulates Aml-1a-dependent glial differentiation and inhibits glioma stem-like cells proliferation by inducing autophagy in a TRPV2-dependent manner. Int. J. Cancer 2015, 137(8), 1855–69. [Google Scholar] [CrossRef] [PubMed]
- Nabissi, M.; Morelli, M.B.; Santoni, M.; Santoni, G. Triggering of the TRPV2 channel by cannabidiol sensitizes glioblastoma cells to cytotoxic chemotherapeutic agents. Carcinogenesis 2013, 34(1), 48–57. [Google Scholar] [CrossRef] [PubMed]
- Morelli, M.B.; Nabissi, M.; Amantini, C.; Farfariello, V.; Ricci-Vitiani, L.; di Martino, S.; Pallini, R.; Larocca, L.M.; Caprodossi, S.; Santoni, M.; De Maria, R.; Santoni, G. The transient receptor potential vanilloid-2 cation channel impairs glioblastoma stem-like cell proliferation and promotes differentiation. Int. J. Cancer 2012, 131(7), E1067-77. [Google Scholar] [CrossRef] [PubMed]
- Aguzzi, C.; Zuccoli, P.; Fanelli, A.; Mammone, A.; Nabissi, M.; Luongo, M. Integrative Use of Cannabidiol, Melatonin, and Oxygen-Ozone Therapy in Triple-Negative Breast Cancer with Lung and Mediastinal Metastases. A Case Report. Reports (MDPI) 2026, 9(1), 28. [Google Scholar] [CrossRef] [PubMed] [PubMed Central]
- Blough, M.D.; Beauchamp, D.C.; Westgate, M.R.; Kelly, J.J.; Cairncross, J.G. Effect of aberrant p53 function on temozolomide sensitivity of glioma cell lines and brain tumor initiating cells from glioblastoma. J. Neurooncol 2011, 102(1), 1–7. [Google Scholar] [CrossRef] [PubMed]
- Valiensi, S.M.; Vera, V.A.; Folgueira, A.L.; Caporale, S.; Ponce de León, M.; Pino Fernández, I.; Vigo, D.E.; Cardinali, D.P. Rethinking Melatonin Dosing: Safety and Efficacy at Higher-than-Usual Levels in Aged Patients with Sleep Disturbances and Comorbidities. Brain Sci. 2025, 15(10), 1040. [Google Scholar] [CrossRef] [PubMed] [PubMed Central]
- Bhaskar, A.; Bell, A.; Boivin, M.; Briques, W.; Brown, M.; Clarke, H.; Cyr, C.; Eisenberg, E.; de Oliveira Silva, R.F.; Frohlich, E.; Georgius, P.; Hogg, M.; Horsted, T.I.; MacCallum, C.A.; Müller-Vahl, K.R.; O'Connell, C.; Sealey, R.; Seibolt, M.; Sihota, A.; Smith, B.K.; Sulak, D.; Vigano, A.; Moulin, D.E. Consensus recommendations on dosing and administration of medical cannabis to treat chronic pain: results of a modified Delphi process. J. Cannabis Res. 2021, 3(1), 22. [Google Scholar] [CrossRef] [PubMed] [PubMed Central]
- Zhou, Y.; Zhou, Y.; Shingu, T.; Feng, L.; Chen, Z.; Ogasawara, M.; Keating, M.J.; Kondo, S.; Huang, P. Metabolic alterations in highly tumorigenic glioblastoma cells: preference for hypoxia and high dependency on glycolysis. J. Biol. Chem. 2011, 286(37), 32843–53. [Google Scholar] [CrossRef] [PubMed] [PubMed Central]
Figure 1.
Dose-dependent cytotoxic effects of MLT, CBG, and CBN on human GBM cell lines. Cell viability of U87 (A), T98 (B), and U251 (C) glioma cells was evaluated by MTT assay after 72 h of treatment with increasing concentrations of CBN (0–50 µM), CBG (0–50 µM), or MLT (0–1 mg/ml). The 100% viability baseline corresponds to the vehicle-treated control cells. Data are expressed as the mean ± Standard Deviation (SD) of three independent experiments. Statistical analysis was performed using One-way ANOVA followed by Dunnet's post-hoc test **p < 0.01, ***p < 0.001, and ****p < 0.0001 vs. Control (0).
Figure 1.
Dose-dependent cytotoxic effects of MLT, CBG, and CBN on human GBM cell lines. Cell viability of U87 (A), T98 (B), and U251 (C) glioma cells was evaluated by MTT assay after 72 h of treatment with increasing concentrations of CBN (0–50 µM), CBG (0–50 µM), or MLT (0–1 mg/ml). The 100% viability baseline corresponds to the vehicle-treated control cells. Data are expressed as the mean ± Standard Deviation (SD) of three independent experiments. Statistical analysis was performed using One-way ANOVA followed by Dunnet's post-hoc test **p < 0.01, ***p < 0.001, and ****p < 0.0001 vs. Control (0).
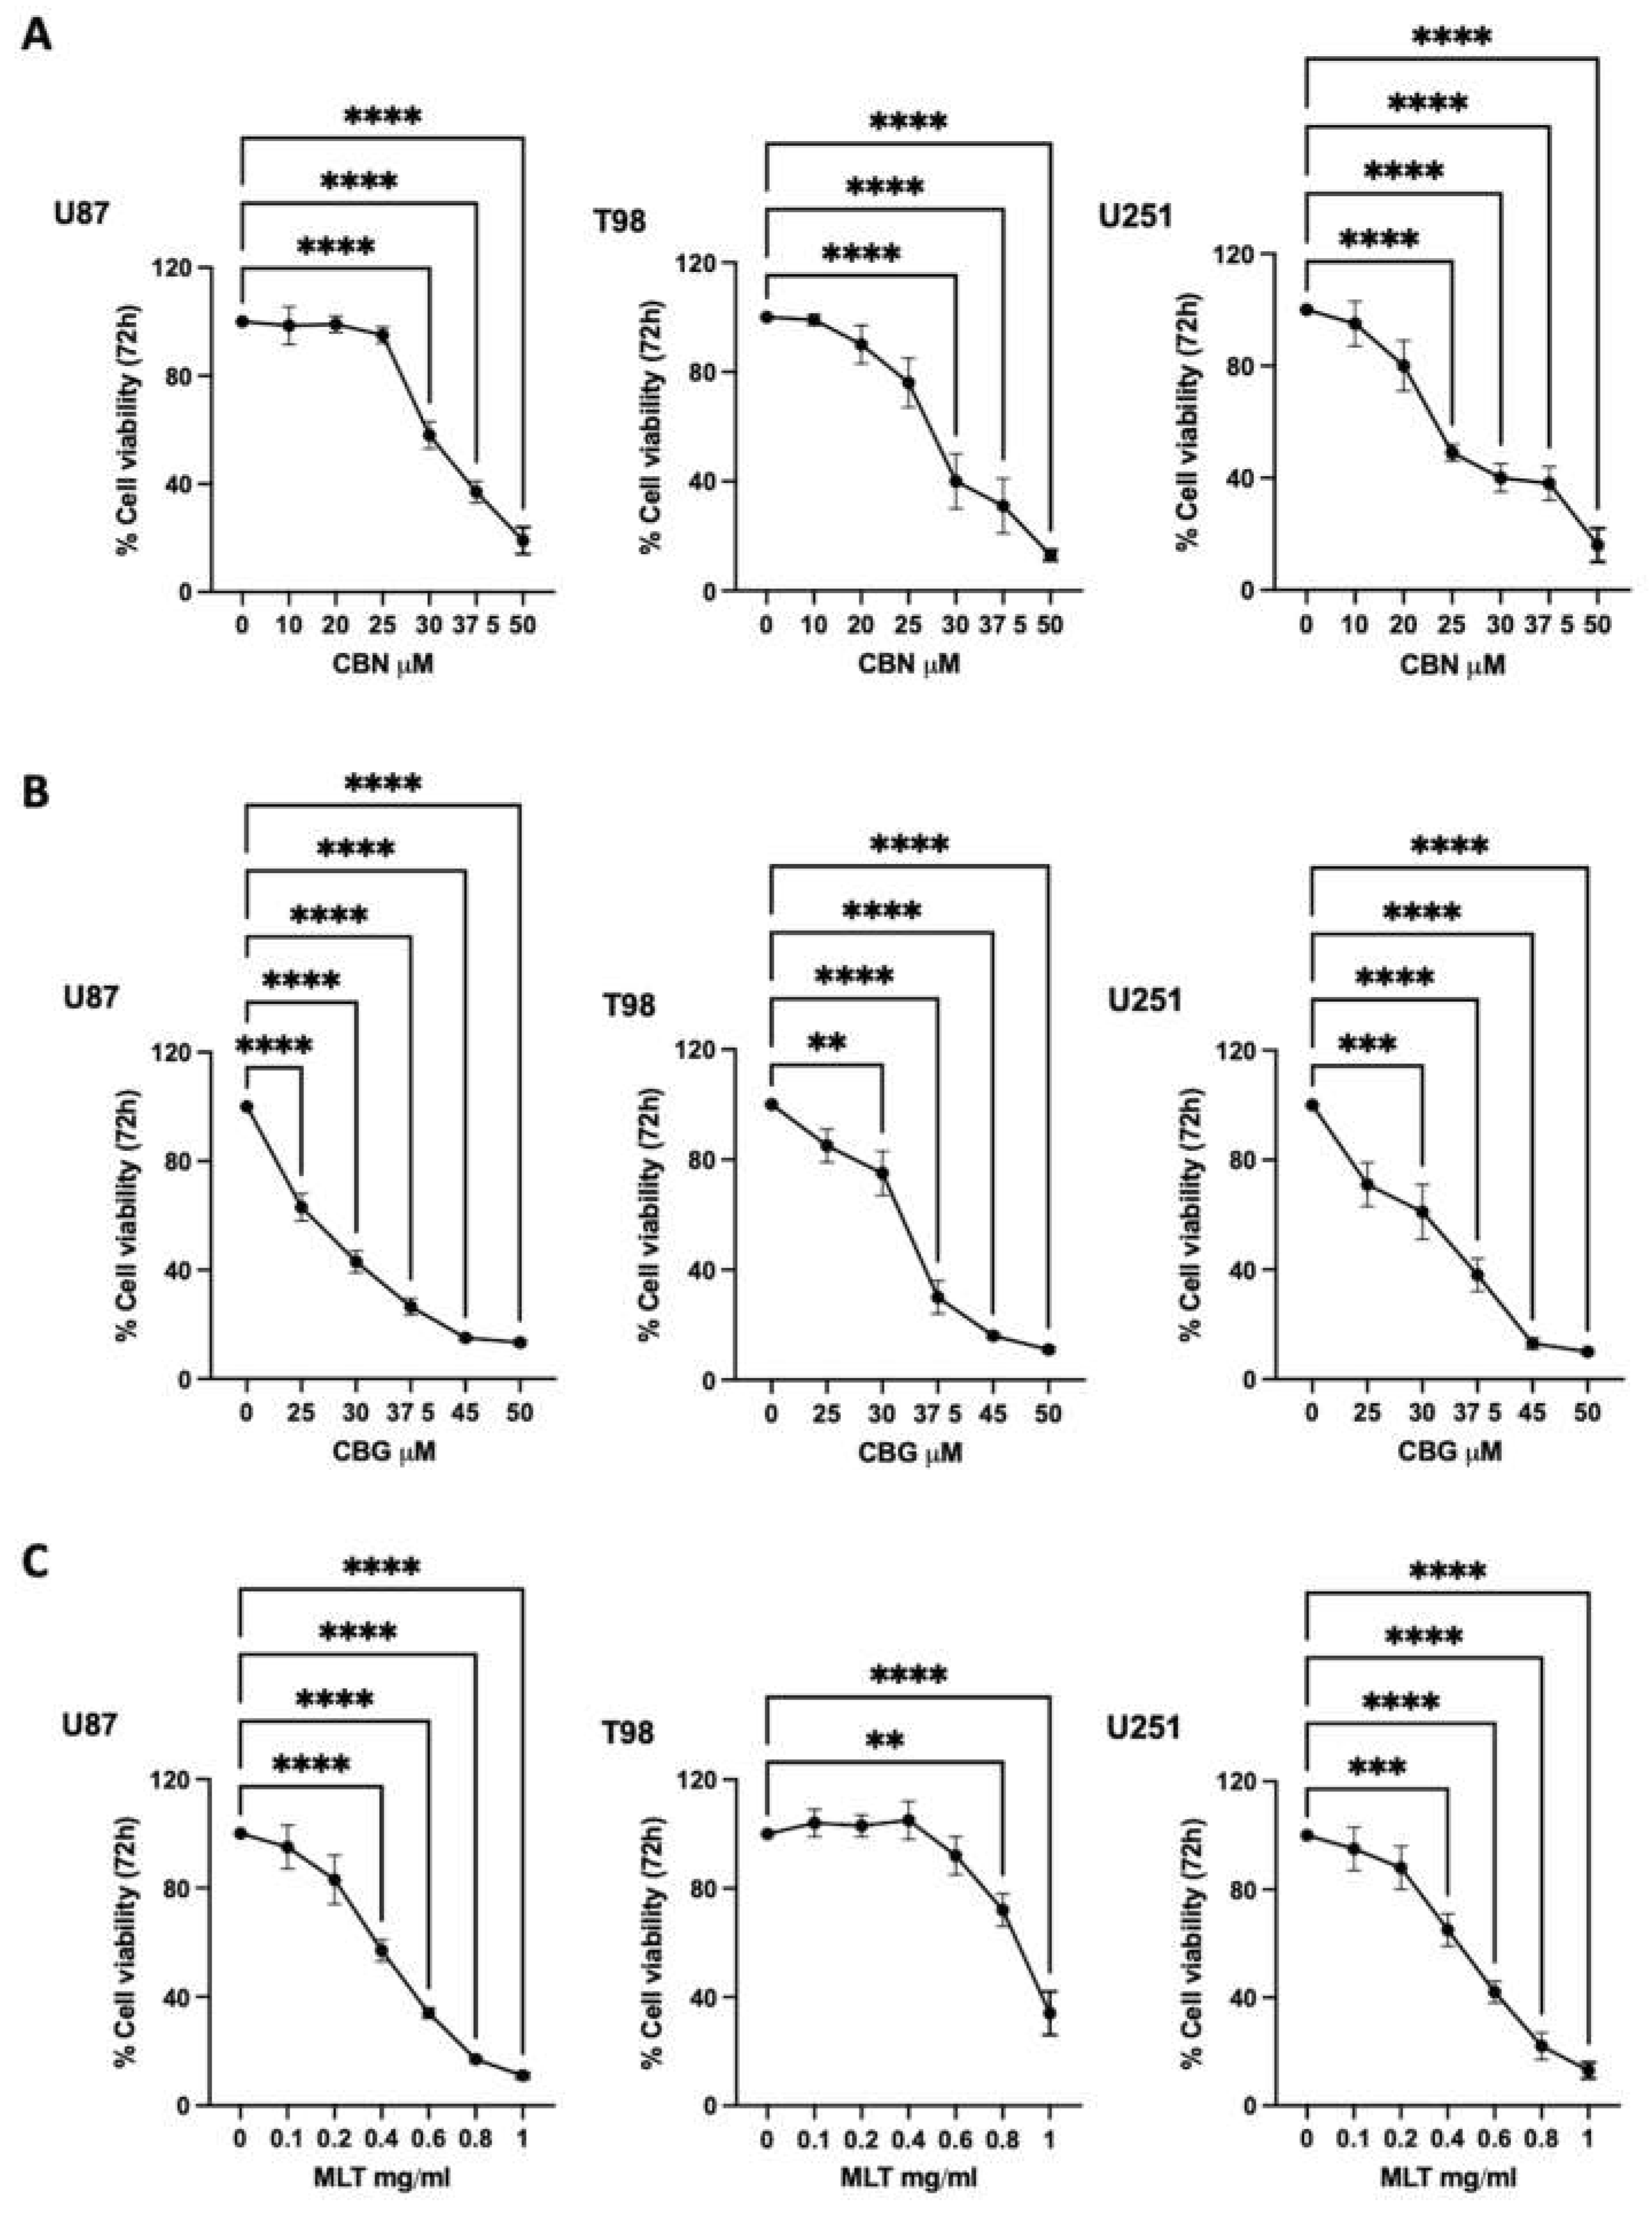
Figure 2.
In vitro cytotoxicity and synergistic interaction maps of cannabinoid-MLT combinations in GBM cell lines. A,C) Dose-response curves of U87, T98, and U251 cells treated with three concentrations of CBN (A) or CBG (C), either alone or in combination with increasing doses of MLT. Data are presented as absolute cell viability (%) relative to untreated cells (set at 100%). Statistical significance was determined using Two-way ANOVA followed by Tukey's post-hoc test (**p < 0.01, ***p < 0.001, ****p < 0.0001 vs. Control). B,D) 2D synergy landscapes calculated using the Bliss independence model for CBN + MLT (B) and CBG + MLT (D). The color scale indicates the Synergy Score: red regions represent synergistic cytotoxicity (score > 10), white regions indicate additive effects (-10 ≤ score ≤ 10), and green regions represent antagonism (score < -10). Data are expressed as mean ± Standard Deviation (SD) of three independent experiments.
Figure 2.
In vitro cytotoxicity and synergistic interaction maps of cannabinoid-MLT combinations in GBM cell lines. A,C) Dose-response curves of U87, T98, and U251 cells treated with three concentrations of CBN (A) or CBG (C), either alone or in combination with increasing doses of MLT. Data are presented as absolute cell viability (%) relative to untreated cells (set at 100%). Statistical significance was determined using Two-way ANOVA followed by Tukey's post-hoc test (**p < 0.01, ***p < 0.001, ****p < 0.0001 vs. Control). B,D) 2D synergy landscapes calculated using the Bliss independence model for CBN + MLT (B) and CBG + MLT (D). The color scale indicates the Synergy Score: red regions represent synergistic cytotoxicity (score > 10), white regions indicate additive effects (-10 ≤ score ≤ 10), and green regions represent antagonism (score < -10). Data are expressed as mean ± Standard Deviation (SD) of three independent experiments.
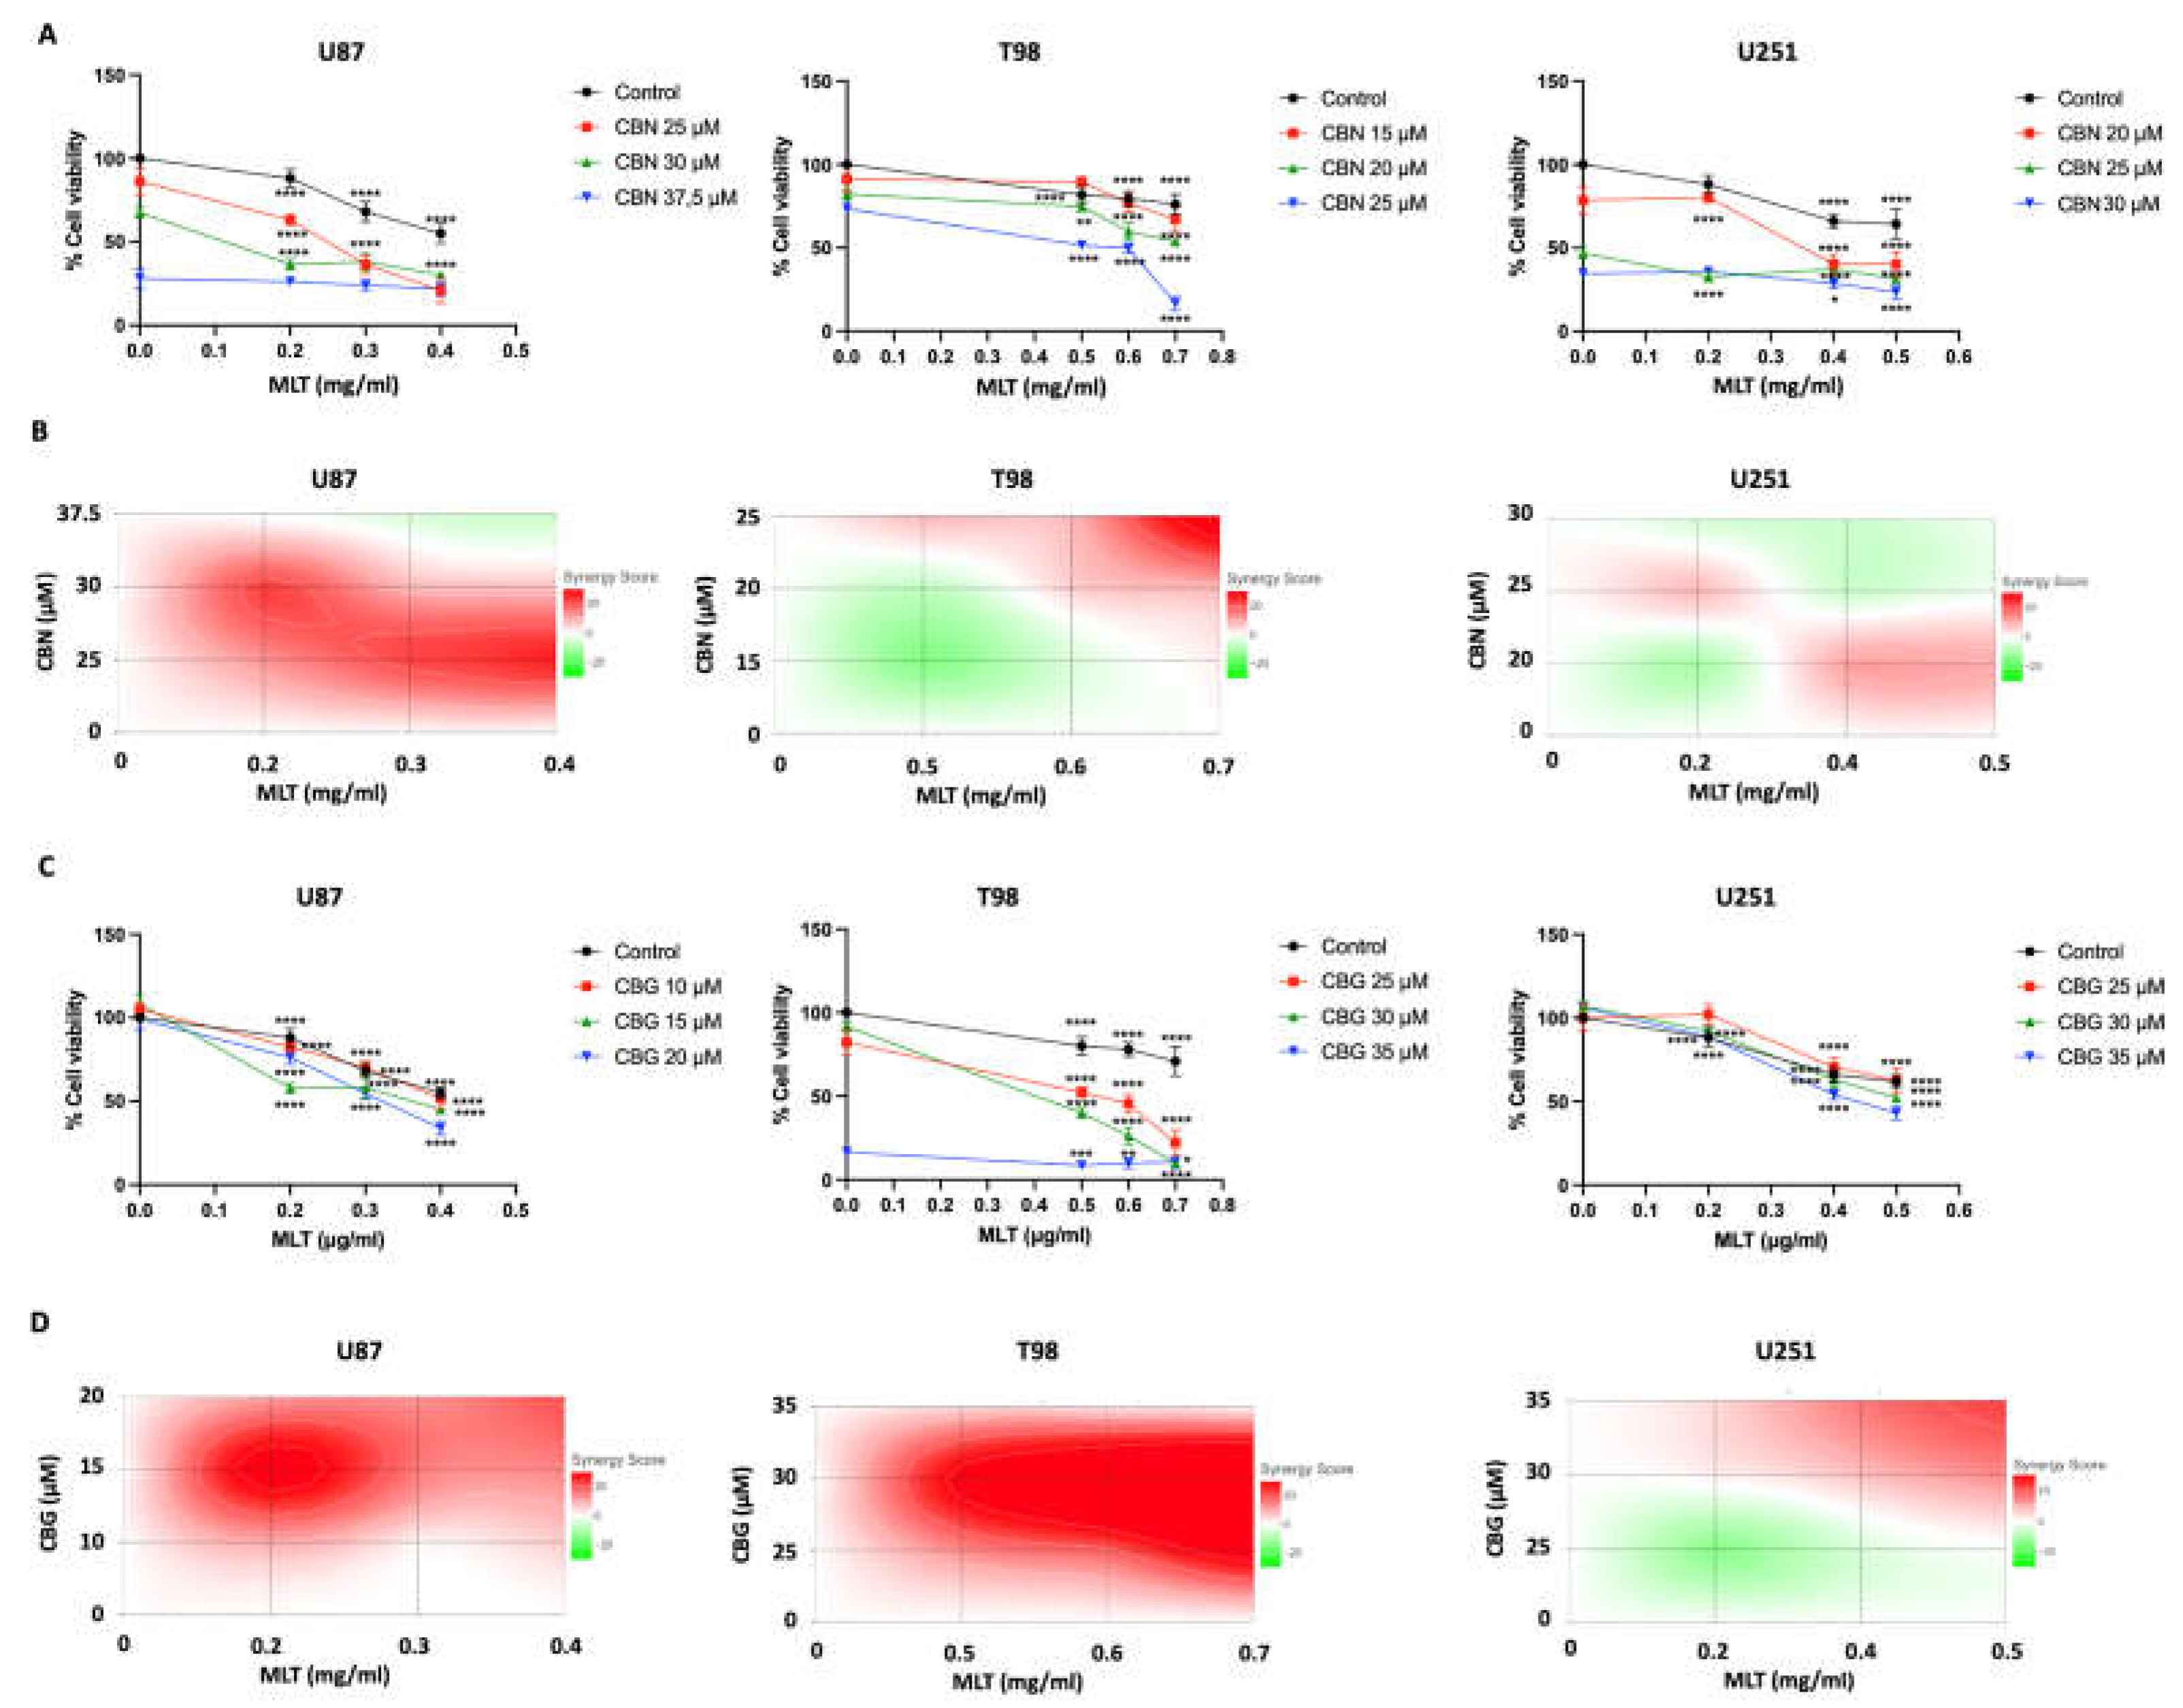
Figure 3.
Relative cell viability of healthy NHF A12 cells and Net Selectivity Indices (SI) of cannabinoid-MLT combinations. (A) Viability of NHF A12 cells treated with CBN or CBG in the absence (Control) or presence of MLT. Data are expressed as relative cell viability (%) normalized to the respective MLT-alone at each concentration (set at 100%, dashed line). Data are presented as mean ± SD. Statistical analysis was performed using Two-way ANOVA followed by Šidák's post-hoc test (*p < 0.05, ***p < 0.001 vs. Control). (B) Net Selectivity Index (SI) calculated for U87, T98, and U251 GBM lines relative to NHF A12 cells; the dashed line at SI = 1.0 represents the threshold of non-selectivity (values > 1.0 indicate preferential cytotoxicity toward cancer cells).
Figure 3.
Relative cell viability of healthy NHF A12 cells and Net Selectivity Indices (SI) of cannabinoid-MLT combinations. (A) Viability of NHF A12 cells treated with CBN or CBG in the absence (Control) or presence of MLT. Data are expressed as relative cell viability (%) normalized to the respective MLT-alone at each concentration (set at 100%, dashed line). Data are presented as mean ± SD. Statistical analysis was performed using Two-way ANOVA followed by Šidák's post-hoc test (*p < 0.05, ***p < 0.001 vs. Control). (B) Net Selectivity Index (SI) calculated for U87, T98, and U251 GBM lines relative to NHF A12 cells; the dashed line at SI = 1.0 represents the threshold of non-selectivity (values > 1.0 indicate preferential cytotoxicity toward cancer cells).
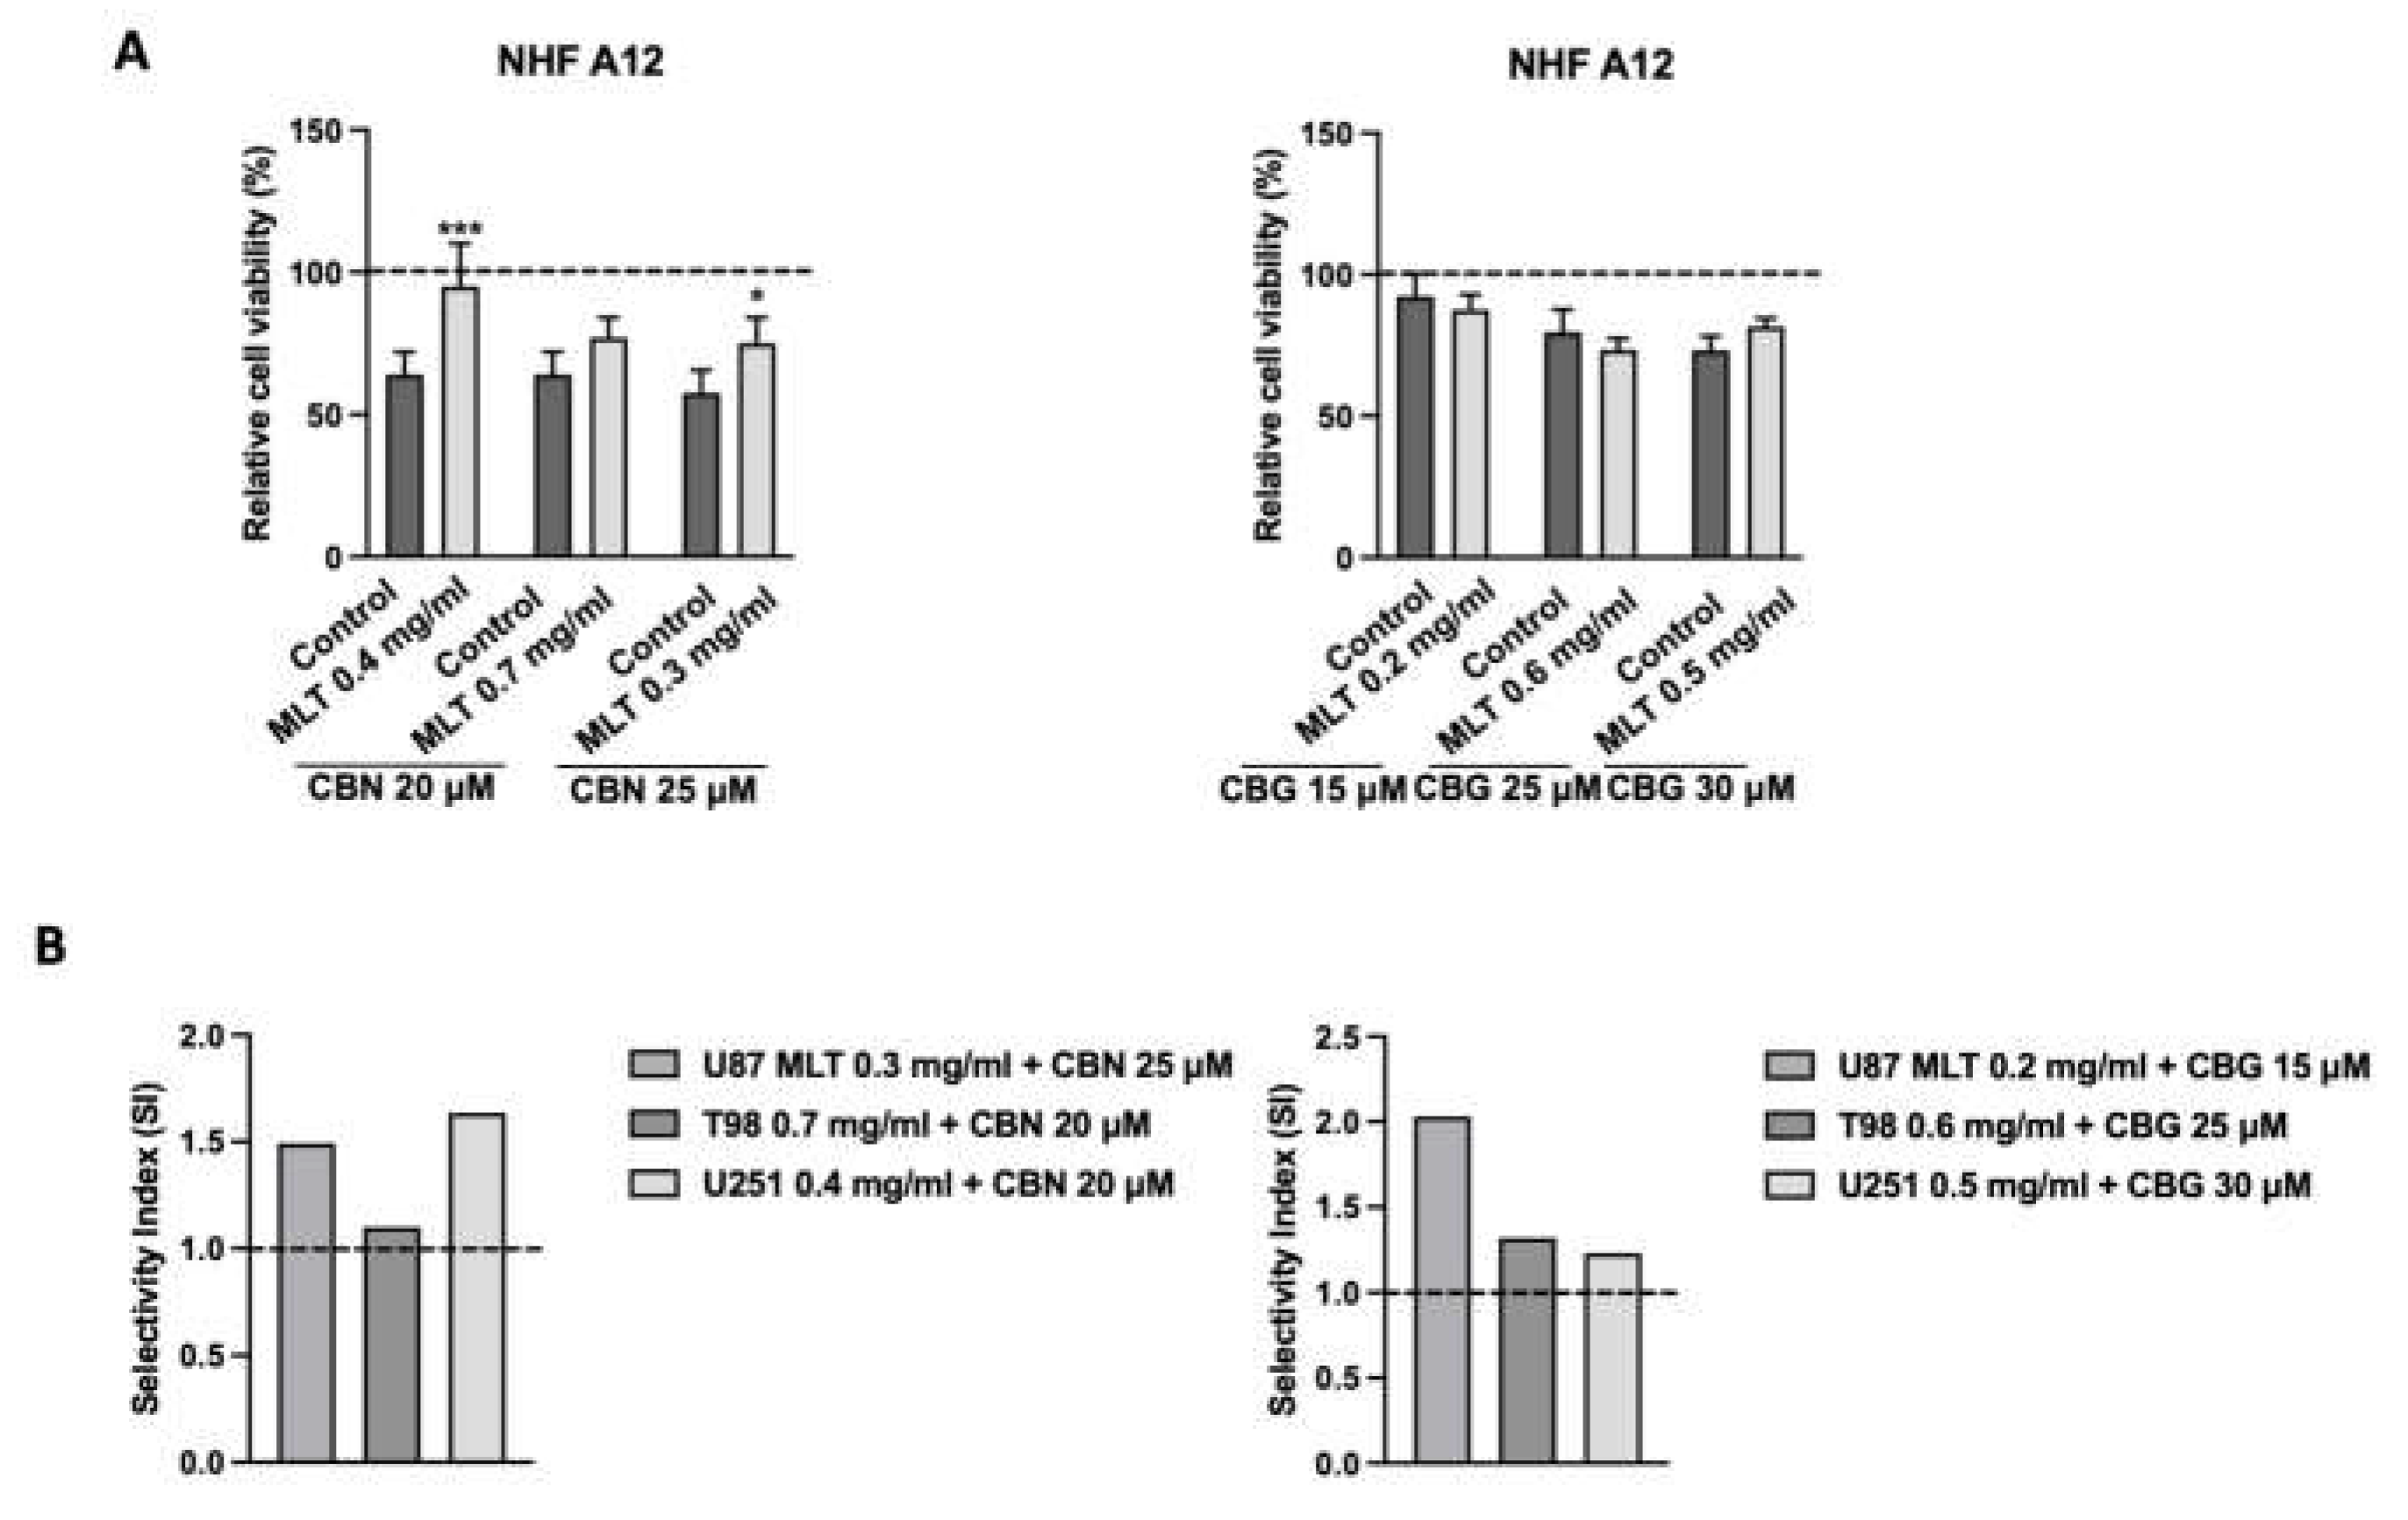
Figure 4.
Evaluation of cell death and DNA damage in GBM cell lines following single or combined treatments. A,B) U87, T98, and U251 cell lines were treated with MLT, CBN, CBG, or their respective combinations for 24 h. Cell death was assessed via PI staining and flow cytometry. A) MFI expressed as fold change relative to the untreated control for U87, T98, and U251 lines under single or combined MLT and CBN exposure. B) Relative MFI quantification for the same GBM lines under single or combined MLT and CBG exposure. In all bar graphs, the control group was normalized to 1. Data are presented as mean ± SD of at least three independent biological replicates. C) Western blot analysis (top) and corresponding densitometric quantification (bottom) of γ-H2AX protein levels relative to Glyceraldehyde-3-Phosphate Dehydrogenase (GAPDH) loading control in U87, T98, and U251 cells after 24 h treatment with MLT, CBN, or their combination. (D) Western blot analysis (top) and corresponding densitometric quantification (bottom) of γ-H2AX protein levels relative to GAPDH loading control in U87, T98, and U251 cells after 24 h treatment with MLT, CBG, or their combination. Statistical significance was determined using a one-way ANOVA followed by Dunnett's post-hoc test for multiple comparisons (* p < 0.05, ** p < 0.01, *** p < 0.001, **** p < 0.0001).
Figure 4.
Evaluation of cell death and DNA damage in GBM cell lines following single or combined treatments. A,B) U87, T98, and U251 cell lines were treated with MLT, CBN, CBG, or their respective combinations for 24 h. Cell death was assessed via PI staining and flow cytometry. A) MFI expressed as fold change relative to the untreated control for U87, T98, and U251 lines under single or combined MLT and CBN exposure. B) Relative MFI quantification for the same GBM lines under single or combined MLT and CBG exposure. In all bar graphs, the control group was normalized to 1. Data are presented as mean ± SD of at least three independent biological replicates. C) Western blot analysis (top) and corresponding densitometric quantification (bottom) of γ-H2AX protein levels relative to Glyceraldehyde-3-Phosphate Dehydrogenase (GAPDH) loading control in U87, T98, and U251 cells after 24 h treatment with MLT, CBN, or their combination. (D) Western blot analysis (top) and corresponding densitometric quantification (bottom) of γ-H2AX protein levels relative to GAPDH loading control in U87, T98, and U251 cells after 24 h treatment with MLT, CBG, or their combination. Statistical significance was determined using a one-way ANOVA followed by Dunnett's post-hoc test for multiple comparisons (* p < 0.05, ** p < 0.01, *** p < 0.001, **** p < 0.0001).
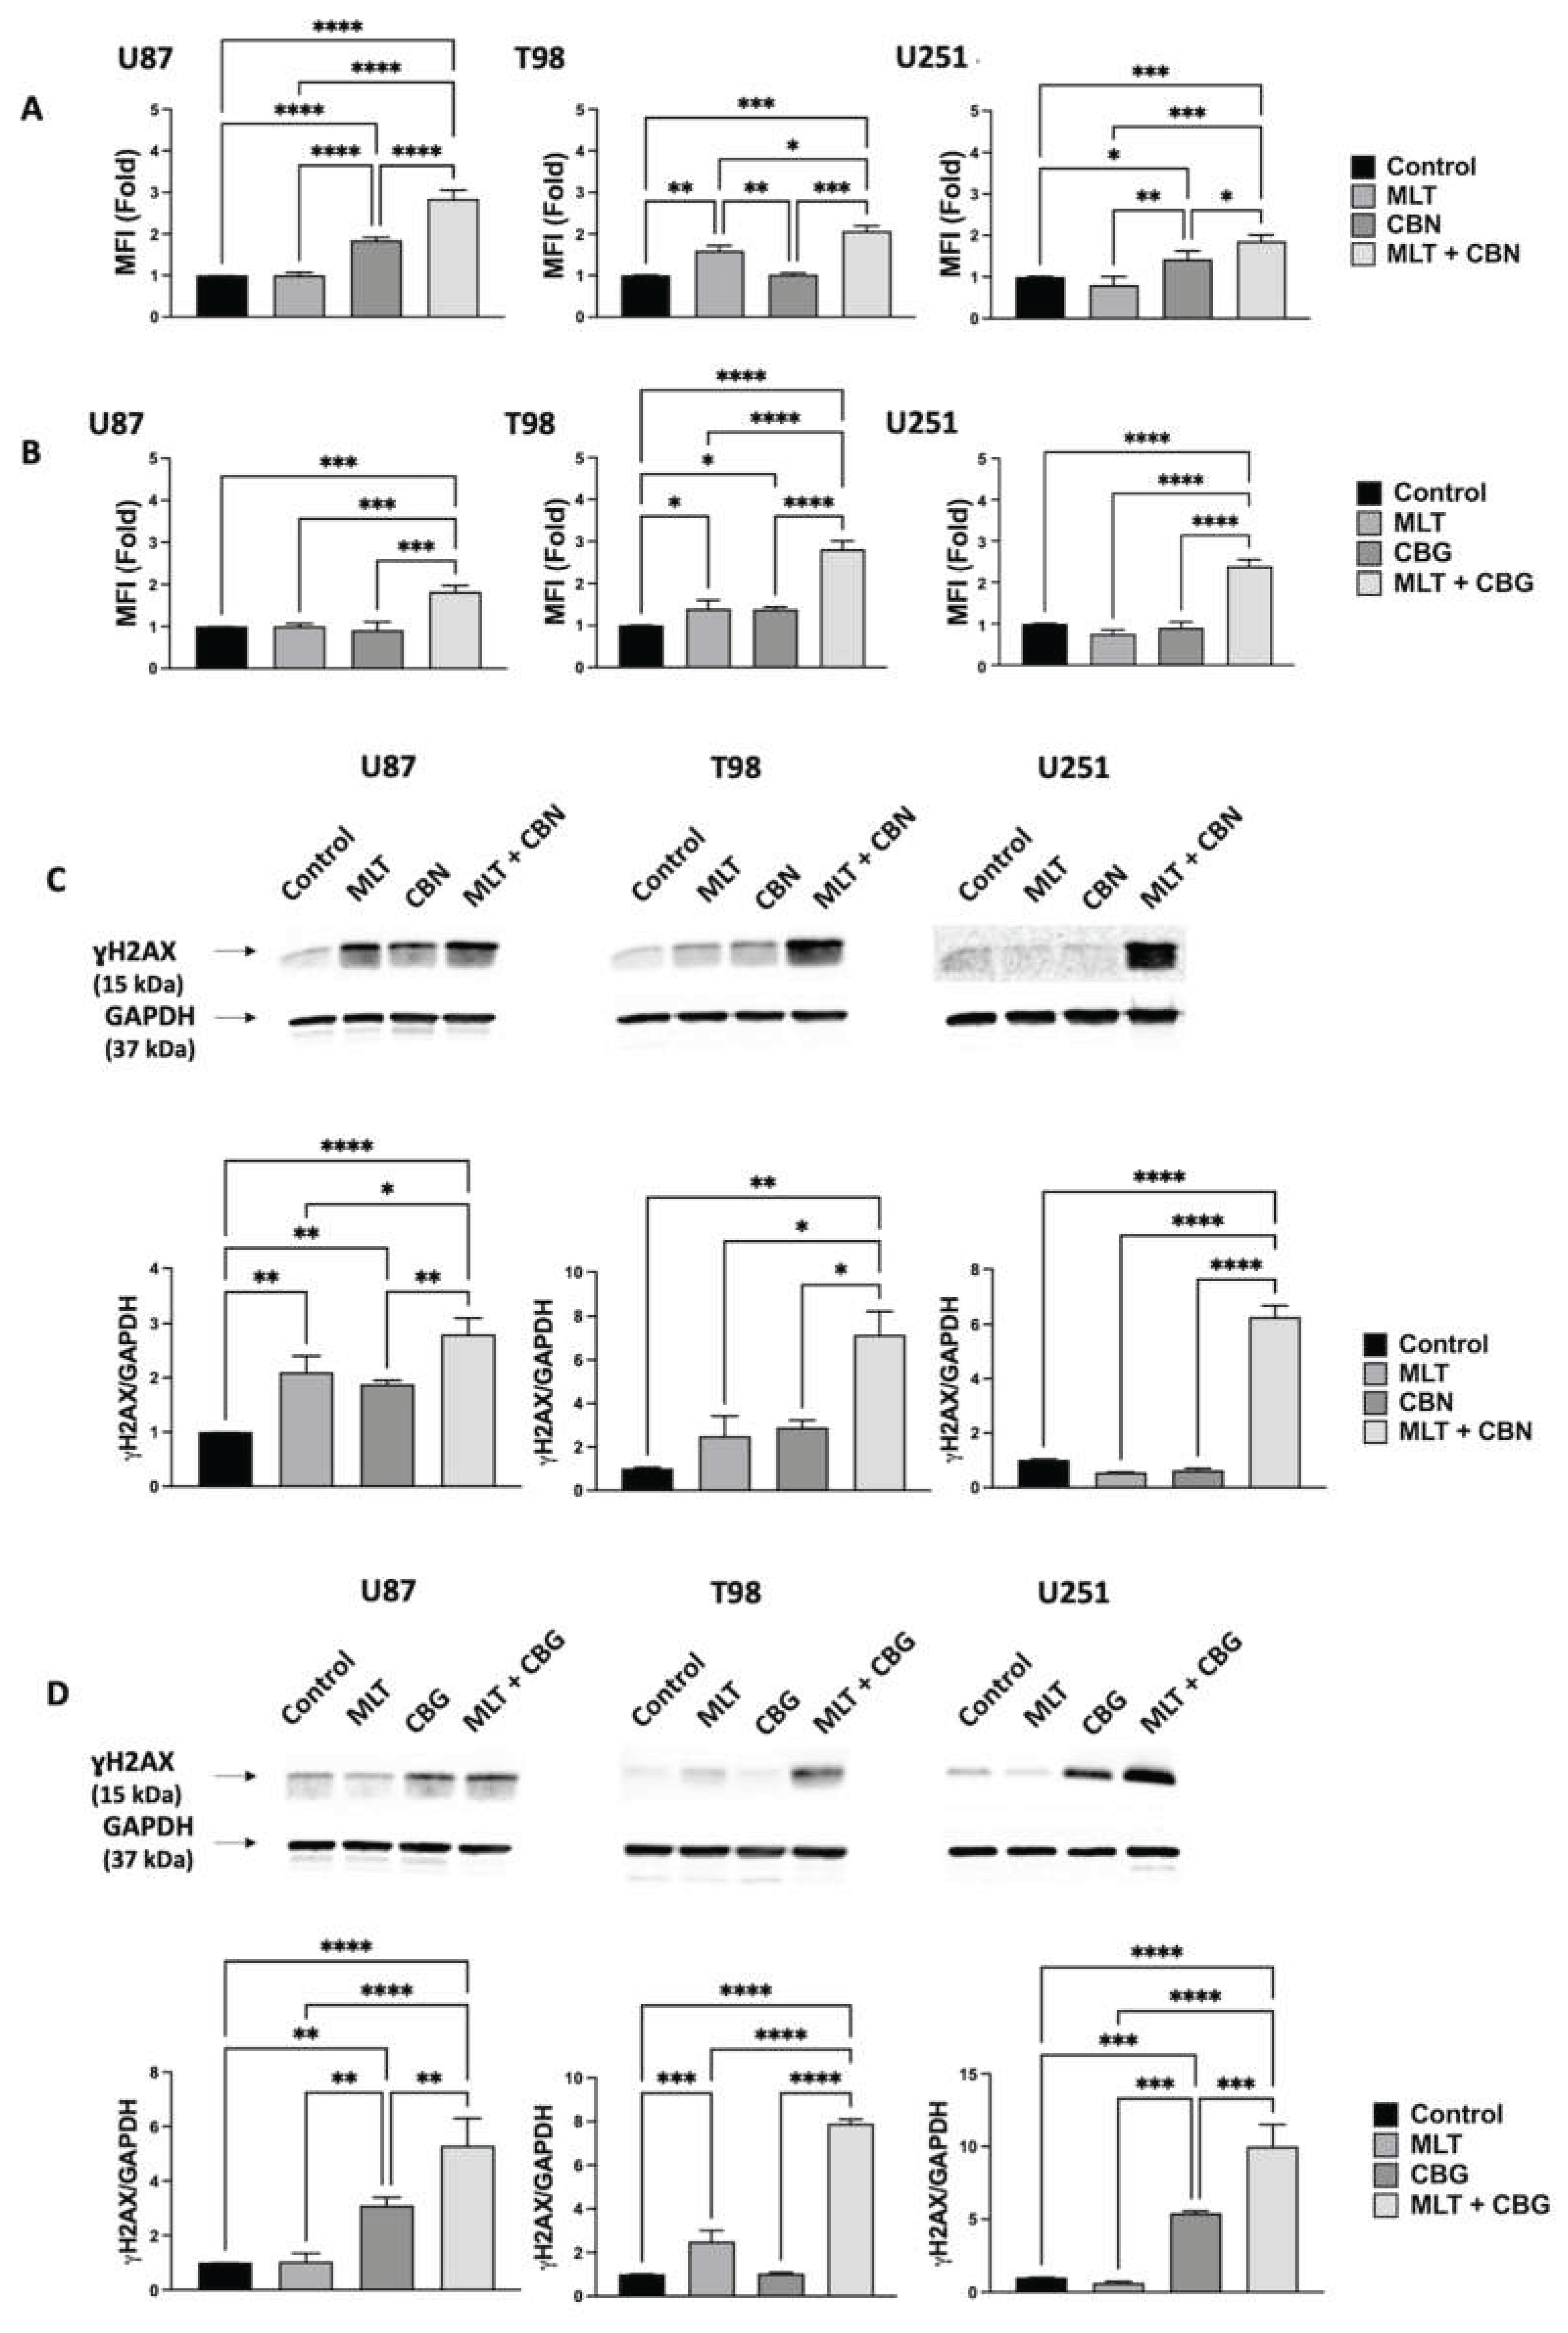
Figure 5.
Flow cytometric analysis of intracellular ROS production in GBM cell lines under time-dependent single or combined cannabinoids and MLT treatments. A) Quantification of DCFDA MFI, expressed as fold change relative to the untreated control, to assess intracellular ROS levels in U87 (16 h), T98 (6 h), and U251 (12 h) lines under single or combined MLT and CBN exposure. B) Relative DCFDA MFI quantification for U87 (16 h), T98 (6 h), and U251 (12 h) lines under single or combined MLT and CBG exposure. In all bar graphs, the untreated control group was normalized to 1. Data are presented as mean ± SD of at least three independent biological replicates. Statistical significance was determined using a one-way ANOVA followed by Tukey’s post-hoc test for multiple comparisons (* p < 0.05, ** p < 0.01, *** p < 0.001).
Figure 5.
Flow cytometric analysis of intracellular ROS production in GBM cell lines under time-dependent single or combined cannabinoids and MLT treatments. A) Quantification of DCFDA MFI, expressed as fold change relative to the untreated control, to assess intracellular ROS levels in U87 (16 h), T98 (6 h), and U251 (12 h) lines under single or combined MLT and CBN exposure. B) Relative DCFDA MFI quantification for U87 (16 h), T98 (6 h), and U251 (12 h) lines under single or combined MLT and CBG exposure. In all bar graphs, the untreated control group was normalized to 1. Data are presented as mean ± SD of at least three independent biological replicates. Statistical significance was determined using a one-way ANOVA followed by Tukey’s post-hoc test for multiple comparisons (* p < 0.05, ** p < 0.01, *** p < 0.001).
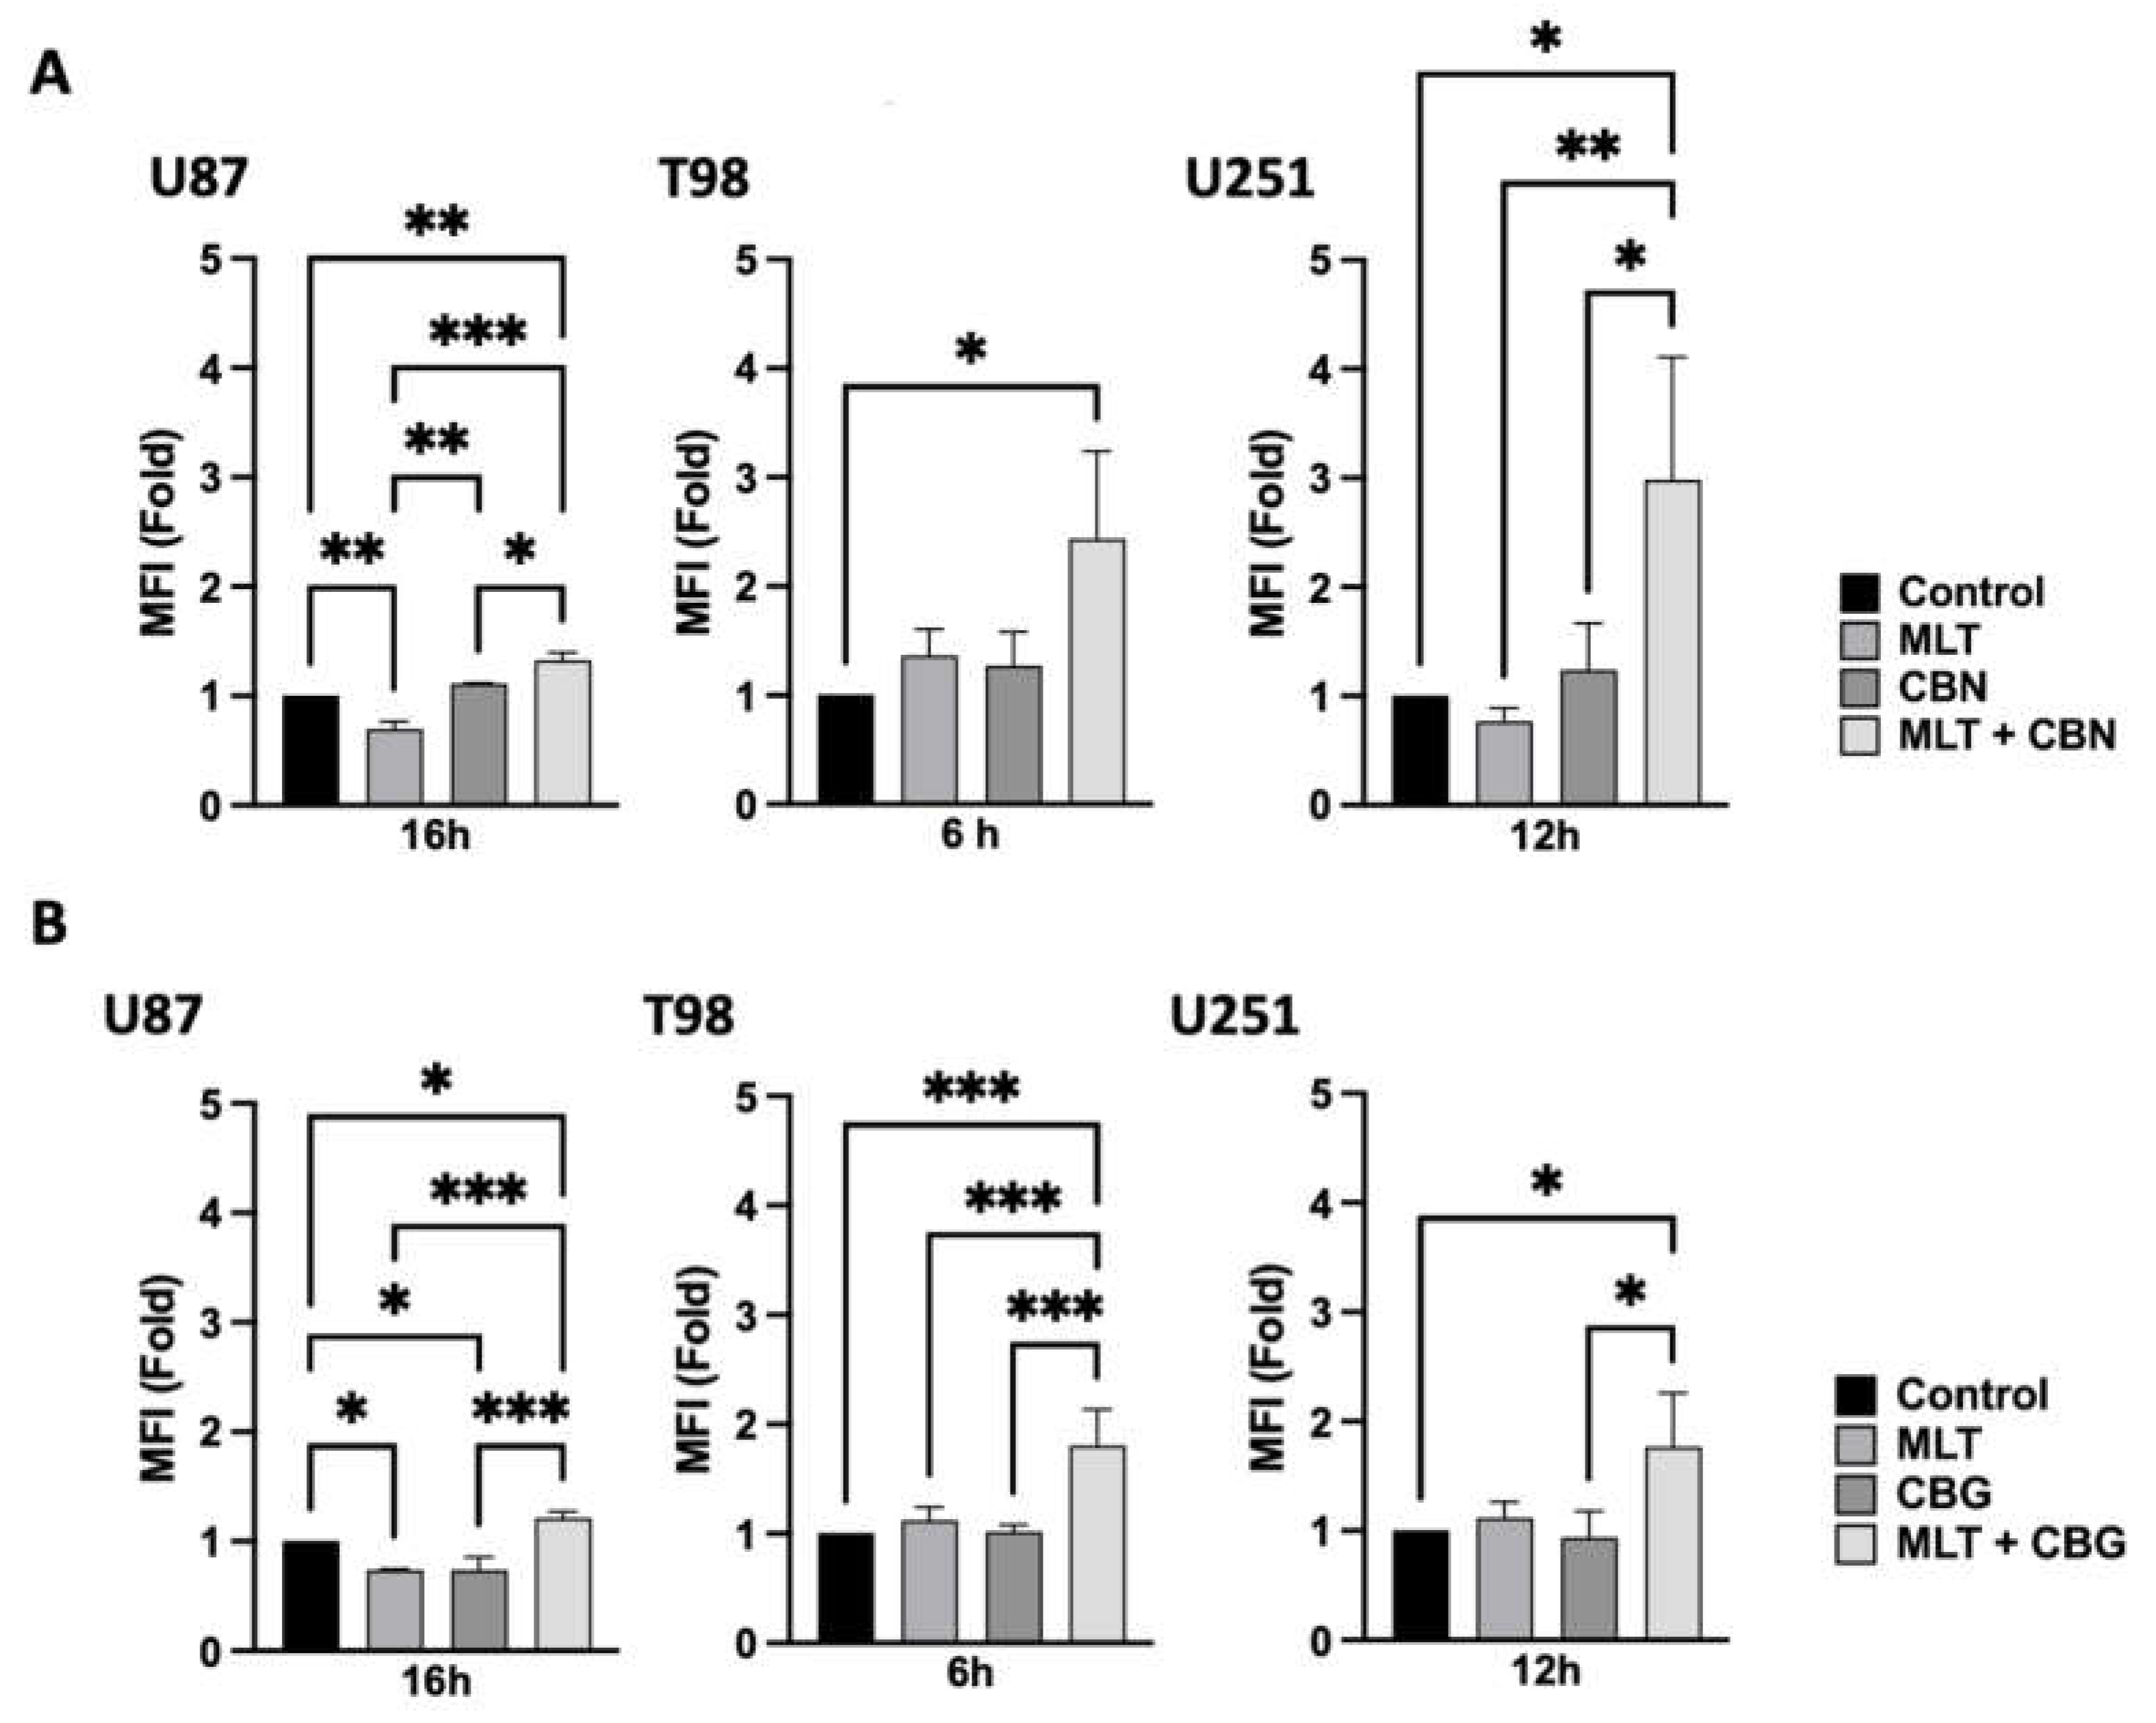
Figure 6.
Effects of cannabinoids and MLT treatments on mitochondrial status in GBM cells. A,B) Flow cytometric analysis of mitochondrial membrane potential (Δψm) expressed as the red (FL2)/green (FL1) fluorescence intensity ratio of JC-1 staining in U87, T98, and U251 lines after 24 h treatment with single or combined MLT, CBN (A) and CBG (B). CCCP was used as a positive control for mitochondrial depolarization. C,D) Flow cytometric quantification of mitochondrial mass assessed via MitoBright staining (MFI, fold change) in U87, T98 and U251 lines following single or combined MLT and CBN (C) or CBG (D) treatments. E) Flow cytometric analysis of Cytochrome c Oxidase subunit IV (COX-IV) expression (MFI, fold change) in T98 cell line under the respective single or combined treatments. Bar graphs indicate the percentage reduction of COX-IV positive cells. E) Confocal microscopy analysis of COX-IV expression and localization in T98 cells (Magnification 100x). In all bar graphs, data are presented as mean ± SD of at least three independent biological replicates. Statistical significance was determined using a one-way ANOVA followed by Tukey’s post-hoc test for multiple comparisons (* p < 0.05, ** p < 0.01, *** p < 0.001, **** p < 0.0001).
Figure 6.
Effects of cannabinoids and MLT treatments on mitochondrial status in GBM cells. A,B) Flow cytometric analysis of mitochondrial membrane potential (Δψm) expressed as the red (FL2)/green (FL1) fluorescence intensity ratio of JC-1 staining in U87, T98, and U251 lines after 24 h treatment with single or combined MLT, CBN (A) and CBG (B). CCCP was used as a positive control for mitochondrial depolarization. C,D) Flow cytometric quantification of mitochondrial mass assessed via MitoBright staining (MFI, fold change) in U87, T98 and U251 lines following single or combined MLT and CBN (C) or CBG (D) treatments. E) Flow cytometric analysis of Cytochrome c Oxidase subunit IV (COX-IV) expression (MFI, fold change) in T98 cell line under the respective single or combined treatments. Bar graphs indicate the percentage reduction of COX-IV positive cells. E) Confocal microscopy analysis of COX-IV expression and localization in T98 cells (Magnification 100x). In all bar graphs, data are presented as mean ± SD of at least three independent biological replicates. Statistical significance was determined using a one-way ANOVA followed by Tukey’s post-hoc test for multiple comparisons (* p < 0.05, ** p < 0.01, *** p < 0.001, **** p < 0.0001).
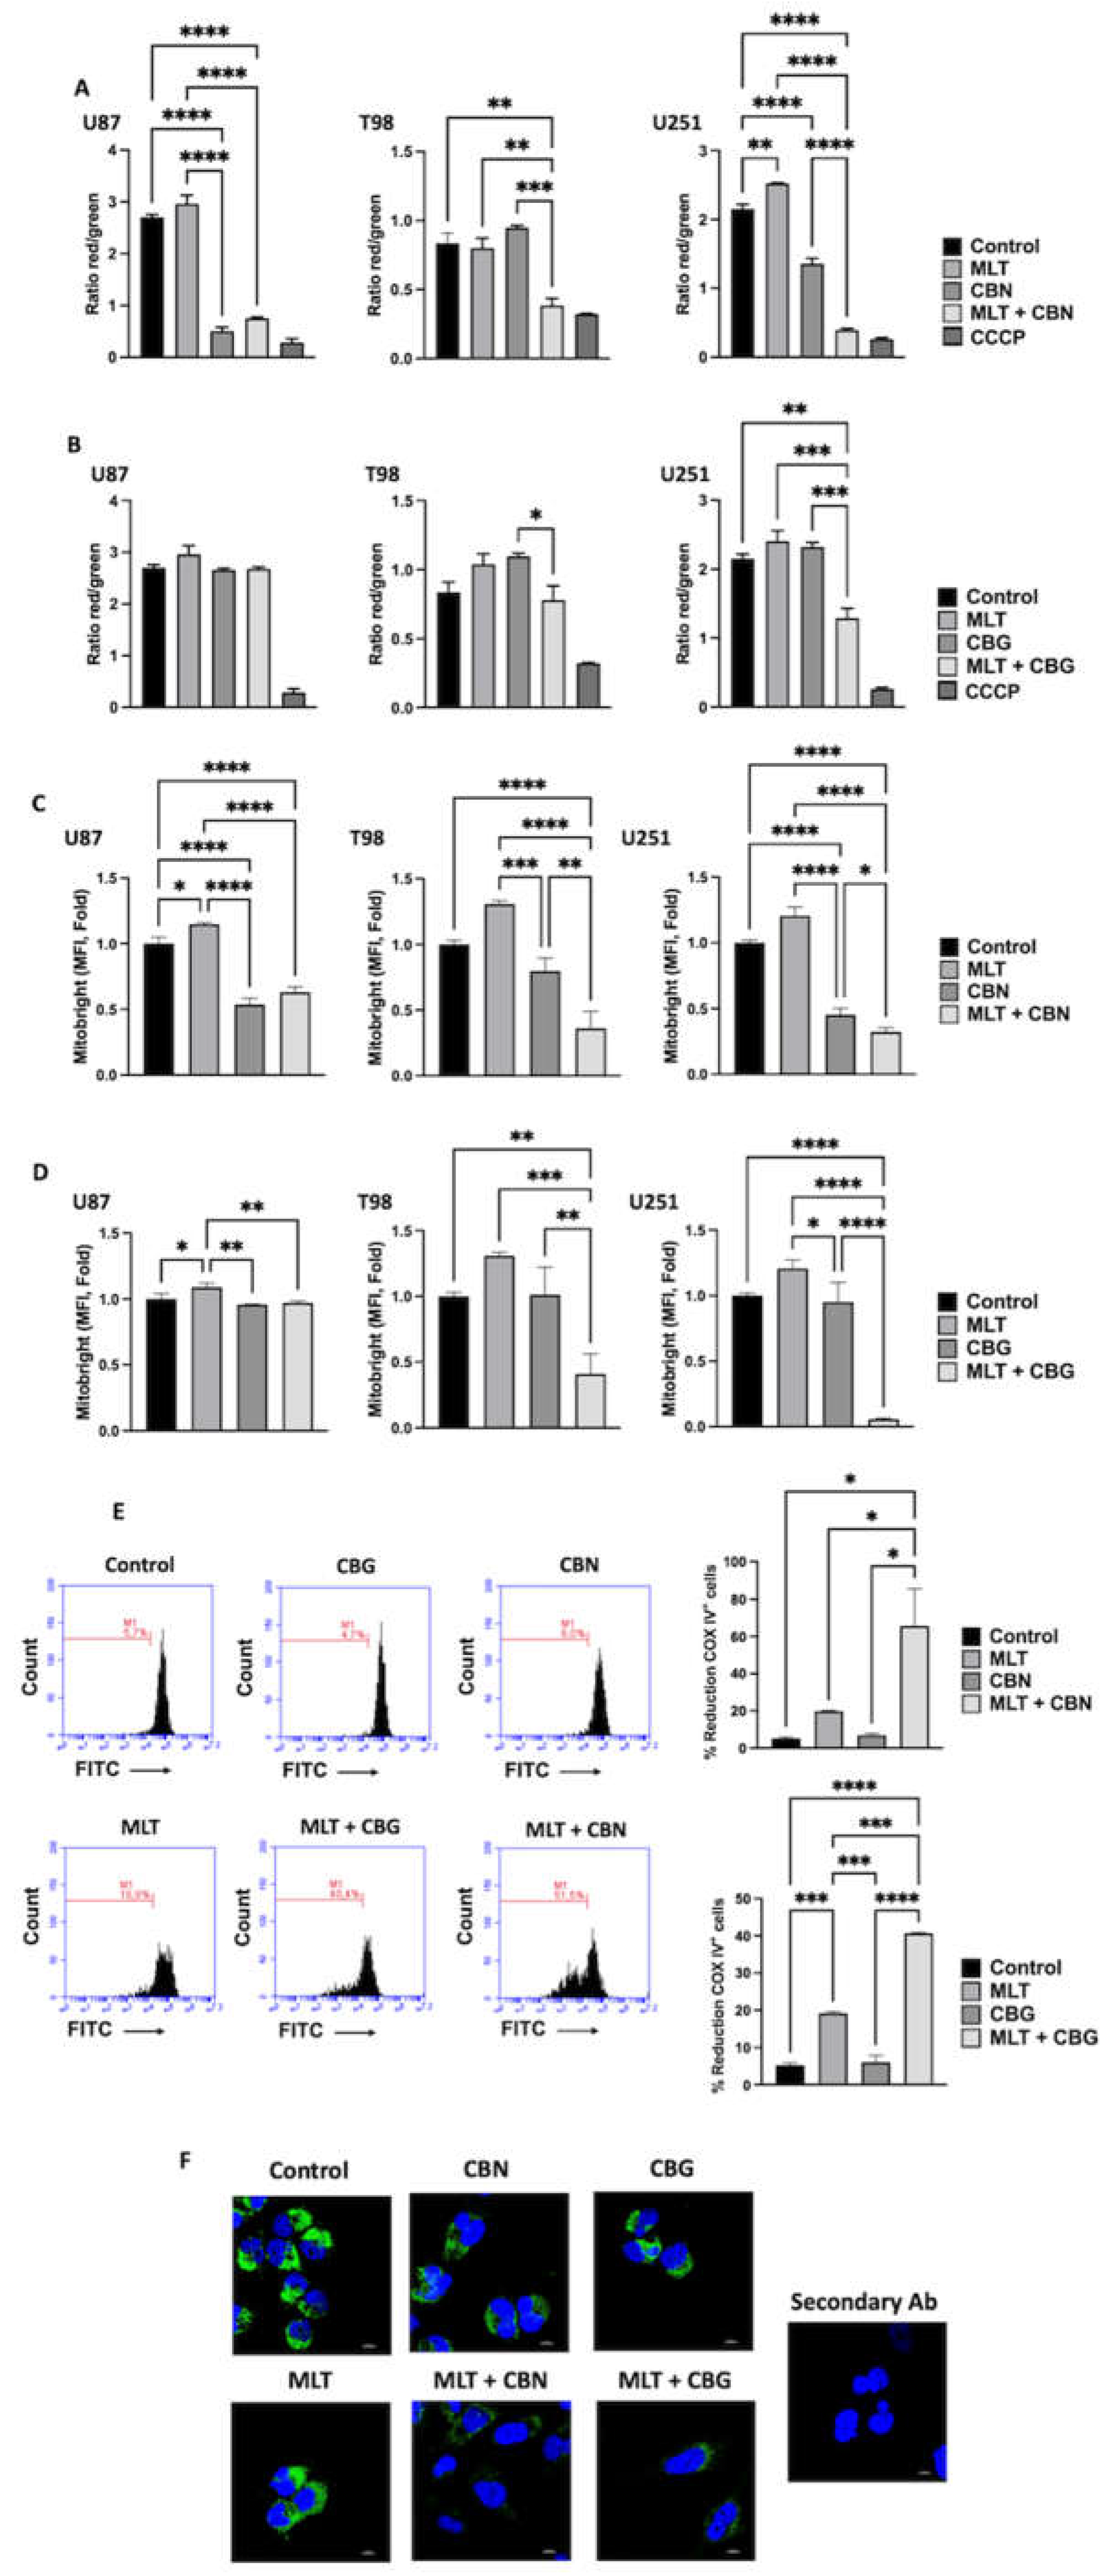
Figure 7.
Flow cytometric analysis of lipid peroxidation in GBM cell lines under single or combined cannabinoids and MLT treatments. A) Evaluation of lipid peroxidation expressed as the PE-A/FITC-A fluorescence ratio of Bodipy staining in U87, T98, and U251 lines after 24 h treatment with single or combined MLT and CBN. B) Relative Bodipy PE-A/FITC-A ratio in U87, T98, and U251 lines under single or combined MLT and CBG exposure for 24 h. In all bar graphs, data are presented as mean ± SD of at least three independent biological replicates. Statistical significance was determined using a one-way ANOVA followed by Tukey’s post-hoc test for multiple comparisons (* p < 0.05, ** p < 0.01, *** p < 0.001).
Figure 7.
Flow cytometric analysis of lipid peroxidation in GBM cell lines under single or combined cannabinoids and MLT treatments. A) Evaluation of lipid peroxidation expressed as the PE-A/FITC-A fluorescence ratio of Bodipy staining in U87, T98, and U251 lines after 24 h treatment with single or combined MLT and CBN. B) Relative Bodipy PE-A/FITC-A ratio in U87, T98, and U251 lines under single or combined MLT and CBG exposure for 24 h. In all bar graphs, data are presented as mean ± SD of at least three independent biological replicates. Statistical significance was determined using a one-way ANOVA followed by Tukey’s post-hoc test for multiple comparisons (* p < 0.05, ** p < 0.01, *** p < 0.001).
Disclaimer/Publisher’s Note: The statements, opinions and data contained in all publications are solely those of the individual author(s) and contributor(s) and not of MDPI and/or the editor(s). MDPI and/or the editor(s) disclaim responsibility for any injury to people or property resulting from any ideas, methods, instructions or products referred to in the content. |
© 2026 by the authors. Licensee MDPI, Basel, Switzerland. This article is an open access article distributed under the terms and conditions of the Creative Commons Attribution (CC BY) license (http://creativecommons.org/licenses/by/4.0/).
Copyright: This open access article is published under a Creative Commons CC BY 4.0 license, which permit the free download, distribution, and reuse, provided that the author and preprint are cited in any reuse.


