

Submitted:
20 June 2026
Posted:
23 June 2026
You are already at the latest version
Abstract
Work zones reduce roadway capacity and create unstable merging, queue spillback, and stop-and-go conditions that simultaneously degrade traffic operations and elevate crash risk. Conventional fixed-time, actuated, and adaptive signal controllers are poorly suited to these non-stationary conditions, and most reinforcement learning (RL) approaches optimize for mobility while treating safety only as a post-hoc evaluation measure. This study develops a safety-aware Deep Q-Network (DQN) framework for adaptive signal control at intersections operating near work zone activity areas. The framework embeds merge conflict risk, upstream spillback propagation, and stop-and-go instability directly into both the state representation and the reward formulation, alongside operational objectives such as delay, throughput, and speed. A merge-conflict model based on relative spacing, relative speed, and acceleration characterizes unsafe interactions in the merge region, and a Pareto-based multi-objective procedure samples reward-weight vectors to identify non-dominated policies balancing efficiency and safety. The framework was implemented and evaluated in a SUMO microscopic simulation of a signalized intersection under lane-closure conditions. The best policy increased throughput by 24.6%, 32.7%, 37.3%, and 29.7% for cars, trucks, buses, and mixed traffic relative to default timing (all p < 0.001; Cohen’s d = 0.53 - 1.29), with the largest gains for trucks and buses. Shockwave analysis showed a 39.1% reduction in maximum queue length and a 45.8% reduction in spillback distance, with faster queue dissipation. The results indicate that encoding surrogate safety indicators as learning objectives, rather than evaluation criteria, enables a single controller to jointly improve mobility and safety in work zones.
Keywords:
reinforcement learning
; traffic signal control
; intelligent transportation systems
; traffic safety
; adaptive signal control
; work zone
; merge conflict
1. Introduction
Work zones are necessary for roadway maintenance, rehabilitation, and construction, but they often create temporary traffic conditions that differ substantially from normal roadway operations. Lane closures, roadway geometry transitions, speed reductions, and temporary traffic-control measures can reduce roadway capacity and disrupt traffic flow along affected corridors [1]. These disruptions commonly lead to increased delay, emissions, queue formation, stop-and-go traffic, and elevated crash risk. Because work zones operate under temporary and constrained roadway conditions, they are often characterized by unstable queues, merging turbulence, and shockwave development, particularly when traffic demand approaches or exceeds the reduced capacity of the open lane [2,3]. Managing traffic operations under these conditions is challenging because work zone traffic patterns vary continuously across both time and space. Although adaptive traffic signal control has been used to manage fluctuating demand and reduce delay, fuel consumption, and emissions, its effectiveness may be limited in work zone environments where traffic patterns deviate from normal operating conditions [4].
In addition to operational impacts, work zones present important safety concerns. National crash statistics show that work zone segments experience elevated crash risk compared with non-work zone roadway sections [5]. Rear-end crashes are especially common because work zones frequently generate sudden deceleration, speed differentials, queue spillback, and unstable merging near lane closures. However, evaluating work zone safety using historical crash records alone can be difficult because crash data are often sparse, site-specific, and affected by reporting or classification inconsistencies. For this reason, many studies have used surrogate safety indicators and traffic-instability measures to identify unsafe operating conditions before crashes occur. These indicators are particularly useful in work zone environments because they can capture short-term changes in speed, spacing, acceleration, braking, queue growth, and merging behavior.
Traditional traffic signal control strategies are not always well suited to these temporary and unstable conditions. Pre-timed signal control relies on predetermined timing plans and therefore lacks responsiveness to rapid changes in demand, queue formation, or capacity reductions caused by work zone lane closures. Fully actuated control can respond to detector calls, but its performance may degrade under work zone conditions when detectors are misaligned, blocked, affected by lane shifts, or unable to capture queues that extend beyond the detection range [6,7]. More advanced adaptive signal control systems can adjust timings in response to changing traffic conditions, but many are still designed around assumptions of relatively stable roadway geometry and recurrent traffic patterns [8,9]. In work zones, traffic dynamics are often dominated by spillback, shockwave propagation, unstable merging interactions, and queue storage limitations rather than ordinary intersection delay alone [10,11]. As a result, conventional signal control strategies may not effectively regulate inflow into a reduced-capacity work zone segment.
Reinforcement learning provides a promising alternative for adaptive traffic signal control because it allows an agent to learn directly from interaction with the traffic environment. Instead of relying entirely on fixed timing plans or predefined detector logic, a reinforcement-learning-based controller observes the current traffic state, selects signal actions, receives feedback through a reward function, and gradually improves its decision-making policy. Prior studies have shown that reinforcement learning can improve traffic signal control by reducing queue length, travel time, delay, and congestion [12,13,14]. Early reinforcement learning applications used tabular methods such as Q-learning and SARSA, but these approaches were limited by large state-action spaces. Deep reinforcement learning addresses this limitation by using neural networks to approximate value functions in complex traffic environments. Among these methods, the Deep Q-Network is particularly suitable for isolated signalized intersection control because signal phase decisions can be represented as a discrete action space while maintaining relatively low computational complexity.
Despite these advances, most reinforcement-learning-based traffic signal control studies remain primarily focused on operational efficiency measures such as delay, queue length, travel time, throughput, and average speed. Safety-related indicators are often treated as post-training evaluation measures rather than being incorporated directly into the learning process. This limitation is especially important in work zone environments, where mobility and safety are closely connected. A signal controller that improves throughput without considering spillback, stop-and-go instability, or merge conflict risk may unintentionally increase unsafe vehicle interactions near the work zone transition area. Recent safety-aware reinforcement learning studies have begun incorporating surrogate safety indicators such as Time-to-Collision, Post-Encroachment Time, and Deceleration Rate to Avoid Collision into traffic control or vehicle-control frameworks. However, many of these studies focus on freeway operations, autonomous driving, or general traffic management rather than signalized intersections operating near work zone lane closures. In addition, safety is still frequently evaluated after policy training rather than being embedded directly into the state representation and reward formulation.
Motivated by these limitations, this study develops a safety-aware Deep Q-Network framework for adaptive traffic signal control at a signalized intersection operating near a work zone lane closure. The proposed framework integrates work-zone-specific safety and mobility indicators directly into both the state representation and reward function. These indicators include accumulated waiting time, work zone spillback length, average traffic speed, stop-behavior instability, merge conflict risk, and current signal phase information. The merge conflict component is formulated using relative spacing, relative speed, acceleration behavior, and interaction instability among vehicles near the work zone merge region. By penalizing spillback growth, unstable merging interactions, and stop-and-go turbulence while rewarding stable traffic movement, the proposed framework is designed to learn signal timing strategies that jointly improve traffic operations and reduce safety-critical instability.
The main contributions of this study are fourfold. First, it develops a safety-aware DQN framework for adaptive signal control in a signalized work zone environment. Second, it incorporates merge conflict risk, spillback propagation, and stop-behavior instability directly into the learning process instead of treating them only as post-evaluation measures. Third, it applies a Pareto-based multi-objective procedure to evaluate trade-offs between safety and mobility objectives under different reward-weight configurations. Fourth, it evaluates the proposed controller in a SUMO microscopic simulation environment using operational, surrogate safety, and shockwave-based performance measures. Through this approach, the study demonstrates how reinforcement learning can be used to manage both mobility and safety under the non-stationery and capacity-constrained conditions created by work zone lane closures.
2. Work Zone Framework and Reinforcement Learning Model Architecture
Work zones can generally be grouped into two primary operational configurations: flagging work zones and lane-closure work zones. In flagging work zones, two-way traffic is alternately controlled through a single open lane, typically under the direction of flaggers or temporary traffic-control devices. These configurations are commonly used on two-lane highways where construction or maintenance activities temporarily restrict one direction of travel. In contrast, lane-closure work zones occur on multilane facilities where one or more lanes are closed, requiring motorists to merge, shift lanes, reduce speed, or adjust their car-following behavior as they approach and travel through the activity area [15]. As illustrated in Figure 1, flagging operations rely on alternating directional movements, whereas lane-closure configurations often maintain simultaneous two-directional flow but introduce lane-changing and merging maneuvers that disrupt normal traffic operations.
These operational adjustments fundamentally alter roadway performance by introducing abrupt transitions that generate merging conflicts, unpredictable queues, and speed variability near the work zone entrance [16]. Because these disruptions affect both traffic flow and crash risk, work zone performance should be evaluated from a perspective that jointly considers safety, mobility, and constructability [17]. Safety focuses on reducing crash risk and unsafe vehicle interactions, particularly in areas where unstable merging behavior, abrupt deceleration, speed differentials, and queue propagation occur near lane closures. Several studies have shown that work zones are associated with increased crash risk and that these crashes are not uniformly distributed along roadway corridors [18,19,20]. Consequently, surrogate safety indicators and conflict-based measures are often used to characterize unsafe traffic conditions in areas where merging turbulence, abrupt braking, and vehicle interactions are difficult to evaluate using crash data alone [21,22,23,24].
Mobility focuses on preserving efficient travel through and around the work zone by minimizing delay, stopping frequency, queue length, and spillback [25]. Constructability ensures that construction and maintenance activities can be completed with adequate workspace for crews while minimizing disruption to traffic operations [25]. Balancing these objectives is challenging because lane closures, reduced speeds, and temporary geometric constraints introduce uncertainty and instability into the traffic stream. These conditions often lead to congestion, long queues, merge turbulence, and an increased likelihood of rear-end and merging-related conflicts [26].
Several strategies have been proposed to mitigate these impacts. Work zone information systems can provide advance warning and safety information to motorists approaching the activity area, helping drivers adjust speed and lane position before reaching the bottleneck. Cooperative Intelligent Transportation Systems have also been proposed to reduce bottlenecks near work zone entrances and promote smoother vehicle movement through coordinated traffic operations. However, these strategies do not directly control signal timing at intersections affected by work zone capacity reductions. In signalized work zone environments, the controller must not only serve competing approaches but also regulate the rate at which vehicles are discharged into the reduced-capacity segment.
To address this need, the proposed reinforcement-learning-based framework directly manages traffic movements under the capacity constraints and geometric disruptions associated with active work zones. Rather than relying on pre-programmed phase cycles or reactive detector-based logic, the RL agent continuously observes real-time traffic states, including queue spillback, traffic speed, stop-behavior instability, and merge conflict risk. Based on these observations, the agent iteratively selects signal phase actions that improve traffic operations while reducing unsafe merging interactions. Through a structured trial-and-error learning process, the agent develops adaptive signal timing strategies that minimize congestion and merge-related conflict risk, providing a more responsive and safety-aware alternative to conventional signal control methods.
Implementing this learning process directly in a real-world traffic system is impractical because the exploration phase may create safety concerns, operational disruptions, and severe congestion [27,28]. Therefore, a simulation environment is required to provide a safe and controlled platform for training and evaluation. In this study, the Simulation of Urban Mobility software is used to model the work zone environment and provide a virtual testbed in which the RL agent can interact with realistic traffic conditions under varying demand levels and geometric configurations [29]. This simulation environment enables repeated experimentation, controlled variation of work zone scenarios, and detailed measurement of both operational and safety-related performance metrics, including delay, queue spillback, throughput, stop instability, and merge conflict risk.
2.1. Problem Statement
Figure 2.
Road network showing work zone bottleneck segment.
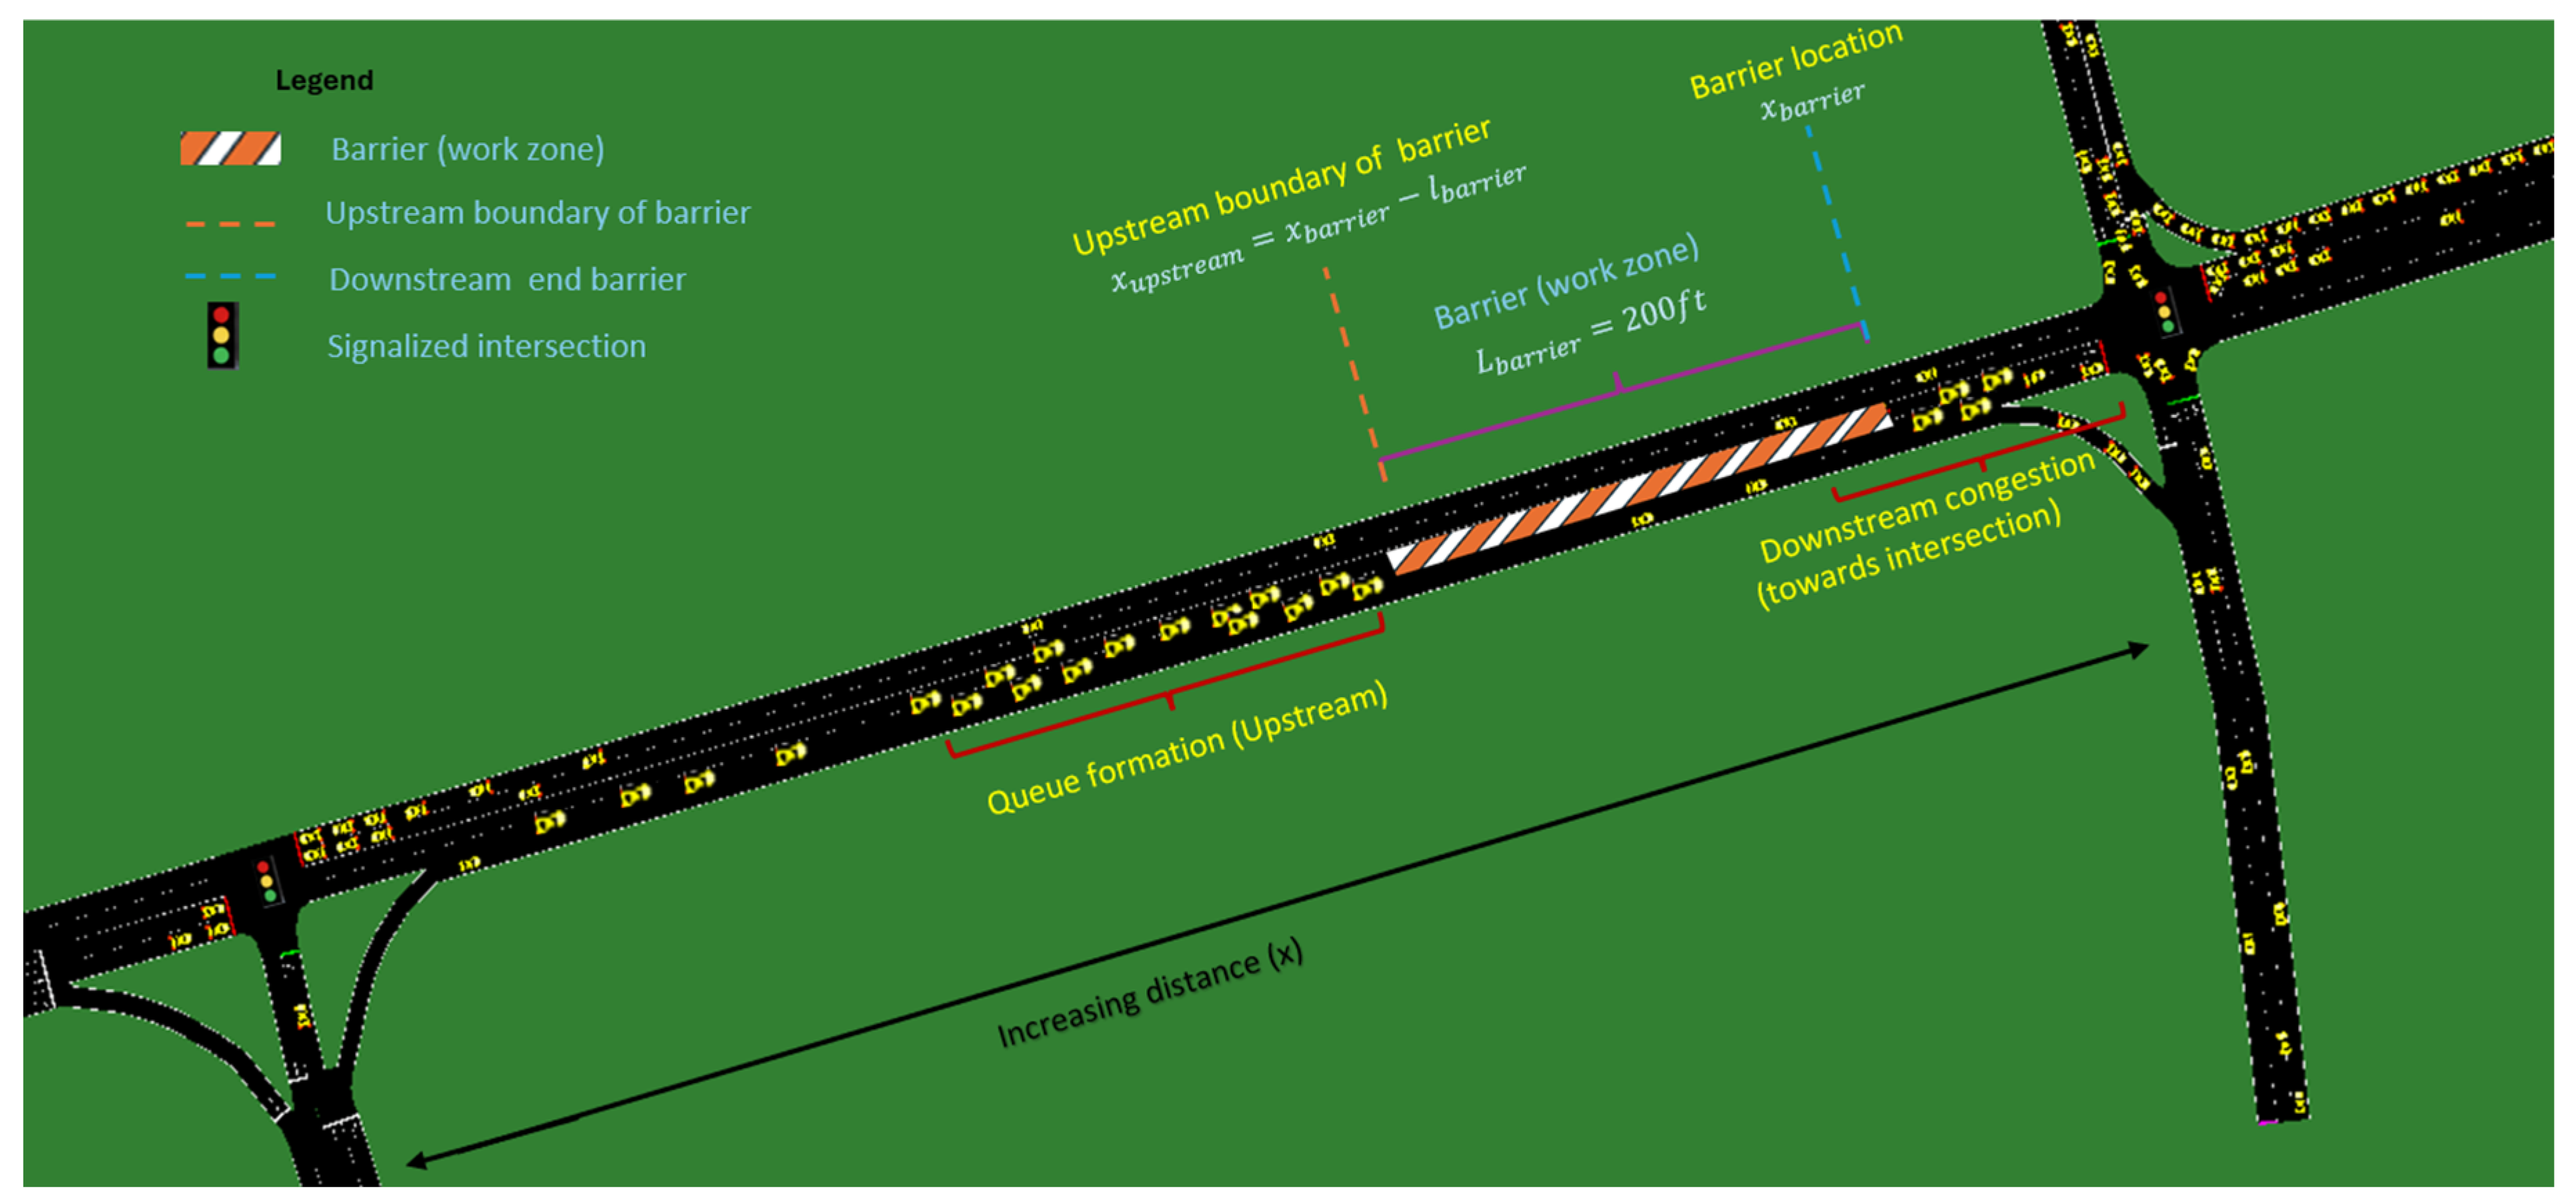
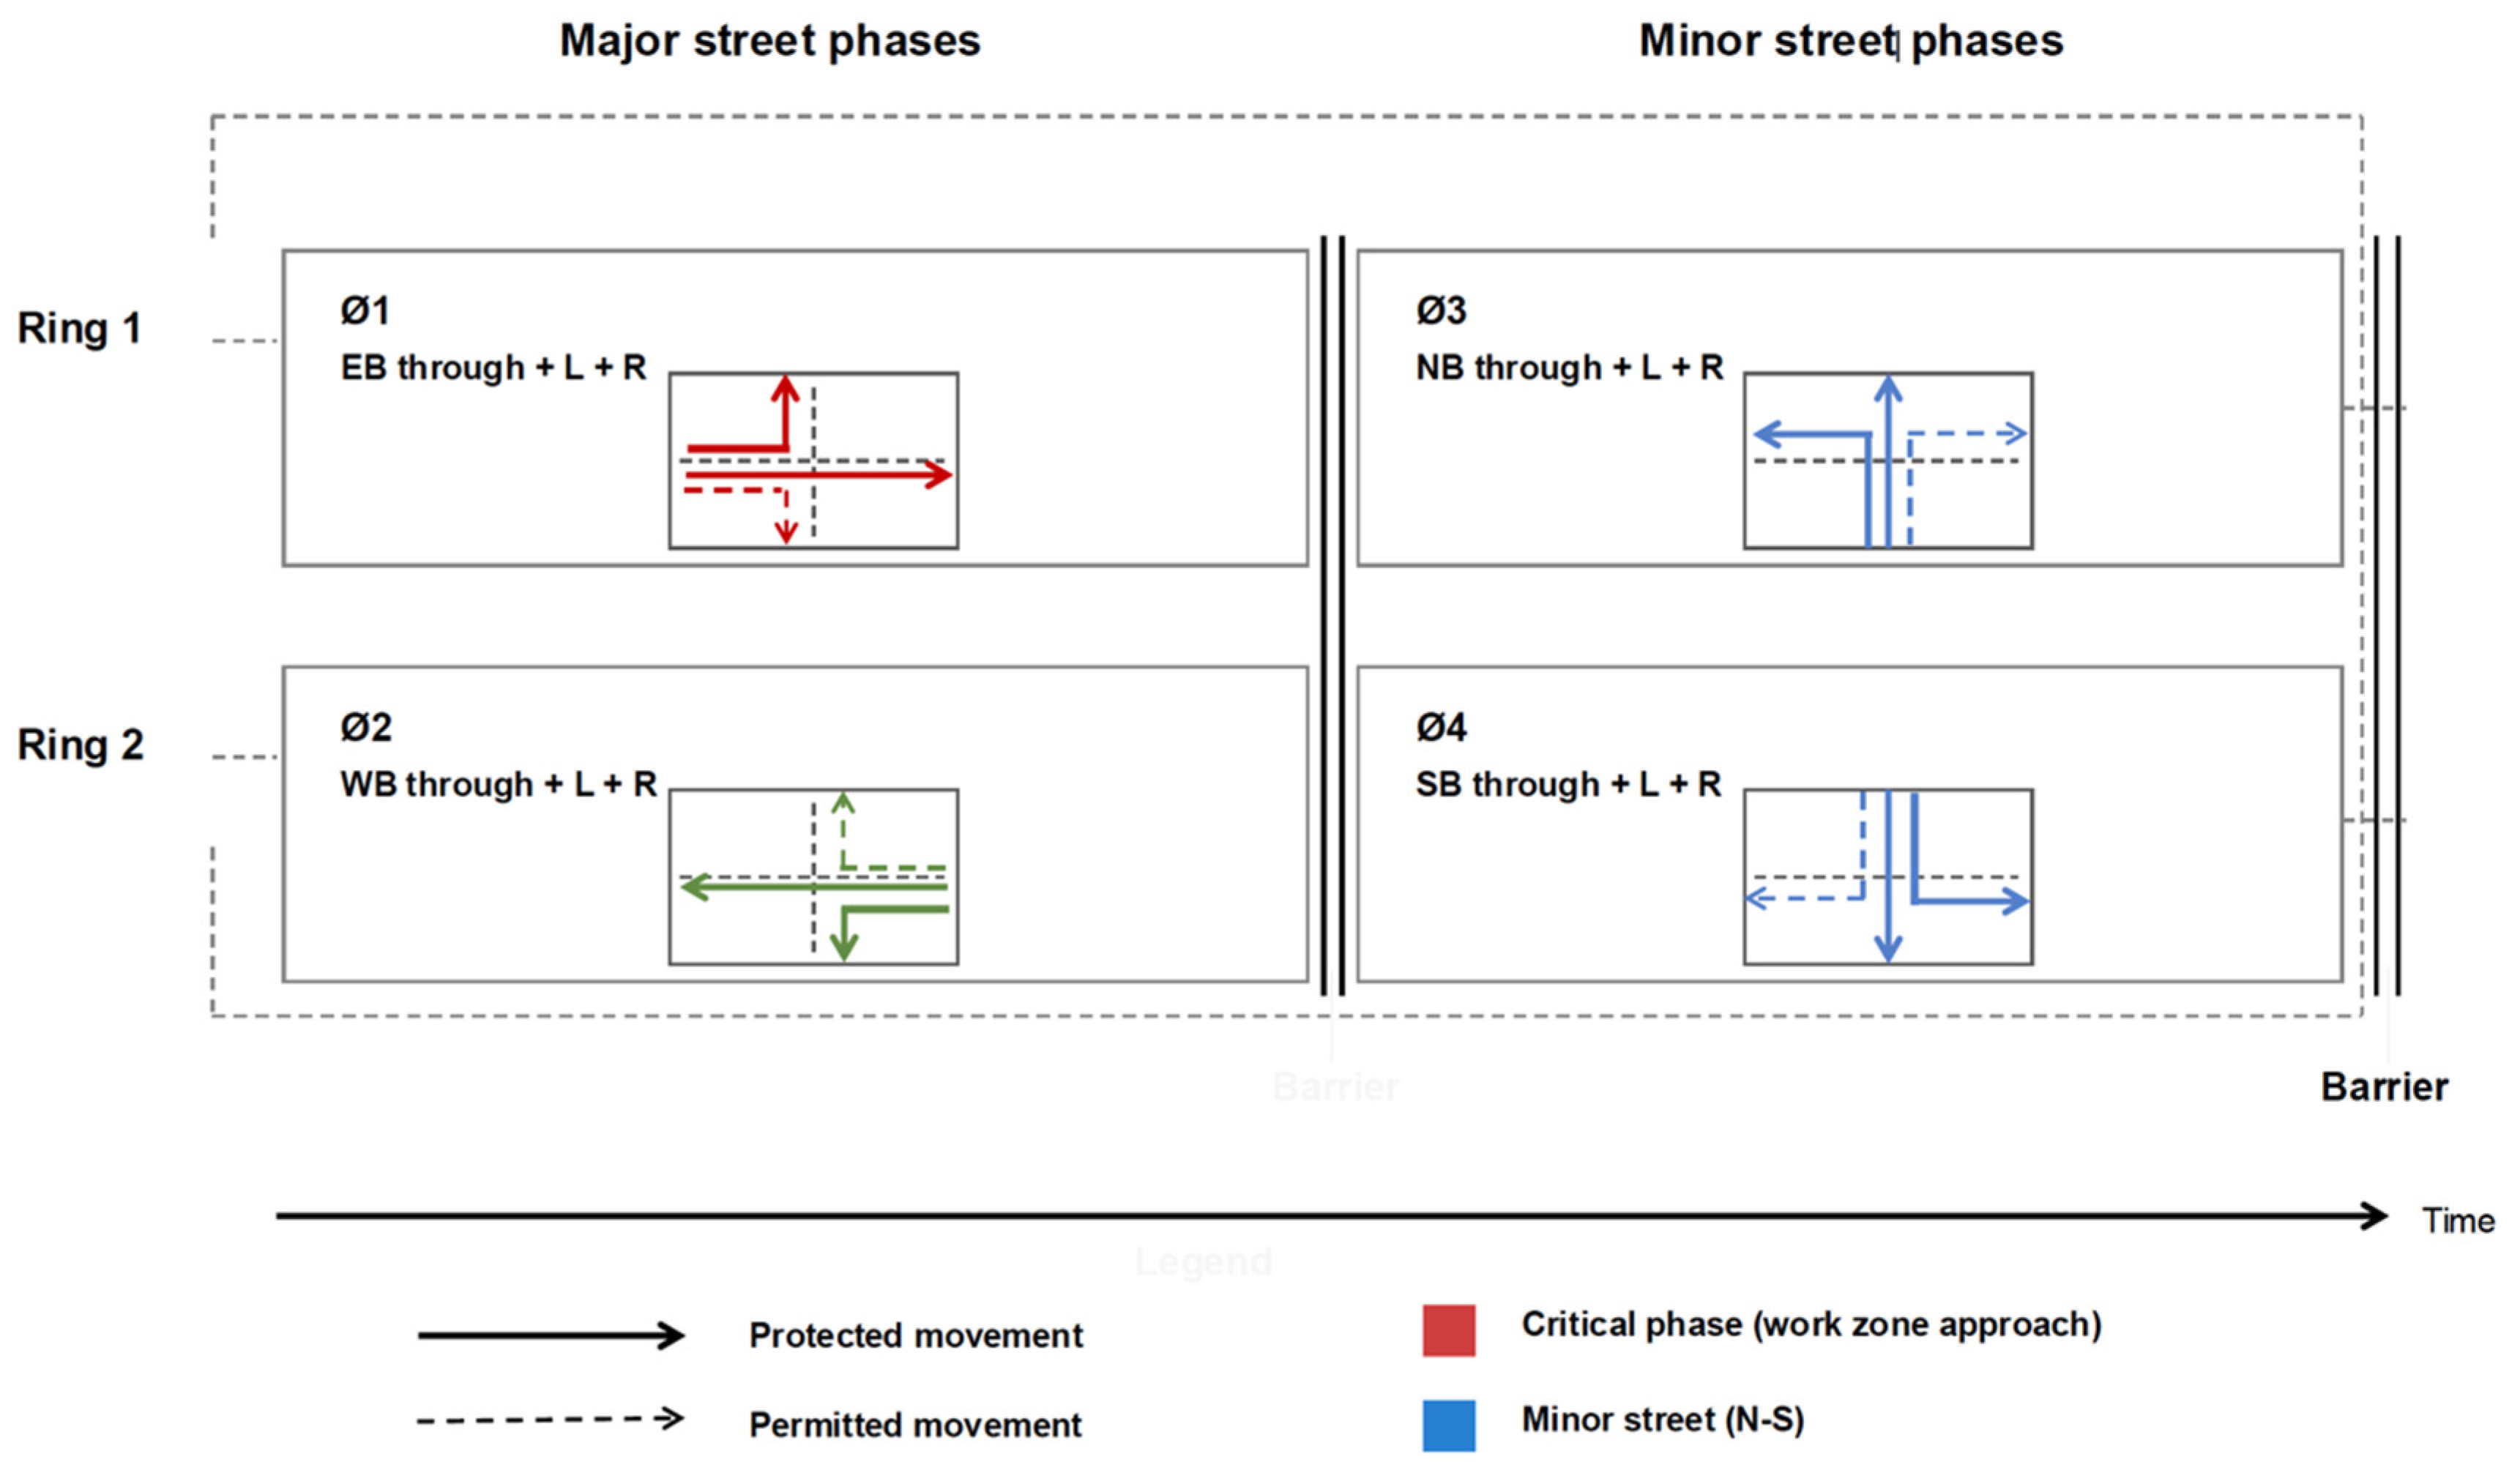
The study network consists of a signalized four-leg intersection with two through lanes per approach and a posted speed limit of 55 mph. A work zone lane closure was introduced approximately 200 ft upstream of the intersection, reducing roadway capacity from two lanes to one lane within the affected segment. The downstream signalized intersection operates under a four-phase split-phasing scheme to accommodate the reduced roadway capacity introduced by the work zone bottleneck on the eastbound (EB) approach. Each phase exclusively serves all traffic movements (through, left-turn, and right-turn) for a single approach: Phase 1 serves eastbound (EB), Phase 2 serves westbound (WB), Phase 3 serves northbound (NB), and Phase 4 serves southbound (SB). Split phasing was adopted instead of the conventional concurrent EB–WB operation because the 200-ft work zone barrier () significantly reduces the available lane capacity through the bottleneck segment. Under these constrained conditions, simultaneous opposing through movements cannot be safely accommodated without introducing operational conflicts and unstable merging interactions near the work zone transition area.
Figure 3.
Ring-barrier phase sequence and movement configuration for the work zone signalized intersection.
Figure 3.
Ring-barrier phase sequence and movement configuration for the work zone signalized intersection.
To represent work zone conditions within the simulation framework, a structured modelling approach is adopted in which roadway disruptions are introduced as controlled obstructions within the traffic stream. The architecture is designed to capture key operational phenomena associated with work zones, including queue formation, speed adaptation, merging behaviour, and downstream congestion propagation. Within this framework, a barrier is introduced to emulate the effects of construction activity or lane closure. The barrier is positioned at a fixed location and remains active throughout the simulation horizon. It has an effective length of , representing the spatial footprint of the work zone. This obstruction modifies vehicle behaviour upstream and downstream, triggering gradual speed reduction, cooperative merging, and congestion buildup as vehicles approach the intersection. The upstream boundary of the barrier is defined as:
This formulation allows the obstruction region to be explicitly defined along the road with marking the upstream limit and marking the downstream limit of the blocked segment.
At each iteration, the simulation evaluates all vehicles approaching the blocked lane. The queue tail position, , is defined as:
where and denote the position and speed of vehicle , respectively, and is a predefined speed threshold used to identify queued vehicles. The condition ensures that only vehicles upstream of the barrier are considered. The minimum operator selects the smallest position value, corresponding to the most upstream vehicle in the queue. Therefore, represents the upstream extent of the queue and provides a dynamic measure of queue growth, which can be used to quantify congestion severity around the work zone.
2.2. Multi-Stage Driver Behaviour Before the Work Zone
To realistically model driver responses near the work zone lane closure, a multi-stage behavioral framework was implemented in SUMO based on the distance between each vehicle and the work zone barrier. Let
where denotes the longitudinal distance between vehicle and the work zone barrier, is the barrier location, and is the position of vehicle . Vehicles entering the 200-ft queue formation region gradually decelerate to 10 ft/s to promote orderly queue development. Within the 170-ft cooperative merge region, vehicles are encouraged to perform zipper-merging maneuvers while maintaining a target speed of 20 ft/s. Vehicles remaining in the closing lane within 20 ft of the barrier are assigned a forced merge command and reduced to 10 ft/s to prevent deadlock. After passing the blockage, vehicles enter a 90-ft post-merge region where speeds are limited to 35 ft/s to represent residual congestion and shockwave effects. This framework enables realistic simulation of queue formation, cooperative merging, forced merging, and post-work zone traffic turbulence. Temporary geometric changes and fluctuating demand patterns create non-stationary traffic conditions that challenge traditional signal-control strategies [30]. Fixed-time controllers, for example, rely on predetermined timing plans that cannot adapt to rapidly changing conditions such as sudden queue formation near the taper or unexpected surges in demand caused by lane closures [30]. Fully actuated controllers also struggle because they depend exclusively on detector actuations, which often become unreliable in work zones due to shifted lanes, misalignment of detection zones, slow-moving queues that mimic gaps, or vehicles traveling outside normal detection paths [30]. As a result, actuated controllers may terminate phases prematurely, extend phases unnecessarily, or fail to regulate inflow into a reduced-capacity zone [31]. Most critically, these conventional control strategies optimize primarily for mobility and do not incorporate safety-related indicators such as TTC, speed variance, shockwave development, or turbulence in merging areas [31]. Studies have emphasized that traditional signal strategies cannot adapt to sudden work zone turbulence and consistently overlook real-time safety indicators such as potential spillback or rapidly deteriorating speed conditions [32]. Given that work zones introduce operational disruptions, and traditional signal-control systems cannot effectively manage the resulting instabilities, a reinforcement-learning with a safety-aware learning objective based adaptive signal control system provides a promising alternative for improving work zone performance. The next section presents the architecture of the RL framework and describes how it is integrated within the SUMO microsimulation environment to evaluate its effectiveness under realistic work zone conditions.
3. Reinforcement Learning
Reinforcement learning is a trial-and-error learning framework in which an agent interacts with an environment and learns to make decisions by receiving rewards or penalties based on its actions [33]. Traditional reinforcement learning methods often struggle in complex environments because of large state-action spaces and high-dimensional data. To address these limitations, Deep Reinforcement Learning (DRL) was introduced by integrating traditional reinforcement learning with deep neural networks to approximate complex nonlinear relationships between dynamic environments and control actions [32]. In this study, a DQN framework was used to approximate the optimal action-value function . The DQN consists of an online Q-network for learning and action selection, and a target Q-network that stabilizes training by periodically updating the target values. The network architecture contains fully connected hidden layers and ReLU activation functions, followed by an output layer corresponding to the discrete signal-control action space. The network learns by minimizing the temporal-difference loss between predicted Q-values and Bellman target values. To improve training stability, experience replay is used, where traffic interactions are stored in a replay memory and randomly sampled during training. This approach enables the model to learn stable and efficient traffic signal control policies under dynamic work zone traffic conditions. In this study, the proposed Deep Q-Network (DQN) employs a fully connected feed-forward neural network consisting of two hidden layers with 128 neurons each and Rectified Linear Unit (ReLU) activation functions. The input layer receives the state vector comprising accumulated waiting time, work zone spillback length, average traffic speed, stop-behavior instability, merge conflict risk, and current signal phase information. The output layer contains two neurons corresponding to the available signal-control actions: maintaining the current signal phase or switching to the next phase.
3.1. State Representation
The state space represents the current traffic condition of the work zone environment at time , including the key traffic features required for adaptive signal control and merge-risk evaluation. The state space is composed of traffic operational variables, merge instability indicators, and signal phase information, as given in Equation (4).
where represents the accumulated waiting time, is the upstream work zone queue spillback length, denotes the average traffic speed, represents the stop-behavior instability term, is the merge conflict risk, and represents the current signal phase.
The state transition process is represented as
where denotes the signal control action selected by the DQN agent at time . The traffic environment evolves dynamically based on the selected signal phase and prevailing traffic conditions. The accumulated waiting time acts as a congestion indicator representing vehicle delay within the network. The spillback term captures upstream queue propagation caused by the work zone lane closure and reflects the severity of congestion near the blocked section. The average speed represents the overall traffic mobility condition within the corridor. The stop-behavior instability term captures stop-and-go traffic conditions generated by repeated vehicle stopping and low-speed operations near the merge region. The merge conflict risk term represents the interaction instability between merging vehicles and surrounding traffic using relative spacing, relative speed, and acceleration behavior. This term allows the model to represent unsafe merging conditions within the work zone environment. The signal phase variable provides the current intersection control state and enables the agent to learn phase-dependent traffic dynamics during training. The selected state variables provide a compact representation of both operational efficiency and merging safety while maintaining a manageable state dimension for stable DQN training.

Table 1.
State Representation and Feature Definitions for the RL Agent.
| Feature | Symbol | Source/Derivation | Normalization | Meaning |
|---|---|---|---|---|
| Accumulated waiting time | Sum of vehicle waiting times across controlled lanes | Min–max normalization | Represents overall vehicle delay and congestion severity | |
| Work zone spillback length | Queue length measured upstream of the lane closure | Min–max normalization | Captures upstream queue propagation caused by the work zone blockage | |
| Average traffic speed | Mean vehicle speed across controlled lanes | Normalized by free-flow speed | Represents traffic mobility and flow efficiency | |
| Stop-behavior instability | Computed from stopped vehicles and average lane speed | Min–max normalization | Captures stop-and-go turbulence near the merge region | |
| Merge conflict risk | Computed from merge interaction instability and conflict probabilities | Min–max normalization | Represents unsafe merging interactions and rear-end conflict potential | |
| Signal phase | Traffic signal controller state | One-hot encoding | Provides phase awareness for adaptive signal control |
3.2. Action Definition and Strategy
The action space of the proposed reinforcement learning agent consists of selecting the active traffic signal phase at the controlled intersection. Let denote the set of all signal phases, where is the total number of feasible phases. At each decision time step , the agent selects an action , which corresponds to activating a particular green phase that serves a specific set of traffic movements. The decision interval is defined by seconds. If the agent repeatedly selects the same action in successive decision steps, the current green phase is extended by another seconds. Conversely, if a different action is selected, the environment automatically initiates a yellow transition period before switching to the new green phase. Consequently, the agent does not explicitly set the green duration; instead, it implicitly learns the optimal green time allocation by deciding whether to maintain or change the active phase based on prevailing traffic conditions.
3.3. Reward Definition
The reward function guides the DQN agent in selecting signal control actions that improve traffic operations and reduce unsafe merging interactions within the work zone environment. The reward function is designed to minimize upstream spillback, reduce merge conflict risk, suppress stop-and-go instability, and maintain stable traffic flow through the work zone corridor. The reward at time is given in Equation (6).
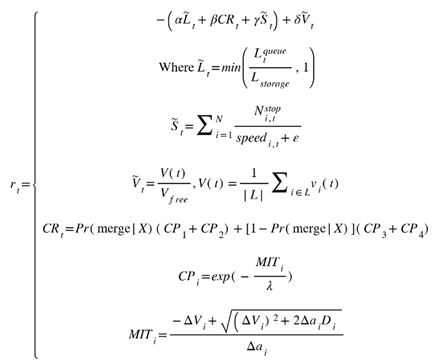
Where represents the normalized upstream work zone spillback length, represents the merge conflict risk, represents stop-and-go instability, and represents the normalized average traffic speed. The parameters , , , and are tunable weights controlling the relative importance of each objective.
The spillback term penalizes excessive upstream queue propagation toward the work zone blockage. The stop-behavior instability term captures unstable stop-and-go conditions caused by repeated vehicle stopping and low-speed operations near the merge region. The speed term rewards sustained traffic through the work zone corridor. The merge conflict risk term is based on the interaction instability between merging vehicles and surrounding traffic. The framework evaluates vehicle interactions using relative spacing, relative speed, and acceleration behavior between surrounding vehicles to characterize unsafe merging conditions. Four interaction scenarios are considered, including conflicts with the preceding vehicle in the closing lane, the following vehicle in the closing lane, the leading vehicle in the open target lane, and the lagging vehicle in the open target lane. The conflict probability associated with each interaction is represented by , while denotes the Merge Instability Time for interaction scenario . Smaller MIT values indicate more unstable vehicle interactions and produce larger conflict probabilities. In the work zone environment, represents the spacing distance between the subject merging vehicle and the surrounding interacting vehicle involved in interaction scenario
3.4. Pareto Weight and Policy Evaluation
Although scalarization enables the application of standard DQN training, the traffic signal control problem remains inherently multi-objective. Different Pareto weight vectors w induces different trade-offs between efficiency and safety objectives and therefore lead to qualitatively different policies. During training, a set of weight vectors is randomly sampled and used to scalarize multiple conflicting objectives such as waiting time, queue length, speed, pressure, merge conflict risk, and work zone queue length into a single reward function [33]. Rather than manually selecting a single weight configuration, multiple weight vectors are sampled to systematically explore the trade-off surface. For each sampled vector, an independent DQN policy is trained using the corresponding scalarized reward. After training, each objective vector for a policy is evaluated using multiple separate performance metrics (delay, speed, safety, etc.), forming a vector that captures trade-offs as shown in Equation (7).
Instead of using one combined value, the analysis looks at all the objectives separately. This is because a single combined value depends on how the weights are chosen, and different weights can make results hard to compare. By looking at each objective individually, it becomes easier to understand the real trade-offs, such as the balance between speed, delay, and safety. Pareto dominance is defined as a policy which is said to dominate another policy if
And
after converting maximization objectives into equivalent minimization form. The Pareto-optimal set (P) is then defined as
where no other policy dominates any member of
This set in the objective space forms the Pareto front which consist of non-dominated traffic signal control policies, where each policy represents a different balance between efficiency and safety [33]. Instead of relying on manually chosen reward weights, the proposed approach clearly shows how improving one objective may affect others. This makes it easier to understand the trade-offs and allows decision-makers to choose a policy based on specific needs, such as improving safety near work zones or increasing traffic flow during congestion. Algorithm 1 presents the pseudocode for the proposed Pareto-based DQN training algorithm implemented in this study.
Figure 4 presents the overall training framework of the proposed Pareto-based Deep Q-Network (DQN) adaptive signal control system for work zone traffic management. The framework begins by iterating through different reward-weight vectors to represent varying operational and safety preferences within the multi-objective optimization process. For each weight vector, the DQN environment is initialized with the online Q-network, target network, and replay memory buffer. At the beginning of each training episode, the traffic state is initialized and the agent continuously interacts with the SUMO traffic environment over multiple time steps. At each decision step, the agent selects an action using the ε-greedy exploration strategy. With probability , a random action is selected to encourage exploration, while with probability , the action with the maximum estimated Q-value is selected using the online network. The selected signal control action is then executed within the traffic environment, after which the agent observes the next traffic state and computes the reward based on the proposed multi-objective reward formulation. The transition is subsequently stored in the replay memory buffer. Once sufficient experiences are collected, random mini-batches are sampled from the replay memory to train the online Q-network. The target Q-values are computed using the target network, and the temporal-difference loss is minimized to update the online network parameters. Periodically, the target network parameters are synchronized with the online network to stabilize training and reduce oscillatory learning behavior.
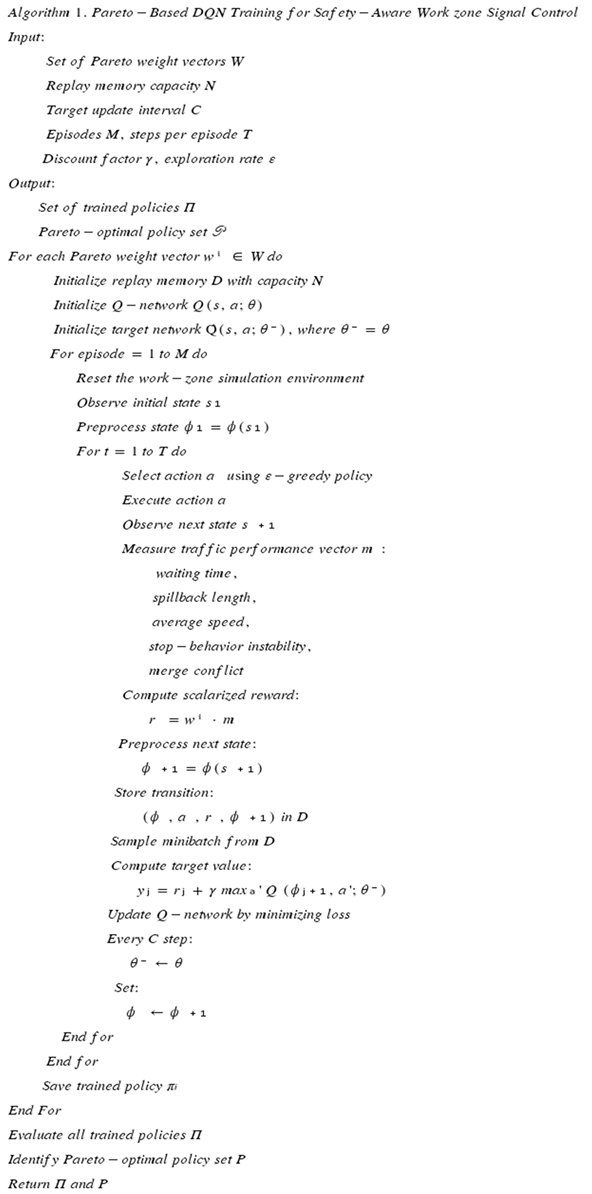
After completing all training episodes for a particular reward-weight configuration, the trained policy performance is evaluated and stored. The framework then proceeds to the next reward-weight vector until all candidate policies are generated. Finally, Pareto analysis is performed on the trained policies to identify non-dominated solutions that provide balanced trade-offs between work zone spillback mitigation, merge conflict reduction, stop-behavior stability, and traffic mobility performance.
3.5. Shock Wave Analysis
Shockwave theory provides a macroscopic framework for analyzing the formation, propagation, and dissipation of traffic congestion along a roadway segment [34,35]. In work zone environments, temporary lane closures and reduced roadway capacity often create abrupt traffic disturbances that generate congestion waves and upstream queue propagation [36]. These traffic shockwaves can be represented using the Rankine–Hugoniot condition, which defines the shockwave speed as:
where represents traffic flow and represents traffic density between two traffic states. Negative shockwave speeds indicate upstream queue propagation, while positive values represent downstream movement [38]. Within the work zone signal-control framework, shockwave analysis is used to characterize queue growth and queue dissipation during red and green signal phases. During queue formation, vehicles decelerate and accumulate upstream of the work zone blockage, producing backward-propagating congestion waves. During queue dissipation, vehicles accelerate and discharge through the work zone merge region, generating clearing shockwaves that describe the recovery of traffic flow [39]. The resulting shockwave trajectories provide a simplified representation of congestion evolution and spillback behavior within the work zone corridor.
3.6. Data Preprocessing
The proposed reinforcement-learning framework was trained and evaluated using traffic states generated within the SUMO microscopic traffic simulation environment. The simulated network represents a signalized urban intersection operating under work zone lane-closure conditions. Traffic measurements including vehicle counts, average speed, queue length, accumulated waiting time, spillback length, and signal phase status were collected through the TraCI interface at one-second intervals during each simulation episode.
Prior to training, continuous traffic variables were normalized using min–max scaling to improve numerical stability and prevent feature dominance within the learning process. Average speed was normalized relative to the free-flow speed, while signal phase information was encoded using one-hot representation. State variables including accumulated waiting time, upstream spillback length, average speed, stop-behavior instability, and merge conflict risk were extracted from the simulated traffic stream. The spillback metric was derived from upstream queue propagation near the lane closure, while stop-behavior instability was estimated using stopped-vehicle counts and lane-average speed conditions. Merge conflict risk was computed from relative spacing, relative speed, and acceleration characteristics of vehicles within the work zone merge area.
Exploratory analysis of the simulated traffic states was conducted to evaluate congestion formation, queue propagation, speed variation, and stop-and-go behavior under different demand conditions. These variables were subsequently integrated into a compact state-space representation that captures both operational efficiency and safety-related traffic dynamics. The resulting state representation provides the input to the DQN agent for adaptive signal-control decision making under dynamic work zone conditions.
3.7. Simulation Experiments
All experiments were implemented in Python and executed on an ASUS ROG workstation equipped with an Intel Core i9 processor, 32 GB RAM, and an NVIDIA GeForce RTX 2080 GPU. The simulation environment was developed using Eclipse SUMO Version 1.12.0 and interfaced with the reinforcement learning framework through the TraCI Python API to enable real-time interaction between the learning agent and the traffic network. All experiments were conducted using one-second simulation intervals under microscopic traffic simulation conditions. The simulation environment is interfaced with the learning algorithm through SUMO’s TraCI Python API, which allows real-time communication between the controller and the traffic network. Through this interface, the reinforcement learning agent continuously observes the evolving traffic state, selects signal control actions, and applies phase changes dynamically during simulation execution. The traffic network is constructed to represent a signalized intersection corridor that includes a dedicated work zone segment. The work zone is explicitly embedded within the SUMO network by modifying lane attributes and operational parameters of the affected roadway segment.
These structural and operational modifications reduce the effective discharge rate of the segment, thereby creating a bottleneck that limits downstream throughput. As traffic demand approaches or exceeds this reduced service capability, vehicles accumulate upstream of the work zone, producing realistic queue formation, spillback, and congestion propagation patterns that the learning agent must manage. Traffic demand is defined through route files specifying vehicle arrival patterns over the simulation horizon. The demand profile is designed to generate sustained congestion near the bottleneck, ensuring that the control problem reflects recurrent work zone traffic conditions rather than uncongested flow. The simulation advances in discrete one-second intervals, and each episode corresponds to a complete one-hour simulation rollout, resulting in 3,600 interaction steps per episode. At every time step, the environment progresses forward, traffic measurements are collected via TraCI, the agent selects a signal phase according to its current policy, and the selected control action is implemented within the simulator. After the final step of the episode is reached, the environment is reset and training proceeds to the next episode. The state representation supplied to the learning algorithm is constructed from real-time traffic measurements extracted from SUMO. These include vehicle counts, lane occupancies, queue lengths, and average speeds on incoming approaches. These variables characterize the instantaneous traffic condition both upstream and downstream of the work zone, allowing the agent to detect congestion buildup, discharge dynamics, and spillback effects.
The action space consists of feasible traffic signal phases at the controlled intersection. When a new phase is selected, built-in transition constraints such as fixed yellow intervals are automatically enforced by the traffic light logic to ensure realistic and safe signal operation. Consequently, the agent selects among admissible green phases while clearance intervals are handled internally by the simulator. All controllers evaluated in the study operate under identical state definitions, action spaces, and control frequencies to ensure a fair and consistent performance comparison. A fully actuated signal controller was implemented using detector-based phase extension logic available within the SUMO simulation environment. The controller dynamically adjusted green phase durations based on real-time vehicle detections and queue presence on each approach. Phase extensions were triggered when vehicles continued to be detected within the active approach, while phase termination occurred when detector occupancy dropped below the specified threshold or when maximum green limits were reached. This benchmark controller was included to evaluate the effectiveness of the proposed DQN framework against conventional detector-based adaptive signal control strategies commonly used in practice.
Since the lane configuration is modified to represent a work zone environment, congestion develops naturally when inflow exceeds the reduced discharge capacity of the segment. This modeling approach captures nonlinear vehicle interactions, realistic queue spillback, and recovery dynamics, thereby enabling the reinforcement learning controller to be evaluated under operational conditions that closely resemble real-world work zone traffic scenarios [40,41]. The values for the Hyperparameters selected for the RL algorithm are explained below.
Table 2.
Values for Selected Hyperparameters.
| Hyperparameter | Symbol | Value |
|---|---|---|
| Learning rate | α | 0.001 |
| Discount factor | γ | 0.99 |
| Replay buffer size | 100,000 | |
| Mini-batch size | B | 64 |
| Target network update frequency | τ update | 1000 steps |
| Exploration rate (initial) | ε₀ | 1.0 |
| Exploration rate (minimum) | ε min | 0.01 |
| Exploration decay rate | λ ε | 0.995 |
| Number of training episodes | N ep | 500 |
| Maximum steps per episode | T max | 3600 |
| Hidden layer size | H | 128 neurons |
| Optimizer | – | Adam |
| Activation function | – | ReLU |
4. Experiment Results
4.1. Reward Convergence During Training
Figure 5 illustrates the evolution of the reward values during the training process of the reinforcement learning controller under multiple Pareto weight configurations. At the beginning of training, the reward values are relatively low and exhibit sharp fluctuations. This behavior occurs because the agent is still exploring the environment and has not yet learned effective signal control strategies for managing traffic flow near the work zone. As training progresses, the reward values increase rapidly during the early learning phase (approximately the first 10,000 - 20,000 training steps), indicating that the agent quickly discovers improved policies for signal phase selection. After this initial learning period, the reward curves begin to stabilize, although moderate fluctuations remain due to the stochastic nature of the traffic environment and the continued exploration mechanism of the ε-greedy policy. Different curves correspond to different Pareto weight vectors used to scalarize the multi-objective reward function. As expected, each weight configuration converges to a different reward level because it prioritizes different objectives such as waiting time reduction, queue mitigation, speed maximization, safety conflict reduction, or work zone spillback prevention. Despite these differences, most reward trajectories show a clear upward trend followed by convergence, demonstrating that the reinforcement learning agent successfully learns effective traffic signal control strategies over time. The stable plateau observed in the later training stages indicates that the learned policies have reached near-convergence and can maintain consistent performance under the simulated work zone traffic conditions.
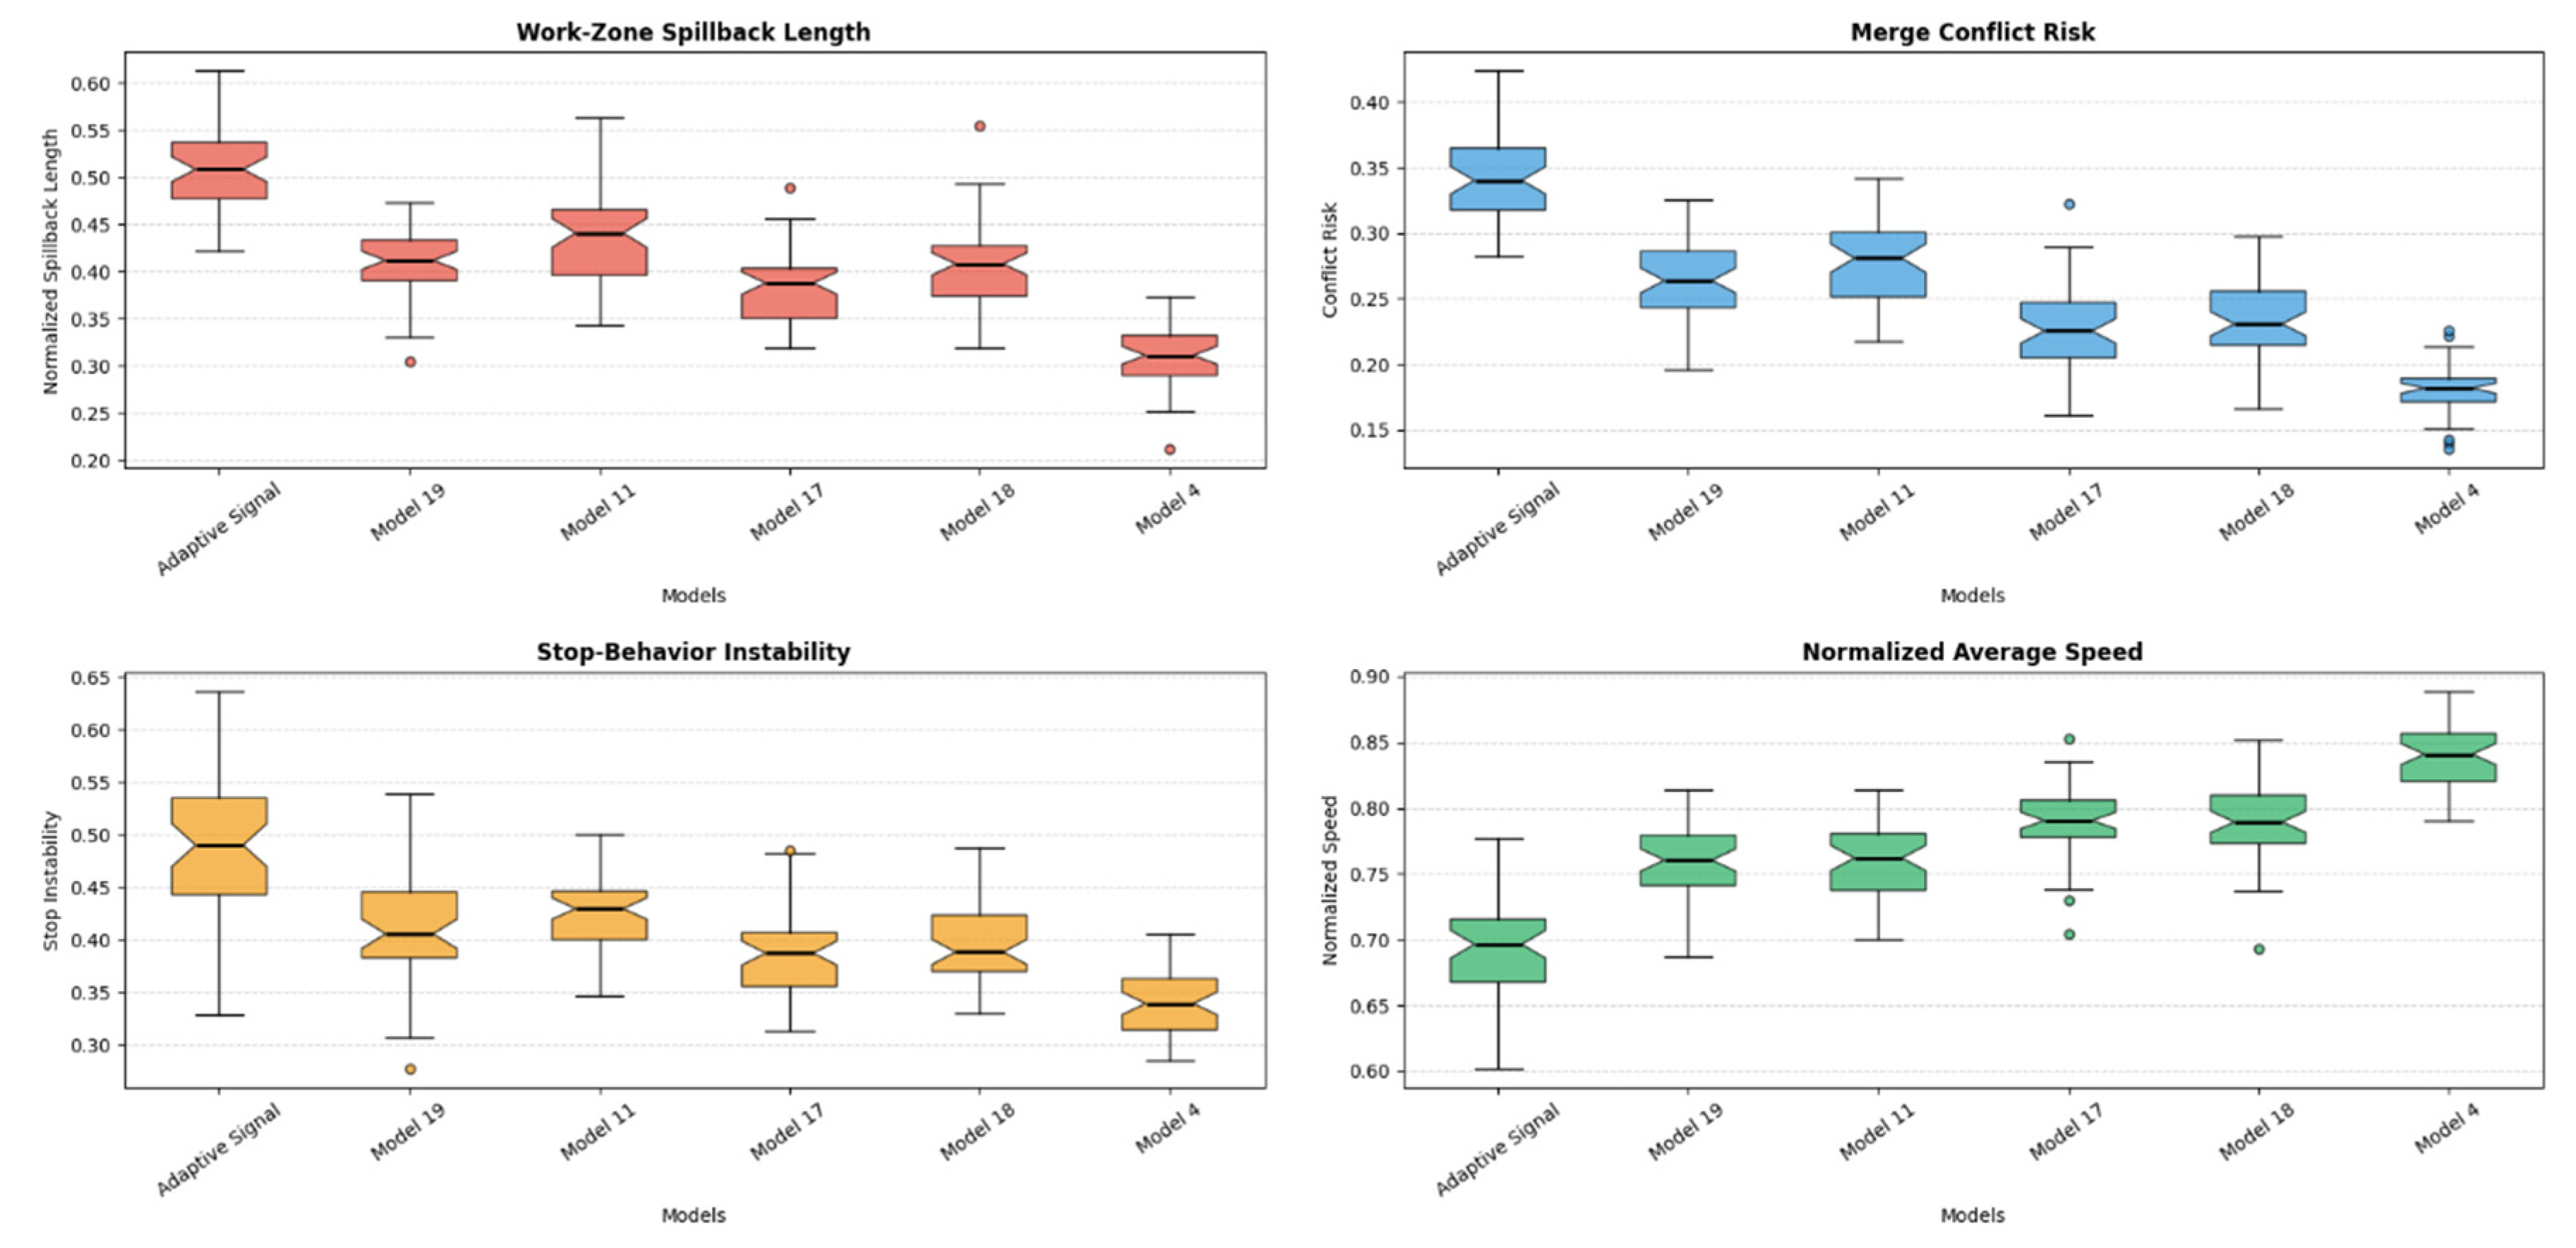
Figure 5 presents the distribution of the reward-function components across the evaluated signal-control models, including the adaptive signal control baseline and the trained DQN policies. The boxplots illustrate the variability of the operational and safety-related metrics over repeated simulation episodes. Lower values of work zone spillback length, merge conflict risk, and stop-behavior instability indicate improved operational stability and safer traffic conditions, while higher normalized average speed values indicate improved mobility performance. Among all evaluated models, Model 4 consistently achieved the best overall performance. Specifically, Model 4 produced the lowest spillback propagation, lowest merge conflict risk, and lowest stop-instability levels while simultaneously maintaining the highest normalized average speed. These results indicate that the proposed DQN policy effectively balanced traffic mobility and safety under dynamically changing work zone conditions. In contrast, the adaptive signal control baseline exhibited the highest variability and poorest performance across most reward-function components, suggesting reduced adaptability under unstable work zone traffic conditions.
Table 3 summarizes the throughput efficiency analysis across different vehicle types for all evaluated models. Performance evaluation revealed that the RL-based signal-control policies consistently achieved higher throughput than the default signal timing strategy across cars, trucks, buses, and mixed traffic conditions. Among the evaluated models, Model 4 achieved the highest throughput across all vehicle categories, recording vehicles for cars, for trucks, for buses, and under mixed-traffic conditions. Significant improvements were observed particularly for trucks and buses, where work zone capacity reductions and unstable merging behaviour typically create severe operational disruptions. The improved performance of the RL-based models can be attributed to their ability to dynamically regulate inflow into the work zone region while reducing spillback propagation, stop-and-go instability, and unsafe merging interactions. Unlike the default signal timing strategy, which operates using fixed phase sequences, the DQN-based models continuously adapt signal timings using real-time traffic states, allowing them to maintain more stable traffic movement under varying vehicle compositions and work zone operating conditions.
Figure 6.
Reward function component comparison across signal control models.
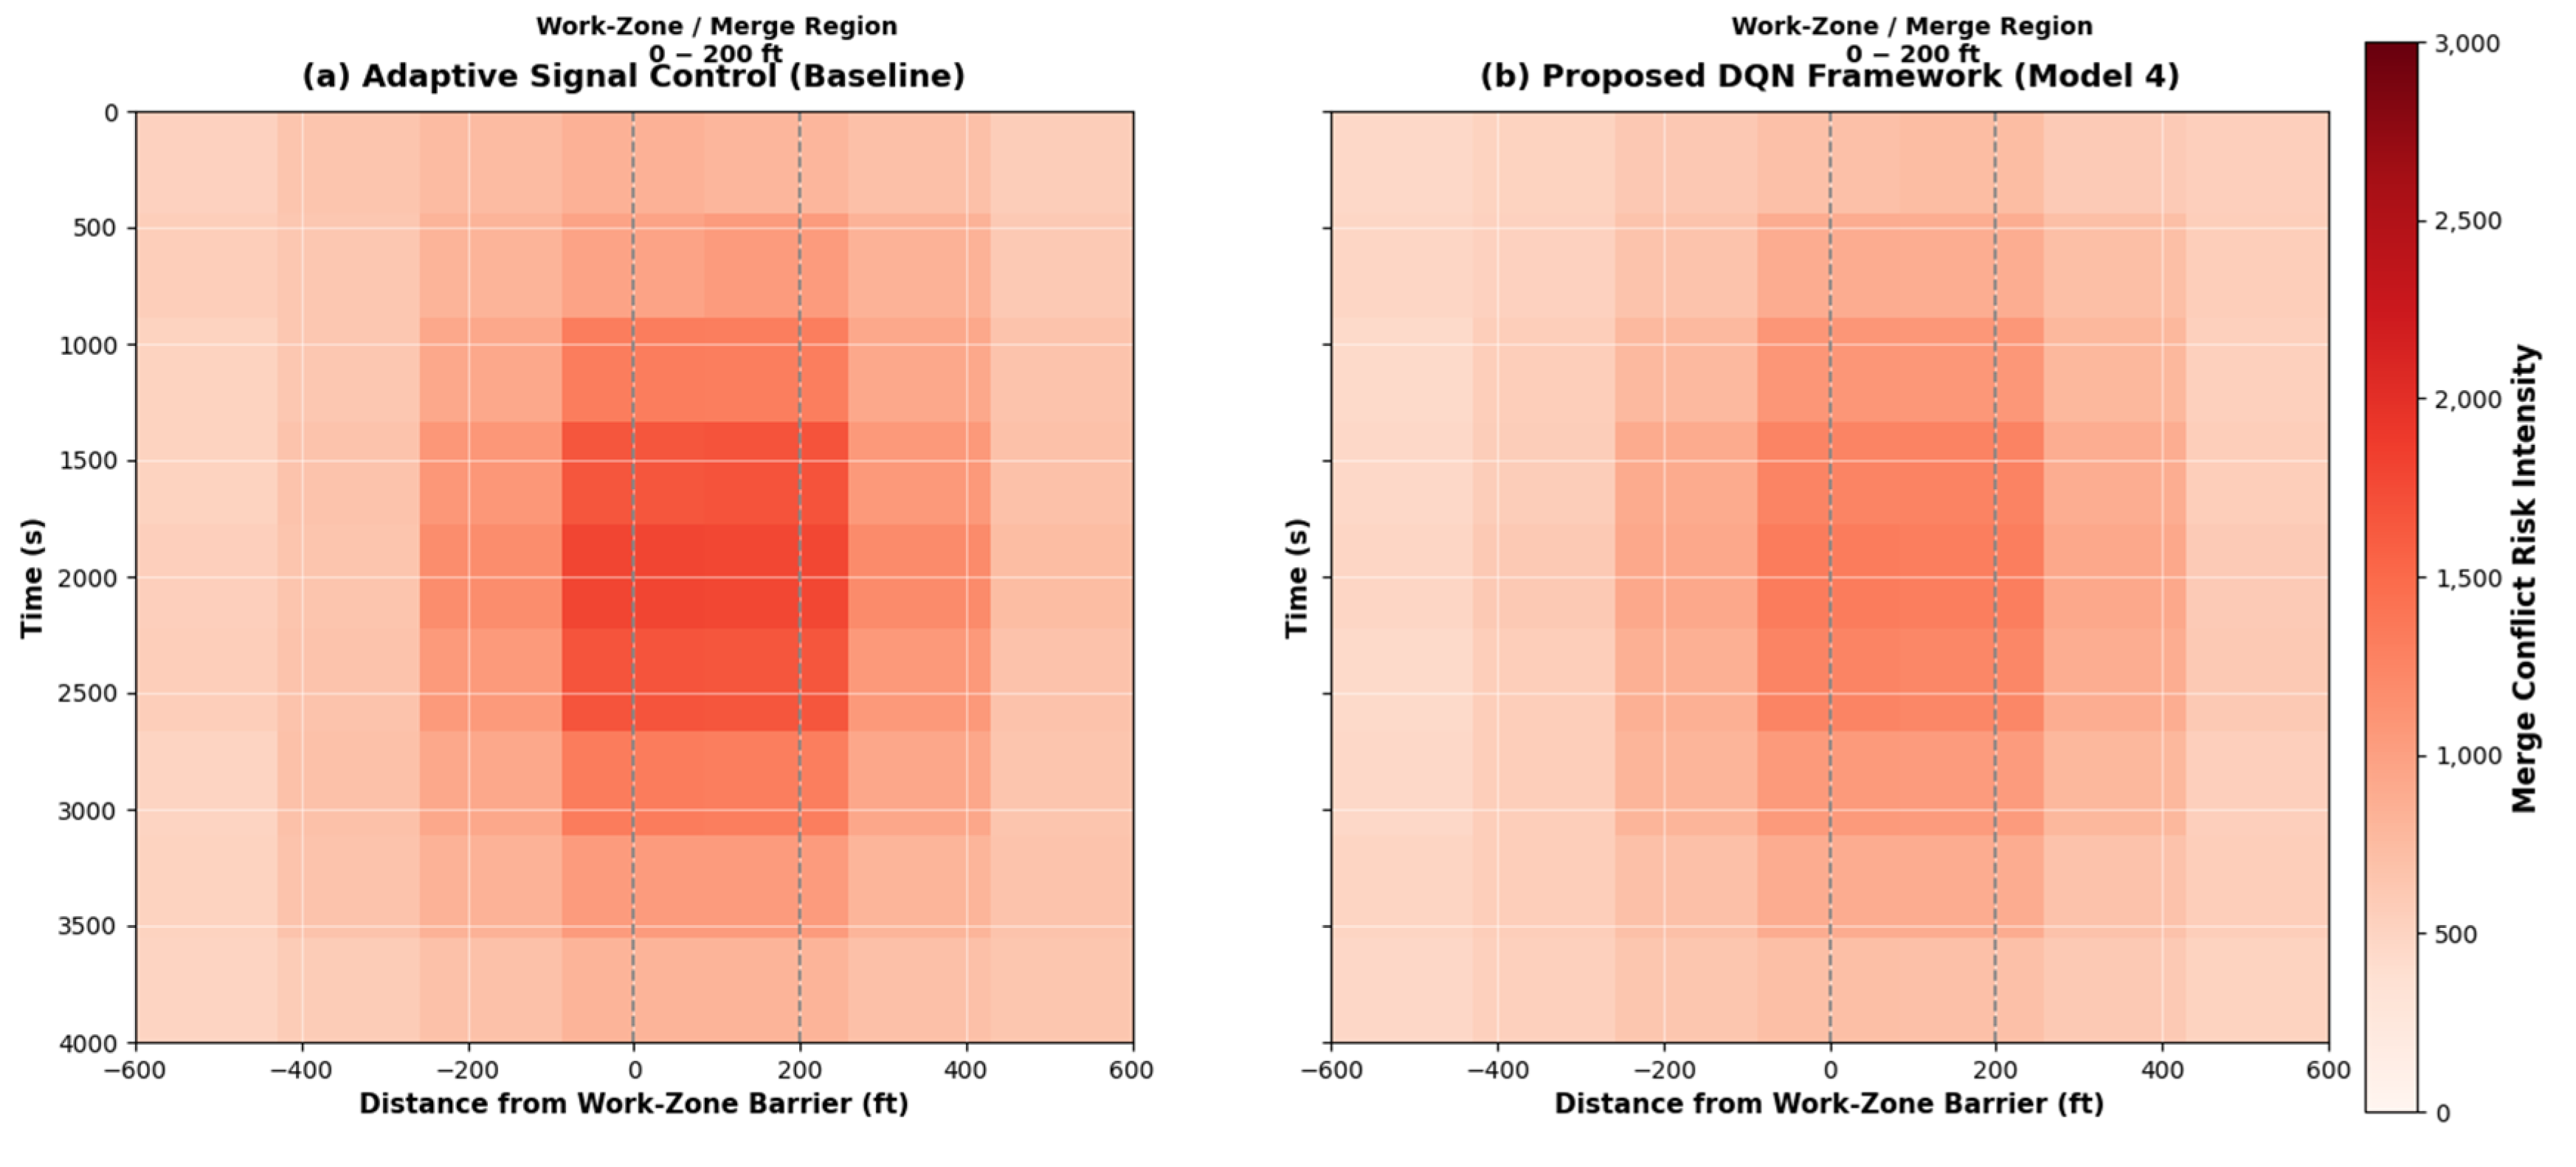
A two-tailed independent t-test was conducted as shown in Table 4 to evaluate the statistical significance of throughput improvements achieved by the proposed reinforcement-learning signal control policies relative to the default signal timing strategy. The analysis indicates that all RL-based controllers significantly improved throughput across all vehicle categories. The largest improvements were consistently observed for Model 4, which increased throughput by 24.6%, 32.7%, 37.3%, and 29.7% for cars, trucks, buses, and mixed traffic conditions, respectively. The corresponding p-values were below 0.001 for all comparisons, indicating strong statistical significance. Furthermore, Cohen’s d values ranged from 0.53 to 1.29, demonstrating moderate-to-large practical effect sizes. These results confirm that the observed throughput gains are unlikely to have occurred due to random simulation variability and support the effectiveness of the proposed safety-aware DQN framework in improving work zone traffic operations under heterogeneous traffic compositions.
Figure 7.
Pareto Optimal Weights.
A total of 20 reinforcement learning policies were trained using randomly sampled reward-weight vectors to represent different operational and safety preferences within the work zone environment. When evaluated using the proposed traffic performance metrics, Pareto analysis reduced the candidate solutions to a smaller subset of non-dominated policies, indicating that several trained policies produced inferior trade-offs and were therefore discarded automatically. From the resulting Pareto-optimal set shown in Table 4, Model 4 was identified as the most balanced policy because it achieved the lowest spillback length, merge conflict risk, and stop-behavior instability while simultaneously maintaining the highest normalized traffic speed. This indicates that Model 4 provided the best balance between operational efficiency and merge-related safety within the work zone environment. In contrast, Model 17 achieved relatively higher mobility performance through increased traffic speed but exhibited slightly higher instability and conflict-related measures. The remaining Pareto-optimal policies represented intermediate trade-offs between traffic mobility, spillback mitigation, and merge stability. The absence of a single policy that dominates all others across every performance metric confirms the conflicting nature of work zone traffic-control objectives and justifies the use of Pareto optimality for policy selection.
Table 5.
Performance Comparison of Pareto-Optimal RL Policies Showing Trade-offs Between Mobility and Safety Metrics in Work zone Conditions.
Table 5.
Performance Comparison of Pareto-Optimal RL Policies Showing Trade-offs Between Mobility and Safety Metrics in Work zone Conditions.
| Runs | Spillback Length | Normalized Speed | Merge Conflict Risk | Stop Instability | Pareto | ||||
|---|---|---|---|---|---|---|---|---|---|
| 4 | 0.18 | 0.34 | 0.21 | 0.27 | 0.31 | 0.84 | 0.18 | 0.33 | TRUE |
| 19 | 0.24 | 0.26 | 0.19 | 0.31 | 0.41 | 0.76 | 0.26 | 0.41 | TRUE |
| 11 | 0.22 | 0.23 | 0.28 | 0.27 | 0.44 | 0.75 | 0.28 | 0.43 | TRUE |
| 17 | 0.29 | 0.18 | 0.16 | 0.37 | 0.38 | 0.79 | 0.23 | 0.38 | TRUE |
| 18 | 0.20 | 0.21 | 0.24 | 0.35 | 0.40 | 0.78 | 0.24 | 0.39 | TRUE |
Table 6.
Statistical significance analysis between the proposed DQN controller and adaptive signal control baseline.
Table 6.
Statistical significance analysis between the proposed DQN controller and adaptive signal control baseline.
| Metric | DQN | Mean Adaptive Signal | Mean t- value | P-value | Cohen’s d |
|---|---|---|---|---|---|
| Work zone Spillback length | 0.31 | 0.47 | 5.84 | 1.12 | |
| Merge conflict risk | 0.18 | 0.29 | 4.76 | 0.94 | |
| Stop-behaviour instability | 0.36 | 0.49 | 3.41 | 0.68 | |
| Normalized average speed | 0.81 | 0.69 | 4.12 | 0.83 | |
| Overall reward | 0.22 | -0.11 | 6.03 | 1.24 |
The statistical significance analysis was conducted using two-tailed independent t-tests on the average per-episode performance metrics obtained from repeated simulation runs. A total of evaluation episodes were used for each controller, resulting in degrees of freedom for all pairwise comparisons. Prior to the statistical analysis, the distributions of the evaluated metrics were examined using visual inspection of boxplots and normality assessment to ensure the suitability of parametric testing. For each metric, the mean, standard deviation, and 95% confidence intervals were computed across all evaluation episodes. The proposed DQN controller demonstrated statistically significant improvements over the adaptive signal control baseline across all evaluated metrics. Lower values of work zone spillback length, merge conflict risk, and stop-behavior instability indicate improved operational stability and safer merge behavior, while higher normalized average speed and overall reward values indicate improved traffic mobility and learning performance. The computed t-values ranged from 3.41 to 6.03, indicating strong separation between the performance distributions of the two controllers. The effect sizes measured using Cohen’s ranged from 0.68 to 1.24, representing medium-to-large practical significance according to standard effect-size interpretation thresholds. In addition, episode-level variance analysis showed that the proposed DQN framework produced lower variability across repeated simulation runs compared to the adaptive signal control baseline, indicating more stable and consistent traffic-control behavior under dynamically changing work zone conditions. Boxplots with confidence whiskers were further included to visualize the distribution, spread, and stability of the evaluated operational and safety-related performance metrics.
4.2. Evaluation of Traffic Shockwave Characteristics
To further evaluate the effectiveness of the proposed DQN controller in managing work zone congestion, a shockwave analysis was conducted to quantify queue formation, queue dissipation, and spillback characteristics. Shockwave-based performance measures provide valuable insights into the temporal and spatial evolution of congestion by capturing the rates at which queues propagate upstream and dissipate following signal release. Table 7 summarizes the shockwave performance metrics for the adaptive signal control strategy and the proposed DQN controller.
Quantitative shockwave analysis shown in Table 7 revealed substantial operational improvements under the proposed DQN controller. The average queue growth shockwave speed decreased from -12.8 ft/s under adaptive signal control to -7.3 ft/s under the DQN policy, indicating slower upstream congestion propagation. Similarly, maximum queue length decreased by 39.1%, while spillback distance was reduced by 45.8%. During queue recovery, the DQN controller achieved a higher queue dissipation rate (8.3 veh/min) compared with the adaptive controller (5.1 veh/min), demonstrating more efficient clearance of congestion following signal release. These results indicate that the proposed controller not only reduces congestion magnitude but also improves the temporal dynamics of queue formation and dissipation within the work zone environment.
5. Conclusion and Discussion
This study developed a safety-aware DRL for adaptive traffic signal control in a signalized work zone environment. Unlike the traditional adaptive signal control, that only focuses on operational efficiency, the proposed DQN considers work zone spillback length, merge conflict, stop behaviour instability and traffic mobility directly in its state and reward definition. By incorporating operational and safety performance indicators were encoded into the reward function and perceived through state observations, allowed the controller to adapt signal timings based on real-time work zone traffic conditions. The proposed framework was implemented in a SUMO-based microscopic traffic simulation of a signalized intersection under lane-closure conditions. Traffic performance was assessed for each reward weight combination by conducting Pareto-based multi-objective optimization and selecting the optimal action based on non-dominated policies. Model 4 outperformed all other models in terms of safety and mobility performance, minimizing spillback propagation, merge conflict risk, and stop-instability while maximizing average normalized speed. Relative to the default signal-timing strategy, the RL-based controllers reduced spillback length, merge conflict risk, and stop-instability while improving traffic mobility across all vehicle classes. Model 4 achieved the largest throughput gains, increasing vehicle throughput by 24.6%, 32.7%, 37.3%, and 29.7% for cars, trucks, buses, and mixed traffic, respectively, with all p-values below 0.001 and Cohen’s d values ranging from 0.53 to 1.29, indicating moderate-to-large practical effect sizes. The improvements were most pronounced for trucks and buses, the vehicle classes most adversely affected by capacity reductions and unstable merging within work zones. The safety-aware DQN likewise outperformed the actuated adaptive signal-control baseline with statistical significance and large effect sizes, confirming that the observed gains are unlikely to reflect random simulation variability. Moreover, the macroscopic shockwave analysis showed that the proposed DQN controller slowed upstream congestion propagation and accelerated recovery relative to the adaptive signal-control baseline, reducing maximum queue length by 39.1% and maximum spillback distance by 45.8% while raising the queue dissipation rate from 5.1 to 8.3 vehicles per minute. These results show that the controller not only reduces the magnitude of congestion but also improves the temporal dynamics of queue formation and clearance, enabling traffic to recover to free-flow conditions more quickly after a disturbance. Taken together, these findings demonstrate that explicitly encoding surrogate safety indicators as learning objectives, rather than treating them solely as evaluation criteria, enables a single controller to jointly improve mobility and safety under the non-stationary, capacity-constrained conditions that characterize work zones. The Pareto-based formulation further allows practitioners to select among non-dominated policies according to site-specific priorities, making the framework adaptable to differing operational and safety preferences without retraining a single fixed reward.
Several limitations should be acknowledged. The framework was developed and evaluated entirely within a SUMO microscopic simulation of a single isolated intersection, and its performance under real-world sensor noise, demand uncertainty, and driver heterogeneity remains to be established. The surrogate safety formulation captures merge-related conflict risk through relative spacing, speed, and acceleration but does not directly model crash outcomes, and the results are conditioned on the specific work zone geometry, demand profile, and reward-weight sampling adopted in this study. These factors should be considered when generalizing the findings to other facilities or control settings. Future research will extend the framework to coordinated multi-intersection corridors, evaluate its robustness across a wider range of work zone configurations and demand levels, and incorporate connected and automated vehicle behavior into the traffic environment. Validation through hardware-in-the-loop testing and field deployment represents a further important step toward translating these simulation-based gains into operational practice.
Author Contributions
Conceptualization, Israel Afriyie and Emmanuel Kofi Adanu; methodology, Israel Afriyie, Kwadwo Amankwah-Nkyi, and Emmanuel Kofi Adanu; software, Israel Afriyie; validation, Israel Afriyie, Kwadwo Amankwah-Nkyi, and Percy Agyei-Essiful; formal analysis, Israel Afriyie; investigation, Israel Afriyie; data curation, Israel Afriyie; writing—original draft preparation, Israel Afriyie; writing—review and editing, Kwadwo Amankwah-Nkyi, Percy Agyei-Essiful, Emmanuel Kofi Adanu, and Emmanuel Kofi Acheampong; visualization, Israel Afriyie; supervision, Emmanuel Kofi Adanu; project administration, Emmanuel Kofi Adanu. All authors have read and agreed to the published version of the manuscript.
Funding
No funding was received for this research.
Institutional Review Board Statement
Not applicable.
Data Availability Statement
The data and simulation models used in this study are available from the corresponding author upon reasonable request.
Acknowledgments
The authors thank Clemson University for providing access to academic resources that contributed to this research.
Conflicts of Interest
The authors declare no conflicts of interest.
Abbreviations
The following abbreviations are used in this manuscript:
| DQN | Deep Q-Network |
| RL | Reinforcement Learning |
| ITS | Intelligent Transportation Systems |
| SUMO | Simulation of Urban Mobility |
| TraCI | Traffic Control Interface |
| MIT | Merge Instability Time |
| CR | Conflict Risk |
| FHWA | Federal Highway Administration |
| TTC | Time-to-Collision |
| PET | Post-Encroachment Time |
| DRAC | Deceleration Rate to Avoid Collision |
References
- Ansari, F.A.; Pani, A.; Mohapatra, S.S. Improving highway work zone mobility in the developing world: A systematic literature review of work zone delay measures and technological solutions. Transp. Res. Rec. 2025. [Google Scholar] [CrossRef]
- Racha, S.; Chowdhury, M.; Sarasua, W.; Ma, Y. Analysis of work zone crash characteristics. Accid. Anal. Prev. 2008, 40, 2078–2086. [Google Scholar] [CrossRef] [PubMed]
- Anastasopoulos, P.C.; Mannering, F.L. A note on modeling vehicle accident frequencies with random-parameters count models. Accid. Anal. Prev. 2009, 41, 153–159. [Google Scholar] [CrossRef]
- Eom, M.; Kim, B.-I. The traffic signal control problem for intersections: A review. Eur. Transp. Res. Rev. 2020, 12, 50. [Google Scholar] [CrossRef]
- Federal Highway Administration. Work Zone Facts and Statistics; FHWA Work Zone Management Program, U.S. Department of Transportation: Washington, DC, USA, 2023. Available online: https://ops.fhwa.dot.gov/wz/ (accessed on 13 June 2026).
- Chu, L.; Kim, H. Evaluation of adaptive signal control in work zones. Transp. Res. Rec. 2005, 1911, 37–45. [Google Scholar] [CrossRef]
- Papageorgiou, M.; Diakaki, C.; Dinopoulou, V.; Kotsialos, A.; Wang, Y. Review of road traffic control strategies. Proc. IEEE 2003, 91, 2043–2067. [Google Scholar] [CrossRef]
- Stevanovic, A. Adaptive Traffic Control Systems: Domestic and Foreign State of Practice; NCHRP Synthesis 403; Transportation Research Board: Washington, DC, USA, 2010. [Google Scholar]
- Federal Highway Administration. Adaptive Signal Control Technology: Lessons Learned. FHWA, U.S. Department of Transportation: Washington, DC, USA, 2018. Available online: https://ops.fhwa.dot.gov/arterial_mgmt/asct.htm (accessed on 13 June 2026).
- Daganzo, C.F. Fundamentals of Transportation and Traffic Operations; Pergamon: Oxford, UK, 1997. [Google Scholar]
- Kerner, B.S. The Physics of Traffic; Springer: Berlin/Heidelberg, Germany, 2004. [Google Scholar]
- Thorpe, T.L.; Anderson, C.W. Traffic Light Control Using SARSA with Three State Representations; Technical Report; Colorado State University: Fort Collins, CO, USA, 1996. [Google Scholar]
- Abdulhai, B.; Pringle, R.; Karakoulas, G.J. Reinforcement learning for true adaptive traffic signal control. J. Transp. Eng. 2003, 129, 278–285. [Google Scholar] [CrossRef]
- Wang, S.; Cao, J. Deep reinforcement learning for traffic signal control. IEEE Internet Things J. 2020, 7, 10017–10031. [Google Scholar] [CrossRef]
- Ullman, G.L.; Finley, M.D.; Bryden, J.E. Traffic Safety Evaluation of Nighttime and Daytime Work Zones; NCHRP Report 627; Transportation Research Board: Washington, DC, USA, 2008. [Google Scholar]
- Laval, J.A.; Leclercq, L. A mechanism to describe the formation and propagation of stop-and-go waves in congested freeway traffic. Philos. Trans. R. Soc. A 2010, 368, 4519–4541. [Google Scholar] [CrossRef] [PubMed]
- Federal Highway Administration. Work Zone Safety and Mobility. FHWA, U.S. Department of Transportation: Washington, DC, USA, 2016. Available online: https://ops.fhwa.dot.gov/wz/ (accessed on 13 June 2026).
- Yang, H.; Ozbay, K.; Ozturk, O.; Xie, K. Work zone safety analysis and modeling: A state-of-the-art review. Traffic Inj. Prev. 2015, 16, 387–396. [Google Scholar] [CrossRef] [PubMed]
- Garber, N.J.; Zhao, M. Distribution and Characteristics of Crashes at Different Work Zone Locations in Virginia; Report No. VTRC 02-R12; Virginia Transportation Research Council: Charlottesville, VA, USA, 2002. [Google Scholar]
- Khattak, A.J.; Council, F.M. Effects of work zone presence on injury and non-injury crashes. Accid. Anal. Prev. 2002, 34, 19–29. [Google Scholar] [CrossRef] [PubMed]
- Gettman, D.; Head, L. Surrogate safety measures from traffic simulation models. Transp. Res. Rec. 2003, 1840, 104–115. [Google Scholar] [CrossRef]
- Archer, J. Indicators for Traffic Safety Assessment and Prediction and Their Application in Micro-Simulation Modelling. Ph.D. Thesis, Royal Institute of Technology (KTH), Stockholm, Sweden, 2005. [Google Scholar]
- Tarko, A.; Davis, G.; Saunier, N. Surrogate Measures of Safety; Transportation Research Board: Washington, DC, USA, 2009. [Google Scholar]
- Vogel, K. A comparison of headway and time to collision as safety indicators. Accid. Anal. Prev. 2003, 35, 427–433. [Google Scholar] [CrossRef] [PubMed]
- Transportation Research Board. Highway Capacity Manual, 6th ed.; Transportation Research Board: Washington, DC, USA, 2016. [Google Scholar]
- Garber, N.J.; Hoel, L.A. Traffic and Highway Engineering, 5th ed.; Cengage Learning: Boston, MA, USA, 2015. [Google Scholar]
- Sutton, R.S.; Barto, A.G. Reinforcement Learning: An Introduction, 2nd ed.; MIT Press: Cambridge, MA, USA, 2018. [Google Scholar]
- Kiran, B.R.; Sobh, I.; Talpaert, V.; Mannion, P.; Al Sallab, A.A.; Yogamani, S.; Pérez, P. Deep reinforcement learning for autonomous driving: A survey. IEEE Trans. Intell. Transp. Syst. 2022, 23, 4909–4926. [Google Scholar] [CrossRef]
- Lopez, P.A.; Behrisch, M.; Bieker-Walz, L.; Erdmann, J.; Flötteröd, Y.-P.; Hilbrich, R.; Wießner, E. Microscopic traffic simulation using SUMO. In Proceedings of the 21st IEEE International Conference on Intelligent Transportation Systems (ITSC), Maui, HI, USA, 4–7 November 2018; pp. 2575–2582. [Google Scholar] [CrossRef]
- Gartner, N.H.; Stamatiadis, C.; Tarnoff, P.J. Development of advanced traffic signal control strategies for intelligent transportation systems: Multilevel design. Transp. Res. Rec. 1995, 1494, 98–105. [Google Scholar]
- Genders, W.; Razavi, S. Using a deep reinforcement learning agent for traffic signal control. J. Intell. Transp. Syst. 2019, 23, 319–331. [Google Scholar] [CrossRef]
- Mnih, V.; Kavukcuoglu, K.; Silver, D.; Rusu, A.A.; Veness, J.; Bellemare, M.G.; Graves, A.; Riedmiller, M.; Fidjeland, A.K.; Ostrovski, G.; et al. Human-level control through deep reinforcement learning. Nature 2015, 518, 529–533. [Google Scholar] [CrossRef] [PubMed]
- Afriyie, I.; Joshua, S.N.; Abuanor, M.N. Utilizing Several Machine Learning Techniques to Investigate the Bridge Deck Condition. J. Stud. Civ. Eng. 2025, 2(2), 35–53. [Google Scholar] [CrossRef]
- Afriyie, I.; Ativor, N.K.; Ofosu-Kwabe, K.; Kofi, A.E. Flood-Resilient Transportation Network Planning in Montpelier, Vermont: A Penalty Dijkstra Algorithm for Optimizing Evacuation Routes. Res. J. Civ. Ind. Mech. Eng. 2024, 1(1), 43–57. [Google Scholar]
- Afriyie, I.; Ofosu-Kwabe, K.; Ativor, N.K. Optimizing Cctv Camera Placement for Campus Security: A Binary Integer Programming Approach for Clemson University. [CrossRef] [PubMed]
- Afriyie, I. Enhancing resilience of transportation infrastructure in the city of Accra. World J. Adv. Res. Rev. 2025, 25(03), 1506–1515. [Google Scholar] [CrossRef]
- Vamplew, P.; Dazeley, R.; Berry, A.; Issabekov, R.; Dekker, E. Empirical evaluation methods for multiobjective reinforcement learning algorithms. Mach. Learn. 2011, 84, 51–80. [Google Scholar] [CrossRef]
- Lighthill, M.J.; Whitham, G.B. On kinematic waves. II. A theory of traffic flow on long crowded roads. Proc. R. Soc. A 1955, 229, 317–345. [Google Scholar] [CrossRef]
- LeVeque, R.J. Numerical Methods for Conservation Laws, 2nd ed.; Birkhäuser: Basel, Switzerland, 1992. [Google Scholar]
- Talebpour, A.; Mahmassani, H.S. Influence of connected and autonomous vehicles on traffic flow stability and throughput. Transp. Res. Part C Emerg. Technol. 2016, 71, 143–163. [Google Scholar] [CrossRef]
- Treiber, M.; Kesting, A. Traffic Flow Dynamics: Data, Models and Simulation; Springer: Berlin/Heidelberg, Germany, 2013. [Google Scholar] [CrossRef]
Figure 1.
(a). Flagging Work zone; (b). Lane Closure Configuration.
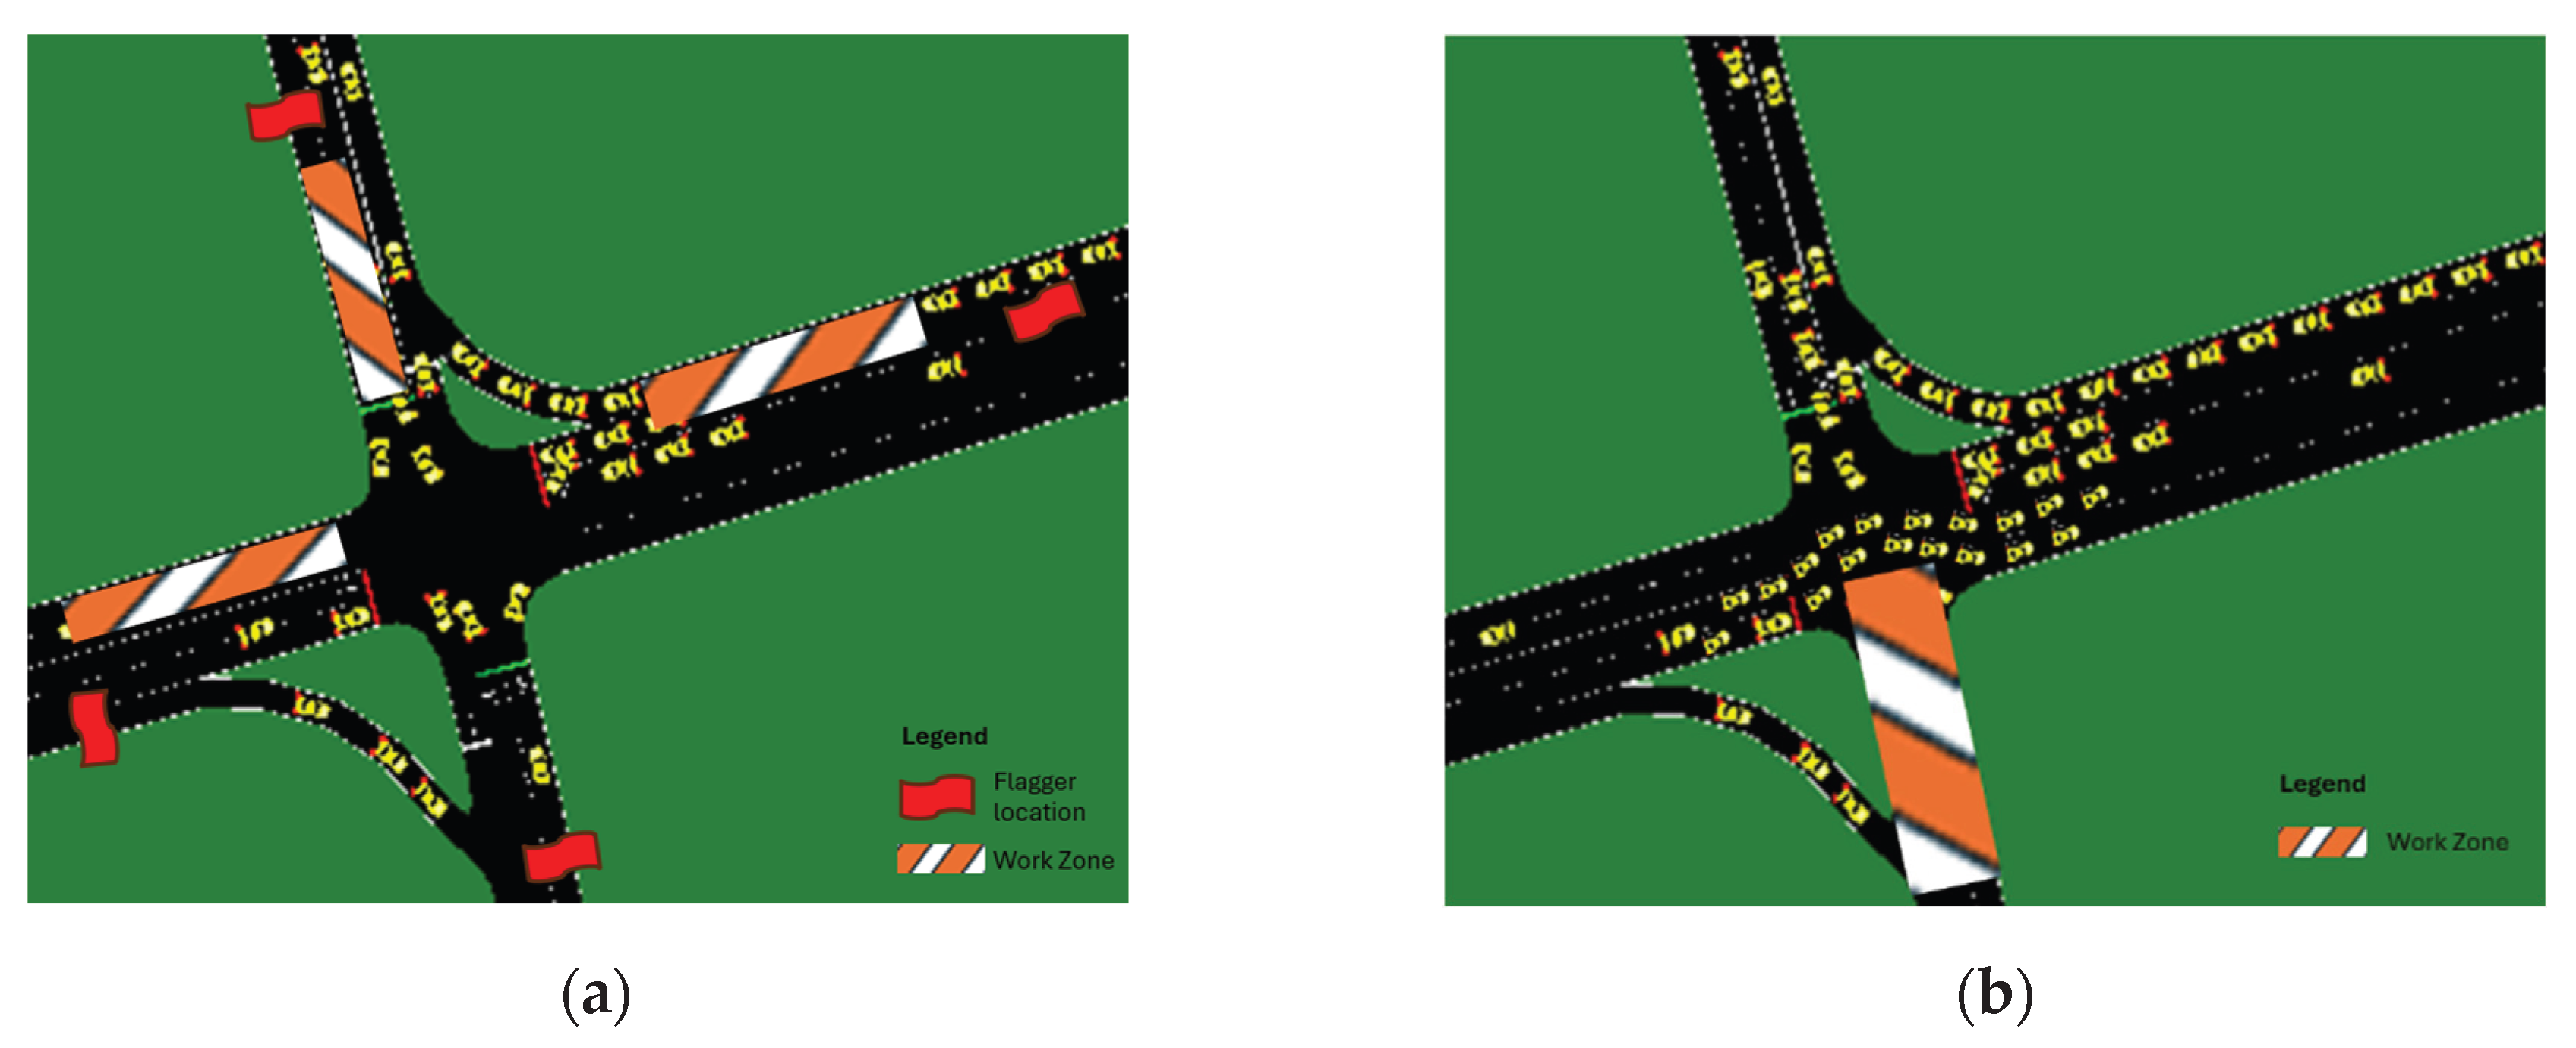
Figure 4.
Flow Chart Diagram.
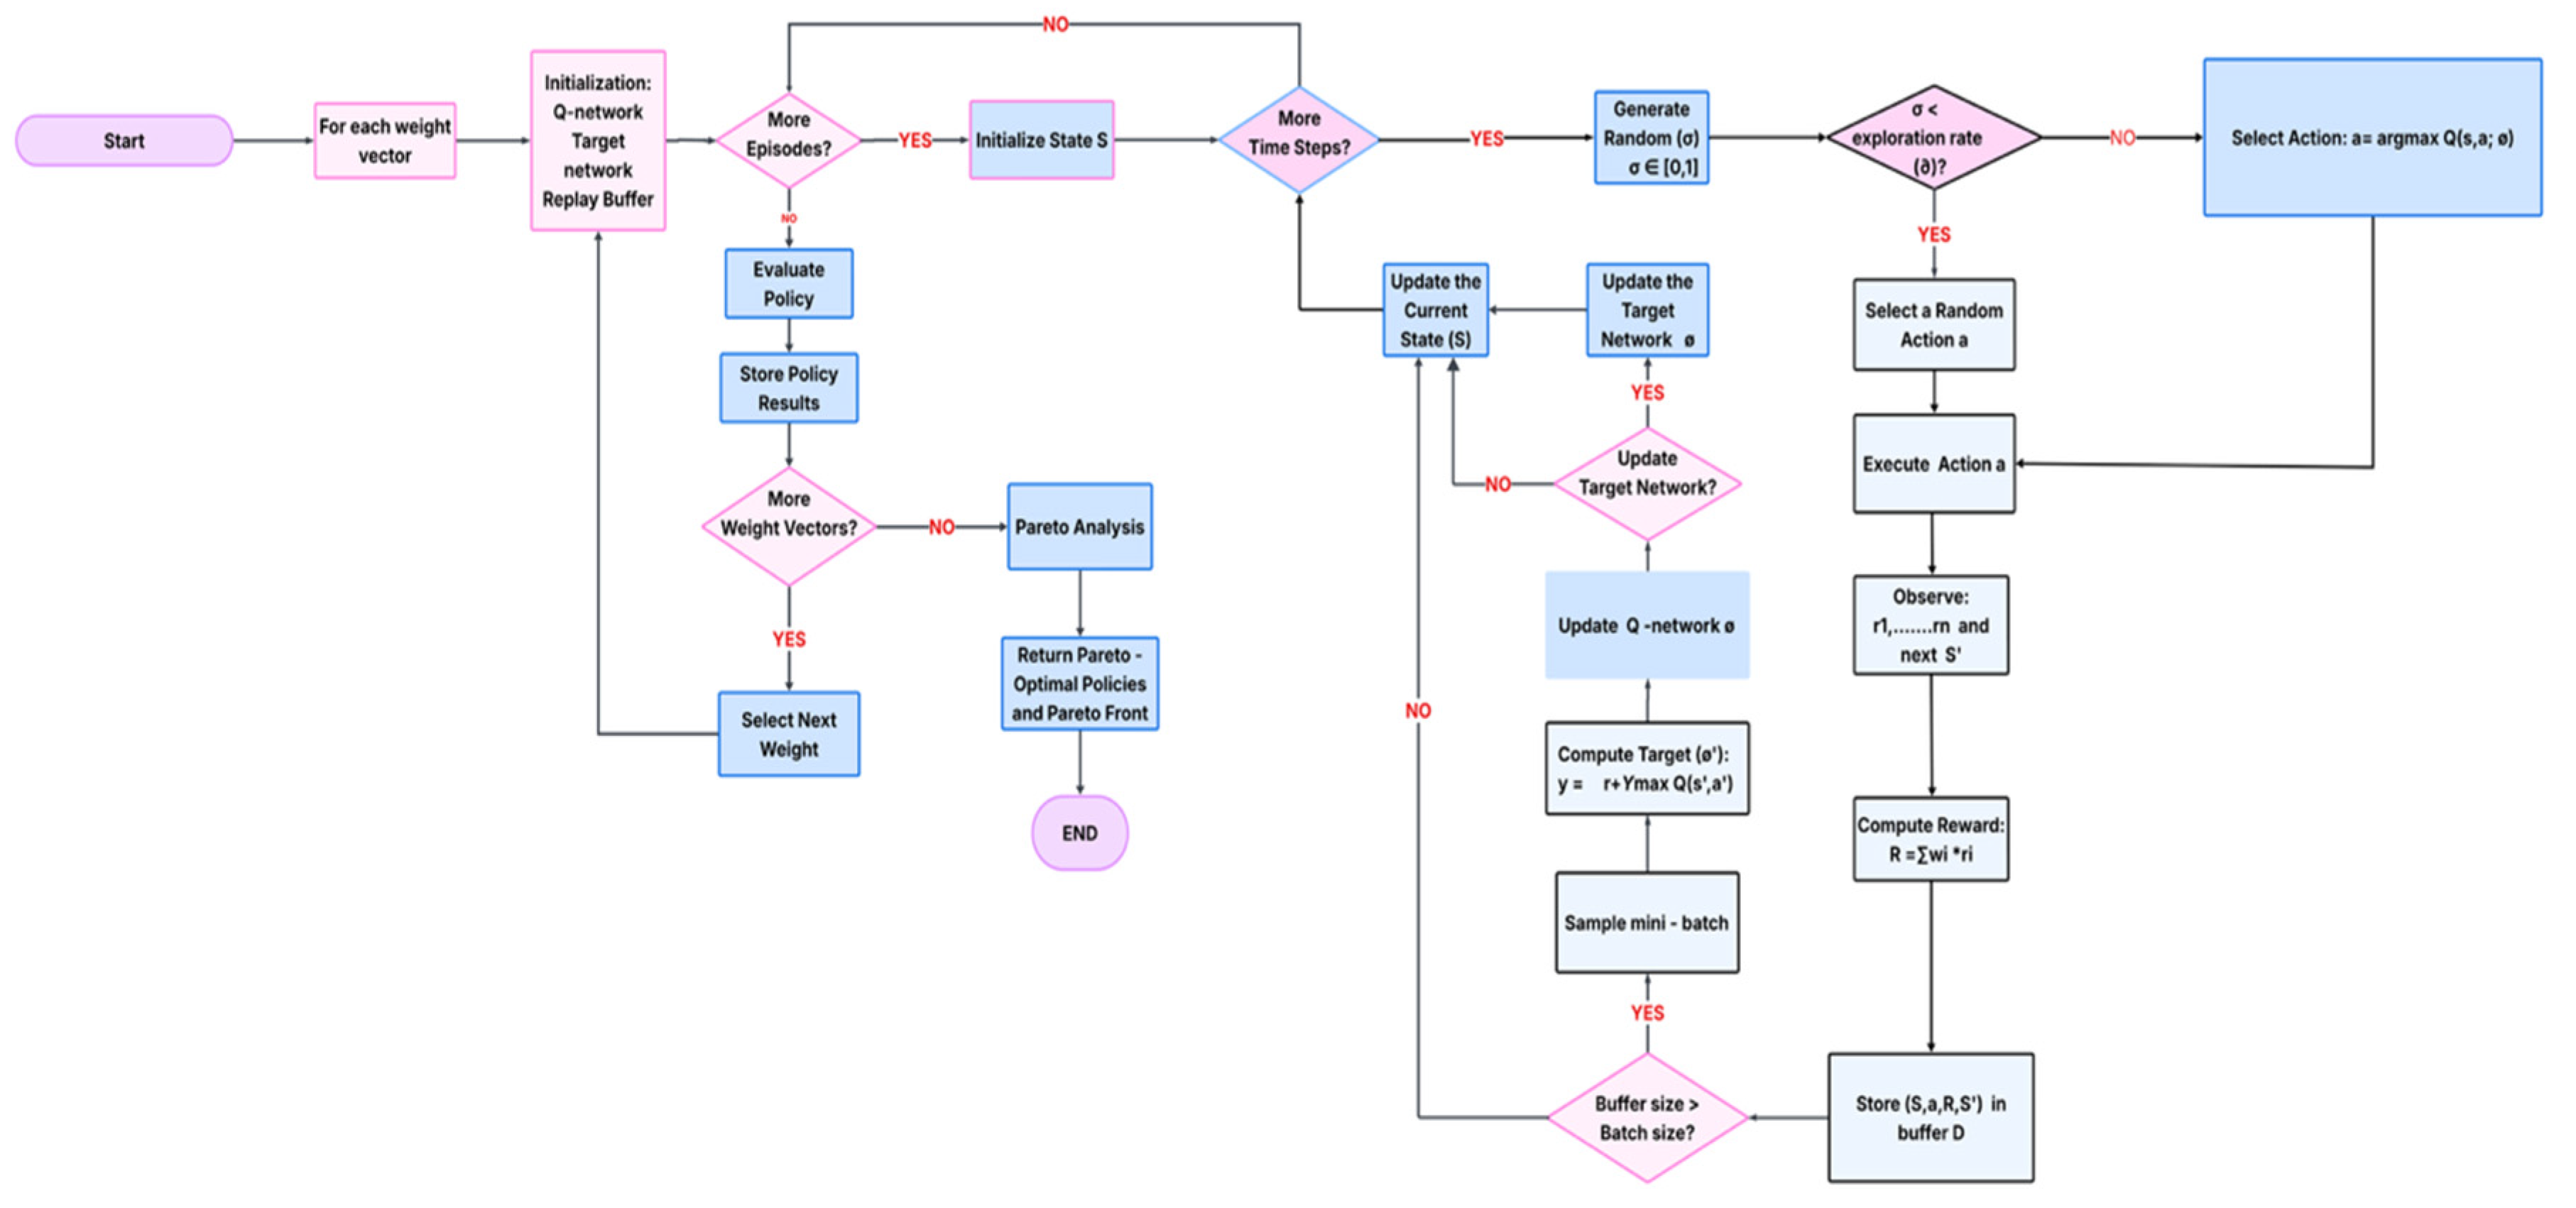
Figure 5.
Pareto Multi Objective Optimization.
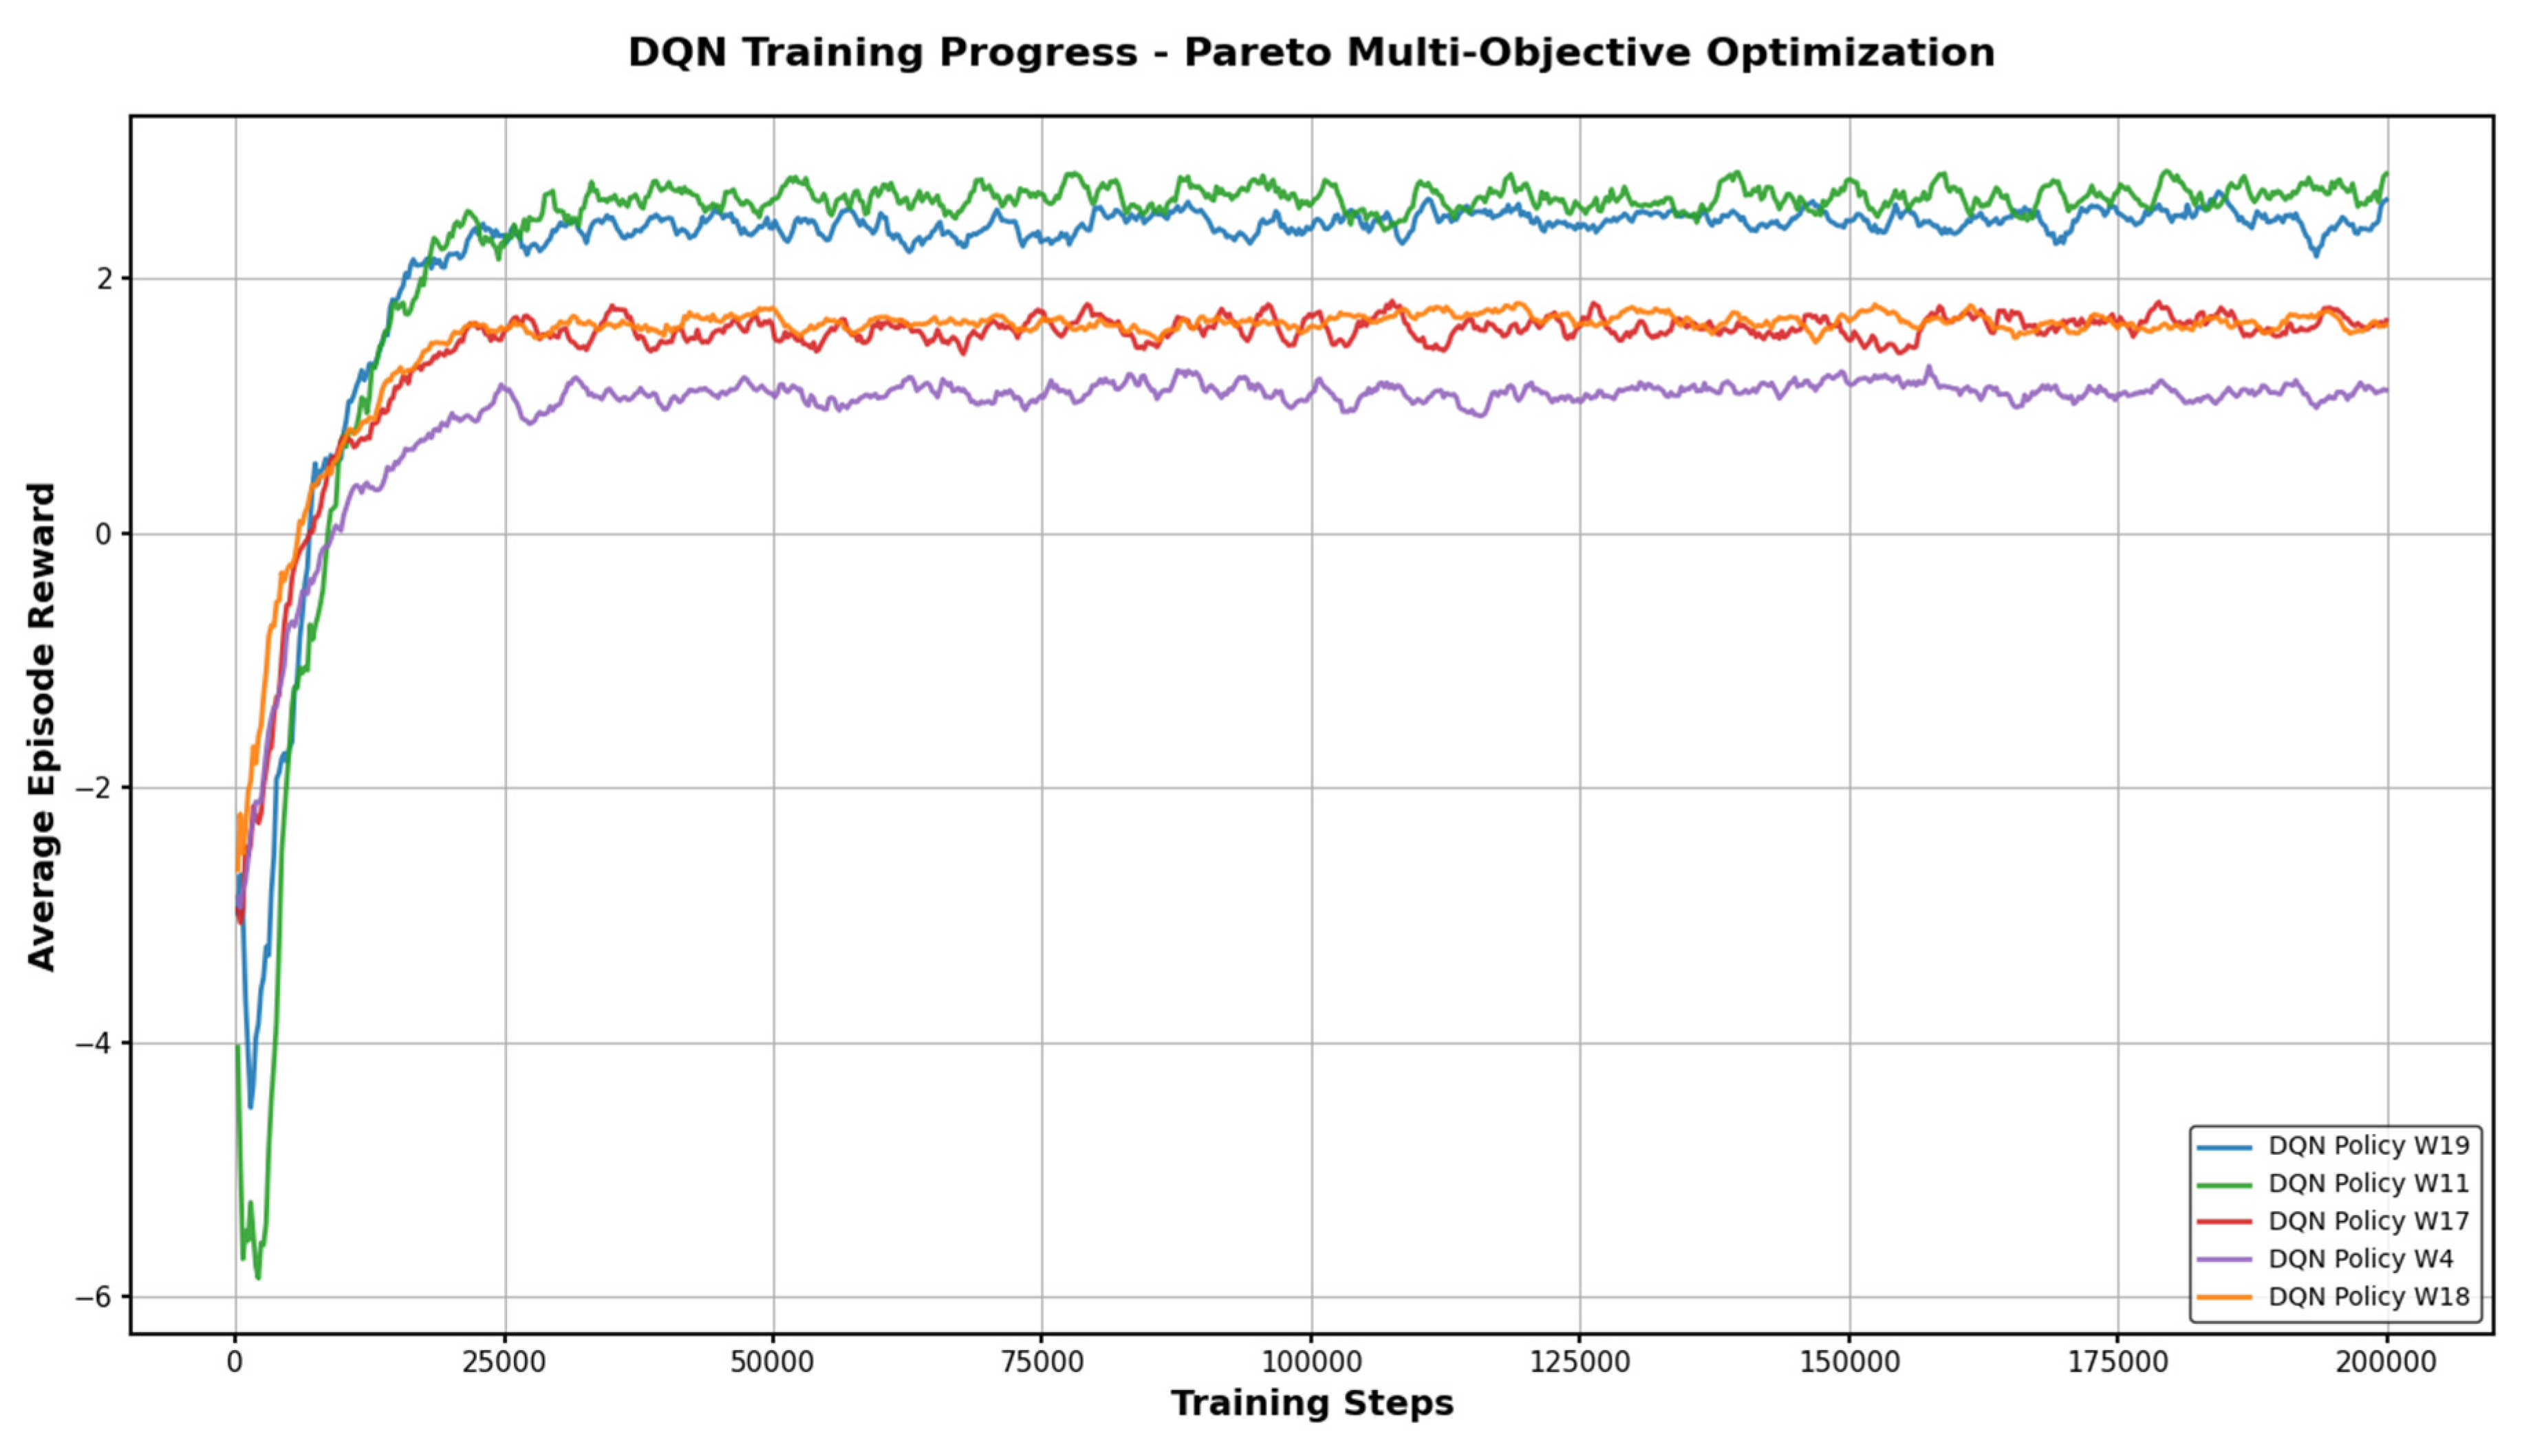
Table 3.
Throughput efficiency analysis across vehicle types.
| Vehicle Type | Default Signal Timing | Model 19 | Model 11 | Model 17 | Model 18 | Model 4 |
|---|---|---|---|---|---|---|
| Cars | ||||||
| Trucks | ||||||
| Buses | ||||||
| Mixed Traffic |
Table 4.
Statistical significance analysis of throughput performance relative to the default signal timing strategy.
Table 4.
Statistical significance analysis of throughput performance relative to the default signal timing strategy.
| Vehicle Type | Comparison | Mean Difference | t-value | p-value | Cohen’s d |
|---|---|---|---|---|---|
| Cars | Model 19 vs Default | +488 | 3.54 | 0.0007 | 0.71 |
| Cars | Model 11 vs Default | +363 | 2.68 | 0.0086 | 0.54 |
| Cars | Model 17 vs Default | +632 | 4.66 | <0.0001 | 0.93 |
| Cars | Model 18 vs Default | +410 | 3.01 | 0.0035 | 0.60 |
| Cars | Model 4 vs Default | +768 | 5.92 | <0.0001 | 1.18 |
| Trucks | Model 19 vs Default | +369 | 3.02 | 0.0034 | 0.61 |
| Trucks | Model 11 vs Default | +291 | 2.31 | 0.0229 | 0.47 |
| Trucks | Model 17 vs Default | +480 | 4.03 | 0.0002 | 0.81 |
| Trucks | Model 18 vs Default | +338 | 2.78 | 0.0065 | 0.56 |
| Trucks | Model 4 vs Default | +613 | 5.27 | <0.0001 | 1.05 |
| Buses | Model 19 vs Default | +369 | 3.18 | 0.0021 | 0.64 |
| Buses | Model 11 vs Default | +311 | 2.64 | 0.0097 | 0.53 |
| Buses | Model 17 vs Default | +447 | 4.15 | 0.0001 | 0.83 |
| Buses | Model 18 vs Default | +358 | 3.05 | 0.0030 | 0.61 |
| Buses | Model 4 vs Default | +554 | 5.11 | <0.0001 | 1.02 |
| Mixed Traffic | Model 19 vs Default | +545 | 3.84 | 0.0004 | 0.77 |
| Mixed Traffic | Model 11 vs Default | +434 | 3.07 | 0.0029 | 0.61 |
| Mixed Traffic | Model 17 vs Default | +789 | 4.91 | <0.0001 | 0.98 |
| Mixed Traffic | Model 18 vs Default | +600 | 4.12 | 0.0001 | 0.82 |
| Mixed Traffic | Model 4 vs Default | +1034 | 6.47 | <0.0001 | 1.29 |
Table 7.
Shockwave Performance Comparison.
| Metric | Adaptive Signal | Model 4 DQN | Improvement |
|---|---|---|---|
| Queue Growth Shockwave Speed (ft/s) | -12.8 | -7.3 | 42.9% |
| Queue Dissipation Shockwave Speed (ft/s) | -8.6 | -12.4 | 44.2% |
| Maximum Queue Length (veh) | 18.4 | 11.2 | 39.1% |
| Queue Growth Rate (veh/min) | 7.8 | 4.5 | 42.3% |
| Queue Dissipation Rate (veh/min) | 5.1 | 8.3 | 62.7% |
| Maximum Spillback Distance (ft) | 192 | 104 | 45.8% |
Disclaimer/Publisher’s Note: The statements, opinions and data contained in all publications are solely those of the individual author(s) and contributor(s) and not of MDPI and/or the editor(s). MDPI and/or the editor(s) disclaim responsibility for any injury to people or property resulting from any ideas, methods, instructions or products referred to in the content. |
© 2026 by the authors. Licensee MDPI, Basel, Switzerland. This article is an open access article distributed under the terms and conditions of the Creative Commons Attribution (CC BY) license (http://creativecommons.org/licenses/by/4.0/).
Copyright: This open access article is published under a Creative Commons CC BY 4.0 license, which permit the free download, distribution, and reuse, provided that the author and preprint are cited in any reuse.


