

Submitted:
20 June 2026
Posted:
22 June 2026
You are already at the latest version
Abstract
Artemisia annua L. (A. annua) produces artemisinin, a key antimalarial compound whose biosynthesis is strongly influenced by light. Although the effects of light inten-sity and spectral quality on plant growth and secondary metabolism have been widely studied, plant responses to extremely low photon fluxes remains poorly understood. This study investigates growth and metabolic responses in A. annua exposed to coher-ent ultralow-photon illumination generated from attenuated red (R) and violet-blue (VB) lasers, compared with plants grown under natural sunlight over a 14-day treat-ment period. The attenuated laser treatments delivered photon flux densities several orders of magnitude lower than those of natural sunlight. Height increment differed among treatments, with the VB treatment produced the greatest increase in height (39.9%, p < 0.01), followed by the R treatment (32.4%, p < 0.05), and natural sunlight (23.0%). In contrast, plants grown under natural sunlight exhibited the greatest in-crease in leaf area. Estimated artemisinin concentrations were highest under natural sunlight (31.09 mg g⁻¹ DW), lower under the R treatment (6.98 mg g⁻¹ DW), and lowest under the VB treatment (1.14 mg g⁻¹ DW). These findings indicate that extreme photon limitation promotes stem elongation while strongly suppressing artemisinin accumu-lation. Overall, the results demonstrate measurable growth and metabolic responses under ultra-low photon fluxes and provide new insight into the interaction between light availability, spectral quality, and growth–metabolite trade-offs in medicinal plants.
Keywords:
medicinal plant
; secondary metabolites
; photon
; high-performance liquid chromatography
1. Introduction
Malaria remains a major global health threat, affecting over 249 million people annually and causing approximately 608,000 deaths [1]. Artemisinin, a key antimalarial compound extracted from its primary natural source, the Chinese medicinal herb Artemisia annua L. (A. annua), has contributed substantially to reducing malaria mortality worldwide ([2,3,4]). To optimize the yield of this valuable medicinal plant, it is important to understand how environmental factors regulate both growth and secondary metabolism in A. annua. These processes are influenced by light intensity and quality, temperature, water and nutrient availability, atmospheric CO₂, developmental stage, and various stress conditions [5]. Among these factors, light plays an important role by regulating plant development, biomass accumulation, and artemisinin biosynthesis.
The accumulation of artemisinin is closely tied to the plant's phenology and cellular structures. Artemisinin levels gradually increase during vegetative growth and peak at the onset of flowering [6], with the highest concentrations observed localized within the glandular trichomes of leaves during early flowering [7,8]. However, achieving peak yields is complicated by environmental fluctuations and genetic variability among cultivars, both of which significantly alter artemisinin content and overall biomass. Abiotic stress, in particular, can shift resource allocation between primary growth and secondary defense metabolism. For instance, while moderate water stress has been reported to enhance artemisinin accumulation through stress-induced signaling, severe drought suppresses both physical growth and metabolite production [9,10]. These responses illustrate fundamental trade-offs between biomass production and secondary metabolism under environmental pressure.
Light serves as a primary master regulator governing this trade-off in A. annua. Light is a primary master regulator governing this trade-off in A. annua. Photons function as an energetic fuel and an informational signal. Specifically, light intensity dictates biomass accumulation and carbon availability via photosynthesis, whereas spectral composition drives photoreceptor-mediated pathways and the downstream expression of key biosynthetic genes [11]. Narrowband red and blue light, administered alone or in combination, have been shown to enhance artemisinin accumulation by promoting glandular trichome development and upregulating essential pathway enzymes such as amorpha-4,11-diene synthase and CYP71AV1 [12,13]. Furthermore, additional spectral components, including UV-B and green light, modulate trichome density and accelerate the accumulation of pathway intermediates [14,15]. Collectively, these findings demonstrate that light intensity and spectral quality can be precisely engineered to tune artemisinin production.
Recent studies suggest that photoreceptor-mediated signaling can remain responsive under remarkably weak light inputs [16]. However, the minimum photon flux required to sustain measurable growth and metabolic responses remains unknown. Consequently, whether growth and secondary metabolism can be maintained under photon fluxes approaching the lower limits of plant light perception has not been established. To address this question, this study investigates growth and artemisinin production in A. annua under coherent ultralow-photon red and violet-blue illumination generated by attenuated laser sources.
2. Materials and Methods
2.1. Plant Material and Growth Conditions
A. annua plants were cultivated during the cool season (November 2024–February 2025) in a pilot greenhouse at the Department of Horticulture, Faculty of Agriculture, Kasetsart University (13°51’13.5” N 100°34’09.2” E). The greenhouse received natural sunlight with an average daytime photosynthetic photon flux density of 206.2 µmol m-2 s-1, an average photoperiod of approximately 11.7 hours, temperatures of 28–30 °C, and a relative humidity of approximately 50–60 %.
2.2. Seed Germination and Plant Preparation
A. annua seeds obtained from China were germinated in transparent plastic boxes filled with peat moss. Seed germination began approximately 4 days after sowing. Seedlings were transplanted into plug trays 7 days after germination and subsequently transferred to 7-inch diameter pots containing a commercial growing medium when they were approximately 3 cm in height. The growing medium was composed of rain tree leaves, bamboo humus, manure, compost, coconut husk, and other organic materials, with an electrical conductivity of 1.6 mS cm-1 and a pH of 7.3. Plants were watered daily with 300 mL of water and fertilized with a granular N–P–K (16–16–16) fertilizer at a rate of 1 g per plant every two weeks. Laser light treatments were initiated when plants were approximately 100 days old.
2.3. Experimental Design
The experiment was conducted using a completely randomized design with three light treatments: attenuated red laser light (R), attenuated violet-blue laser light (VB), and natural sunlight (control). A total of twelve potted A. annua plants were used, with four biological replicates (individual potted plants) assigned to each treatment.
2.4. Treatment Setup
Eight potted A. annua plants assigned to the laser-light treatments were placed inside a tent divided into 2 identical compartments (Figure 1a). Each compartment measured 1.2 m in width, 1.5 m in length, and 1.8 m in height and contained four plants. The tent was enclosed with polyethylene sheeting and positioned within a dark room to eliminate ambient light. An overview of the experimental setup is shown in Figure 1(b). One compartment contained four plants exposed to attenuated red laser light, whereas the other contained four plants exposed to attenuated violet-blue laser light. Plants were maintained under their respective laser-light treatments for 14 days. Throughout the treatment period, temperature and relative humidity inside the tent were maintained at 27 ± 1 °C and 70 ± 5 %, respectively. Four control plants were maintained separately under natural greenhouse sunlight conditions for the same duration.
2.5. Attenuated Laser Light Sources and Photon Characterization
Ultra-low light intensities were generated by attenuating the output of two continuous-wave (cw) laser diodes: a red laser (6 mW; spectral range 630–645 nm, peak wavelength 635 nm), (RLD63NPC5, ROHM Semiconductor, Germany) and a violet-blue laser (5 mW; spectral range 350–450 nm, peak wavelength 405 nm), (405P-40-BL, Q-BAIHE, China). Each laser diode, equipped with a 5.0 mm aperture, was driven by separate iC-WK2D laser drivers (Global Laser, Germany) at a current above the lasing threshold to ensure coherent emission. The laser output was attenuated using a neutral density filter (OD = 0.5, 5247NF, Newport, USA) and then passed through a ground glass diffuser (DG05-120, Thorlabs, USA) to provide uniform illumination of the plants. Each laser diode was positioned 1.80 m above the center of four potted plants, generating a uniform circular illumination area approximately 0.7 m in diameter (Figure 1). The estimated photon flux densities were approximately 2.0 × 10⁸ photons m⁻² s⁻¹ for the attenuated violet-blue laser and 1.0 × 10⁷ photons m⁻² s⁻¹ for the attenuated red laser. Detailed calculations are provided in Appendix A.
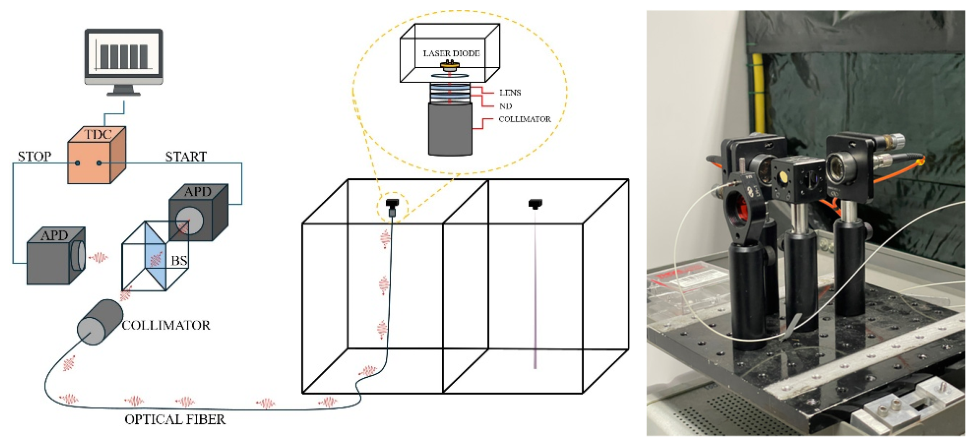
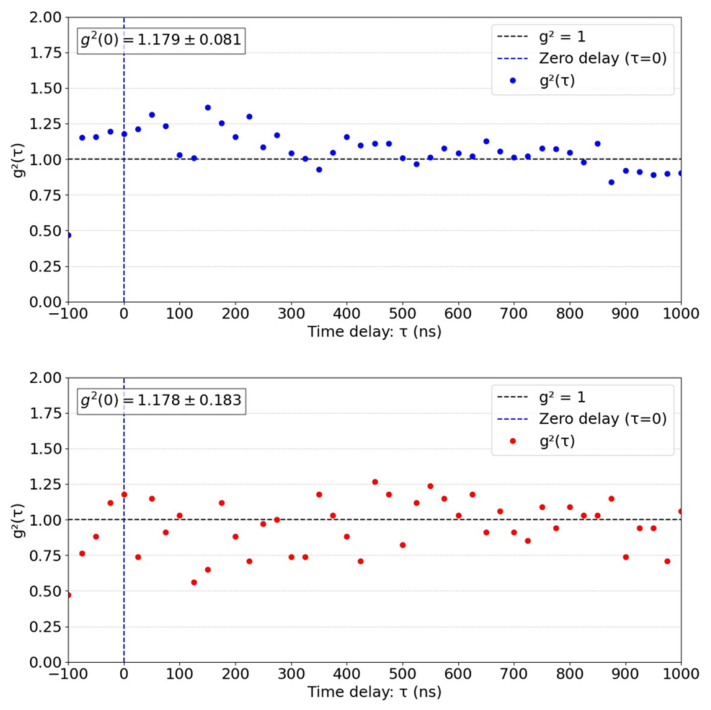
The photon statistics of the attenuated light sources were characterized using the Hanbury Brown and Twiss (HBT) setup following the procedure described in [17]. The setup consisted of a beam splitter (BS025, Thorlabs, USA) and a single-photon counting module (SPCM-AQ4C, Perkin-Elmer, USA). Photon-correlation signals were acquired using a high-speed digital oscilloscope (DSOX3024A, Keysight, USA) (Figure S1). The second-order coherence function, g(2)(τ), was measured for both laser sources. Both attenuated laser beams exhibited coherent photon statistics, with measured g(2)(0) values close to unity (Figure A2). Detailed experimental procedures and photon-flux calculations are provided in the appendix.
2.6. Soil Moisture Control and Irrigation Management
To eliminate variations in water availability, soil moisture was regulated throughout the 14-day light-treatment period using XH-M214 digital soil-moisture control modules. The lower and upper sensor thresholds were set at 60% and 80%, respectively. For plants receiving laser-light treatments, irrigation was automatically controlled by the XH-M214 integrated relay system connected to solenoid valves supplied with the tap water. When the sensor reading fell below 60%, irrigation was activated and continued until the moisture level reached 80%. For plants maintained under natural sunlight (controle), identical XH-M214 sensor probes were inserted into the growing medium and monitored daily. Whenever the sensor reading fell below the 60% threshold, the corresponding pot was manually irrigated until the moisture level returned to approximately 80%. The same moisture thresholds were applied to all treatments to ensure comparable water availability throughout the experiment. No fertilizer was applied to any treatment during the 14-day treatment period.
2.7. Evaluation of Plant Height and Total Leaf Area Estimation
For each of the three light treatments, plant height and total leaf area were measured at the start (Day 1) and end (Day 14) of the experiment. Plant height was measured for four individual plants per treatment from the soil surface to the apical shoot tip using a measuring tape. Plant height increment was calculated as the difference between the Day 14 and Day 1 measurements. Leaf area was estimated by photographing each plant using a smartphone camera following the method described in [18]. The images were analyzed using ImageJ software (version 1.50, National Institutes of Health, USA) to quantify leaf area. A ruler of known length was included in each image for calibration prior to image analysis.
2.8. HPLC Quantification of Artemisinin
Leaf samples from the upper main branches of A. annua were collected at the end of the treatment period and stored at 4 °C until analysis. All samples were stored under identical conditions and analyzed in a single batch to minimize analytical variation. Samples were dried in a forced-air oven at 50 °C for 48 h, sieved through a No. 14 stainless-steel mesh sieve, and stored in stoppered glass jars at room temperature prior to extraction.
Artemisinin extraction and HPLC analysis were adapted from the method described by Lapkin et al. [19]. Briefly, 0.5 g of dried and sieved leaf material was refluxed with 50 mL hexane at 75 °C for 1 h. The extract was evaporated to dryness in a fume hood and the residue was reconstituted in 10.0 mL acetonitrile. The solution was filtered through a pre-wetted 0.2 μm nylon syringe filter (Millex-GN, 25 mm; Millipore Corporation, Bedford, MA, USA) prior to HPLC analysis.
Chromatographic analysis was performed using a Chromaster HPLC system (Hitachi High Technologies Corporation, Tokyo, Japan) equipped with a UV detector operated at 216 nm and controlled using HPLC System Manager software. Separation was achieved on a C18 column (250 mm × 4.6 mm, 5 μm; Thermo Fisher Scientific, USA) using a mobile phase consisting of acetonitrile and water (65:35, v/v) at a flow rate of 1.0 mL min⁻¹ and a column temperature of 40 °C. The injection volume was 10 μL. Artemisinin reference standard (≥98% purity; Chengdu Biopurity Phytochemicals Ltd., Chengdu, China) was dissolved in methanol and diluted to 1.0 mg/mL generate calibration curves for quantification. HPLC-grade acetonitrile was obtained from Fisher Scientific (UK).
2.9. Statistical Analysis
One-way ANOVA was used to compare plant height increment, total leaf area increase, and artemisinin content among treatments. Plant height increment and total leaf area increase were calculated as the difference between Day 14 and Day 1 measurements and used for statistical analysis. One-way analysis of variance (ANOVA) was performed using Microsoft Excel to evaluate differences among the three light treatments (natural sunlight, attenuated violet-blue laser light, and attenuated red laser light). When significant treatment effects were detected (p < 0.05), Tukey's honestly significant difference (HSD) test was performed for pairwise comparisons among treatment means using the ASTATSA online statistical calculator. Differences were considered statistically significant at p < 0.05.
3. Results
3.1. Light Intensity and Photon Flux Density
A. annua plants grown under natural sunlight received an average photosynthetic photon flux density (PPFD) of 206.2 µmol m⁻² s⁻¹, corresponding to approximately 1.2×10²⁰ photons m⁻² s⁻¹. In contrast, plants exposed to attenuated violet-blue laser and attenuated red laser received lower average photon fluxes. Assuming uniform illumination over the treatment area, the estimated photon flux densities were approximately 2.0 × 10⁸ photons m⁻² s⁻¹ for the attenuated violet-blue laser and 1.0 × 10⁷ photons m⁻² s⁻¹ for the attenuated red laser. Thus, the attenuated laser treatments delivered photon fluxes approximately 13 orders of magnitude lower than those provided by natural sunlight. Detailed photon-flux calculations are provided in Appendix A.
3.2. Plant Height and Total Leaf Area
Figure 2(a) compares the height of representative A. annua plants after 14 days of growth under natural sunlight, attenuated red laser light (635 nm), and attenuated violet-blue laser light (405 nm). Figure 2(b) shows that control plants reached a height of approximately 78 cm by Day 14.
The raw data for plant height and total leaf area recorded on Day 1 and Day 14 under natural sunlight, attenuated violet–blue laser, and attenuated red laser are provided in Table A1. Values are presented as mean ± standard deviation (n = 4). On Day 1 of the experiment, A. annua plants grown under natural sunlight had relatively uniform initial heights of 63.1 ± 0.9 cm. By Day 14, these plants reached an average height of 77.6 ± 0.9 cm, representing an approximate 23.0% increase in height. Plants exposed to the attenuated violet–blue laser had an initial height of 58.3 ± 2.3 cm and exhibited the greatest height increase, with a mean height gain of 23.3 ± 1.4 cm, representing an approximate 39.9% increase. In contrast, plants treated with the attenuated red laser had the shortest initial height (54.4 ± 2.6 cm) and attained a mean height gain of 17.6 ± 1.3 cm, corresponding to an approximate 32.4% increase. One-way ANOVA and Tukey’s HSD tests revealed significant differences in plant height increment among treatments (Figure 3a). Plants exposed to attenuated violet-blue laser light exhibited the greatest increase in height, followed by the attenuated red laser treatment, whereas plants grown under natural sunlight showed the smallest increase. However, no significant difference in height increment was observed between the attenuated violet-blue and attenuated red laser treatments.
Total leaf area differed significantly among light treatments. On Day 1, A. annua grown under natural sunlight had a total leaf area of 208.5 ± 19.7 cm², which increased to 217.2 ± 20.1 cm² by Day 14 (≈ 4.2% increase). Plants grown under attenuated violet–blue laser light increased from 164.7 ± 23.9 cm² to 170.1 ± 23.5 cm² (≈ 3.3% increase), while those under attenuated red laser light increased from 134.8 ± 24.8 cm² to 139.0 ± 25.4 cm² (≈ 3.1% increase). Plants grown under natural sunlight exhibited a significantly greater increase in total leaf area than plants exposed to attenuated violet–blue or attenuated red laser light (Figure 3b). However, the difference in total leaf area increase between plants exposed to attenuated violet–blue and attenuated red laser light was not statistically significant.
3.2. HPLC Analysis of Artemisinin in A. annua Leaves
Figure 4 shows representative HPLC chromatogram of artemisinin standard and leaf extracts obtained from A. annua plants grown under different light treatments. The artemisinin standard exhibits a major peak at retention time of 7.0 min (Figure 4a). Peaks observed near 6.5 min and 7.5 min have previously been assigned to artemisitene and deoxyartemisinin, under similar chromatographic conditions [19]. In leaf extracts, a major peak corresponding to the retention time of the artemisinin standard was detected in all treatments. The peak area associated with artemisinin was greatest in plants grown under natural sunlight and decreased in plants exposed to attenuated red laser light and attenuated violet-blue laser light. A slight retention-time shift (~0.1 min) was observed in extracts from the attenuated violet-blue treatment; however, additional analytical techniques would be required to determine whether this shift reflects compound modification or normal chromatographic variation.
Quantitative estimates of artemisinin concentration, dry-weight yield, and relative peak areas assigned to artemisitene and deoxyartemisinin are summarized in Table 1. Plants grown under natural sunlight exhibited the highest estimated artemisinin concentration (31.09 mg g⁻¹ DW), whereas attenuated red and attenuated violet-blue laser treatments resulted in substantially lower concentrations. In contrast, the chromatographic peak assigned to artemisitene was largest under attenuated red laser light, while the peak assigned to deoxyartemisinin was largest under attenuated violet-blue laser light.
4. Discussion
4.1. Plant Height and Total Leaf Area
In this study, 100-day-old A. annua plants grown under attenuated violet–blue light at ultra-low intensity were taller than those grown under attenuated red light at approximately the same intensity. This result differs from earlier studies, which reported greater plant height under red light than under violet–blue light [20]. Other studies found no clear height differences in young A. annua plants exposed to different LED lights for short periods [14]. These differences suggest that plant height responses depend not only on light color but also on light intensity, plant age, and exposure time. Under ultra-low light conditions, plants may respond differently to light quality under conditions of extreme photon limitation. Differences among studies may indicate that the effects of light spectrum vary with plant developmental stage and duration of exposure. Studies comparing single-color and mixed light conditions further support this idea. For example, plants grown under white light and white light supplemented with blue light showed similar heights [21], suggesting that blue light has little effect when it is only a small part of a broader light spectrum.
These observations suggest that the effects of blue wavelengths may depend strongly on the surrounding spectral environment. Under the conditions of the present study, plants exposed to attenuated violet-blue laser light exhibited greater height increment than plants exposed to attenuated red laser light. The greater elongation observed under the violet-blue treatment suggests that spectral quality may influence stem growth under extremely low photon flux densities. However, because the photon flux densities of the attenuated laser treatments were lower than those of natural sunlight, the observed responses may also reflect low-light acclimation or shade-avoidance-like responses associated with severe photon limitation.
Plants grown under natural sunlight exhibited the greatest increase in leaf area. This trend was consistent with the statistical analysis, which showed significantly greater leaf-area increase under natural sunlight than under either laser treatment. The greater increase in leaf area under natural sunlight likely reflects the substantially higher photon availability, which supports greater photosynthetic carbon assimilation and biomass accumulation. Together, these results suggest that under ultra-low light conditions, spectral quality interacts with photon availability to influence growth responses in A. annua.
4.2. Artemisinin Content
The results of this study demonstrate that A. annua plants grown under natural sunlight exhibited the highest artemisinin content in their leaves. The enhanced artemisinin yield can be attributed to the broad spectral composition and high photon flux of natural sunlight, both of which regulate the secondary metabolite production. This interpretation is supported by Wang et al. [22], who reported that higher sunlight intensity resulted in increased leaf artemisinin content compared with lower light intensities. Similarly, Poulson and Thai [23] found that exposure to high-intensity halide lamp light led to approximately a twofold increase in leaf artemisinin content, which was attributed to photoinhibition and light-induced stress responses. Additionally, UV-B radiation present in sunlight has been shown to induce the expression of artemisinin biosynthetic genes, therefore further enhancing artemisinin accumulation [24,25].
In contrast, we found that red laser light resulted in higher artemisinin content than violet–blue light. This finding contrasts with the results of Lopes et al. [26], who reported the highest artemisinin levels in A. annua grown in vitro under white fluorescent light, followed by blue LED light, while red LED light produced the lowest levels. Our results also differ from those of Sankhuan et al. [15] and Zhang et al. [12], who identified blue light as more effective in enhancing artemisinin accumulation. These disagreements may be attributed to differences in experimental conditions, particularly the monochromatic nature and extremely low photon flux of the laser light used in the present study. Although our results suggest that laser treatments were effective in promoting the accumulation of artemisinin precursors, they may have lacked the light intensity or spectral components necessary for the complete biosynthesis of artemisinin. The low photon flux may have been insufficient to fully activate photomorphogenic or photosynthetic signaling pathways involved in downstream artemisinin synthesis. Furthermore, factors such as plant age, light intensity, and treatment duration may also influence artemisinin accumulation in A. annua.
4.3. Limitations
This study has several limitations, including assessment of plants at a single developmental stage (approximately 100 days old), measurement of only plant height and total leaf area, a limited range of spectral wavelengths, and a relatively small sample size. Plant responses to ultra-low light may vary across growth stages, and molecular analyses would be needed to clarify the underlying physiological and biochemical mechanisms. Furthermore, the photon flux densities of the attenuated laser treatments were many orders of magnitude lower than those of natural sunlight, making it difficult to completely separate spectral effects from responses associated with extreme photon limitation. The limited spectral range may also have influenced the observed responses. In addition, each laser treatment was conducted within a single compartment, and the natural-sunlight and laser treatments were maintained in different physical environments; therefore, environmental effects cannot be completely separated from treatment effects. Because HPLC analyses were performed on representative samples without replicate injections, the peak-area comparisons should be regarded as semi-quantitative. The identities of chromatographic peaks assigned to artemisitene and deoxyartemisinin were inferred from retention-time matching and were not independently confirmed. Artemisinin concentrations were estimated using a single-point external standard calibration and should therefore be regarded as approximate. Therefore, the present study should be considered a pilot-scale investigation, and the observed responses require confirmation in larger-scale experiments with replicated environmental conditions.
5. Conclusions
This study examined the responses of Artemisia annua to extremely weak light, focusing on plant growth and artemisinin accumulation. Ultra-low photon fluxes generated from attenuated laser sources were applied to 100-day-old plants. Under the conditions tested, attenuated violet–blue laser light produced the greatest increase in plant height, whereas artemisinin accumulation exhibited an opposite trend. Artemisinin content was highest in plants grown under natural sunlight, lower under attenuated red laser light, and substantially reduced under attenuated violet–blue laser light. These findings indicate that artemisinin accumulation was strongly constrained under the ultra-low photon flux densities used in this study, while plant growth responses remained sensitive to spectral quality. Overall, the results suggest a trade-off between stem elongation and artemisinin accumulation under conditions of extreme photon limitation.
Funding
This research was funded by the Kasetsart University Research and Development Institute (KURDI), grant number; FF(KU)8.68.
Acknowledgments
The author gratefully acknowledges Dr. Benya Manochai (Department of Horticulture, Faculty of Agriculture, Kasetsart University) for providing Artemisia annua plant material used in this study, and Dr. Suporn Methaphatkarn (Department of Biochemistry, Kasetsart University) for conducting the HPLC analysis of artemisinin in the plant samples.
Conflicts of Interest
The authors declare no conflicts of interest. The funders had no role in the design of the study; in the collection, analyses, or interpretation of data; in the writing of the manuscript; or in the decision to publish the results.
Appendix A
Appendix A.1

Table A1.
Raw data of plant height and total leaf area under three light treatments.
| Light treatment | Plant height (cm) | Total leaf area (cm2) | ||
|---|---|---|---|---|
| Day 1 | Day 14 | Day 1 | Day 14 | |
| Natural Sunlight (Control) | 62.0 | 76.4 | 201.36 | 210.78 |
| 63.0 | 78.5 | 229.82 | 238.61 | |
| 64.0 | 77.5 | 184.63 | 192.44 | |
| 63.5 | 78.0 | 218.19 | 226.97 | |
| Attenuated-Violet-Blue laser | 56.2 | 78.0 | 143.59 | 149.22 |
| 57.0 | 81.0 | 175.88 | 182.10 | |
| 58.6 | 83.5 | 146.37 | 151.86 | |
| 61.5 | 84.0 | 193.15 | 197.33 | |
| Attenuated-Red laser |
52.0 | 69.0 | 119.89 | 124.22 |
| 53.5 | 70.5 | 149.84 | 153.79 | |
| 54.0 | 71.0 | 108.38 | 111.56 | |
| 58.0 | 77.5 | 161.28 | 166.43 | |
Appendix B
Figure A1.
Hanbury Brown and Twiss (HBT) setup. Left: schematic diagram; Right: experimental image. Abbreviations: beam splitter (BS), Single-photon avalanche photodetector (APD), Neutral density filter (ND), Time-digital convertor (TDC).
Figure A1.
Hanbury Brown and Twiss (HBT) setup. Left: schematic diagram; Right: experimental image. Abbreviations: beam splitter (BS), Single-photon avalanche photodetector (APD), Neutral density filter (ND), Time-digital convertor (TDC).
1) Photon Flux Density Over the Illuminated Plant Area.
The photon rate was estimated by dividing the count rate recorded by the avalanche photodiode (APD) by its detection efficiency (2.5% at 405 nm and 60% at 635 nm). APD measurements were performed prior to insertion of the neutral-density filter. Mean APD count rates for the attenuated violet-blue (405 nm) and attenuated red (635 nm) laser sources were approximately 5.6 × 10⁶ and 5.9 × 10⁶ counts s⁻¹, respectively. These values correspond to photon rates of approximately 2.24 × 10⁸ photons s⁻¹ for the violet-blue laser and 9.83 × 10⁶ photons s⁻¹ for the red laser. After insertion of a neutral-density filter (OD = 0.5; transmission = 31.6%), the photon rates were reduced to 7.08 × 10⁷ photons s⁻¹ at 405 nm and 3.11 × 10⁶ photons s⁻¹ at 635 nm.
Additional optical losses arising from the ground-glass diffuser, surface reflections, beam splitter, and collection efficiency were not quantified and therefore were not included in the photon-rate calculations. Following transmission through the diffuser, the photon flux was assumed to be approximately uniform across the illuminated area encompassing the leaves of four potted plants. Each laser diode was positioned 1.80 m above the center of four potted plants, generating a circular illumination area approximately 0.7 m in diameter. Assuming uniform illumination over an area of approximately 0.385 m², the estimated photon flux densities were 1.84 × 10⁸ photons m⁻² s⁻¹ for the attenuated violet-blue laser and 8.08 × 10⁶ photons m⁻² s⁻¹ for the attenuated red laser. These values represent estimated photon flux densities over the illuminated plant area and do not account for diffuser transmission losses, reflection losses, or leaf interception efficiency.
2) Verification of Coherent Laser Emission Using HBT Measurement.
The second-order coherence function, g2(τ), can be used to distinguish between chaotic (g2(0) > 1), coherent (g2(0) = 1), and sub-Poissonian (g2(0) <1) light sources. The Hanbury Brown and Twiss (HBT) setup (Figure A1) equipped with single-photon avalanche diodes (APDs) was used to measure g2(τ) for attenuated laser sources. The incident light was divided by a beam splitter and detected by two APDs, while a time-correlated single-photon counting module recorded the delay time (τ) between detection events. Chaotic light exhibits a coincidence peak at τ = 0 owing to photon bunching, whereas ideal coherent light exhibits g²(τ) = 1 for all delay times. As shown in Figure A2, both attenuated laser sources exhibited nearly flat g²(τ) functions over the measured delay range, consistent with coherent photon statistics. Data were collected over a 3-h measurement period. The measured values at zero delay were g²(0) = 1.179 ± 0.081 for the attenuated violet-blue laser and g²(0) = 1.178 ± 0.183 for the attenuated red laser, both close to the expected value of unity for coherent light, indicating coherent laser emission.
Figure A2.
Second-order coherence function, g2(τ), of the attenuated violet-blue (top) and attenuated red (bottom) laser sources. The measured g2(0) values were 1.179 ± 0.081 and 1.178 ± 0.183, respectively, indicating coherent photon statistics.
Figure A2.
Second-order coherence function, g2(τ), of the attenuated violet-blue (top) and attenuated red (bottom) laser sources. The measured g2(0) values were 1.179 ± 0.081 and 1.178 ± 0.183, respectively, indicating coherent photon statistics.
References
- G.M.P. World malaria report 2023; Who.int; World Health Organization, 30 November 2023; Available online: https://www.who.int/publications/i/item/9789240086173.
- Li, S.; Yuan, W.; Yang, P.; Antoun, M. D.; Balick, M. J.; Cragg, G. M. Pharmaceutical crops: An overview. Pharm. Crops 2010, 1(1), 1–17. [Google Scholar] [CrossRef]
- Brown, G. D. The biosynthesis of artemisinin (Qinghaosu) and the phytochemistry of Artemisia annua L. (Qinghao). Molecules 2010, 15(11), 7603–7698. [Google Scholar] [CrossRef] [PubMed]
- Soni, R.; Shankar, G.; Mukhopadhyay, P.; Gupta, V. A concise review on Artemisia annua L. Ind. Crops Prod. 2022, 184, 115072: 1–17. [Google Scholar] [CrossRef]
- Li, Y.; Yang, Y.; Li, L.; Tang, K.; Hao, X.; Kai, G. Advanced metabolic engineering strategies for increasing artemisinin yield in Artemisia annua L. Hortic. Res. 2024, 11(2), uhad292. [Google Scholar] [CrossRef] [PubMed]
- Mannan, A.; Ahmed, I.; Arshad, W.; Hussain, I.; Mirza, B. Effects of vegetative and flowering stages on biosynthesis of artemisinin in Artemisia species. Arch. Pharmacal Res. 2011, 34(10), 1657–1661. [Google Scholar] [CrossRef] [PubMed]
- Zhang, L.; Ye, H. C.; Li, G. F. Effect of development stage on artemisinin content and SCAR marker of high-artemisinin strains of Artemisia annua L. J. Integr. Plant Biol. 2006, 48(9), 1054–1062. [Google Scholar] [CrossRef]
- Gupta, S. K.; Singh, P.; Bajpai, P.; Ram, G.; Singh, D.; Gupta, M. M.; Jain, D. C.; Khanuja, S. P.; Kumar, S. Morphogenetic variation for artemisinin and volatile oil in Artemisia annua. Ind. Crops Prod. 2002, 16(3), 217–224. [Google Scholar] [CrossRef]
- Marchese, J. A.; Ferreira, J. F.; Rehder, V. L.; Rodrigues, O. Water deficit effect on biomass and artemisinin accumulation in Artemisia annua. Braz. J. Plant Physiol. 2010, 22(1), 1–9. [Google Scholar] [CrossRef]
- Soni, P.; Abdin, M. Z. Water deficit-induced oxidative stress affects artemisinin content and expression of proline metabolic genes in Artemisia annua L. FEBS Open Bio 2016, 7(3), 367–381. [Google Scholar]
- Zhang, S.; Zhang, L.; Zou, H.; Qiu, L.; Zheng, Y.; Yang, D.; Wang, Y. Effects of light on secondary metabolite biosynthesis in medicinal plants. Front. Plant Sci. 2021, 12, 781236: 1–16. [Google Scholar] [CrossRef] [PubMed]
- Zhang, D.; Sun, W.; Shi, Y.; Wu, L.; Zhang, T.; Xiang, L. Red and blue light promote artemisinin accumulation in Artemisia annua L. Molecules 2018, 23(6), 1329: 1–17. [Google Scholar] [CrossRef] [PubMed]
- Kim, K. W.; Hwang, C. H. Enhanced biosynthesis of artemisinin by environmental stresses in Artemisia annua. J. Plant Biotechnol. 2022, 49(4), 307–315. [Google Scholar] [CrossRef]
- Zhang, N.; Yang, H.; Han, T.; Kim, H. S.; Marcelis, L. F. Toward greenhouse cultivation of Artemisia annua: The application of LEDs in regulating plant growth and secondary metabolism. Front. Plant Sci. 2023, 13, 1099713: 1–12. [Google Scholar] [CrossRef] [PubMed]
- Sankhuan, D.; Niramolyanun, G.; Kangwanrangsan, N.; Nakano, M.; Supaibulwatana, K. Variation in terpenoids in Artemisia annua leaves under different LED spectra. BMC Plant Biol. 2022, 22(1)(128), 1–13. [Google Scholar]
- Li, Q.; Orcutt, K.; Cook, R. L.; Sabines-Chesterking, J.; Tong, A. L.; Schlau-Cohen, G. S.; Zhang, X.; Fleming, G. R.; Whaley, K. B. Single-photon absorption and emission from a natural photosynthetic complex. Nature 2023, 619(7969), 300–304. [Google Scholar] [CrossRef] [PubMed]
- Chiangga, S. Room-Temperature Fiber-Coupled Single-Photon Source from CdTeSeS Core Quantum Dots. Photonics 2025, 12(1), 52: 1–10. [Google Scholar] [CrossRef]
- Marcon, M.; Mariano, K.; Braga, R. A.; Paglis, C. M.; Scalco, M. S.; Horgan, G. W. Estimation of total leaf area in perennial plants using image analysis. Rev. Bras. De Eng. Agrícola E Ambient. 2011, 15(1), 96–101. [Google Scholar] [CrossRef]
- Lapkin, A. A.; Walker, A.; Sullivan, N.; Khambay, B.; Mlambo, B.; Chemat, S. Development of HPLC analytical protocols for quantification of artemisinin in biomass and extracts. J. Pharm. Biomed. Anal. 2009, 49(4), 908–915. [Google Scholar] [CrossRef] [PubMed]
- Rai, N.; Kumari, S.; Singh, S.; Saha, P.; Pandey, A. K.; Pandey-Rai, S. Modulation of morpho-physiological attributes and in situ analysis of secondary metabolites using Raman spectroscopy in response to red and blue light exposure in Artemisia annua. Environ. Exp. Bot. 2024, 217, 105563: 1–18. [Google Scholar] [CrossRef]
- Gooran, M. N.; Jalali Honarmand, S.; Kahrizi, D. The effect of different light spectrum ratios and PPFD on agronomic and physiological traits in Artemisia annua L. J. Med. Plants By-Prod. 2022, 11(2), 139–147. [Google Scholar]
- Wang, M. L.; Jiang, Y. S.; Wei, J. Q.; Wei, X.; Qi, X. X.; Jiang, S. Y.; Wang, Z. M. Effects of irradiance on growth and artemisinin content of Artemisia annua L. Photosynthetica 2008, 46(1), 17–20. [Google Scholar] [CrossRef]
- Poulson, M. E.; Thai, T. Effect of high light intensity on photoinhibition, oxyradicals and artemisinin content in Artemisia annua L. Photosynthetica 2015, 53(3), 403–409. [Google Scholar] [CrossRef]
- Pandey, N.; Pandey-Rai, S. Short-term UV-B radiation-mediated transcriptional responses and altered secondary metabolism in in vitro propagated Artemisia annua plantlets. Plant Cell Tissue Organ Cult. 2014, 116(3), 371–385. [Google Scholar]
- Ma, T. Y.; Gao, H.; Zhang, D.; Shi, Y. H.; Zhang, T. Y.; Shen, X. F.; et al. Transcriptome analyses revealed UV-B irradiation and gibberellins coordinately promote artemisinin accumulation in Artemisia annua. Chin. Med. 2020, 15, 1–17. [Google Scholar] [CrossRef] [PubMed]
- Lopes, E. M.; Guimarães-Dias, F.; Gama, T. D. S.; Macedo, A. L.; Valverde, A. L.; de Moraes, M. C.; de Aguiar-Dias, A. C. A.; Bizzo, H. R.; Alves-Ferreira, M.; Tavares, E. S.; Macedo, A. F. Artemisia annua L. and photoresponse: from artemisinin accumulation, volatile profile and anatomical modifications to gene expression. Plant Cell Rep. 2020, 39(1), 101–117. [Google Scholar] [PubMed]
Figure 1.
Experimental setup. (a) Photograph of potted plants inside the tent compartments. (b) Dimensioned schematic of the tent structure, plant layout, and light treatments.
Figure 1.
Experimental setup. (a) Photograph of potted plants inside the tent compartments. (b) Dimensioned schematic of the tent structure, plant layout, and light treatments.
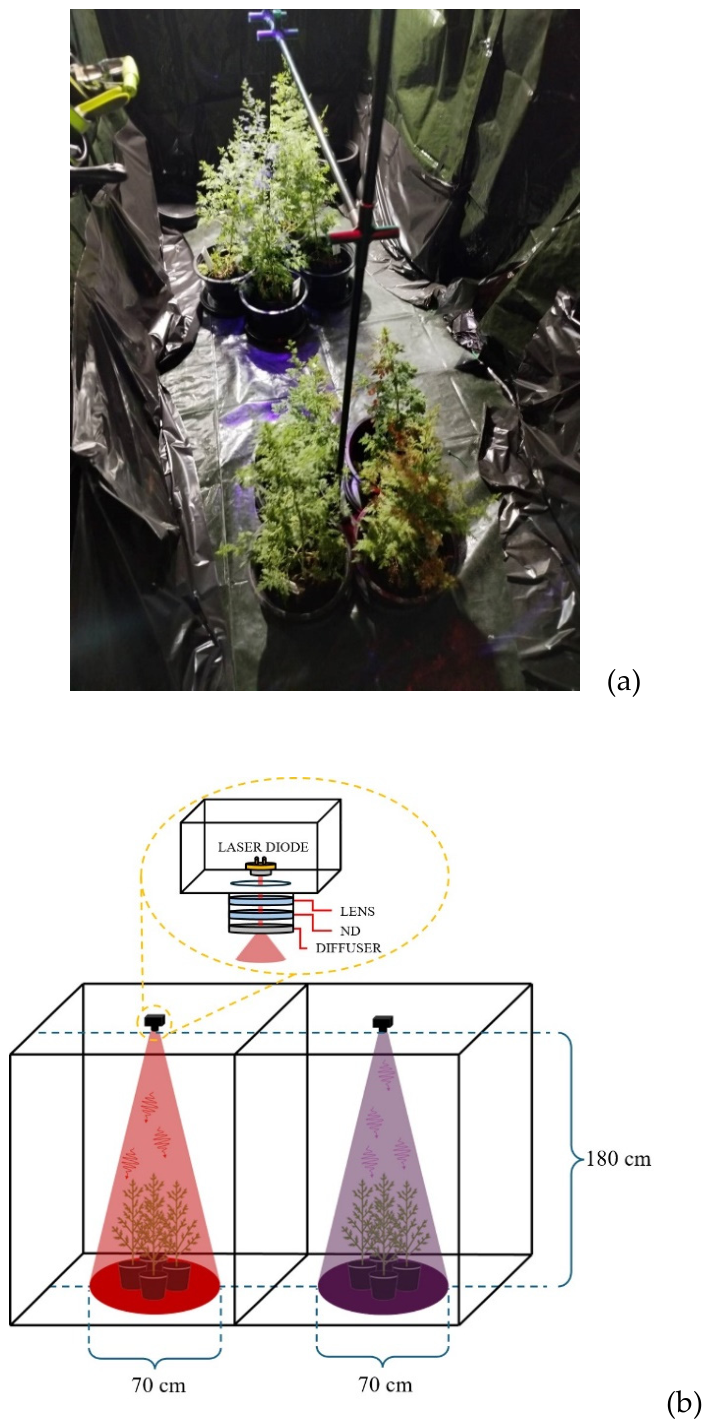
Figure 2.
(a) A. annua plants grown under natural sunlight (left), attenuated 635 nm red laser (center), and attenuated 405 nm violet-blue laser (right). (b) Control plant grown under natural sunlight reached ~78 cm in height on Day 14.
Figure 2.
(a) A. annua plants grown under natural sunlight (left), attenuated 635 nm red laser (center), and attenuated 405 nm violet-blue laser (right). (b) Control plant grown under natural sunlight reached ~78 cm in height on Day 14.
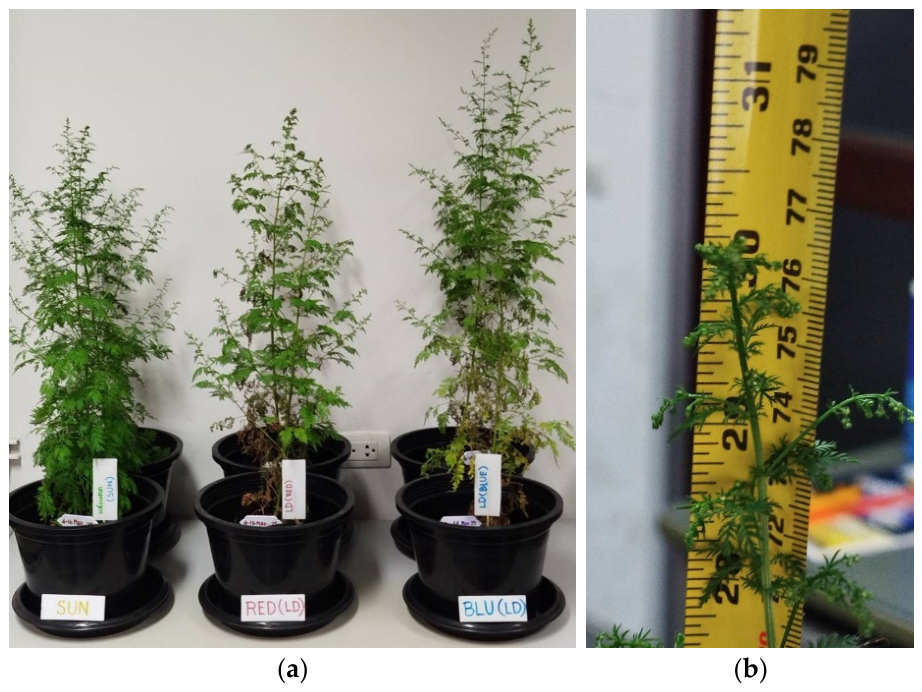
Figure 3.
(a) Increase in plant height and (b) increase total leaf area measured under different light treatments over 14 days. Bars represent the mean ± standard deviation (SD), n = 4. Statistical differences between treatment means were determined using Tukey's HSD test. * p < 0.05; ** p < 0.01.
Figure 3.
(a) Increase in plant height and (b) increase total leaf area measured under different light treatments over 14 days. Bars represent the mean ± standard deviation (SD), n = 4. Statistical differences between treatment means were determined using Tukey's HSD test. * p < 0.05; ** p < 0.01.
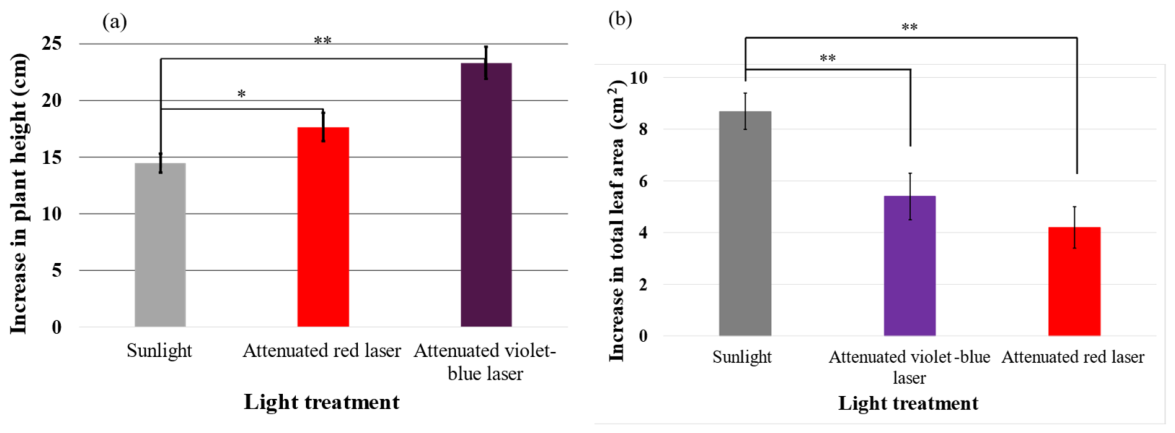
Figure 4.
HPLC chromatograms used for artemisinin quantification: (a) standard artemisinin; and extracts from A. annua grown under (b) natural sunlight, (c) attenuated red laser, and (d) attenuated violet-blue laser.
Figure 4.
HPLC chromatograms used for artemisinin quantification: (a) standard artemisinin; and extracts from A. annua grown under (b) natural sunlight, (c) attenuated red laser, and (d) attenuated violet-blue laser.
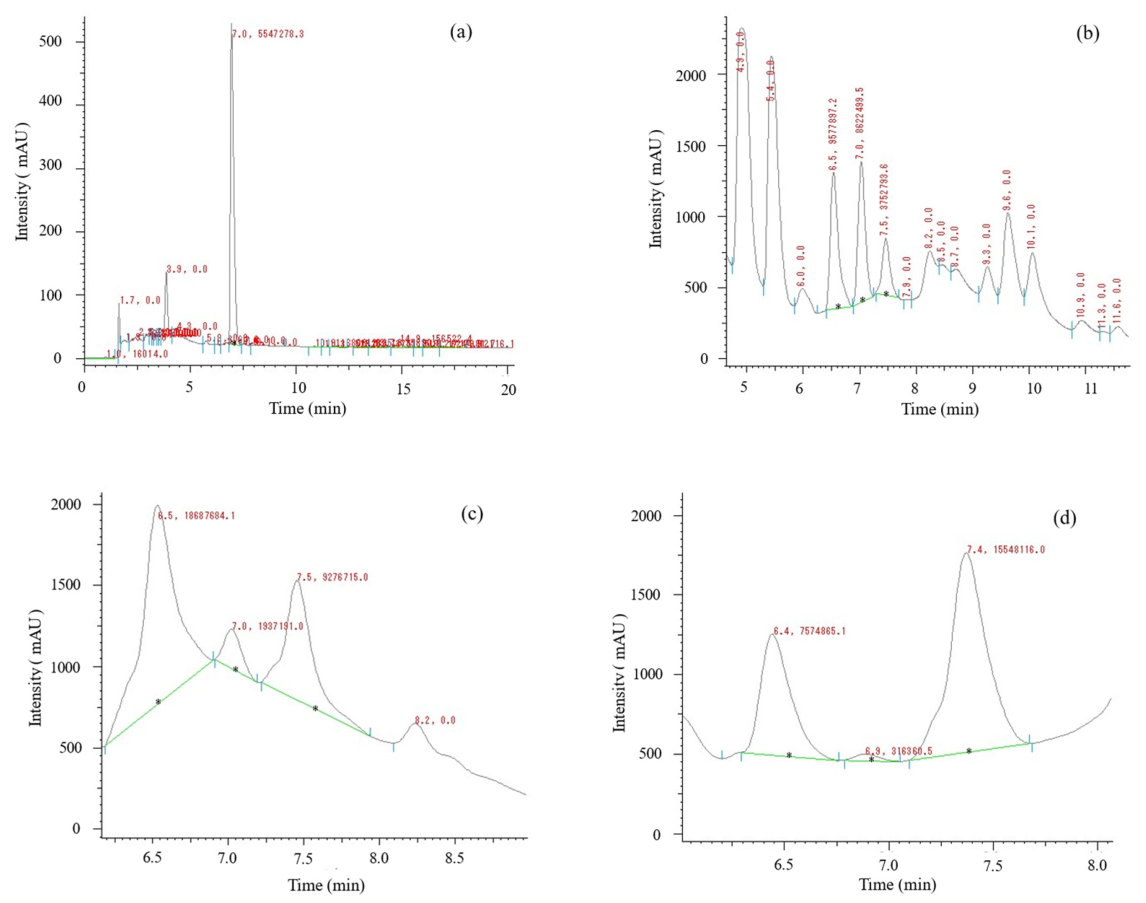
Table 1.
Quantitative yield and relative mass accumulation of sesquiterpenes in Artemisia annua leaves under varying light treatments.
Table 1.
Quantitative yield and relative mass accumulation of sesquiterpenes in Artemisia annua leaves under varying light treatments.
| Light Treatment Group |
Artemisinin Content (mg g−1 DW) |
Artemisinin Yield (% Dry Weight) |
Artemisitene Peak Area (×106 A.U.) |
Deoxyartemisinin Peak Area (×106 A.U.) |
|---|---|---|---|---|
| Natural Sunlight (Control) |
31.09 | 3.11% | 9.58 | 3.75 |
| Attenuated Red Laser | 6.98 | 0.70% | 18.69 | 9.28 |
| Attenuated Violet-Blue Laser | 1.14 | 0.11% | 7.57 | 15.55 |
Disclaimer/Publisher’s Note: The statements, opinions and data contained in all publications are solely those of the individual author(s) and contributor(s) and not of MDPI and/or the editor(s). MDPI and/or the editor(s) disclaim responsibility for any injury to people or property resulting from any ideas, methods, instructions or products referred to in the content. |
© 2026 by the authors. Licensee MDPI, Basel, Switzerland. This article is an open access article distributed under the terms and conditions of the Creative Commons Attribution (CC BY) license (http://creativecommons.org/licenses/by/4.0/).
Copyright: This open access article is published under a Creative Commons CC BY 4.0 license, which permit the free download, distribution, and reuse, provided that the author and preprint are cited in any reuse.


