

Submitted:
18 June 2026
Posted:
22 June 2026
You are already at the latest version
Abstract
The stability of financial institutions is crucial; however, current regulations evaluate credit, liquidity, and market risks separately, which hampers a consistent assessment of an entity's true loss-absorbing capacity. To address this, our study introduces the Risk Capacity Index (ICR) as a comprehensive indicator of financial sustainability for organizations in Colombia's solidarity sector. The approach adjusts a macrofinancial risk capacity model to fit the institutional setting, defining the ICR as the ratio of technical equity to total risk exposure, including expected credit losses, market Value-at-Risk, and the liquidity gap. This index was empirically tested with monthly data from 2025 from a closed savings and credit cooperative, using sensitivity tests and stress scenarios aligned with Basel III standards. Results show that liquidity risk is the main driver of capacity depletion, responsible for most of the index's fluctuations and causing non-linear deterioration during adverse conditions, while market risk effects are minor. Significant funding pressures sharply reduce the ICR below viability levels, leading to structural issues on the balance sheet. The ICR provides a new, integrated early-warning tool that complements traditional solvency measurements. The study highlights that managing liquidity and liabilities proactively, rather than just increasing capital, is key to preserving financial stability in cooperative models.
Keywords:
risk capacity
; solidarity sector
; Basel III
; expected loss
; financial resilience
1. Introduction
The stability of financial institutions stands as a cornerstone of contemporary academic and regulatory agendas due to its profound implications for global economic and social resilience. Recent systemic crises have vividly underscored the structural fragility of financial networks when subjected to unanticipated macroeconomic shocks. Notably, the 2008 global financial crisis demonstrated how rapidly interconnected solvency and liquidity distress can propagate through systemic channels, while the COVID-19 pandemic re-exposed the acute vulnerabilities of financial entities serving low-income and marginalized populations (Claessens et al., 2010; Drehmann & Juselius, 2014; Llerena Sarsoza et al., 2025). In response to these compounding disruptions, international macroprudential frameworks have undergone rigorous tightening, cementing Basel III as the definitive global benchmark for capital adequacy, leverage caps, and liquidity management (Committee on Banking Supervision, 2017).
Within this global landscape, Colombia's solidarity sector, comprising savings and credit cooperatives, employee funds, and mutual associations, serves as a vital pillar of financial inclusion, currently supporting more than 7 million associates (Superintendencia de Economía Solidaria de Colombia, 2025). Despite their socio-economic importance, these institutions face severe operational headwinds stemming from baseline institutional heterogeneity, highly restricted access to wholesale capital markets, and direct exposure to volatile financial risk factors. To mitigate these pressures, domestic prudential supervision has historically relied on a fragmented architecture of specialized risk management systems: CRMS for credit risk, LRMS for liquidity, ORMS for operational risk, and LARMS for anti-money laundering. While this siloed compliance approach has undoubtedly enhanced individual risk control at the institutional level (Arias-Serna et al., 2023), its primary systemic limitation remains the absolute absence of a unified diagnostic tool capable of comprehensively measuring an entity’s true loss-absorbing capacity.
Contemporary banking literature has increasingly explored the dimensions of risk capacity through diverse methodological lenses. Bigio & d’Avernas (2021) conceptualizes financial risk capacity as a structural "risk budget" governed by hard capital, liquidity, and funding limits, explicitly demarcating it from subjective risk appetite. Our study adapts this macroeconomic formulation to the micro-institutional level, operationalizing their theoretical constraints into a concrete, quantitative indicator designed to measure an institution's genuine ability to absorb aggregate risk exposures. This direction aligns with and expands upon parallel empirical findings; for instance, Drehmann & Juselius (2014) demonstrate that traditional, capital-centric metrics possess weak predictive power regarding impending distress, pointing to liquidity as the critical variable during market volatility. In developing regions, however, comprehensive research has lagged noticeably. While Calomiris & Haber (2014) stress the imperative of tailoring macroprudential rules to specific domestic contexts, while Hameed & Ghafoor (2022) evaluate how microfinance firms and cooperatives navigate abrupt liquidity shocks but stop short of providing an integrated measure of comprehensive risk management capacity. Nationally, prominent studies by Bermeo-Cisneros & Moreno-Narváez (2024) and Jarama-Jarama & Jaramillo-Calle (2024) have advanced the analysis of credit provisions and liquidity hazards within Colombian cooperatives and employee funds, linking internal governance directly to institutional resilience. Nevertheless, these valuable contributions continue to treat capital, credit, market, and liquidity parameters in isolation, leaving a critical gap regarding a unified framework.
The regulatory roadmap mandated by national supervisory bodies underscores the highly opportune and timely nature of this study. Although the implementation deadlines for specialized risk systems have advanced progressively, the empirical data required to perform integrated, multi-dimensional calculations has only recently reached the baseline fidelity and availability necessary for systematic research. This informational limitation is particularly evident within the operational risk (ORMS) framework, where regulatory supervisory standards have not yet defined a formalized, forward-looking quantitative model, restricting current institutional practices to retrospective loss logging. Consequently, the recent mandatory enforcement of the prospective expected loss model for credit risk within savings and credit cooperatives—fully implemented in January 2025 (Superintendencia de Economía Solidaria de Colombia, 2025) marks an unprecedented significant. By unlocking the first consistent series of forward-looking accounting information for these specialized cooperative entities, this regulatory transition provides a unique and immediate window of opportunity to construct integrated metrics, establishing the proposed index as a highly timely diagnostic tool for contemporary risk governance.
In this context, this study introduces the Risk Capacity Index (ICR), a metric that operationalizes Bigio & d’Avernas (2021) capacity constraints by combining technical equity against an additive pool of observable financial vulnerabilities: expected credit losses, market Value-at-Risk, and the short-term liquidity gap. By calculating the ratio between an entity’s technical equity and its aggregate risk exposure, the ICR represents a major methodological leap over existing fragmented frameworks. It effectively integrates liquidity, credit, and market dimensions into a single, unified analytical lens to diagnose loss-absorption dynamics under concurrent stress environments. Applying this index to a comprehensive 2025 dataset reveals that liquidity risk acts as the absolute primary driver of capacity consumption, whereas market risk plays a marginal role. Concurrently, the ICR emerges as a vital, unifying analytical instrument that simultaneously complements existing specialized systems and provides a transformative mechanism for strategic management and supervisory oversight across the Colombian solidarity economy, fully aligned with Basel III tenets.
The remainder of this article is structured as follows. Section 2 describes the materials and methods, detailing the theoretical foundation of financial risk capacity and its adaptation into the proposed Risk Capacity Index (ICR) for the Colombian solidarity sector, as well as the framework for sensitivity analysis and stress testing. Section 3 presents empirical results, analyzing the monthly evolution of the ICR and the relative impact of its individual components using 2025 data from a representative entity. Section 4 provides a comprehensive discussion of stress-testing dynamics, evaluating the non-linear amplification of risks and the primacy of liquidity risk under varying adverse scenarios. Finally, Section 5 outlines their conclusions, summarizing the study's main methodological and empirical contributions.
2. Materials and Methods
2.1. Defining and Formulating of Financial Risk Capacity
Financial risk capacity is a key financial concept for explaining how well institutions withstand shocks. Simply put, risk appetite is the level of risk an institution is willing to take, while risk capacity is the hard limit set by its available capital and regulatory or liquidity rules.
Bigio & d’Avernas (2021) define financial risk capacity as the real limit that financial firms face when taking on risk. It is the share of capital assets that is supported by intermediaries’ net worth. This caps the system’s lending capacity. In short, financial risk capacity is:
where:
is the financial risk capacity in period t
is the aggregate net worth of financial intermediaries in period t,
denotes the total capital stock of the economy in period t.
This expression summarizes the proportion of real assets that can be sustained for each unit of financial wealth, and therefore the limit to efficient intermediation. The intuition behind this formulation is that intermediaries' equity strength determines the extent to which they can support the financing of productive investments and absorb losses from shocks. A reduction in , whether due to accounting losses, impairment in asset valuation, or capital withdrawals, translates into a contraction of . Similarly, an increase in that is not accompanied by a proportional increase in financial wealth also reduces the system's relative capacity to sustain the new asset volume.
Bigio & d’Avernas (2021) define both terms based on integrals that reflect the aggregate valuation of assets and liabilities in general equilibrium.
2.2. Proposal for the Concept of Risk Capacity for the Colombian Solidarity Sector
The original formulation by Bigio & d’Avernas (2021) defines financial risk capacity as the ratio between the net worth of the financial system and the aggregate capital of the economy, where both are expressed as integrals that aggregate the positions of heterogeneous agents. In the case of the Colombian solidarity sector, the same logic can be applied with the following adaptations: Net worth corresponds to the entity's aggregate accounting equity (share capital, reserves, accumulated surpluses, among others), which absorbs losses and sustains operations. Physical capital is interpreted as the portfolio of credit and productive investments financed by the entity, representing the assets exposed to risk in its intermediation role. In this way, the concept of capacity, which in the macroeconomic model relates equity and productive capital, translates into a simplified balance sheet of a cooperative or employee fund:
Although the formulation of Bigio & d’Avernas (2021) defines risk capacity as a macro-financial relationship between intermediaries' net worth and the economy's capital stock, its adaptation to the Colombian solidarity sector requires consideration of structural and regulatory particularities (Esther et al., 2023). Solidarity entities do not operate under the same leverage and diversification conditions as commercial banks but depend primarily on their members' savings as a primary source of funding (Superintendencia de Economía Solidaria de Colombia, 2025). Given the above, this basic expression needs to be enriched to capture exposures to specific risks affecting the solidarity sector and subject to regulation by the Superintendencia de Economía Solidaria de Colombia (2025).
Therefore, in this research, a Risk Capacity Index (ICR) is proposed, inspired by the notion of wealth restriction introduced by Bigio & d’Avernas (2021), but adapted to the metrics used by Colombian regulation. Formally, the indicator is expressed as:
Where
= Technical equity in period t and is calculated by the expression:
Being : Share capital in the period, : Reservations in the period, : Funds for specific allocation in the period t, : Surpluses or losses for the year in period t, : Cumulative results for first-time adoption in period t, : Another comprehensive result in the period, : Surpluses or losses of non-controlling participations in the period, and : Profit or loss for prior years in the period.
And:
Total exposure risk of the cooperative in period t calculated as:
Where : Expected loss in period t for credit risk (taken from the CRMS Credit Risk Management System), : Value at risk in the period t or maximum loss associated with market risk (Taken from the MRMS Market Risk Management System) and : Liquidity gap in the period (Liquidity Risk Management System LRMS).
Risk exposure is conceived as the additive aggregation of three fundamental components: credit risk, liquidity risk, and market risk. This approach reflects the need to integrate the main financial vulnerability factors faced by solidarity entities into a single metric, enabling them to be articulated within a coherent analytical framework comparable to available assets.
The structural scope of the current Risk Capacity Index (ICR) focuses strictly on Quantifiable Financial Balance Sheet Risks (credit, market, and liquidity), where exposures directly impact asset valuations and immediate cash flow through observable, forward-looking parameters. Consequently, operational risk is intentionally excluded from the baseline index core. Rather than a limitation, this boundaries-setting provides a clean separation between financial and non-financial risk dynamics. While solidarity institutions systematically log historical operational loss events to comply with supervisory reporting, these metrics represent retrospective accounting impacts rather than prospective balance-sheet capital charges suitable for direct denominator standardization.
Therefore, the architectural design of the ICR is presented as a robust framework optimized for standardizable balance sheet risks. This formulation maintains a flexible, modular methodological structure. It establishes a clear pathway for future research extensions to formally incorporate operational risk into the aggregate denominator once long-term operational loss data achieves the granular fidelity required to implement advanced capital-at-risk modeling, such as the Loss Distribution Approach (LDA).
Each component of the ICR is estimated following the standardized methodologies proposed by the Superintendencia de Economía Solidaria de Colombia (2025) as described below.
The expected loss (EL) associated with credit risk is defined as the product of the value exposed to the risk (EAD), the probability of default (PD), and the loss given default (LGD):
This calculation is widely documented in the literature (Crouhy et al., 2000) and adopted in the Colombian regulatory framework (Superintendencia de Economía Solidaria de Colombia, 2025), which reflects the average expected loss for the loan portfolio.
The loss associated with market risk was approximated using Value-at-Risk (VaR) methodologies, which is a technique widely used in financial management (Danielsson et al., 2016; Jorion, 2007). For a diversified portfolio, it is calculated as:
where is the vector of individual exposure, is the transposed exposure vector, and Σ is the correlation matrix between the risk factors that make up the portfolio. In this study, the calculation was carried out at a confidence level of 99% and a horizon of 1 month (20 business days on average), following the methodology defined in the Market Risk Management System (Superintendencia de Economía Solidaria de Colombia, 2025).
Liquidity risk was represented through the liquidity gap (LG), defined as the difference between expected revenues and contractual and non-contractual outflows in each time horizon:
where is the expected revenue, are contractual departures and non-contractual ones. This indicator is required by the LRMS (Superintendencia de Economía Solidaria de Colombia, 2025) and supported by the literature (Stoika et al., 2025). It allows you to capture the risk of funding in short-term horizons.
By replacing equations 7, 8, and 9 in equation 6, we will obtain the total risk exposure expressed as:
Therefore, the proposed Risk Capacity Index will be obtained by replacing equations 5 and 10 in equation 4 as follows:
The proposed index synthesizes, in a single measure, the relationship between capital resources and quantifiable risks, thereby providing a comprehensive indicator of the effective capacity to absorb losses. In this way, a dimensionless metric is obtained that expresses how many times the equity can cover the aggregate set of risks. Unlike regulatory models that treat each risk independently, it recognizes the simultaneous interaction among exhibitions, aligning with the perspective on capacity constraints proposed in the international literature. In this sense, the can be interpreted as the applied and quantifiable version of . for the Colombian solidarity sector, allowing it to move from a theoretical macroeconomic formulation to a practical tool for financial monitoring at the entity level.
2.3. Methodology for Sensitivity Analysis and Stress Testing
To evaluate the structural robustness of the Risk Capacity Index (ICR) and its ability to capture the dynamics of financial deterioration under adverse conditions, an integrated sensitivity analysis and stress scenario scheme was implemented. This approach is based on the guidelines of the Basel Committee on Banking Supervision (Committee on Banking Supervision, 2017) , emphasizing the need to incorporate forward-looking methodologies that assess the resilience of financial institutions to severe but plausible shocks.
From a methodological perspective, sensitivity analysis is an essential instrument for examining the functional stability of composite indicators. It allows for the identification of the direction of change in the face of disturbances, the relative magnitude of the impacts, and the possible existence of nonlinearities (Glasserman, 2003; Saltelli et al., 2008).
2.3.1. Local Sensitivity (Partial Derivatives)
The partial derivatives of the ICR allow us to characterize its marginal behavior in the face of infinitesimal changes in its determinants:
These expressions reveal three fundamental properties:
- Structural monotonicity: the ICR responds in the expected direction to changes in its determinants, which guarantees economic coherence.
- Non-linearity: sensitivity is inversely dependent on the square of total exposure, implying that the marginal impact of risks is amplified in contexts of high vulnerability.
- Marginal symmetry: the three risk components have the same marginal effect in absolute terms, suggesting that the differentiation among risks arises from their relative magnitudes rather than from their functional structure.
2.3.2. Stress Scenarios (Basel III Approach)
To systematically assess the resilience of the ICR under adverse conditions, stress scenarios were modeled by applying simultaneous proportional shocks to its determinants (Committee on Banking Supervision, 2017). The ICR under stress conditions is formulated as:
The ICR under stress conditions is defined as:
where the perturbed variables follow a set of simultaneous proportional shocks:
Substituting these elements yields the reduced parametric form, evaluated via the vector of disturbances
Then the ICR can be interpreted as a parametric function:
which allows us to characterize its behavior as a non-linear transformation of the financial system in the face of joint shocks. This formulation is consistent with the forward-looking approach to resilience assessment promoted in Basel III, in which capital adequacy must be analyzed under plausible adverse scenarios (Committee on Banking Supervision, 2017).
3.2.3. Scenario Calibration and Viability Condition
Three discrete stress scenarios were calculated to represent different levels of severity, supported by empirical evidence and specialized literature:
- Moderate Scenario : Represents cyclical fluctuations of the financial system. A 20% increase in expected losses consistent with the procyclicality of credit risk (Drehmann & Juselius, 2014), a 15% increase in VaR reflects moderate volatility fluctuations (Glasserman, 2003), a 30% liquidity shock models non-systemic funding tensions (Allen et al., 2015), and a 10% capital reduction is consistent with standard regulatory exercises (Committee on Banking Supervision, 2017).
- Severe Scenario : Captures the conditions of a financial crisis. A 40% increase in credit losses reflects the non-linear nature of credit risk in recessions (Jorion, 2007), a 60% increase in the liquidity gap represents amplification mechanisms associated with liquidity spirals (Brunnermeier & Pedersen, 2009), a 30% increase in VaR indicates substantial volatility, and a 20% capital loss aligns with systemic crisis evidence.
- Extreme Scenario Represents deep systemic disruptions. The doubling of the liquidity gap is consistent with severe funding crises, a 60% increase in expected losses reflects extreme credit deterioration, a 50% VaR increase captures episodes of extreme volatility, and a 30% capital reduction aligns with reverse stress testing exercises (Committee on Banking Supervision, 2017).
For each modeled scenario , the condition for structural loss-absorbing capacity (financial sustainability) requires that the entity remains above the viability threshold:
2.4. Characterization of the Study Entity
The unit of analysis for this study corresponds to a closed savings and credit cooperative belonging to the Colombian solidarity financial sector, whose identity is protected by confidentiality agreements. These entities are characterized by providing financial intermediation exclusively to their associates, who share a common labor relationship, operating under the core principles of cooperation and mutual aid. This specific organization was selected using a convenience sampling approach due to its advanced maturity in risk management, which guaranteed the comprehensive availability of the required monthly data series covering the study period. Because of its regulatory classification as a specialized financial cooperative, the institution is legally mandated to implement the Comprehensive Risk Management System (IRMS) dictated by national supervisory authorities. This macroprudential compliance framework requires the systematic deployment of specialized systems to identify, measure, control, and monitor core financial and operational vulnerabilities. The robust risk architecture of the target cooperative ensured the availability of high-fidelity data covering the expected credit loss, the Value-at-Risk, and the liquidity gap.
In terms of financial magnitude, the institution demonstrated moderate balance sheet slack, with its technical assets fluctuating within a stable range during the study period, establishing a solid baseline to test the Risk Capacity Index (ICR) against idiosyncratic shocks. The entity's financial model is structured around a traditional retail intermediation matrix. On the liability side, funding is captured primarily through demand deposits, fixed-term deposit certificates structured across multiple maturity bands and scheduled contractual savings plans. On the asset side, resources are allocated into the credit market through multiple lending modalities, focusing on payroll-deductible and over-the-counter lines for both consumer and housing purposes, alongside commercial credit allocations. Its structural funding architecture reflects the classic model of the solidarity sector, remaining intrinsically dependent on the deposits of its associates. This concentration exposes the balance sheet to pronounced, highly predictable liquidity cycles, characterized by concentrated seasonal outflows of contractual savings that the organization must support at the end of the fiscal year.
An analysis of the cooperative's risk profile reveals a specific multi-dimensional exposure configuration across its portfolio. Credit risk is highly concentrated within the consumer lending portfolio, which represents most total loan placements and exhibits material degradation across impaired regulatory categories, signaling a heightened latent non-performing loan ratio. Concurrently, liquidity risk is driven by a profound structural dependence on term resources, where fixed-term deposit certificates constitute most total captured deposits. The concentration of these instruments within short-term maturity horizons creates substantial refinancing and roll-over pressures, generating systemic liquidity stress during contractionary cycles. Conversely, market risk exposure remains structurally bounded due to a highly conservative and restricted investment portfolio primarily earmarked for the statutory liquidity reserve; thus, market risk is predominantly constrained to interest rate risk in the banking book. Operational risk exposures stem from a hybrid operational model that integrates physical branch offices with digital transactional channels, subjecting the institution to infrastructure vulnerabilities, fraudulent events, and administrative underwriting errors under the oversight of standardized protocols. To holistically evaluate these dimensions, the study integrates this institutional characterization into a comprehensive risk assessment framework that operationalizes the management cycle by synthesizing the core parameters of international standards with enterprise risk management frameworks, ensuring full alignment with the macroprudential guidelines established by the Basel Committee on Banking Supervision and domestic financial regulations.
3. Results
As mentioned in the previous section, the formulation of risk capacity in the Colombian solidarity sector is based on the notion proposed by Bigio & d’Avernas (2021), which defines the maximum level of exposure an institution can tolerate without compromising its stability. In this case study, this notion was operationalized through the ICR which integrates, in a single indicator, technical equity, expected loss, value at risk, and liquidity gap. The proposal seeks to overcome the limitations of current regulatory models, which assess these risks independently, and instead offers a comprehensive measure of financial resilience. This structure allows the absorption capacity of potential losses to be measured uniformly, so that ICR > 1 values indicate equity sufficiency and ICR < 1 values indicate vulnerability. The application of this model was carried out using monthly data from January to December 2025, the period during which the expected loss model issued by Supersolidaria came into force (Superintendencia de Economía Solidaria de Colombia, 2025).
3.1. Results Obtained from the ICR and Its Components
The calculations presented here are based on the monthly data series provided by the entity under study: technical equity, Value-at-Risk (VaR), expected credit loss (PE), and liquidity gap. The Risk Capacity Index (ICR) is defined as the ratio of equity to aggregate exposure (ER). Table 1 shows the monthly values calculated by the entity for each ICR component in 2025 (in millions of COP pesos).
Table 1 shows that the mean ICR, close to 7.27, indicates moderate slack; however, the standard deviation and the presence of extreme values (November and December) indicate significant volatility. Overall, the liquidity gap is the determinant of capacity consumption, accounting for between 83% and 96% of aggregate exposure in all months analyzed. The expected loss comprises variable and secondary shares, while the market VaR is practically irrelevant (<0.2%). The evolution of the ICR is shown in Figure 1. The indicator starts in January at 11.8, reflecting significant slack: equity of COP 62,054 million covers more than 11 times the aggregate exposure (approximately COP 5,249 million). Subsequently, the indicator fluctuates throughout the year, reaching its lowest level in November (-9.9), associated with a negative liquidity gap, and its highest level in December (17.4), which shows a significant recovery in coverage capacity. The entity under study presents low liquidity risk in the short term; however, between October and November 2025, the gap decreased significantly, from $20,324 million to $938 million, representing a -95.4% decrease. The abrupt fall in the Risk Capacity Index (ICR) to -9.95 in November is explained by an extreme liquidity shock stemming from a strategic decision by Financial Management. To prepare for the massive outflow of contractual savings scheduled for December, the entity decided to transfer resources from its investments into cash and equivalents. Given that the regulations require different maturation dynamics, investments mature in proportion to their maturities, while cash is calculated based on historical decreases, this accounting treatment severely altered the distribution of flows across time bands. As a result, the liquidity gap collapsed to negative values, generating what the document calls a "structural breakdown" of the balance sheet, an extreme imbalance that temporarily nullifies the entity's ability to absorb risks.
October is a critical month, with an ICR of 2.6. This drop is not due to significant changes in equity, which remains at COP 65,213 million, but to an abrupt increase in the liquidity gap to COP 24,128 million, representing approximately 96% of the total exposure for the month. Figure 2 shows this behavior: the liquidity gap shoots up in October, far exceeding the levels recorded in the previous and subsequent months.
The months of March and April show a significant recovery. With the gap normalized to 4,167 and 3,620 million, the ICR rises to 12.49 and 14.07, respectively. However, in June, the PE rose to 965 million, raising its relative share to 11.4% of total exposure and suggesting a worsening in lending conditions.
In September and October, the trend is downward again. The ICR falls to 5.7 and 2.6, driven by the simultaneous growth of the gap (from 10,451 to 24,128 million) and the PE (from 970 to 975 million). This dynamic reveals a scenario in which liquidity and credit pressures combine to sustainably reduce the capacity to absorb risk. Figure 3 compares the stability of equity with changes in total exposure, showing that it is the risk components, not capital, that determine fluctuations in the ICR.
Statistical analysis confirms the indicator's volatility. The mean ICR was 7.27, the median 7.40, and the standard deviation 6.94. The range extends from a low of -9.9 in November to a high of 17.4 in December. This dispersion shows that risk capacity is sensitive to idiosyncratic shocks, particularly liquidity shocks.
Sensitivity exercises allow the effectiveness of different management measures to be assessed. In September, a 20% reduction in the gap would have raised the ICR from 5.7 to 7.1, and a 50% reduction would have brought it to 11.0. In contrast, in June, even if the PE was reduced by 50%, the ICR would have barely gone from 7.40 to 7.84. These results confirm that liquidity management is the most efficient lever to improve the ICR in the short term, while reducing the PE has a more gradual impact.
The critical episode in October, when the ICR fell to 2.6, underscores how a sudden increase in the liquidity gap can drastically erode the capacity to absorb risks, even in the absence of equity impairment. This behavior is similar to that described in the literature on liquidity spirals (Brunnermeier & Pedersen, 2009), in which temporary financing tensions are amplified and, in a non-linear way, reduce institutions' capacity to sustain their positions. In the solidarity sector, where liability structures are often heavily dependent on members' deposits, these episodes can be more frequent and potentially more damaging than in traditional commercial banks. The results show that EL represents a constant and significant fraction of exposure (≈8–13%), with an upward trend in the last months analyzed. This finding coincides with regulatory concerns expressed after the pandemic, when the Superintendence of the Solidarity Economy emphasized the need to adopt expected loss models to anticipate portfolio deterioration. Indeed, the increase in the PE in June, which coincided with a fall in the ICR to 7.40, shows that the progressive materialization of credit risk can be combined with liquidity pressures to generate fragile scenarios. In contrast, market risk, as measured by VaR, was marginal across all periods, accounting for less than 0.2% of exposure. This result does not invalidate its methodological relevance, but it does indicate that, in practice, solidarity entities concentrate their vulnerability on liquidity and credit management.
From a comparative perspective, the ICR proposed in this study is a useful indicator that complements traditional solvency metrics. Unlike regulatory capital ratios, the ICR explicitly integrates liquidity and credit interactions, offering a more dynamic view and being sensitive to idiosyncratic events. This makes it a monitoring tool that could contribute to improving risk governance in the solidarity sector, in line with what has been suggested by the literature on early warning indicators (Borio & Drehmann, 2009). The practical implications are clear: recapitalization is not a viable strategy in the face of severe liquidity shocks, as it would require disproportionate increases in assets. On the contrary, reducing exposures, particularly the liquidity gap, is shown to be the most effective lever for improving the ICR in the short term. This conclusion resonates with international evidence that underscores the importance of active liability management and diversification of funding for small and medium-sized institutions (Allen et al., 2015).
4. Discussion: Stress Testing Dynamics
To comprehensively evaluate the robustness of the Financial Risk Capacity Index (ICR) and its practical utility for the solidarity sector, the indicator’s behavior was analyzed under three calibrated stress scenarios (Moderate, Severe, and Extreme) based on Basel III forward-looking principles. The results obtained reveal critical insights into the structural vulnerabilities of cooperative entities and highlight the complex, non-linear dynamics of financial deterioration.
4.1. Non-Linearity and the Amplification of Risk
The results demonstrate that the ICR exhibits highly non-linear dynamics under simultaneous perturbations to its determinants. This non-linearity is an inherent property of the indicator's rational structure, in which the aggregate risk exposure in the denominator amplifies the effects of shocks when baseline exposures are already high.
As observed in the trajectory of the stress scenarios (Figure 4), the divergence between the Moderate, Severe, and Extreme scenarios widens significantly as the severity of the shocks increases. In periods with high initial levels of the indicator (e.g., March and April), the system demonstrates substantial absorption capacity. However, in periods with less initial slack, small disturbances induce abrupt falls, exponentially degrading the entity's risk-bearing capacity.
The graph illustrates the non-linear deterioration dynamic. Crossing the $ICR=1$ threshold in severe and extreme scenarios defines a region of financial inviability, while negative values reflect a structural breakdown associated with severe liquidity imbalances.
4.2. The Primacy of Liquidity Risk in the Solidarity Sector
From a risk decomposition perspective, the impact of shocks on the ICR is strictly determined by the structure of the exposure. The data confirms that:
Because the liquidity gap () overwhelmingly dominates the total exposure, the term becomes the primary driver of the index's deterioration. This generates a remarkably high elasticity of the ICR against liquidity shocks. This empirical result is highly consistent with the broader literature on systemic risk, which identifies liquidity as the primary channel for the transmission and amplification of shocks, often triggering liquidity spirals (Avila et al., 2025; Brunnermeier & Pedersen, 2009).
4.3. Viability Thresholds and Structural Breakouts
A central finding of this application is the identification of a region of "financial inviability," mathematically characterized by the failure to meet the financial sustainability condition:
Table 2 reveals that the degradation of the ICR is progressive with the severity of the scenario but highly heterogeneous between periods.
While resilient months easily withstand shocks, periods such as July and October exhibit latent fragility. In October, an observed ICR of 2.60 rapidly collapses to 1.00 under the Severe scenario and 0.50 under the Extreme scenario, crossing into the region of inviability. This indicates that the entity temporarily loses its structural capacity to absorb losses.
Furthermore, the data from November illustrates a "structural breakout." In this month, the ICR turns deeply negative across all scenarios. This negative valuation does not merely represent a lack of capital; it indicates an extreme balance sheet imbalance, a profound liquidity crisis where traditional stability mechanisms are no longer effective. Conversely, the rapid recovery observed in December demonstrates the highly dynamic nature of the system, confirming that risk capacity in the solidarity sector is heavily dependent on the cyclical recomposition of the liquidity gap.
The stress testing outcomes validate the ICR as a highly sensitive early-warning tool. The observation that capital sufficiency can evaporate rapidly under severe funding crises proves that evaluating risks in isolated, fragmented silos provides a false sense of security. For cooperative entities, these findings underscore that proactive liability management and the continuous monitoring of integrated metrics like the ICR are essential to maintaining long-term financial resilience.
5. Conclusions
This study proposes the Risk Capacity Index (ICR) as an integrated metric to evaluate institutional financial robustness, successfully operationalizing the macrofinancial concept of risk capacity constraints at the firm level. By simultaneously articulating technical equity against the expected credit loss, market Value-at-Risk (VaR), and the short-term liquidity gap, the ICR overcomes the limitations of traditional regulatory indicators that focus solely on capital in a static manner. Empirically, the findings demonstrate that liquidity risk constitutes the primary determinant of capacity consumption within the cooperative model, questioning the adequacy of prudential frameworks centered exclusively on equity solvency. Furthermore, the index serves a prescriptive function by confirming, through parametric sensitivity analysis, that the active mitigation of the liquidity gap represents the most efficient short-term lever to preserve financial stability against idiosyncratic shocks.
Regarding avenues for future research, it is pertinent to delve deeper into modeling the seasonality of liquidity gaps in solidarity entities, allowing for an accurate capture of the impact of salary cycles and localized activities on fund flows. Additionally, it is recommended to incorporate more robust market risk measures into the aggregate denominator, such as Expected Shortfall, alongside quantitative operational risk indicators whose interaction could alter the comprehensive diagnostic of risk capacity.
Author Contributions
For research articles with several authors, a short paragraph specifying their individual contributions must be provided. The following statements should be used “Conceptualization, M.A, L.M,; methodology, M.A, L.M, M.L.; software M.A, L.M, M.L, J.Q; validation, M.A, L.M, M.L.J.Q; formal analysis, M.A, L.M, M.L investigation, M.A, L.M, M.L, J.Q resources, M.A, L.M, M.L, J.Q; data curation, M.A, L.M, M.L. J.Q; writing—original draft preparation, M.A, L.M, M.L.; writing—review and editing, M.A, L.M, M.L. J.Q.; visualization, M.A, L.M, M.L, J.Q; supervision, M.A, L.M,.; project administration, M.A, L.M, M.L.. All authors have read and agreed to the published version of the manuscript.” Please turn to the Cedit taxonomy for the term explanation. Authorship must be limited to those who have contributed substantially to the work reported.
Funding
This research received no external funding.
Informed Consent Statement
Not applicable.:
Data Availability Statement
The data supporting the findings of this study are available from the corresponding author upon reasonable request.
Conflicts of Interest
The authors declare no conflicts of interest.
References
- Allen, F.; Carletti, E.; Marquez, R. Deposits and bank capital structure. J. Financ. Econ. 2015, 118(3), 601–619. [Google Scholar] [CrossRef]
- Arias-Serna, M. A.; Bedoya-Londoño, D. A.; Muñoz-Calle, S. M. Desarrollo de una plataforma tecnológica para la gestión integral del riesgo financiero en el Sector Solidario Colombiano. Rev. Ibérica De Sist. E Tecnol. De Informação 2023, (E63), 28–43. [Google Scholar]
- Avila, G. M. C.; Pérez, Á. B. B.; Toalombo, M. E. P.; Naranjo, G. G. M. Solvencia y liquidez COAC segmento 2 y 3 en Chimborazo: Un estudio comparativo. Polo Del. Conoc. 2025, 10(6), 1918–1940. [Google Scholar] [CrossRef]
- Bermeo-Cisneros, J. B.; Moreno-Narváez, V. P. Provisiones y riesgos crediticios en cooperativas de ahorro y crédito en Ecuador [Provisions and credit risks in credit unions in Ecuador]. Rev. Multidiscip. Perspect. Investig. 2024, 4, 29–42. [Google Scholar] [CrossRef]
- Bigio, S.; d’Avernas, A. Financial Risk Capacity. Am. Econ. J. Macroecon. 2021, 13(4), 142–181. [Google Scholar] [CrossRef]
- Borio, C.; Drehmann, M. Assessnig the risk of banking crises - revisited - BIS Quarterly Review, part 3, March 2009. BIS Q. Rev. 2009, 1–18. Available online: https://ssrn.com/abstract=1513316.
- Brunnermeier, M. K.; Pedersen, L. H. Market Liquidity and Funding Liquidity. Rev. Financ. Stud. 2009, 22(6), 2201–2238. [Google Scholar] [CrossRef]
- Calomiris, C. W.; Haber, S. Fragile by Design: Banking Crises, Scarce Credit,and Political Bargains, 1st ed.; Princeton University Press, 2014; Available online: https://press.princeton.edu/books/hardcover/9780691155241/fragile-by-design.
- Claessens, S.; Dell’Ariccia, G.; Igan, D.; Laeven, L. Cross-country experiences and policy implications from the global financial crisis. Econ. Policy 2010, 25(62), 267–293. [Google Scholar] [CrossRef]
- Committee on Banking Supervision, B. Basel Committee on Banking Supervision Basel III: Finalising post-crisis reforms. 2017. Available online: https://www.bis.org/basel_framework/.
- Crouhy, M.; Galai, D.; Mark, R. Risk Management, 1st ed.; McGraw-Hill New York, 2000; Vol. 1. [Google Scholar]
- Danielsson, J.; James, K. R.; Valenzuela, M.; Zer, I. Model risk of risk models. J. Financ. Stab. 2016, 23, 79–91. [Google Scholar] [CrossRef]
- Drehmann, M.; Juselius, M. Evaluating early warning indicators of banking crises: Satisfying policy requirements. Int. J. Forecast. 2014, 30(3), 759–780. [Google Scholar] [CrossRef]
- Esther, R.; Guailla, P.; Leonor, V.; López, P. Estrategias para mitigación del riesgo financiero en cooperativas de ahorro y crédito del segmento 3: Strategies for mitigating financial risk in segment 3 credit unions. LATAM Rev. Latinoam. De Cienc. Soc. Y Humanidades 2023, 4(2), 24–37. [Google Scholar] [CrossRef]
- Glasserman, P. Monte Carlo Methods in Financial Engineering, 1st ed.; Springer, 2003. [Google Scholar]
- Hameed, A.; Ghafoor, F. Determinants of liquidity risk management in microfinance institutions. J. Contemp. Bus. Islam. Financ. (JCBIF) 2022, 2(1), 86–93. [Google Scholar]
- Jarama-Jarama, R. M.; Jaramillo-Calle, C. Y. Provisiones contables para riesgos crediticios: estrategias innovadoras en las Cooperativas de Ahorro y Crédito. Rev. Arbitr. Interdiscip. Koinon\’\ia 2024, 9(2), 223–249. [Google Scholar] [CrossRef]
- Jorion, P. Value at Risk: The New Benchmark for Managing Financial Risk, 3rd ed.; McGraw-Hill New York, 2007; Vol. 1. [Google Scholar]
- Llerena Sarsoza, G. Y.; Rosales Pallasco, F. O.; Llerena Sarsoza, G. Y.; Rosales Pallasco, F. O. Análisis de los Indicadores Financieros de las Cooperativas de Ahorro y Crédito del Segmento I De Ecuador Usando HJ-Biplot y Clúster Jerárquico. Rev. Econ. Y Política 2025, 42(42), 81–99. [Google Scholar] [CrossRef]
- Saltelli, A.; Ratto, M.; Andres, T.; Campolongo, F.; Cariboni, J.; Gatelli, D.; Saisana, M.; Tarantola, S. Global sensitivity analysis : the primer; John Wiley & Sons, 2008; Available online: https://books.google.com/books/about/Global_Sensitivity_Analysis.html?hl=es&id=wAssmt2vumgC.
- Stoika, V.; Paździor, M.; Nogaj, Ł.; Nowak, M. Financial resilience of cooperative banks: the Polish experience. Eur. Res. Stud. J. 2025, 28(2), 38–50. [Google Scholar] [CrossRef]
- Superintendencia de Economía Solidaria de Colombia. Circular Básica Contable y Financiera - Capitulo III - Sistema de Administración de Riesgo de Liquidez – SARL. Anexo 1 - Metodología y Modelo Estándar de Medición del Riesgo de Liquidez para las Cooperativas de Ahorro y Crédito, Multiactivas e Integrales con Sección de Ahorro y Crédito. 2025, pp. 1–14. Available online: https://www.supersolidaria.gov.co/sites/default/files/data/sarl_anexo_1_metodologia_y_modelo_estandar_de_medicion_del_riesgo_de_liquidez_para_las_cooperativas_de_ahorro_y_credito_0.pdf.
Figure 1.
Evolution of the Risk Capacity Index (ICR), Year 2025.
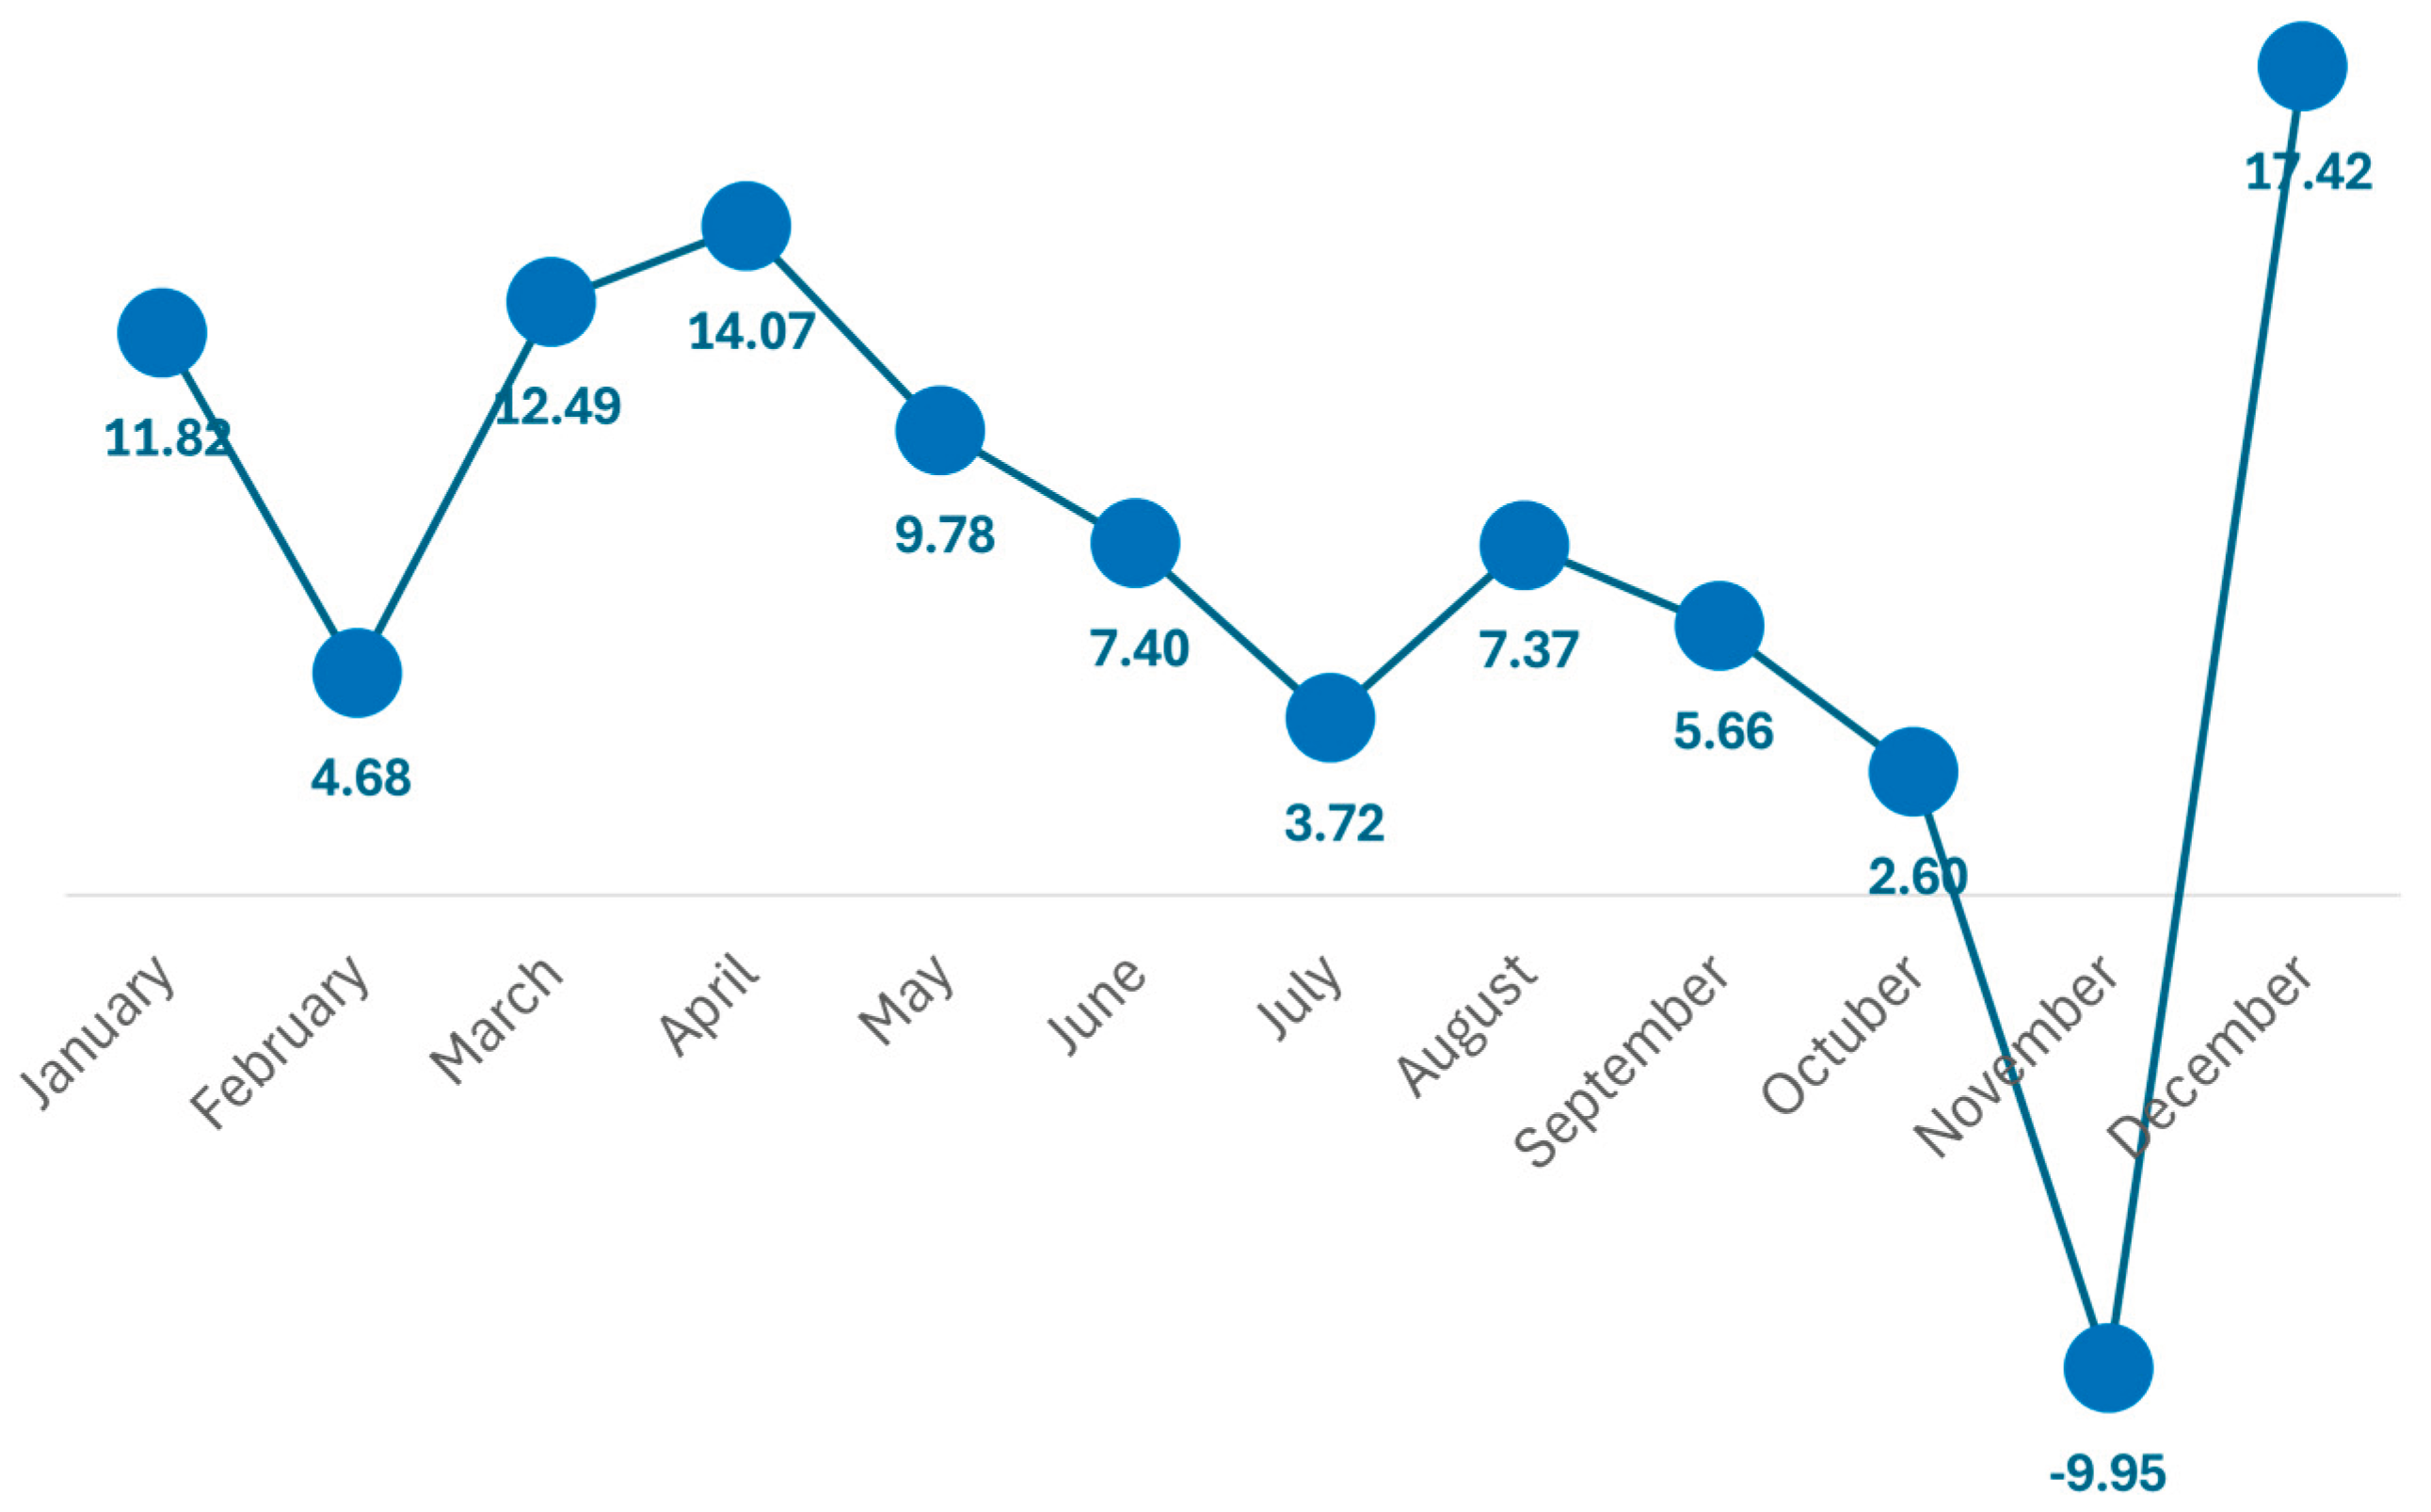
Figure 2.
Monthly liquidity gap (million COP), Year 2025.
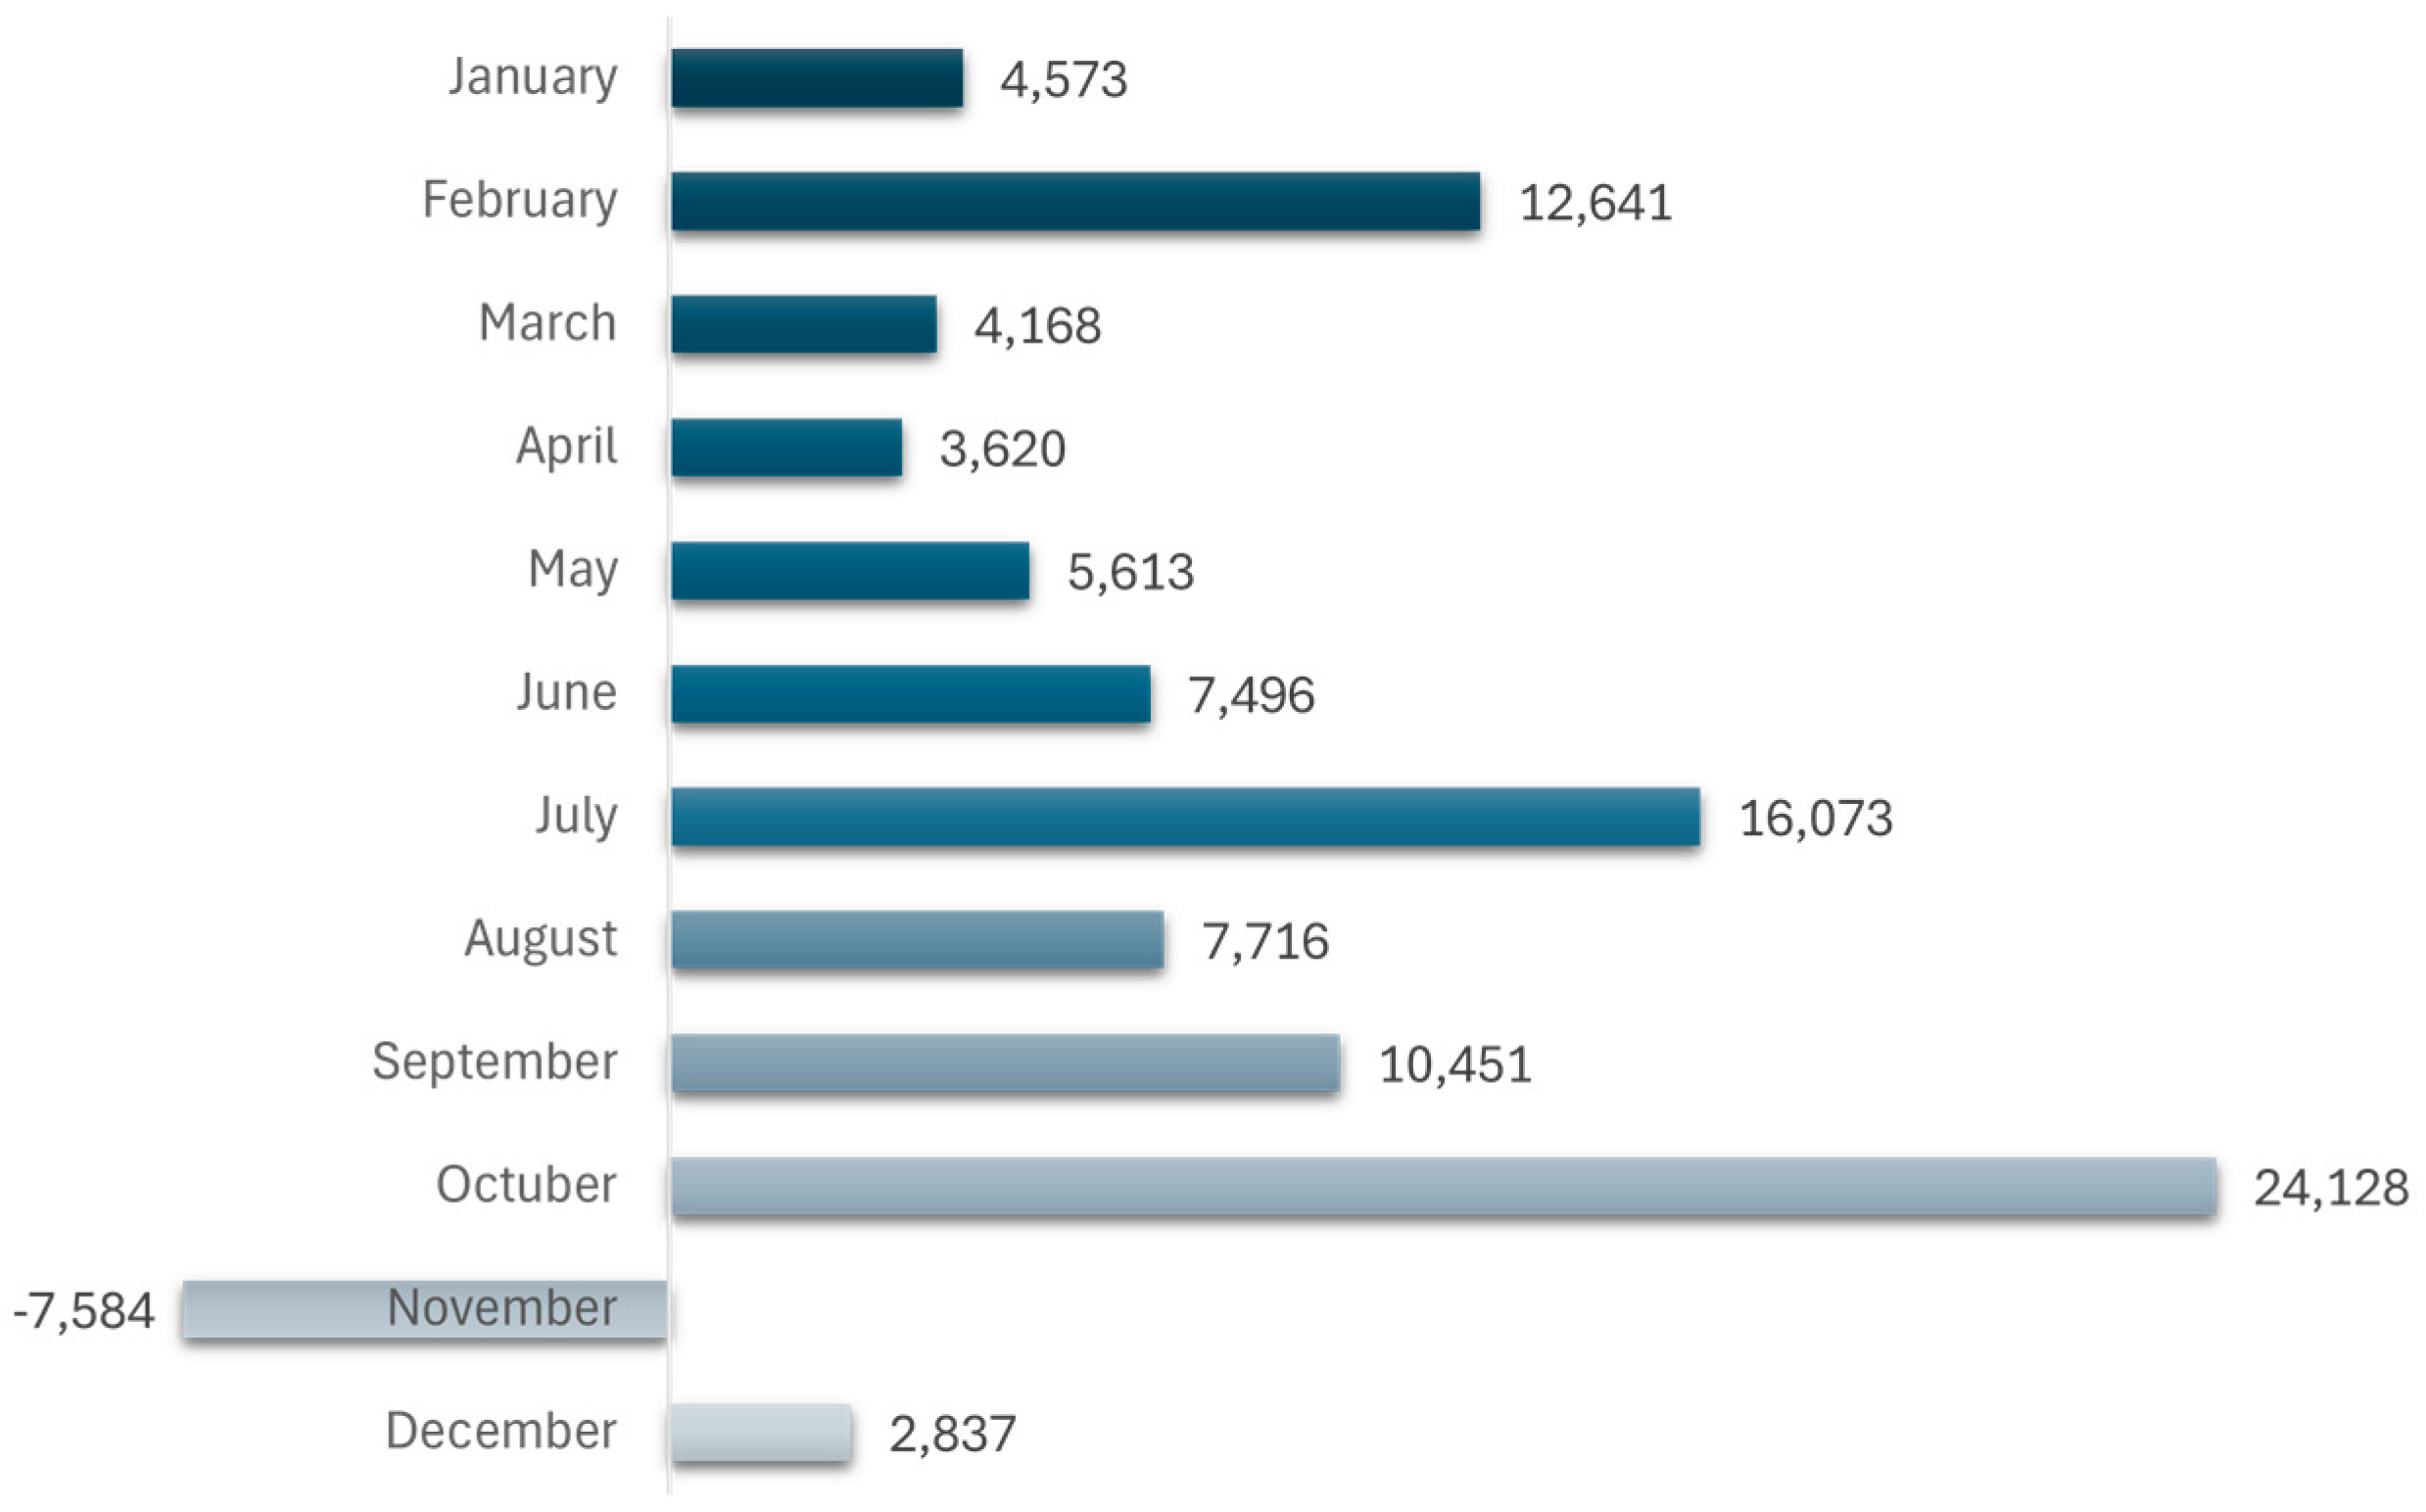
Figure 3.
Equity vs total risk exposure.
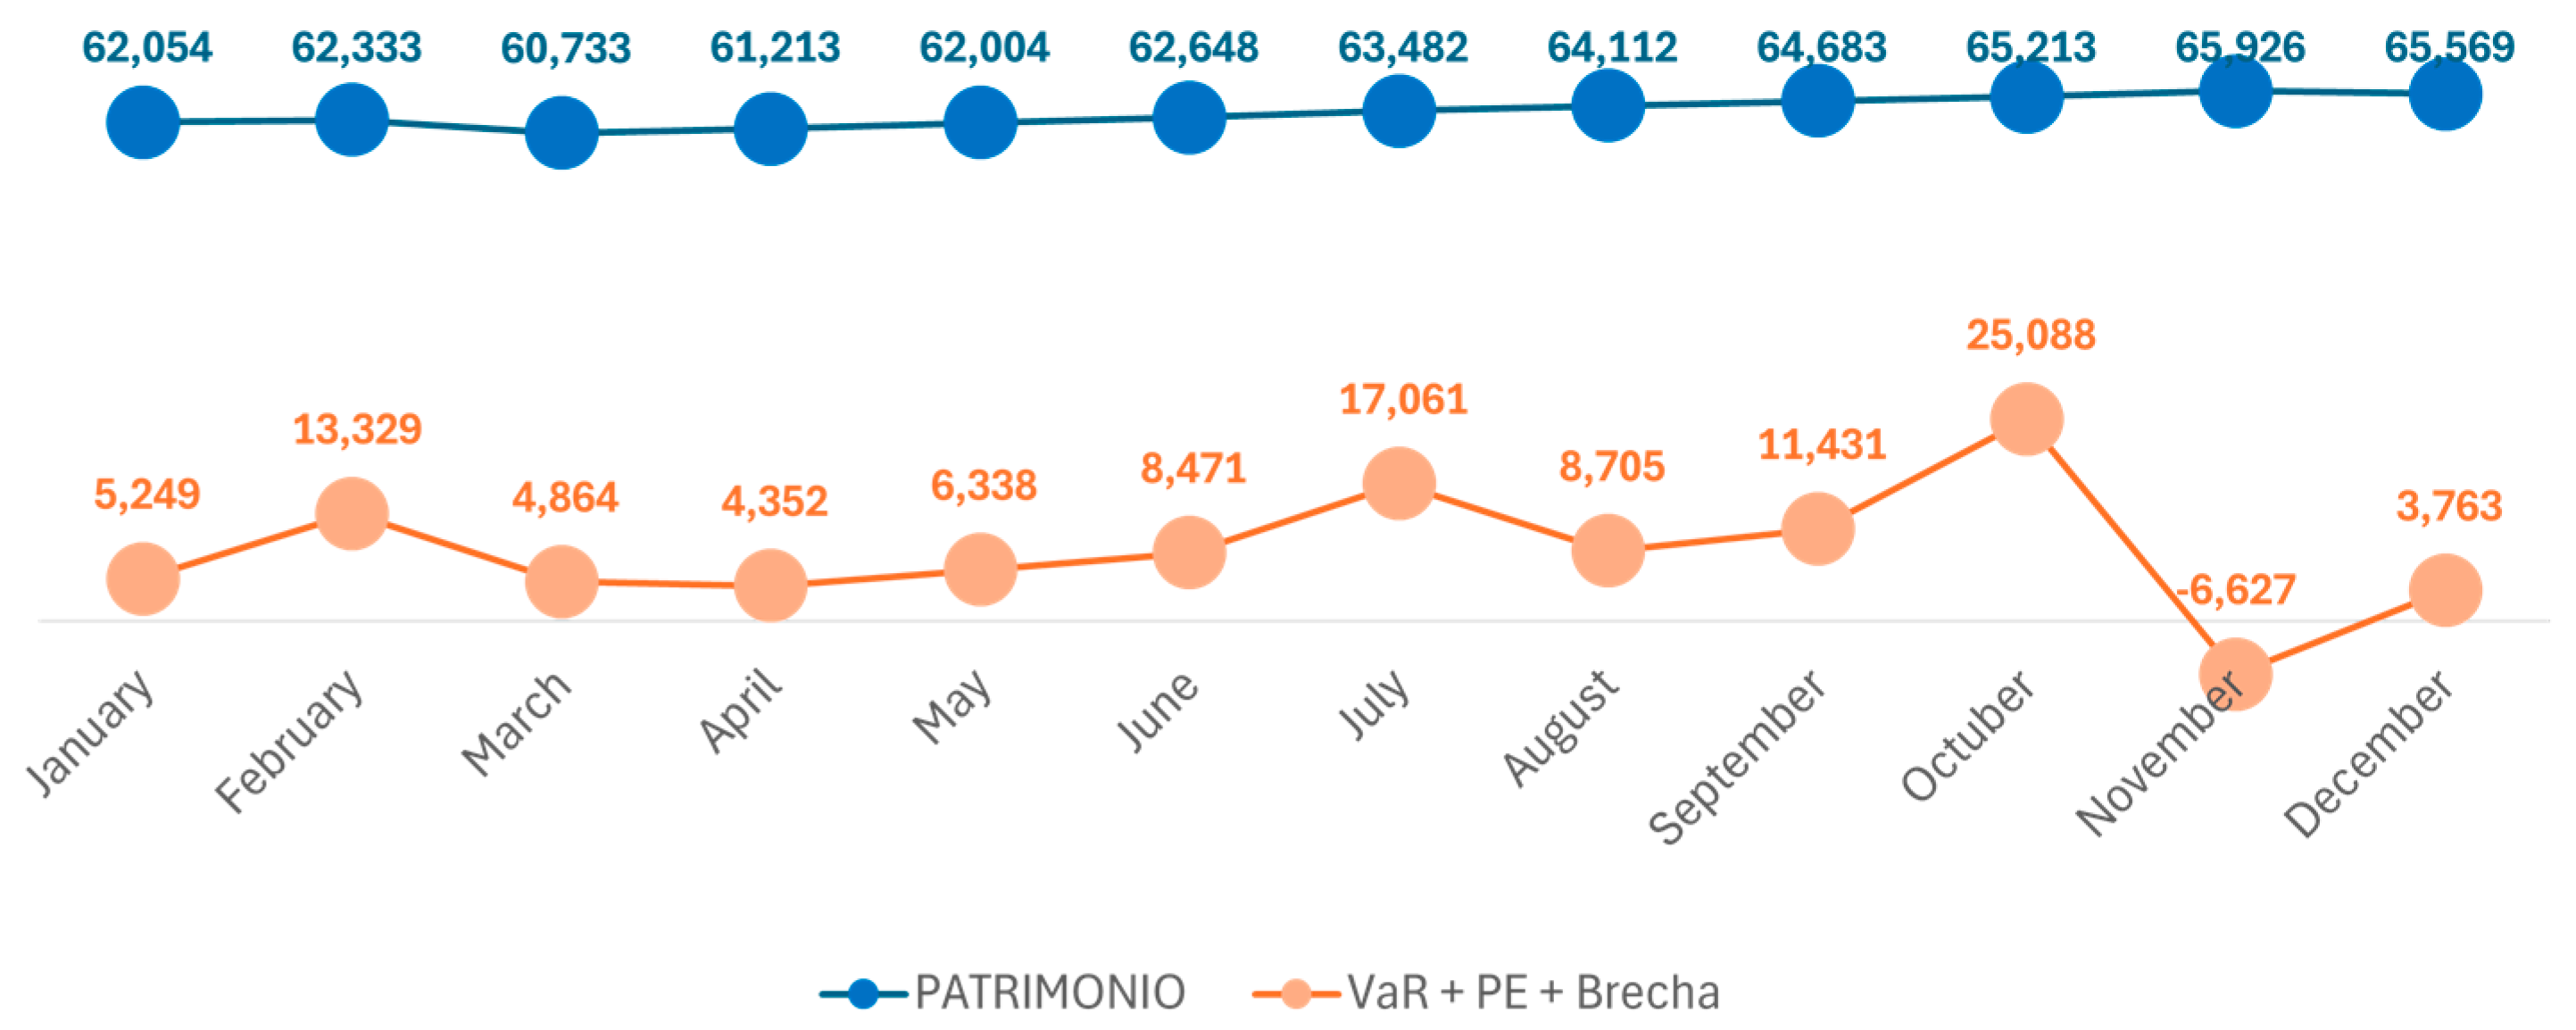
Figure 4.
Trajectory of the ICR under stress scenarios.
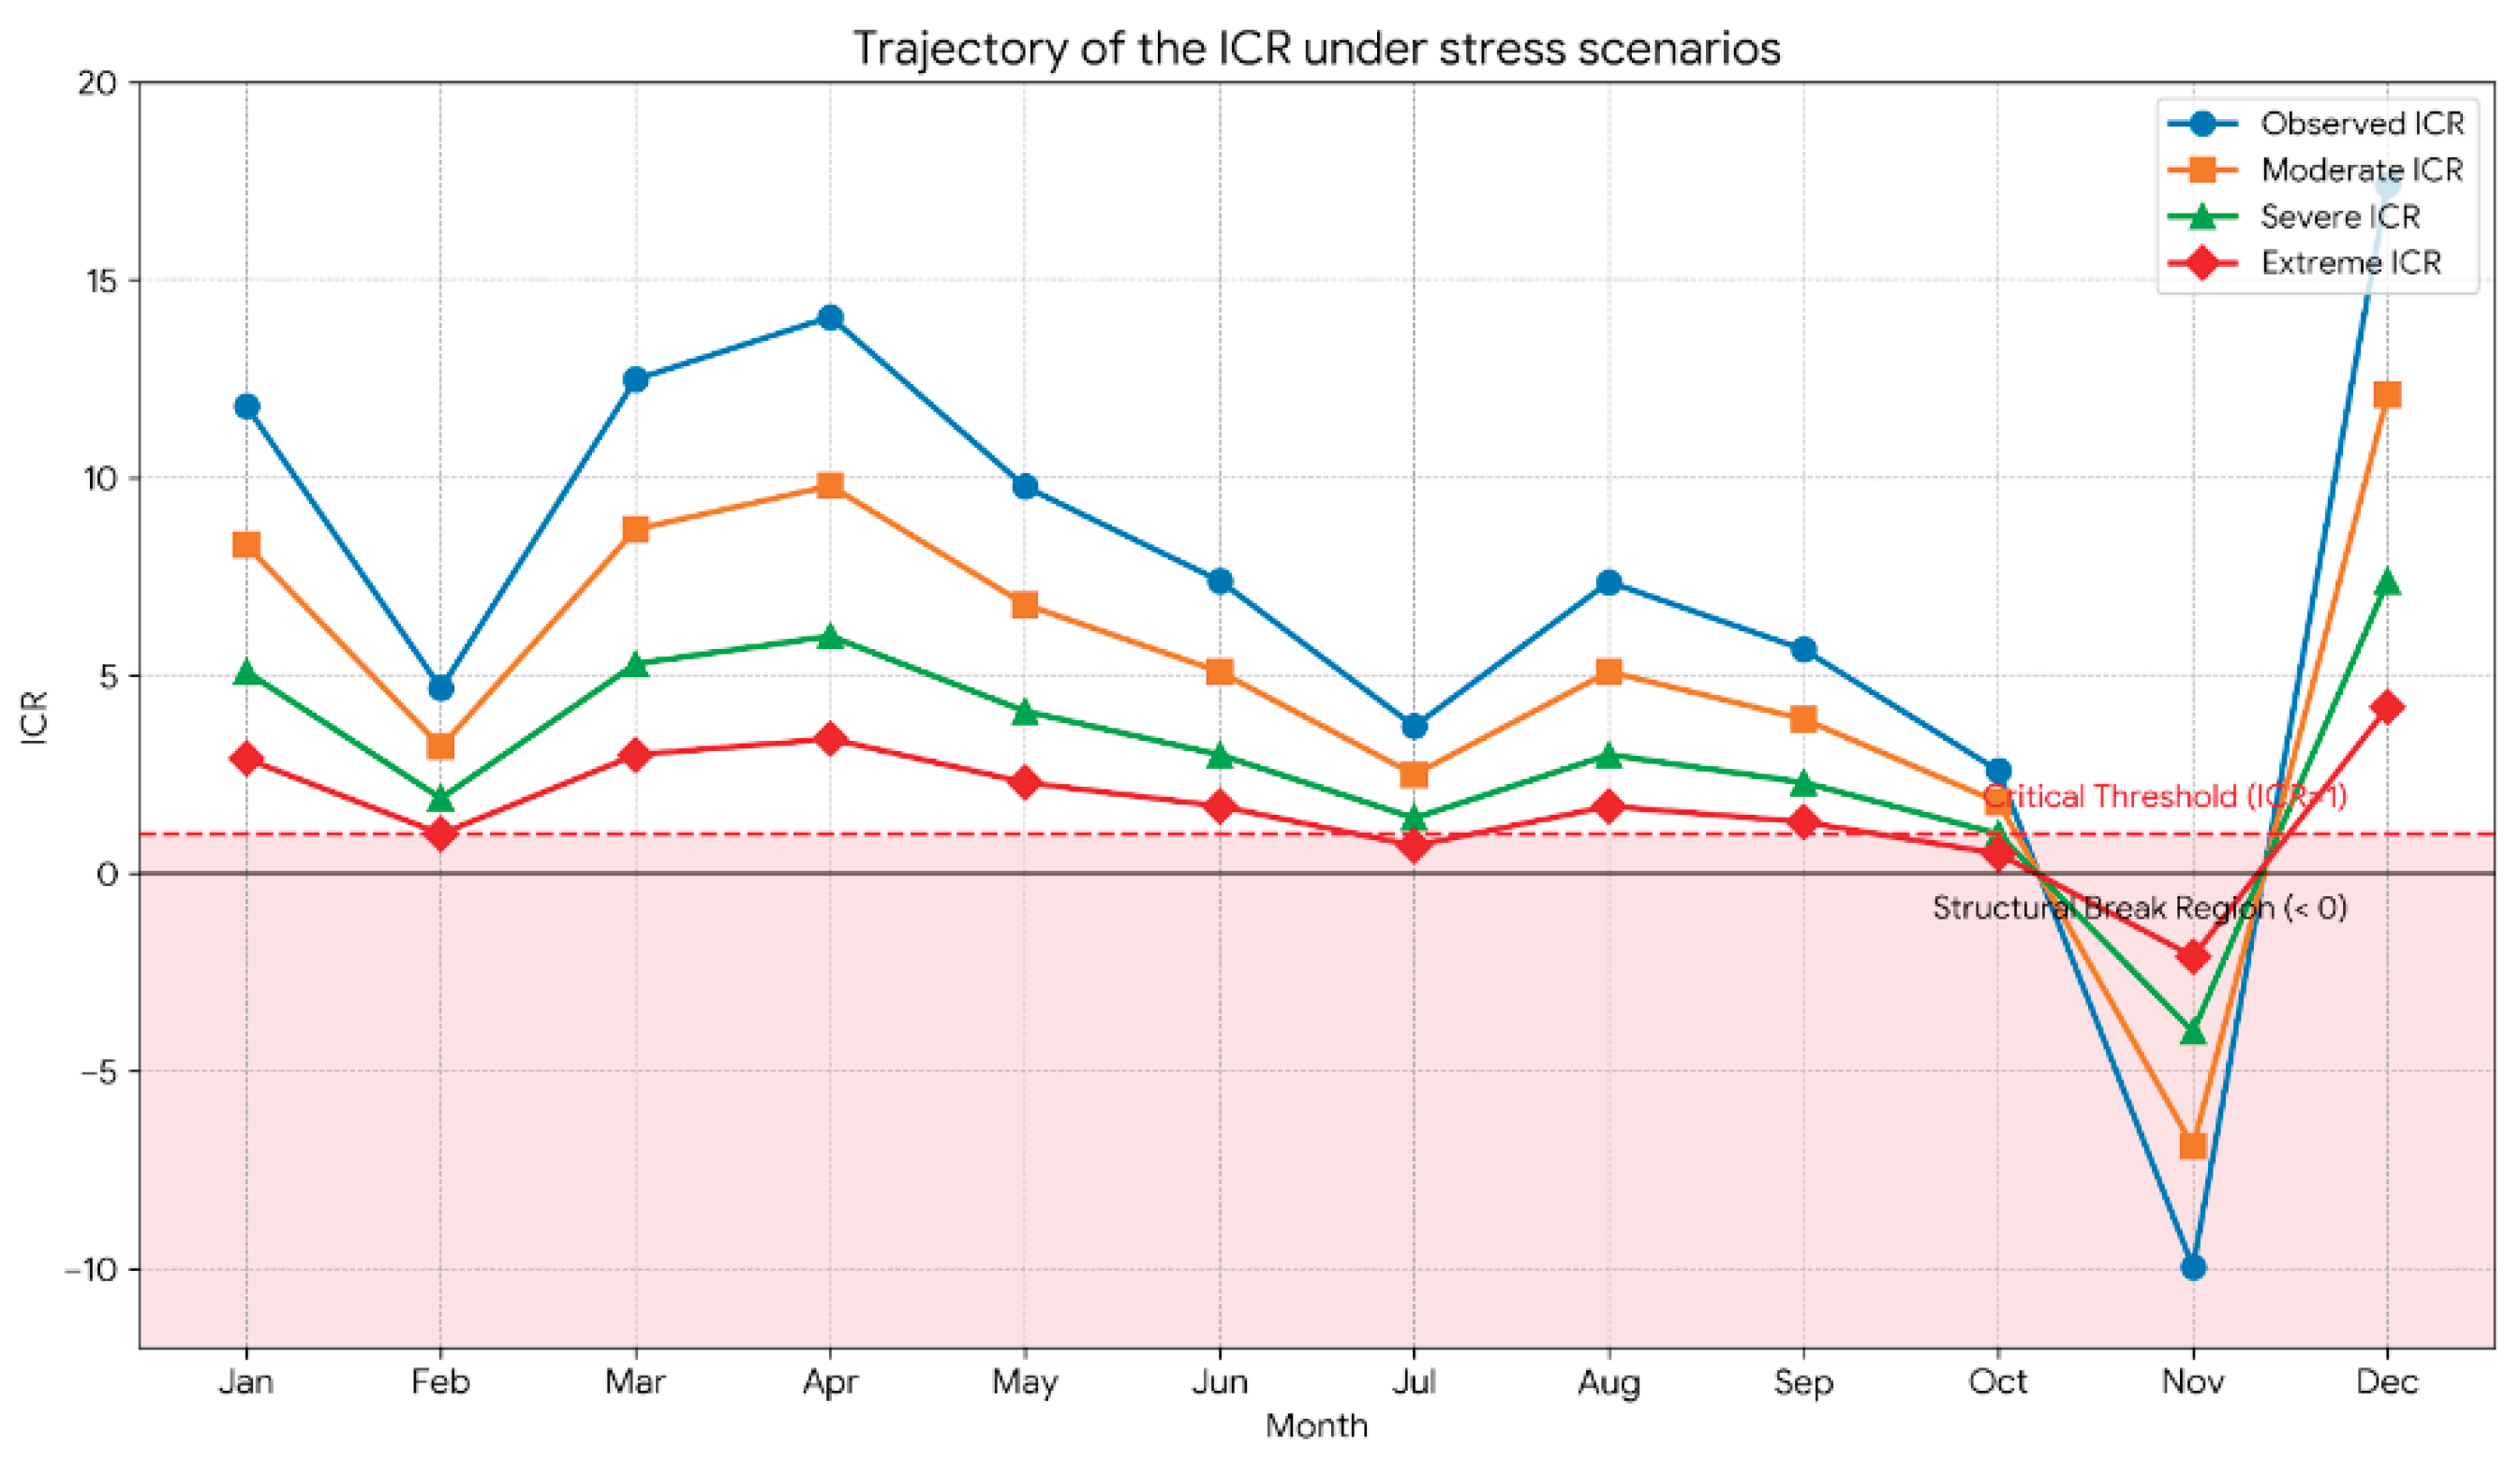

Table 1.
Components of the ICR for the year 2025.
| Month | TE | VaR | EL | LG | ICR |
|---|---|---|---|---|---|
| January | 62,053.85 | 7.47 | 668.90 | 4,572.69 | 11.82 |
| February | 62,332.75 | 6.94 | 681.01 | 12,641.34 | 4.68 |
| March | 60,733.10 | 6.31 | 689.45 | 4,167.76 | 12.49 |
| April | 61,213.04 | 4.57 | 727.80 | 3,619.73 | 14.07 |
| May | 62,004.07 | 9.22 | 715.89 | 5,612.95 | 9.78 |
| June | 62,648.19 | 9.23 | 965.00 | 7,496.36 | 7.40 |
| July | 63,482.22 | 4.50 | 984.18 | 16,072.52 | 3.72 |
| August | 64,112.13 | 7.43 | 981.06 | 7,716.29 | 7.37 |
| September | 64,682.90 | 10.26 | 970.18 | 10,450.95 | 5.66 |
| October | 65,212.56 | 19.96 | 939.73 | 24,128.41 | 2.60 |
| November | 65,926.35 | 17.63 | 938.58 | - 7,583.59 | - 9.95 |
| December | 65,569.46 | 6.94 | 919.58 | 2,836.88 | 17.42 |
Table 2.
Results of proposed stress scenarios.
| Month | ICR Obs | Moderate | Severe | Extreme |
|---|---|---|---|---|
| Jan | 11.82 | 8.30 | 5.10 | 2.90 |
| Feb | 4.68 | 3.20 | 1.90 | 1.00 |
| Mar | 12.49 | 8.70 | 5.30 | 3.00 |
| Apr | 14.07 | 9.80 | 6.00 | 3.40 |
| May | 9.78 | 6.80 | 4.10 | 2.30 |
| Jun | 7.40 | 5.10 | 3.00 | 1.70 |
| Jul | 3.72 | 2.50 | 1.40 | 0.70 |
| Aug | 7.37 | 5.10 | 3.00 | 1.70 |
| Sep | 5.66 | 3.90 | 2.30 | 1.30 |
| Oct | 2.60 | 1.80 | 1.00 | 0.50 |
| Nov | -9.95 | -6.90 | -4.00 | -2.10 |
| Dec | 17.42 | 12.10 | 7.40 | 4.20 |
Disclaimer/Publisher’s Note: The statements, opinions and data contained in all publications are solely those of the individual author(s) and contributor(s) and not of MDPI and/or the editor(s). MDPI and/or the editor(s) disclaim responsibility for any injury to people or property resulting from any ideas, methods, instructions or products referred to in the content. |
© 2026 by the authors. Licensee MDPI, Basel, Switzerland. This article is an open access article distributed under the terms and conditions of the Creative Commons Attribution (CC BY) license (http://creativecommons.org/licenses/by/4.0/).
Copyright: This open access article is published under a Creative Commons CC BY 4.0 license, which permit the free download, distribution, and reuse, provided that the author and preprint are cited in any reuse.