Submitted:
17 June 2026
Posted:
18 June 2026
You are already at the latest version
Abstract
Early hidden cracks in circular magnetic encoder rings induce only slight magnetic perturbations at the incipient stage, yet they may evolve into missing-pole, demagnetization, or severe waveform-distortion faults that degrade angular-displacement measurement and closed-loop control. This study establishes a physical mapping between crack-induced magnetization nonuniformity, pole-pitch deviation, and the amplitude-modulated and frequency-modulated components of the measured magnetic signal, and models the encoder output as a compound frequency-modulated–amplitude-modulated waveform. A precision-controlled experimental platform equipped with a self-developed tunnel magnetoresistance read head, a precision rotary stage, multi-axis positioning stages, and laser displacement sensing was built to suppress eccentricity-related disturbances and disturbances related to sensor lift-off distance. An analysis workflow combining fast Fourier transform-based band-pass filtering, Hilbert demodulation, sixth-order Butterworth low-pass filtering, and coefficient-of-variation analysis was used to extract the instantaneous amplitude and instantaneous angular frequency. Experiments on intact, hidden-crack, and visible-crack states show that the proposed normalized indicators sensitively capture weak crack-related fluctuations, reduce sensitivity to sensor lift-off distance after normalization, and increase monotonically with damage severity. The method does not require a high-accuracy external reference and shows promise for online monitoring of circular magnetic encoder rings and related electromagnetic sensing elements.
Keywords:
magnetic encoder
; hidden crack detection
; tunnel magnetoresistance sensor
; Hilbert transform
; amplitude-modulated–frequency-modulated demodulation
; condition monitoring
1. Introduction
High-accuracy angular-displacement measurement is a prerequisite for precision motion control in machine-tool spindles, servo drives, industrial robots, and other high-end rotating equipment [1,2]. Compared with optical encoders, magnetic position sensors and magnetic encoders are more tolerant to dust, oil mist, vibration, and other harsh industrial conditions while retaining compact size, contactless operation, and favorable cost-performance characteristics [3,4]. Recent advances in magnetic encoder technology have further expanded their applicability in compact industrial motion-control systems [5].
Despite these advantages, the measurement performance of circular magnetic encoder rings remains strongly dependent on the health of the magnetized pole array and the read-head signal quality. Manufacturing defects, local damage, assembly errors, and environmental disturbances can all distort the encoded field distribution and thereby degrade the angular output [6,7]. Among these fault modes, hidden cracks are particularly challenging because the initial damage is extremely weak and is often invisible to the naked eye or to simple magnetic viewing methods. If undetected, such defects may progressively develop into more severe missing-pole or demagnetized regions, eventually threatening control accuracy and operational reliability.
For precision equipment, the practical difficulty is not only whether a severe defect can be detected after the output has already deteriorated, but also whether early degradation can be recognized before it produces a clear measurement failure. A circular magnetic encoder ring contains a periodically magnetized pole pattern, so local damage does not necessarily appear as a large isolated anomaly in the raw waveform. Instead, it may be distributed over the carrier and its modulation sidebands, where it is easily masked by eccentricity, sensor lift-off distance variation, vibration, and electronic noise. This feature makes hidden-crack diagnosis different from ordinary waveform-threshold detection: the key information is embedded in small changes in the regularity of the modulated magnetic signal.
Existing studies on magnetic encoders have mainly focused on structural design, error-source analysis, and algorithmic compensation of explicit nonlinearities [8,9]. These approaches are valuable for improving measurement performance, but they are generally more sensitive to obvious faults or macroscopic error sources than to subtle early-stage degradation. Related work on encoder-signal-based condition monitoring has shown that weak fluctuations embedded in position signals can reveal mechanical health conditions, provided that suitable signal decomposition and denoising methods are available [10,11]. However, methods that directly connect hidden-crack-induced magnetic-pole degradation in circular magnetic encoder rings with physically interpretable amplitude modulation (AM)–frequency modulation (FM) features and normalized quantitative indicators remain limited.
In this study, hidden-crack diagnosis is reformulated as an AM–FM signal-decoupling problem. The central idea is that hidden cracks change both the magnetization strength of local poles and the effective spacing between adjacent poles. These two effects respectively manifest as amplitude nonuniformity and frequency fluctuation in the acquired magnetic waveform. On this basis, the main contributions of this work are as follows:
- A physical mapping is established between hidden-crack-induced pole degradation and the AM/FM components of the measured magnetic signal, allowing the circular magnetic encoder signal to be modeled as a compound frequency modulation–amplitude modulation (FM–AM) waveform.
- A precision-controlled experimental platform based on a self-developed tunnel magnetoresistance (TMR) read head and precision alignment units is constructed to minimize eccentricity-related interference and interference related to sensor lift-off distance during data acquisition.
- A feature-extraction strategy based on band-pass filtering, Hilbert demodulation, secondary low-pass filtering, and coefficient-of-variation (CV) values is proposed to quantify magnetization uniformity and pole-spacing consistency without using a high-accuracy external reference.
2. Materials and Methods
2.1. Physical Mapping and Signal Model
The damage mechanism considered in this study indicates that a hidden crack produces two coupled but distinguishable effects in a circular magnetic encoder ring. First, local material damage alters the magnetization intensity of the affected pole region, causing amplitude nonuniformity in the magnetic signal acquired by the read head. Second, crack-induced geometric distortion or magnetic-field redistribution changes the effective spacing between adjacent poles, leading to slight nonuniformity in the interval between successive poles and thus to frequency fluctuation. This interpretation is consistent with magnetic-wheel-encoder health studies showing that local degradation can manifest as subtle waveform and spectral changes in encoder-related signals [12].
Under fixed-axis rotation, the magnetic flux density measured at a spatial sampling point can thus be described by a compound FM–AM model:
where is the instantaneous amplitude governed primarily by pole-magnetization uniformity, is the instantaneous angular frequency governed primarily by pole-spacing consistency, and is the initial phase. Equation (1) therefore provides a direct physical interpretation of the measured waveform: hidden cracks disturb both the AM and FM components, and separate extraction of these components enables the degradation to be traced back to the underlying pole characteristics. In practice, is also influenced by the sensor lift-off distance, so the amplitude-related feature is later normalized using the CV. The extraction of can be affected by rotary-stage stability, residual eccentricity, and phase noise; these influences are reduced in the experiment by precision rotation, laser-assisted alignment, and fixed sampling conditions.
This model is not intended to replace a full electromagnetic field simulation of the damaged ring. Instead, it provides a compact signal-level representation that is suitable for diagnosis. Under stable rotation and fixed sampling conditions, the carrier component reflects the nominal passage of magnetic poles across the sensing region, whereas slow variations in and reflect the nonuniformity superimposed on this nominal periodic process. The separation of these two quantities is especially useful because a reduction in local magnetization and a local shift in effective pole spacing may both distort the raw waveform, but they have different physical meanings and different implications for subsequent health assessment.
2.2. Experimental Platform
To reproduce the working state of a circular magnetic encoder ring under fixed-axis rotation, a precision-controlled measurement platform was assembled, as shown schematically in Figure 1. The tested specimen was an MR5232 circular magnetic encoder ring manufactured by Jiangsu Aoming Technology, with an inner diameter of mm, an outer diameter of mm, a width of mm, and 32 magnetic poles with a nominal pole width of 5 mm. The encoder ring was driven by a Zolix AK25-6520SR precision rotary stage with a positioning accuracy of arcsec and a repeatability better than arcsec. A Zolix TBR100 two-dimensional translation stage was installed beneath the rotary stage to align the encoder-ring center with the rotary axis. An HMC-C10 laser displacement sensor was used during alignment to monitor the residual offset in real time and suppress eccentricity-related interference.
The magnetic signal was acquired by a self-developed TMR read head based on a MultiDimension TMR2652D linear TMR chip. TMR technology is well suited to weak-field, compact, high-sensitivity sensing tasks and has been widely used in precision magnetic detection and displacement sensing [13,14]. In the present setup, the read head was mounted on a three-axis positioning unit composed of one TSA200-B stage for the x direction and two TSA100-B stages for the y and z directions, enabling fine control of the sensor position and sensor lift-off distance. A Python-based acquisition program coordinated the rotary stage, TMR read head, and laser displacement sensor to achieve synchronized and automated acquisition of magnetic, displacement, and angular-position signals. The data-acquisition interval was fixed at 100 ms throughout the experiments.
Before each measurement, the encoder ring was adjusted so that the residual radial offset was minimized according to the laser displacement reading. The sensor lift-off distance is defined here as the normal air-gap distance between the sensitive surface of the TMR read head and the outer surface of the encoder ring. This distance was then set by the z-axis positioning stage and kept unchanged during each individual acquisition. This procedure was used to reduce uncontrolled geometric variation between repeated tests. Because the purpose of the experiment was to evaluate intrinsic signal changes caused by pole degradation, the mechanical rotation condition, sampling interval, read-head position, and data-processing program were kept identical for the intact, hidden-crack, and visible-crack comparisons except for the intentionally changed damage state or sensor lift-off distance.
2.3. Signal-Processing Workflow
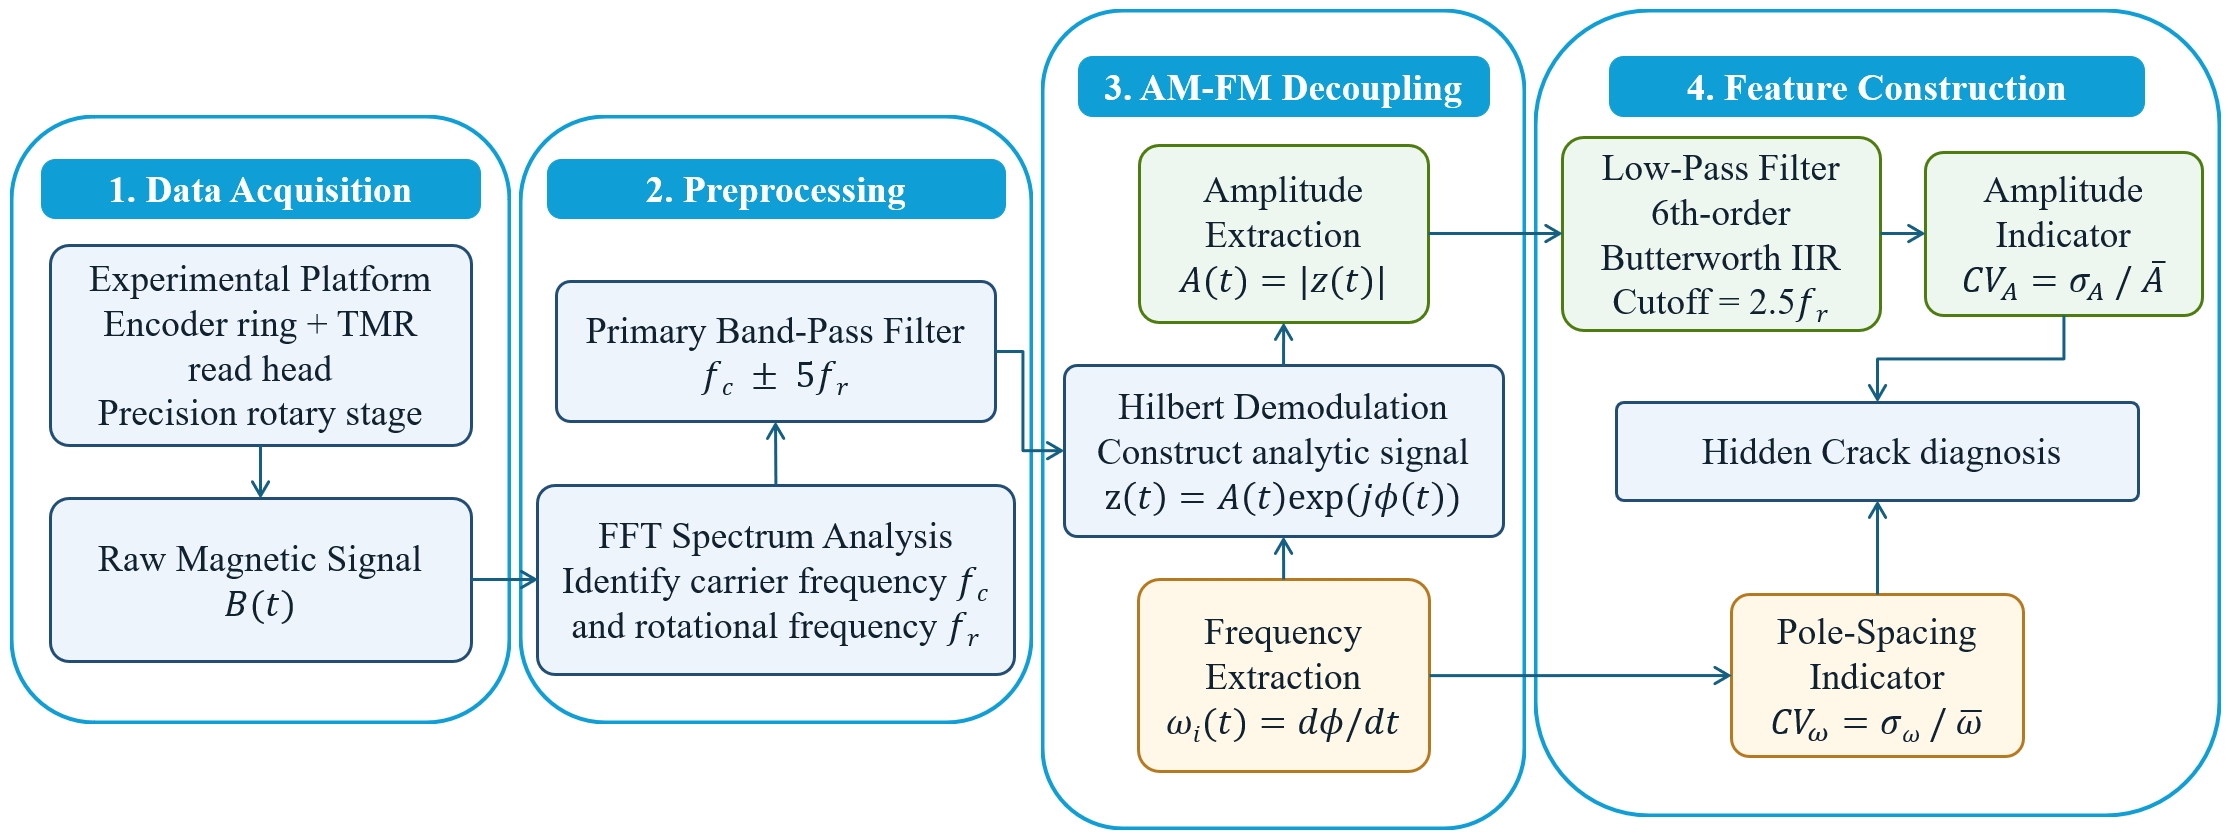
The complete processing pipeline is outlined in Figure 2. It contains four key stages: primary band-pass filtering, Hilbert demodulation, secondary low-pass filtering, and normalized feature calculation. The workflow combines established ideas from modulation-sideband analysis and envelope-based diagnosis while adapting them to the specific degradation mechanism of circular magnetic encoder rings [15,16].
In practical operation, the raw magnetic sequence was first inspected in the frequency domain to identify the dominant carrier frequency. A carrier-centered band-pass filter was then applied to remove slow drift and broadband disturbances while retaining the modulation sidebands required for demodulation. The filtered sequence was transformed into an analytic signal using the Hilbert transform, from which the instantaneous amplitude and unwrapped instantaneous phase were obtained. The phase derivative was used to calculate the instantaneous angular frequency, and the demodulated amplitude sequence was further smoothed by the secondary low-pass filter. Finally, the CV was calculated for both sequences so that the resulting indicators described relative fluctuation rather than absolute signal level.
2.3.1. Primary Band-Pass Filtering
The raw magnetic signal contains not only the encoded magnetic waveform but also environmental electromagnetic interference, mechanical vibration, residual eccentricity, and sensor noise. To preserve the fault-sensitive modulation components while removing irrelevant out-of-band disturbances, the signal is first transformed into the frequency domain and processed using an FFT-based band-pass filter. Let denote the magnetic carrier frequency identified from the dominant FFT peak and let denote the rotational frequency of the encoder ring. Theoretically, for an encoder ring with N magnetic poles, the carrier frequency satisfies ; for the 32-pole encoder ring used in this study, this gives . In the present workflow, a carrier-centered passband is used before Hilbert demodulation, and the detailed selection and verification of the retained sideband range are discussed in Section 3.1. The angular frequency and ordinary frequency satisfy ; therefore, and are used for frequency-domain filter design, whereas denotes the instantaneous angular frequency extracted from the analytic signal.
2.3.2. Hilbert Demodulation
The Hilbert transform is a standard tool for analyzing narrow-band AM–FM signals and extracting instantaneous amplitude, phase, and frequency information [17]. After primary band-pass filtering, the magnetic signal can be treated as an approximately single-component narrow-band waveform. For a real signal , its Hilbert transform is defined using the Cauchy principal value (PV) as
where PV denotes the PV. The associated analytic signal is
where j denotes the imaginary unit and denotes the instantaneous phase. The instantaneous amplitude and instantaneous angular frequency are then obtained as
2.3.3. Secondary Low-Pass Filtering
Although primary band-pass filtering suppresses most out-of-band disturbances, residual components may remain in the demodulated amplitude sequence. The extracted envelope, namely the instantaneous amplitude defined as the magnitude of the analytic signal in Equation (4), is therefore further processed by a sixth-order Butterworth infinite impulse response (IIR) low-pass filter. After Hilbert demodulation, the signal of interest is shifted from the carrier region to the low-frequency baseband; thus, the low-pass stage should preserve the modulation band while attenuating residual carrier-related terms and high-frequency artifacts [18].
For the circular magnetic encoder ring considered here, the cutoff frequency of the secondary low-pass filter was determined by scanning a series of candidate cutoff frequencies and comparing the stability of the resulting CV values. The final cutoff used in subsequent analysis is reported and discussed together with the corresponding experimental result in Section 3.2.
2.4. Normalized Feature Construction
The instantaneous amplitude sequence reflects magnetization uniformity, whereas the instantaneous angular-frequency sequence reflects pole-spacing consistency. However, the absolute amplitude level is strongly influenced by sensor lift-off distance. To reduce this dependency, two normalized intrinsic indicators are defined using the CV:
where and are the standard deviation and mean of the instantaneous-amplitude sequence, and and are the standard deviation and mean of the instantaneous-angular-frequency sequence. Because the CV is dimensionless, it suppresses the influence of overall signal level and facilitates intrinsic comparison across different sensor lift-off distances. Here, the instantaneous amplitude and instantaneous angular frequency are the same quantities defined in Equation (1). The two coefficients, and , are the final diagnostic indicators used for crack-state identification in this study.
3. Results and Analysis
3.1. Results for the Intact Encoder Ring
Figure 3 presents the measured magnetic signal of the intact circular magnetic encoder ring. The time-domain waveform exhibits clear periodicity and is consistent with the compound FM–AM model established in Section 2.1. For the tested 32-pole ring, the theoretical carrier-frequency relation is , and the corresponding FFT result in Figure 4a shows a dominant carrier peak at this pole-passage frequency surrounded by rotational sidebands, with the most informative components concentrated mainly within the first few sideband orders. Such sideband structures are consistent with the expected behavior of periodically modulated rotating-system signals.
The retained passband was selected from this spectral distribution rather than assigned only as an empirical parameter. FFT inspection indicates that hidden-crack-related modulation is mainly located in the low-order rotational sidebands around the carrier. For a standard interference-free signal with comparable AM and FM contributions, the spectral peak at the fifth rotational sideband is approximately 2% of the carrier amplitude. This means that useful modulation content has already decayed substantially by the fifth sideband order, whereas components beyond this range contribute little to the present feature extraction. Therefore, the FFT-based band-pass filter shown in Figure 4b is extended to , retaining the crack-sensitive low-order sidebands while excluding outer-band components with very weak energy. Under the present experimental conditions, this choice provides a data-based compromise between sideband preservation and interference suppression.
This selection also avoids two common problems in demodulation-based diagnosis. If the passband is too narrow, part of the modulation sideband energy is removed together with the noise, and the subsequent Hilbert envelope becomes overly smooth, which weakens the small fluctuations associated with early defects. If the passband is too wide, high-frequency interference and unrelated spectral components are allowed to enter the analytic signal, increasing the apparent fluctuation of the extracted amplitude and frequency. The adopted range therefore serves as a controlled preprocessing window that preserves the physically meaningful modulation content while limiting the contribution of components outside the defect-sensitive band.
The band-pass-filtered waveform retains the carrier and the most relevant low-order sidebands while suppressing low-frequency eccentricity components and broadband noise. These results confirm that the selected passband preserves the useful modulation content without introducing unnecessary outer-band components. The preprocessing step therefore improves the signal-to-noise ratio and provides a more suitable input for Hilbert demodulation. The intact ring is used here not only as a healthy reference state but also as a way to verify that preprocessing preserves the nominal encoder waveform rather than amplifying arbitrary noise.
3.2. Extraction of Instantaneous Amplitude and Frequency
Figure 5 illustrates the secondary-processing results of the intact encoder ring after demodulation. Figure 5a gives the instantaneous-amplitude spectrum before low-pass filtering, and Figure 5b presents the cutoff-frequency scan used for parameter selection. Among the tested candidate cutoff frequencies, yields the minimum final CV and is therefore adopted in the subsequent analysis. Figure 5c further shows that the filtered preserves the slow, physically meaningful amplitude variation of the healthy reference signal while suppressing residual high-frequency fluctuation. Figure 5d compares the original and filtered magnetic-flux-density waveforms in the time domain, providing a direct visual check that the selected filtering step preserves the main waveform trend while suppressing small residual fluctuations. Because Hilbert demodulation shifts the target modulation information from the carrier region to the low-frequency baseband, this cutoff preserves the main crack-related fluctuation while suppressing residual carrier-related terms, high-frequency interference, and demodulation artifacts. This result indicates that provides the best balance between feature stability and fluctuation preservation under the present experimental conditions. In other applications, the same parameter can be adaptively adjusted according to the measured low-frequency energy distribution and the corresponding feature stability.
The derived instantaneous amplitude and instantaneous angular frequency form the basis for intrinsic condition characterization. For the intact encoder ring, the result shown in Figure 5 remains concentrated after filtering, indicating good pole-magnetization uniformity. The companion instantaneous-angular-frequency result is obtained from the phase derivative in Equation (5) using the same preprocessed intact signal; it remains close to the nominal pole-passage angular frequency and shows only weak fluctuation, indicating regular pole spacing. This combined behavior of stable and stable is expected for a healthy encoder ring without observable local damage.
The two extracted sequences provide complementary information. The instantaneous-amplitude sequence is directly affected by the local magnetic-field strength sensed by the read head and is therefore sensitive to magnetization attenuation or field redistribution near a damaged pole. The instantaneous-angular-frequency sequence is obtained from the phase evolution and is more closely related to the regularity of pole passage. A hidden crack may affect both quantities, but the relative change can differ depending on whether the dominant consequence is local weakening of magnetization, local pole-shape distortion, or a combined change in the field distribution. Using both sequences therefore reduces the risk of missing a weak defect that is visible mainly in only one modulation component.
3.3. Effect of Sensor Lift-Off Distance
Figure 6 compares the processed results obtained at sensor lift-off distances of 1, 2, and 3 mm. As the sensor lift-off distance increases, the absolute signal amplitude decreases because of spatial magnetic-field attenuation. Consequently, both the mean level and the standard deviation of the amplitude-related sequence exhibit clear distance dependence. In contrast, the instantaneous angular-frequency sequence remains much less sensitive to sensor lift-off distance.
After normalization by the CV, the distance dependence is markedly reduced. Across the three tested sensor lift-off distances, the amplitude-related CV values remain within a narrow fluctuation band, with dispersions on the order of 0.016–0.017, whereas the frequency-related CV remains close to 0.006. These results indicate that and can serve as intrinsic indicators that are substantially less sensitive to sensor lift-off distance after normalization and are therefore more suitable for diagnosis than unnormalized statistics. In this respect, the proposed indicators complement prior encoder-signal health measures by providing a more robust representation of magnetic-pole degradation.
This result is important because sensor lift-off distance variation is one of the most common disturbances in practical magnetic sensing. Absolute amplitude can decrease even when the encoder ring is healthy, simply because the read head is farther from the magnetized surface. A diagnostic feature based only on amplitude magnitude would therefore be difficult to separate from installation tolerance or small mechanical displacement. By using the ratio between the standard deviation and the mean, emphasizes the relative nonuniformity of the amplitude sequence rather than its absolute scale. Similarly, describes the relative fluctuation of phase-derived pole passage regularity. The reduced distance sensitivity supports the use of these indicators for condition comparison when the sensor lift-off distance cannot be perfectly fixed.
4. Detection of Hidden Cracks
To verify sensitivity to early hidden-crack damage, a single-variable comparative experiment was designed using the same encoder ring under four states: intact, hidden crack, visible 1 mm crack, and visible 2 mm crack. The hidden crack was intentionally prepared to be too weak to be distinguished reliably by direct visual inspection or by a magnetic viewing sheet, thereby approximating an incipient manufacturing or service-induced defect.
Using the same ring and measurement platform for the four states reduces the influence of specimen-to-specimen variation and highlights the effect of progressive damage. The intact state provides the baseline fluctuation level of the magnetic pole array, whereas the hidden-crack state represents the target early fault condition. The two visible-crack states are not the primary detection target, but they provide a severity reference for evaluating whether the proposed indicators respond consistently as damage becomes more pronounced. This arrangement makes it possible to examine both early detectability and trend monotonicity within the same experimental framework.
Representative photographs and magnetic viewing observations of the crack specimens are shown in Figure 7. For the hidden-crack specimen, the damage remains difficult to identify by direct visual inspection or by magnetic viewing, whereas the visible-crack specimen provides a comparative reference with a clearly observable defect. This comparison motivates the subsequent signal-based diagnosis route.
Figure 8 compares the instantaneous-amplitude and instantaneous-angular-frequency responses for the four damage states. Panel (a) summarizes the instantaneous-amplitude sequences for the intact ring, hidden crack, visible 1 mm crack, and visible 2 mm crack, whereas panel (b) summarizes the corresponding instantaneous-angular-frequency sequences. The intact ring exhibits a stable amplitude envelope and an almost constant instantaneous angular frequency. Once a hidden crack appears, weak but repeatable amplitude fluctuation and frequency deviation become observable. As the damage develops into visible cracks of 1 mm and 2 mm, both the waveform distortion and the fluctuation intensity increase markedly.
The amplitude response increases more strongly than the frequency response as the visible crack grows, which suggests that the dominant effect of crack enlargement is a local change in magnetic-field strength and distribution. Nevertheless, the frequency-related fluctuation also increases, indicating that the phase regularity of pole passage is affected by the damaged region. This joint response is consistent with the physical mapping proposed in Section 2.1: damage changes both the local magnetization state and the effective pole-spacing consistency, and the two effects are coupled in the raw waveform. Separating them into amplitude and frequency indicators makes the degradation process easier to interpret.
The quantitative results are summarized in Table 1. The intact encoder ring exhibits very low values of both indicators, with and . In the hidden-crack state, the indicators increase to and , respectively, demonstrating that the proposed features can capture signal perturbations that remain too weak for conventional inspection. When the crack becomes visible and grows to 1 mm and 2 mm, both indicators increase further and monotonically, reaching and , and and , respectively.
These results indicate that the proposed indicators are sensitive to incipient degradation and maintain a generally positive relationship with damage severity. They are therefore suitable not only for early warning but also for trend monitoring of hidden-crack evolution.
From a diagnostic perspective, the most important comparison is between the intact and hidden-crack states. The increase of from 0.092 to 0.132 and the increase of from 0.004 to 0.008 show that the hidden crack produces measurable modulation irregularity even when direct observation remains unreliable. The larger increases observed for the visible 1 mm and 2 mm cracks further indicate that the indicators are not merely binary fault labels; they also carry information about the degree of degradation. This behavior is favorable for practical monitoring, where an early warning should ideally be followed by continued tracking of damage development.
5. Discussion
The experimental results support the central premise of this study: hidden cracks in circular magnetic encoder rings can be diagnosed from intrinsic signal characteristics before they become obvious geometric defects. Unlike compensation-oriented approaches that mainly target output accuracy after error formation [19,20], the proposed method emphasizes physically interpretable degradation characterization. The AM-related feature characterizes the uniformity of pole magnetization, whereas the FM-related feature characterizes the consistency of pole spacing. This separation improves interpretability and helps distinguish two degradation pathways that are otherwise mixed in the raw magnetic waveform.
Another practical advantage is that the proposed workflow does not rely on a high-accuracy external reference encoder, which is often expensive or inconvenient in practical use. This property distinguishes the method from calibration-heavy accuracy-evaluation procedures commonly used for encoder characterization [21,22]. Moreover, compared with general encoder-signal fluctuation analysis, the present study provides a more interpretable link between modulation behavior and magnetic-pole degradation while also mitigating the dependence of the amplitude-related feature on sensor lift-off distance through CV-based normalization.
The proposed indicators can also be understood as relative health descriptors of the magnetic pole array. In a stable encoder ring, adjacent poles should produce a nearly repeatable magnetic response during rotation, so the extracted amplitude and instantaneous-frequency sequences should remain comparatively uniform. A crack introduces local nonuniformity, and this nonuniformity appears as an increased dispersion relative to the mean level. The CV formulation therefore converts waveform irregularity into a dimensionless quantity that can be compared across different signal amplitudes and, to some extent, across different installation distances.
Several limitations should nevertheless be noted. First, the experiments were conducted under controlled laboratory conditions, and the robustness of the method against stronger thermal drift, structural vibration, and electromagnetic interference remains to be validated in field environments. Second, the present work focuses on hidden cracks and does not yet establish a complete fault taxonomy that separates hidden cracks from other early magnetic faults such as partial demagnetization or debris contamination. Third, although the monotonic increase of the proposed indicators with crack severity is encouraging, broader statistical validation with more samples is still necessary before universal alarm thresholds can be recommended.
In addition, the selected filtering parameters are linked to the operating condition and spectral distribution used in this study. Although the sideband-based selection and cutoff-frequency scan reduce arbitrariness, different pole numbers, rotational speeds, read-head bandwidths, or noise environments may shift the useful modulation band. Therefore, the numerical settings should not be regarded as universal constants. A practical system should preserve the same selection logic but update the actual passband and cutoff frequency according to the measured carrier, rotational frequency, and low-frequency feature stability. This adaptive interpretation is more important than the exact numerical values used in the present laboratory experiment.
Future work should therefore proceed in three directions. The first is to expand the database of fault modes and combine the current physically interpretable indicators with multi-domain features or learning-based classifiers for finer fault discrimination. The second is to evaluate the method under more realistic operating conditions and to develop adaptive filtering or compensation schemes for changing environmental disturbances. The third is to connect the extracted indicators with inverse error models so that early degradation monitoring can be integrated with online compensation and health-aware motion control, thereby linking the present diagnosis-oriented framework with recent TMR-encoder demodulation and compensation strategies [23].
6. Conclusions
This study investigated the feasibility of early hidden-crack diagnosis in circular magnetic encoder rings by modeling the acquired magnetic signal as a compound FM–AM waveform and decoupling its intrinsic modulation components. A precision-controlled measurement platform based on a self-developed TMR read head was established, and a signal-processing workflow consisting of primary band-pass filtering, Hilbert demodulation, secondary low-pass filtering, and CV analysis was developed.
The results show that the instantaneous-amplitude CV and the instantaneous-angular-frequency CV can quantify magnetization uniformity and pole-spacing consistency, respectively. After CV normalization, the indicators become substantially less sensitive to sensor lift-off distance and are therefore suitable for intrinsic condition characterization under controlled experimental conditions. Comparative experiments on intact, hidden-crack, and visible-crack states demonstrate that the indicators can detect hidden cracks that are difficult to identify by direct visual or magnetic-viewing inspection and increase monotonically with damage severity.
Overall, the proposed method provides an interpretable and calibration-light framework for early hidden-crack assessment in circular magnetic encoder rings. Under controlled experimental conditions, the results verify its feasibility and show its potential for online monitoring of related electromagnetic precision sensing elements in which weak local defects manifest as modulation changes in measured signals.
Author Contributions
H.X. and X.F. conceived the research and designed the methodology. H.X., Z.W. and J.G. conducted the software operation, data analysis and experimental investigation. Z.W. assisted in data sorting and visual presentation. The original manuscript was primarily drafted by H.X. and Z.W., while B.W., D.G. and X.F. revised and polished the paper. D.G. and X.F. supervised the whole research process, and X.F. was responsible for project management and funding support. All authors have read and agreed to the published version of the manuscript.
Funding
This research was funded by the National Key Laboratory of Particle Transport and Separation Technology, grant number KGKF-2024-2.
Institutional Review Board Statement
Not applicable.
Informed Consent Statement
Not applicable.
Data Availability Statement
The data supporting the reported results are available from the corresponding author upon reasonable request.
Conflicts of Interest
The authors declare no conflicts of interest.
References
- Kumar, A.S.A.; George, B.; Mukhopadhyay, S.C. Technologies and applications of angle sensors: A review. IEEE Sens. J. 2021, 21, 7195–7206. [Google Scholar] [CrossRef]
- Wang, S.; Ma, R.; Cao, F.; Luo, L.; Li, X. A review: High-precision angle measurement technologies. Sensors 2024, 24, 1755. [Google Scholar] [CrossRef] [PubMed]
- Lenz, J.; Edelstein, A.S. Magnetic sensors and their applications. IEEE Sens. J. 2006, 6, 631–649. [Google Scholar] [CrossRef]
- Jiang, F.; Lou, D.; Zhang, H.; Tang, L.; Sun, S.; Yang, K. Design of a GMR-based magnetic encoder using TLE5012B. In Proceedings of the 2017 IEEE International Conference on Mechatronics and Automation, Takamatsu, Japan, 6–9 August 2017. [Google Scholar]
- Hua, W.; Zhang, C.; Wang, Y. Embedded magnetic encoder-based rotor-position detection technology for permanent magnet synchronous machines: A review. Chin. J. Electr. Eng. 2025, 11, 136–161. [Google Scholar] [CrossRef]
- Ponce, E.A.; Leeb, S.B. A 3-D field solution for axially polarized multi-pole ring permanent magnets and its application in position measurement. IEEE Trans. Magn. 2020, 56, 8000309. [Google Scholar] [CrossRef]
- Zhang, X.; Gong, W.; Xu, X. Magnetic ring multi-defect stereo detection system based on multi-camera vision technology. Sensors 2020, 20, 392. [Google Scholar] [CrossRef] [PubMed]
- Jia, H.-K.; Yu, L.-D.; Zhao, H.-N.; Jiang, Y.-Z. A new method of angle measurement error analysis of rotary encoders. Appl. Sci. 2019, 9, 3415. [Google Scholar] [CrossRef]
- Jia, H.-K.; Yu, L.-D.; Jiang, Y.-Z.; Zhao, H.-N.; Cao, J.-M. Compensation of rotary encoders using Fourier expansion-back propagation neural network optimized by genetic algorithm. Sensors 2020, 20, 2603. [Google Scholar] [CrossRef] [PubMed]
- Xu, X.; Zhao, M.; Lin, J. Detecting weak position fluctuations from encoder signal using singular spectrum analysis. ISA Trans. 2017, 71, 440–447. [Google Scholar] [CrossRef] [PubMed]
- Algburi, R.N.A.; Gao, H. Health assessment and fault detection system for an industrial robot using the rotary encoder signal. Energies 2019, 12, 2816. [Google Scholar] [CrossRef]
- Ladoiye, J.S.; Spry, D.; Jalali, M. Health estimation of magnetic wheel encoder. In Proceedings of the Annual Conference of the PHM Society, 2021; Volume 13. [Google Scholar]
- Yan, S.; Zhou, Z.; Yang, Y.; Leng, Q.; Zhao, W. Developments and applications of tunneling magnetoresistance sensors. Tsinghua Sci. Technol. 2022, 27, 443–454. [Google Scholar] [CrossRef]
- Wang, X.; Li, W.; Jin, L.; Gong, M.; Wang, J. High-precision micro-displacement sensor based on tunnel magneto-resistance effect. Sci. Rep. 2022, 12, 3021. [Google Scholar] [CrossRef] [PubMed]
- Inalpolat, M.; Kahraman, A. A theoretical and experimental investigation of modulation sidebands of planetary gear sets. J. Sound. Vib. 2009, 323, 677–696. [Google Scholar] [CrossRef]
- Kim, S.; An, D.; Choi, J.-H. Diagnostics 101: A tutorial for fault diagnostics of rolling element bearing using envelope analysis in MATLAB. Appl. Sci. 2020, 10, 7302. [Google Scholar] [CrossRef]
- Feldman, M. Hilbert transform in vibration analysis. Mech. Syst. Signal Process. 2011, 25, 735–802. [Google Scholar] [CrossRef]
- Randall, R.B.; Antoni, J. Rolling element bearing diagnostics—A tutorial. Mech. Syst. Signal Process. 2011, 25, 485–520. [Google Scholar] [CrossRef]
- Jiang, W.; Zheng, B.; Sheng, D.; Li, X. A compensation approach for magnetic encoder error based on improved deep belief network algorithm. Sens. Actuators A Phys. 2024, 366, 115003. [Google Scholar] [CrossRef]
- Chuang, H.-C.; Kung, C.-W.; Chen, L.-W.; Jiang, S.-B. Nonlinear error correction for magnetic encoders. IEEE Sens. J. 2023, 23, 9129–9138. [Google Scholar] [CrossRef]
- Muralikrishnan, B.; Shilling, M.; Lee, V.; Ridzel, O.; Holland, G.; Villarrubia, J. A method to calibrate angular positioning errors using a laser tracker and a plane mirror. Sensors 2025, 25, 1834. [Google Scholar] [CrossRef] [PubMed]
- Lashmanov, O.U.; Vasilev, A.S.; Vasileva, A.V.; Anisimov, A.G.; Korotaev, V.V. High-precision absolute linear encoder based on a standard calibrated scale. Measurement 2018, 123, 30–35. [Google Scholar] [CrossRef]
- Xin, Y.; Cui, J.; Wei, H.; Lui, L. A combined error-compensation and adaptive third-order PLL demodulation method for TMR-based magnetic encoders. Electronics 2026, 15, 860. [Google Scholar] [CrossRef]
Figure 1.
Experimental platform. (a) Circular magnetic encoder ring. (b) Laser displacement sensor. (c) Self-developed TMR read head. (d) Simplified illustration of the sensor lift-off distance between the magnetic encoder ring and the TMR sensor, together with the measured signal. (e) Schematic of the measurement system.

Figure 2.
Signal-processing workflow for hidden-crack detection in circular magnetic encoder rings, including fast Fourier transform (FFT)-based band-pass filtering, Hilbert demodulation, extraction of the instantaneous amplitude and instantaneous angular frequency, and construction of the normalized indicators and for crack-state identification.

Figure 3.
Measured magnetic signal of the intact encoder ring. (a) Magnetic flux density as a function of time acquired with the experimental platform. (b) Local enlargement of the waveform.
Figure 3.
Measured magnetic signal of the intact encoder ring. (a) Magnetic flux density as a function of time acquired with the experimental platform. (b) Local enlargement of the waveform.

Figure 4.
Frequency-domain analysis and primary filtering. (a) FFT spectrum of the raw signal shown in Figure 3, where the dominant modulation sidebands are concentrated mainly within the first few rotational orders around the carrier. (b) FFT-based band-pass filtering with a passband of , selected to retain the dominant low-order sidebands while excluding outer-band components with negligible energy.

Figure 5.
Secondary processing results for the intact encoder ring. (a) Spectrum of the instantaneous amplitude before low-pass filtering. (b) Variation of the CV with the low-pass cutoff frequency, showing a minimum at . (c) Comparison of the demodulated instantaneous-amplitude signal before and after sixth-order Butterworth IIR low-pass filtering with the selected cutoff frequency of . (d) Time-domain comparison of the original and filtered magnetic-flux-density waveforms.

Figure 6.
Processed results obtained at different sensor lift-off distances. (a) Filtered instantaneous-amplitude sequences. (b) Instantaneous-angular-frequency sequences.
Figure 6.
Processed results obtained at different sensor lift-off distances. (a) Filtered instantaneous-amplitude sequences. (b) Instantaneous-angular-frequency sequences.

Figure 7.
Samples with (a) hidden crack and (c) visible crack; (b) and (d) show the corresponding magnetic viewing observations using a magnetic viewing film.
Figure 7.
Samples with (a) hidden crack and (c) visible crack; (b) and (d) show the corresponding magnetic viewing observations using a magnetic viewing film.

Figure 8.
Time-domain responses under different damage states. (a) Instantaneous-amplitude sequences for the intact ring, hidden crack, visible 1 mm crack, and visible 2 mm crack. (b) Instantaneous-angular-frequency sequences for the corresponding four states.
Figure 8.
Time-domain responses under different damage states. (a) Instantaneous-amplitude sequences for the intact ring, hidden crack, visible 1 mm crack, and visible 2 mm crack. (b) Instantaneous-angular-frequency sequences for the corresponding four states.


Table 1.
Comparison of the proposed indicators for different damage states (uncertainty: ).
| Damage state | ||
|---|---|---|
| Intact | 0.092 | 0.004 |
| Hidden crack | 0.132 | 0.008 |
| Visible 1 mm crack | 0.289 | 0.013 |
| Visible 2 mm crack | 0.593 | 0.039 |
Disclaimer/Publisher’s Note: The statements, opinions and data contained in all publications are solely those of the individual author(s) and contributor(s) and not of MDPI and/or the editor(s). MDPI and/or the editor(s) disclaim responsibility for any injury to people or property resulting from any ideas, methods, instructions or products referred to in the content. |
© 2026 by the authors. Licensee MDPI, Basel, Switzerland. This article is an open access article distributed under the terms and conditions of the Creative Commons Attribution (CC BY) license.
Copyright: This open access article is published under a Creative Commons CC BY 4.0 license, which permit the free download, distribution, and reuse, provided that the author and preprint are cited in any reuse.


