

Submitted:
16 June 2026
Posted:
18 June 2026
You are already at the latest version
Abstract
This study investigated the role of soil chemical attributes in explaining yield variability in a commercial flooded rice system in southern Brazil during the 2024/2025 growing season. We hypothesized that spatial variability in rice yield is primarily controlled by soil fertility gradients and redox-induced accumulation of Fe and Mn under flooding conditions. The study was conducted in a 45-ha field, where 44 soil samples (0–20 cm) were analyzed for chemical attributes and irrigation water depth. Grain yield data were collected using a combine harvester equipped with a yield monitor and used to generate thematic and relative yield maps. Data were evaluated through descriptive statistics, Pearson correlation, and principal component analysis (PCA). Average grain yield was 10.35 t ha⁻¹, with a spatial variability range of 4.5 t ha⁻¹. PCA explained 76.4% of the total variance, with the first component representing a fertility gradient characterized by higher Ca, Mg, organic matter, and Si contents positively associated with yield, whereas Fe and Mn showed negative associations. High-yield zones exhibited greater cation saturation and lower Fe and Mn concentrations. These findings demonstrate that yield heterogeneity is driven by the interaction between soil fertility and redox-mediated micronutrient dynamics, highlighting the importance of site-specific nutrient and water management.
Keywords:
redox dynamics
; precision agriculture
; management zones
; principal component analysis
1. Introduction
Rice (Oryza sativa L.) is one of the most important crops for global food security and represents the staple food for more than half of the world’s population. In Brazil, irrigated rice production is concentrated primarily in the southern region, particularly in Rio Grande do Sul State, which accounts for most of the national production due to favorable environmental conditions and the adoption of advanced cultivation technologies [1]. Despite the high productivity achieved in this region, considerable spatial variability in grain yield is commonly observed within commercial fields, indicating that production potential is not uniformly expressed across the landscape.
Yield variability is the result of complex interactions among soil, climate, topography, and management factors [2,3]. Understanding the causes of this heterogeneity is a fundamental step toward improving resource-use efficiency and supporting precision agriculture practices. Yield maps generated by combine harvesters have demonstrated that significant differences in crop performance may occur within the same field, often reflecting variations in soil properties and environmental conditions [3,4]. Consequently, identifying the factors responsible for these differences is essential for the delineation of management zones and the implementation of site-specific interventions.
Among the factors influencing rice productivity, soil chemical properties play a central role because they directly affect nutrient availability and plant development [5]. However, in flooded rice systems, the influence of soil chemistry extends beyond conventional fertility attributes. The establishment of a permanent water layer creates anaerobic conditions that profoundly alter the soil environment, triggering a series of biogeochemical and geochemical reactions that modify nutrient dynamics and the availability of several chemical elements [6,7].
Following flooding, oxygen is rapidly depleted from the soil profile due to microbial respiration and root activity. As soil redox potential decreases, a sequence of reduction reactions occurs, affecting several electron acceptors and leading to substantial changes in soil chemistry [6,8]. Among the most important processes is the reduction of manganese and iron oxides, resulting in the conversion of Mn⁴⁺ and Fe³⁺ into the more soluble forms Mn²⁺ and Fe²⁺ [8,9]. This increase in solubility can significantly alter the composition of the soil solution and influence crop performance.
Although iron and manganese are essential micronutrients for plant growth, excessive concentrations may become detrimental under prolonged flooding conditions. Iron toxicity is recognized as one of the most important nutritional disorders affecting rice production worldwide and can cause leaf bronzing, oxidative stress, impaired root development, and yield reduction [9]. Likewise, excessive manganese availability may disrupt physiological processes and interfere with nutrient uptake, particularly in environments subjected to intense reduction conditions [6]. Therefore, the productivity of flooded rice systems depends not only on nutrient supply but also on maintaining a favorable chemical balance capable of preventing the excessive accumulation of potentially toxic elements.
Conversely, several soil attributes contribute positively to crop performance. Soil organic matter plays an essential role in nutrient cycling, cation retention, and soil buffering capacity, contributing to the maintenance of soil fertility [10]. Exchangeable calcium and magnesium are important for root development, membrane stability, and nutrient absorption, while also contributing to the reduction of metal toxicity through competitive interactions in the soil-plant system [11]. Silicon, although not considered an essential nutrient for most crops, is recognized as a beneficial element for rice due to its role in strengthening plant tissues, improving tolerance to biotic and abiotic stresses, and enhancing crop productivity [12].
Because these attributes are not uniformly distributed across agricultural fields, substantial spatial variability in fertility conditions may occur. Previous studies have demonstrated that variations in soil chemical properties can significantly influence crop productivity and contribute to the formation of distinct production environments within the same field [13,14,15,16]. The identification of these spatial patterns has become increasingly important in precision agriculture, where management decisions are based on local soil conditions rather than field-average values [17,18,19].
Several studies have investigated relationships between individual soil attributes and rice yield [2,20]. However, relatively few studies have evaluated the combined effects of fertility-related attributes and redox-sensitive elements under commercial flooded rice production systems. Furthermore, conventional approaches based on bivariate analyses often fail to account for the strong interdependence among soil variables, potentially limiting the identification of the principal factors controlling yield variability [21].
Multivariate techniques such as Principal Component Analysis (PCA) provide an effective framework for reducing data dimensionality, minimizing collinearity, and identifying the most relevant variables explaining spatial variability in agricultural systems [21]. When combined with yield mapping and spatial analyses, these techniques can improve the understanding of soil–crop relationships and support the development of more efficient management strategies.
We hypothesized that spatial variability in flooded rice yield is jointly controlled by two interacting processes: (i) gradients in soil fertility represented by variations in organic matter, calcium, magnesium, and silicon availability, and (ii) redox-induced accumulation of iron and manganese under flooded conditions, which negatively affect crop performance through toxicity mechanisms. Therefore, the objective of this study was to evaluate the relationships between soil chemical attributes and grain yield in a commercial flooded rice field and to identify the key factors explaining yield heterogeneity under irrigated conditions in southern Brazil.
2. Materials and Methods
The study was conducted during the 2024/2025 growing season in a 45 ha commercial irrigated rice field located in Uruguaiana, Rio Grande do Sul, Brazil (Figure 1). The soil is classified as a Regolithic Entisol according to Mineral Resources Research Company [22], with parent material derived from andesite [23], corresponding to Regosols in the World Reference Base for Soil Resources [24] and Psamments (Entisols) in the Soil Taxonomy system [25].
Sowing was carried out under dry soil conditions, using conventional tillage, in early October. The cultivar IRGA 424 RI was used, with row spacing of 0.17 m and a seeding rate of 120 kg ha⁻¹. Basal fertilization consisted of applying 300 kg ha⁻¹ of the N–P–K formulation (05–20–30), based on prior soil analysis, along with nitrogen topdressing totaling 150 kg ha⁻¹. Of this amount, 50% was applied before flooding and the remainder at the R1 stage (panicle initiation) [26].
Weed management was performed using glyphosate (1440 g a.i. ha⁻¹) and clomazona (648 g a.i. ha⁻¹) at the S3 stage (booting stage) [26], in addition to post-emergence applications of cyhalofop-butyl (360 g a.i. ha⁻¹) and bentazon (900 g a.i. ha⁻¹). Flood irrigation began at 20 days after emergence (DAE), and all other practices followed the technical recommendations for rice cultivation [27].
The area of interest was delineated using QGIS software (version 3.40.10) based on satellite imagery. Within this area, a regular sampling grid was established with a density of one sample per hectare, totaling 44 georeferenced sampling points.
Soil samples were collected from the 0–20 cm layer using a cutting spade. Each composite sample consisted of five subsamples collected within a 10 m radius around each sampling point. Samples were homogenized, identified, and sent to the laboratory for physicochemical analysis.
Laboratory analyses included: clay content determined by the hydrometer method; pH in water; phosphorus (P), potassium (K), copper (Cu), zinc (Zn), and sodium (Na) extracted using Mehlich-1; calcium (Ca), magnesium (Mg), aluminum (Al), and manganese (Mn) extracted with 1 mol L⁻¹ KCl; sulfur (S) extracted with Ca(H₂PO₄)₂; silicon (Si) extracted with CaCl₂; iron (Fe) extracted with 0.2 mol L⁻¹ ammonium oxalate (pH 6.0); and boron (B) determined by hot water extraction.
Water depth was measured at the R4 stage (anthesis) [26], with five readings per sampling point. Grain yield was obtained using a John Deere S760 combine harvester equipped with a yield monitor. The raw data were filtered to remove errors related to turning operations, stationary periods, variations in cutting width, and outliers [28].
The filtered data were subjected to spatial dependence analysis using experimental semivariograms, performed with the Smart Map plugin [29] available in QGIS (version 3.40.10).
Semivariogram fitting was performed manually based on visual inspection, selecting the model with the lowest nugget effect (C₀), highest coefficient of determination (R²), and best cross-validation results (lowest R² and lowest root mean square error – RMSE). Spatial dependence modeling included estimation of the nugget effect (C₀), sill (C₀ + C), range (A), and Moran’s index. After model selection, yield maps were interpolated using ordinary kriging, assuming isotropic models and using eight neighboring points. The interpolated yield map was then classified into three relative yield classes: low (<95%), medium (95–105%), and high (>105%) relative to the field average [30].
The relationship between variables and yield was evaluated by generating buffers with a 20 m radius around each sampling point. Yield values from both the thematic yield map and the relative yield map were extracted using zonal statistics and used for statistical analyses.
Statistical analyses were conducted in four stages. First, descriptive statistics were calculated to characterize data distribution, including mean, minimum, maximum, standard deviation, and coefficient of variation. Next, Pearson correlation analysis was performed to evaluate the strength and direction of linear relationships among variables, with significance assessed using Student’s t-test at a 5% level (p < 0.05).
Principal Component Analysis (PCA) was used as a multivariate technique to reduce data dimensionality and identify patterns of variability, as well as the relative contribution of each variable to total variance. Variables with significant loadings in the same principal component as yield were then selected for mean comparison. These comparisons were performed between selected variables and relative yield classes to identify significant differences among yield classes using analysis of variance (ANOVA), followed by Tukey’s test at a 5% significance level (p ≤ 0.05).
The adequacy of PCA was verified using the Kaiser–Meyer–Olkin (KMO) test and Bartlett’s test of sphericity [31,32]. Varimax rotation was applied to improve component interpretation, retaining components with eigenvalues greater than 1. Variables with factor loadings ≥ |0.5| were considered significant [21,32]. All statistical analyses were performed using Jamovi software (version 2.7.24).
3. Results
3.1. Modeling the Spatial Dependence of Rice Yield
The Figure 2 present the geostatistical modeling and thematic map of irrigated rice yield (t ha⁻¹) in Uruguaiana, Rio Grande do Sul, Brazil (2024/2025 growing season). Was observed a strong spatial dependence of productivity, with the semivariogram best fitted to a spherical model. The coefficient of determination (R² = 0.928) and the error (RMSE = 0.262 t ha⁻¹) indicate that ordinary kriging successfully captured the variability in yield. Similar results have been reported in rice studies, where spatial models showed satisfactory performance when combined with georeferenced data and environmental variables, enabling an accurate representation of yield heterogeneity [4].
3.2. Descriptive Statistics of Soil Attributes and Rice Yield
The Table 1 present the descriptive statistics of soil physicochemical properties, grain yield, irrigation water depth with rice yield in a flooded rice field in Uruguaiana, Rio Grande do Sul, Brazil (2024/2025 season). The average grain yield reached 10.35 t ha⁻¹, with a coefficient of variation of 9.9% and a yield range of 4.5 t ha⁻¹ among sampled locations. The irrigation water depth averaged 8.22 cm (CV = 9.1%). Soil pH ranged from 4.8 to 5.6, with an average value of 5.2. Clay content varied from 26 to 40%, indicating medium to clayey texture. Soil organic matter averaged 2.93% (CV = 11.1%).
Phosphorus presented an average concentration of 3.51 mg dm⁻³, while potassium averaged 88 mg dm⁻³. Calcium, magnesium, sulfur and silicon showed average values considered adequate for irrigated rice cultivation. Zinc, copper and aluminum exhibited greater spatial variability. Iron and manganese averaged 181 and 73 mg dm⁻³, respectively. Silicon averaged 30.5 mg dm⁻³, ranging from 17.12 mg dm⁻³ to higher values across the field.
3.3. Correlation Analysis
The correlation matrix (Figure 3) showed positive correlations between rice yield and clay content, organic matter, calcium, magnesium, and silicon. Yield was negatively correlated with iron and manganese. Positive correlations were also observed between pH and phosphorus (r = 0.31), and between iron and manganese (r = 0.71). Manganese showed a positive correlation with irrigation water depth (r = 0.34).
3.4. Principal Component Analysis
Principal component analysis explained 76.4% of the total variance in soil attributes and yield (Table 2). The first component accounted for 33.7% of the variance and represented a fertility gradient characterized by positive loadings for Ca, Mg, organic matter, silicon and grain yield. These attributes are commonly associated with improved soil chemical stability and nutrient retention capacity. In addition to negative loadings for Fe and Mn, this increases the reliability that, in this study, these micronutrients acted in a toxic manner to irrigated rice cultivation.
3.5. Yield Classes and Comparison of Means
The stratification of irrigated rice yield into classes (Figure 4) enabled the identification of zones with distinct productivity levels. Yield increased significantly from low-yield areas (9.30 t ha⁻¹) to high-yield areas (11.51 t ha⁻¹), while the intermediate class showed 10.28 t ha⁻¹. The significant differences among classes, confirmed by Tukey’s test (p ≤ 0.05), indicate that the delineation of production environments was consistent and effective in discriminating different levels of crop performance within the field.
The Figure 5, accompanied by an increase in organic matter, basic cation (Ca²⁺ and Mg²⁺), and silicon content. This pattern reinforces the importance of cation exchange capacity (CEC) and base saturation (V%) for sustaining higher yields, since clayier soils richer in organic matter exhibit greater nutrient and water retention, favoring root growth [10,33]
4. Discussion
4.1. Soil Fertility Gradients and Rice Yield Formation
The results support the hypothesis that soil fertility gradients are among the primary factors controlling yield variability in flooded rice systems. The positive associations observed between rice yield and organic matter, calcium, magnesium, and silicon indicate that high-yield environments were characterized by a more favorable chemical balance and greater nutrient availability.
Soil organic matter (OM) showed a strong relationship with grain yield, highlighting its importance for maintaining soil fertility under flooded conditions. Beyond serving as a nutrient reservoir, OM contributes to cation exchange capacity, nutrient buffering, and microbial activity, thereby improving nutrient availability and plant uptake [10]. The higher OM levels observed in productive areas likely promoted greater nutrient retention and enhanced resilience to chemical fluctuations induced by flooding.
Calcium and magnesium were also positively associated with rice productivity. These cations play fundamental roles in plant growth and soil chemical balance. Calcium participates in cell elongation, cell wall stability, and signaling processes [34], while magnesium is essential for chlorophyll formation, carbohydrate metabolism, and membrane stabilization [35,36]. Previous studies conducted in irrigated rice systems have demonstrated that adequate Ca and Mg availability contributes to improved crop performance and reduced susceptibility to nutritional disorders [11].
Silicon emerged as another important attribute associated with high-yield environments. Although not classified as an essential nutrient, silicon is widely recognized as a beneficial element for rice cultivation because it improves plant architecture, increases tolerance to abiotic and biotic stresses, and enhances photosynthetic efficiency [12]. The higher silicon levels observed in productive zones reinforce the importance of maintaining adequate Si availability in intensively cultivated rice systems, particularly considering the high rates of silicon export through harvested grain [12].
Collectively, these results suggest that productive environments are not simply characterized by higher nutrient concentrations but rather by a more balanced fertility status capable of sustaining crop growth throughout the season. Similar relationships between soil fertility gradients and crop performance have been reported in other studies investigating spatial variability in agricultural systems [2,16,37].
4.2. Redox-Induced Fe and Mn Dynamics as Yield-Limiting Factors
While fertility-related attributes contributed positively to yield, the negative associations observed between rice productivity and Fe and Mn indicate that redox-induced geochemical processes played a major role in determining crop performance. This finding supports the second component of the proposed hypothesis and highlights the importance of considering the consequences of prolonged flooding on soil chemical dynamics.
Flooding rapidly depletes oxygen in the soil and promotes the reduction of electron acceptors, resulting in substantial changes in redox potential [6,8]. Under these conditions, ferric iron (Fe³⁺) and manganese oxides are reduced to their more soluble forms, Fe²⁺ and Mn²⁺, increasing their concentration in the soil solution [8,9]. Although both elements are essential micronutrients, excessive accumulation may impair root function, alter nutrient uptake, induce oxidative stress, and reduce grain yield [9].
The strong relationship observed between Fe and Mn indicates that both elements responded similarly to the reducing conditions characteristic of flooded soils. Their negative association with yield suggests that environments experiencing more intense reduction processes became less favorable for crop development. Similar behavior has been reported in lowland rice systems, where prolonged anaerobic conditions increase Fe²⁺ and Mn²⁺ availability and may induce toxicity symptoms [6,9].
Among the evaluated attributes, manganese showed the strongest negative association with productivity and the largest differences among yield classes. This result suggests that Mn toxicity may represent an underrecognized limitation in rice-growing regions of southern Brazil. According to regional recommendations, Mn levels extracted by KCl above 5 mg dm⁻³ are considered high [38]. However, the concentrations observed in the present study greatly exceeded this threshold, particularly in low-yield zones. Previous surveys conducted in Rio Grande do Sul also reported elevated Mn concentrations in rice leaves, frequently surpassing levels considered excessive for the crop [39].
The negative effects of Fe and Mn may also explain the inverse relationship observed between these elements and fertility-related attributes. Productive environments showed higher levels of Ca, Mg, OM, and Si, together with lower Fe and Mn concentrations. This pattern suggests that favorable fertility conditions may indirectly contribute to mitigating toxicity through competitive ion uptake, complexation reactions, improved buffering capacity, and enhanced plant tolerance [40,41,42].
Therefore, yield variability in the studied field was not determined exclusively by nutrient availability or micronutrient toxicity, but rather by the interaction between fertility gradients and redox-mediated geochemical processes. These findings reinforce the importance of incorporating redox-sensitive elements into soil assessments conducted in flooded rice systems.
4.3. Implications for Precision Agriculture and Site-Specific Management
The integration of Pearson correlation analysis, principal component analysis (PCA), yield stratification, and mean comparison tests enabled a comprehensive assessment of the factors controlling yield variability in the study area. While correlation analysis identified initial relationships between soil attributes and yield, PCA reduced data dimensionality and highlighted the principal factors governing productivity. Yield stratification subsequently provided an agronomic interpretation of these relationships and confirmed the relevance of the identified attributes.
The observed yield variability demonstrates considerable opportunities for site-specific management. High-yield zones were characterized by greater concentrations of organic matter, calcium, magnesium, and silicon, whereas low-yield zones exhibited elevated Fe and Mn levels. These contrasting conditions indicate that different portions of the field may require distinct management approaches to maximize productivity and resource-use efficiency.
From a practical perspective, the results support the adoption of precision agriculture strategies aimed at correcting localized limitations rather than applying uniform management across the entire field. Variable-rate fertilization, targeted liming, and silicon replenishment represent promising alternatives for improving soil chemical balance in low-productivity zones. Furthermore, management practices designed to mitigate Fe and Mn toxicity may contribute substantially to reducing yield gaps.
Water management also deserves particular attention because the accumulation of Fe and Mn is directly controlled by redox conditions. Practices such as intermittent drainage and alternate wetting and drying have been reported as effective strategies for reducing Fe toxicity and improving rice productivity under flooded conditions [43,44]. Likewise, the application of lime and silicon amendments has been shown to reduce Fe and Mn availability while improving crop performance [40,45].
Nevertheless, the present study was conducted during a single growing season. Although the observed relationships are supported by well-established soil chemical processes, rice productivity is strongly influenced by climatic conditions and seasonal variability. Consequently, future multi-season studies are necessary to evaluate the temporal stability of the identified relationships and management zones before broader extrapolation of the results.
Overall, the findings demonstrate that yield heterogeneity in flooded rice systems is governed by the interaction between soil fertility status and redox-induced Fe and Mn dynamics. Understanding these processes provides a scientific basis for developing site-specific management strategies capable of increasing productivity while improving the efficiency and sustainability of irrigated rice production.
5. Conclusions
The results supported the proposed hypothesis that yield heterogeneity in flooded rice systems is jointly controlled by soil fertility gradients and redox-mediated accumulation of iron and manganese under flooded conditions.
Higher rice yields were associated with greater concentrations of organic matter, calcium, magnesium, and silicon, indicating that productive environments were characterized by improved soil chemical balance and nutrient availability. In contrast, elevated Fe and Mn concentrations were consistently associated with lower productivity, suggesting that excessive accumulation of these elements under reducing conditions represents an important constraint to crop performance.
Among the evaluated attributes, manganese emerged as a particularly relevant factor explaining yield variability, highlighting the need for greater attention to its dynamics in irrigated rice systems. The results further demonstrate that rice yield depends not only on adequate nutrient supply but also on the mitigation of adverse geochemical processes associated with prolonged flooding.
The integration of spatial analysis, Pearson correlation, principal component analysis, and yield stratification proved effective for identifying key soil attributes associated with crop performance and for supporting the delineation of site-specific management zones.
From a practical perspective, strategies aimed at maintaining soil chemical balance, replenishing silicon, increasing organic matter levels, and reducing Fe and Mn toxicity may contribute to improving yield and resource-use efficiency in irrigated rice systems.
Because this study was conducted during a single growing season, future multi-season investigations are necessary to evaluate the temporal stability of the observed relationships and the consistency of the identified management zones. Nevertheless, the findings provide important evidence that integrating fertility indicators with redox-sensitive soil attributes can improve the understanding and management of yield variability in flooded rice production systems.
Author Contributions
Conceptualization, V.G.P.; C.F.P.; R.G.S. and F.F.S.; methodology, V.G.P.; F.F.S. and E.L.B.; software, V.G.P. and F.F.S.; validation, V.G.P. and F.F.S.; formal analysis, V.G.P. and F.F.S.; investigation, V.G.P.; C.F.P. and R.G.S.; resources, V.G.P.; C.F.P. and R.G.S.; data curation, V.G.P.; C.F.P. and R.G.S.; writing—original draft preparation, V.G.P.; E.L.B.; writing—review and editing, V.G.P. and E.L.B.; visualization, F.F.S. and E.L.B.; supervision, V.G.P. and E.L.B.; project administration, V.G.P. All authors have read and agreed to the published version of the manuscript.
Funding
This research received no external funding.
Data Availability Statement
The raw data supporting the conclusions of this article will be made available by the authors on request.
Acknowledgments
During the preparation of this manuscript, the authors used OpenAI GPT-5.5 for the purposes of to assist in the grammatical review of English. The authors have reviewed and edited the output and take full responsibility for the content of this publication.
Conflicts of Interest
The authors declare no conflicts of interest.
References
- Ribas, G.G.; Heinemann, A.B.; Stone, L.F.; Castro, A.P.; Streck, N.A.; Santos, A.B.; Silva, M.R.; Steinmetz, S.; Soares, C.F.; Zanon, A.J. Rice-based cropping systems in Brazil: Irrigated and rainfed. Crop Environ. 2025, 4, 256–262. [Google Scholar] [CrossRef]
- Durigon, R.; Schlosser, J.F.; Russini, A.; Dornelles, M.E. de. C.; Pinheiro, E.D. Correlações entre atributos químicos do solo e atributos da cultura e da produtividade do arroz irrigado. Ciênc. Rural 2009, 39, 2629–2633. [Google Scholar] [CrossRef]
- Trevisan, R.G.; Bullock, D.S.; Martin, N.F. Spatial variability of crop responses to agronomic inputs in on-farm precision experimentation. Precis. Agric. 2021, 22, 342–363. [Google Scholar] [CrossRef]
- Liu, Z.; Ju, H.; Ma, Q.; Sun, C.; Lv, Y.; Liu, K.; Wu, T.; Cheng, M. Rice Yield Estimation Using Multi-Temporal Remote Sensing Data and Machine Learning: A Case Study of Jiangsu, China. Agriculture 2024, 14, 638. [Google Scholar] [CrossRef]
- Shrestha, J.; Kandel, M.; Shah, K.K. Role of nutrients in rice (Oryza sativa L.): A review. Agrica 2020, 9, 53–62. [Google Scholar] [CrossRef]
- Radmann, V.; Sousa, R.O. de.; Weinert, C.; Jordão, H.W.C.; Carlos, F.S. Soil solution and rice nutrition under liming and water management in a soil from Amazonian natural fields. Rev. Bras. Ciênc. Solo 2023, 47, e0220101. [Google Scholar] [CrossRef]
- Kirchhof, G.; Priyono, S.; Utomo, W.H.; Adisarwanto, T.; Dacanay, E.V.; So, H.B. The effect of soil puddling on the soil physical properties and crop performance under rice cultivation. Soil Tillage Res. 2000, 56, 37–50. [Google Scholar] [CrossRef]
- Boie, F.; Shaheen, S.M.; Kandeler, E.; Rinklebe, J. Controlled redox potentials and flooding duration affect microbial community composition and biomass in an arable soil. Soil Biol. Biochem 2025, 211, 109962. [Google Scholar] [CrossRef]
- Zhang, L.; Li, Y.; Wang, Y.; Liu, Z.; Kronzucker, J.H.; Li, G. Exploring the complexities of rice iron toxicity: Paradoxes, mechanisms, and strategic deliberations. J. Plant Physiol. 2025, 314, 154601. [Google Scholar] [CrossRef] [PubMed]
- Ramos, F.T.; Dores, E.F.C.; Weber, O.L.D.S.; Beber, D.C.; Campelo Junior, J.H.; Maia, J.C.S. Soil organic matter doubles the cation exchange capacity of tropical soil under no-till farming in Brazil. J. Sci. Food Agric. 2018, 98, 3595–3602. [Google Scholar] [CrossRef] [PubMed]
- Silva, L.S. da.; Ranno, S.K. Calagem em solos de várzea e a disponibilidade de nutrientes na solução do solo após o alagamento. Ciênc. Rural 2005, 35, 1054–1061. [Google Scholar] [CrossRef]
- Sharma, B.; Kumawat, K.C.; Tiwari, S.; Kumar, A.; Dar, R.A.; Singh, U.; Cardinale, M. Silicon and plant nutrition-dynamics, mechanisms of transport and role of silicon solubilizer microbiomes in sustainable agriculture: A review. Pedosphere 2023, 33, 534–555. [Google Scholar] [CrossRef]
- Dalchiavon, F.C.; Carvalho, M. de P. e.; Andreotti, M.; Montanari, R. Variabilidade espacial de atributos da fertilidade de um Latossolo Vermelho Distroférrico sob Sistema Plantio Direto. Rev. Ciênc. Agron. 2012, 43, 453–61. [Google Scholar] [CrossRef]
- Montanari, R.; Pereira, G.T.; Marques Júnior, J.; de Souza, Z.M.; Pazeto, R.J.; Camargo, L.A. Variabilidade espacial de atributos químicos em latossolo e argissolos. Ciênc. Rural 2008, 38, 1266–1272. [Google Scholar] [CrossRef]
- Jiang, Z.; Yin, Z.; Li, X.; Chen, D.; Huang, M.; Zhou, Y.; Wu, T.; Zhao, M.; Wang, W.; Zhang, Y. Spatial Heterogeneity of Soil Nutrient in Principal Paddy and Cereal Production Landscapes of Fengtai County within the Huai River Basin, Eastern China. Appl. Sci. 2024, 14, 9087. [Google Scholar] [CrossRef]
- Gazolla-Neto, A.; Fernandes, M.C.; Vergara, R. de O.; Gadotti, G.I.; Villela, F.A. Spatial distribution of the chemical properties of the soil and of soybean yield in the field. Rev. Cienc. Agron. 2016, 47, 325–333. [Google Scholar] [CrossRef]
- Molin, J.P. Definição de unidades de manejo a partir de mapas de produtividade. Engen. Agric. 2002, 22, 83–92. [Google Scholar]
- Valente, D.S.M.; Pereira, G.W.; de Queiroz, D.M.; Zandonadi, R.S.; Amaral, L. R. d.; Bottega, E.L.; Costa, M.M.; de Freitas Coelho, A.L.; Grift, T. Accuracy of Various Sampling Techniques for Precision Agriculture: A Case Study in Brazil. Agriculture 2024, 14, 2198. [Google Scholar] [CrossRef]
- da Silva Júnior, J.F.; da Silva, T.T.; Sousa, D.J. da S.; Tavares, R.L.M.; de Souza, B.D.L.; Pinheiro, D.P. Delineation of potential management zones for cowpea by factorial kriging and spatial Fuzzy C-Means of yield and soil chemical and texture properties. Rev. Bras. Ciênc. Solo 2025, 49, e0230158. [Google Scholar] [CrossRef]
- Pinto, M.A.B.; Parfitt, J.M.B.; Timm, L.C.; Faria, L.C.; Scivittaro, W.B. Produtividade de arroz irrigado por aspersão em terras baixas em função da disponibilidade de água e de atributos do solo. Pesqui. Agropecu. Bras. 2016, 51, 1584–1593. [Google Scholar] [CrossRef]
- Ten Caten, A.; Dalmolin, R.S.D.; Pedron, F.A.; Mendonça-Santos, M. de L. Estatística multivariada aplicada à diminuição do número de preditores no mapeamento digital do solo. Pesqui. Agropecu. Bras. 2011, 46, 553–561. [Google Scholar] [CrossRef]
- CPRM—Serviço Geológico do Brasil. Mapa Geodiversidade do Estado do Rio Grande do Sul; Escala 1:750,000; Available online; CPRM: Porto Alegre, Brazil; RIGeo – Mapa Geodiversidade do Estado do Rio Grande do Sul, 2009; (accessed on 2 June 2026). [Google Scholar]
- Streck, E.V.; Kämpf, N.; Dalmolin, R.S.D.; Klamt, E.; Nascimento, P.C.; Giasson, E.; Pinto, L.F.S. Solos do Rio Grande do Sul, 3rd ed., rev. and expanded; Emater/RS-Ascar: Porto Alegre, Brazil, 2018; p. 252 p. Available online: https://www.researchgate.net/publication/236965550_Solos_do_Rio_Grande_do_Sul (accessed on 2 June 2026).
- IUSS Working Group WRB. World Reference Base for Soil Resources 2014: International Soil Classification System for Naming Soils and Creating Legends for Soil Maps; World Soil Resources Reports No. 106; Food and Agriculture Organization of the United Nations (FAO): Rome, Italy, 2014; ISBN 978-92-5-108370-3. [Google Scholar]
- Soil Survey Staff. Soil Taxonomy: A Basic System of Soil Classification for Making and Interpreting Soil Surveys, Available online, 2nd ed.; U.S. Department of Agriculture, Natural Resources Conservation Service: Washington, DC, USA; USDA Soil Taxonomy, 1999; (accessed on 2 June 2026)Agriculture Handbook No. 436. [Google Scholar]
- Counce, P.; Keisling, T.C.; Mitchell, A.J. A uniform, objective, and adaptive system for expressing rice development. Crop Sci. 2000, 40, 436–443. [Google Scholar] [CrossRef]
- SOSBAI – Sociedade Sul-Brasileira de Arroz Irrigado. Arroz irrigado: recomendações técnicas da Pesquisa para o Sul do Brasil, 33 ed.; Sociedade Sul-Brasileira de Arroz Irrigado: Cachoeirinha; Cachoeirinha, Brasil, 2022; p. 200p. [Google Scholar]
- Menegatti, L.A.A.; Molin, J.P. Remoção de erros em mapas de produtividade via filtragem de dados brutos. Rev. Bras. Eng. Agric. Ambient. 2004, 8, 126–134. [Google Scholar] [CrossRef]
- Pereira, G.W.; Valente, D.S.M.; Queiroz, D.M.D.; Coelho, A.L.D.F.; Costa, M.M.; Grift, T. Smart-Map: An open-source QGIS plugin for digital mapping using machine learning techniques and ordinary kriging. Agronomy 2022, 12, 1350. [Google Scholar] [CrossRef]
- Molin, J.P. Definição de unidades de manejo a partir de mapas de produtividade. Engen. Agric. 2002, 22, 83–92. [Google Scholar]
- Kaiser, H.F. The application of electronic computers to factor analysis. Educ. Psychol. Meas. 1960, 20, 141–151. [Google Scholar] [CrossRef]
- Bartlett, M.S. Tests of significance in factor analysis. Br. J. Psychol. 1950, 3, 77–85. [Google Scholar] [CrossRef]
- Shrestha, J.; Kandel, M.; Shah, K.K. Role of nutrients in rice (Oryza sativa L.): A review. Agrica 2020, 9, 53–62. [Google Scholar] [CrossRef]
- Upadhyaya, H.; Begum, L.; Dey, B.; Nath, P.K.; Panda, S.K. Impact of Calcium Phosphate Nanoparticles on Rice Plant. J. Plant Sci. Phytopathol. 2017, 1, 1–10. [Google Scholar] [CrossRef]
- Lamichhane, S.; Tarpley, L.; Dou, F. Impact of Excess Magnesium Salt Supply on Rice Yield, Physiological Response, and Grain Mineral Content. Sustainability 2023, 15, 15741. [Google Scholar] [CrossRef]
- Arinzechi, C.; Huang, P.; Ping, Y.; Xu, H.; Wang, Q.; Tang, C.; Si, M.; Li, Q.; Yang, Z. Calcium-magnesium synergy in reducing cadmium bioavailability and uptake in rice plants. Int. J. Phytoremediation 2025, 27, 832–841. [Google Scholar] [CrossRef] [PubMed]
- Amado, T.J.C.; Pes, L.Z.; Lemainski, C.L.; Schenato, R.B. Atributos químicos e físicos de latossolos e sua relação com os rendimentos de milho e feijão irrigados. Rev. Bras. Ciênc. Solo 2009, 33, 831–843. [Google Scholar] [CrossRef]
- Comissão de Química e Fertilidade do Solo (CQFS-RS/SC). Manual de Adubação e de Calagem para os Estados do Rio Grande do Sul e de Santa Catarina, 11th ed.; Sociedade Brasileira de Ciência do Solo—Núcleo Regional Sul: Porto Alegre, Brazil, 2016; p. 376 p. [Google Scholar]
- Guindani, R.H.P.; Anghinoni, I.; Nachtigall, G.R. DRIS na avaliação do estado nutricional do arroz irrigado por inundação. Rev. Bras. Ciênc. Solo 2009, 33, 109–118. [Google Scholar] [CrossRef]
- Suriyagoda, L.; Sirisena, D.; Somaweera, K.; Dissanayake, A.; Costa, W.A.J.M. de.; Lambers, H. Incorporation of dolomite reduces iron toxicity, enhances growth and yield, and improves phosphorus and potassium nutrition in lowland rice (Oryza sativa L). Plant Soil 2017, 410, 299–312. [Google Scholar] [CrossRef]
- Rajonandraina, T.; Ueda, Y.; Wissuwa, M.; Kirk, G.J.D.; Rakotoson, T.; Manwaring, H.; Andriamananjara, A.; Razafimbelo, T. Magnesium supply alleviates iron toxicity-induced leaf bronzing in rice through exclusion and tissue-tolerance mechanisms. Front. Plant Sci. 2023, 14, 1213456. [Google Scholar] [CrossRef] [PubMed]
- Lu, H.; Nkoh, J.N.; Biswash, R.M.; Hua, H.; Dong, G.; Li, J.; Xu, R. Effects of surface charge and chemical forms of manganese (II) on rice roots on manganese absorption by different rice varieties. Ecotoxicol. Environ. Saf. 2021, 207, 111224. [Google Scholar] [CrossRef] [PubMed]
- Schmidt, F.; Fortes, M.; de, Á.; Wesz, J.; Buss, G.L.; Sousa, R. The impact of water management on iron toxicity in flooded rice. Rev. Bras. Ciênc. Solo 2013, 37, 1226–1235. [Google Scholar] [CrossRef]
- Dossou-Yovo, E.R.; Kouadio, S.A.K.; Saito, K. Effects of mid-season drainage on iron toxicity, rice yield, and water productivity in irrigated systems in the derived savannah agroecological zone of West África. Field Crops Res. 2023, 296, 108901, 2023. [Google Scholar] [CrossRef]
- Santos, M.S.; Sanglard, L.M.V.P.; Barbosa, M.L.; Namorato, F.A.; Melo, D.C.; Franco, W.C.G.; Pérez-Molina, J.P.; Martins, S.C.V.; DaMatta, F.M. Silicon nutrition mitigates the negative impacts of iron toxicity on rice: evidence for improved photosynthesis and yield under excess Fe. Chemosphere 2020, 248, 125983. [Google Scholar] [CrossRef]
Figure 1.
Geographic location of the study area and spatial distribution of the soil sampling grid in a flooded rice field in Uruguaiana, Rio Grande do Sul, Brazil (2024/2025 growing season).
Figure 1.
Geographic location of the study area and spatial distribution of the soil sampling grid in a flooded rice field in Uruguaiana, Rio Grande do Sul, Brazil (2024/2025 growing season).
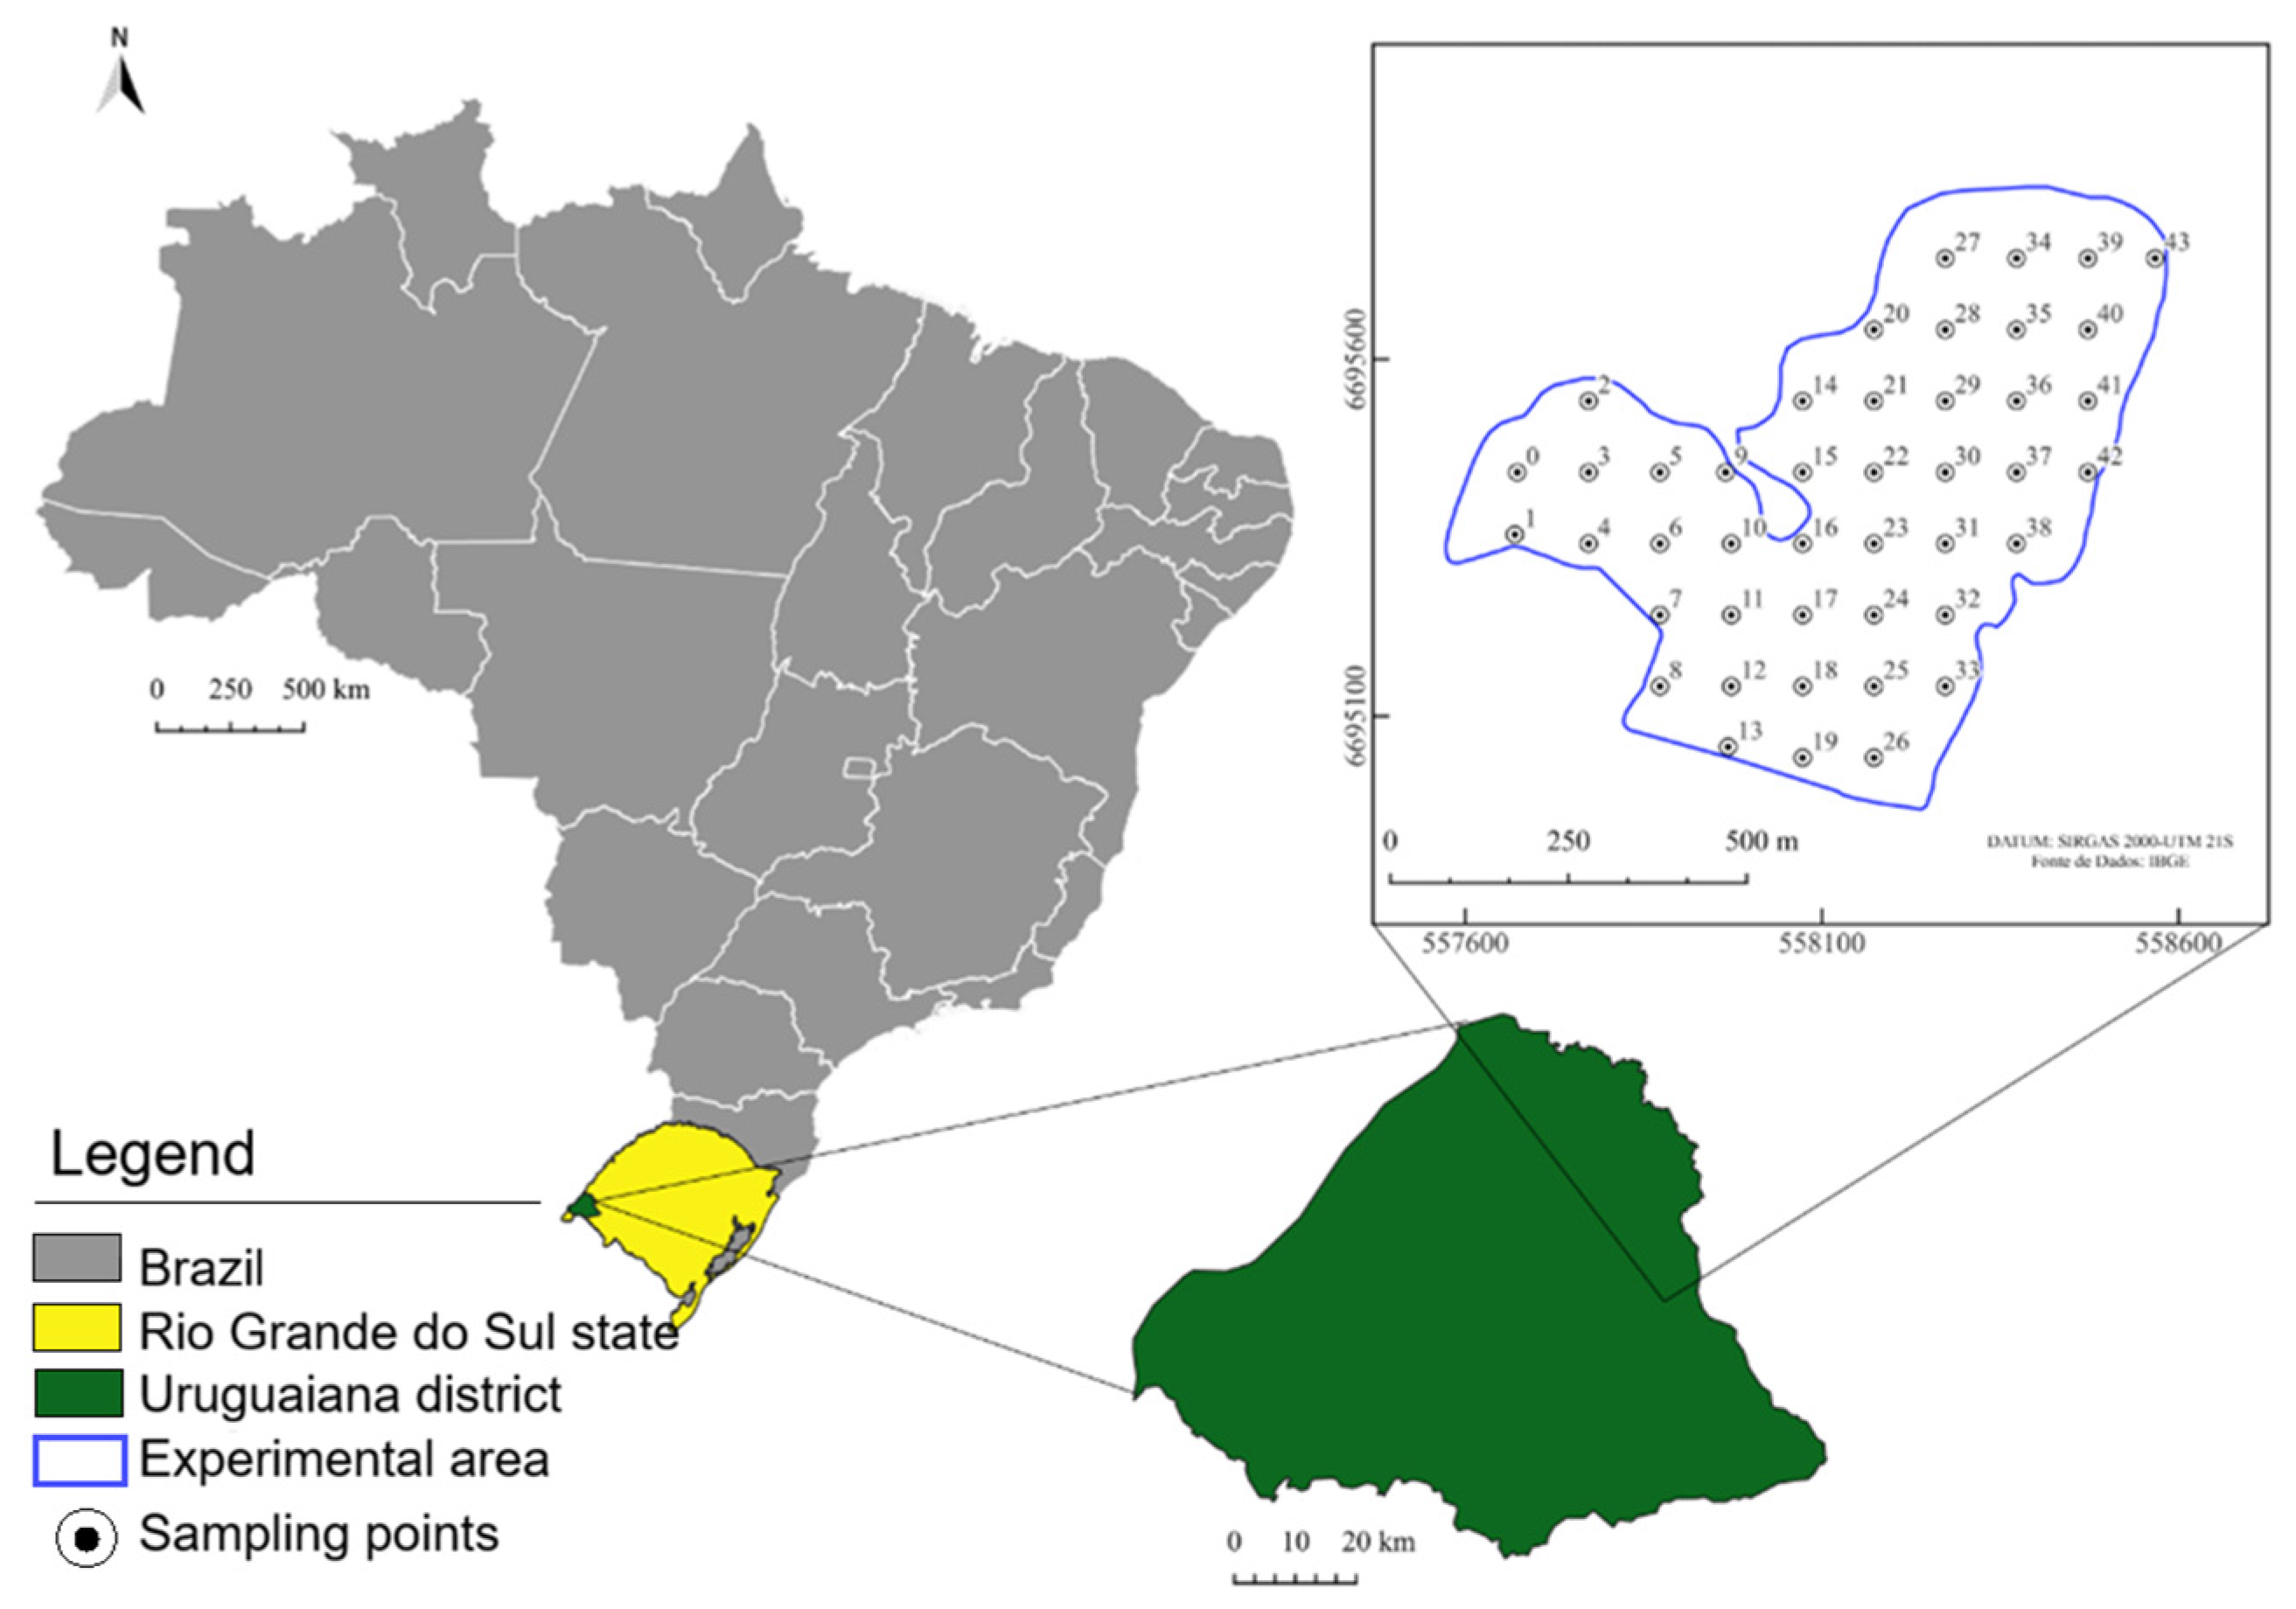
Figure 2.
Geostatistical modeling and thematic map of irrigated rice yield (t ha⁻¹) in Uruguaiana, Rio Grande do Sul, Brazil (2024/2025 growing season).
Figure 2.
Geostatistical modeling and thematic map of irrigated rice yield (t ha⁻¹) in Uruguaiana, Rio Grande do Sul, Brazil (2024/2025 growing season).
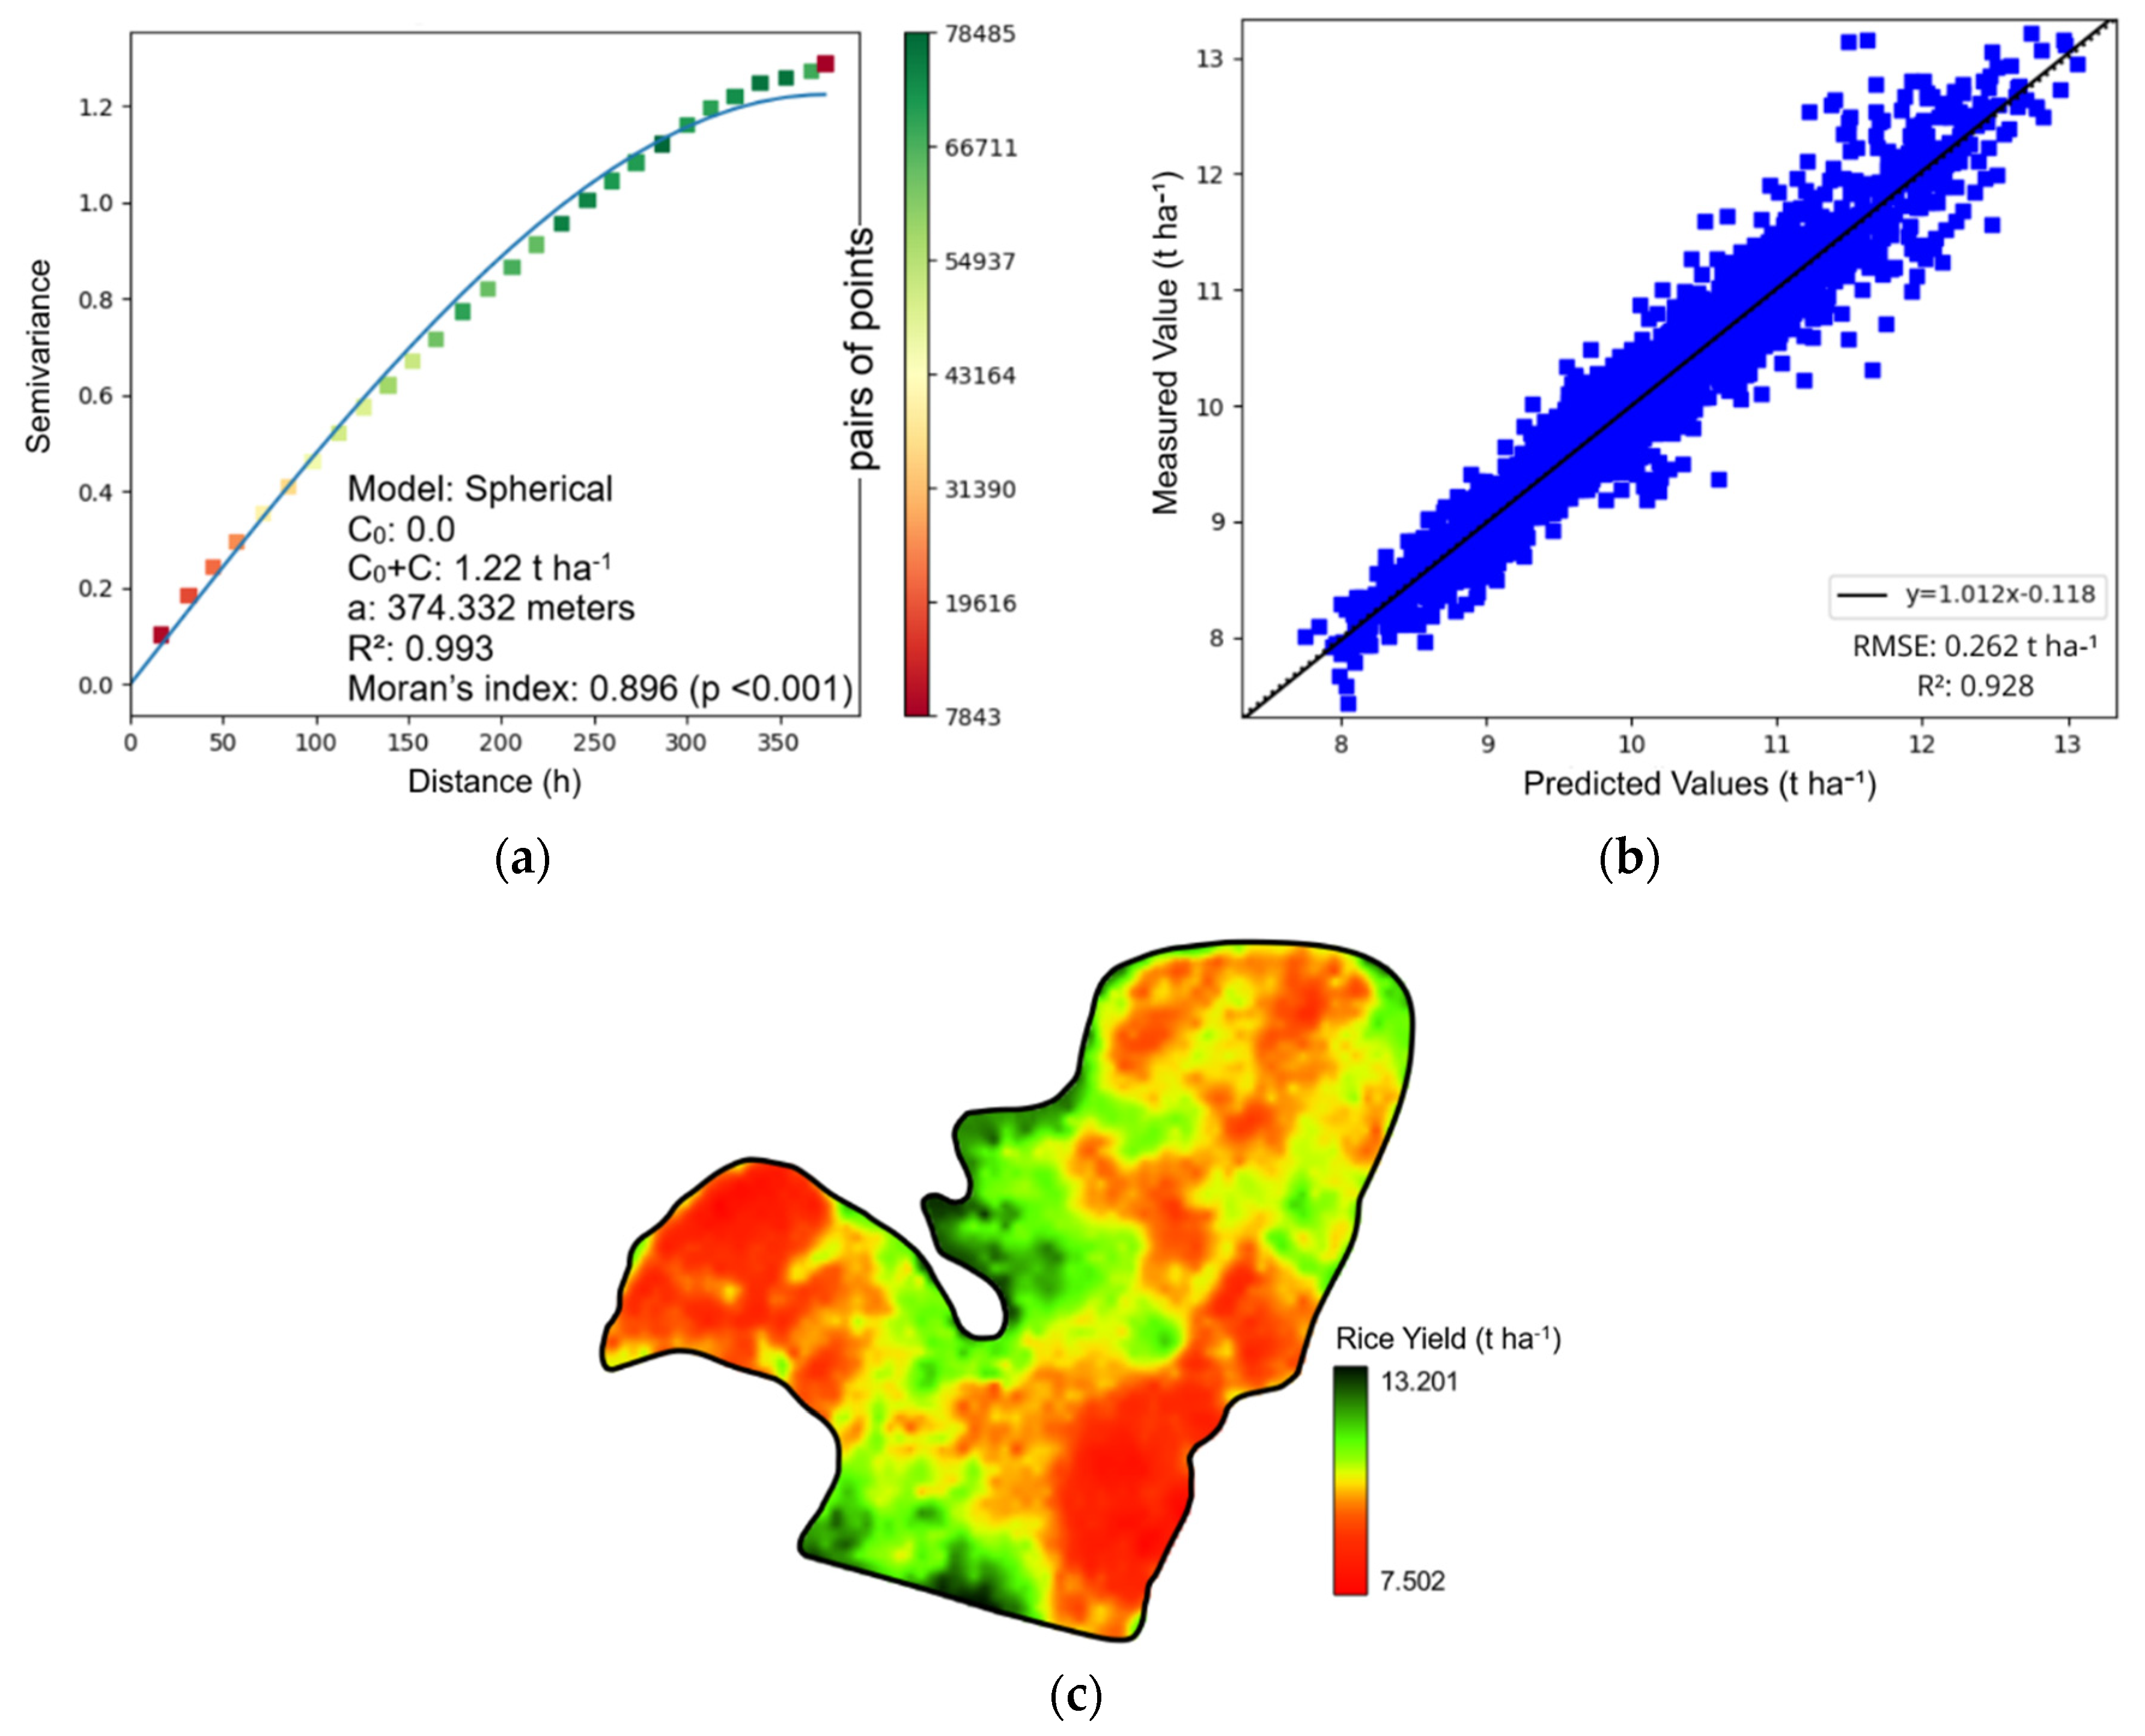
Figure 3.
Pearson correlation heatmap between soil attributes and irrigated rice yield in Uruguaiana, Rio Grande do Sul, Brazil (2024/2025 season). O.M – organic matter, P – phosphorus, K – potassium, Ca – calcium, Mg – magnesium, S – sulfur, Zn – Zinc, Cu – copper, B – Boron, Fe – Iron, Na – Sodium, Mn – Manganese, Al – Aluminium, Si – Silicon, H – Hidrogen and IWD – irrigation water depth.
Figure 3.
Pearson correlation heatmap between soil attributes and irrigated rice yield in Uruguaiana, Rio Grande do Sul, Brazil (2024/2025 season). O.M – organic matter, P – phosphorus, K – potassium, Ca – calcium, Mg – magnesium, S – sulfur, Zn – Zinc, Cu – copper, B – Boron, Fe – Iron, Na – Sodium, Mn – Manganese, Al – Aluminium, Si – Silicon, H – Hidrogen and IWD – irrigation water depth.
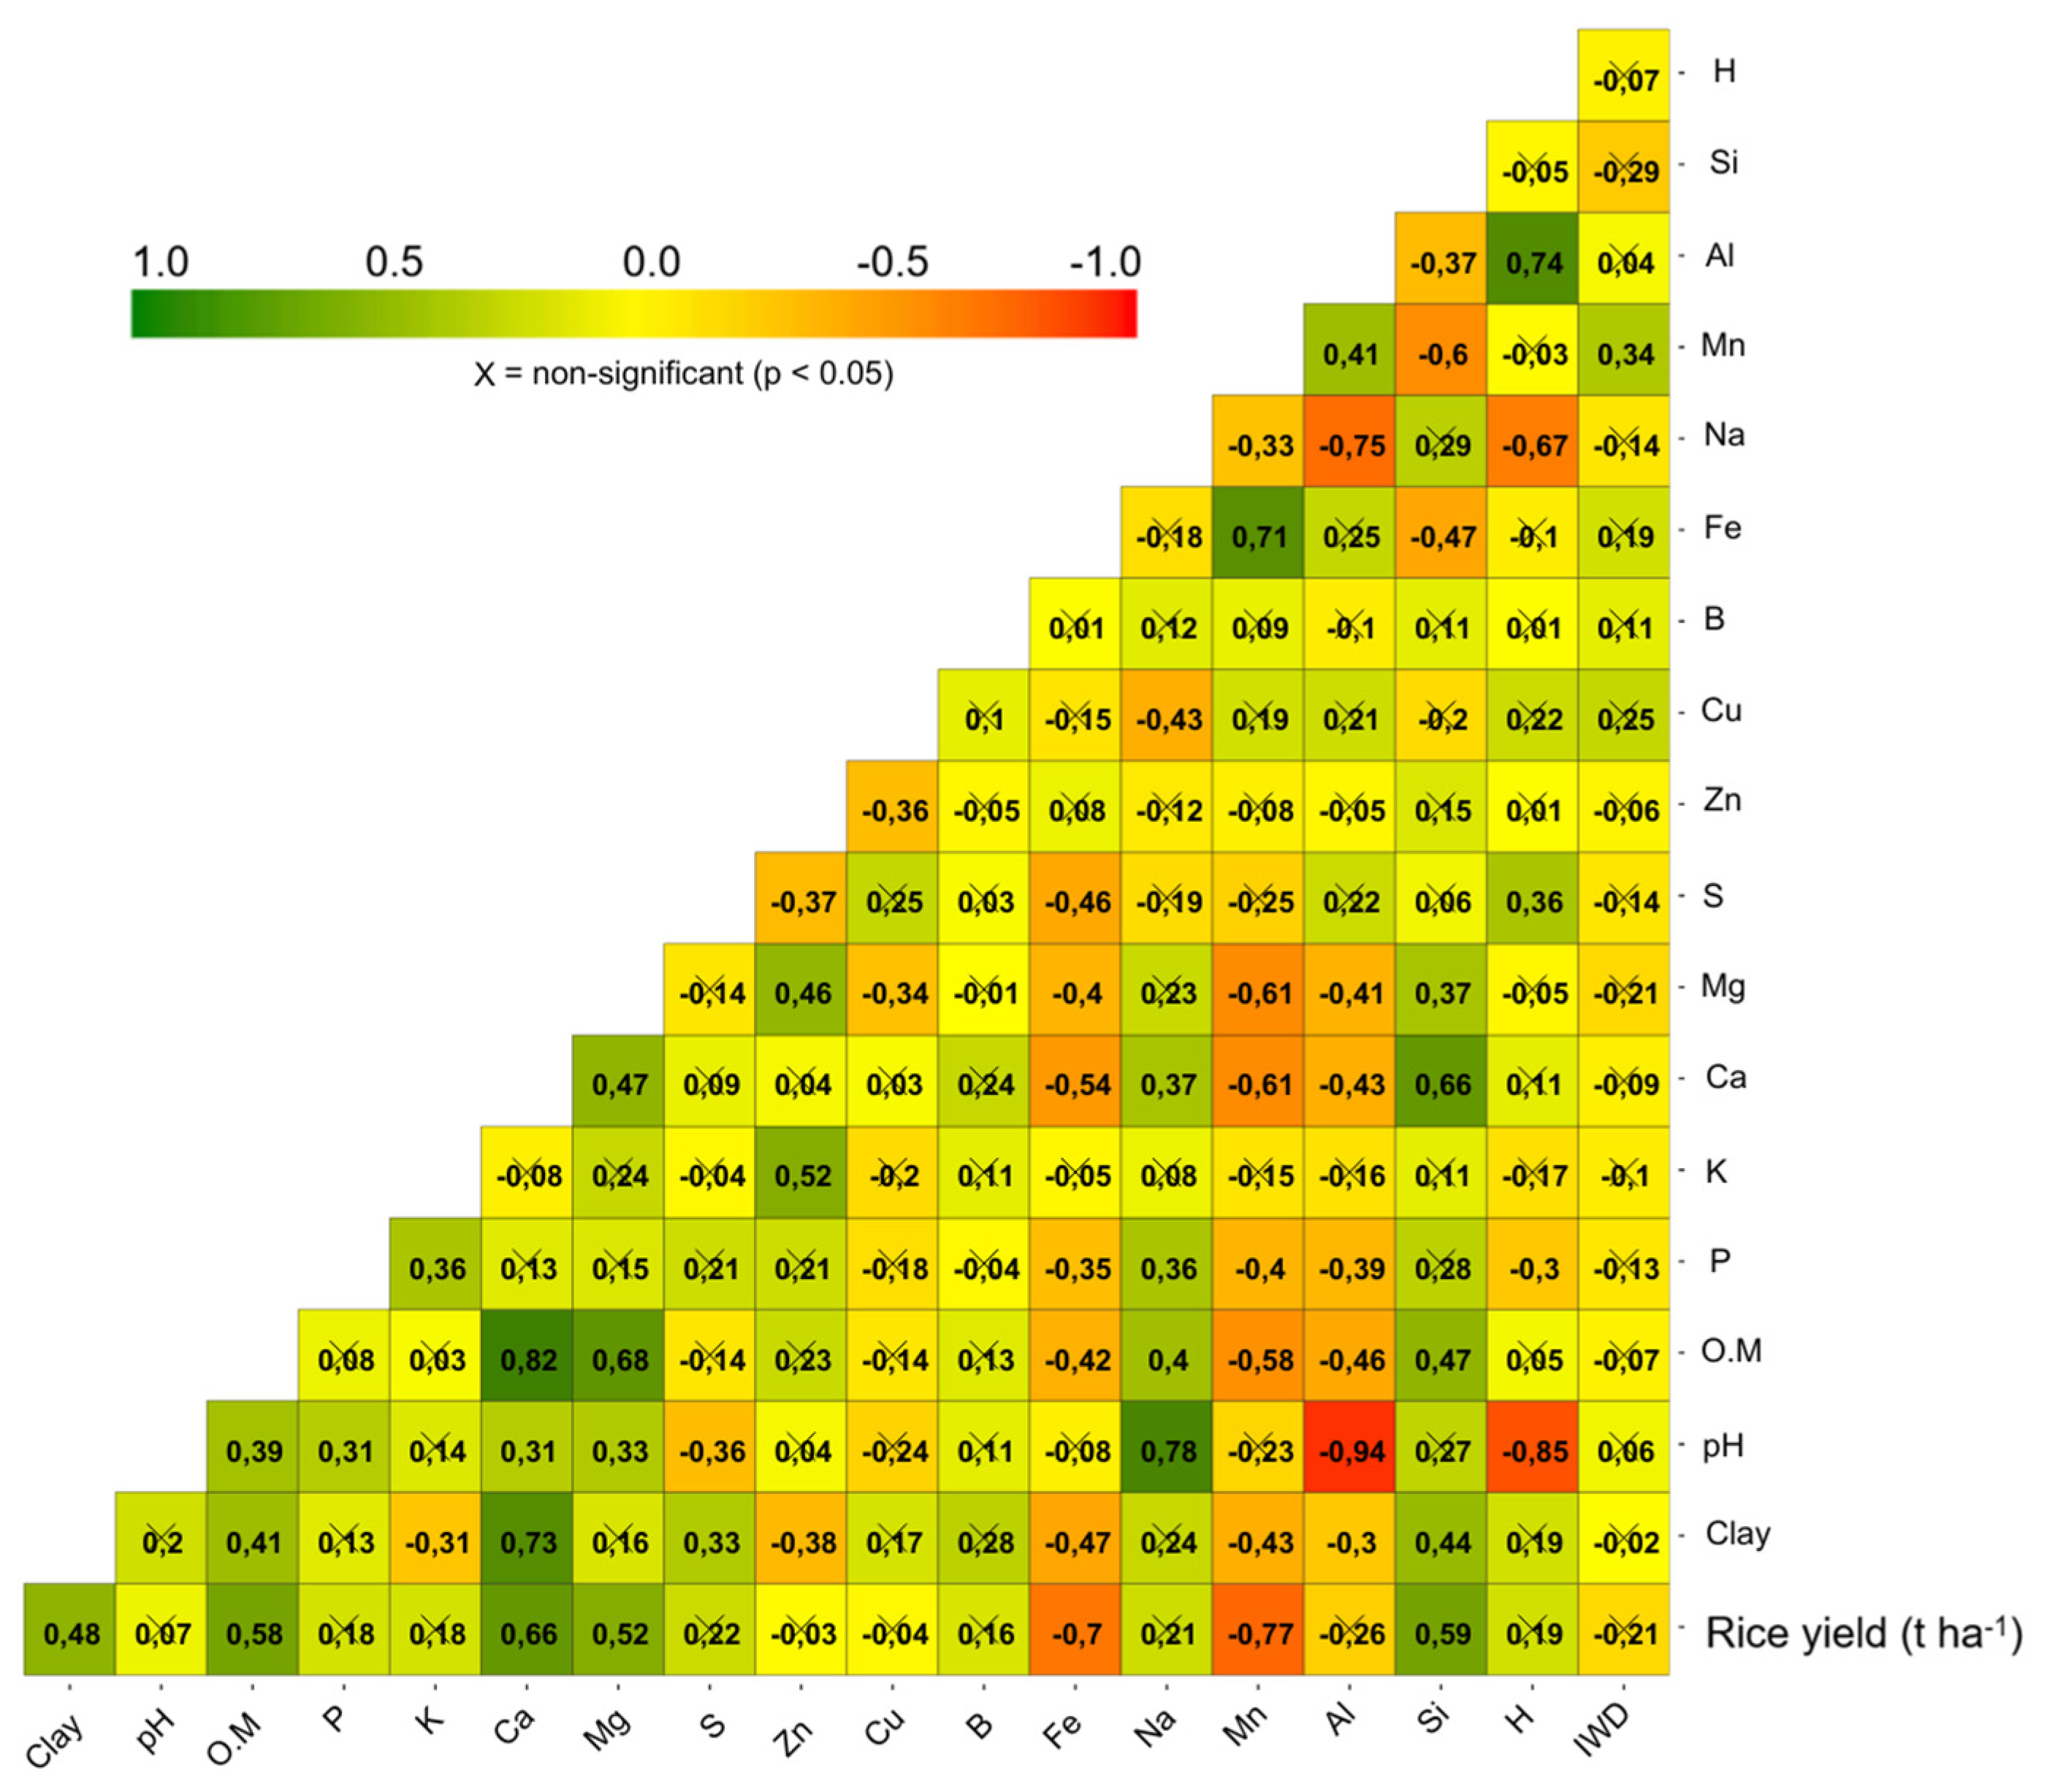
Figure 4.
Relative yield classes (%) of irrigated rice productivity in Uruguaiana, Rio Grande do Sul, Brazil (2024/2025 growing season). High: >105% RY; Average: 95–105%; Low: <95% relative to the field mean. * Means followed by the same lowercase letter in the rows are not significantly different according to Tukey’s test (p ≤ 0.05).
Figure 4.
Relative yield classes (%) of irrigated rice productivity in Uruguaiana, Rio Grande do Sul, Brazil (2024/2025 growing season). High: >105% RY; Average: 95–105%; Low: <95% relative to the field mean. * Means followed by the same lowercase letter in the rows are not significantly different according to Tukey’s test (p ≤ 0.05).
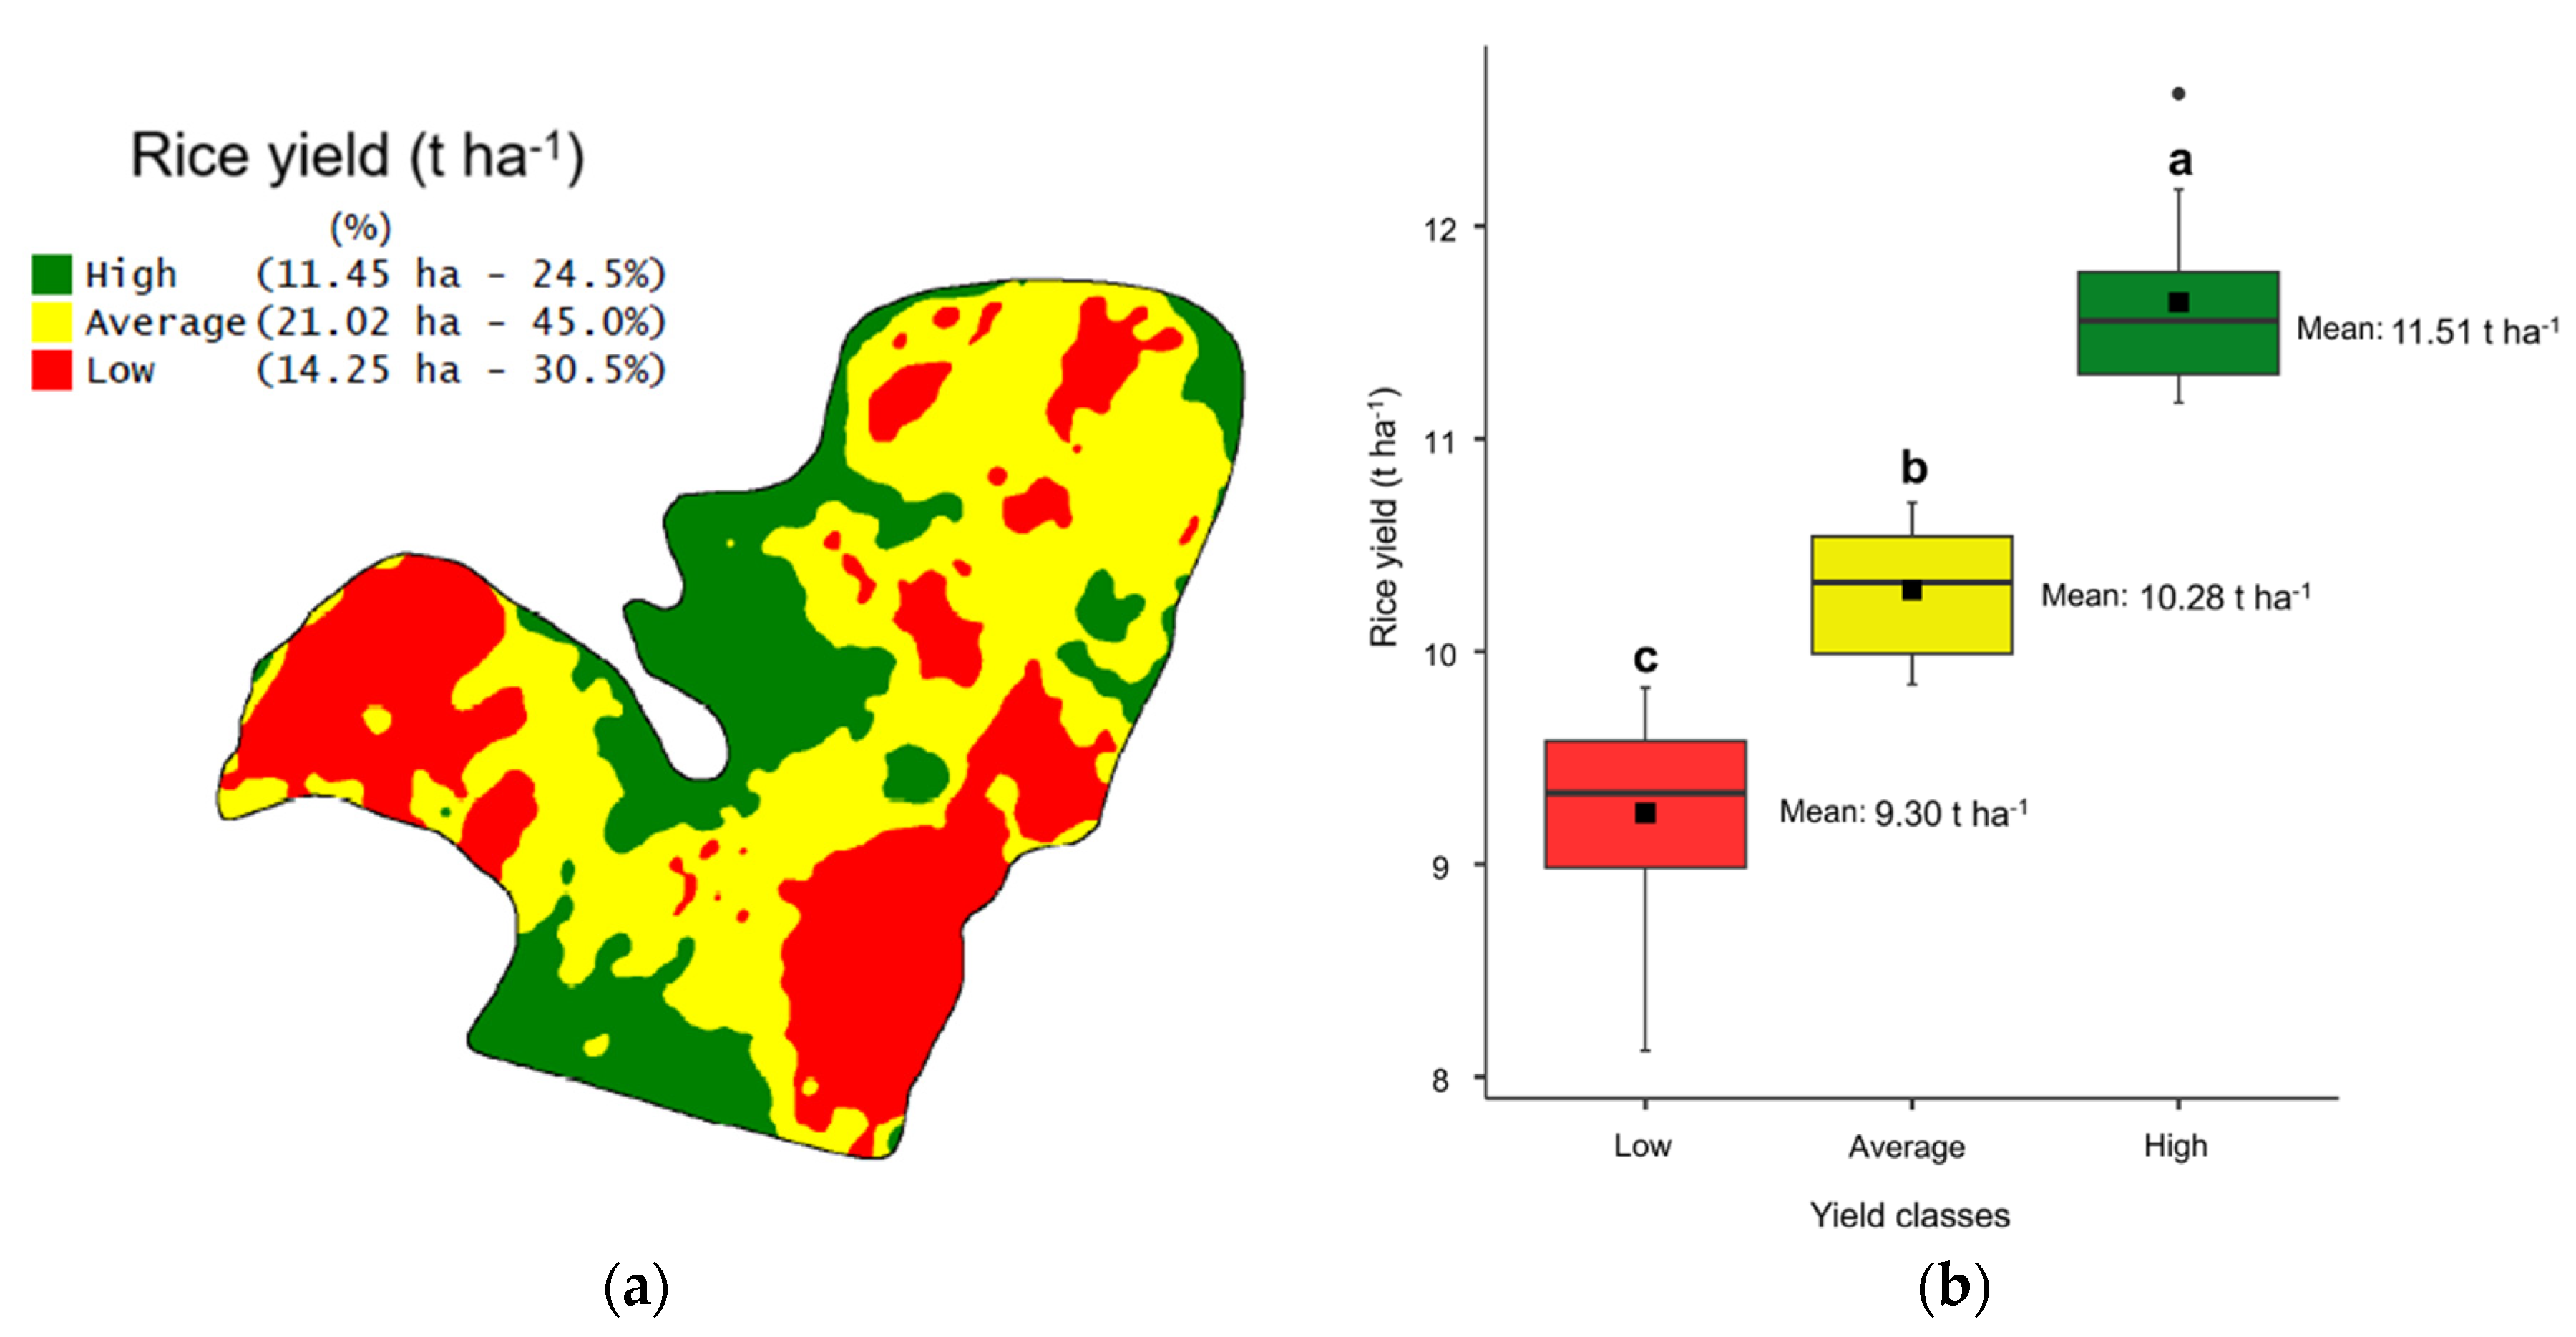
Figure 5.
Mean values of soil chemical attributes across yield classes in a Regolithic Entisol in Uruguaiana, Rio Grande do Sul, Brazil (2024/2025 growing season). *Different lowercase letters for each attribute differ statistically according to Tukey’s test (p ≤ 0.05). Values within the bloxpot (attribute averages for yield classes).
Figure 5.
Mean values of soil chemical attributes across yield classes in a Regolithic Entisol in Uruguaiana, Rio Grande do Sul, Brazil (2024/2025 growing season). *Different lowercase letters for each attribute differ statistically according to Tukey’s test (p ≤ 0.05). Values within the bloxpot (attribute averages for yield classes).
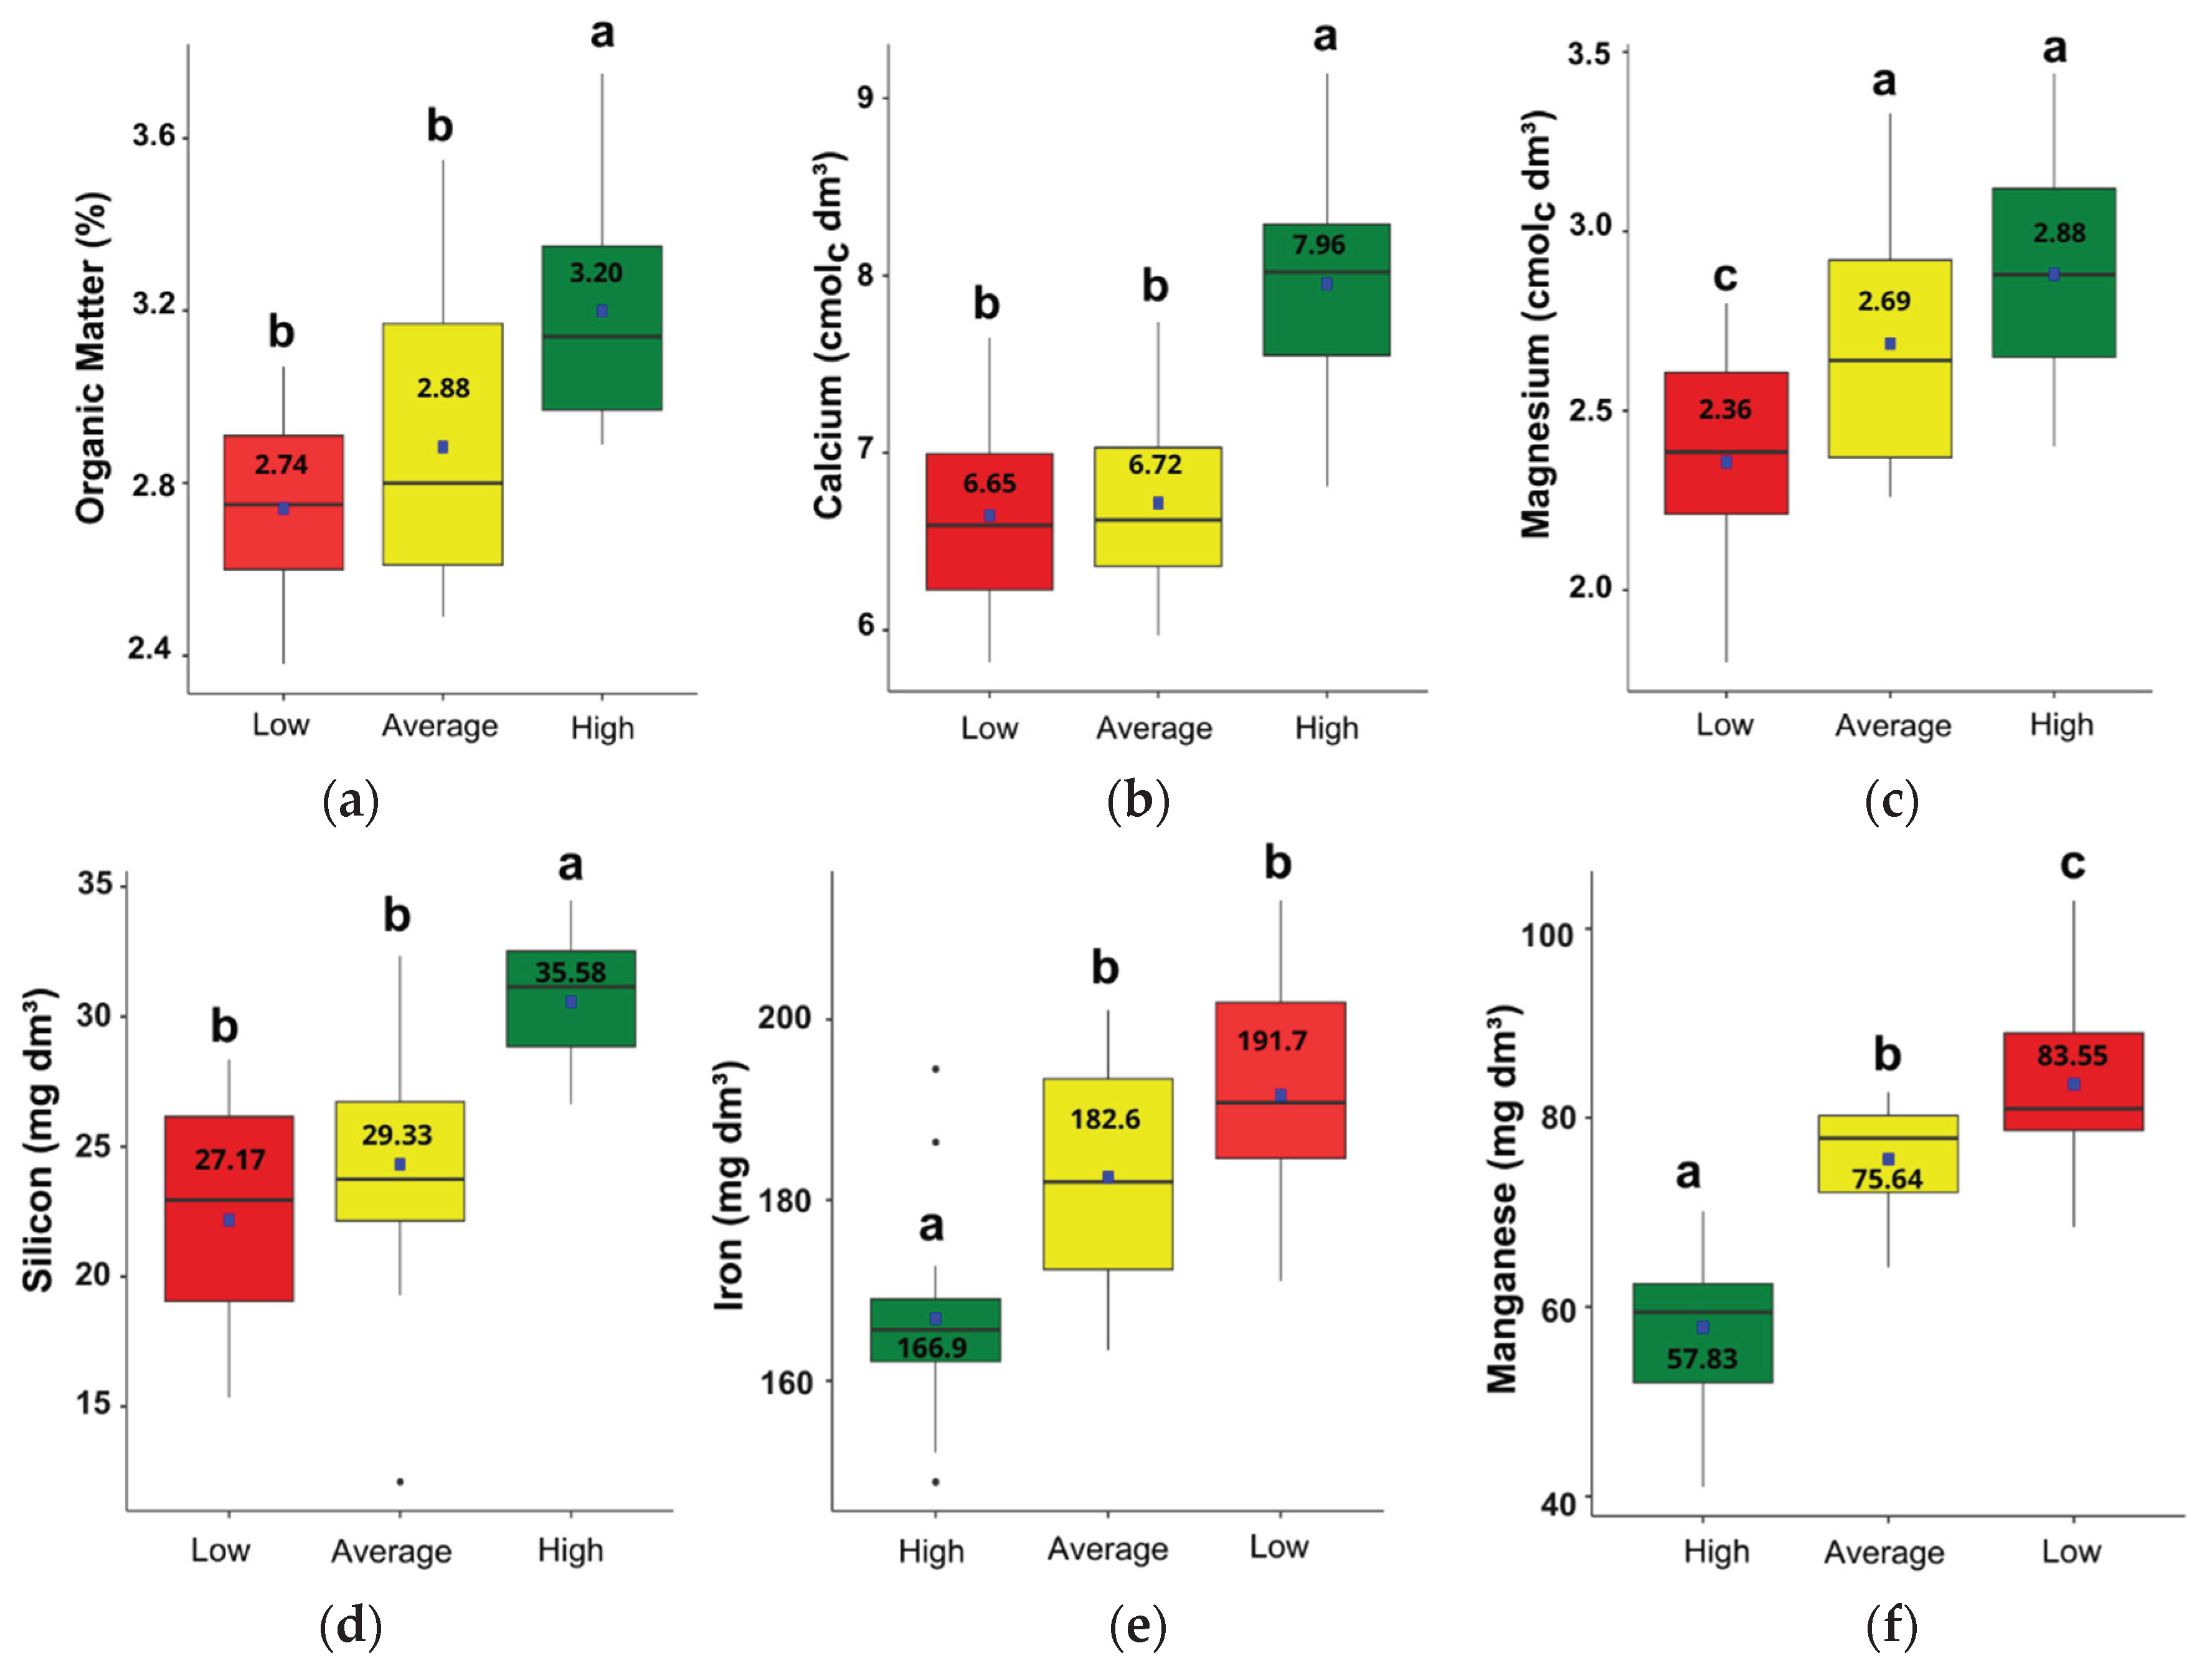

Table 1.
Descriptive statistics of soil physicochemical properties, grain yield, irrigation water depth with rice yield in a flooded rice field in Uruguaiana, Rio Grande do Sul, Brazil (2024/2025 season).
Table 1.
Descriptive statistics of soil physicochemical properties, grain yield, irrigation water depth with rice yield in a flooded rice field in Uruguaiana, Rio Grande do Sul, Brazil (2024/2025 season).
| Attribute | Unit | Min. | Mean | Max. | SD | VC (%) |
|---|---|---|---|---|---|---|
| Yield Rice | t ha-1 | 8.12 | 10.35 | 12.62 | 1.03 | 9.9 |
| Clay | % | 26 | 31 | 40 | 3.42 | 11.2 |
| pH H2O | - | 4.8 | 5.2 | 5.6 | 0.18 | 3.6 |
| O.M. | % | 2.38 | 2.93 | 3.75 | 0.33 | 11.1 |
| Phosphorus | mg dm-3 | 2.43 | 3.51 | 4.34 | 0.43 | 12.2 |
| Potassium | mg dm-3 | 60 | 88 | 137 | 18.40 | 21.0 |
| Calcium | cmolc dm-3 | 5.82 | 7.06 | 9.14 | 0.80 | 11.4 |
| Magnesium | cmolc dm-3 | 1.80 | 2.67 | 3.44 | 0.38 | 14.5 |
| Sulfur | mg dm-3 | 7.20 | 8.63 | 10.4 | 0.72 | 8.4 |
| Zinc | mg dm-3 | 0.73 | 1.26 | 1.97 | 0.32 | 25.1 |
| Copper | mg dm-3 | 2.93 | 5.10 | 7.47 | 1.13 | 22.1 |
| Boron | mg dm-3 | 0.36 | 0.43 | 0.52 | 0.05 | 10.8 |
| Iron | mg dm-3 | 149 | 181 | 213 | 15.80 | 8.7 |
| Sodium | mg dm-3 | 24.9 | 28.54 | 32.97 | 1.74 | 6.1 |
| Manganese | mg dm-3 | 41 | 73 | 103 | 12.95 | 17.8 |
| Aluminum | cmolc dm-3 | 0.00 | 0.16 | 0.33 | 0.07 | 42.9 |
| Silicon | mg dm-3 | 17.12 | 30.5 | 39.5 | 5.40 | 17.7 |
| Hydrogen | cmolc dm-3 | 1.65 | 3.85 | 6.41 | 1.00 | 26.1 |
| IWD | cm | 6.55 | 8.22 | 9.72 | 0.75 | 9.1 |
Min. – minimum; Max. – maximum; SD – standard deviation; VC (%) – variation coefficient; r – Pearson correlation coefficient; O.M. – organic matter; IWD – irrigation water depth * significant at a 5% probability.
Table 2.
Factor loadings from principal component analysis (PCA) of soil chemical attributes and rice yield in a flooded rice field (Uruguaiana, southern Brazil, 2024/2025).
Table 2.
Factor loadings from principal component analysis (PCA) of soil chemical attributes and rice yield in a flooded rice field (Uruguaiana, southern Brazil, 2024/2025).
| Variance Components¹ | Principal Component | ||
|---|---|---|---|
| PC1 | PC2 | PC3 | |
| Rice yield (t ha-¹) | 0.827 | * | * |
| O.M. (%) | 0.876 | * | * |
| Calcium (CmolC dm³) | 0.869 | * | * |
| Magnesium (CmolC dm³) | 0.745 | * | * |
| Iron (mg dm³) | -0.628 | * | -0.612 |
| Manganese (mg dm³) | -0.775 | * | * |
| Silicon (mg dm³) | 0.671 | * | * |
| Aluminium (CmolC dm³) | * | -0.879 | * |
| Sodium (mg dm³) | * | 0.821 | * |
| Phosphorus (mg dm³) | * | * | 0.668 |
| Sulfur (mg dm³) | * | * | 0.789 |
| pH | * | 0.946 | * |
| Hydrogen (Cmol dm³) | * | -0.935 | * |
| Eigenvalues | 5.221 | 3.022 | 1.684 |
| Proportion (%) | 33.7 | 27.4 | 15.2 |
| Cumulative Proportion (%) | 33.7 | 61.2 | 76.4 |
¹ Note: Varimax Rotation Method. Bartlett test (X² = 491. 81; df =78; p < 0,001); General KMO = 0.797. *Values with factor loading < 0.5 on the principal component.
Disclaimer/Publisher’s Note: The statements, opinions and data contained in all publications are solely those of the individual author(s) and contributor(s) and not of MDPI and/or the editor(s). MDPI and/or the editor(s) disclaim responsibility for any injury to people or property resulting from any ideas, methods, instructions or products referred to in the content. |
© 2026 by the authors. Licensee MDPI, Basel, Switzerland. This article is an open access article distributed under the terms and conditions of the Creative Commons Attribution (CC BY) license (http://creativecommons.org/licenses/by/4.0/).
Copyright: This open access article is published under a Creative Commons CC BY 4.0 license, which permit the free download, distribution, and reuse, provided that the author and preprint are cited in any reuse.


