

Submitted:
16 June 2026
Posted:
17 June 2026
You are already at the latest version
Abstract
Environmental stressors such as fine particulate matter (PM₂.₅), surface heat, and ultraviolet (UV) radiation pose significant public health risks, particularly in densely populated and climate-sensitive regions like India. This study presents a comprehensive spatiotemporal analysis of these parameters using satellite-derived datasets, reanalysis models, and public health data. PM₂.₅ data (1998–2023) were obtained from the Copernicus Atmosphere Monitoring Service (CAMS), while surface temperature data (2000–2024) were sourced from the ERA5 reanalysis archive. UV Index trends (2001–2023) were analyzed using NASA’s CERES SYN1deg dataset. Additionally, seasonal UV variability (2016–2018) was examined in relation to Vitamin D deficiency among children and adolescents. To assess long-term trends, the Mann-Kendall test and Sen’s Slope Estimator were applied to annual raster composites. Spatial mapping enabled identification of regional hotspots and temporal patterns. Results indicate a consistent rise in PM₂.₅ levels across northern and central India, particularly the Indo-Gangetic Plain, exceeding international air quality standards. Surface temperatures showed a significant upward trend across western, central, and peninsular India, highlighting increased vulnerability to extreme heat events. UV radiation displayed notable spatial and seasonal variation, with lower levels in northern and northeastern regions potentially contributing to widespread Vitamin D deficiency. Mortality data from the Global Burden of Disease project were analyzed to assess PM₂.₅-attributable deaths (1998–2021) and heat-related mortality (2016–2022). The findings emphasize the need for integrated environmental health strategies and support evidence-based policy and climate-adaptive planning in India.
Keywords:
PM2.5
; surface temperature
; ultraviolet radiation
; human health
; ERA5
1. Introduction
Air pollution has emerged as a major global concern because of its severe impact on human health, contributing to nearly nine million deaths each year (Fuller et al., 2022; Cao et al., 2023). According to the World Health Organization (WHO), around 92% of the world’s population is exposed to polluted air where the annual average concentration of PM2.5 surpasses 10 µgm3, significantly increasing the risk of cardiovascular and respiratory diseases (Gakidou et al., 2017; HEI, 2019). Reports from the UN Environment Programme and the World Meteorological Organization highlight that reducing pollution also contributes to climate change mitigation (WHO, 2021). The effects of prolonged exposure to fine particulate matter (PM₂.₅) on human health have been extensively documented. Brown et al. (2022) conducted a mortality assessment through the Million Death Study, revealing that ambient PM₂.₅ is among the leading causes of preventable deaths in India. Chatterjee et al. (2023) expanded on this by attributing source contributions to PM₂.₅, highlighting the critical roles of urban emissions, biomass burning, and industrial sources. Complementary work by Jaganathan et al. (2024) utilized a difference-in-differences framework to confirm the statistically significant effect of annual PM₂.₅ exposure on mortality. Manchanda et al. (2020) offered detailed insight into pollution composition during the COVID-19 lockdown, revealing temporary improvements in Delhi’s air quality.
Heat stress has also emerged as a major contributor to excess mortality. In a multi-city study, de Bont et al. (2024) identified a direct correlation between rising surface temperatures and all-cause mortality across India. Kumar and Singh (2020) analyzed heat stroke–related fatalities and emphasized the role of regional heatwave patterns in natural cause-of-death data. Sudharsan et al. (2025) provided projections indicating that future warming will significantly increase the frequency and intensity of oppressive heat events. Choudhary et al. (2023) further delineated heat stress risk across different climatic zones, reinforcing the regional variability in vulnerability. At a global scale, Lüthi et al. (2023) contextualized India’s rising mortality trends within a broader pattern of accelerating heat-related deaths worldwide.
In parallel, UV radiation plays a paradoxical role in India’s health landscape. Despite abundant sunlight, vitamin D deficiency is alarmingly prevalent. Garg et al. (2018) examined sun exposure in rural India, attributing deficiencies to limited outdoor activity and atmospheric attenuation of UVB rays. Mustafa and Shekhar (2021) observed similar trends among Indian adolescents, linking suboptimal vitamin D levels to behavioral patterns. Khadilkar et al. (2022) contributed further multicenter data, confirming high prevalence across diverse states and socioeconomic groups. Ritu and Gupta (2014) identified both environmental and cultural factors such as air pollution and clothing practices that reduce effective skin exposure.
To understand these phenomena holistically, this study employs datasets from CAMS for PM2.5 (1998–2023), ERA5 reanalysis for surface temperature (2000–2024) (Hersbach et al., 2020), and CERES SYN1deg for UV Index (2001–2023). Temporal changes were assessed using the Sen’s Slope Estimator (Sen, 1968) and Mann–Kendall trend test, following frameworks outlined by Gowthaman et al. (2023) and Jaiswal et al. (2018) for air quality trend detection. Dataset validation and calibration methods were guided by Jin et al. (2022), enhancing the robustness of observed patterns.
India stands at the forefront of multiple intersecting environmental crises—air pollution, heatwaves, and ultraviolet (UV) radiation—each imposing significant and measurable impacts on public health. These stressors not only act individually but also interact to compound disease risk, particularly for vulnerable populations in both urban and rural areas. In this context, a comprehensive, integrated approach to evaluating long-term environmental trends becomes essential for shaping targeted health interventions and climate-resilient policies.
The current study integrates more than two decades of satellite and reanalysis datasets to assess the spatiotemporal variability of PM₂.₅, surface temperature, and ultraviolet (UV) radiation across India. By linking environmental exposure with health outcomes such as mortality and vitamin D deficiency, the study aims to provide a comprehensive framework for understanding the intersection of environmental stressors and public health. The specific objectives are as follows:-
1.1. To Generate High-Resolution Annual and Seasonal Maps of PM₂.₅, Surface Temperature, and UV Radiation over India, and Analyze Their Spatial Variability
1.1. To apply trend detection methods (Mann–Kendall test and Sen’s Slope Estimator) to identify long-term changes in PM₂.₅, heat, and UV Index from 1998 to 2024
1.2. To examine state-wise and regional disparities in PM₂.₅- and heat-related mortality, and their alignment with observed environmental trends
1.3. To evaluate the association between UV Index patterns and vitamin D deficiency prevalence among children and adolescents, highlighting vulnerable populations and regions
1.4. To provide a spatially integrated framework that combines environmental and health datasets for evidence-based risk assessment and climate-sensitive health planning in India.
2. Study Area
This study covers the entire geographical extent of India (Figure 1), a country that offers a compelling case for environmental health analysis due to its vast climatic diversity, urban-rural contrasts, and substantial human exposure (Figure 2) to environmental stressors. The temporal scope spans multiple decades: PM₂.₅ concentrations were analyzed from 1998 to 2023, surface temperatures from 2000 to 2024, and UV radiation patterns from 2001 to 2023. Seasonal UV analysis focuses on the period 2016–2018, particularly to explore its association with vitamin D deficiency among children and adolescents. India’s selection as the study area is supported by numerous recent studies that highlight its vulnerability to environmental hazards.
Figure 2.
Study area map of India (QGIS shapefile).
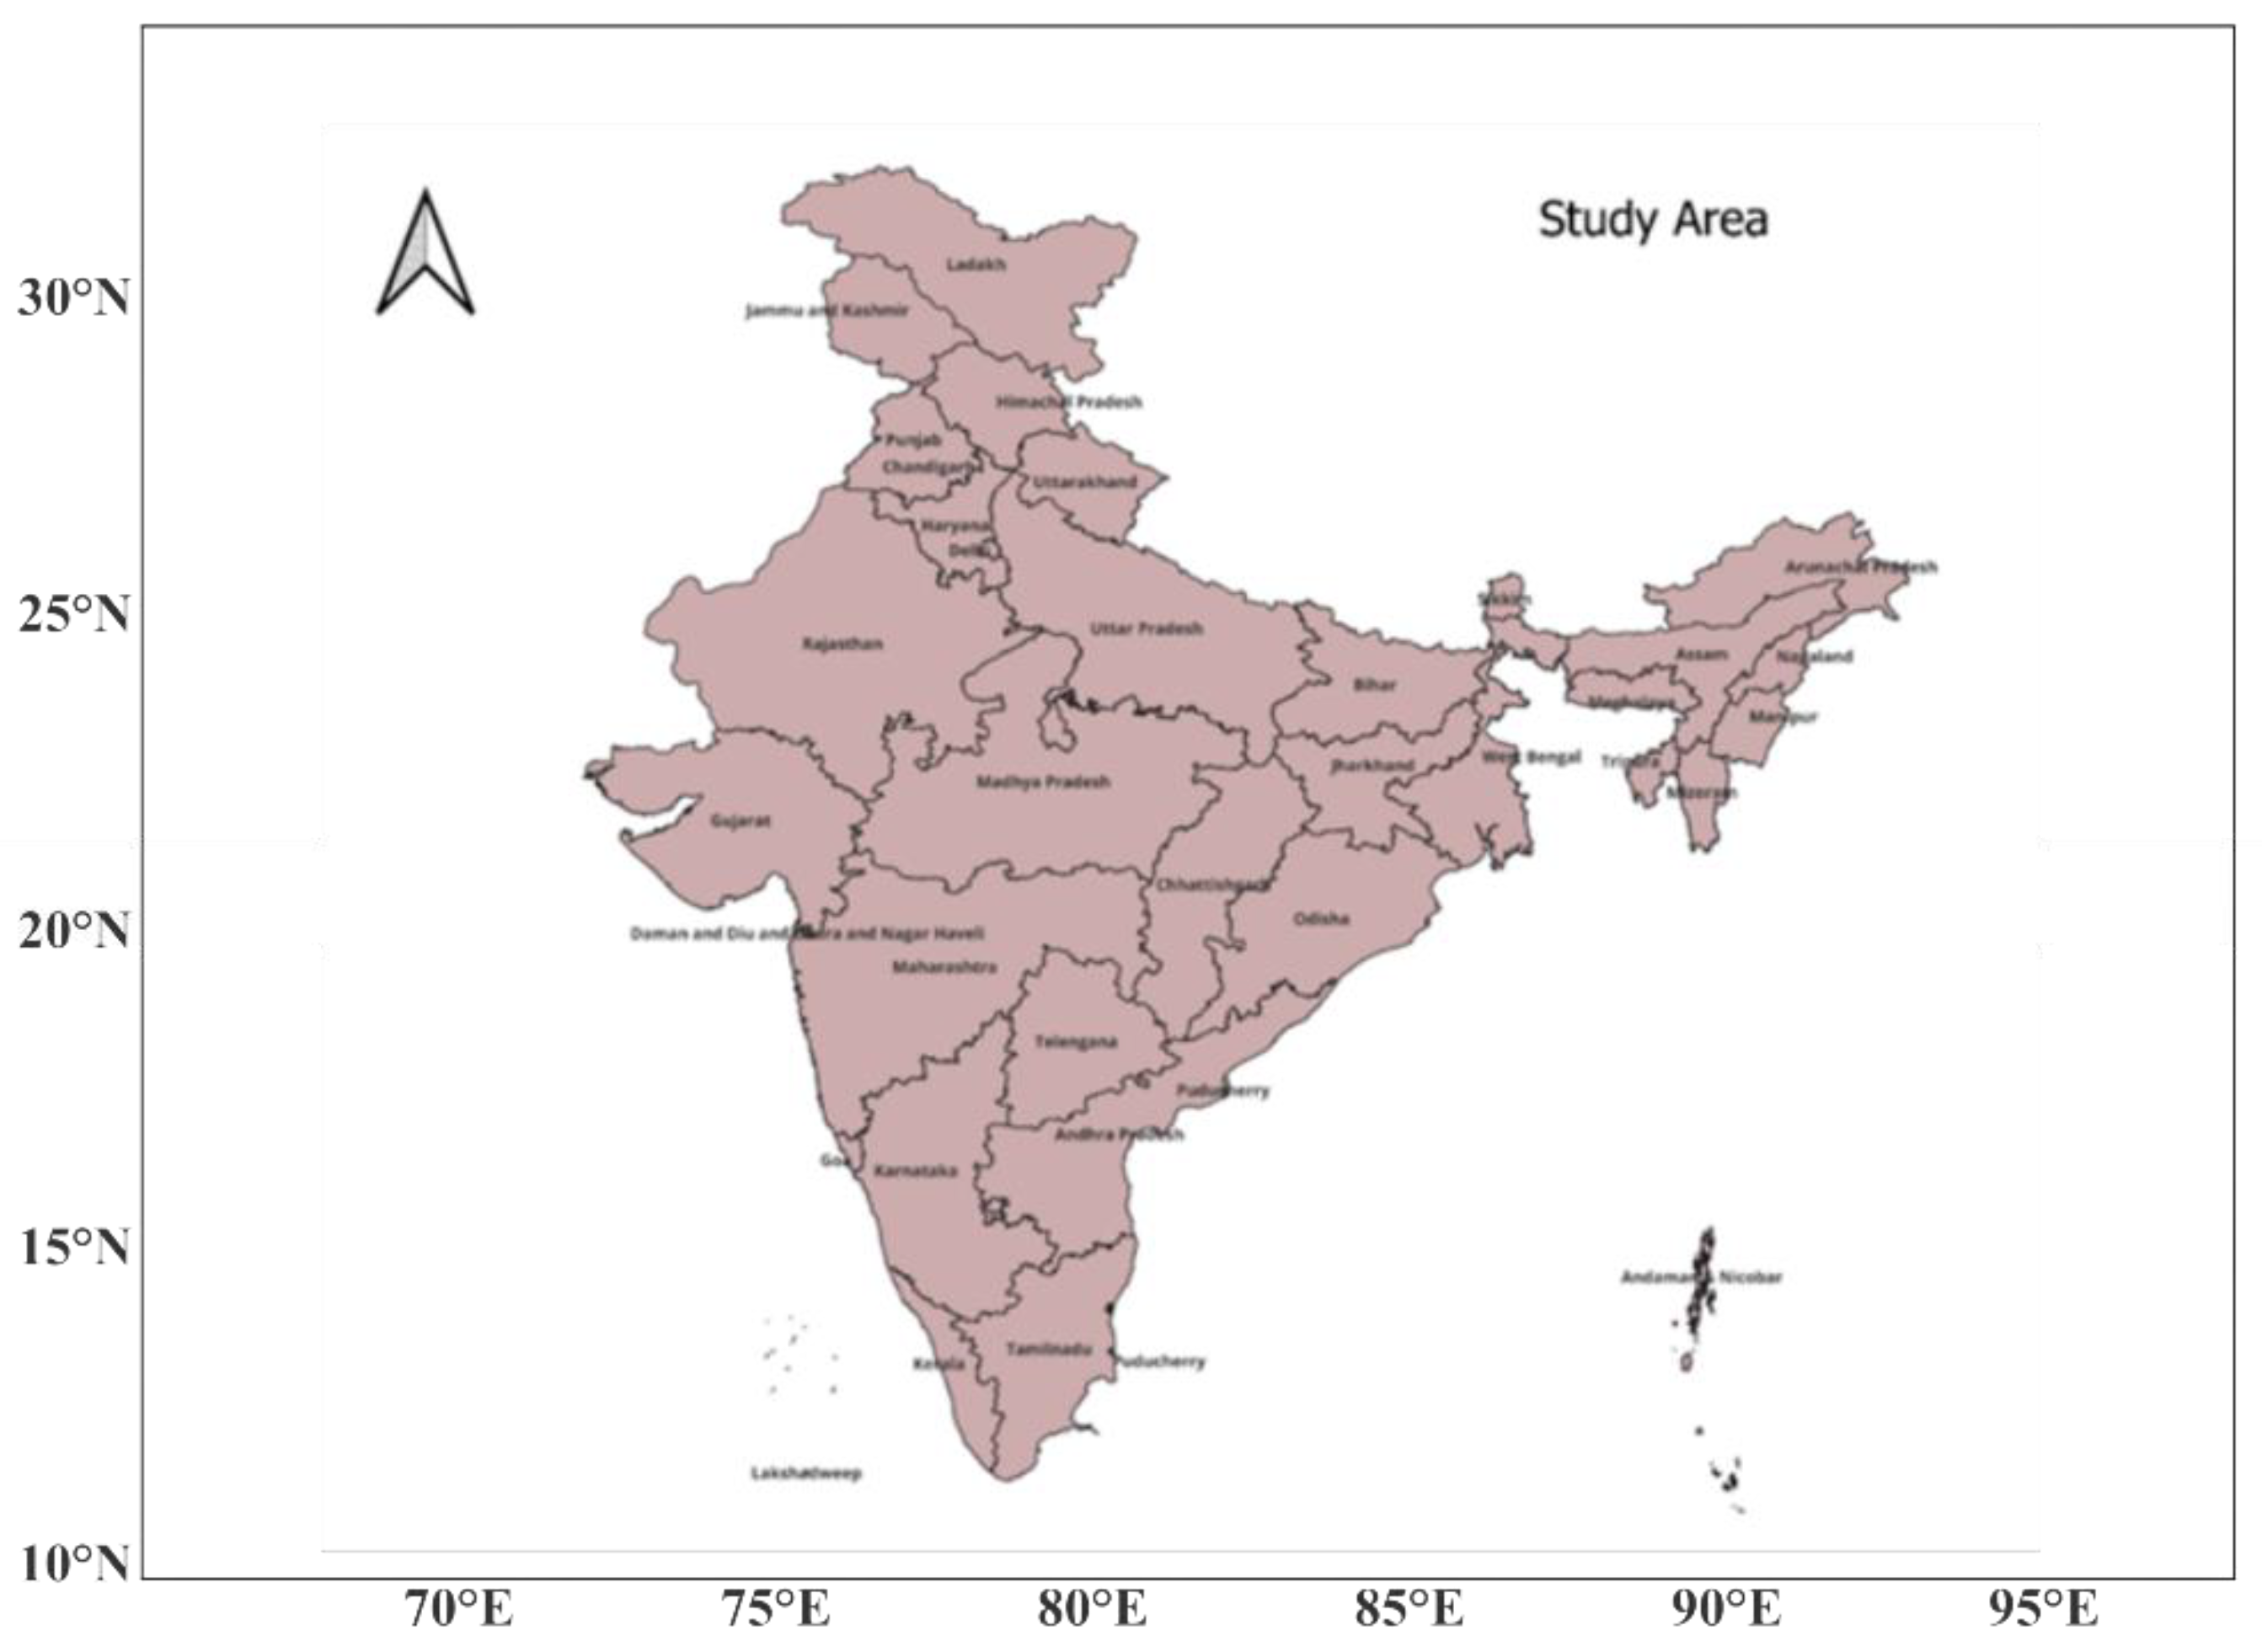
Figure 3.
Demographic and age-sex pyramid of India.
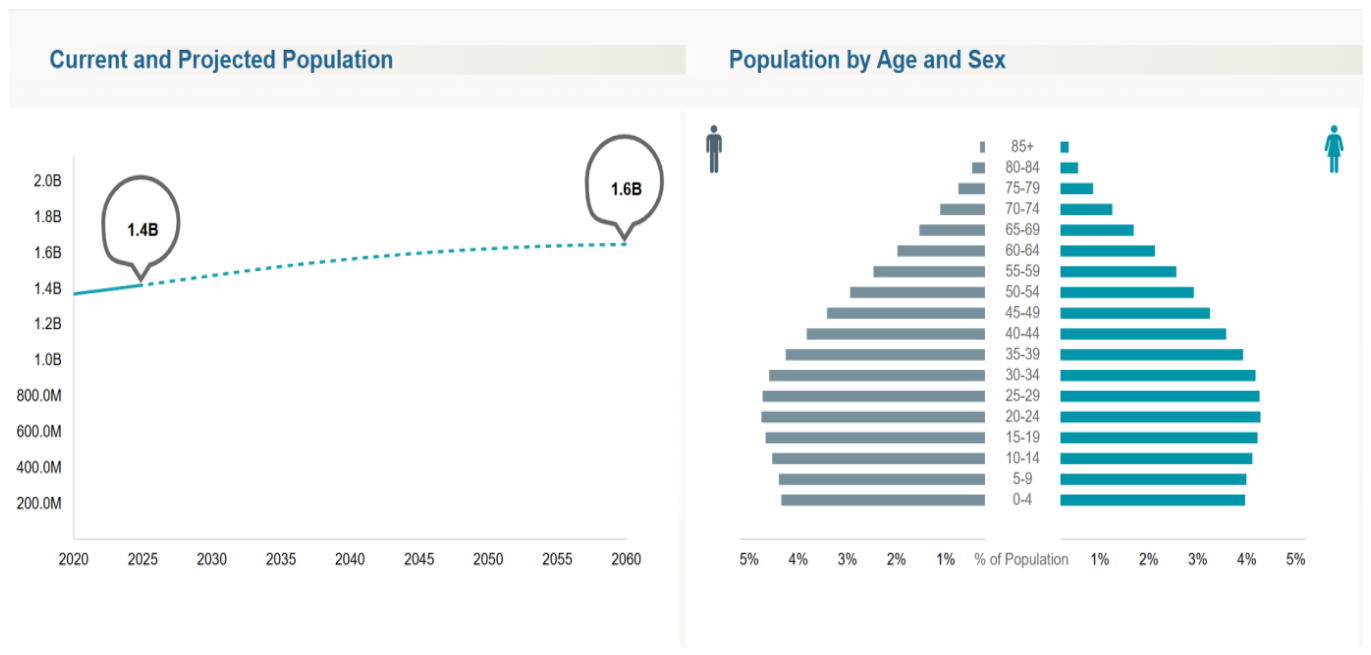
Moreover, projections suggest that India’s population is still on the rise (Figure 3), which not only elevates the risk of exposure for more people but also stresses public health systems. The intersection of rising population, climate extremes, and urbanization makes India a critical case study for understanding environmental health risks especially given that PM2.5 levels in many Indian cities already exceed WHO thresholds, heatwave events are becoming more frequent, and vitamin D deficiency is widespread despite high sunlight availability.
By analyzing long-term environmental patterns alongside demographic trends, this study aims to provide a spatially comprehensive and temporally relevant framework for public health risk assessment and mitigation planning in India.
3. Materials and Methods
3.1. PM₂.₅ and Surface Temperature from CAMS and ERA5 Reanalysis Data
To assess the long-term spatial and temporal dynamics of air quality and heat exposure across India, this study integrates data from two globally recognized reanalysis products: the Copernicus Atmosphere Monitoring Service (CAMS), (Copernicus Climate Data Store) for PM2.5 concentrations and the ERA5 reanalysis dataset for surface temperature (Hersbach et al. (2020)). CAMS provides global atmospheric composition data by assimilating satellite retrievals and ground-based measurements into a chemical transport model (IFS-AER), delivering PM2.5 estimates at a spatial resolution of approximately 0.125° to 0.4°, depending on the product version. Monthly PM2.5 concentrations from CAMS Global Reanalysis (EAC4) were accessed through the Copernicus Atmosphere Data Store and processed to generate consistent temporal composites for the years 1998–2023.
The Copernicus Atmosphere Monitoring Service (CAMS) estimates PM2.5 concentrations using a global atmospheric composition reanalysis system based on the Integrated Forecasting System with aerosol (IFS-AER), developed by the European Centre for Medium-Range Weather Forecasts (ECMWF). Rather than relying on direct satellite measurements of PM2.5, CAMS assimilates multiple data sources including satellite-derived aerosol optical depth (AOD), ground-based monitoring, and meteorological variables to simulate aerosol transport and chemical transformations. PM2.5 is computed within the model as a mass-weighted sum of key fine-mode aerosol species: sulphate (SO₄), organic carbon (OC), black carbon (BC), and fine fractions of dust (DU) and sea salt (SS). Specifically, CAMS applies empirical scaling factors to represent only the sub-2.5 µm component of dust and sea salt, using the formula:
PM2.5 = SO₄ + OC + BC + 0.38 × DU2.5 + 0.25 × SS2.5.
The resulting variable particulate-matter-2.5 is provided as a gridded field in units of micrograms per cubic meter (µg/m³), offering spatially and temporally consistent data suitable for regional air quality assessments.
Surface temperature data were derived from the ERA5 dataset, developed by the European Centre for Medium-Range Weather Forecasts (ECMWF) (Copernicus Climate Data Store), ERA5 is the fifth-generation reanalysis product, offering hourly and monthly atmospheric parameters at a horizontal resolution of 0.25° × 0.25°, with coverage from 1950 to the present. The 2-meter air temperature variable was extracted to represent ambient surface temperature conditions. Monthly mean temperatures were processed using Python libraries such as xarray, netCDF4, and rasterio, and subsequently converted from NetCDF to GeoTIFF format to enable spatial analysis in GIS platforms like QGIS. All temperature values were standardized from Kelvin to Celsius for public health relevance. Seasonal and annual raster composites were created using arithmetic mean functions, ensuring temporal consistency and suitability for regional epidemiological assessments.
3.2. UV Radiation Levels from CERES SYN1deg Data
To assess solar UV radiation exposure across India, this study utilizes the CERES SYN1deg Edition 4.1 dataset developed by NASA’s Langley Research Center CERES provides global measurements of shortwave and longwave radiative fluxes at the Earth’s surface, atmosphere, and top of the atmosphere. For this analysis, the Surface Downward Shortwave Flux variable was extracted, representing the total solar radiation incident on the surface, including the ultraviolet (UV) component (ultraviolet A (UVA 315nm-400nm), ultraviolet B (UVB 280nm-315nm), and the ultraviolet radiation exposure index). These UV products are computed using the methodology of Su et al. (2005). The CERES product offers a spatial resolution of 1° × 1° and a temporal resolution of 3-hourly averages, which were aggregated into monthly and annual means using Python libraries such as xarray, netCDF4, and numpy. Raster outputs were converted into GeoTIFF format via rasterio and clipped to the Indian boundary using QGIS. This step ensured that the data matched the coordinate system and resolution of the PM₂.₅ and temperature datasets derived from ERA5. The UV Index, as defined by the World Health Organization (WHO), is calculated using the following equation:
E_eff is the effective UV irradiance (W/m²) weighted by the erythemal action spectrum, which represents the sensitivity of human skin to different wavelengths of ultraviolet radiation. The erythemal action spectrum used for calculating the UV Index follows the formulation recommended by the Commission Internationale de l’Éclairage (CIE) and described by McKinlay and Diffey (1987). The denominator 0.025 W/m² corresponds to one unit of the UV Index as defined by the World Health Organization. The denominator, 0.025 W/m², corresponds to 1 unit of UV Index.
Annual and seasonal UV Index maps were generated, covering the period from 2001 to 2023, along with focused composites for 2016–2018 to match with NFHS-5 vitamin D deficiency records. Raster symbology followed a blue-to-red gradient, where higher UV fluxes appeared in red, allowing for visual correlation with deficiency prevalence.
This approach enables a national-scale perspective on UV radiation distribution across India and its relationship with public health metrics. Unlike prior UV studies such as Garg et al. (2018) which explores sun exposure and Vitamin D in rural India, this research leverages gridded satellite data to offer a spatially continuous and temporally consistent framework.
3.3. Trend Analysis Using Mann–Kendall (MK) Test and Sen’s Slope Estimation
The Mann–Kendall (MK) test is a non-parametric statistical method widely used for detecting monotonic trends in environmental time series data without requiring the data to follow a specific distribution (Mann, 1945; Kendall, 1975). The test checks the null hypothesis (H₀) of no trend against the alternative hypothesis (H₁) of a significant increasing or decreasing trend. In this study, the MK test was used to evaluate long-term trends in annual PM₂.₅ concentration, surface temperature, and UV radiation across India. The MK statistic (S) is computed as:
Where xj and xi are the sequential data values in the time series, If the test statistic S is significantly different from zero, a trend is present. The significance of the trend is assessed by computing the standardized test statistic Z, which follows a standard normal distribution under the null hypothesis
To quantify the magnitude of change in each environmental parameter over time, Sen’s Slope estimator was employed. Proposed by Sen (1968), this non-parametric method computes the median of all possible pairwise slopes and is resistant to outliers, making it suitable for skewed environmental data.
Where Qirepresents the slope between any two points (xj,xk) in the time series. A positive Qi indicates an upward trend, while a negative value indicates a downward trend.
In this study, these methods were implemented pixel-wise to generate high-resolution spatial trend maps in QGIS. Methodological guidance was taken from Gowthaman et al. (2023) and Jaiswal et al. (2018), who demonstrated the application of MK and Sen’s slope for air quality trend analysis. However, unlike previous studies limited to urban clusters or short temporal windows, our study applies this framework over more than two decades of data (1998–2024), using georeferenced raster datasets for the entire Indian subcontinent. The integration of statistical trend significance and slope magnitude into spatially explicit outputs enables improved interpretation of environmental stressor dynamics in relation to human exposure and public health risk.
3.4. Mortality and Vitamin D Deficiency Data for Exposure-Response Interpretation
To assess the health impacts of long-term exposure to PM₂.₅, heat, and ultraviolet (UV) radiation, this study incorporated mortality and vitamin D deficiency data into a spatially integrated framework. These health outcomes were compared against environmental trends derived from satellite datasets to explore geographic overlaps, co-occurrence zones, and regional disparities in public health vulnerability across India.
PM2.5-Attributable Mortality
Data on PM₂.₅-related mortality were obtained from the Global Burden of Disease Study 2021 (GBD 2021), hosted by the Institute for Health Metrics and Evaluation (IHME). The GBD dataset provides age-standardized death rates (ASDRs) per 100,000 population, enabling consistent comparisons across time and geography by adjusting for demographic differences. In this study, ASDRs attributable to ambient particulate matter (PM₂.₅) exposure were extracted for the years 1998 to 2021 and processed using Microsoft Excel and QGIS for spatial analysis. The data were joined with Indian state-level administrative boundaries to produce choropleth maps that visualize mortality trends alongside PM2.5 concentration estimates derived from CAMS (Copernicus Atmosphere Monitoring Service). GBD’s estimation approach is based on integrated exposure–response functions and counterfactual risk scenarios, which model the number of deaths attributable to ambient air pollution. This methodology has been extensively validated and applied in India-focused studies, such as Brown et al. (2022)
Heat-Related Mortality Analysis
Data on heat-related deaths were collected from Data.gov.in, under the publicly available dataset titled "Deaths due to Forces of Nature." Annual death counts associated with extreme temperature events (i.e., heatwaves) were retrieved for the years 2016 to 2022. Since total mortality figures were available alongside cause-specific data, the Proportional Mortality Rate (PMR) was calculated to evaluate the relative impact of heat across regions:
This metric allowed for a comparative understanding of regional vulnerability even where absolute death numbers varied. Results revealed that several states in northern and central India, such as Uttar Pradesh and Rajasthan, consistently exhibited higher PMRs for heat-related deaths. These findings are in line with heat stress risk patterns observed by Choudhary et al. (2023), who reported excess mortality due to heat across multiple climatic zones in India. All mortality datasets were georeferenced using QGIS and overlaid with corresponding environmental exposure maps using zonal statistics and polygon-level joins. This allowed the identification of critical overlaps between environmental hotspots and mortality clusters.
Vitamin D Deficiency Prevalence
To evaluate the physiological implications of long-term UV exposure, this study utilized age-stratified vitamin D deficiency data obtained from the Nutrition India Dashboard, built on findings from the National Family Health Survey (NFHS-5, 2019–21). The data, representing the percentage of children and adolescents (ages 1–19) with serum 25-hydroxy vitamin D [25(OH)D] deficiency, was downloaded in tabular format and organized by state. These prevalence values were compared against annual UV radiation levels (2001–2023) and seasonal composites (2016–2018) derived from CERES SYN1deg datasets. As explained in Section 3.2, shortwave downward radiation was used as a spatial proxy for UV exposure. Maps were generated for each age category and aligned with UV rasters in QGIS using district and state shape files. Particular attention was paid to regions with high UV availability yet elevated deficiency prevalence, indicating possible behavioral, atmospheric, or cultural barriers to effective UVB absorption.
Such patterns support findings by Khadilkar et al. (2022), who reported widespread vitamin D deficiency across Indian adolescents despite sufficient ambient sunlight.
4. Results and Discussion
4.1. PM2.5 Analysis and Health Impact
4.1.1. PM2.5 Annual Trends (1998-23)
The annual PM₂.₅ concentration across India for the years 1998, 2005, 2010, 2016, 2021, and 2023 is shown in Figure 4 and Figure 5. The Indo-Gangetic Plain (IGP) continues to be the most critically affected region, with persistently high concentrations recorded in states such as Uttar Pradesh, Bihar, and West Bengal. These states have remained hotspots of PM₂.₅ exposure, with annual average concentrations consistently exceeding permissible-thresholds of 15 microgram/m3 for a 24-hour averaging time (WHO, 2021). A recent air quality assessment by Singh et al. (2023) documented extremely high concentrations of PM₂.₅ in Raipur (131–654 µg/m³) and Korba (150–1699 µg/m³), attributed largely to thermal power plants, open-cast coal mines (SECL), and fly-ash emissions from coal handling and transport activities, This marks the concentration patch shown in central Chhattisgarh. Over the 25-year period, while marginal improvements are visible in selected areas of central and eastern India after 2020, the IGP exhibits sustained levels of severe pollution, as indicated by the deep red zones. This pattern is consistent with the findings of Brown et al. (2022), who reported a high mortality burden linked to PM₂.₅ exposure in India using Million Death Study data. Chatterjee et al. (2023) also observed regional source contributions to PM₂.₅, confirming northern India’s dominance in terms of particulate pollution. Jaganathan et al. (2024) further supported these trends with causal estimates of annual PM₂.₅ exposure on mortality, reinforcing the association between long-term air pollution and premature death in the Indian context. In alignment with these findings, our analysis also reflects spatial persistence of extreme PM₂.₅ levels, particularly in the northern plains. Moreover, the regional hotspot consistency supports the conclusions of Kannemadugu et al. (2024), who identified similar pollution zones using ERA5 data, their scope was focused on capital cities and for the entire world. Our study expands on this by offering full-country coverage and time-resolved mapping of PM₂.₅ exposure, which collectively underscores the urgent need for sustained air quality interventions in high-risk zones.
4.1.2. PM2.5 Trend and Significance (Sen’s Slope)
The Figure 6 illustrates the spatial trend of PM2.5 concentration across India using the Sen’s Slope Estimator, where statistical significance is marked at the 95% confidence level. Areas shaded in orange to red indicate a positive trend signifying a consistent increase in PM2.5 levels over time most prominently across the Indo-Gangetic Plain and several parts of central and eastern India. In contrast, regions shown in green reflect marginal improvements in air quality, although these areas are relatively limited in extent. This type of pixel-wise trend assessment aligns with the work of Chatterjee et al. (2023) and Jaganathan et al. (2024), who also analyzed long-term changes in PM2.5 concentration using regional datasets and confirmed strong upward trends in pollution across population-dense areas.
Unlike prior studies that relied on city-level or regional averages, the present analysis applies the Sen’s Slope and Mann-Kendall tests at a much finer resolution using high-quality raster data clipped exclusively to India’s boundaries. This methodological precision enables a more granular depiction of statistically significant changes over time. The map highlights clear spatial clustering of rising pollution, revealing trend hotspots with greater clarity than aggregated analyses. The Sen’s Slope results (Figure 6) further reinforce these findings, confirming statistically significant increases in PM2.5 concentration across northern and eastern India. Moderate but consistent upward trends are also evident in parts of central and western regions, One of the major episodic drivers of elevated PM₂.₅ levels across northern India, particularly during the post-monsoon months, is agricultural stubble burning in Punjab and Haryana. Nirwan et al. (2024) demonstrated that crop residue burning contributes significantly to transboundary pollution, with seasonal hotspots in Punjab strongly influencing air quality deterioration in Delhi and the wider Indo-Gangetic Plain. Overall, the map underlines the chronic persistence and intensification of PM2.5 exposure in India’s most densely inhabited belts (Figure 1) The population Density of India in 2020), reinforcing the conclusions drawn from recent high-resolution national assessments by Brown et al. (2022) and modelled exposure trends discussed by Kannemadugu et al. (2024)
4.1.3. PM2.5-Related Mortality (1998–2021)
The spatial distribution of PM₂.₅-attributable mortality across India (Figure 7) reveals marked regional disparities that align with long-term air pollution patterns. In 1998, Uttar Pradesh and Bihar emerged as the states with the highest mortality burden, consistent with their position in the Indo-Gangetic Plain, where particulate concentrations have historically been most severe. Central Indian states such as Madhya Pradesh and Chhattisgarh also recorded elevated mortality, reflecting both industrial emissions and coal mining activities. Many southern and north eastern states recorded significantly fewer deaths, likely due to lower PM2.5 concentrations observed in these regions during that period. By 2010, the mortality burden had intensified across northern and central India, with Delhi and its surrounding states showing significant increases, while relatively lower burdens persisted in the southern and north-eastern states where PM₂.₅ levels remained moderate. Though there were lockdown restrictions due to covid-19 pandemic which resulted in reduced vehicular emissions, the 2021 distribution continues to highlight Uttar Pradesh as the dominant contributor to national PM₂.₅-related deaths, though states such as Punjab, Haryana, and West Bengal also show consistently high burdens, driven by industrial activity, biomass burning, and crop residue burning. In contrast, Kerala and the north-eastern states, including Mizoram and Nagaland, remain among the least affected, owing to comparatively lower population density and ambient particulate levels. These trends confirm that the Indo-Gangetic Plain functions as the epicenter of air pollution–related mortality in India, while regional differences underscore the influence of local sources and demographic exposure in shaping the health burden
This analysis highlights that despite temporary improvements during the pandemic, chronic exposure in the Indo-Gangetic Plain continues to impose a significant mortality burden.
The annual PM2.5-attributed deaths in India between 1998 and 2021is shown in Figure 8 gradual increase in mortality is evident until around 2010, followed by a sharp rise that peaked in 2018–2019 with over 139,000 deaths. Although there was a dip in 2020 potentially due to lockdown-related reductions in air pollution levels the figures rebounded in 2021, indicating that air pollution continues to be a persistent and critical public health concern. This suggests that reduced mobility and industrial activity led to a temporary improvement in air quality and may have saved lives. The consistent upward trend aligns with worsening air quality in urban and industrialized regions across the country
4.2. Heat Analysis and Health Impact
4.2.1. Annual Heat Trends (2000-24)
The Figure 9 and Figure 10 shows the annual surface temperature distribution across India for the years 2000, 2005, 2010, 2015, 2020, and 2024. A clear and consistent rise in surface temperatures is evident across the country, with pronounced warming trends in central, western, and southern states. Regions such as Rajasthan, Gujarat, Maharashtra, and Andhra Pradesh have steadily transitioned toward higher temperature zones over the last two decades. In contrast, the northern Himalayan belt remains relatively cooler, maintaining lower annual mean temperatures compared to the rest of the subcontinent. This persistent rise in surface temperature signifies a shift in India’s thermal baseline and directly contributes to the increasing frequency and intensity of heatwaves, particularly in densely populated and economically vulnerable regions.
The spatial patterns of warming align with broader climate change projections and are supported by findings from de Bont et al. (2024), who reported a consistent link between rising temperatures and all-cause mortality in multiple Indian cities. Similarly, Choudhary et al. (2023) demonstrated that excess mortality due to heat stress varies across climatic zones, with central and north-western India showing elevated risk levels. These observations are further substantiated by Sudharsan et al. (2025), who projected a future increase in the frequency of oppressive heatwaves over India under continued warming scenarios. Collectively, these studies emphasize that the thermal landscape of India is undergoing a measurable transformation, which amplifies public health vulnerabilities especially among high-risk groups such as outdoor workers, children, and the elderly. By combining this thermal trend analysis with mortality and vulnerability data in later sections, the study aims to provide a spatially grounded perspective on how sustained heat exposure influences health outcomes across India. The results underscore the need for targeted heat adaptation strategies, particularly in states already experiencing accelerated warming and infrastructural stress.
4.2.2. Heat Trend and Significance
The Sen’s slope trend in surface temperature across India, representing the rate of annual temperature change over time, with statistically significant areas marked at the 95% confidence level. Positive trends, shown in warmer shades, indicate a consistent increase in annual mean temperatures, particularly concentrated over parts of northwestern Madhya Pradesh and Rajasthan. These regions exhibit statistically significant warming, suggesting that surface heat exposure is intensifying more rapidly in these central and north-western zones.
In contrast, several areas in southern and northeastern India display negative or near-zero slopes, represented by cooler blue tones, indicating localized stabilization or slight reductions in surface temperatures over the same time period. However, these pockets of decline are limited in spatial extent and magnitude. This spatial pattern aligns with the findings of de Bont et al. (2024), who reported rising heat-related mortality in urban centres subjected to persistent thermal stress. The observed warming trend is also supported by projections from Sudharsan et al. (2025), who identified northwestern and central India as future hotspots for heatwave amplification. Furthermore, Choudhary et al. (2023) demonstrated regional disparities in excess mortality risk due to heat stress, emphasizing that certain climate zones including parts of western and central India face elevated long-term health risks due to temperature escalation. The Sen’s slope analysis shown here Figure 11 reinforces the urgency for localized heat adaptation planning and infrastructure resilience, particularly in regions showing statistically significant increases in surface temperature. As India’s urban population grows and exposure to environmental heat intensifies, such high-resolution trend mapping offers a critical foundation for evidence-based public health interventions.
4.2.3. Heat-Related Mortality (2016–2021)
Maps depicting deaths from heatstroke or sunstroke are presented for 2016 and 2021( Figure 12 and Figure 13). In 2016, Andhra Pradesh reported the highest number of deaths, consistent with several heatwave incidents reported in that period. Second highest number of deaths are reported in Uttar Pradesh and Punjab states. High fatalities were also observed in Telangana and parts of Odisha and Maharashtra. This was a period with minimal public awareness and preparedness plans at the state level.
By 2021, the number of heat-related deaths had declined across most states, including Andhra Pradesh. The highest fatalities were now recorded in Punjab. This decline may reflect both increased adaptation strategies and the effect of the COVID-19 lockdowns, which kept people indoors during peak heat months. However, reporting biases due to overwhelmed health systems cannot be ignored
In contrast, annual heat-related deaths in India (Figure 14) from 2016 to 2022 reveal a more fluctuating pattern. The highest death tolls were recorded in 2016 and 2019 (above 1200 deaths), with a dramatic drop during 2020 and 2021. This dip again aligns with the pandemic period, possibly reflecting reduced outdoor activity or underreporting. However, deaths began to rise again in 2022, hinting at a return to previous vulnerability levels with rising global temperatures which leads to increased frequency of extreme heatwaves and challenges in adaptive measures.
4.3. UV Radiation and Vitamin D Deficiency
4.3.1. UV Trend (2001-2022)
The spatial distribution of annual UV radiation levels/ Index across India for the years 2001, 2005, 2010, 2015, 2020, and 2022 are shown in Figure 15 and Figure 16. A distinct latitudinal gradient is evident, with southern regions such as Tamil Nadu, Kerala, and parts of Maharashtra consistently experiencing higher UV radiation levels, while the northern and north-eastern states including Jammu & Kashmir, Himachal Pradesh, and Assam receive comparatively lower exposure. This spatial pattern is largely shaped by solar zenith angle, atmospheric path length, and seasonal cloud cover, and remains consistent across the time series. The UV radiation map reflects geographic stability in exposure levels, where the southern and central zones remain high in UV availability (depicted in red), and the Indo-Gangetic Plain along with the Himalayan foothills persist as UV-deficient regions (shown in blue). These findings are in alignment with Sumiya et al. (2023), who demonstrated that in cold-climate regions such as Ulaanbaatar, Mongolia, ambient UV radiation is significantly reduced during winter due to high aerosol loading, (As shown in Figure 4 and Figure 5). Pollution acts as a layer of bed where it blocks and deviates the UV rays. Extended atmospheric path length, and persistent cloud cover, despite overall regional sunlight availability.
While the visual distribution of UV radiation appears steady over the years, its impact on health outcomes especially vitamin D synthesis shows notable spatial variation. In northern India, despite extended daylight hours, high atmospheric aerosol concentrations and behavioural factors like limited sun exposure restrict effective UVB absorption. This paradox is emphasized by Khadilkar et al. (2022), who reported that children and adolescents in India suffer from widespread vitamin D deficiency, even in sun-drenched environments, due to pollution, clothing practices, and time spent indoors. What distinguishes the present study is its integration of long-term satellite-derived UV datasets with health outcomes across age groups and geographies. Unlike previous studies that assessed UV radiation seasonally or within isolated urban locations, this work provides a comprehensive, raster-level analysis at the national scale. Such data-driven mapping holds substantial value for informing region-specific public health policies particularly those focused on optimizing sunlight exposure guidelines and addressing micronutrient deficiencies across vulnerable populations
4.3.2. UV Radiation Trend and Significance
The spatial trend in UV radiation across India, based on Sen’s Slope Estimator with statistical significance mapped at the 95% confidence level (Figure 17), reveals a mild to moderate decline in UV exposure over large portions of central and southern India, while certain northern and coastal zones show marginal increases. Notably, these declining UV trends overlap geographically with regions that also exhibit strong positive trends in PM₂.₅ concentrations (Figure 5), suggesting that rising aerosol loading contributes to attenuation of surface-level solar irradiance. In addition to aerosol impacts, cloud cover variability and large-scale circulation shifts may also play a role (Burnett et al., 2018; Jin et al., 2022). The statistically significant negative slopes observed across central India are of particular concern for public health, as reduced UVB radiation has implications for cutaneous vitamin D synthesis. These findings are consistent with Sumiya et al. (2023), who reported that regions with colder climates or higher pollution burdens tend to experience lower ambient UV availability regardless of latitude.
The declining UV trends are further supported by prevalence data on vitamin D deficiency reported in multi center studies such as those by Khadilkar et al. (2022) and Mustafa and Shekhar (2021), which showed widespread insufficiency among children and adolescents across India. Broader reviews by Ritu and Gupta (2014) and Harinarayan (2018) have also emphasized how air pollution, limited sun exposure, and cultural practices exacerbate these deficiencies. The overlap between decreasing UV radiation zones and high-deficiency regions reinforces the need for spatially informed public health interventions. By using pixel-wise Sen’s slope analysis over a multi-year dataset, this study offers a high-resolution view of declining UV radiation trends, adding important context to India’s ongoing micronutrient challenges (Sumiya et al., 2023; Jin et al., 2022). These maps are valuable not only for environmental assessment but also for guiding future vitamin D supplementation strategies and promoting behavioral changes related to sunlight exposure.
4.3.3. Association of UV Index and Vitamin D Deficiency
The Figure 18 shows spatial variation of average UV Index (2016-18) and Figure 19 (a) shows Vitamin D deficiency prevalence among children aged 1–4 years. Comparison between the two figures reveals only partial alignment. While northern states (Gujarat, Rajasthan, Punjab, Haryana, Jammu & Kashmir, Uttarakhand, Bihar and Manipur) with relatively lower UV exposure do show higher deficiency (> 20 %). This discrepancy suggests that environmental UV exposure alone does not fully explain Vitamin D outcomes at this age group; nutritional intake, skin pigmentation, cultural clothing practices, and time spent outdoors are likely major contributing factors (Ritu & Gupta, 2014; Khadilkar et al., 2022).
The Figure 19 (b) shows the Vitamin D deficiency among children aged 5–9 years. High deficiency rates (>= 30 %) are observed in northern states (Punjab, Haryana, Jammu & Kashmir, Uttarakand) and north eastern state (Manipur), despite moderate UV availability. These findings underscore the role of sun exposure habits and cultural practices in influencing Vitamin D levels during early schooling years.
The Figure 19 (C) shows Vitamin D deficiency prevalence in children aged 10–14 years in relation to average UV levels. A sharp rise in deficiency is evident across northern, eastern, and central states. This may reflect reduced outdoor activity during adolescence, as well as increasing urbanization, school hours, and indoor lifestyles. The Figure 19 (d) shows a continued high prevalence of Vitamin D deficiency among adolescents aged 15–19, with many regions crossing 30% prevalence even in areas with relatively high UV exposure. This disconnects points toward complex risk factors including inadequate sunlight exposure, skin-covering clothing, and limited dietary intake particularly among older adolescents.
- Vitamin D synthesis in humans depends primarily on ultraviolet B (UVB) exposure. The spatial comparison between average UV Index data (2016–2018) and vitamin D deficiency prevalence (ages 1–19) highlights clear regional disparities. Southern states with consistently high UV availability show comparatively lower deficiency rates, while the Indo-Gangetic Plain and northeastern India report widespread deficiency despite moderate to high UV exposure. This disconnect indicates that environmental UV alone cannot fully explain deficiency levels.
Multi center studies in India (Khadilkar et al., 2022; Mustafa & Shekhar, 2021) confirm that air pollution, limited outdoor activity, clothing practices, and skin pigmentation substantially restrict effective UVB absorption. Earlier reviews (Ritu & Gupta, 2014) also emphasized the importance of non-environmental determinants. By integrating satellite-derived UV data with NFHS-5 vitamin D deficiency maps at a pixel level, this study provides higher-resolution insights across multiple age groups. The findings reinforce the complex interplay between environmental exposure and socio-behavioral factors, aligning with previous work by Garg et al. (2018) and Khadilkar et al. (2022), while introducing a novel spatial framework to identify regional risk clusters. Such mapping can better inform public health strategies, including supplementation programs and behavioral interventions tailored to local contexts
4.3.4. Average UV per Day (Timings)
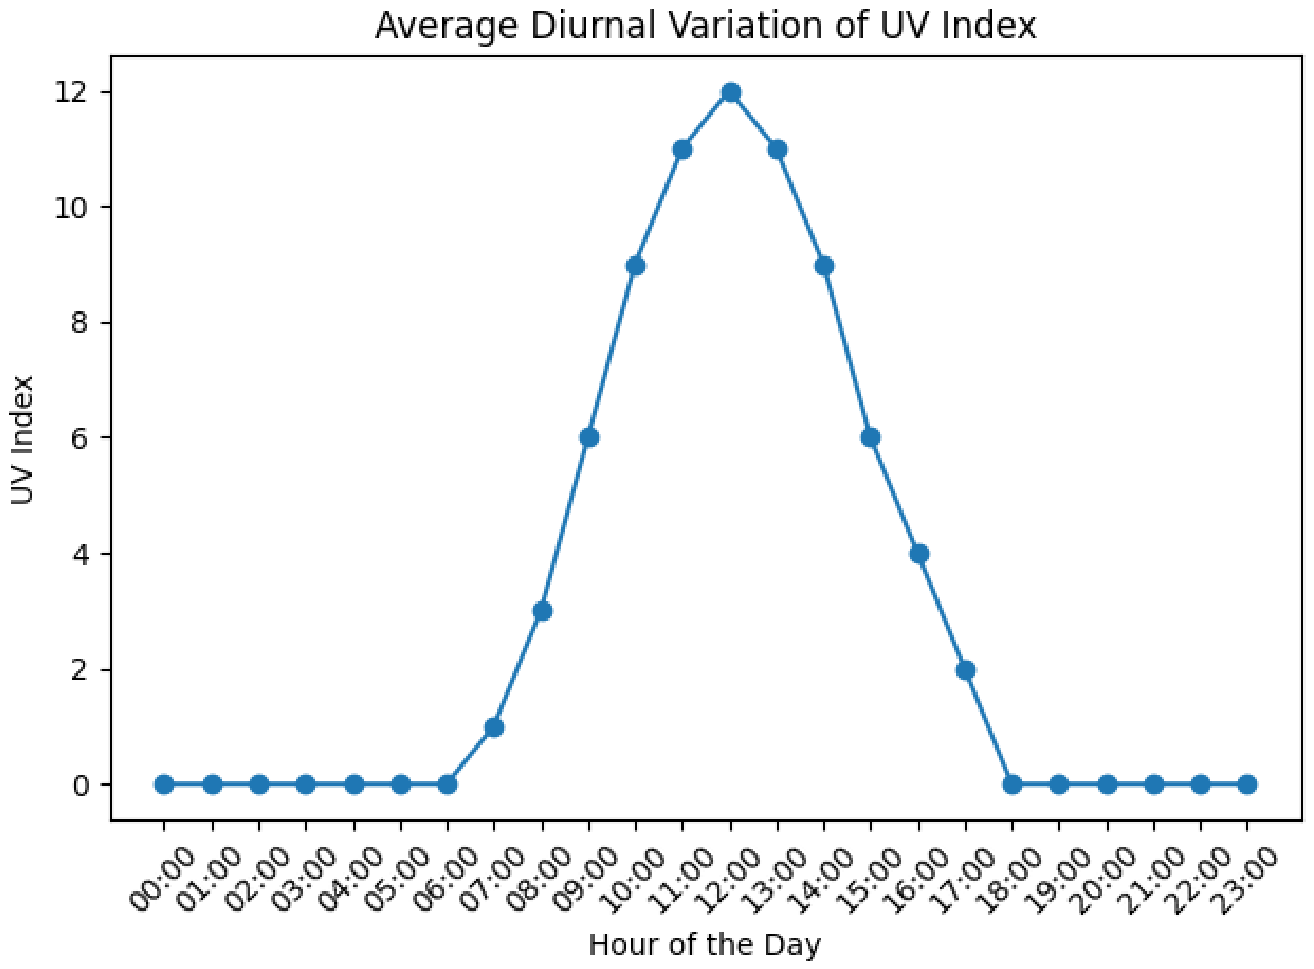
The Figure 20 represents the diurnal variation of average UV per day, The UV data was hourly which helped us to find out which is the best time to get the enough vitamin D for synthesis process. This figure interprets that the best time for anyone to come out would be between 10 hrs - 14 hrs, the time would reduce according to the amount of UV index which our body is exposed to. This representation is made to understand and showcase that which is the best time to go out and stand in the sun.
The Fitzpatrick Skin Type Classification is a dermatological scale that categorizes human skin based on its sensitivity to ultraviolet (UV) radiation. It ranges from Type I to Type VI. Type I skin is very pale, often with freckles, and always burns without tanning common among Northern Europeans. Type II skin is fair and also burns easily but may tan minimally, typical of most Caucasian individuals. Type III is medium-toned skin that burns moderately and tans uniformly, usually seen in Southern Europeans. Type IV is olive or light brown skin, which rarely burns and tans easily common in Middle Eastern populations and some Indians. Type V, which represents the majority of the Indian population, is brown skin that very rarely burns and tans profusely. Finally, Type VI is very dark brown or black skin that never burns and is characteristic of individuals of African or Afro-Caribbean descent.
These skin types are critical in vitamin D studies because the amount of melanin in darker skin (e.g., Types V and VI) absorbs more UVB radiation, thus requiring longer exposure to produce the same amount of vitamin D₃ as lighter skin. For instance, the Minimal Erythemal Dose (MED)—the threshold of UV radiation that causes slight reddening of the skin—is higher in darker skin. For Indian skin (Type V), the MED is approximately 600 J/m², compared to 200–300 J/m² in fair-skinned individuals. This variation must be considered when modeling vitamin D synthesis, as it affects how much UV is needed to reach the biologically effective dose (e.g., 1 Standard Vitamin D Dose or SDD)
5. Conclusion
1. This study presents a comprehensive analysis of three major environmental stressors PM₂.₅, surface temperature, and UV radiation across India over a span of two decades. Using satellite and reanalysis datasets, the spatial and temporal patterns of these stressors were mapped and interpreted with high resolution, providing a national-scale view of environmental change.
2. The results showed a persistent increase in PM₂.₅ levels, especially in the Indo-Gangetic Plain, with northern states such as Uttar Pradesh and Bihar consistently recording high concentrations. This increase in pollution levels was closely associated with rising PM₂.₅-attributed mortality over time, pointing to a worsening public health burden in already densely populated regions.
3. Surface temperature trends revealed a steady warming pattern across most parts of India, particularly in central, western, and southern states. The impact of this warming has become increasingly visible through a rise in heat-related deaths, most notably after 2016, highlighting the need for urgent intervention to reduce heat exposure risks and improve urban climate resilience.
4. UV radiation levels showed consistent spatial variation, with lower exposure in northern India and higher exposure in the south. These variations were reflected in vitamin D deficiency trends, particularly among children and adolescents. Regions with lower UV levels exhibited higher rates of deficiency, suggesting that environmental exposure plays a critical role in determining vitamin D synthesis potential across different parts of the country.
5. The application of non-parametric statistical tools like Sen’s Slope and the Mann–Kendall test enabled the detection of significant long-term trends in environmental parameters. This methodological framework added robustness to the analysis and helped establish the directional change and intensity of environmental variables over time.
6. Compared to previous studies, this research offers a unique approach by combining multi-source environmental data with spatially distributed health outcomes. The study not only confirms known hotspots and trends but also introduces a more granular, pixel-level assessment across both rural and urban regions, strengthening its utility for targeted policy and health planning.
7. The findings underscore the urgent need for region-specific climate-sensitive health interventions in India. These include strategies for pollution mitigation, heatwave management, and public awareness campaigns around safe sun exposure and vitamin D supplementation. Without timely action, the overlapping burden of environmental stressors will continue to pose a growing risk to public health, especially among vulnerable populations.
6. Acknowledgments
Authors thank GD, ASLSP&CG, DD, ECSA and Director, NRSC for the encouragement towards this study. The author gratefully acknowledges the Copernicus Climate Data Store for providing ERA5 reanalysis datasets, the NASA CERES project for UV radiation data, and the Institute for Health Metrics and Evaluation (IHME) for access to GBD mortality statistics. The support of QGIS and Python open-source communities was also instrumental in completing this work.
- Authors’ contributions: All authors contributed to the study conception and design. Material preparation, data collection, and analysis were performed by S.S and H.B.S.K. The first draft of the manuscript was written by S.S and H.B.S.K and all authors commented on previous versions of the manuscript. All authors read and approved the final manuscript.
- Code availability: The Python code used for raster processing and trend analysis is available from the corresponding author upon reasonable request.
7. Funding
The author received no specific funding for this research work.
8. Declarations
- Ethics approval Not applicable.
- Consent to participate Not applicable.
- Consent for publication Not applicable.
- Competing interests the authors declare no competing interests
9. Data Availability
The datasets supporting the findings of this study are all publicly available from the following sources:
● ERA5 Climate Data (PM2.5 and Temperature): Downloaded from the Copernicus Climate Data Store, covering hourly data from 1950 to the present.
● UV Radiation Data: Obtained from the CERES SYN1deg Edition 4.1 provided by NASA.
● PM2.5-Related Mortality Data: Retrieved from the Global Burden of Disease (GBD) portal maintained by the Institute for Health Metrics and Evaluation (IHME), using “particulate matter” as the cause-of-death filter.
● Heat-Related Mortality Data: Extracted from government records available on Data.gov.in, specifically under deaths caused by natural forces (sunstroke and heatstroke) for the years 2016–2022.
● Vitamin D Deficiency Data: Sourced from the Nutrition India Dashboard, based on NFHS-5 (National Family Health Survey) data for the age group 1–19.
No ethical approval was required as this study relied entirely on publicly accessible secondary datasets.
References
- Brown PE, Izawa Y, Balakrishnan K, Fu SH, Chakma J, Menon G, Dikshit R, Dhaliwal RS, Rodriguez PS, Huang G, Begum R, Hu H, D’Souza G, Guleria R, Jha P. Mortality associated with ambient PM₂.₅ exposure in India: Results from the Million Death Study. Environmental Health Perspectives. 2022;130(3):037001. Available from: https://ehp.niehs.nih.gov/doi/full/10.1289/EHP9538.
- Chatterjee D, McDuffie EE, Smith SJ, Bindle L, van Donkelaar A, Hammer MS, Venkataraman C, Brauer M, Martin RV. Source contributions to fine particulate matter and attributable mortality in India and the surrounding region. Environmental Science & Technology. 2023;57(2):705–716. Available from: https://pubs.acs.org/doi/10.1021/acs.est.2c07641. [CrossRef]
- Jaganathan S, Stafoggia M, Rajiva A, Mandal S, Dixit S, de Bont J, et al. Estimating the effect of annual PM₂.₅ exposure on mortality in India: A difference-in-differences approach. The Lancet Planetary Health. 2024;8(12):E987–E996. Available from: https://www.thelancet.com/journals/lanplh/article/PIIS2542-5196(24)00248-1/fulltext.
- Manchanda C, Kumar M, Singh V, Faisal M, Hazarika N, Shukla A, Lalchandani V, Goel V, Thamban N, Ganguly D, Tripathi SN. Variation in chemical composition and sources of PM₂.₅ during the COVID-19 lockdown in Delhi. arXiv Preprint. 2020. Available from: https://arxiv.org/abs/2011.08140.
- de Bont J, Nori-Sarma A, Stafoggia M, Banerjee T, Ingole V, Jaganathan S, Mandal S, Rajiva A, Krishna B, Kloog I, Lane K, Mall RK, Tiwari A, Wei Y, Wellenius GA, Prabhakaran D, Schwartz J, Prabhakaran P, Ljungman P. Impact of heatwaves on all-cause mortality in India: A comprehensive multi-city study. Science of the Total Environment. 2024;900:168902. Available from: https://www.sciencedirect.com/science/article/pii/S0160412024000473.
- Kumar A, Singh DP. Heat stroke–related deaths in India: An analysis of natural causes of deaths associated with the regional heatwave. Science of the Total Environment. 2020;712:136497. Available from: https://www.sciencedirect.com/science/article/abs/pii/S0306456520305635.
- Sudharsan N, Singh J, Ghosh S, Karmakar S. Increasing risk of oppressive heatwaves over India in the future warming. arXiv Preprint. 2025. Available from: https://arxiv.org/abs/2501.13359.
- Choudhary RK, Joshi P, Ghosh S, Ganguly D, Balakrishnan K, Singh N, Mall RK, Kumar A, Dey S. Excess mortality risk due to heat stress in different climatic zones of India. International Journal of Environmental Health. 2023. Available from: https://pubmed.ncbi.nlm.nih.gov/38151765.
- Lüthi S, Fairless C, Fischer EM, Scovronick N, Armstrong B, De Sousa Zanotti Stagliorio Coelho M, Guo YL, Guo Y, Honda Y, Huber V, Kyselý J, Lavigne E, Royé D, Ryti N, Silva S, Urban A, Gasparrini A, Bresch DN, Vicedo-Cabrera AM. Rapid increase in the risk of heat-related mortality. Nature Communications. 2023;14:40599. Available from: https://www.nature.com/articles/s41467-023-40599-x. [CrossRef]
- Garg S, Dasgupta A, Maharana SP, Paul B, Bandyopadhyay L, Bhattacharya A. Sun exposure and vitamin D in rural India: A cross-sectional study. Indian Journal of Public Health. 2018;62(4):297–302. Available from: https://journals.lww.com/ijph/fulltext/2018/62030/sun_exposure_and_vitamin_d_in_rural_india__a.4.aspx. [CrossRef]
- Mustafa A, Shekhar C. Concentration levels of serum 25-hydroxyvitamin-D and vitamin D deficiency among children and adolescents of India: A descriptive cross-sectional study. BMC Pediatrics. 2021;21:334. Available from: https://bmcpediatr.biomedcentral.com/articles/10.1186/s12887-021-02803-z.
- Khadilkar A, Kajale N, Oza C, Oke R, Gondhalekar K, Patwardhan V, Khadilkar V, Mughal Z, Padidela R. Vitamin D status and determinants in Indian children and adolescents: A multicentre study. Scientific Reports. 2022;12:16790. Available from: https://www.nature.com/articles/s41598-022-21279-0. [CrossRef]
- Ritu G, Gupta A. Vitamin D deficiency in India: Prevalence, causalities and interventions. Nutrients. 2014;6(2):729–775. [CrossRef]
- Harinarayan CV. How to treat vitamin D deficiency in sun-drenched India – guidelines. Journal of Clinical and Scientific Research. 2018;7(3):131–140. [CrossRef]
- Sen PK. Estimates of the regression coefficient based on Kendall’s tau. Journal of the American Statistical Association. 1968;63(324):1379–1389. Available from: https://pacificclimate.org/~wernera/zyp/Sen%201968%20JASA.pdf. [CrossRef]
- Hersbach H, Bell B, Berrisford P, Hirahara S, Horányi A, Muñoz-Sabater J, Nicolas J, Peubey C, Radu R, Schepers D, Simmons A, Soci C, Abdalla S, Abellan X, Balsamo G, Bechtold P, Biavati G, Bidlot J, Bonavita M, et al. The ERA5 global reanalysis. Quarterly Journal of the Royal Meteorological Society. 2020;146(730):1999–2049. [CrossRef]
- Government of India. National Family Health Survey (NFHS-5) 2019–21. Nutrition India Dashboard. https://healthnutritionindia.in/dashboard/1/1/205.
- Su, W., T. P. Charlock, and F. G. Rose (2005), Deriving surface ultraviolet radiation from CERES surface and atmospheric radiation budget: Methodology, J. Geophys. Res., 110, D14209. [CrossRef]
- Kannemadugu H.B.S., Dorligjav S., Taori A., Bothale R., Chauhan P. (2024). Long term trends in global air pollution potential and its application to ventilation corridors.. Air Quality, Atmosphere & Health. [CrossRef]
- Sumiya E., Dorligjav S., Purevtseren M., Gombodorj G., Byamba-Ochir M., Dugerjav O., Sugar M., Batsuuri B., Tsegmid B. (2023). Climate patterns affecting cold season air pollution of Ulaanbaatar City, Mongolia. Climate, 11(1), 4. [CrossRef]
- Burnett R.T., Pope C.A. III, Ezzati M., Olives C., Lim S.S., Mehta S. et al. (2018). An integrated risk function for estimating the global burden of disease attributable to ambient fine particulate matter exposure. Environmental Health Perspectives, 122(4), 397–403. https://ehp.niehs.nih.gov/doi/full/10.1289/EHP4438.
- Khadilkar A.V., Ekbote V.H., Chiplonkar S.A., Khadilkar V.V. (2022). Prevalence of vitamin D deficiency in Indian children and adolescents: a multicenter study using dried blood spots. Scientific Reports, 12, 17862. [CrossRef]
- Jin C., Wang Y., Li T., Yuan Q. (2022). Global validation and hybrid calibration of CAMS and MERRA-2 PM2.5 reanalysis products based on OpenAQ platform. Atmospheric Environment, 274, 118972. [CrossRef]
- Gowthaman, G., Sundaravadivelu, K., &Muniraj, I. (2023). Detecting air pollutants trends using Mann-Kendall tests and Sen’s slope estimates. Environment Conservation Journal, 24(3), 157–166. [CrossRef]
- Jaiswal, A., Sharma, P., & Choudhary, S. (2018). Trend analysis of air pollutants using Mann–Kendall and Sen’s slope estimator in Excel. Environment Conservation Journal, 19(3), 139–146. https://journal.environcj.in/index.php/ecj/article/view/1506.
- GBD 2021 Risk Factors Collaborators. Global Burden of Disease Study 2021 (GBD 2021) Results. Seattle, WA: Institute for Health Metrics and Evaluation (IHME); 2022. Available from: https://vizhub.healthdata.org/gbd-results/.
- Nirwan N, Siddiqui A, Kannemadugu HBS, Chauhan P, Singh RP. Determining hotspots of gaseous criteria air pollutants in Delhi airshed and its association with stubble burning. Scientific Reports. 2024;14:986. [CrossRef]
- McKinlay AF, Diffey BL (1987).A reference action spectrum for ultraviolet induced erythema in human skin. CIE Journal, 6(1), 17–22.
- Fitzpatrick, T. B. (1975). Soleil et peau. Journal of Dermatologie (Paris), 2(1), 33–34.
Figure 1.
Population Density of India 2020 per Sq.km.
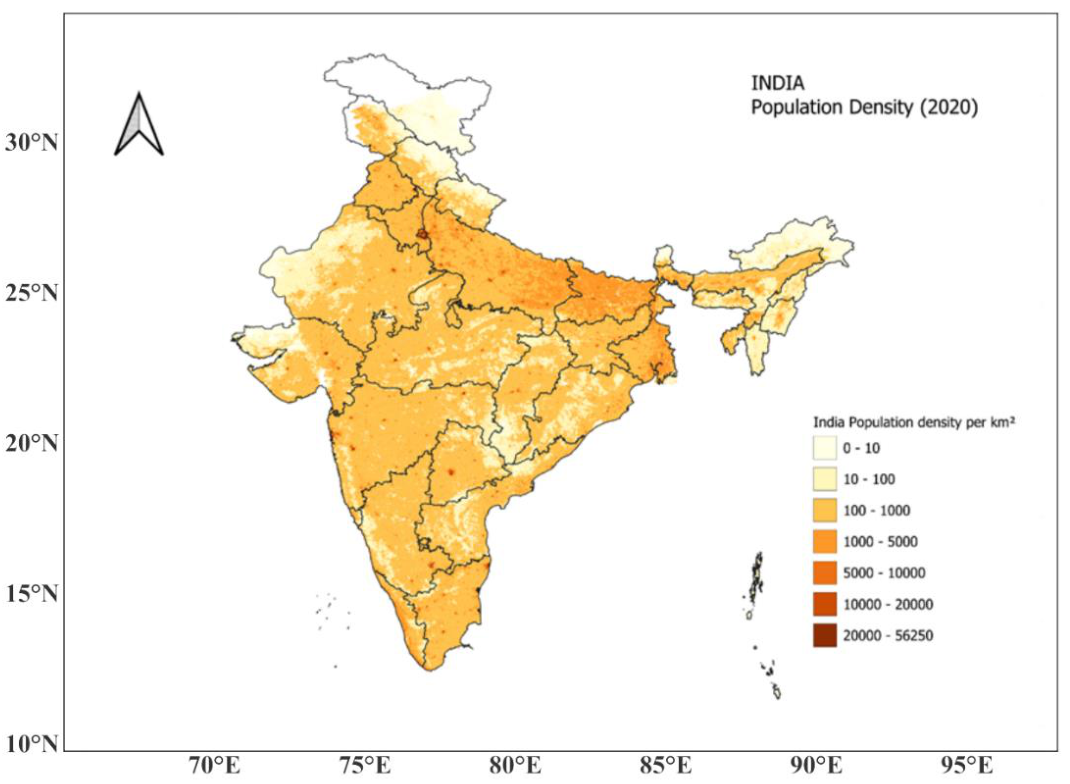
Figure 4.
Annual PM2.5 concentration across India (1998, 2005, 2010, 2015).
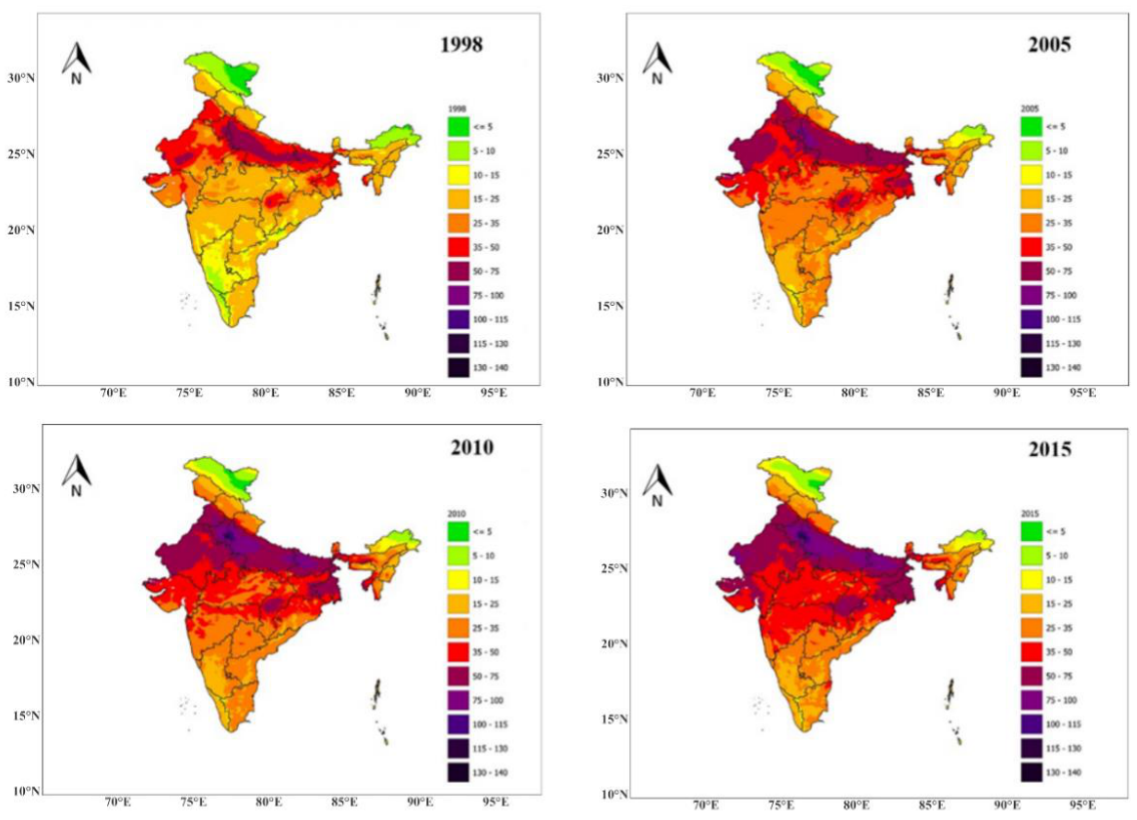
Figure 5.
Annual PM2.5 concentration across India (2016, 2019, 2021, 2023).
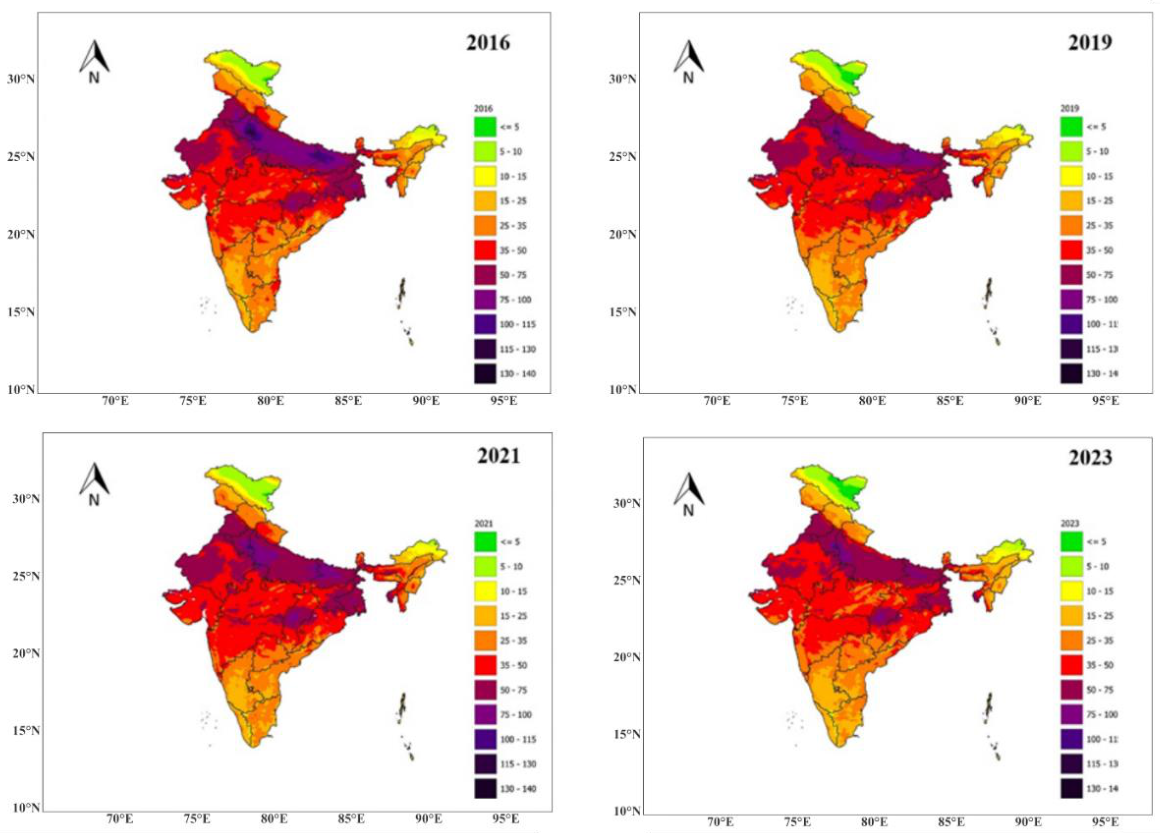
Figure 6.
PM2.5 trend significance (Sen’s slope).
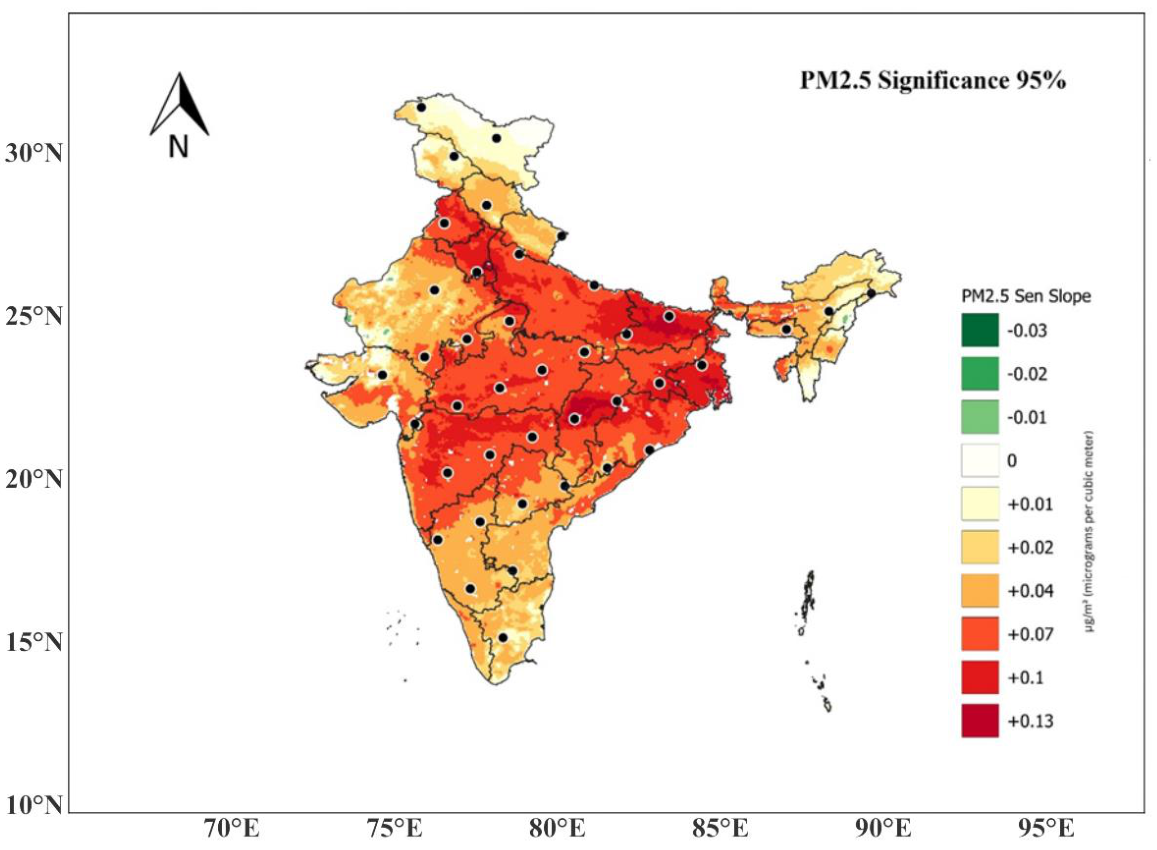
Figure 7.
PM2.5 Attributed Deaths (1998, 2010, 2021).
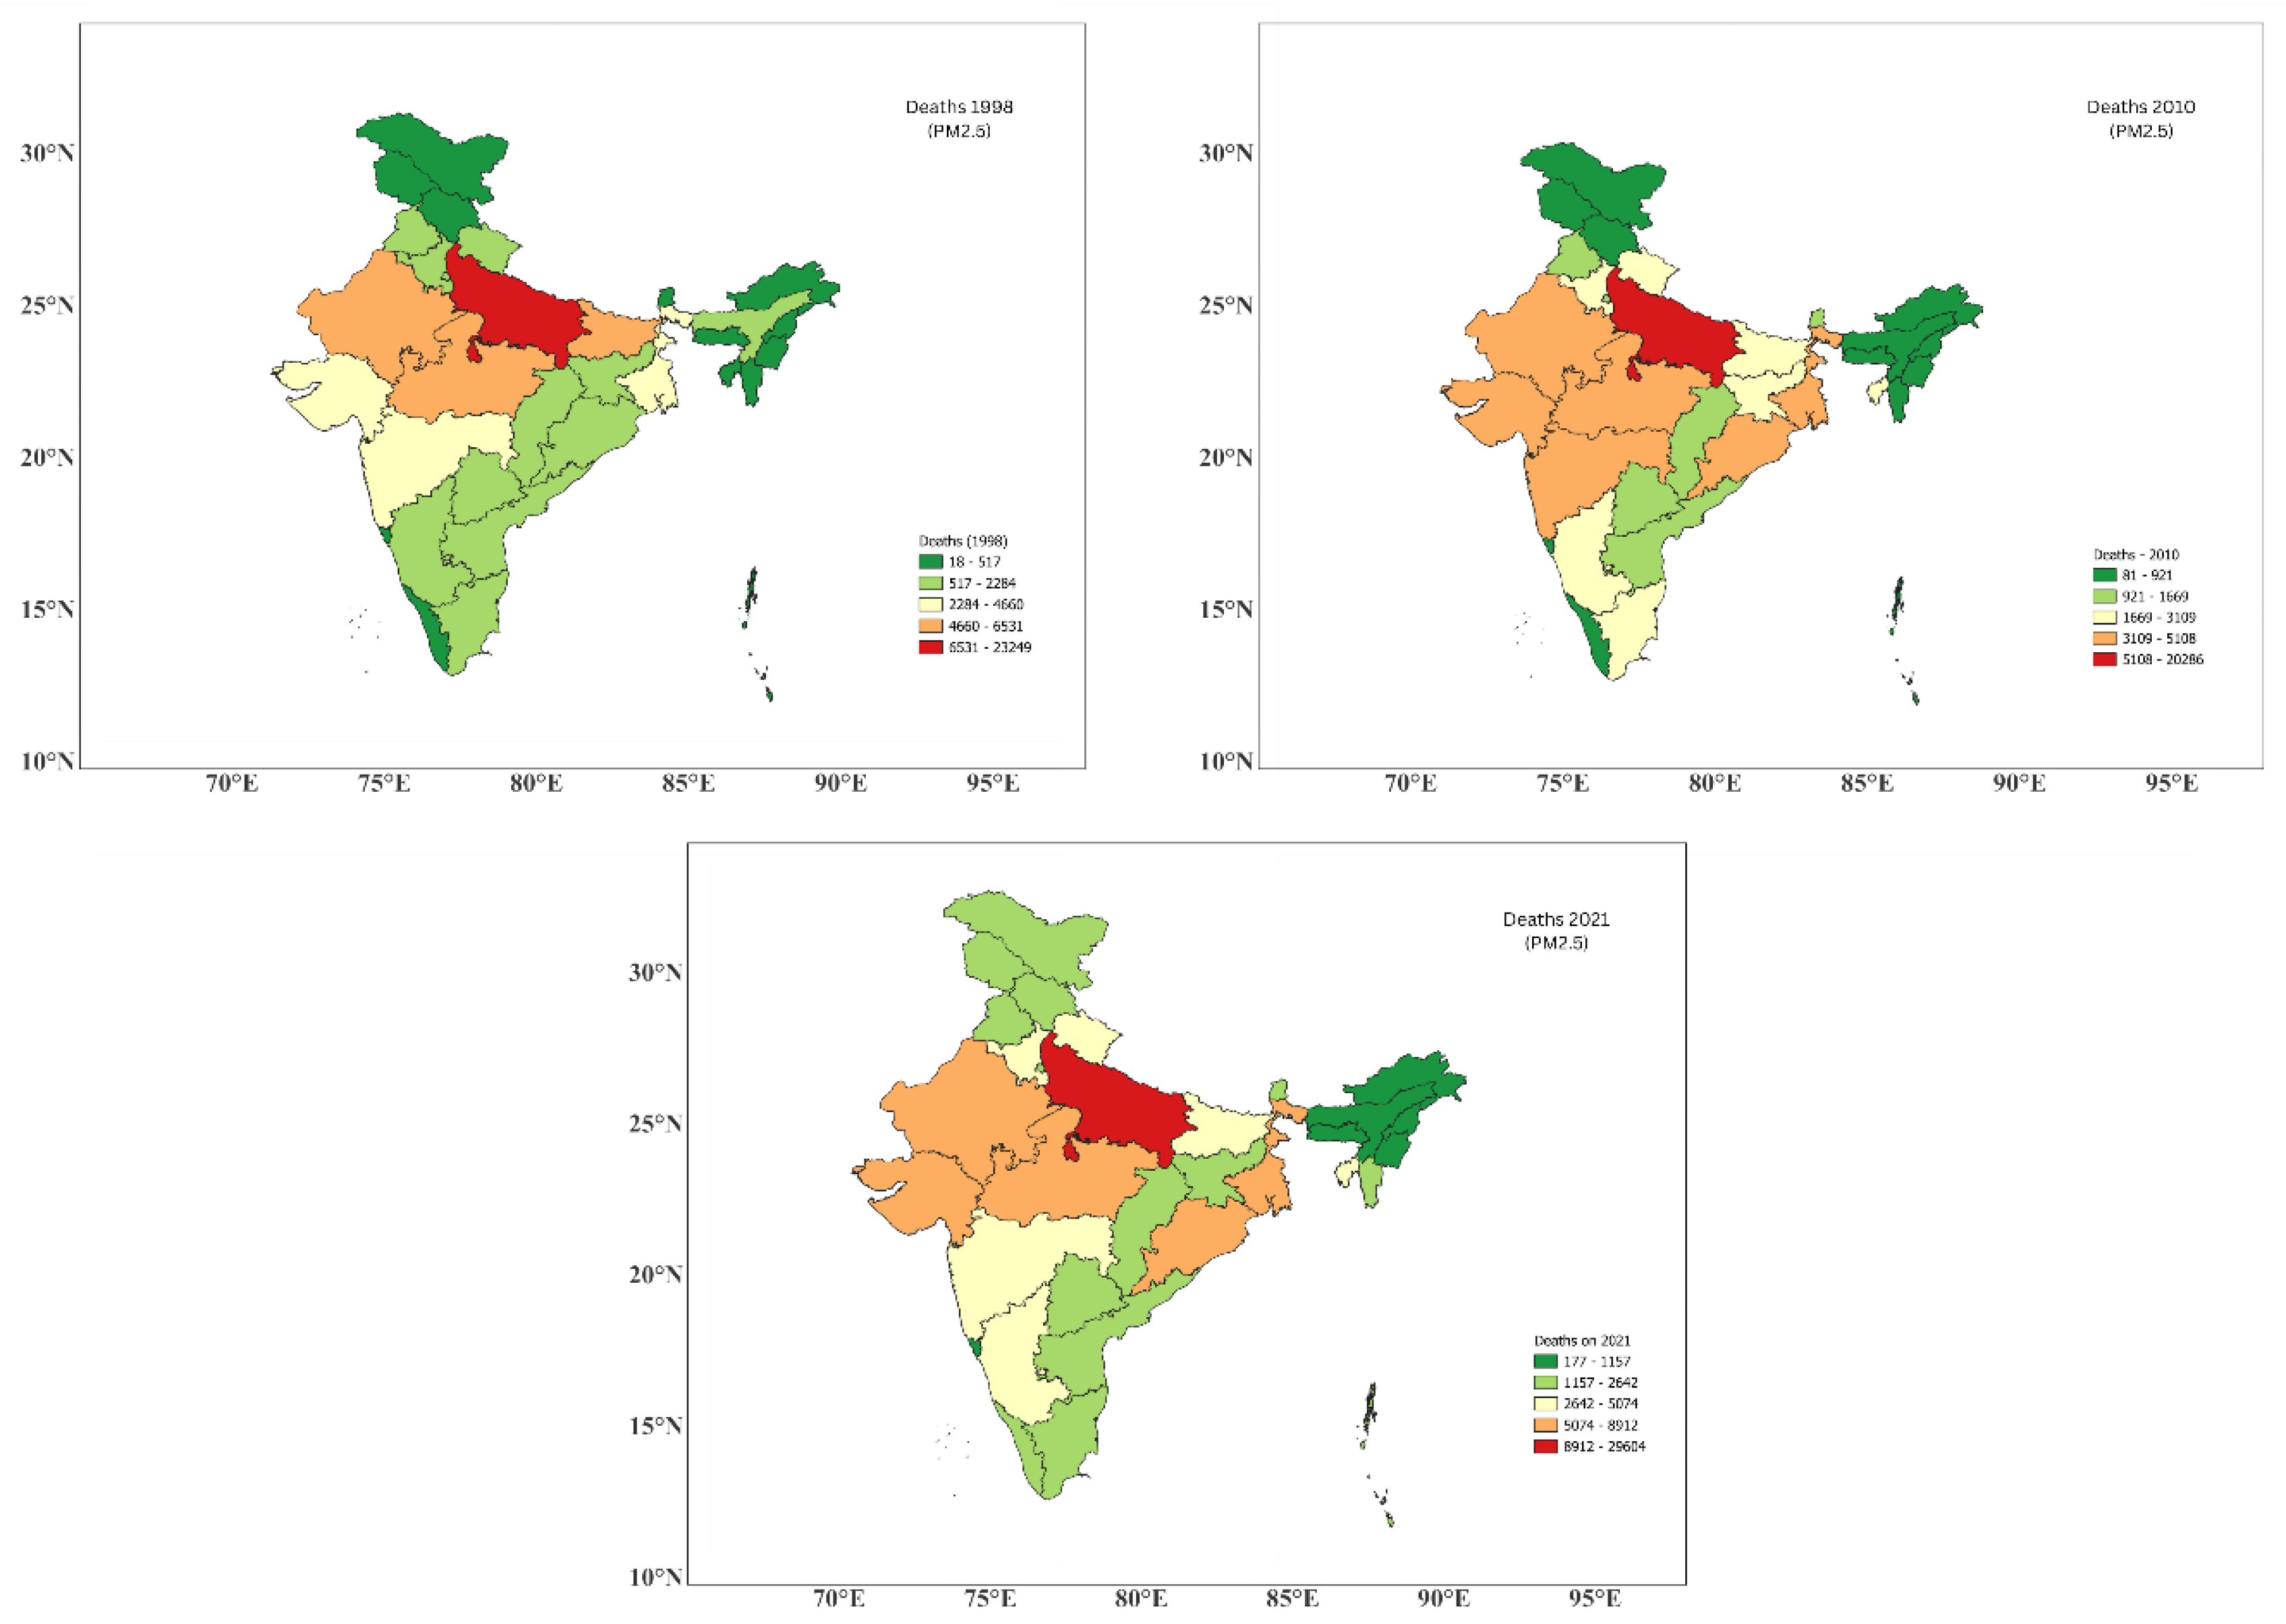
Figure 8.
PM2.5 attributed deaths annual trend in India.
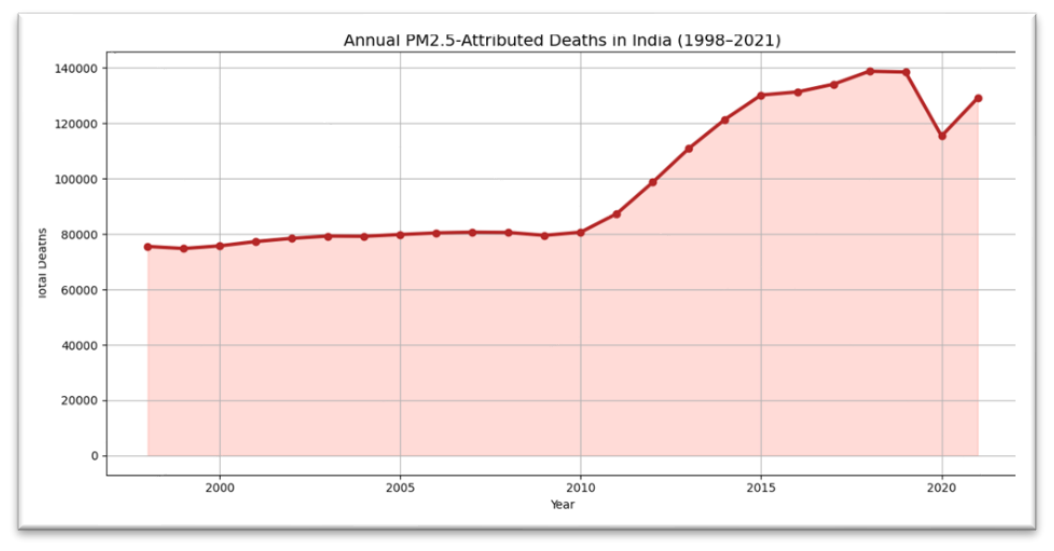
Figure 9.
Annual Heat spatial variation (2000, 2004, 2008, 2012).
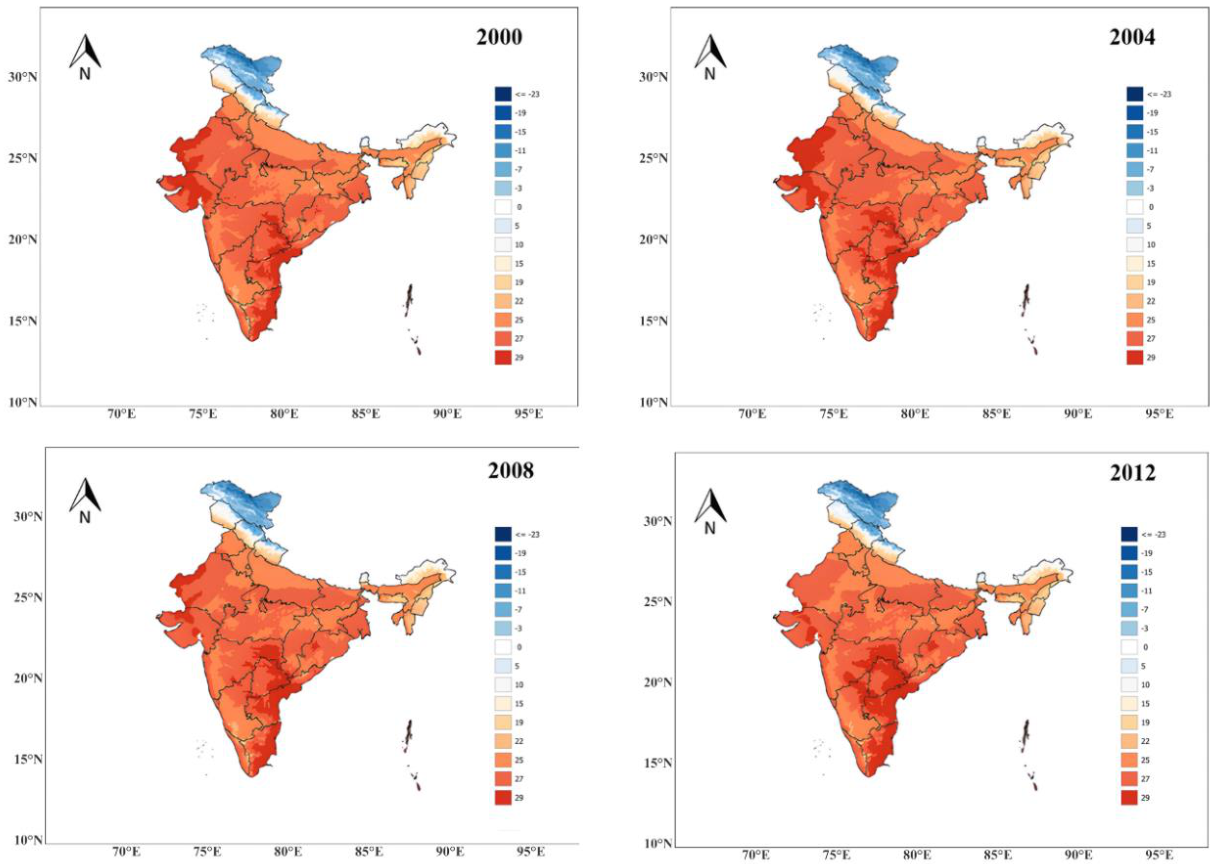
Figure 10.
Annual Heat spatial variation (2016, 2019, 2020, 2024).
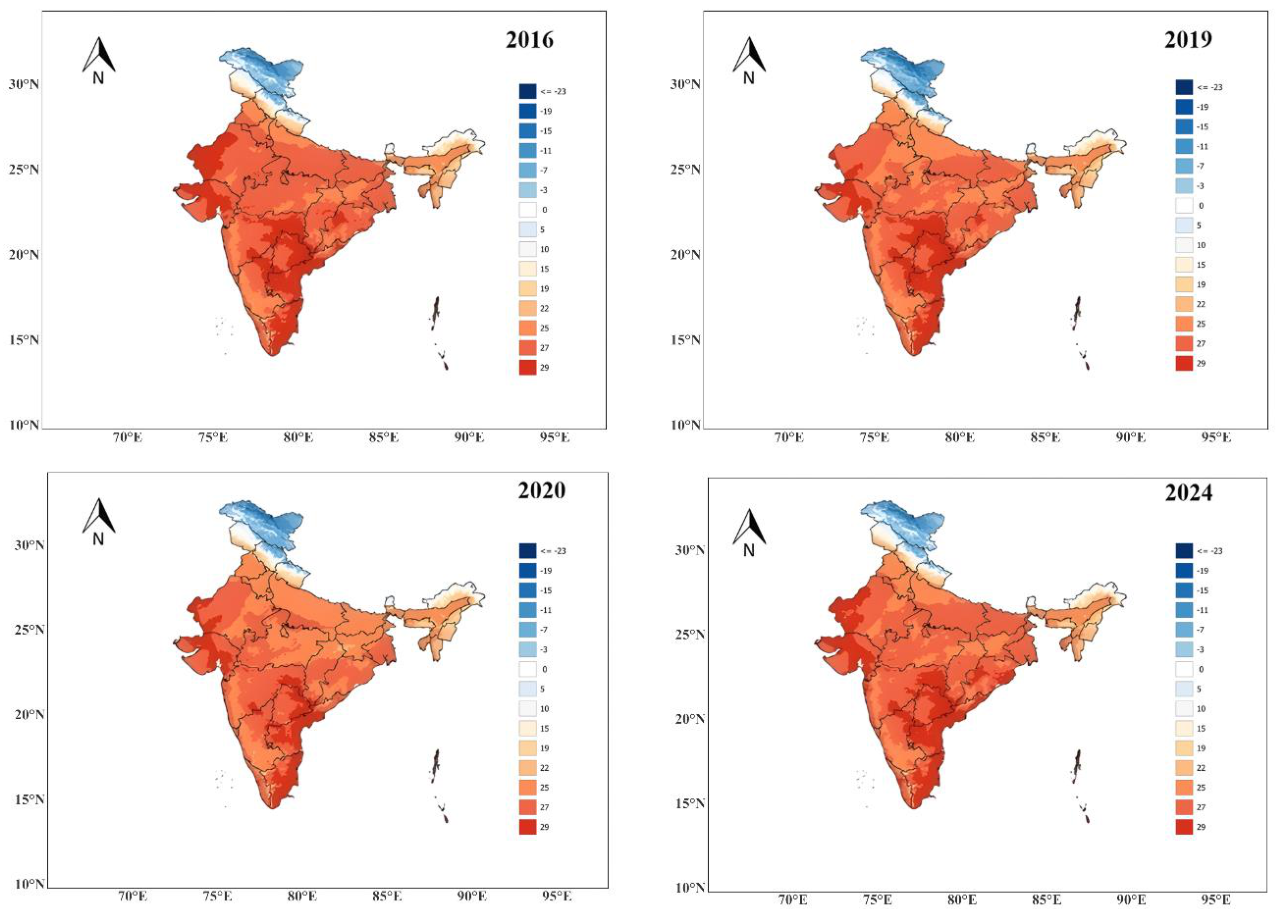
Figure 11.
Heat trend significance (Sen’s slope).
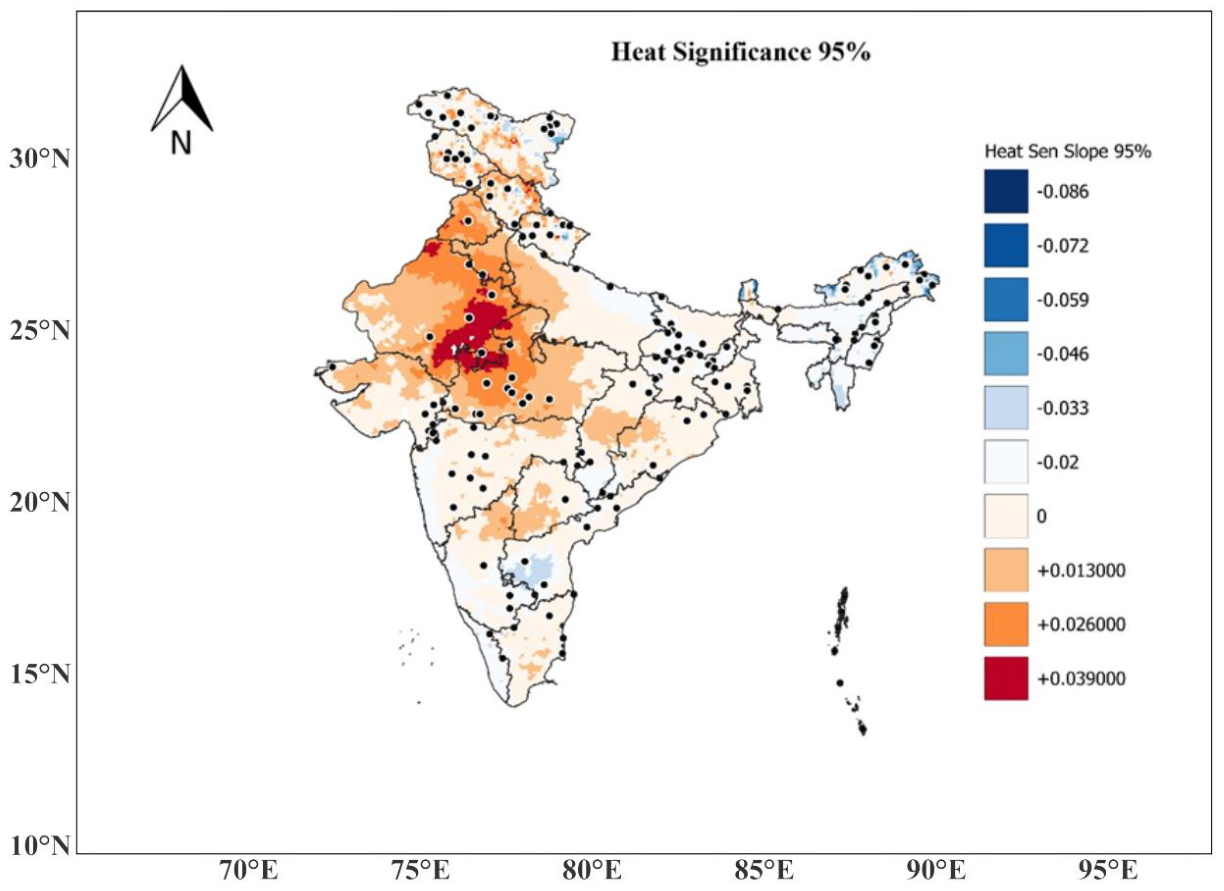
Figure 12.
Heat deaths during the year 2016.
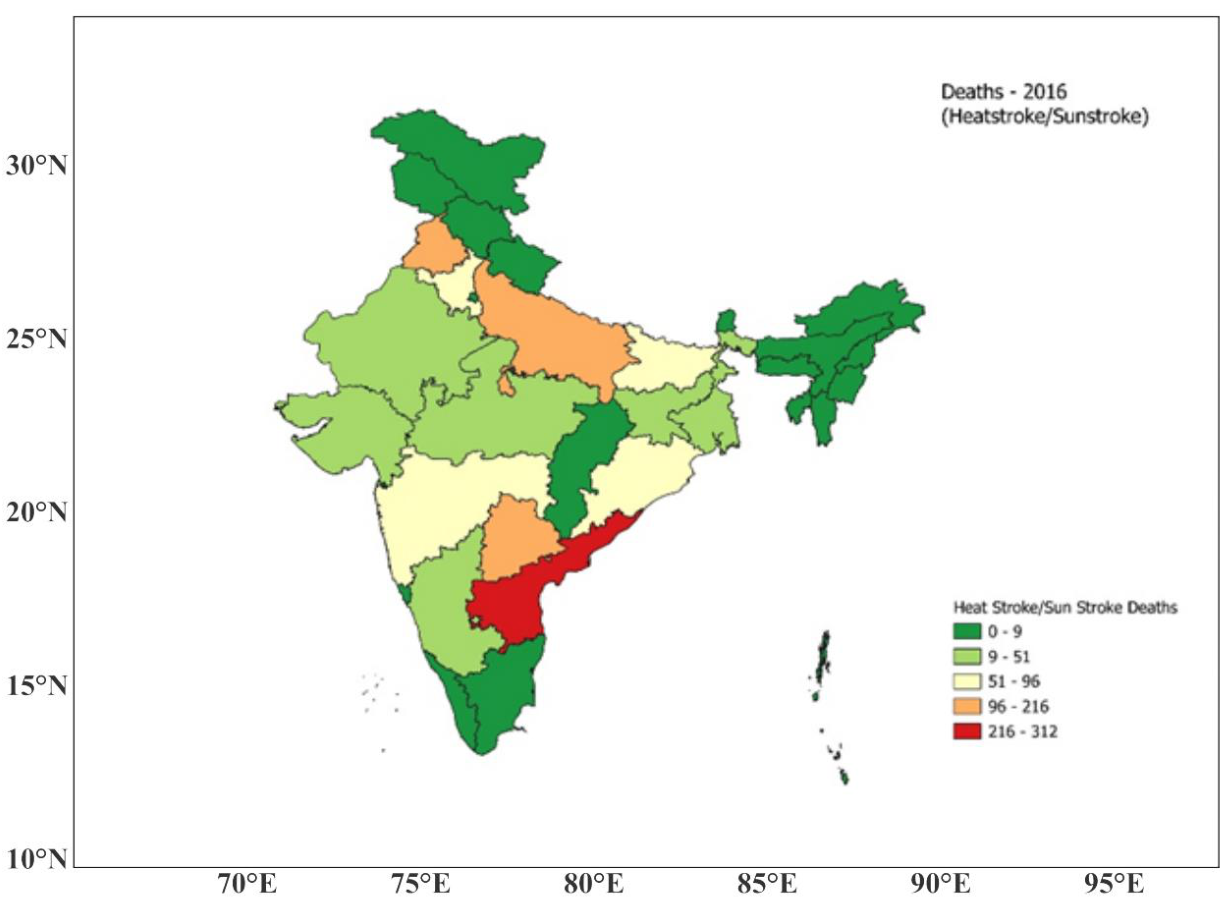
Figure 13.
Heat deaths during the year 2021.
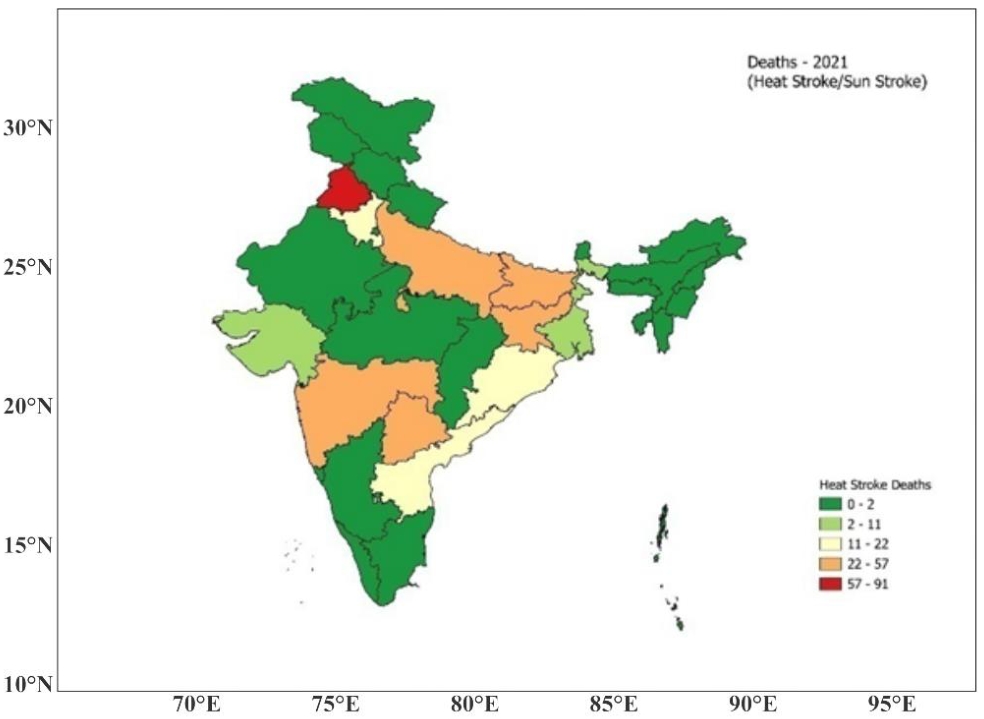
Figure 14.
Heat related deaths in India (2016-2022).
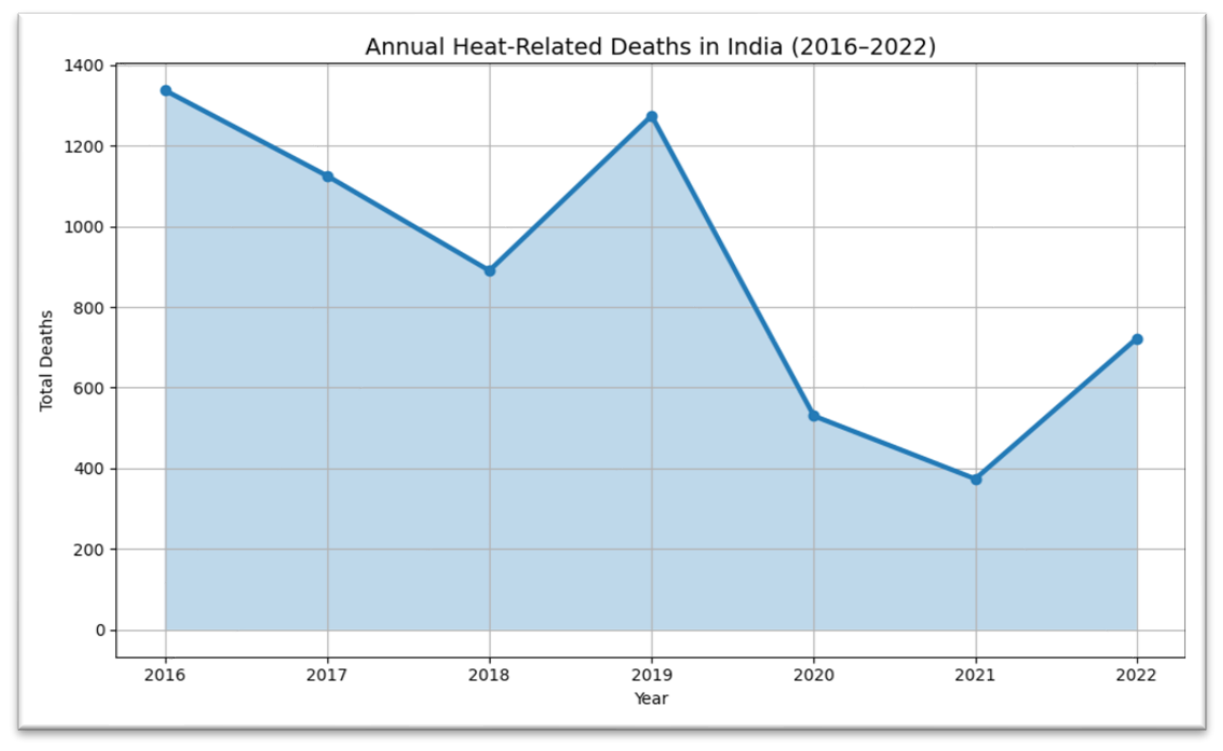
Figure 15.
Annual UV Index spatial variation (2001, 2006, 2011, 2015).
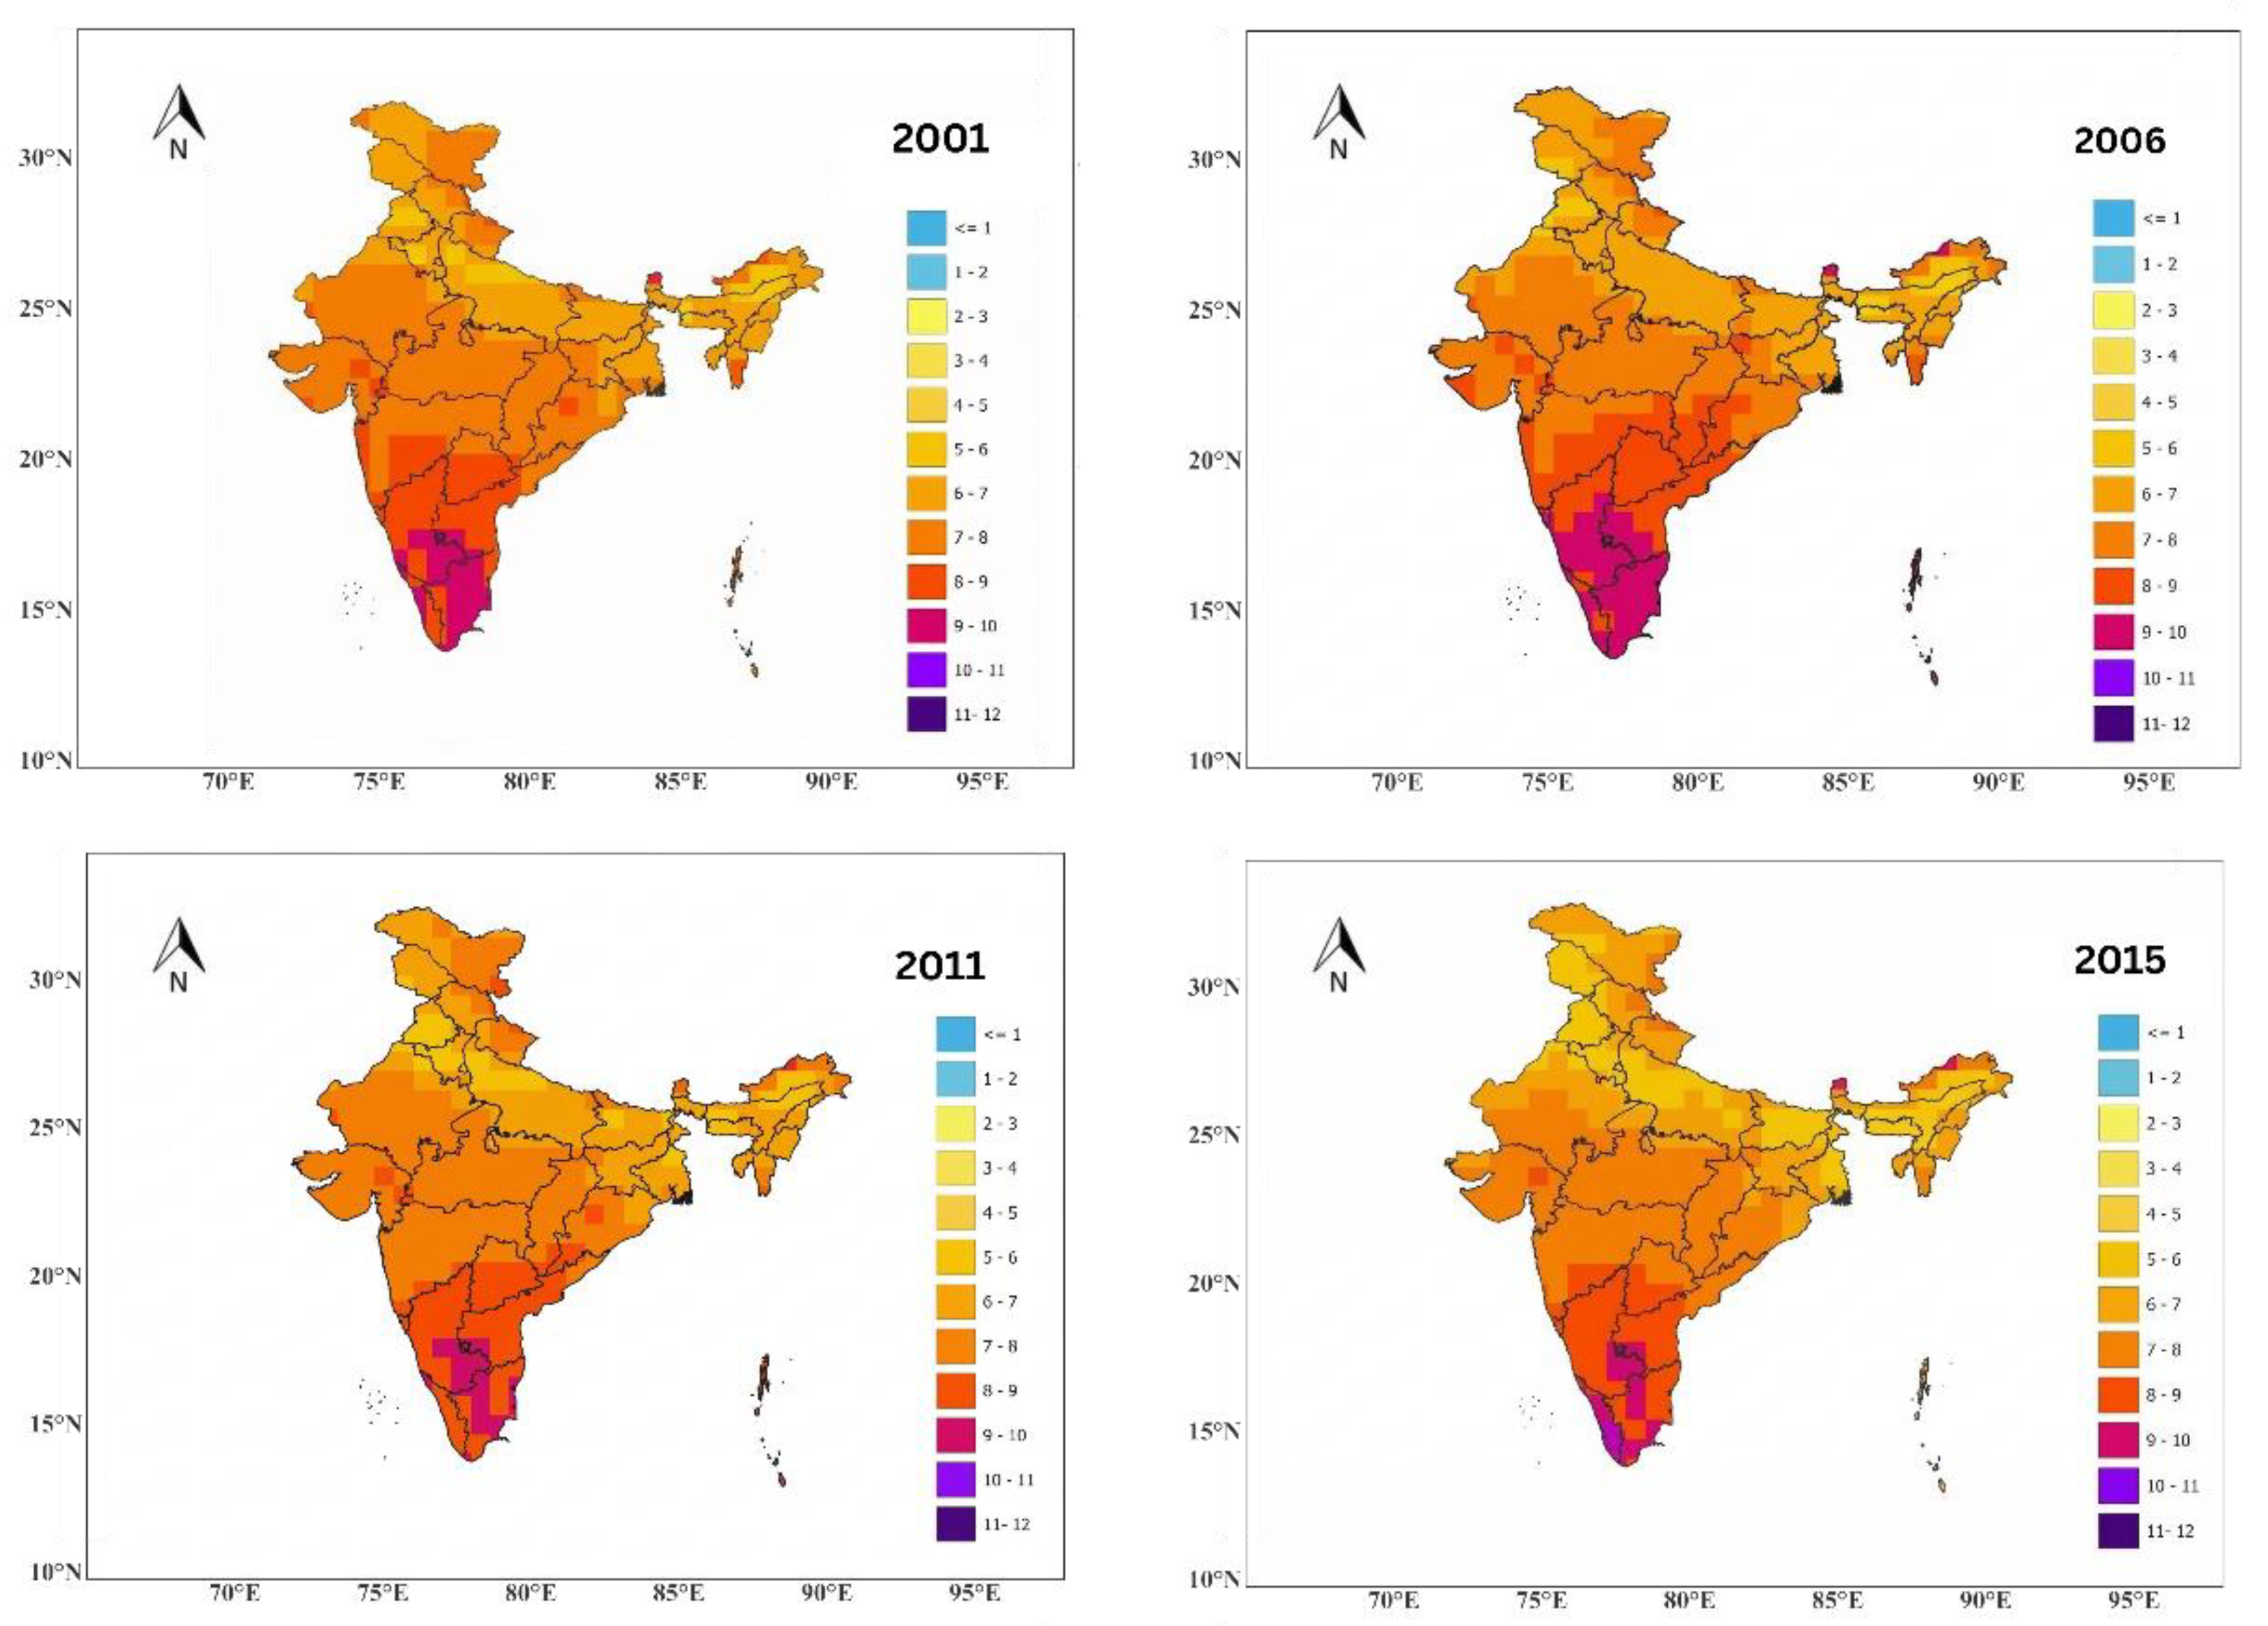
Figure 16.
Annual UV Index spatial variation (2018, 2019, 2020, 2021).
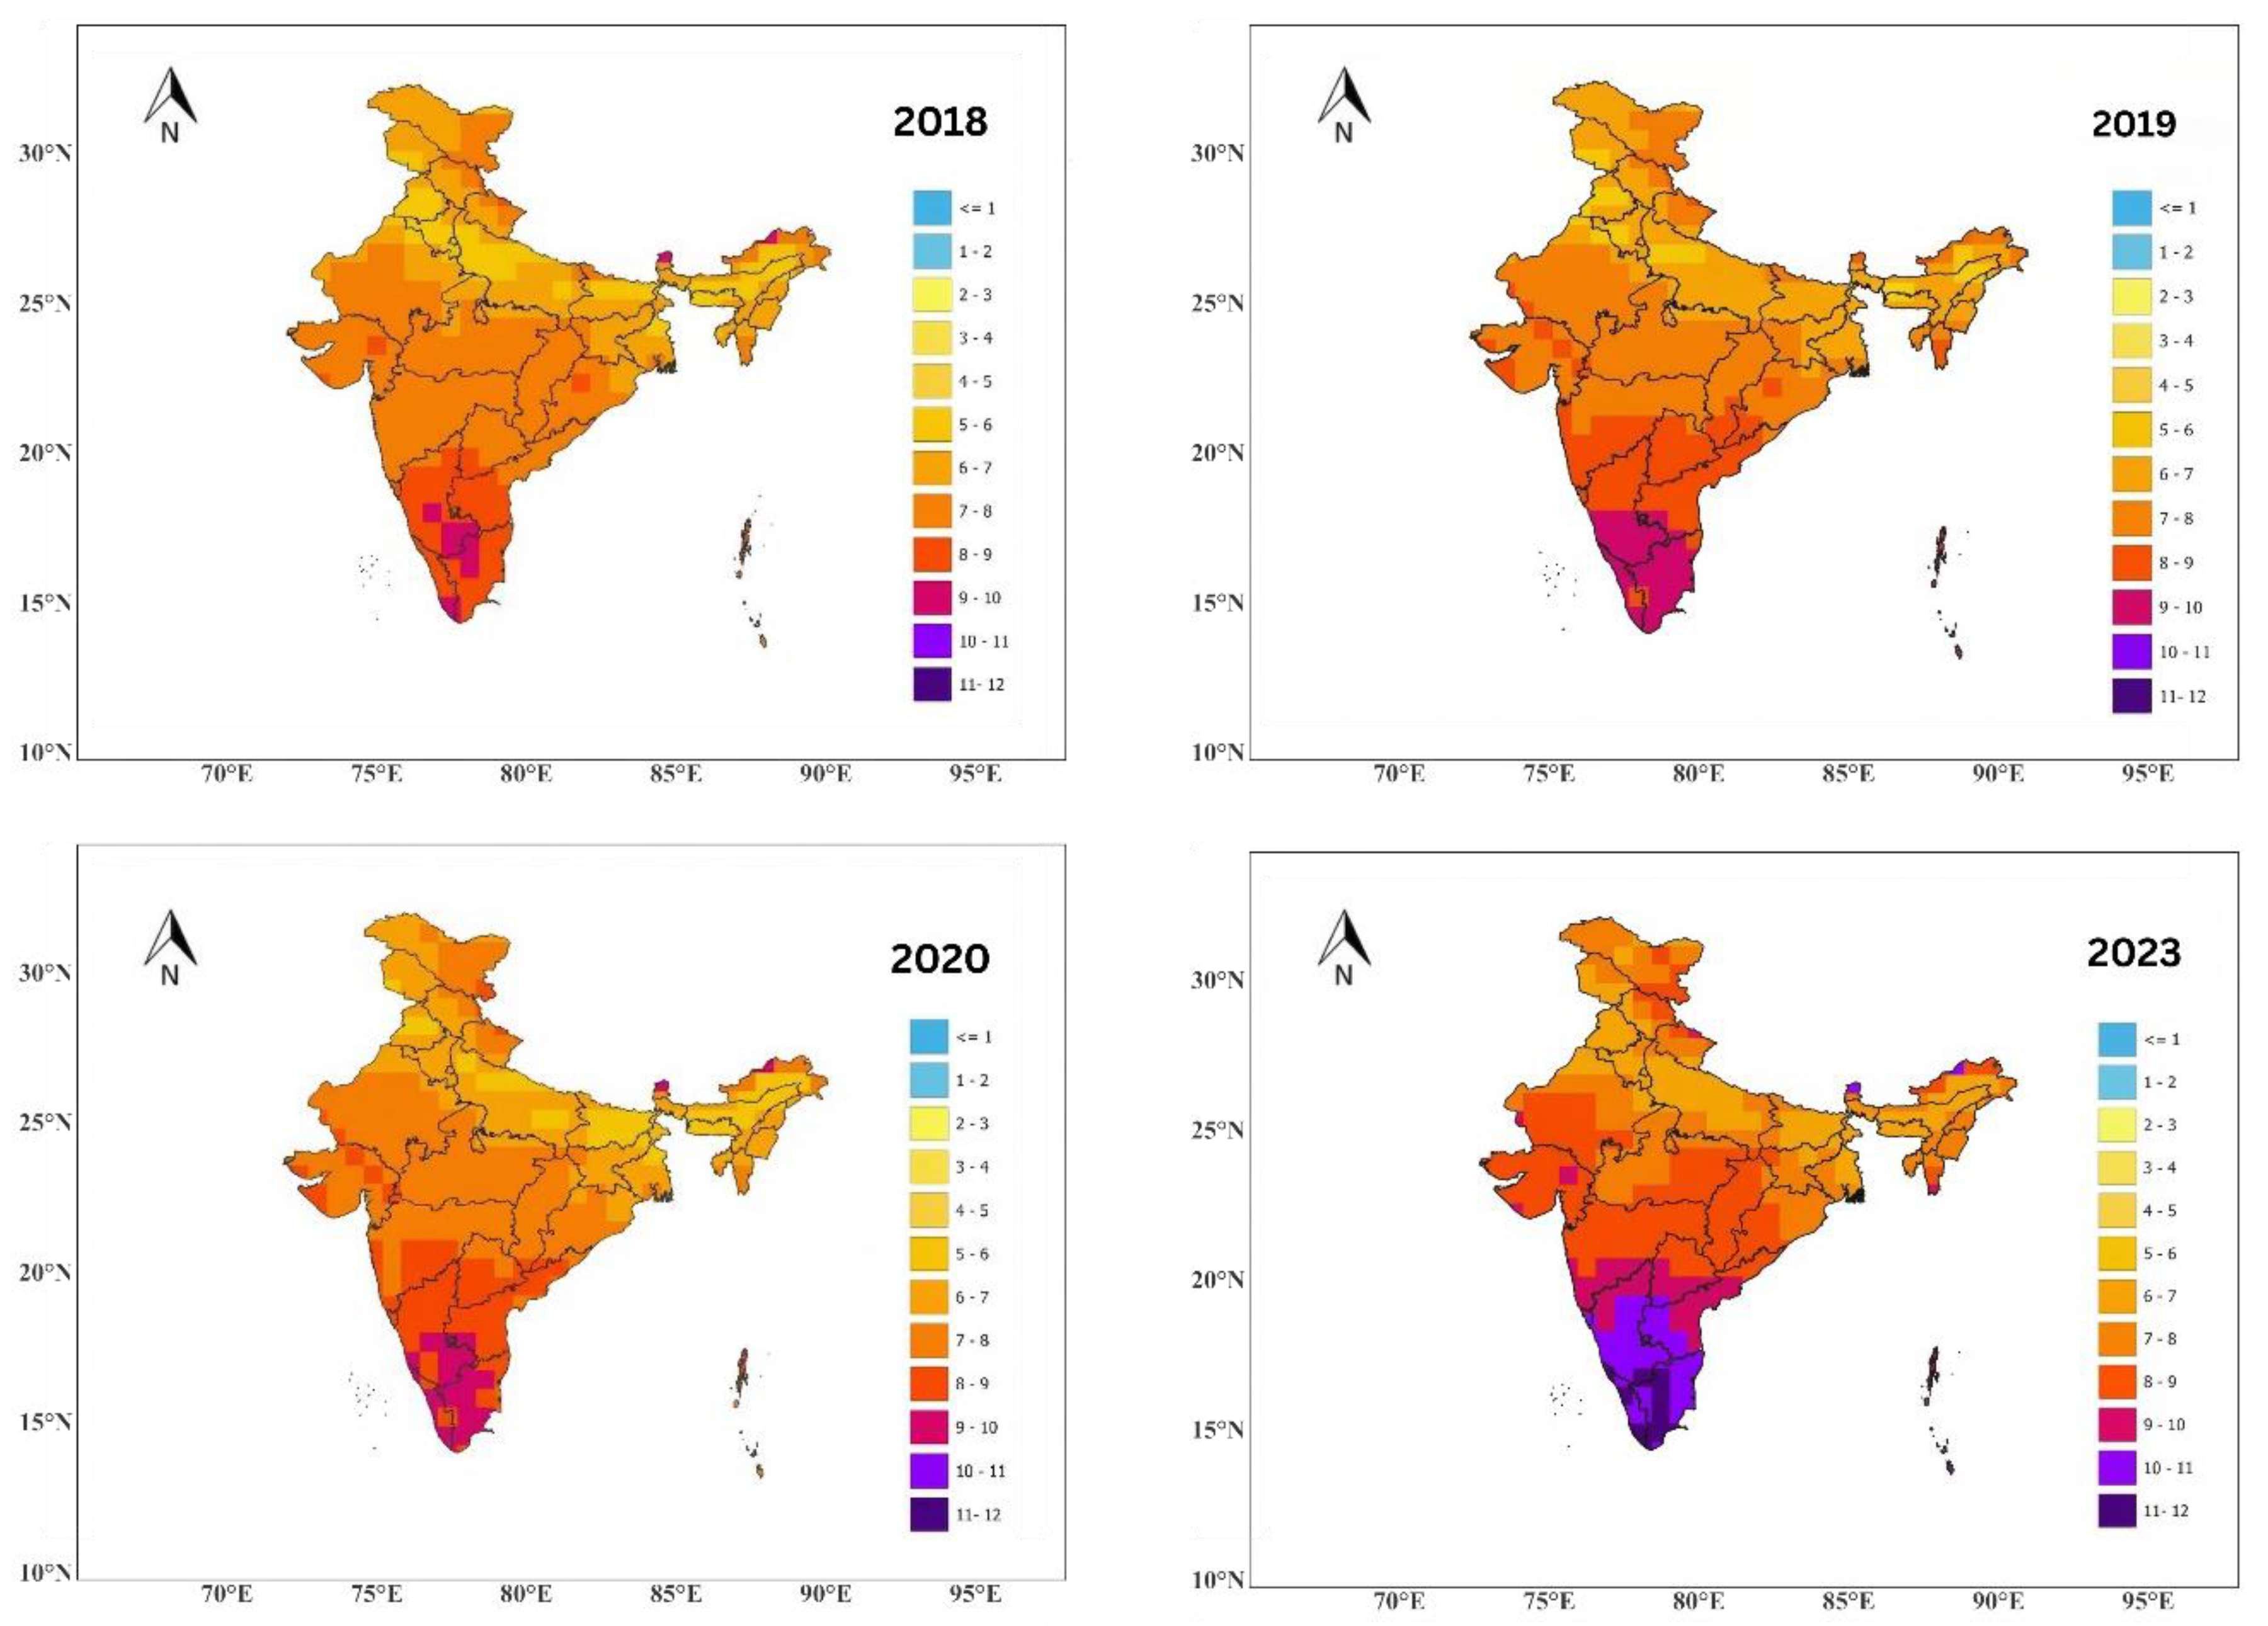
Figure 17.
UV trend significance (Sen’s slope).
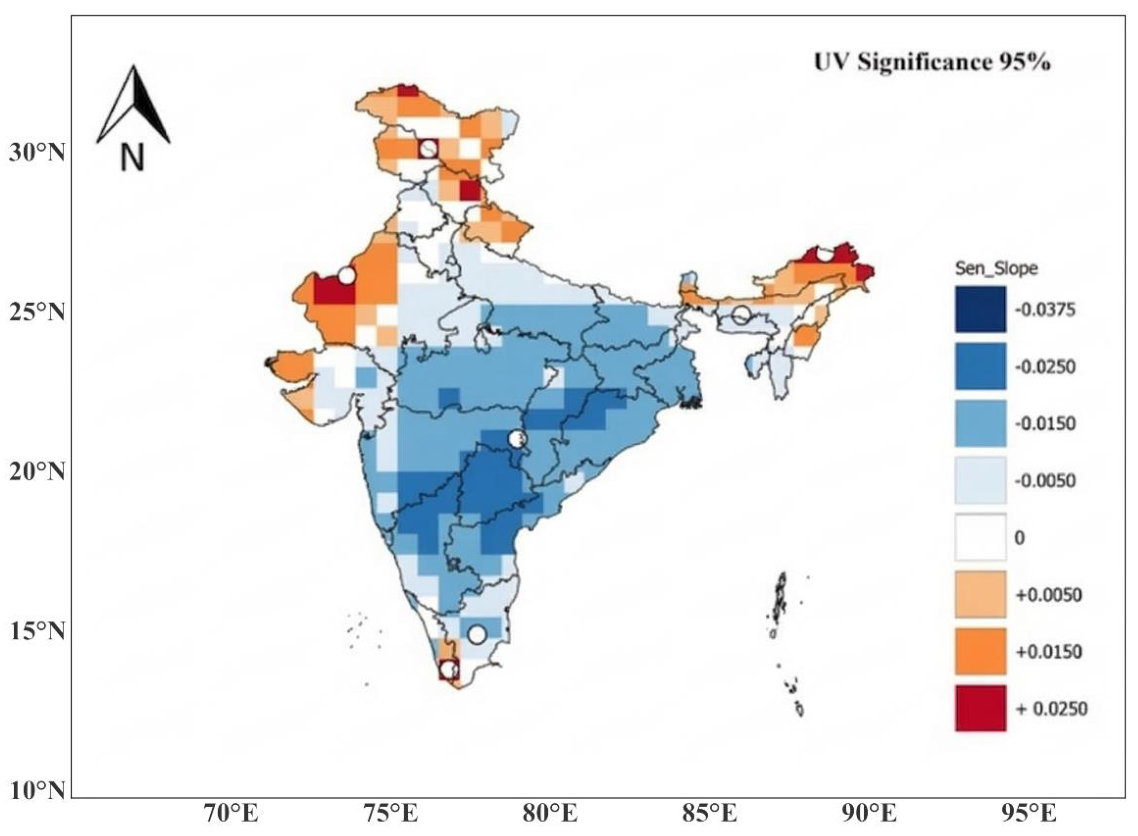
Figure 18.
Average UV index (2016–2018).
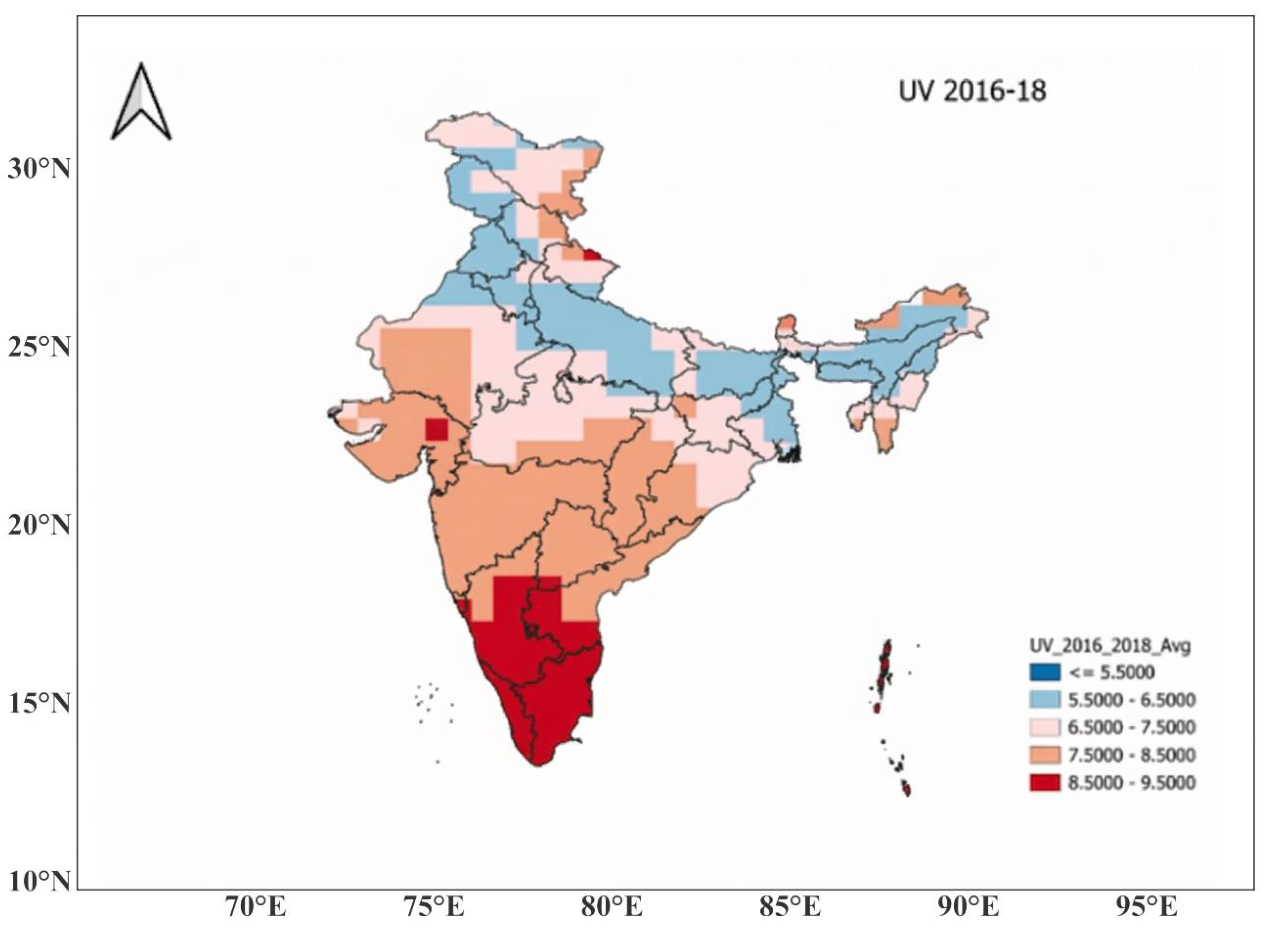
Figure 19.
Vitamin D deficiency by age groups.
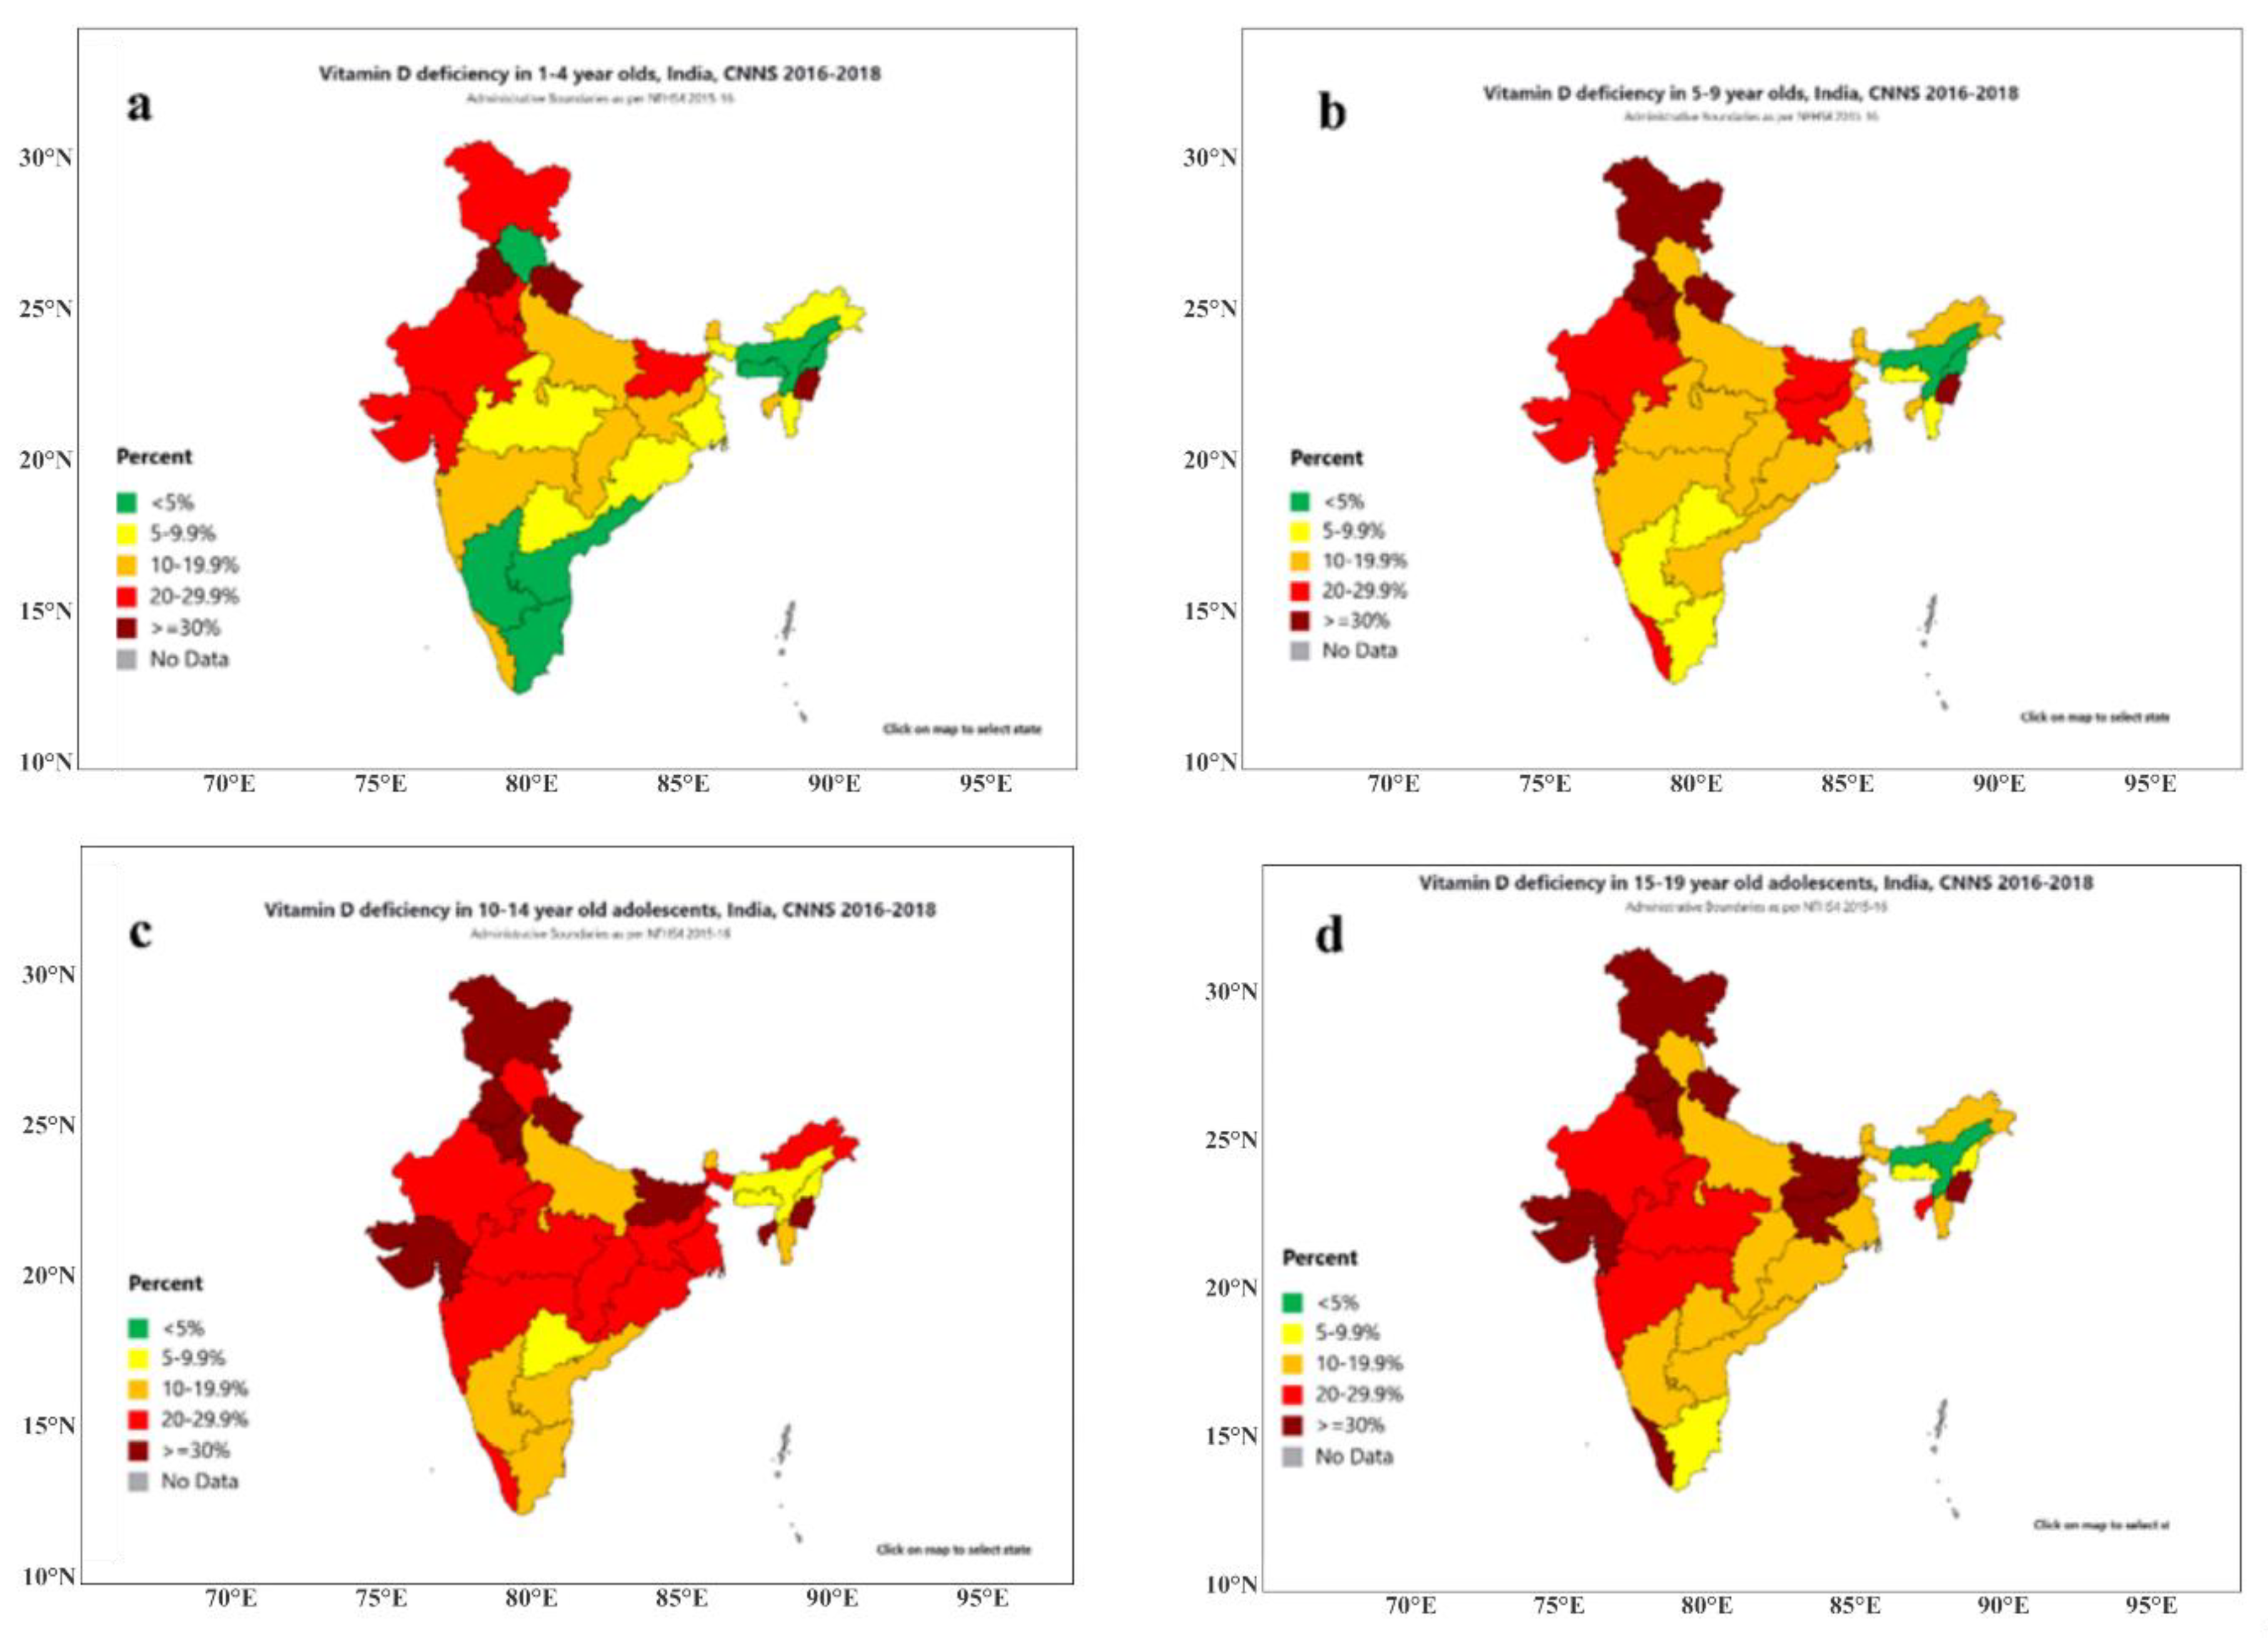
Figure 20.
Diurnal variation of average UV index.
Disclaimer/Publisher’s Note: The statements, opinions and data contained in all publications are solely those of the individual author(s) and contributor(s) and not of MDPI and/or the editor(s). MDPI and/or the editor(s) disclaim responsibility for any injury to people or property resulting from any ideas, methods, instructions or products referred to in the content. |
© 2026 by the authors. Licensee MDPI, Basel, Switzerland. This article is an open access article distributed under the terms and conditions of the Creative Commons Attribution (CC BY) license (http://creativecommons.org/licenses/by/4.0/).
Copyright: This open access article is published under a Creative Commons CC BY 4.0 license, which permit the free download, distribution, and reuse, provided that the author and preprint are cited in any reuse.


