

Submitted:
15 June 2026
Posted:
17 June 2026
You are already at the latest version
Abstract
Conventional Kansei Engineering (KE) models treat morphological components as equally weighted predictors of affective response, implicitly assuming that fixation volume indexes perceptual significance. This study proposes an attention-weighted KE framework integrating AOI-based eye-tracking evidence into morphological variable weighting prior to form–emotion modelling. Ten Ming-style chair samples were encoded into 30 binary morphological parameters; affective ratings were collected via semantic differential survey (N = 389) and element-level fixation distributions via eye-tracking (N = 30), from which coefficient-of-variation-derived weights were assigned. A critical dissociation emerged: the backrest dominated fixation (50.01%) yet received the lowest perceptual weight, while the head-rail and front arm support received the highest — demonstrating that fixation dominance and perceptual weighting are decoupled constructs. Attention-weighted models achieved 83.3% predictive consistency across five of six Kansei dimensions (p > .05). Findings offer a quantitative method for integrating visual attention into KE modelling, with implications for perception-informed design.
Keywords:
eye-tracking
; visual attention
; Kansei Engineering
; form–emotion
; Ming-style chairs
1. Introduction
Understanding how product form evokes affective responses is a central concern in design research, as product experience depends not only on function but also on perception, meaning attribution, and emotional appraisal [1], [2]. Kansei Engineering (KE) has become a widely used framework for this purpose, converting subjective affective impressions into analysable design parameters and supporting evidence-based form development [3], [4].
A fundamental assumption underlying conventional KE, however, is that the affective significance of a morphological feature can be inferred from its formal presence once identified and coded [5], [6]. This assumption rests on subjective methods—primarily semantic differential scales and questionnaire ratings—which capture explicit affective judgements but provide no direct evidence about how formal information is selected and weighted during perception [7]. If viewers do not attend equally to all coded features, then treating formal presence as a proxy for perceptual salience introduces a systematic confound into form–emotion modelling.
Eye-tracking research provides direct evidence that this confound is real. Visual attention is distributed selectively across product components, and gaze measures including fixation duration and fixation count correlate significantly with evaluative response [8], [9]. These findings imply that affective judgement is shaped not only by which form cues are present, but by which receive perceptual priority. Ignoring this distinction means that conventional KE models may misrepresent the relative contribution of individual morphological features to affective evaluation.
Ming-style chairs offer a theoretically well-suited context in which to examine this problem. Unlike many products whose appeal depends on colour, surface ornament, or material novelty, the visual character of Ming-style chairs is defined almost entirely by proportion, restraint, and the spatial organisation of structural components [10], [11], [12]. Because affective variation in this product category must be explained through form, the question of which structural components actually attract visual attention [13]—and whether attention predicts affective evaluation—is especially consequential. Prior studies confirm that evaluation of Ming-style chairs is closely associated with responses to specific structural elements [14], yet whether these elements receive comparable perceptual attention remains unexamined.
This gap points to a broader methodological limitation in KE research [15]. Although attention data can in principle provide objective weights for morphological variables based on visual-cognitive evidence rather than subjective ratings alone [16], such evidence has rarely been incorporated systematically into KE analysis. The present study addresses this limitation by integrating KE with AOI-based eye-tracking within an attention-weighted modelling framework grounded in Feature Integration Theory (FIT). FIT holds that visual features are registered pre-attentively in parallel before being selectively integrated into coherent object representations [17], providing a theoretical basis for treating fixation-derived evidence as an index of perceptual weighting. Against this background, the study pursues three related objectives: to characterise how visual attention is distributed across structural components of Ming-style chairs; to examine how attention-derived weights relate to affective evaluation; and to assess how incorporating such weights alters the representation of form–emotion relationships relative to conventional KE.
2. Literature Review
2.1. Limits of Morphological Coding in Form–Emotion Research
Product form is understood in design research not simply as physical configuration, but as a perceptual stimulus that shapes evaluative and affective responses [18], [19]. Based on this premise, Kansei Engineering (KE) has been widely used to model form–emotion relationships by translating users’ implicit affective perceptions into measurable design variables that can inform design decisions [20], [21]. In furniture research, this approach has proved useful for linking formal variation to perceptual evaluation [22], [23], [24], [25].
However, once morphological attributes are identified and coded, KE generally treats them as if their evaluative relevance follows directly from formal presence. This assumption is less appropriate for artefacts whose meaning depends on relations among multiple components rather than isolated features [26]. Ming-style chairs illustrate this limitation clearly. Their aesthetic character is expressed through the organised relation among the head-rail, backrest, armrests, seat, and supporting members, where proportion, structural order, and compositional harmony operate at the level of overall configuration rather than single features [27], [28].
The significance of this limitation becomes clearer when considered from the perspective of perceptual theory. Feature Integration Theory argues that visual perception depends not only on the registration of discrete features, but also on attention-guided integration into coherent object representations [29], [30]. Eye-tracking studies in furniture research support this view by showing that different components attract attention to different degrees and in different sequences [14], [31], [32], [33]. Studies of seating forms further show that structural and decorative regions tend to dominate viewing patterns [34], [35], while research on Ming-style furniture indicates that attention concentrates on major compositional regions and that aesthetic judgement depends on whole-form integration rather than local feature accumulation [30], [36].
Taken together, these studies suggest that coded morphological variables should not be assumed to contribute equally at the perceptual level. In the context of Ming-style chairs, this makes it necessary to first clarify how visual attention is distributed across morphological elements before their role in affective evaluation is inferred.
RQ1. How are visual attention and CV-derived attention weights distributed across the morphological elements of Ming-style chairs?
2.2. Visual Attention and Differential Perceptual Weighting
If morphological elements do not enter perception equally, a further issue concerns whether such perceptual differences are associated with affective evaluation. Visual attention provides process-based evidence for this possibility because fixation-related measures indicate which components are prioritised during viewing [37]. This issue is especially important in chair perception, where multiple structural elements carry differentiated visual and semantic roles [14], [38], [39].
Existing eye-tracking studies on Chinese-style furniture consistently show that attention is distributed selectively across components rather than uniformly across the whole form [40]. Backrests, armrests, bases, and decorative regions repeatedly emerge as high-attention areas, indicating that some attributes have greater perceptual salience in style recognition and aesthetic appraisal [41]. Accordingly, fixation latency, fixation count, revisit frequency, and dwell time can be treated as behavioural indicators of differential perceptual weighting across morphological attributes [42].
At the same time, selective attention does not map directly onto affective judgement. Whole-form evaluation depends on the integration of attended components rather than on the isolated contribution of single features. In South official chairs, overall form cognition has been shown to exceed the summed contribution of individual features, indicating that evaluative meaning is reorganised at the level of the integrated form [43]. Similarly, although carved backrests attract dense fixation patterns, their evaluative relevance depends on their role within the broader compositional structure rather than on ornament intensity alone [44]. Related studies further suggest that different attributes may enter evaluation through different attentional routes, with material eliciting deeper fixation-based processing and decoration exerting stronger influence on visual search organisation [45], [46].
The literature therefore supports two linked propositions: morphological attributes differ in perceptual salience, and affective judgement depends on how attended components are integrated at the whole-form level. What remains insufficiently specified is whether these attention-based differences can be translated into analytically meaningful weights for explaining affective evaluation. This unresolved point gives rise to the second research question:
RQ2. What relationships can be identified between attention-weighted morphological attributes and affective evaluation across the selected Kansei dimensions?
2.3. Attention-Weighted Modelling in Kansei Engineering
Given the relevance of attention-based differences to affective evaluation, the remaining issue is methodological in nature. The principal limitation of conventional KE in this context lies not in morphological decomposition itself, but in the equal status assigned to coded variables once they enter the model [47], [48]. For Ming-style chairs, whose formal meaning is distributed across coordinated structural components rather than isolated motifs, this assumption weakens the correspondence between encoded morphology and actual perceptual processing [49], [50].
Recent studies on Ming-style chairs have developed relatively systematic KE procedures for perceptual-word extraction, morphological decomposition, and form–image mapping, yet variable priority is still typically determined through expert judgement, requirement-level weighting, or formal statistical association [30], [51]. As a result, these models capture coded form variables, but not necessarily the components that dominate perceptual processing. Eye-tracking evidence makes this limitation explicit by showing that fixations converge on a restricted set of structurally salient regions, especially the backrest and upper structural components, while other encoded features receive much less attention [14], [16], [32]. Quantitative weighting studies further confirm this asymmetry: when physiological and subjective evidence are combined, the backrest carries the greatest share of weight, followed by the stretcher extension and armrests, whereas the remaining components contribute substantially less [52], [53].
Attention-weighted modelling offers a way to address this problem. Rather than assuming that all coded features contribute equally, attention-derived evidence can be used to assign differential weights to morphological variables before form–emotion modelling. This direction has begun to emerge in product research, where subjective and eye-tracking-assisted physiological weighting are used to derive differentiated component priorities for subsequent form–image modelling [54], [55], [56]. More broadly, eye-tracking-based weighting studies show that feature codes can be converted into weighted parameters prior to model construction, thereby improving the objectivity of model representation [57]. It should be noted, however, that fixation volume and perceptual weight are not equivalent: the coefficient of variation (CV) captures cross-observer variability in fixation allocation rather than fixation magnitude, such that elements attracting consistently high gaze receive lower CV-derived weights than those showing greater inter-observer dispersion [58]. This distinction implies that the element receiving the largest raw fixation share is not necessarily the most analytically influential in a CV-weighted model.
Accordingly, the key unresolved issue is not whether attention is selective, but whether incorporating attention-derived weighting changes the representation and predictive performance of form–emotion models relative to equal-weight coding within a KE framework. This methodological gap motivates the third research question:
RQ3. To what extent does attention-weighted change the representation and predictive performance of form–emotion relationships relative to equal-weight coding within a KE framework?
3. Method
3.1. Research Design
The study adopted a sequential mixed-method design to examine how Ming-style chair form attributes relate to affective evaluation, and how eye-tracking data can inform the representation of those relationships within a Kansei Engineering (KE) framework. The methodological logic followed the Type I KE sequence proposed by Schütte et al. [59] : defining the product domain, spanning the semantic space, spanning the product property space, constructing form–image mappings, and validating the resulting model. Within this structure, the study integrated three linked components — semantic evaluation, eye-tracking measurement, and attention-weighted weights — in a unified empirical pipeline.
The study proceeded in four stages (Figure 1). First, representative Ming-style chair samples and Kansei descriptors were identified through structured multi-stage screening. Second, the selected chair samples were morphologically decomposed into nine primary structural components and encoded as binary form variables. Third, a semantic differential (SD) survey and an eye-tracking experiment were conducted concurrently using the same ten-sample stimulus set, enabling subjective Kansei ratings and objective gaze data to be captured within a shared measurement context. Fourth, eye-tracking-derived attention weights were applied to the morphological variables before stepwise regression modelling and predictive validation. This four-stage sequence aligns the empirical design with the theoretical argument developed in the previous section: because perceptual attention is not uniformly distributed across morphological components, the representational status of those components in KE models should be adjusted accordingly.
3.2. Semantic Space Construction
3.2.1. Kansei Word Collection and Screening
Kansei words — affective descriptors capturing users’ perceptual and emotional responses to product form — were collected from academic literature, furniture market publications, design magazines, and direct user reports elicited through structured interviews. This multi-source approach reflects standard KE practice, which prioritises comprehensive semantic coverage of the target product domain [3]. An initial pool of 132 Chinese adjectives was assembled.
The pool underwent a two-step reduction. First, semantic screening removed synonyms and descriptors with overlapping meaning, yielding 69 representative adjectives. These were then administered in a pilot questionnaire to five participants (three with design training, two without) to assess clarity and cognitive burden; 34 adjectives were retained. A formal screening survey was subsequently completed by 62 Generation Y participants in Shenzhen. Descriptors selected by more than one-third of respondents were retained for dimensional analysis. This process is shown in Figure 2.
3.2.2. Kansei Word Dimensional Reduction
Retained Kansei words were subjected to a two-stage dimensionality reduction. Participants rated perceived similarity between all word pairs using a five-point scale, producing a symmetric similarity matrix. Multidimensional scaling (MDS) was applied to this matrix to map semantic proximity onto a low-dimensional coordinate space; model adequacy was assessed using stress and RSQ statistics [60]. Ward’s hierarchical clustering was then performed on the MDS coordinates, and the resulting dendrogram was examined alongside agglomeration coefficients to determine a stable cluster solution. K-means clustering was subsequently applied to optimise cluster membership using the predetermined cluster number. From each cluster, the word pair closest to its centroid was selected as the representative Kansei dimension.
This procedure yielded six bipolar Kansei dimensions (Table 1): Traditional–Fashionable, Practical–Decorative, Unique–Ordinary, Concise–Complicated, Natural–Artificial, and Graceful–Clumsy. These six dimensions constituted the semantic basis for both the questionnaire survey and the eye-tracking experiment.
3.3. Stimuli and Morphological Coding
3.3.1. Sample Collection and Selection
The product domain encompassed all major Ming-style chair types: round-backed chairs, hanging-lamp chairs, Northern and Southern official-hat chairs, rose chairs, Zen chairs, and folding armchairs. Representative samples were collected from academic literature, museum websites, art archives, antique furniture stores, and auction databases. After redundancy screening, 159 candidate images were retained, each standardised to a 45° viewing perspective.
To reduce this set to an experimentally manageable size, a structured expert panel of ten specialists (six furniture designers and four academic researchers in furniture design; combined experience range: 13–44 years) conducted an affinity diagramming (KJ method) session (Table 2). Experts independently categorised all images into morphologically coherent groups and identified the most representative sample within each group. This procedure produced a final set of ten Ming-style chair samples spanning the five major formal categories.
3.3.2. Image Standardisation
All stimuli were processed in Adobe Photoshop using an identical standardisation pipeline. Background and shadow pixels were removed, each chair was centred within the frame, images were converted to greyscale (saturation = −100) to eliminate colour-driven perceptual effects, and logos were removed. Output files were standardised to 30 cm × 35 cm at 300 PPI on a white background, preserving morphological form as the primary source of visual variation (Figure 3).
3.3.3. Morphological Coding
Each chair was decomposed into nine primary structural elements using mathematical morphological analysis [61]: head-rail (Xa), armrest body (Xb), front arm support (Xc), central arm support (Xd), backrest (Xe), seat (Xf), seat–leg transition (Xg), stretcher (Xh), and legs (Xi) (Table 3). The number of morphological types within each element ranged from two to six (Table 3). Each morphological category was encoded as a binary variable (1 = present, 0 = absent), producing a 30-parameter form vector per chair (Table 4).
3.4. Kansei Evaluation Survey
3.4.1. Participants
The target population was Generation Y consumers (aged 25–44) in Shenzhen, China. Based on the finite-population proportion formula with a conservative maximum-variability estimate (p = 0.5, confidence level = 95%, margin of error = 5%), the minimum required sample was 384 valid responses; a target of 403 was set to allow for quality-control attrition. The survey was administered online via the Credamo platform, restricted to four economically developed districts (Nanshan, Futian, Bao’an, and Longgang) with inclusion criteria of: (1) continuous six-month residence, (2) familiarity with Ming-style furniture, and (3) residential addresses at least 1 km apart to prevent neighbourhood clustering (Table 5).
3.4.2. Procedure and Instrument
A pilot survey (n = 30) was conducted to verify item clarity and internal consistency. In the main survey, participants viewed each of the ten standardised chair images and rated it on the six bipolar Kansei dimensions using a five-point SD scale [62], with -2 anchored at the left pole and 2 at the right pole. Stimuli were presented in randomised order. Mean SD scores per chair per dimension constituted the dependent variable in subsequent regression modelling.
3.5. Eye-Tracking Experiment
3.5.1. Participants
Forty-eight individuals were recruited through online postings and word-of-mouth referral. After calibration and technical screening, 30 participants were retained for analysis; 8 were excluded due to failed calibration caused by contact lens reflections or uncorrected astigmatism. The final sample comprised 17 males and 13 females aged 25–44 years (M = 32.7), including 15 design professionals and 15 non-professionals (Table 6). All participants had normal or corrected-to-normal vision with no colour deficiencies. Written informed consent was obtained before participation (Figure 4), and each participant received RMB 20 on completion.
3.5.2. Apparatus and Environment
Gaze data were recorded using a Tobii Pro Glasses 2 head-mounted eye tracker (sampling rate: 50 Hz; gaze accuracy: ~0.5° visual angle; system latency: <35 ms), connected to Tobii Pro Glasses Controller and Tobii Pro Lab for data acquisition and AOI-based analysis. Stimuli were displayed on a 25-inch monitor (16:9) under uniform LED lighting in a controlled laboratory at Wuyi University. Participants were seated 40–90 cm from the display; curtains were drawn to exclude external light; only one participant was present per session (Figure 5)
3.5.3. Experimental Procedure
Each participant was first assisted by a researcher in fitting the Tobii Pro Glasses 2 head-mounted eye tracker; participants were instructed to remain relaxed and to refrain from adjusting the device once positioned (Figure 3). Following device installation, a manufacturer calibration procedure was conducted, after which a pilot verification trial confirmed gaze stability (tolerance: ≤3 mm drift on the display surface). Participants then completed 2–3 practice trials to familiarise themselves with the sequential structure of the image-viewing procedure, and were encouraged to raise any questions before proceeding to the formal experiment; practice data were excluded from all analyses. Once the researcher confirmed that device status and calibration results met the required standard, participants reviewed the on-screen experimental instructions and clicked the “Start Experiment” button to enter the formal phase.
The formal experiment adopted a structured trial-based paradigm [63], [64]. Each trial comprised four sequential stages (Figure 6): an instruction screen, which participants reviewed and confirmed by clicking to proceed, followed by a 2-second transition into the trial; an 8-second stimulus presentation, in which a standardised greyscale chair image was displayed on a 25-inch monitor with gaze recorded continuously at 50 Hz; a semantic evaluation stage of unconstrained duration, in which participants rated the preceding stimulus across the six Kansei dimensions using a 5-point semantic differential scale (−2 to +2); and a 3-second blank screen buffer to attenuate visual carryover effects before the next trial began. This four-stage sequence was repeated for each stimulus, with the presentation order of chair images fully randomised across participants to control for order and fatigue effects.
3.5.4. AOI Definition and Gaze Measures
Nine Areas of Interest (AOIs) were delineated in Tobii Pro Lab for each of the ten chair stimuli, corresponding directly to the nine morphological elements in the coding scheme (Xa–Xi). AOI boundaries were drawn individually for each image to accommodate morphological variation across samples [65]. This element-level alignment ensures that the perceptual data and the formal coding system operate at the same analytical granularity (Figure 7; Figure 8).
3.6. Data Analysis and Model Development
3.6.1. Kansei Word Dimensionality Reduction
Kansei word data were reduced through the four-stage procedure described in Section 3.2.2: frequency screening (retention threshold: selection of items with>1/3 of respondents), similarity matrix construction, MDS analysis, and two-stage Ward’s/K-means clustering. The final six representative bipolar dimensions (Table 1) formed the semantic basis for all subsequent modelling. All analyses were conducted in SPSS 26.0.
3.6.2. Form Attribute Parameterisation
Each chair sample was represented as a binary parameter vector based on the coding scheme in Table 4. The encoding rule was:

This produced a structured form matrix (10 samples × 30 binary parameters) for subsequent modelling.
3.6.3. Eye-Tracking Weighting of Morphological Parameters
The coefficient of variation (CV) method was used to derive a perceptual salience weight for each of the nine morphological elements from the AOI fixation data, following. For element i, the CV is defined as:
where is the standard deviation and is the mean of total fixation duration across participants and stimuli. A higher CV indicates greater relative dispersion in fixation allocation, reflecting greater perceptual variability in how observers engage with that element. Raw CV values were normalised to sum to unity:
The attention weight was then applied to the corresponding binary morphological parameters:
This transformation reflects the core representational logic of the study: morphological variables carry a weight proportional to the perceptual salience of their parent element, rather than being treated as equivalent predictors.
3.6.4. Stepwise Regression Modelling
For each of the six Kansei dimensions (K1–K6), a stepwise multiple regression model was constructed with the mean SD score as the dependent variable and the attention-weighted parameters as predictors:
Stepwise entry was selected to identify parsimonious predictor sets from the large number of morphological variables (30 binary parameters, 10 observations). Model adequacy was assessed using R2 and adjusted R2, the overall F-statistic, VIF values for multicollinearity (threshold: VIF < 10), and the Durbin–Watson statistic for residual independence. Only models meeting all adequacy criteria were retained.
3.6.5. Model Validation
Predictive validity was assessed using five new Ming-style chair samples selected from the high-ranking expert candidates excluded from model development (Figure 9), ensuring independence between the calibration and validation data. The five validation stimuli were processed using the same image standardisation pipeline and subjected to the same SD survey and eye-tracking protocol; more than 30 participants completed the validation procedure (Figure 10).
For each validation sample, morphological parameters were coded and weighted using the procedures in Section 3.6.2 and Section 3.6.3, and the established regression equations were used to generate predicted Kansei scores. Predicted values were compared with observed mean SD ratings using paired-sample t-tests. Non-significant t-statistics (p > 0.05) indicate that model predictions are not statistically distinguishable from observed perceptual judgements, providing evidence of adequate predictive validity [66].
3.6.6. AI Assistance Declaration
During the preparation of this work, the author(s) used ChatGPT (OpenAI) and Claude (Anthropic) to assist in the literature review section. The author(s) independently collected all primary data and constructed a structured literature matrix, which was subsequently submitted to the aforementioned AI tools to facilitate the extraction and thematic summarization of key findings. All data collection, research design, experimental analysis, interpretation of results, and conclusions presented in this article were conducted independently by the author(s) without AI assistance. After using these tools, the author(s) thoroughly reviewed and edited all AI-assisted content and take(s) full responsibility for the accuracy, originality, and integrity of the content of the published article.
4. Results
4.1. Kansei Word Screening and Dimensional Reduction
Kansei word collection yielded an initial pool of 132 Chinese adjectives drawn from academic literature, market publications, design magazines, and structured user interviews. Semantic screening removed synonyms and descriptors with overlapping meaning, reducing the pool to 69 representative adjectives. A pilot questionnaire administered to five participants further narrowed the set to 34 adjectives based on clarity and cognitive burden. Formal frequency screening of these 34 adjectives against responses from 62 Generation Y consumers retained 17 Kansei words, each selected by more than one-third of respondents (Table 8).
Multidimensional scaling of the 17 × 17 pairwise similarity matrix yielded a six-dimensional solution (Stress = 0.014, RSQ = 0.998). K-means clustering on the MDS coordinates identified six stable clusters, with the centroid-nearest word pair selected as the representative bipolar label for each cluster. The six resulting Kansei dimensions were: Traditional–Fashionable (Y1), Practical–Decorative (Y2), Unique–Ordinary (Y3), Concise–Complicated (Y4), Natural–Artificial (Y5), and Graceful–Clumsy (Y6).
4.2. Kansei Evaluation
Mean semantic differential ratings for the ten chair stimuli are reported in Table 9 (N = 389; Cronbach’s α = 0.907). On Y1, eight of ten stimuli scored negatively, indicating dominant traditional associations; E02 (M = 0.16) and E05 (M = 0.36) — both folding chairs — were the only stimuli that shifted toward fashionable. All ten stimuli scored negatively on Y3, confirming consistent unique-character perception across the set. Official-hat chairs B11 and B18 showed the strongest concise associations (Y4 ≈ −0.99), while rose chair D03 received the highest complexity rating (Y4 = 1.24) and the strongest artificial association (Y5 = 1.08). Nine of ten stimuli fell in the graceful direction on Y6, with A18 showing the strongest graceful rating (M = −0.73).
Two-dimensional perceptual maps confirm that chair categories occupied distinct semantic quadrants (Figure 11). On Y1 × Y2, official-hat and Southern official-hat chairs clustered in the Traditional–Practical quadrant, rose chairs in Traditional–Decorative, and folding chairs in Fashionable–Decorative; the Fashionable–Practical quadrant was unoccupied. All stimuli fell in the Unique half of Y3 × Y4; six occupied Unique–Concise and four Unique–Complicated. On Y5 × Y6, nine of ten stimuli occupied Artificial–Graceful, with D03 alone in Artificial–Clumsy.
4.3. Visual Attention Distribution
Total fixation duration per AOI across all ten stimuli is reported in Table 10. AOI-5 (backrest, Xe) dominated fixation allocation, accounting for 50.01% of total fixation time and attracting first fixations as early as 320 ms (D03, E05). AOI-6 (seat, Xf) ranked second at 15.59%, followed by AOI-7 (seat–leg transition, 9.12%) and AOI-9 (legs, 7.70%). AOI-4 (central arm support) received the lowest aggregate fixation share (2.39%), and AOI-8 (stretcher) remained below 5% for every stimulus.
Heat maps (Figure 12) revealed three fixation density patterns within AOI-5: concentrated (red-zone intensity, 15–40% of backrest area: A24, D03, C09), characteristic of stimuli with focal carved motifs; distributed (yellow-green coverage spanning 50–70%: A18, C18, E02, B18), characteristic of structurally uniform backrests; and hierarchical (multiple discrete density tiers: A24, C09). AOI-8 and AOI-9 showed the lowest density (blue-green) across all stimuli. Gaze plots (Figure 13) showed the proportion of fixations in AOI-5 ranging from 35–45% (E05, D04) to 70–80% (B18, D03). Cross-participant fixation convergence was strongest in AOI-5 for stimuli with central carved motifs (D03, A18, B18).
4.4. Attention-Derived Element Weights
Normalised attention weights (w_bi) derived from the coefficient of variation of total fixation duration per AOI are reported in Table 11. Despite accounting for 50.01% of total fixation time, AOI-5 (backrest, Xe) received the lowest attention weight (w = 0.042), reflecting the highest fixation consistency across observers (V̄ = 0.184). By contrast, AOI-1 (head-rail, Xa; w = 0.192) and AOI-3 (front arm support, Xc; w = 0.163) received the highest weights, indicating that fixation allocation to these elements varied most across observers. AOI-6 (seat, Xf; w = 0.064) showed notable perceptual weight relative to its raw fixation share.
4.5. Ming-Style Chair Form Attributes Coding Based on Eye Movement Weighting
The process involves assigning weights to the parameters of the form attributes of Ming-style chairs, based on their visual cognition weights. Using formula (4), the weighted parameter of each morphological feature was obtained by integrating its categorical indicator with the corresponding visual cognition weight. This operation adjusts the raw parameters according to their perceptual importance, resulting in the weighted form attributes parameters for each sample, as presented in Table 12.
4.6. Form–Emotion Modelling: Stepwise Regression
Six regression models were established for the six Kansei dimensions using the attention-weighted morphological parameters as predictors. The final regression equations and model statistics are presented in Table 13.
Overall, five models achieved high explanatory power (R2 > .814, p < .001). Among all predictors, the pierced backrest feature (Xec) appeared most frequently, contributing to four emotional dimensions (Y2–Y5). In contrast, some dimensions were dominated by highly specific structural variables, such as the X-shaped leg configuration (Xi2) in the Traditional–Fashionable dimension.
4.6.1. Traditional–Fashionable (Y1)
The Y1 model was statistically significant (R2 = .814, p < .001). The X-shaped leg configuration (Xi2) was the only significant predictor and positively influenced fashionable perception. This result suggests that folding-chair-derived leg structures contributed strongly to contemporary visual impressions.
4.6.2. Practical–Decorative (Y2)
The Y2 model demonstrated the highest explanatory power among all dimensions (R2 = .992, p < .001). Sickle-shaped (Xdb) and turned-spindle (Xda) central arm supports negatively influenced decorative perception, whereas pierced backrest (Xec) and non-protruding head-rail (Xab) positively influenced decorative perception.
These findings indicate that decorative impressions were associated with visually articulated backrest and head-rail treatments, while exposed structural support elements were more strongly related to practical perception.
4.6.3. Unique–Ordinary (Y3)
The Y3 model explained 53.4% of the variance (R2 = .534, p = .016). Pierced backrest (Xec) was the only retained predictor and negatively predicted ordinary perception, indicating that perforated backrest structures enhanced perceived uniqueness.
Compared with the other dimensions, the explanatory performance of Y3 was relatively lower. In addition, the low Durbin–Watson value suggests potential residual dependence; therefore, this model should be interpreted cautiously.
4.6.4. Concise–Complicated (Y4)
The Y4 model showed high explanatory performance (R2 = .975, p < .001). Straight head-rail geometry (Xa1), pierced backrest (Xec), and curved armrest body (Xb2) positively contributed to complicated perception, whereas rectangular seat structure (Xf1) reduced perceived complexity.
The results suggest that visual richness and geometric variation increased perceived complexity, while simplified seat geometry enhanced concise impressions.
4.6.5. Natural–Artificial (Y5)
The Y5 model was statistically significant (R2 = .956, p < .001). Pierced backrest (Xec) and straight head-rail geometry (Xa1) increased artificial perception, whereas step-by-step rising stretcher (Xh2) contributed to natural perception.
This finding indicates that regularised geometric structures were associated with artificial impressions, while progressive structural transitions conveyed greater naturalness.
4.6.6. Graceful–Clumsy (Y6)
The Y6 model explained 94.5% of the variance (R2 = .945, p < .001). Plain front arm support (Xca) was the strongest predictor of graceful perception, followed by carved seat–leg transition (Xgb).
The results suggest that graceful impressions were closely related to smooth structural continuity and visually coherent transition treatment.
Overall, the regression results demonstrate that emotional perceptions of Ming-style chairs can be effectively predicted using attention-weighted morphological features. Structural geometry, backrest treatment, and transition details emerged as the most influential form attributes across the six Kansei dimensions.
4.7. Model Validation
4.7.1. Model-Calculated and Observed Kansei Scores
Model-calculated values (Ycv) and observed subjective evaluation values (Ysv) for the five validation chairs (A04, B10, C14, D01, E03) are presented in Table 14. Ycv was derived from the six regression equations in Table 13; Ysv represents mean semantic differential ratings on the five-point bipolar scale (−2 to +2).
4.7.2. Paired-Sample t-Test Results
Table 15 presents paired-sample t-test results (df = 4) comparing Ycv with Ysv for each Kansei dimension.
Pair 1 (Y1cv − Y1sv) was the only pair to reach significance (t(4) = 5.176, p = .007, M = 0.348, SD = 0.150, 95% CI [0.161, 0.535]). The positive mean difference and CI entirely above zero indicate that the model systematically overestimated traditionality–fashionability ratings. The remaining five dimensions showed no significant discrepancy (Y2–Y6: all p > .05, all 95% CIs crossing zero): Y2 (t(4) = 0.506, p = .639), Y3 (t(4) = 0.922, p = .409), Y4 (t(4) = 0.311, p = .771), Y5 (t(4) = −1.001, p = .373), Y6 (t(4) = 1.024, p = .364). Inter-pair variability was considerable, with Y2 exhibiting the widest spread (SD = 0.857) and Y5 the narrowest (SD = 0.228).
Adequate predictive consistency between model scores and observed evaluations was achieved in five of six Kansei dimensions (83.3%), as indicated by non-significant paired-sample t-tests (p > .05) across 30 comparisons (5 chairs × 6 dimensions). The one exception was Y1 (Traditional–Fashionable), which showed a systematic overestimation of fashionability ratings and should be interpreted with caution.
5. Discussion
5.1. Uneven Visual Attention and the Distinction Between Fixation Dominance and CV-Derived Weight
The results show that visual attention was not evenly distributed across the nine chair elements. The backrest (Xe) received 50.01% of total fixation duration, followed by the seat (Xf, 15.59%), the seat–leg transition (Xg, 9.12%), and the legs (Xi, 7.70%). This pattern is consistent with earlier eye-tracking studies on Ming-style chairs and related forms. Jia & Niu [67]reported that gaze concentration was highest in the backrest region, while Liu et al. [68] found that the backrest, base, and armrests were the main guiding elements in style cognition. Niu & Huang [32] further showed that carved backrests generated denser fixation patterns than plain ones.
However, the CV-derived weighting results show that fixation dominance and attentional weighting are not equivalent. Although the backrest received the highest fixation share, it had the lowest CV-derived weight (w = 0.042), whereas the head-rail (w = 0.192) and the front arm support (w = 0.163) received the highest weights. This divergence indicates that fixation amount reflects visual concentration, whereas the CV-based weight reflects cross-observer and cross-stimulus variability. The backrest appears to have served as a stable visual anchor, attracting consistent attention across participants, while elements such as the head-rail and front arm support showed greater variability and therefore exerted greater influence in the weighting scheme. This interpretation is broadly compatible with Feature Integration Theory [17], which suggests that object perception is not reducible to isolated local features.
5.2. Relationship Between Attention-Derived Weighting and Affective Evaluation
5.2.1. Kansei Dimensions and Overall Validation Pattern
The six Kansei dimensions identified in this study overlap with affective descriptors reported in earlier Ming-style chair studies, especially those concerning tradition, simplicity, naturalness, and stylistic expression [67], [69], [70], [71], suggesting that the semantic structure is not purely sample-specific. Five of the six dimensions (Y2–Y6) showed no statistically significant discrepancy between Ycv and Ysv. The main exception was Y1 (Traditional–Fashionable), which failed validation. The Y3 model should also be interpreted cautiously because of residual autocorrelation.
5.2.2. Interpretation of Validated Dimensions
Among the validated models, the pierced backrest (Xec) entered multiple equations, with positive coefficients in Y2, Y4, and Y5 and a negative coefficient in Y3. Perforated structures may increase visual richness and craft salience, thereby contributing to perceptions of decoration, complexity, and artificiality—consistent with the literature on carved and perforated components in Ming-style furniture [32], [34], [72]. Notably, the Graceful–Clumsy dimension (Y6) was predicted by the plain front arm support (Xca) and carved seat–leg transition (Xgb), rather than by any backrest variable, even though the backrest received the highest fixation share. This suggests that gracefulness may depend more on the continuity of supporting and transitional structures than on the most immediately salient region of the chair.
5.2.3. The Traditional–Fashionable Dimension as a Boundary Condition
The Y1 model failed validation and warrants closer examination of two distinct but related issues. The first concerns predictor coverage: the model relied solely on Xi2 (X-shaped leg configuration), reducing a complex affective judgement to a single structural predictor. The second concerns systematic bias: across all five validation chairs, the model overestimated fashionability in the same direction (mean difference = 0.348, all positive), indicating a structural rather than random error. For chairs in which Xi2 = 0 — that is, all non-folding types — the model prediction defaults to the intercept value of −0.752, whereas observed ratings for the same chairs averaged approximately −1.0. This gap suggests that the intercept itself is miscalibrated for the traditional end of the dimension, likely because the ten calibration stimuli did not adequately represent the full range of traditionality perceived by respondents.
Both issues point to the same underlying limitation: the traditional–fashionable evaluation channel appears to involve broader cultural associations, typological familiarity, historical symbolism, and implied material and craft cues — factors that a morphology-only model with a small calibration sample cannot capture. Expanding the stimulus set and incorporating non-morphological variables such as material type, surface finish, or historical period would be necessary conditions for modelling this dimension adequately.
5.3. Implications for Kansei Engineering Modelling
The present study differs from the conventional equal-weight approach [73] by introducing eye-tracking-derived attention weights, calculated using the coefficient of variation [43], prior to regression analysis. Chair elements were weighted according to the variability of fixation duration across observers and stimuli [42], rather than being treated as equally important predictors—an approach distinguishable from conventional KE studies that typically use equal-weight morphological coding or subjective weighting [15]. Relative to the equal-weight baseline, the attention-weighted models showed higher overall directional consistency and changed the relative contribution of several morphological predictors, most notably by increasing the prominence of the head-rail and front arm support while reducing that of the backrest. A comparable pattern was reported by Gao [51], who found the head-rail to play a stronger predictive role than backrest carving under an equal-weight KE framework.
5.4. Limitations and Future Directions
Several limitations constrain interpretation. First, the calibration sample included only ten chairs against 30 candidate binary parameters, increasing the likelihood of sample-specific predictor selection, and the high calibration R2 values should be interpreted cautiously. Second, the experiment used static image stimuli with semantic cues, so observed fixation patterns may reflect task-directed evaluation rather than unconstrained visual exploration [74], [75]. Third, model performance varied across affective dimensions. Future research should expand the calibration sample, compare alternative weighting strategies, include free-viewing conditions, and examine whether non-morphological variables can improve the modelling of dimensions such as Traditional–Fashionable.
6. Conclusion
This study examined how visual attention to Ming-style chair elements can be incorporated into the modelling of form–emotion relationships within a Kansei Engineering (KE) framework. The results show that visual attention was distributed unevenly across the nine structural elements. Although the backrest attracted the largest share of total fixation time, the coefficient-of-variation-based weighting scheme assigned the highest weights to the head-rail and front arm support and the lowest weight to the backrest. Raw fixation dominance and attention-derived weighting therefore capture different aspects of perceptual processing and should not be treated as equivalent. Consistent with this result, attention-weighted coding improved predictive performance relative to an equal-weight baseline: five of the six Kansei dimensions showed acceptable agreement between model-calculated and observed evaluation values, and overall directional consistency was higher under the attention-weighted scheme.
At the same time, the advantage of attention-weighted modelling was not uniform across dimensions. The weaker result for the Traditional–Fashionable dimension suggests that some affective judgements are not adequately explained by morphological variables alone and may depend on broader cultural or semantic associations. More generally, the findings indicate that perceptual salience and evaluative contribution should not be treated as interchangeable in form–emotion modelling.
Methodologically, the study extends KE by introducing attention-weighted modelling at the stage of morphological representation. Rather than treating coded form variables as equivalent, the proposed framework assigns differential weights on the basis of eye-tracking-derived evidence and evaluates the resulting models against an equal-weight alternative using an independent validation set. In this respect, the study contributes a more perceptually grounded approach to form–emotion modelling in culturally specific product contexts. The findings should nevertheless be interpreted in light of several limitations, including the small calibration sample, the use of static image stimuli, and the reliance on a single eye-tracking metric for weight construction. Future research should therefore test the framework with larger and more diverse sample sets, compare alternative weighting strategies, and examine whether additional variables such as material, finish, or cultural familiarity improve model performance in affective dimensions that are less strongly determined by form alone.
Author Contributions
Conceptualization, T.G. and I.S.M.Y.; methodology, T.G.; software, T.G.; validation, T.G. and I.S.M.Y.; formal analysis, T.G. and I.S.M.Y.; investigation, T.G.; resources, T.G.; data curation, T.G.; writing—original draft preparation, T.G.; writing—review and editing, T.G., I.S.M.Y. and R.C.M.; visualization, T.G.; supervision, I.S.M.Y. and R.C.M.; project administration, T.G. and I.S.M.Y.; funding acquisition, T.G. and I.S.M.Y. All authors have read and agreed to the published version of the manuscript.
Funding
This research was funded by the National College Student Innovation and Entrepreneurship Training Program (2024) for the project Innovative Chair Form Design Based on Eye-Tracking Technology (Project No. 202411349025), and by the Guangdong Provincial Young Innovative Talent Program (2025) for the project A Study on the Emotional Preferences of Generation Z Toward the Forms of Ming-Style Chairs Made of Rosewood and Carbon Fiber Based on Eye-Tracking (Project No. 2025WQNCX066).
Institutional Review Board Statement
The studies involving human participants were reviewed and approved by Universiti Putra Malaysia Institutional Review Board (JKEUPM-2025-170, date of approval: 30 April 2025).
Informed Consent Statement
Informed consent was obtained from all subjects involved in the study.
Data Availability Statement
The original contributions presented in this study are included in the article. Further inquiries can be directed to the corresponding author.
Conflicts of Interest
The authors declare no conflicts of interest.
References
- Desmet, P.M.A. Designing Emotions. Ph.D. Thesis, Delft University of Technology, Delft, The Netherlands, 2002. [Google Scholar]
- Vaidya, G.; Kalita, P.C. Understanding emotions and their role in the design of products: An integrative review. Arch. Des. Res. 2021, 34, 5–21. [Google Scholar] [CrossRef]
- Nagamachi, M. Kansei engineering in consumer product design. Ergon. Des. 2002, 10, 5–9. [Google Scholar] [CrossRef]
- Schütte, S.; Eklund, J.; Axelsson, J.R.C.; Nagamachi, M. Concepts, methods and tools in Kansei engineering. Theor. Issues Ergon. Sci. 2004, 5, 214–231. [Google Scholar] [CrossRef]
- Holmqvist, K.; Andersson, R. Eye Tracking: A Comprehensive Guide to Methods, Paradigms, and Measures; Lund Eye-Tracking Research Institute: Lund, Sweden, 2017; ISBN 978-1-979-48489-3. [Google Scholar]
- Su, J.; Li, H. Investigation of the relationship of form design elements to Kansei image by means of quantification I theory. J. Lanzhou Univ. Technol. 2005, 31, 36–39, https://doi.org/1000-5889(2005)02-0036-04. [Google Scholar]
- Zhang, Q.; Liu, Z.; Yang, B.; Wang, C. Product styling cognition based on Kansei engineering theory and implicit measurement. Appl. Sci. 2023, 13, 9577. [Google Scholar] [CrossRef]
- Soares, M.M.; Chivă, M.; Gath-Morad, M.; Shi, W.; Zhou, M.; Ono, K. Cognitive style and visual attention in multimodal museum exhibitions: An eye-tracking study on visitor experience. Buildings 2025, 15, 2968. [Google Scholar] [CrossRef]
- Yan, L.; Huan, L.; Yanting, J.; Wu, S.; Pengfei, L. Image evaluation of subway passenger room design based on eye tracking. J. Mach. Des. 2023, 40, 150–155. [Google Scholar] [CrossRef]
- Niu, X. Seeking the roots of craftsmanship: Analysis and reflection on the ontology beauty of Ming-style furniture. Art. Des. Res. 2022, 3, 81–86. [Google Scholar]
- Zou, Q. Analysis of Form Aesthetics of Ming-Style Chair. Master’s Thesis, Northeast Forestry University, Harbin, China, 2010. [Google Scholar]
- Guan, J.; Wu, Z. The structural aesthetics and cultural images of Chinese Ming-style furniture. Furnit. Inter. Des. 2012, 16–19. [Google Scholar] [CrossRef]
- Chen, Y.; Zhou, Y.; Guo, Y.; Fang, F. Application of the eye movement technique in innovative design of furniture. J. Anhui Agric. Univ. 2012, 39, 306–310. [Google Scholar] [CrossRef]
- Liu, Y.; Li, Y.; Shen, L. Analysis of the cognitive of southern official hat chair styling features based on eye tracking. J. Cent. South Univ. For. Technol. 2017, 37, 146–152. [Google Scholar] [CrossRef]
- Zhang, Z.; Huang, K. Study on innovative design of furniture shaping based on Kansei engineering. J. Cent. South Univ. For. Technol. 2012, 32, 195–199. [Google Scholar] [CrossRef]
- Jia, T.; Niu, X. Analysis on the image of Ming-style chair based on eye movement. Packag. Eng. 2018, 39, 208–214. [Google Scholar] [CrossRef]
- Treisman, A.M.; Gelade, G. A feature-integration theory of attention. Cogn. Psychol. 1980, 12, 97–136. [Google Scholar] [CrossRef] [PubMed]
- Zhao-Xian, R.; et al. Exploring the complex mapping between user perception and product form: A case study of air purifiers. J. Eng. Des. 2025. [Google Scholar] [CrossRef]
- Liu, X.; Yang, S. Study on product form design via Kansei engineering and virtual reality. J. Eng. Des. 2022, 33, 412–440. [Google Scholar] [CrossRef]
- Guo, F.; Qu, Q.X.; Nagamachi, M.; Duffy, V.G. A proposal of the event-related potential method to effectively identify Kansei words for assessing product design features in Kansei engineering research. Int. J. Ind. Ergon. 2020, 76, 102940. [Google Scholar] [CrossRef]
- Schütte, S.; et al. Kansei for the digital era. Int. J. Affect. Eng. 2023. [Google Scholar] [CrossRef] [PubMed]
- Jing, Y.; Cheng, Y.; Yu, S.; Lin, J. An innovative application of diagonal ridge elements of classical Suzhou-style buildings to furniture design based on Kansei engineering and shape grammar. BioResources 2024, 19, 5549–5567. [Google Scholar] [CrossRef]
- Xue, G.; Chen, J. Application of regional culture in wooden furniture styling design based on extension semantics and shape grammar: Taking Su-style stool as an example. BioResources 2025, 20, 248–267. [Google Scholar] [CrossRef]
- Fidalgo, J.; Filgueiras, E. Furniture design identity: Discover the identity of design through user semantics. In Lecture Notes in Computer Science; Springer: Berlin/Heidelberg, Germany, 2022; Volume 13311, pp. 136–156. [Google Scholar] [CrossRef] [PubMed]
- Jiang, L.; Cheung, V.; Westland, S.; Rhodes, P.A.; Shen, L.; Xu, L. The impact of color preference on adolescent children’s choice of furniture. Color Res. Appl. 2020, 45, 754–767. [Google Scholar] [CrossRef]
- López, Ó.; Murillo, C.; González, A. Systematic literature reviews in Kansei engineering for product design—A comparative study from 1995 to 2020. Sensors 2021, 21, 6532. [Google Scholar] [CrossRef] [PubMed]
- Cai, J. Discussion on the social adaptability of Ming-style furniture and the theory of ‘Heaven & Earth/Yin & Yang’ in its modeling design. Furnit. Inter. Des. 2022, 29, 68–74. [Google Scholar] [CrossRef]
- Men, C. Study on the aesthetic characteristics of chairs in Ming style furniture. Furnit. Inter. Des. 2018, 9, 11–13. [Google Scholar] [CrossRef]
- Song, Y. Research of Space Composition Modality on Chairs of the Ming-Style Chair. Master’s Thesis, Northeast Forestry University, Harbin, China, 2010. [Google Scholar]
- Zuo, W.; Wang, N.; Zhang, Z. Study on the design of imagery of Ming-style chair shape based on Kansei engineering. J. For. Eng. 2023, 8, 190–197. [Google Scholar] [CrossRef]
- Qiu, Z. A Study on the Scientific Aspects and Cultural Values of Ming-Style Furniture. Ph.D. Thesis, Nanjing Forestry University, Nanjing, China, 2006. [Google Scholar]
- Niu, X.; Huang, J. Research on backrest modeling of Ming-style furniture with full carving using the technology of eye tracking. J. For. Eng. 2022, 7, 200–206. [Google Scholar] [CrossRef]
- Chen, Y.; Zhou, Y.; Guo, Y.; Fang, F. Application of the eye movement technique in innovative design of furniture. J. Anhui Agric. Univ. 2012, 39, 306–310. [Google Scholar] [CrossRef]
- Yu, J.; Gao, W.; Wu, Z. Relevance analysis between the proportion of woodcarving decoration and visual perception of Su-style furniture in Ming and Qing dynasties. China For. Prod. Ind. 2019, 56, 52–57. [Google Scholar] [CrossRef]
- Gao, W.; Wu, Z.; Yu, J. Analysis of decoration differences of Su-style furniture woodcarving in Ming and Qing dynasty. China For. Prod. Ind. 2018, 33–37. [Google Scholar] [CrossRef]
- Zou, W. The Research on Modal and Decorative Meaning of the Officer’s Cap Chair. Master’s Thesis, Central South University of Forestry and Technology, Changsha, China, 2006. [Google Scholar]
- Mao, Y. Influence of material and decoration on design style, aesthetic performance, and visual attention in Chinese-style chairs. For. Prod. J. 2024, 74, 220–228. [Google Scholar] [CrossRef]
- Li, D. Based on the Semiotics of the Ming-Style Chairs Furniture Category. Master’s Thesis, Northeast Forestry University, Harbin, China, 2009. [Google Scholar]
- Su, J.; Qiu, K.; Zhang, S.; Xiao, L.; Zhang, X. Evaluation method study of product modeling design elements based on eye movement data. J. Mach. Des. 2017, 34, 124–128. [Google Scholar] [CrossRef] [PubMed]
- Wan, Q.; Wang, G.; Zhang, Y.C.; Song, S.S.; Fei, B.H.; Li, X.H. Cognitive processing toward traditional and new Chinese style furniture: Evidence from eye-tracking technology. Wood Res. 2018, 63, 727–740. [Google Scholar]
- Cui, X.; Xu, J.; Dong, H. Design preferences for contemporary Chinese-style wooden furniture: Insights from conjoint analysis. BioResources 2025, 20, 164–189. [Google Scholar] [CrossRef] [PubMed]
- Zhao, T.; Zhang, X.; Zhang, H.; Meng, Y. A study on users’ attention distribution to product features under different emotions. Behav. Inf. Technol. 2023. [Google Scholar] [CrossRef]
- Kuo, J.Y.; Chen, C.H.; Koyama, S.; Chang, D. Investigating the relationship between users’ eye movements and perceived product attributes in design concept evaluation. Appl. Ergon. 2021, 94, 103393. [Google Scholar] [CrossRef] [PubMed]
- Nayak, B.K.; Karmakar, S. A review of eye tracking studies related to visual aesthetic experience: A bottom-up approach. Smart Innov. Syst. Technol. 2019, 135, 391–403. [Google Scholar] [CrossRef]
- Ye, J.; Cheng, J.; Xi, L.; Xiao, W. Using eye tracking technology to evaluate new Chinese furniture material design. Commun. Comput. Inf. Sci. 2015, 528, 450–455. [Google Scholar] [CrossRef]
- Zhu, Y.; Luo, S. A study on the aesthetic preference of product display: An example of smart speaker. Displays 2025, 87, 102920. [Google Scholar] [CrossRef]
- Wang, K.C. A hybrid Kansei engineering design expert system based on grey system theory and support vector regression. Expert Syst. Appl. 2011, 38, 8738–8750. [Google Scholar] [CrossRef]
- Fu, L.; Lei, Y.; Zhu, L.; Lv, J. An evaluation and design method for Ming-style furniture integrating Kansei engineering with particle swarm optimization-support vector regression. Adv. Eng. Inform. 2024, 62, 102822. [Google Scholar] [CrossRef]
- Chen, T.; Liao, W.; Hong, P. Visual image analysis in form of Chinese Ming Dynasty armchair. In Proceedings of the International Conference on Kansei Engineering and Emotion Research (KEER 2010), Paris, France, 2–4 March 2010; p. 2. Available online: https://www.keer.org/keer2010/Papers/1456.pdf (accessed on 11 April 2026).
- Lin, Q.; Cai, J.; Xue, Y. Affective response difference to the viewing of different styles of solid wood furniture based on Kansei engineering. BioResources 2024, 19, 805–822. [Google Scholar] [CrossRef]
- Gao, T.; Mohd Yusoff, I.S.; Gao, M. The relationship between Ming-style chair form attributes and GenY emotion by Kansei engineering in China. Lect. Notes Comput. Sci. 2024, 14699, 224–239. [Google Scholar] [CrossRef]
- Lei, Y.; Fu, L.; Zhu, L.; Lv, J. Wooden furniture design based on physiological-psychological measurement technology and Kansei engineering: Taking Ming-style chair as an example. BioResources 2024, 19, 6304–6324. [Google Scholar] [CrossRef]
- Zhang, Z.; Xu, B. Tang dynasty chair feature design based on Kansei evaluation and eye tracking system. Wood Res. 2020, 65, 161–174. [Google Scholar] [CrossRef]
- Yang, C.; Liu, F.; Ye, J. A product form design method integrating Kansei engineering and diffusion model. Adv. Eng. Inform. 2023, 57, 102058. [Google Scholar] [CrossRef]
- Yang, C.; Cheng, J.; Wang, X. Hybrid quality function deployment method for innovative new product design based on the theory of inventive problem solving and Kansei evaluation. Adv. Mech. Eng. 2019, 11, 1687814019848939. [Google Scholar] [CrossRef]
- Zhu, T.; Wu, C.; Zhang, Z.; Li, Y.; Wu, T. Research on evaluation methods of complex product design based on hybrid Kansei engineering modeling. Symmetry 2025, 17, 306. [Google Scholar] [CrossRef]
- Yang, P.; Lin, L.; Yang, M.; Guo, Z. Analyzing perceptual cognitive characteristics of product forms with eye-tracking and electroencephalogram techniques. Mech. Sci. Technol. Aerosp. Eng. 2023, 42, 1088–1097. [Google Scholar] [CrossRef]
- Lin, L.; Yin, X.; Guo, Z.; Deng, Y.; Yang, P. KE model of product form based on eye-tracking weighting and image cognition by EEG. Packag. Eng. 2022, 43, 37–44. [Google Scholar] [CrossRef]
- Schütte, S.; Eklund, J.; Axelsson, J.R.C.; Nagamachi, M. Concepts, methods and tools in Kansei engineering. Theor. Issues Ergon. Sci. 2004, 5, 214–231. [Google Scholar] [CrossRef]
- Kruskal, J.B.; Wish, M. Multidimensional Scaling; SAGE Publications: Thousand Oaks, CA, USA, 1978. [Google Scholar] [CrossRef] [PubMed]
- Najman, L.; Talbot, H. Mathematical Morphology: From Theory to Applications; John Wiley & Sons: Hoboken, NJ, USA, 2013. [Google Scholar]
- Osgood, C.E.; Snider, J.G. Semantic Differential Technique: A Sourcebook; Aldine Publishing Company: Chicago, IL, USA, 1969. [Google Scholar]
- Duchowski, A.T. Eye Tracking Methodology: Theory and Practice, 3rd ed.; Springer: Cham, Switzerland, 2017. [Google Scholar] [CrossRef]
- Rayner, K. Eye movements in reading and information processing: 20 years of research. Psychol. Bull. 1998, 124, 372–422. [Google Scholar] [CrossRef] [PubMed]
- Hessels, R.S.; Benjamins, J.S.; Cornelissen, T.H.W.; Hooge, I.T.C. A validation of automatically-generated areas-of-interest in videos of a face for eye-tracking research. Front. Psychol. 2018, 9, 1367. [Google Scholar] [CrossRef] [PubMed]
- Moriasi, D.N.; Arnold, J.G.; Van Liew, M.W.; Bingner, R.L.; Harmel, R.D.; Veith, T.L. Model evaluation guidelines for systematic quantification of accuracy in watershed simulations. Trans. ASABE 2007, 50, 885–900. [Google Scholar] [CrossRef]
- Jia, T.; Niu, X. Evaluation of color and visual characteristics of 22 kinds of mahogany wood. J. Northwest For. Univ. 2017, 32, 250–258. [Google Scholar] [CrossRef]
- Liu, Y.; Li, Y.; Shen, L. Analysis of the cognitive of southern official hat chair styling features based on eye tracking. J. Cent. South Univ. For. Technol. 2017, 37, 146–152. [Google Scholar] [CrossRef]
- Xu, L.; Pan, Y. Study on imagery modeling of solid wood chairs in big data. Electronics 2023, 12, 1949. [Google Scholar] [CrossRef]
- Li, J. Idea of creation in Ming-style furniture design. Packag. Eng. 2018, 39, 214–219. [Google Scholar] [CrossRef]
- Liu, Y. Something about folding chair. Furnit. Inter. Decor. 2014, 50–51. [Google Scholar] [CrossRef]
- Sun, C.; Zheng, Q. A study on the aesthetic characteristics of Ming-style furniture. Furnit. Inter. Des. 2021, 264, 9–11. [Google Scholar] [CrossRef]
- Yang, Y.; Liu, W. Investigation of the relationship between office-chair Kansei image and modeling elements. J. For. Eng. 2016, 1, 139–143. [Google Scholar] [CrossRef]
- Palacios-Ibáñez, A.; Castellet-Lathan, S.; Contero, M. Exploring the user’s gaze during product evaluation through the semantic differential: A comparison between virtual reality and photorealistic images. Virtual Real. 2024, 28, 153. [Google Scholar] [CrossRef]
- Herman, L.; Popelka, S.; Hejlova, V. Eye-tracking analysis of interactive 3D geovisualization. J. Eye Mov. Res. 2017, 10, 1–15. [Google Scholar] [CrossRef] [PubMed]
Figure 1.
Overall research procedure for attention-weighted KE modelling of Ming-style chairs.
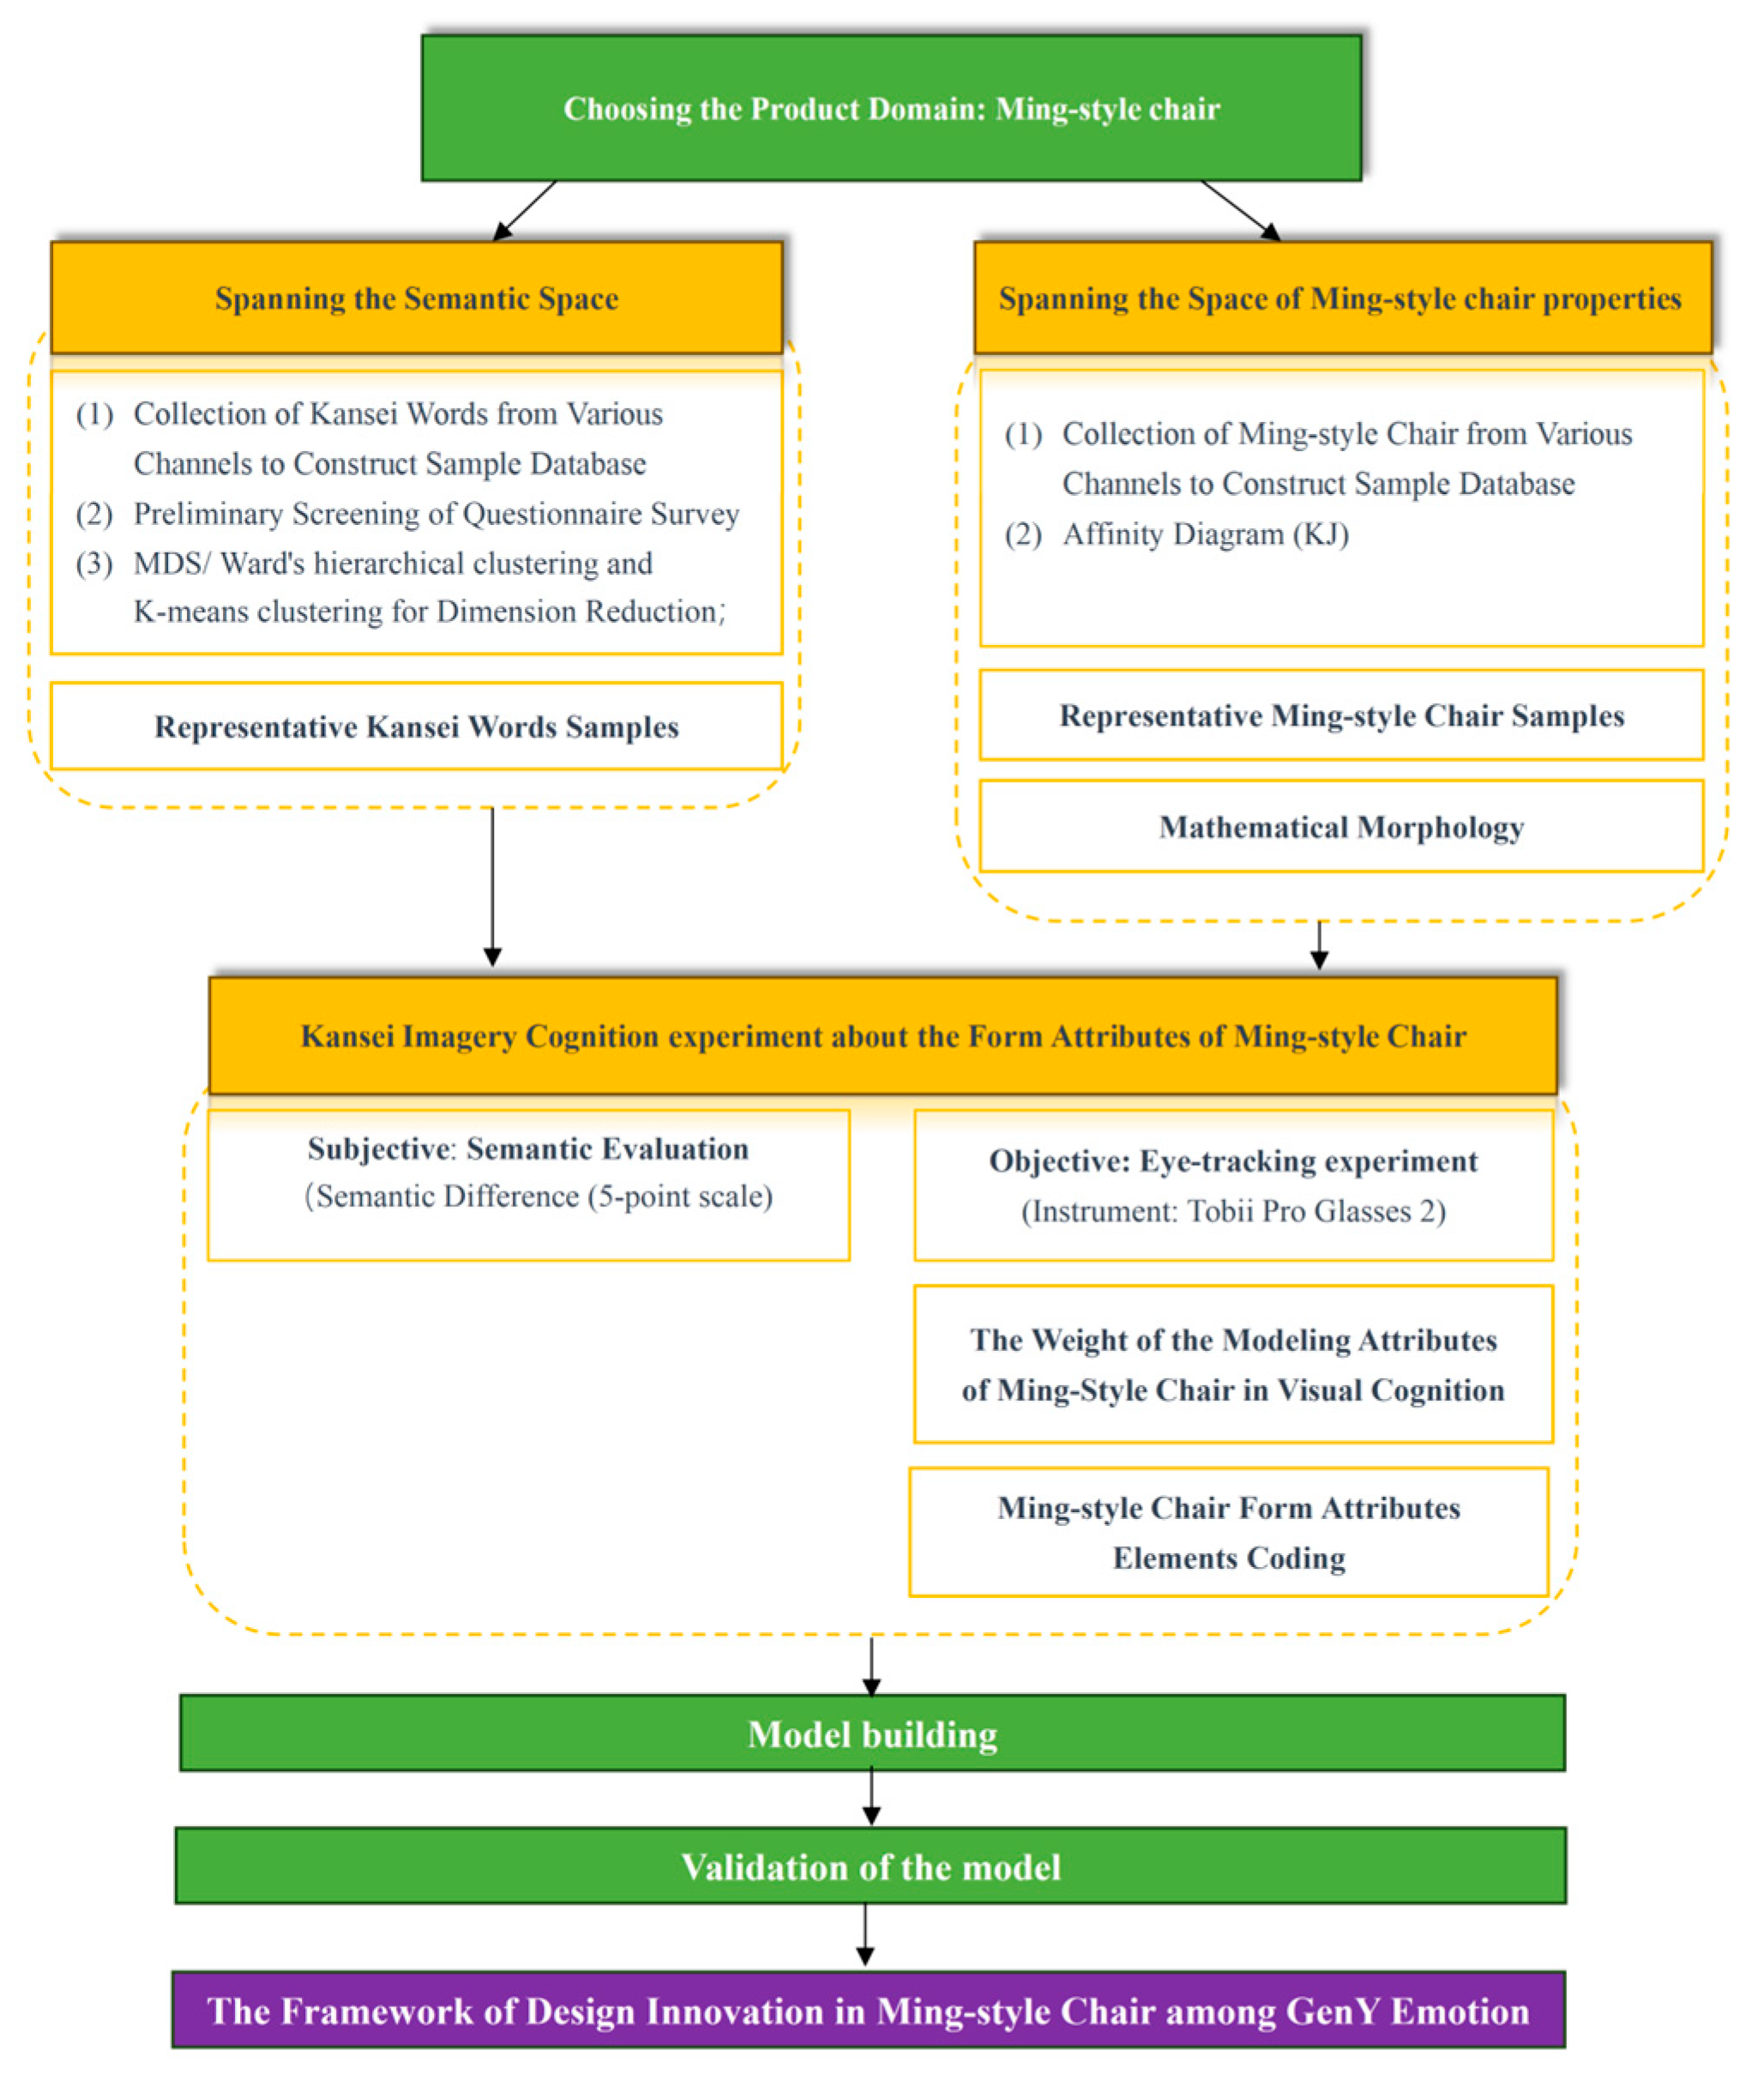
Figure 2.
Research flow for Kansei word selection and dimensional reduction.
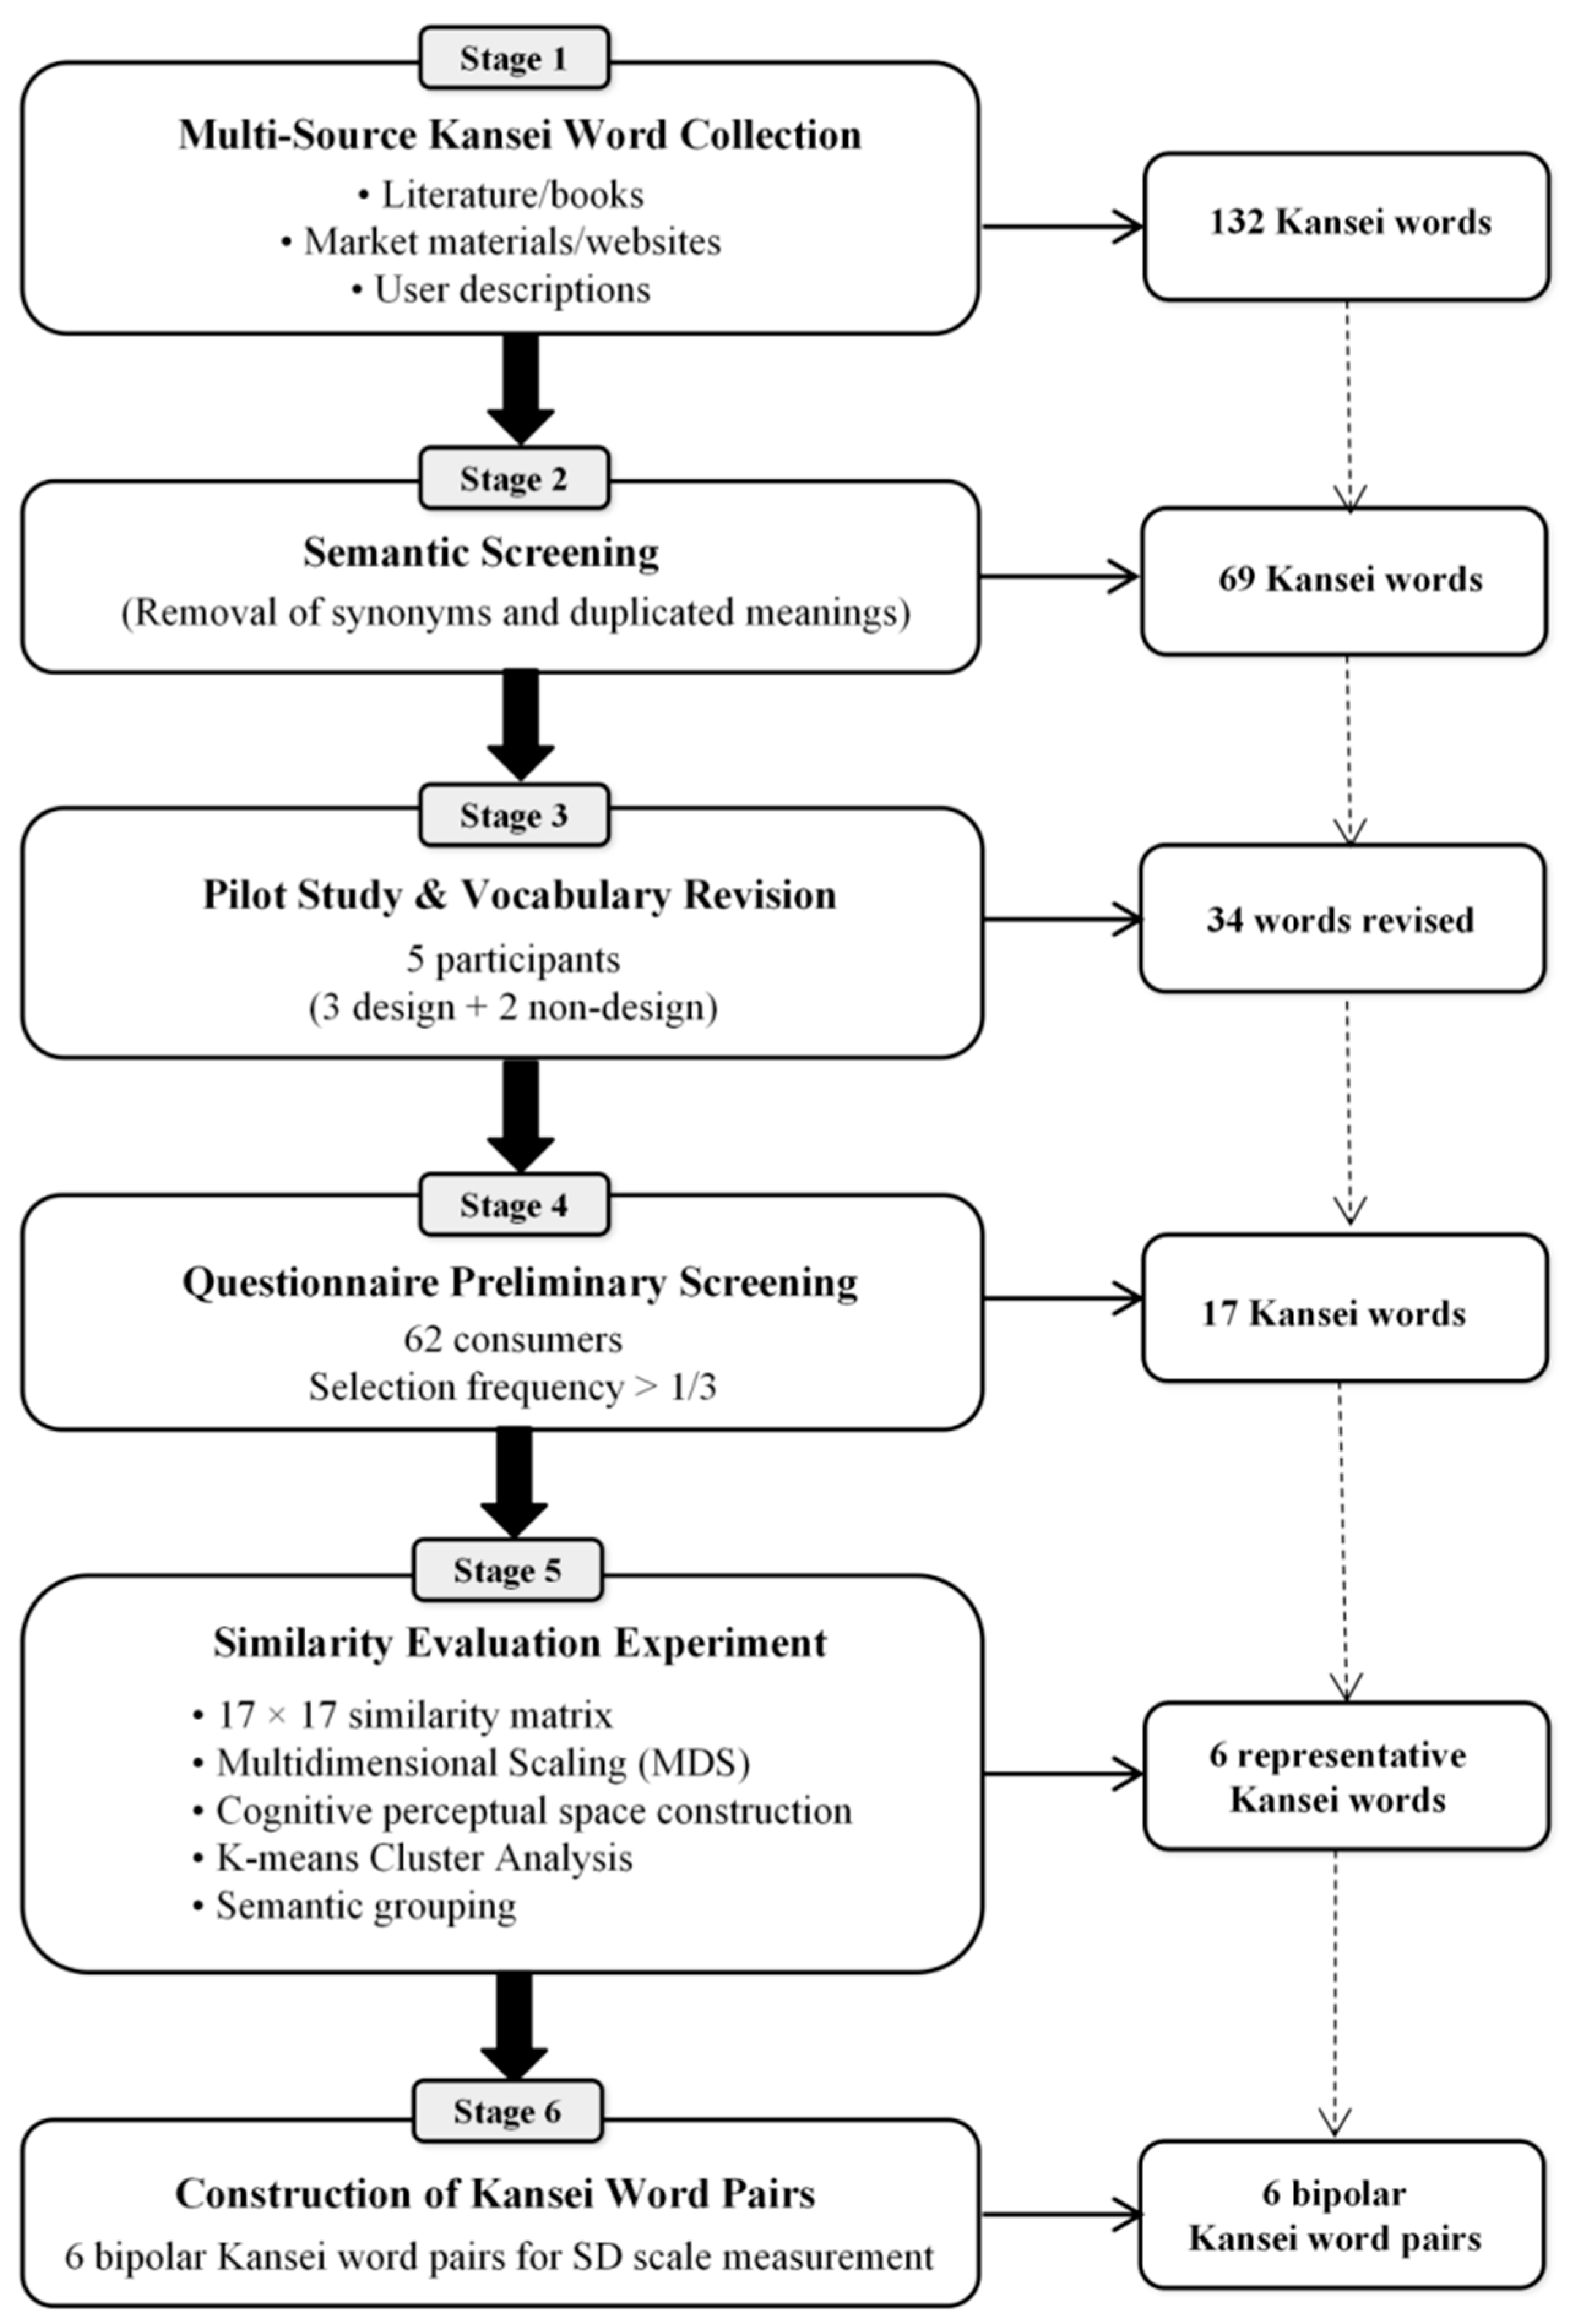
Figure 3.
Ten standardised Ming-style chair stimuli used consistently across both experiments.
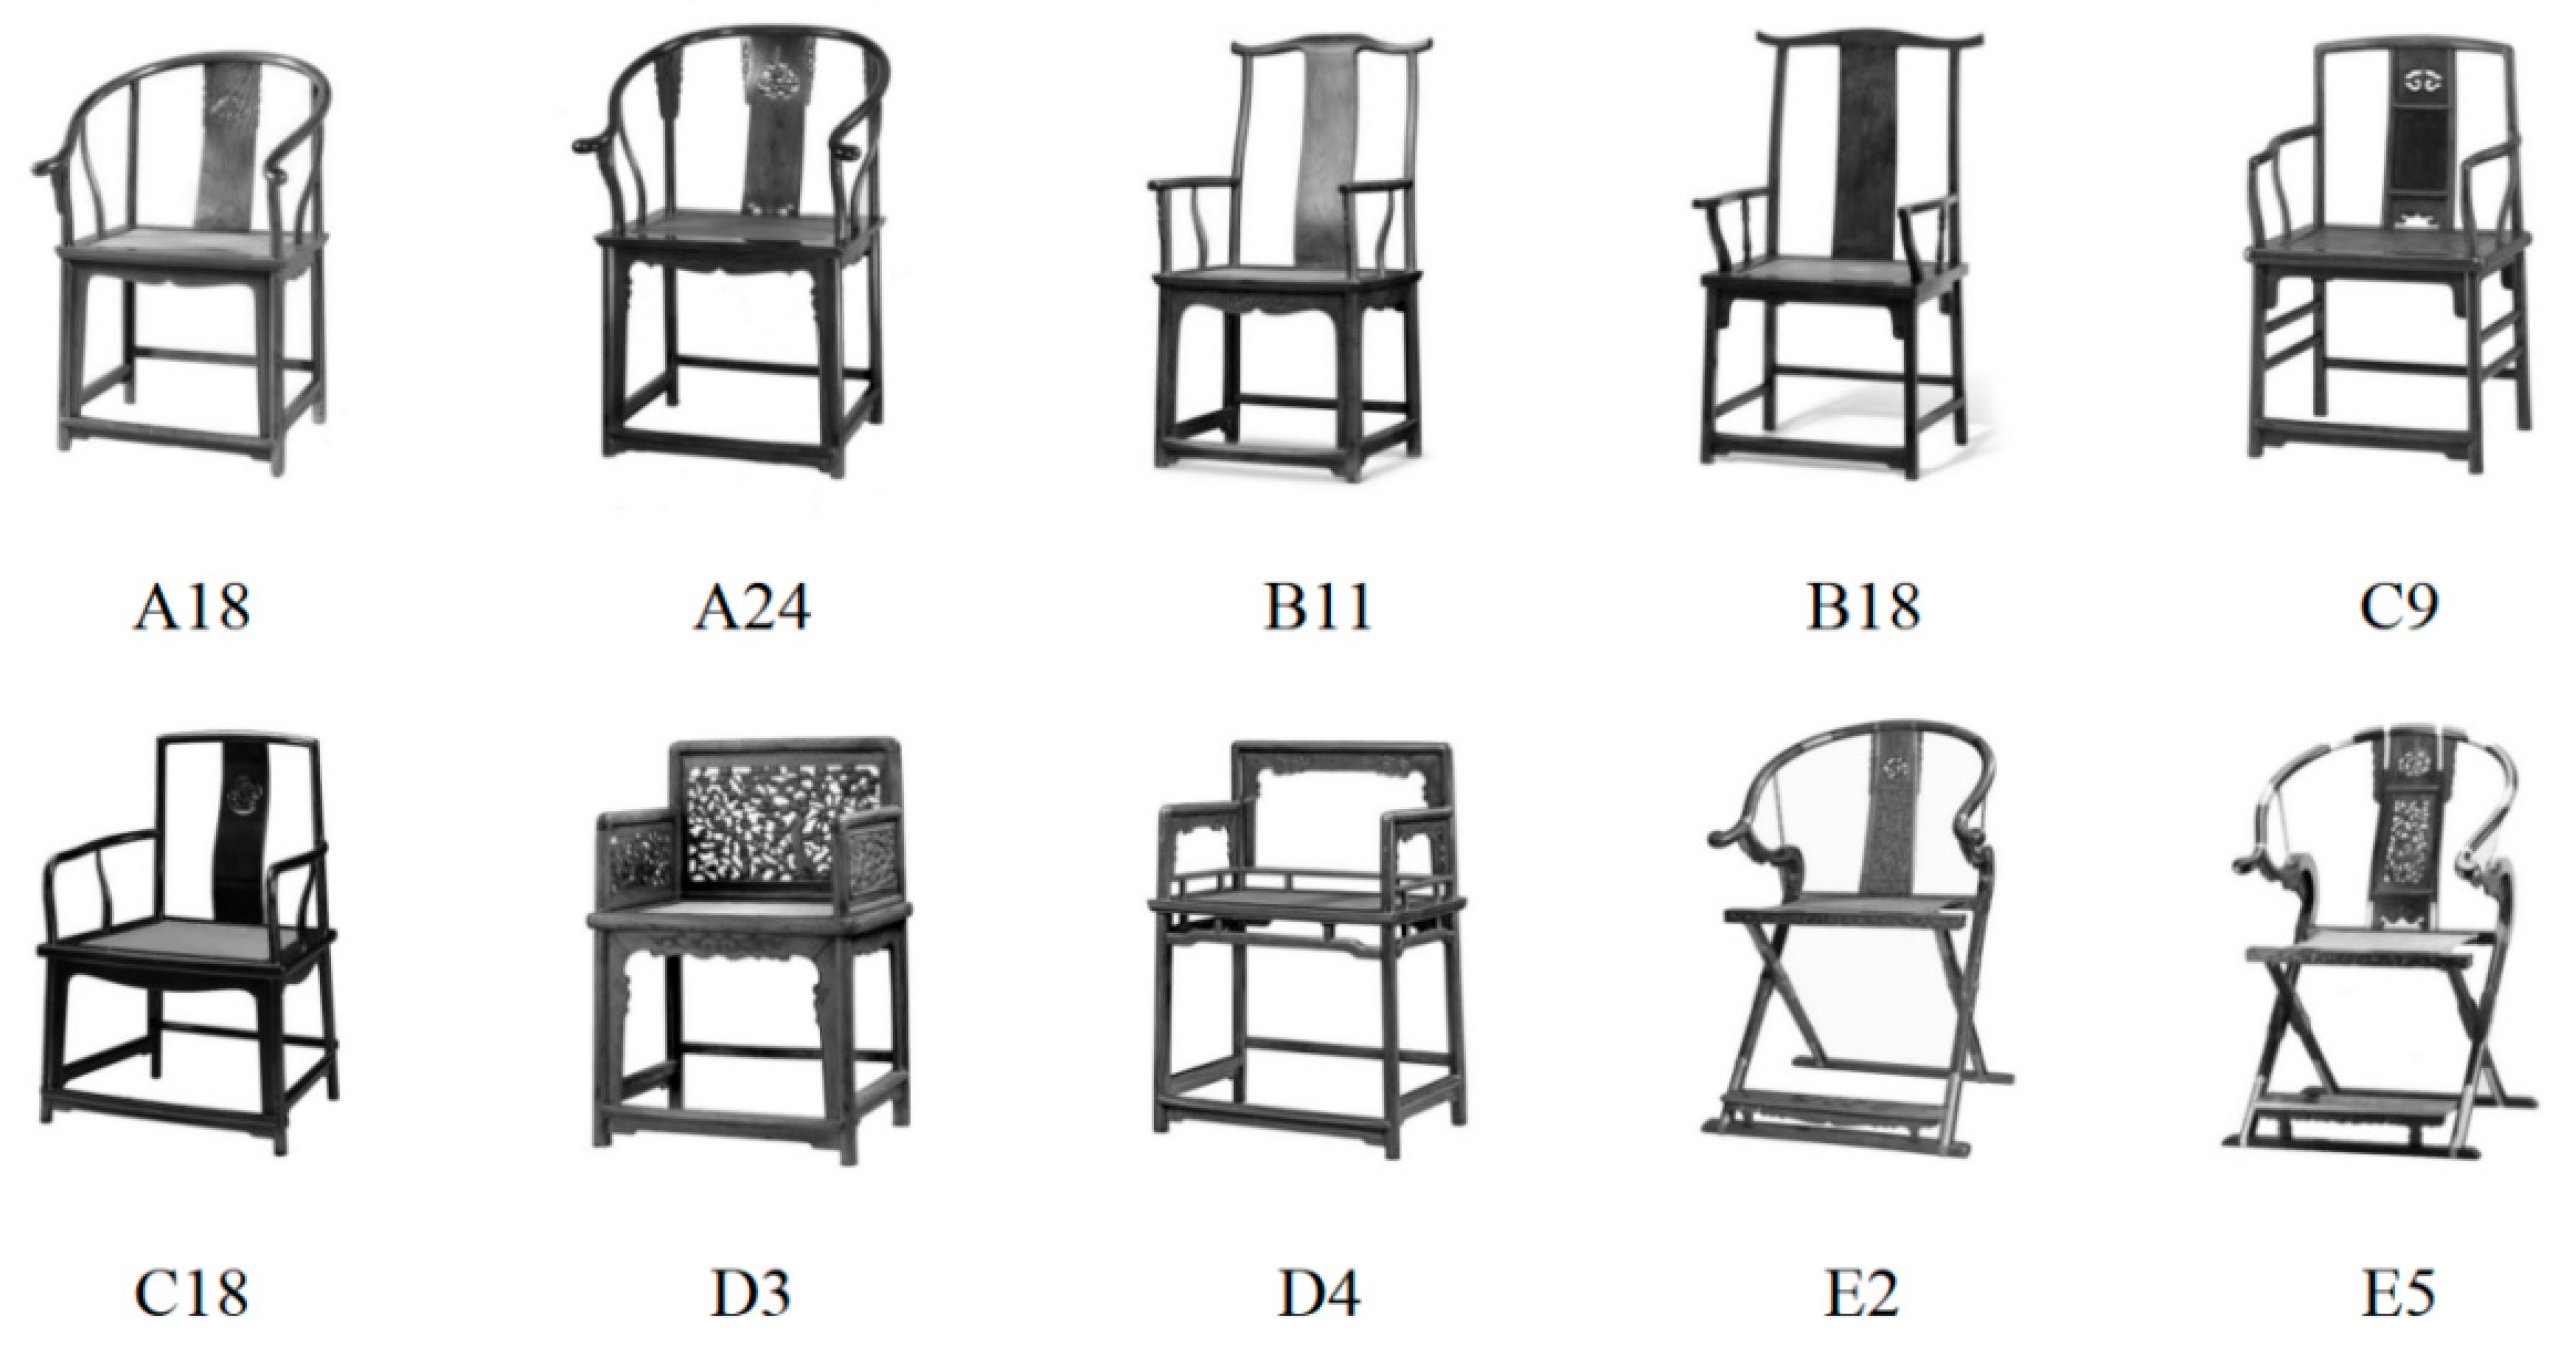
Figure 4.
Participants signed informed consent forms before the eye-tracking experiment.

Figure 5.
Tobii Pro Glasses 2 eye-tracking system (top) and experimental setup (bottom).
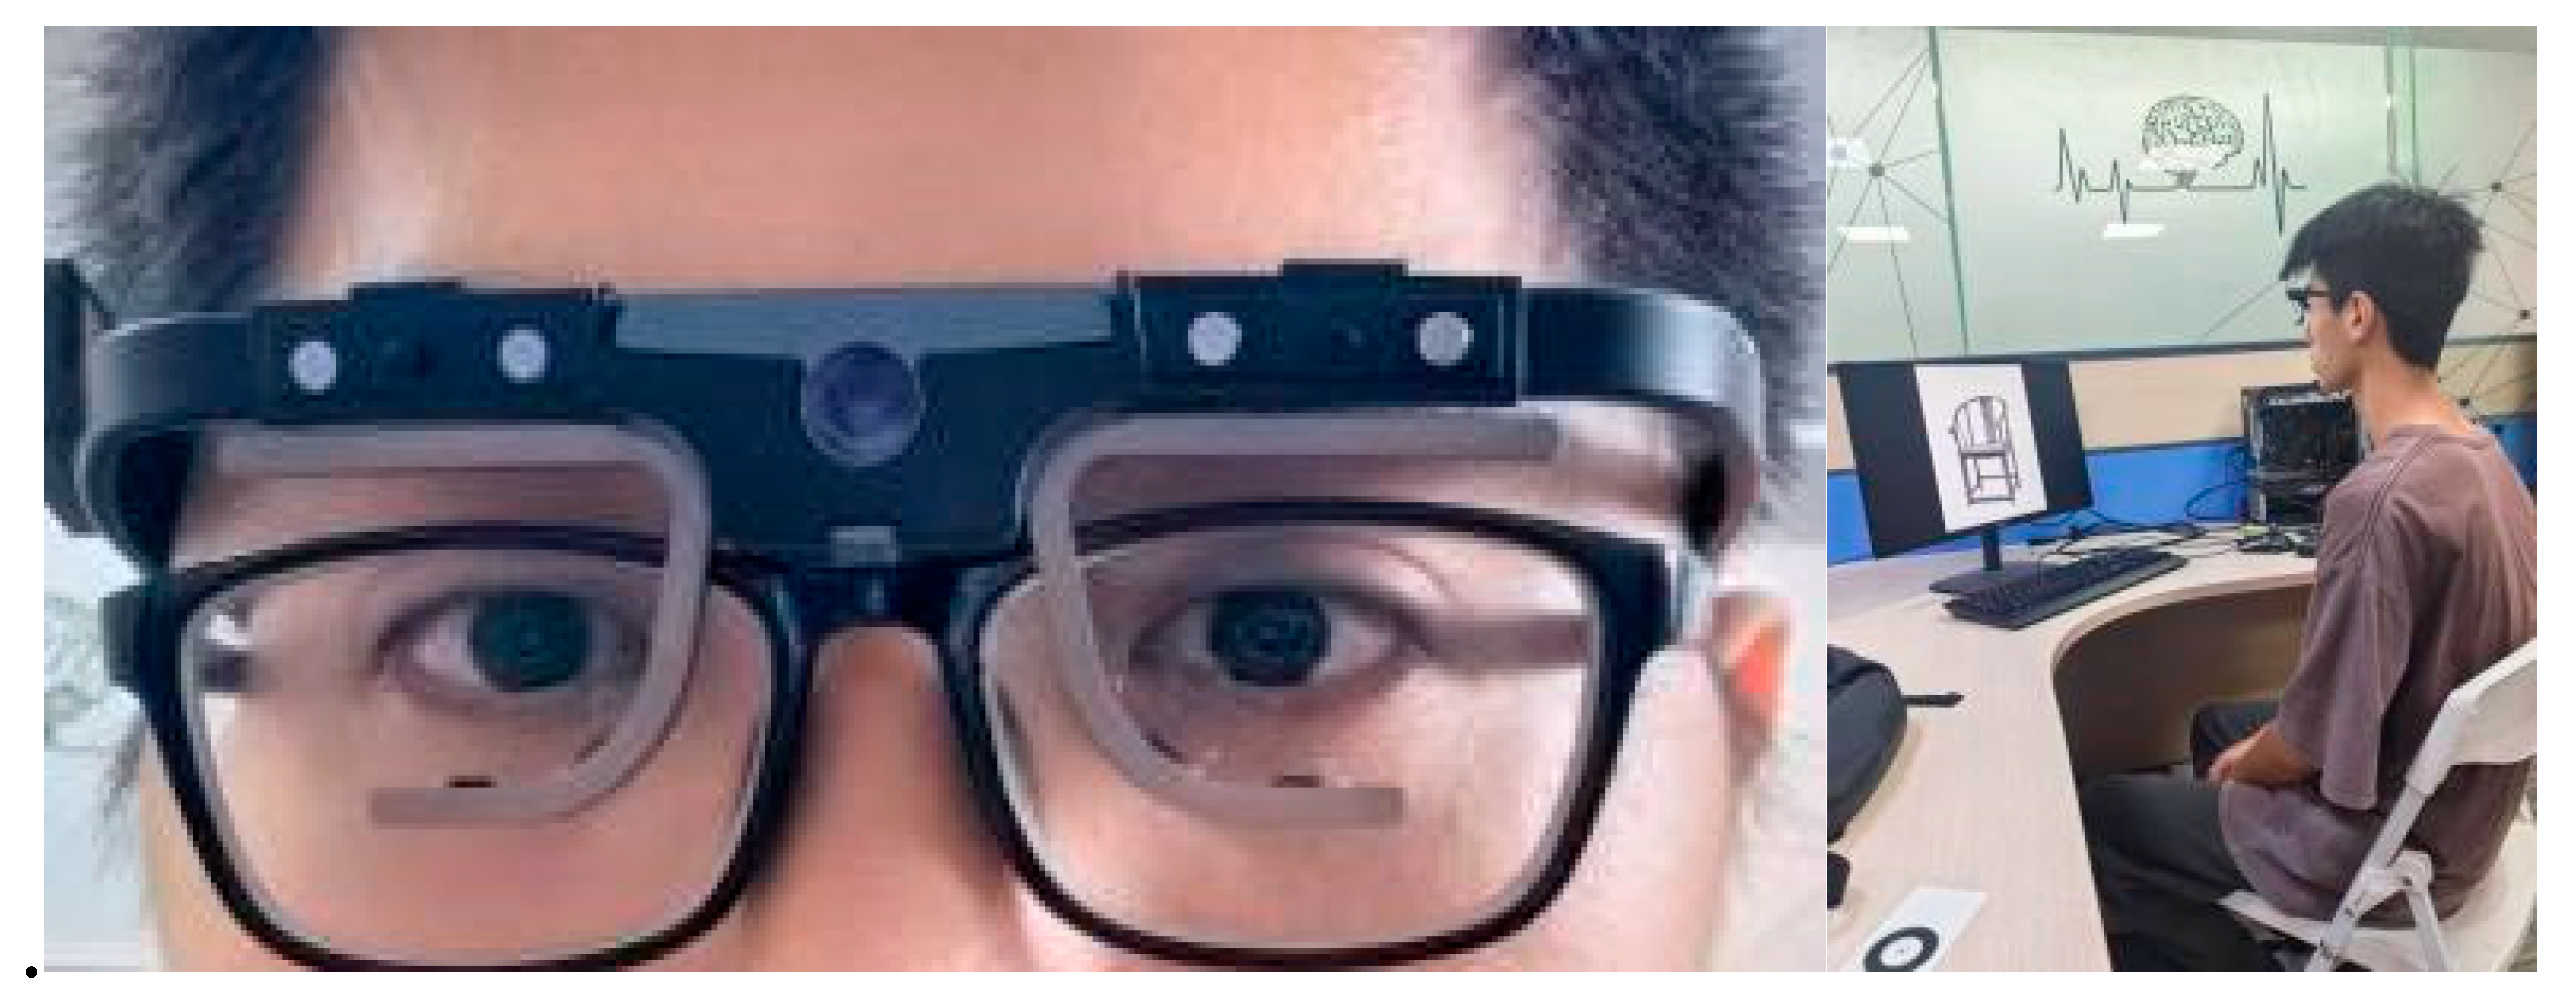
Figure 6.
Trial sequence structure showing the four stages of each experimental trial.
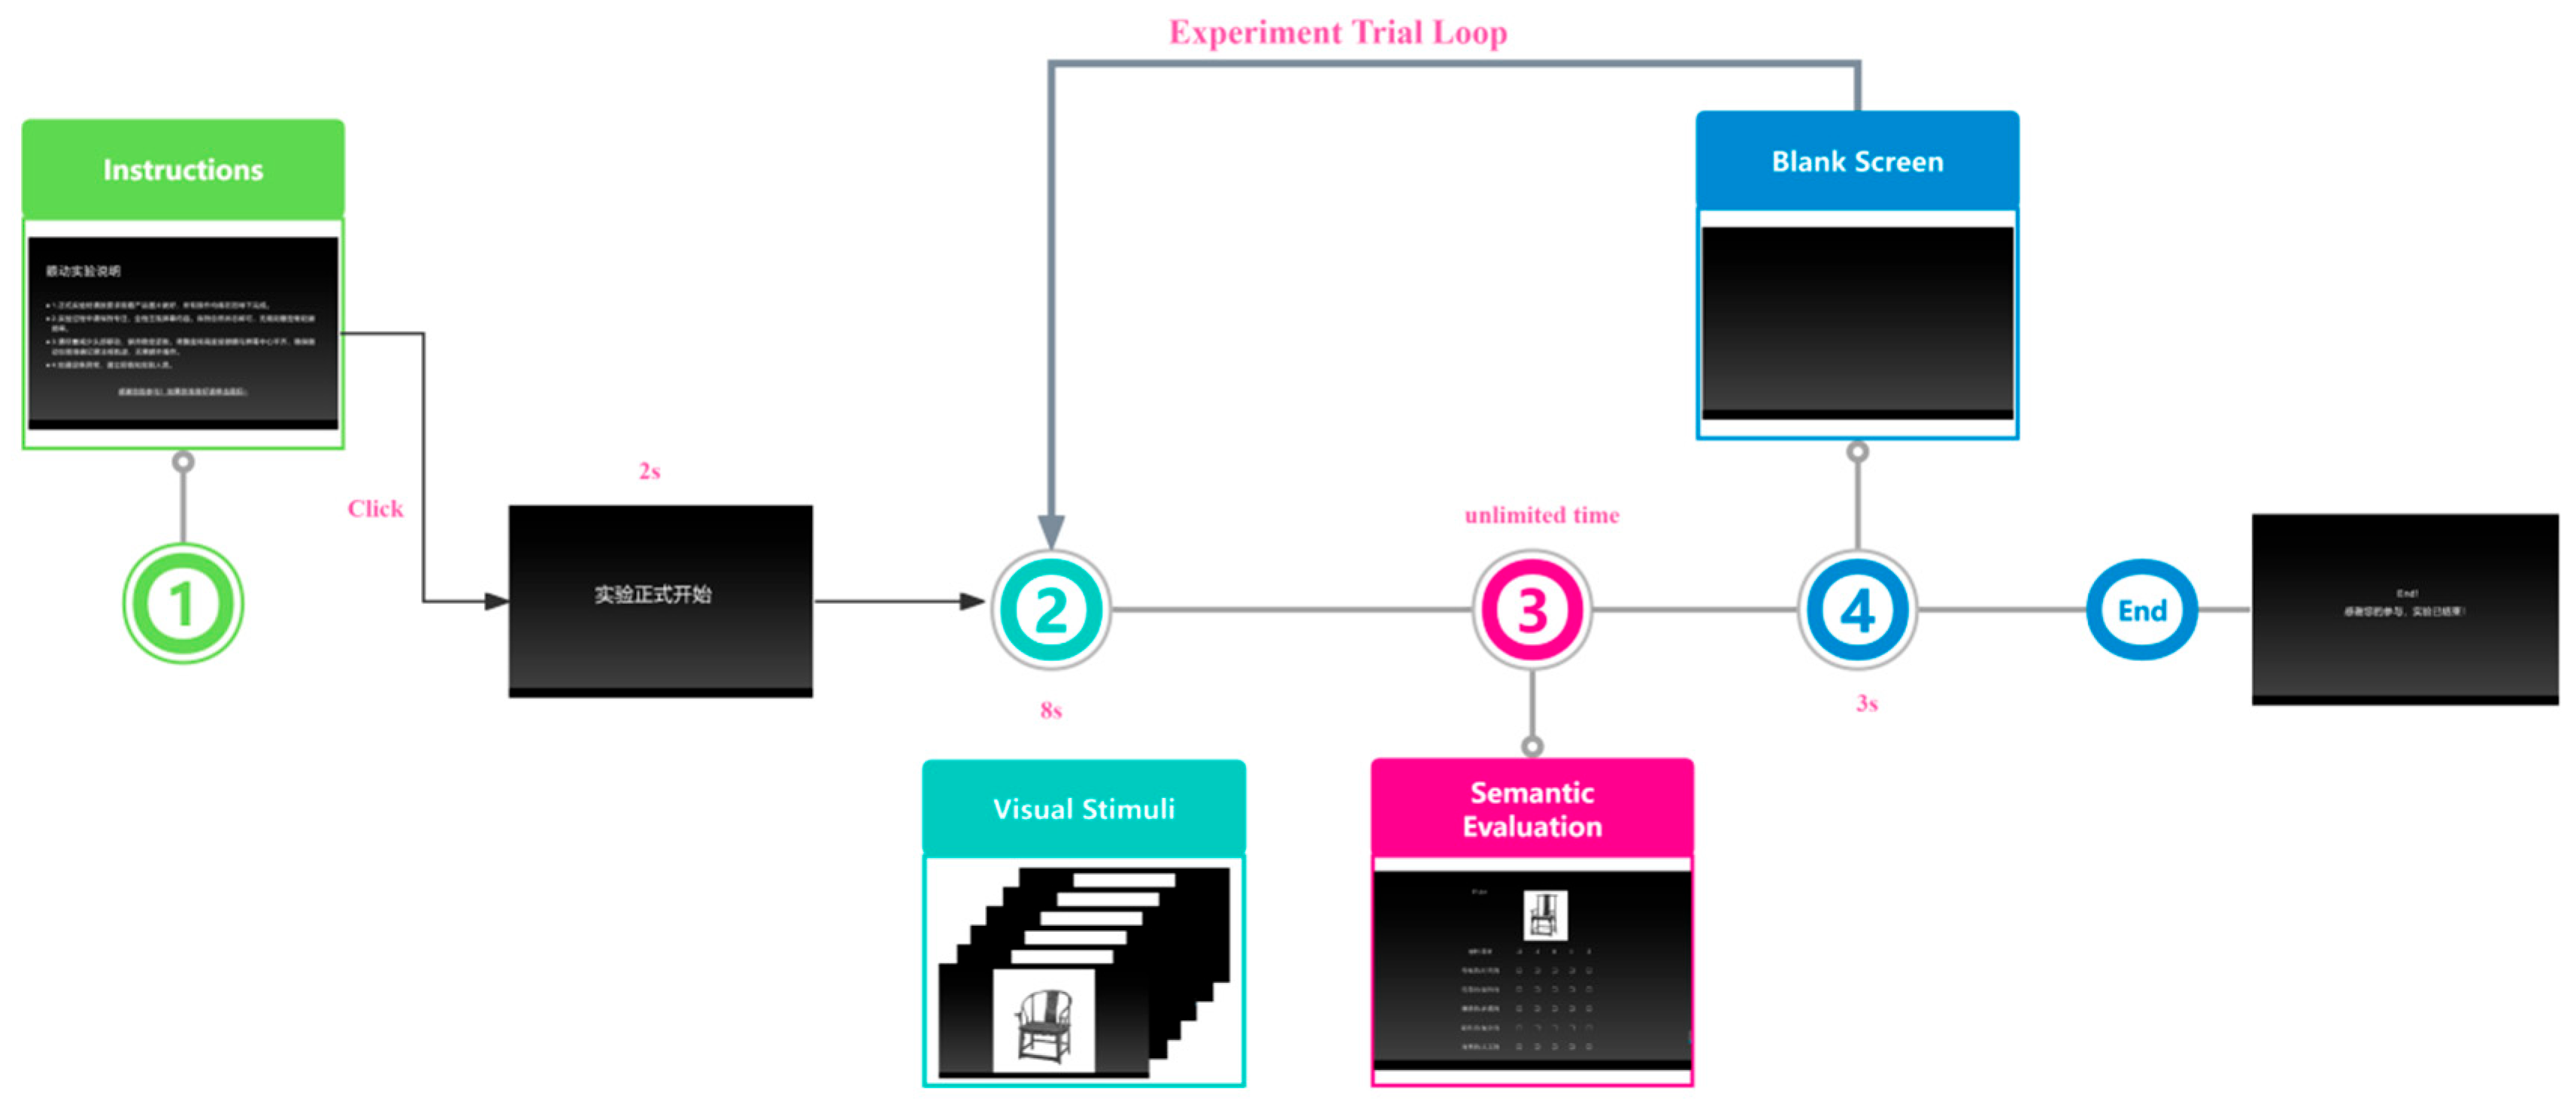
Figure 7.
AOI definition for the component-based eye-tracking analysis (sample A18).
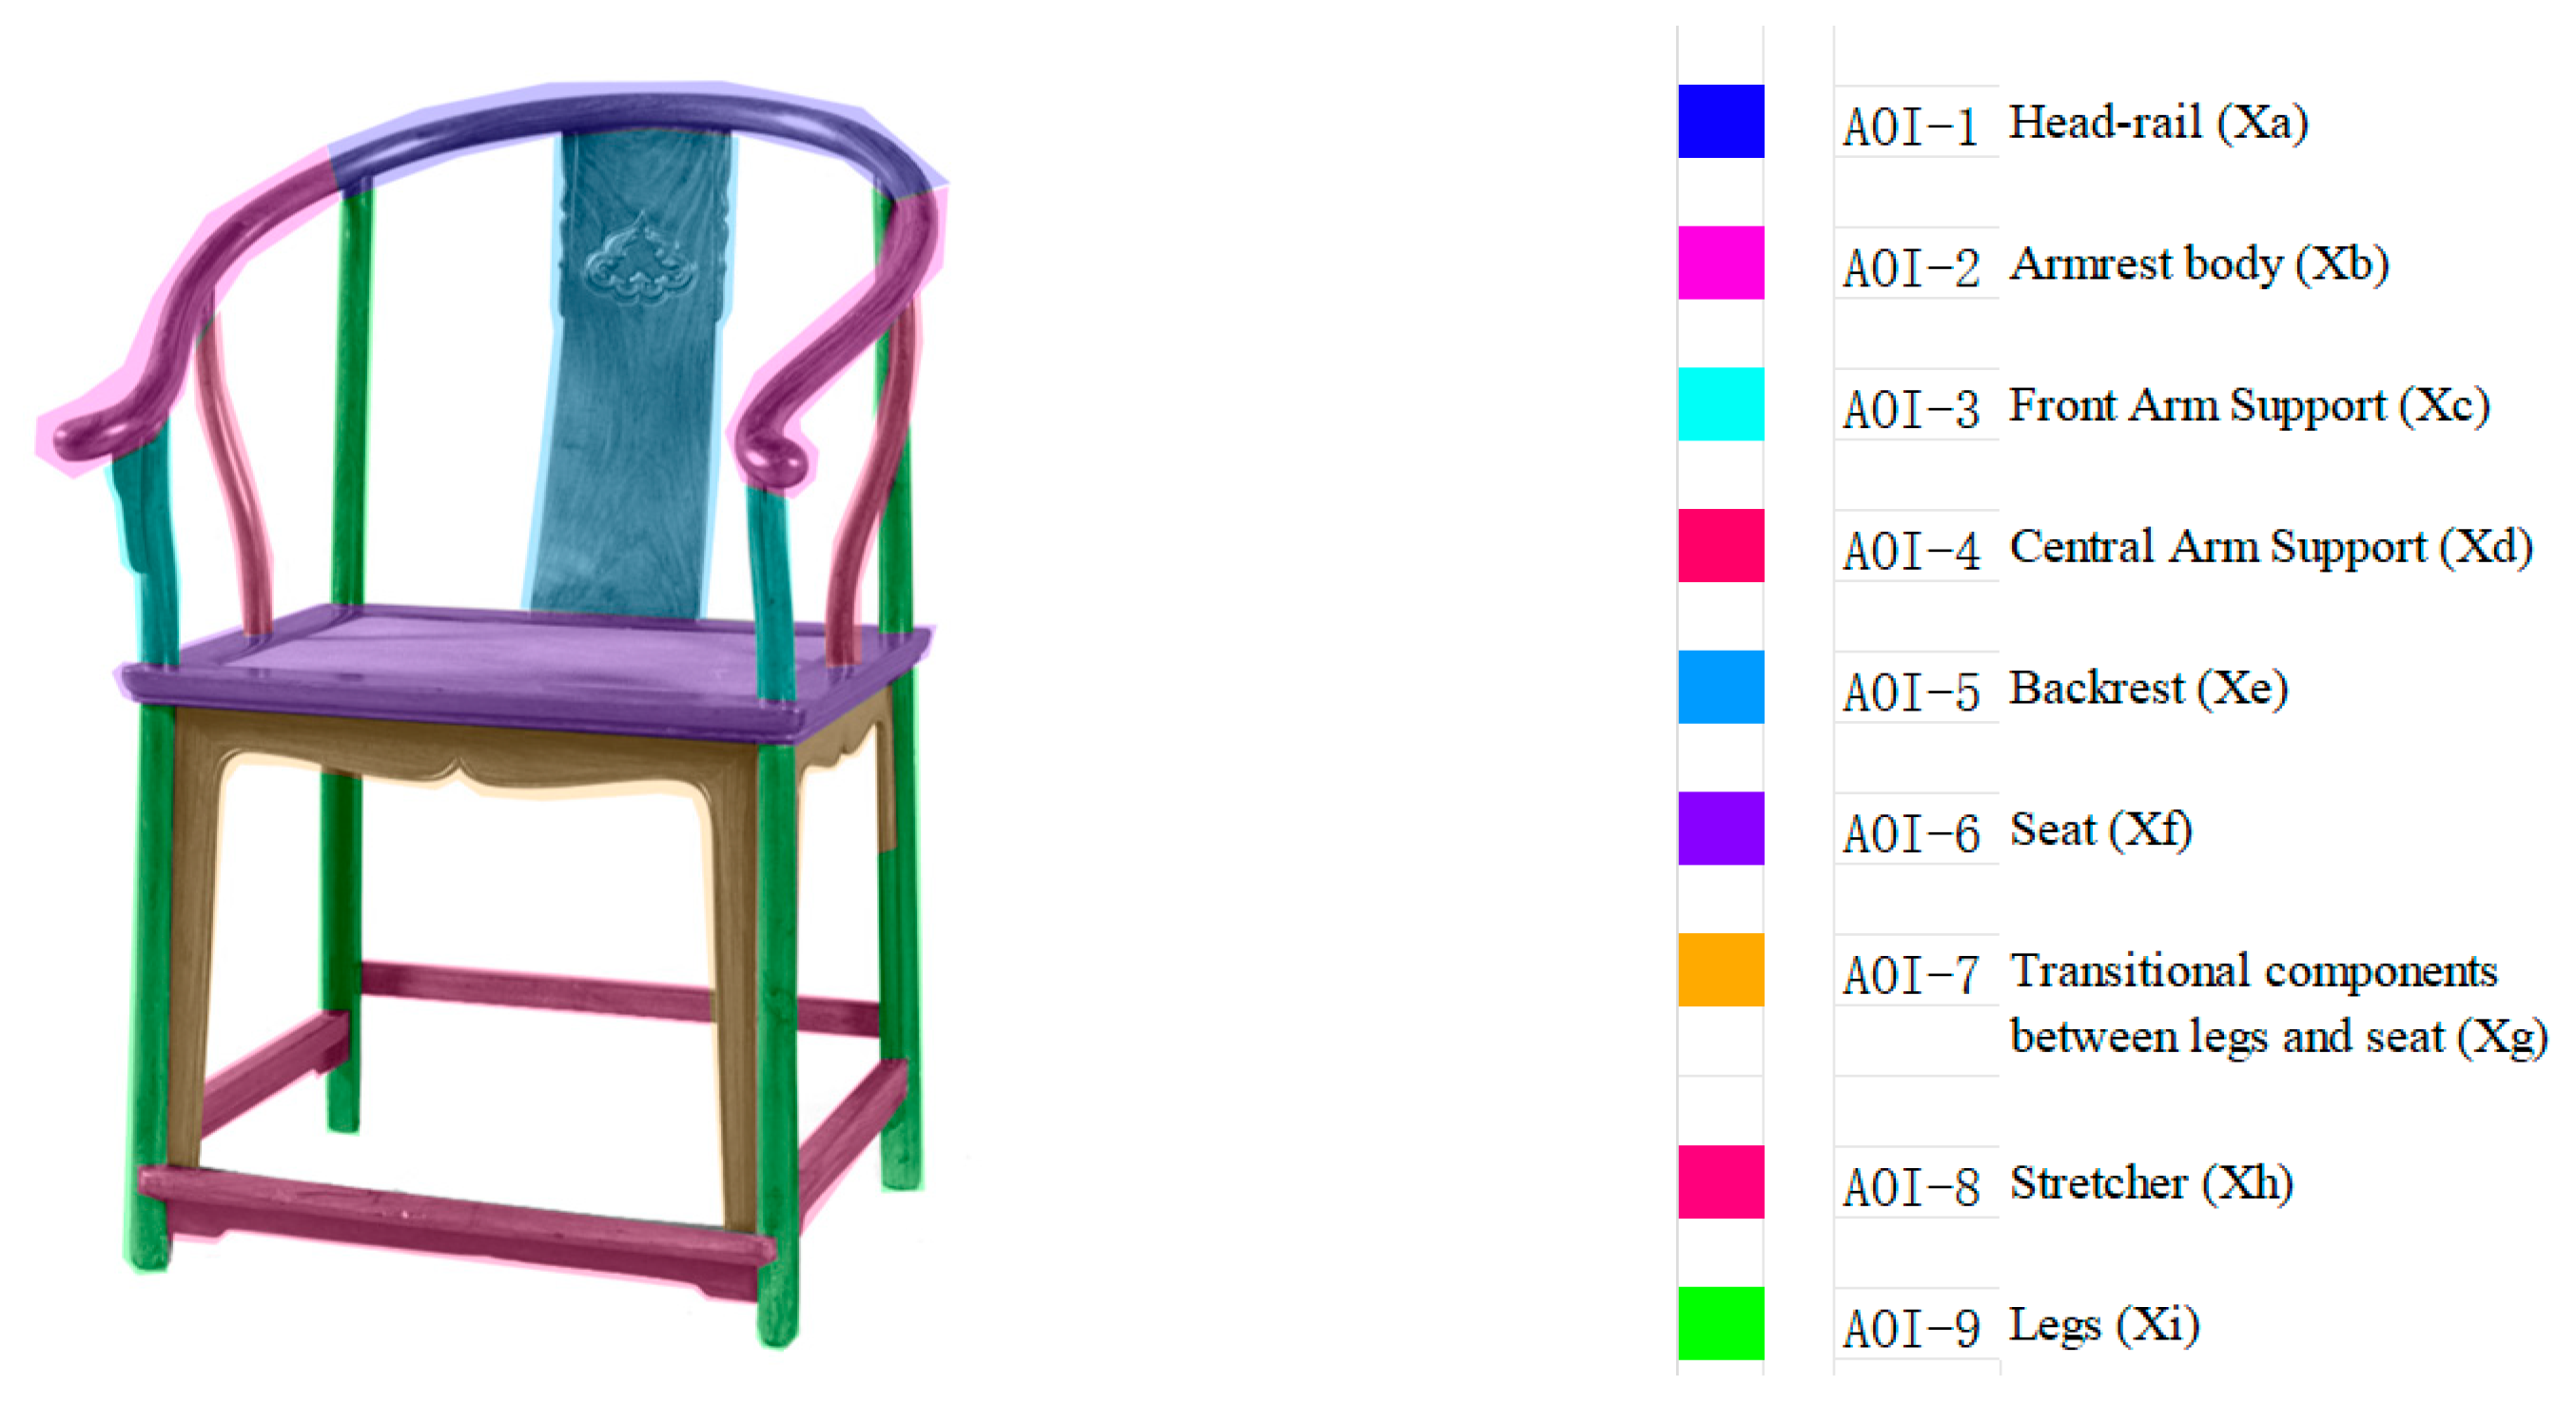
Figure 8.
AOI divisions applied to all ten Ming-style chair stimuli.
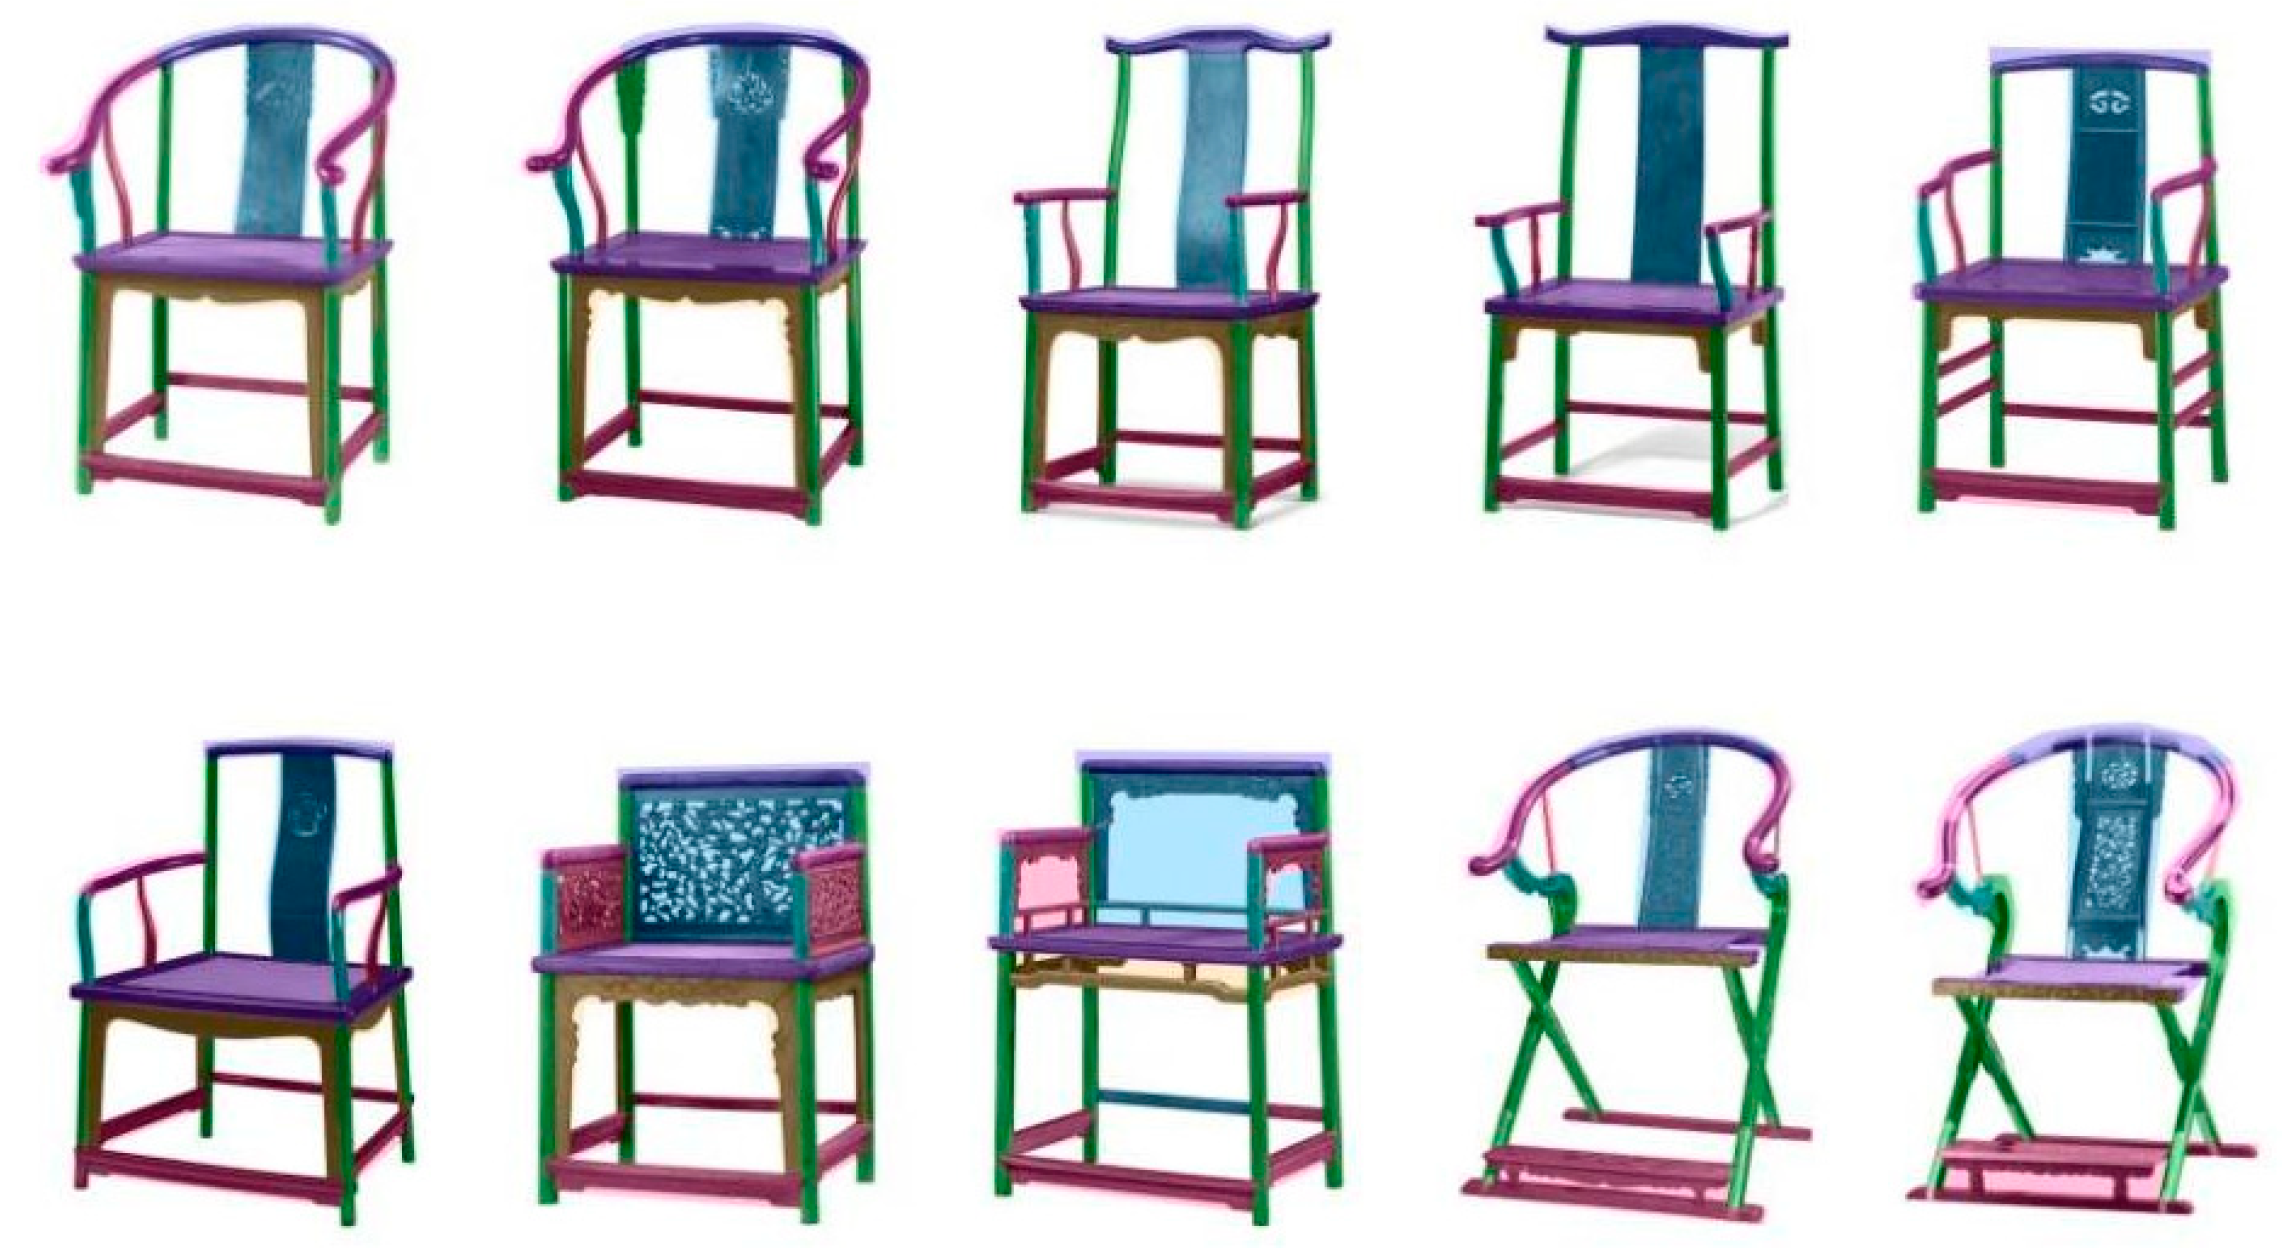
Figure 9.
Five new Ming-style chair samples used for model validation.
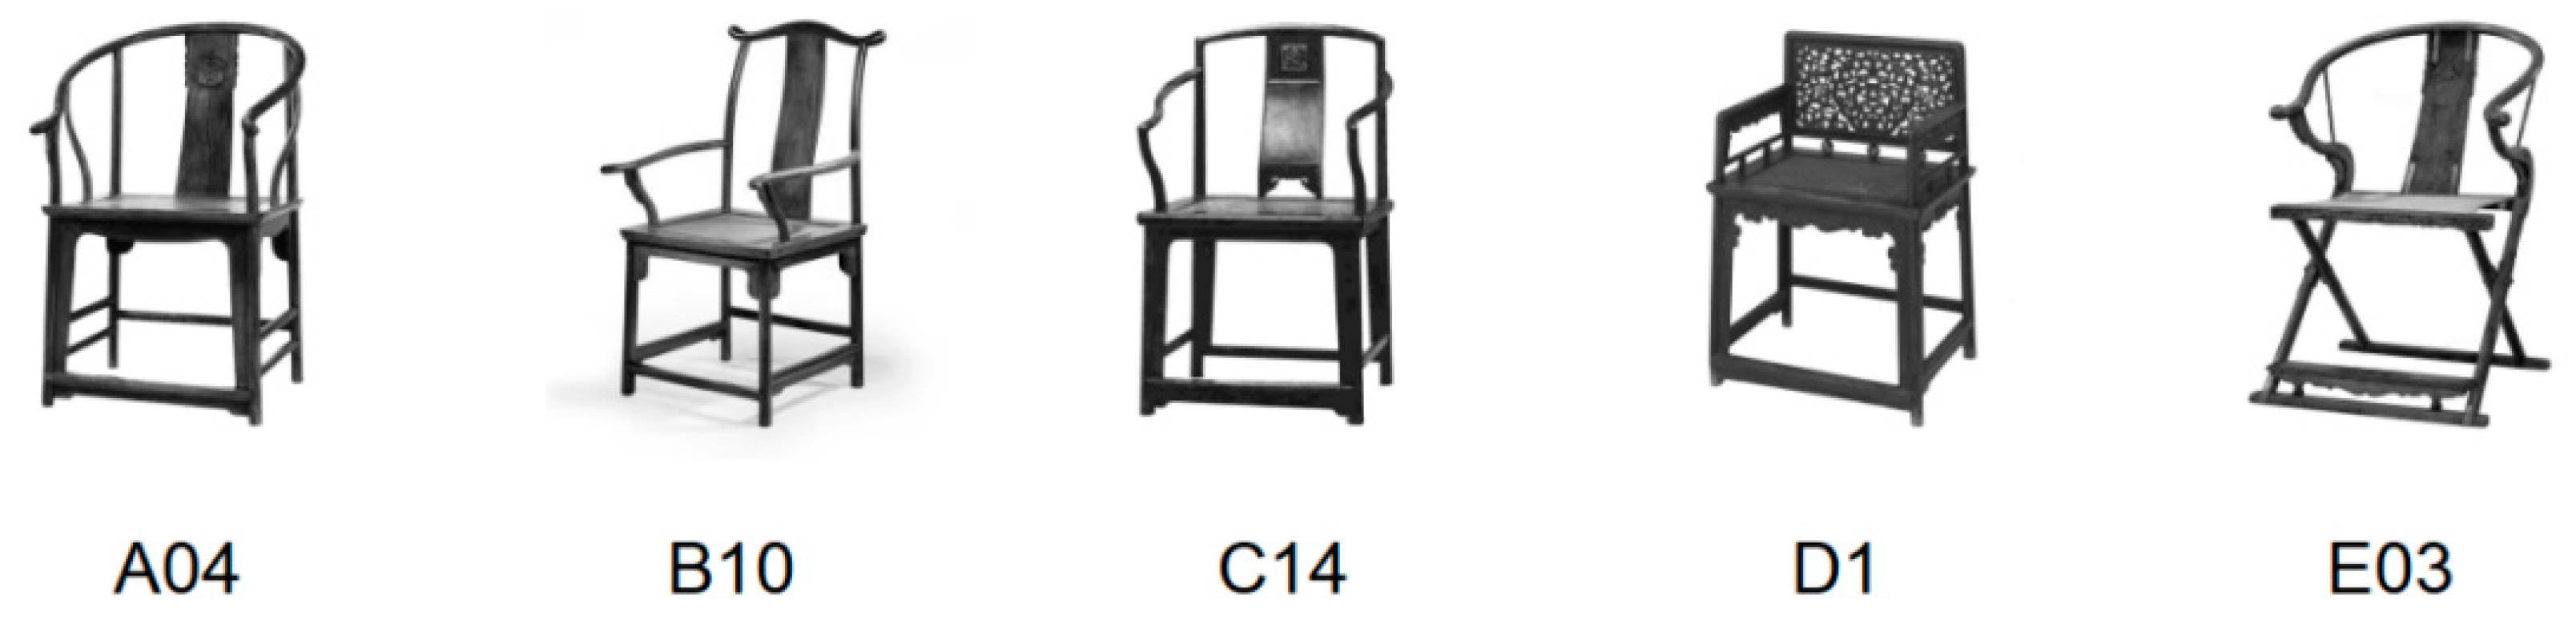
Figure 10.
Flowchart for the model validation procedure.
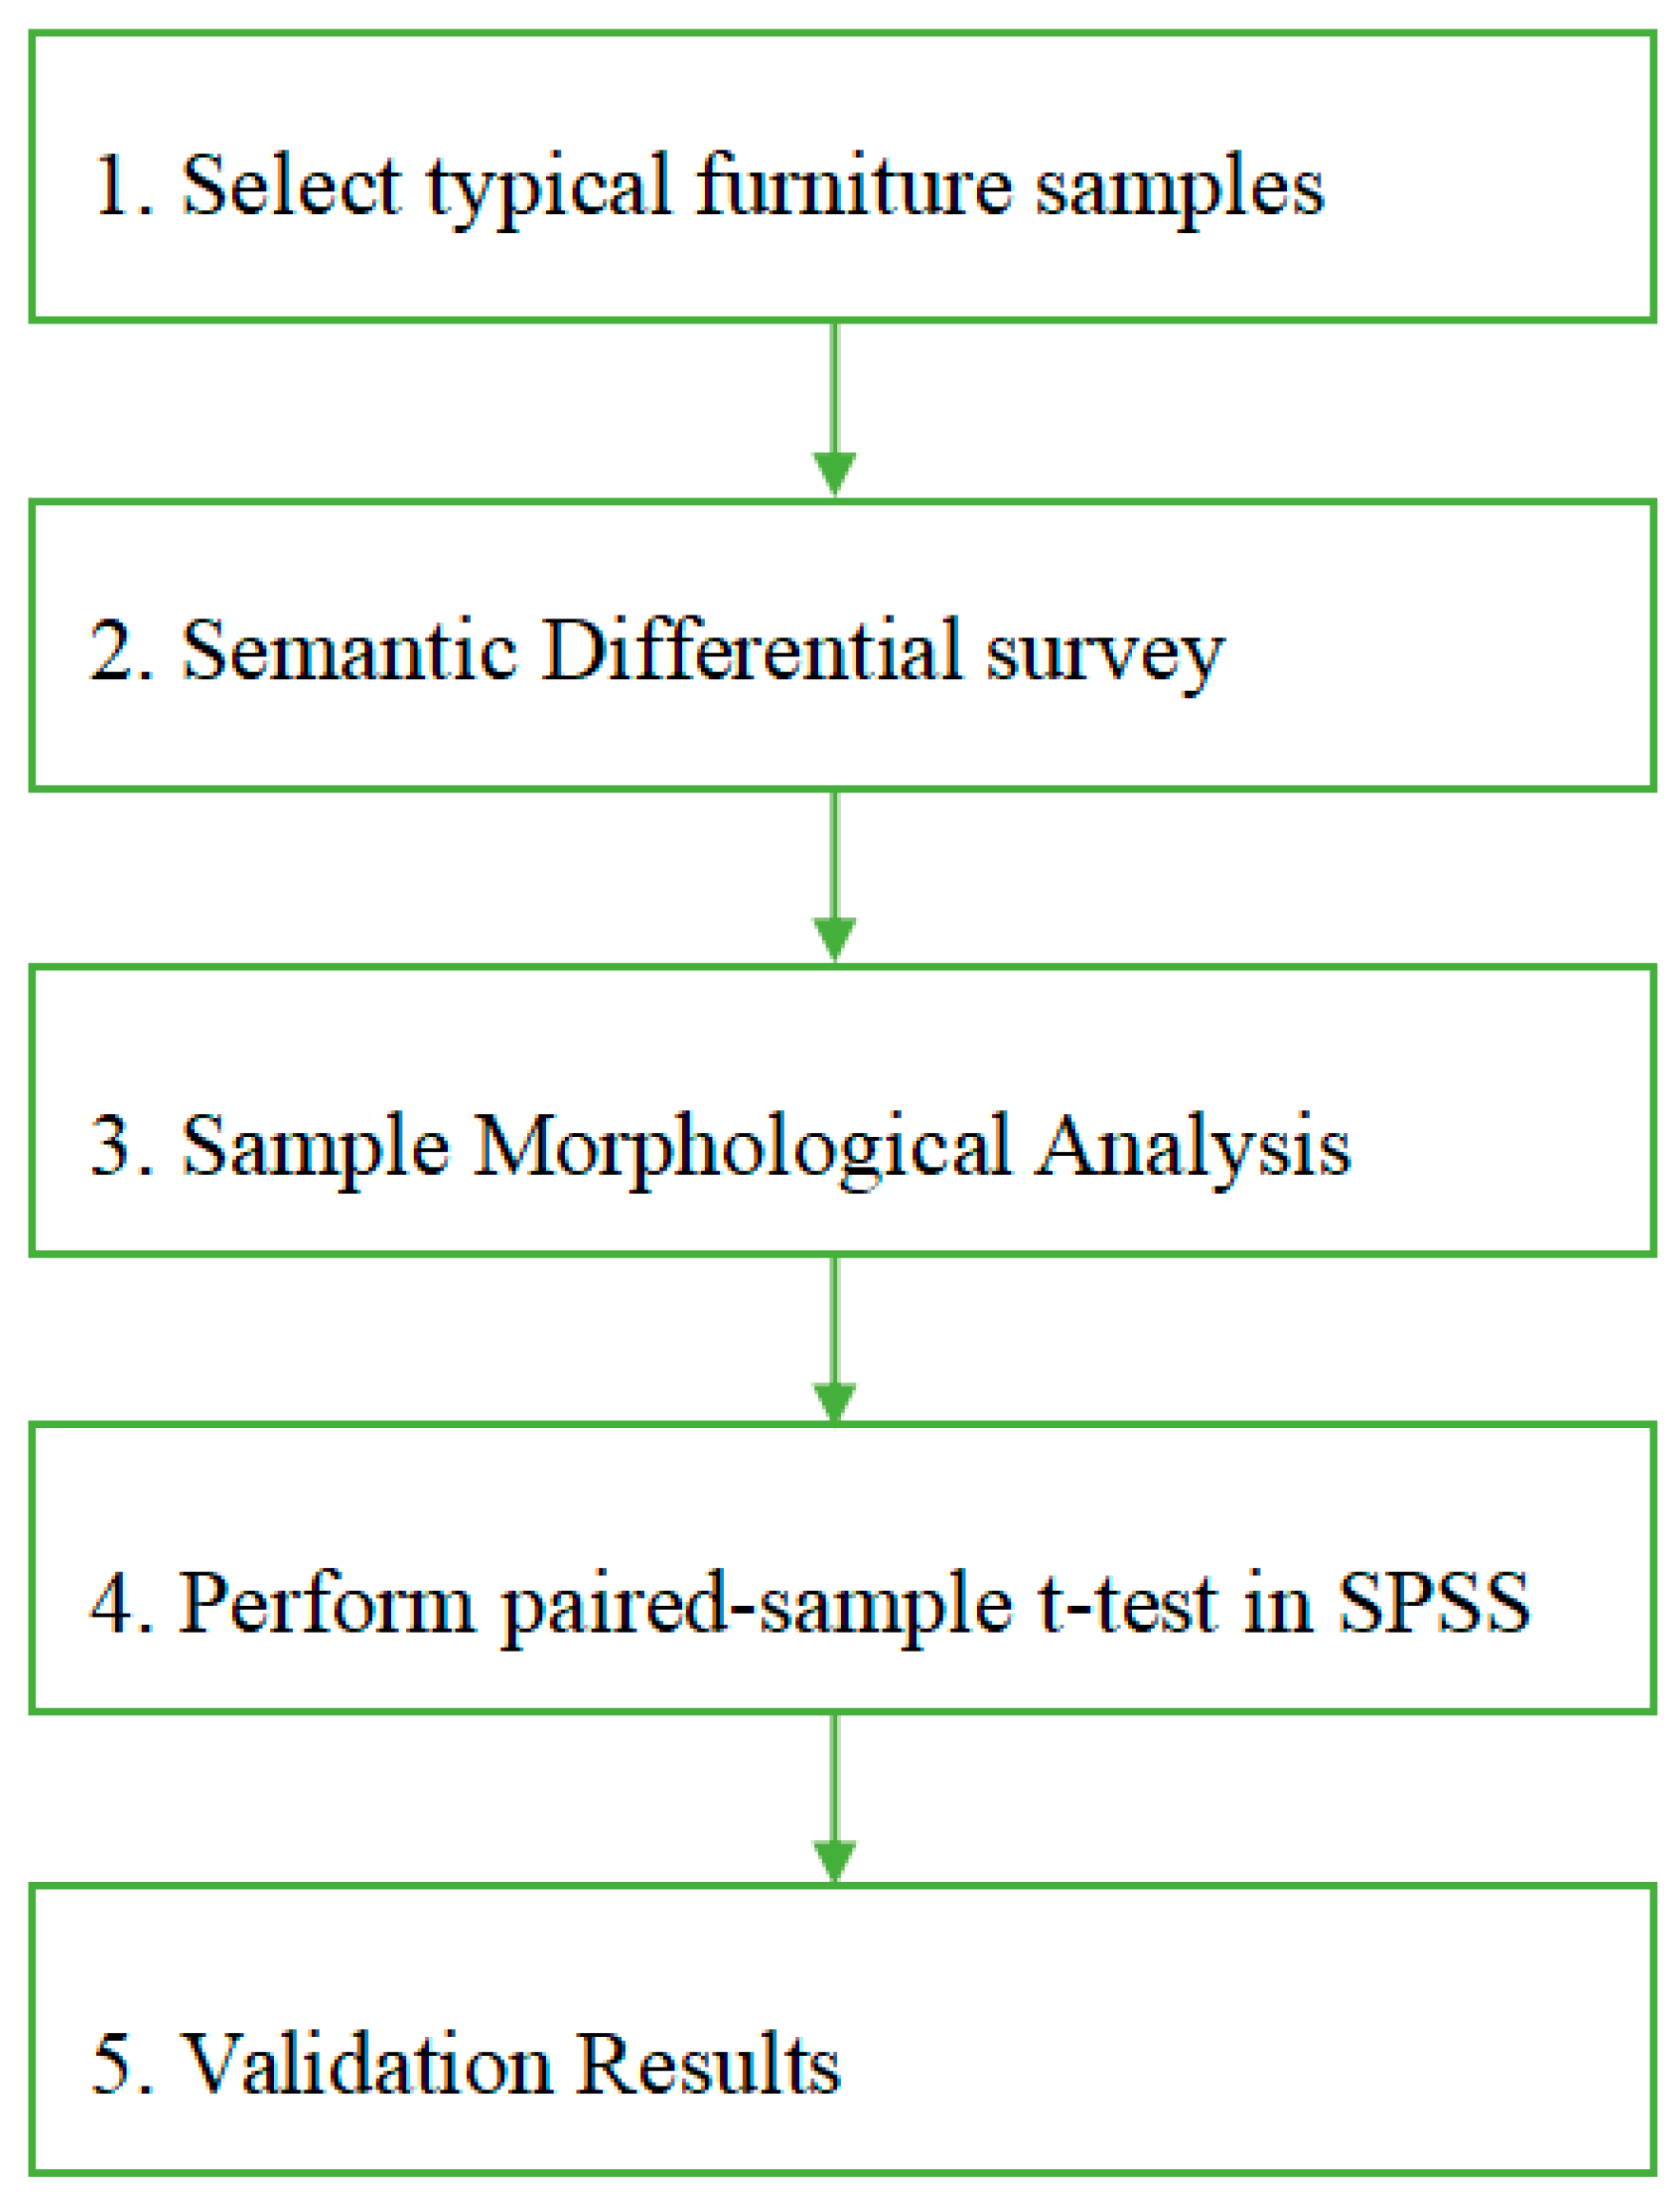
Figure 11.
Two-dimensional perceptual maps: (a) Y1 × Y2, (b) Y3 × Y4, (c) Y5 × Y6.
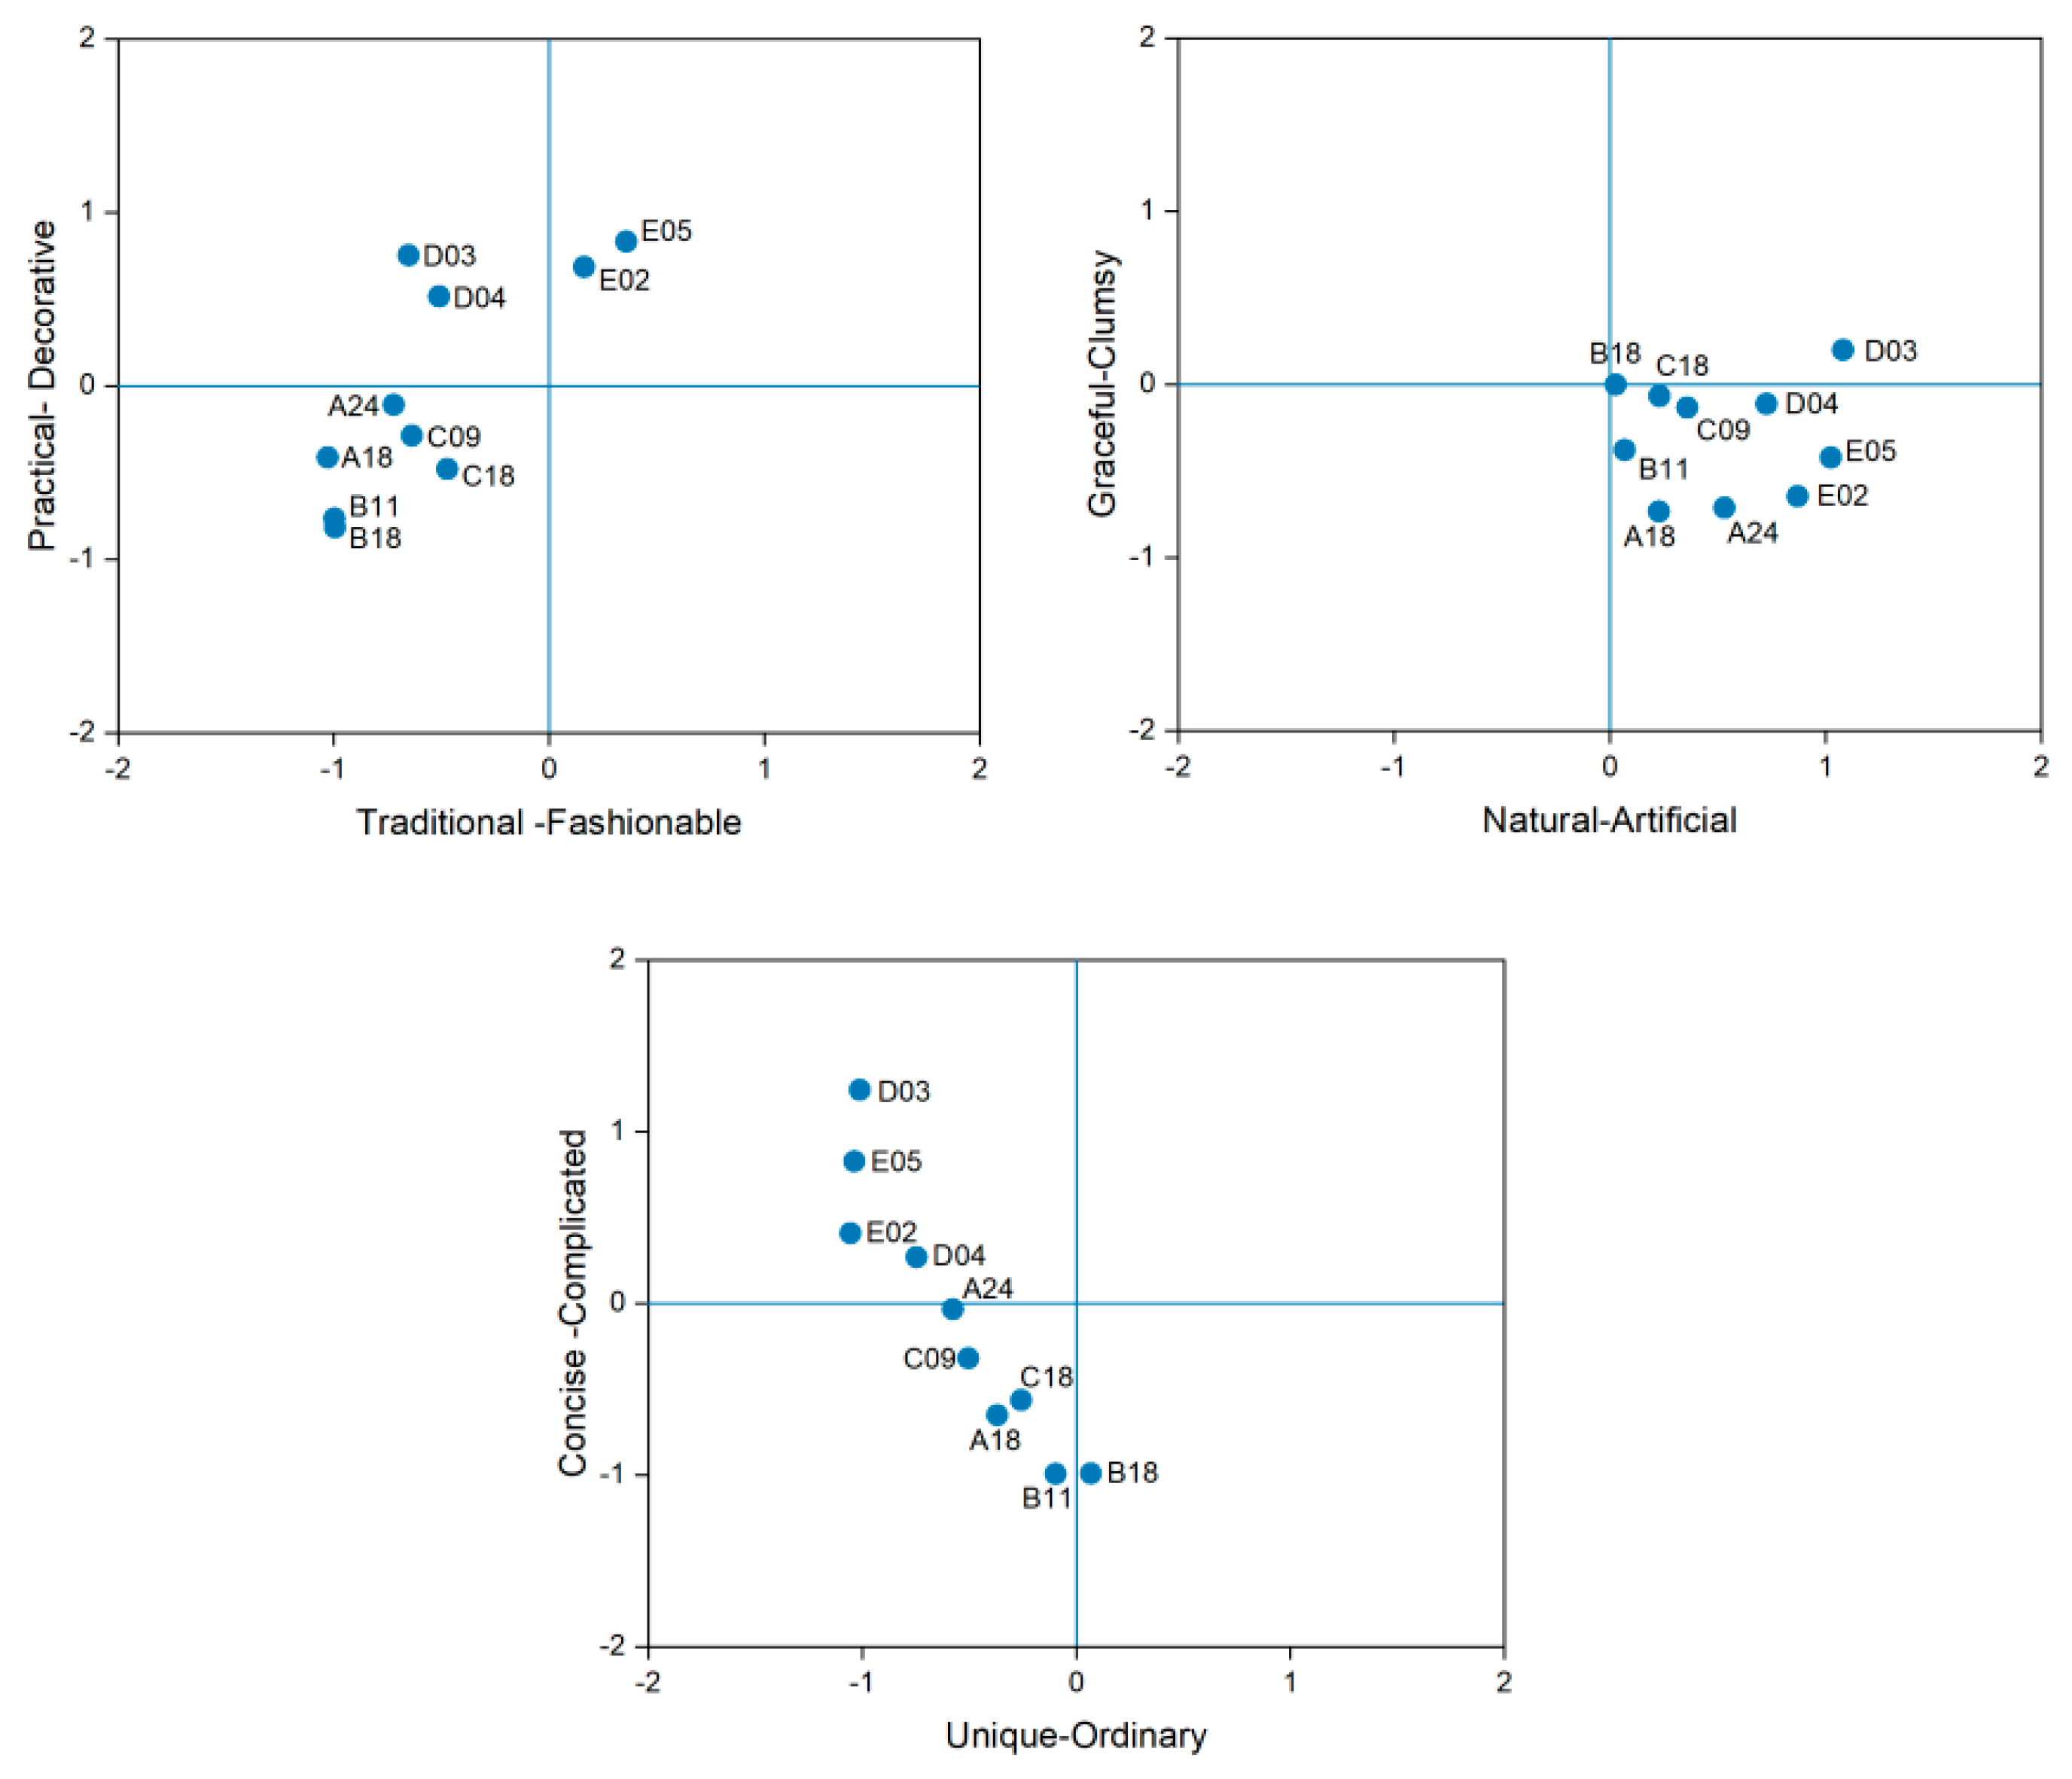
Figure 12.
Heat maps for ten chair stimuli (A18, A24, B11, B18; C09, C18, D03, D04; E02, E05). Red–orange = high fixation density; blue–green = low density.
Figure 12.
Heat maps for ten chair stimuli (A18, A24, B11, B18; C09, C18, D03, D04; E02, E05). Red–orange = high fixation density; blue–green = low density.
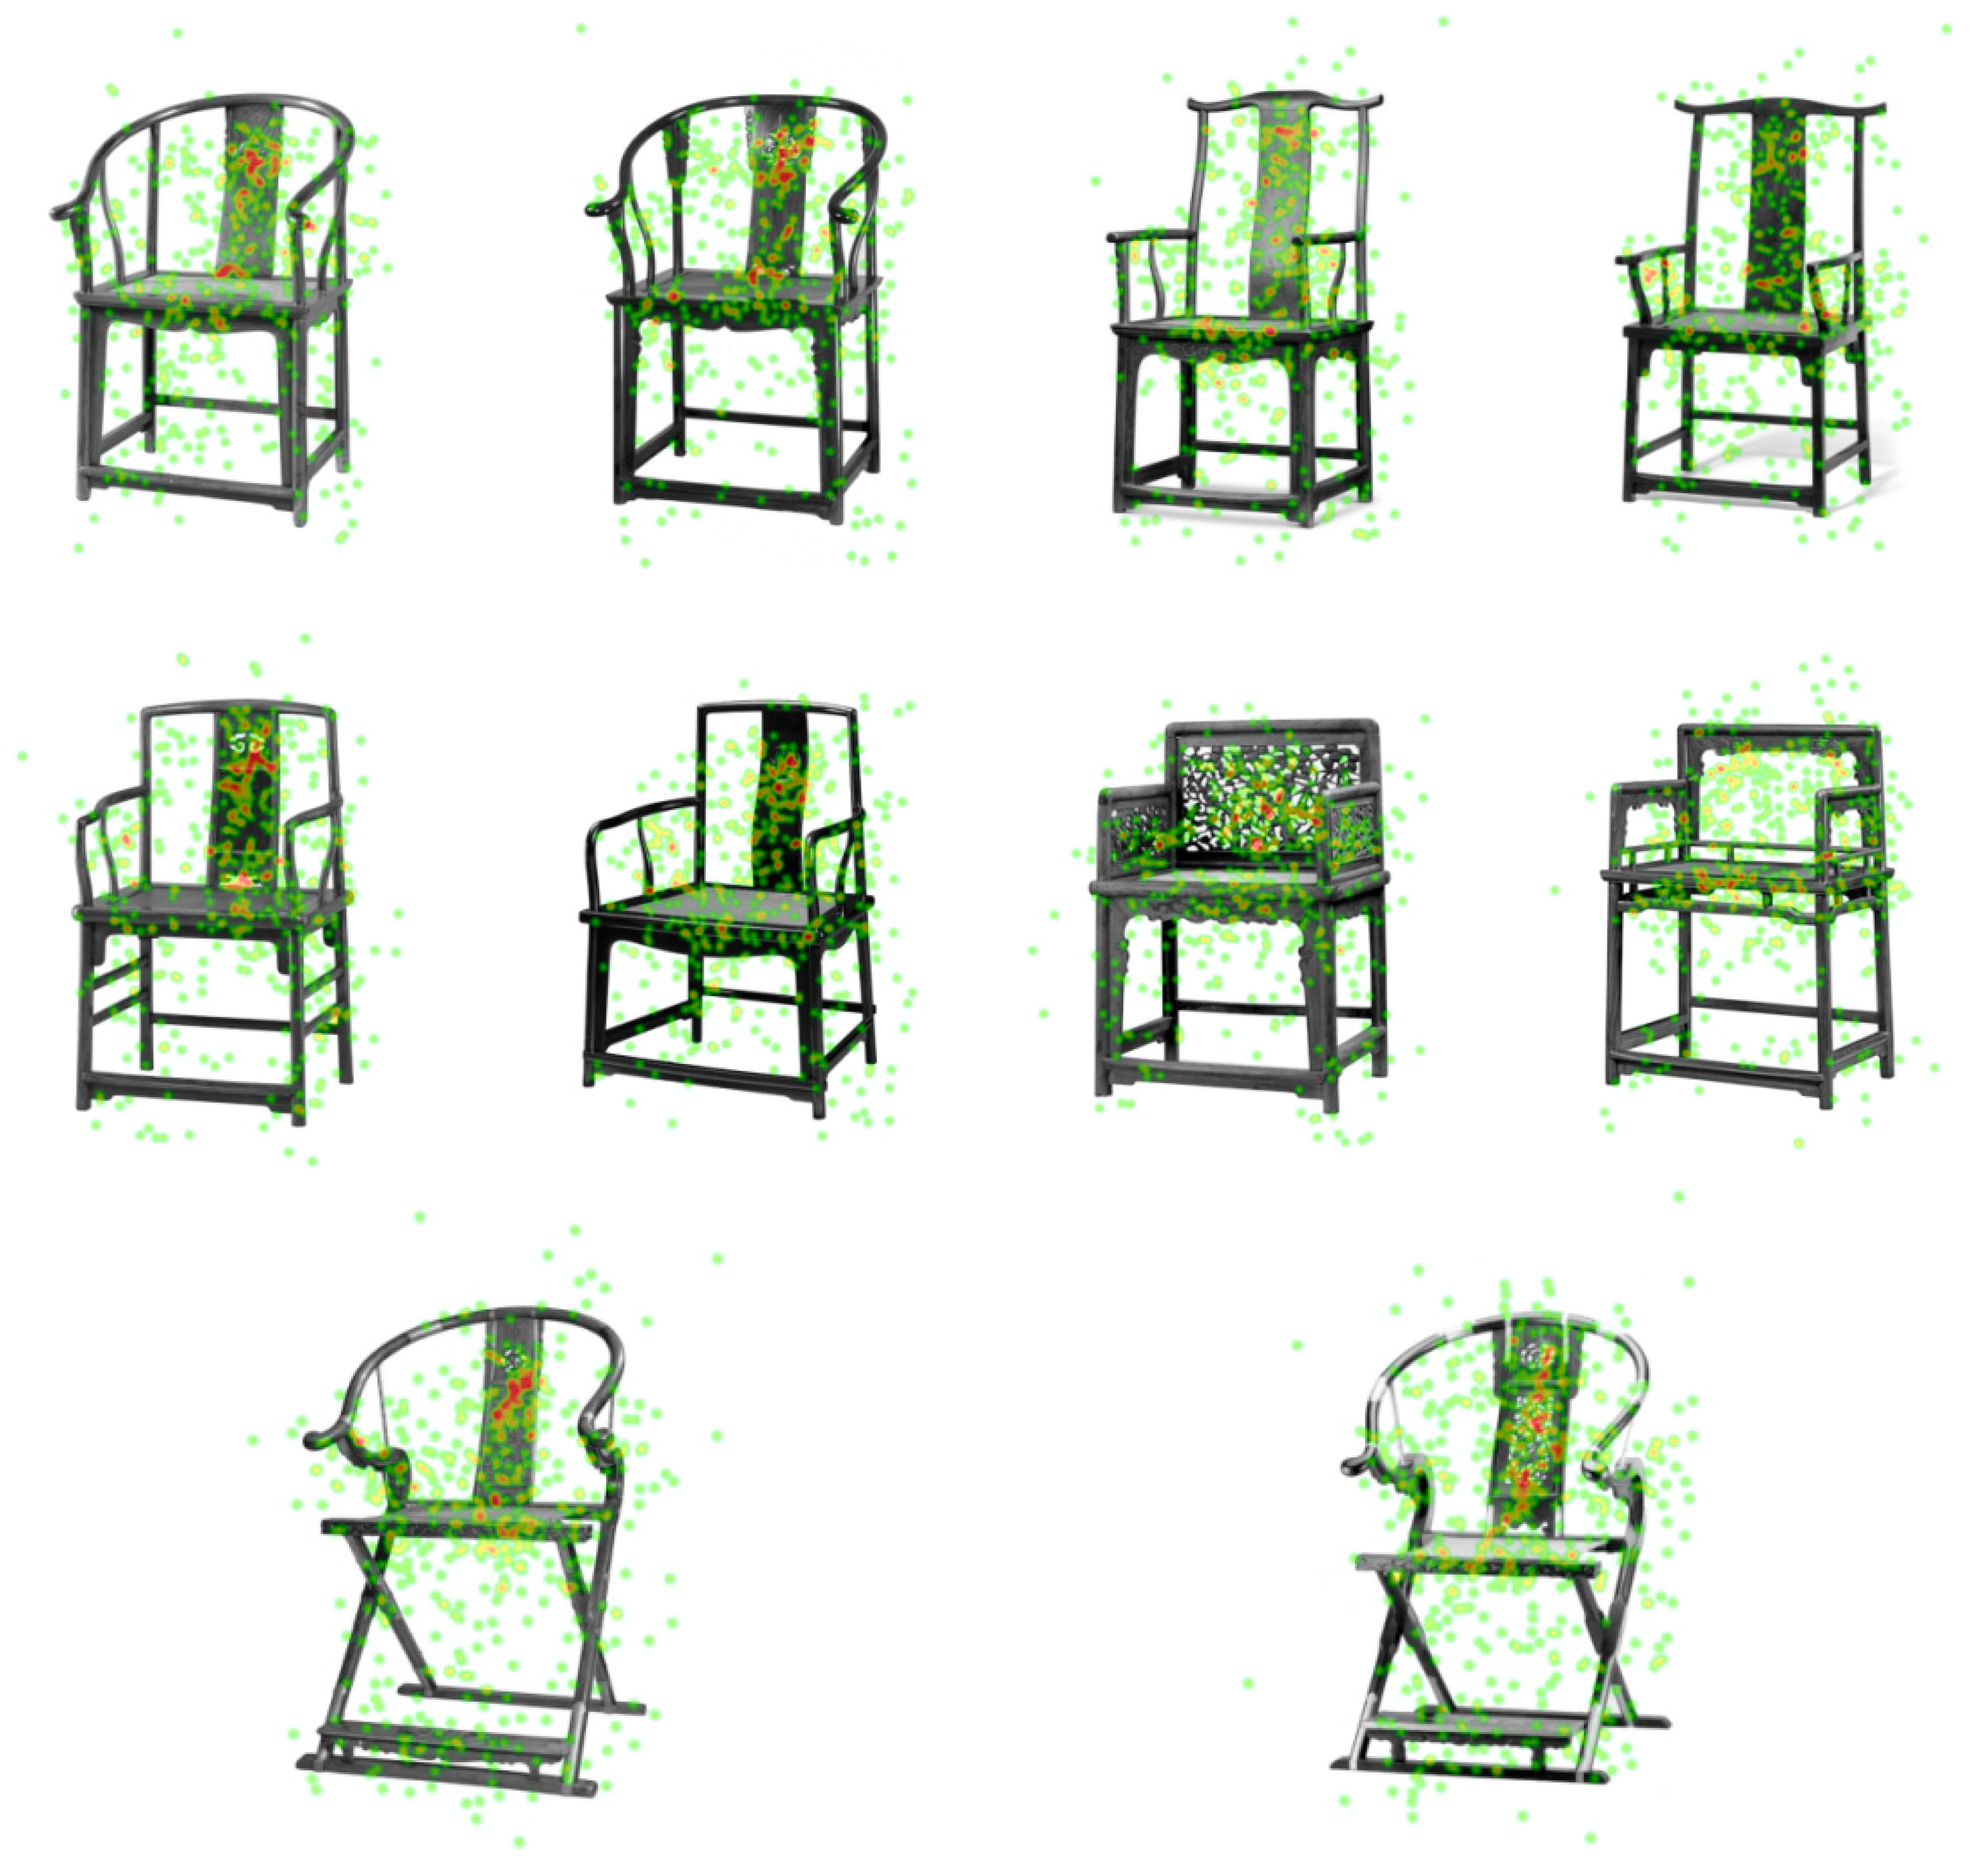
Figure 13.
Gaze plots for ten chair stimuli (same order as Figure 2). Circle size = fixation duration; number = fixation sequence; lines = saccadic paths.
Figure 13.
Gaze plots for ten chair stimuli (same order as Figure 2). Circle size = fixation duration; number = fixation sequence; lines = saccadic paths.
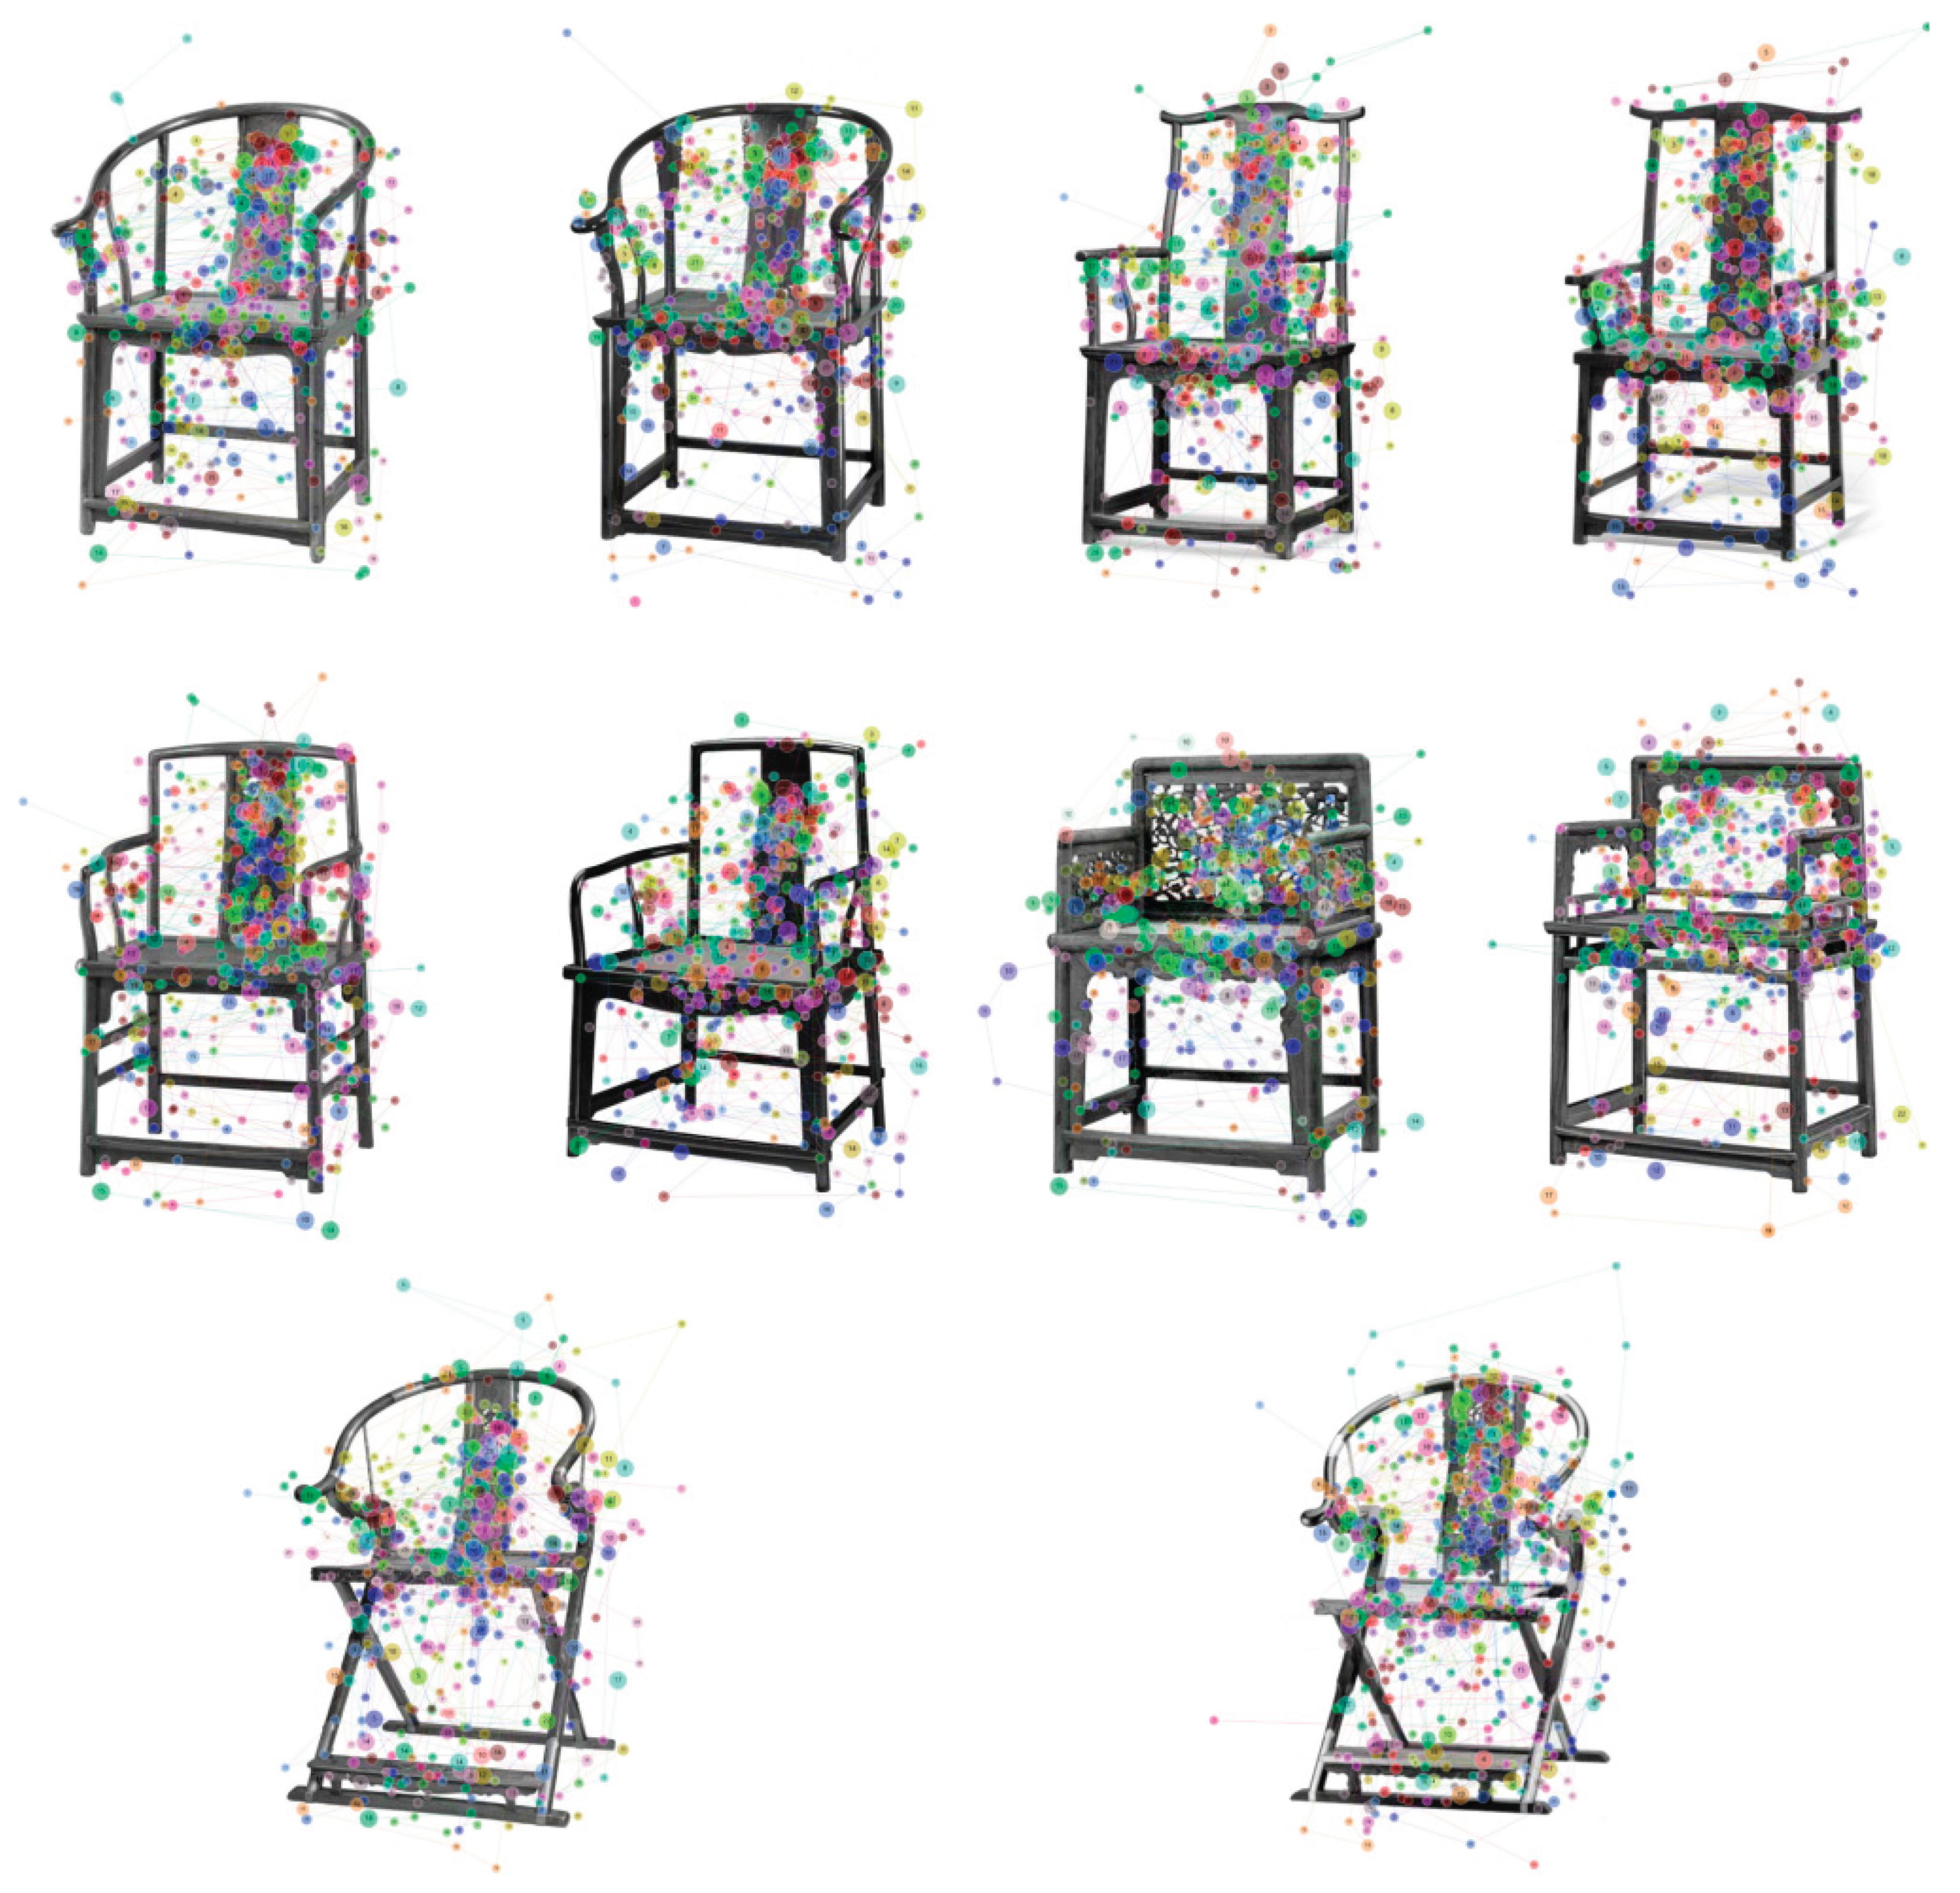

Table 1.
Six bipolar Kansei dimensions derived from MDS and cluster analysis.
| Dim. | Bipolar pair |
| Y1 | Traditional ↔ Fashionable |
| Y2 | Practical ↔ Decorative |
| Y3 | Unique ↔ Ordinary |
| Y4 | Concise ↔ Complicated |
| Y5 | Natural ↔ Artificial |
| Y6 | Graceful ↔ Clumsy |
Table 2.
Composition of the expert panel using the KJ method.
| Name | Age | Organization | Position | Professional Knowledge | Work Experience (Years) |
| Lv Jufang | 54 | Nanjing Forestry University | Director (Institute of Classical Furniture and Mahogany Technology) | Furniture Design and Engineering | 31 |
| Liu Xinyou | 42 | Nanjing Forestry University | Head of Furniture Design Department | Furniture Design and Engineering | 15 |
| Huang Huifang | 35 | Chuanshilong Chinese Classical Furniture Co., Ltd. | Design Director |
Ming-style Furniture Design and Manufacturing | 13 |
| He Pengsheng | 37 | San Fu | Designer of the Research Center for New Chinese Furniture Design | Furniture Design | 13 |
| Gao Weixia | 35 | Changshu University | Lecturer | Furniture Culture | 14 |
| Qian Xiaojin | 59 | San Fu | Factory Director and Design Director | Traditional Chinese Furniture Carpentry, Mortise and Tenon Structure, Shape, and Craftsmanship | 38 |
| Wen Ming | 40 | Youxiang Chinese Classical Furniture Co., Ltd | Design Director | Furniture Design | 14 |
| Ni Jianping | 62 | Yulinshijia Premium Hardwood Furniture | Boss and Designer Director | Ming-style Furniture Design and Manufacturing, Classical Furniture Restoration | 44 |
| Song Weidong | 54 | Sufu Hardwood Furniture Co., Ltd | National Intangible Cultural Heritage Project Representative Inheritor of Ming-style Furniture (City-level), Jiangsu Provincial Craft Master, Senior Craft Artist | Ming-style Furniture Manufacturing Skills | 34 |
| Zhang Tianxing | 42 | Wuyi University | Lecturer | traditional furniture theory research and the restoration of antique lacquer furniture | 14 |
Table 3.
Morphological coding scheme for Ten Ming-style Chair Form Attributes Analysis.
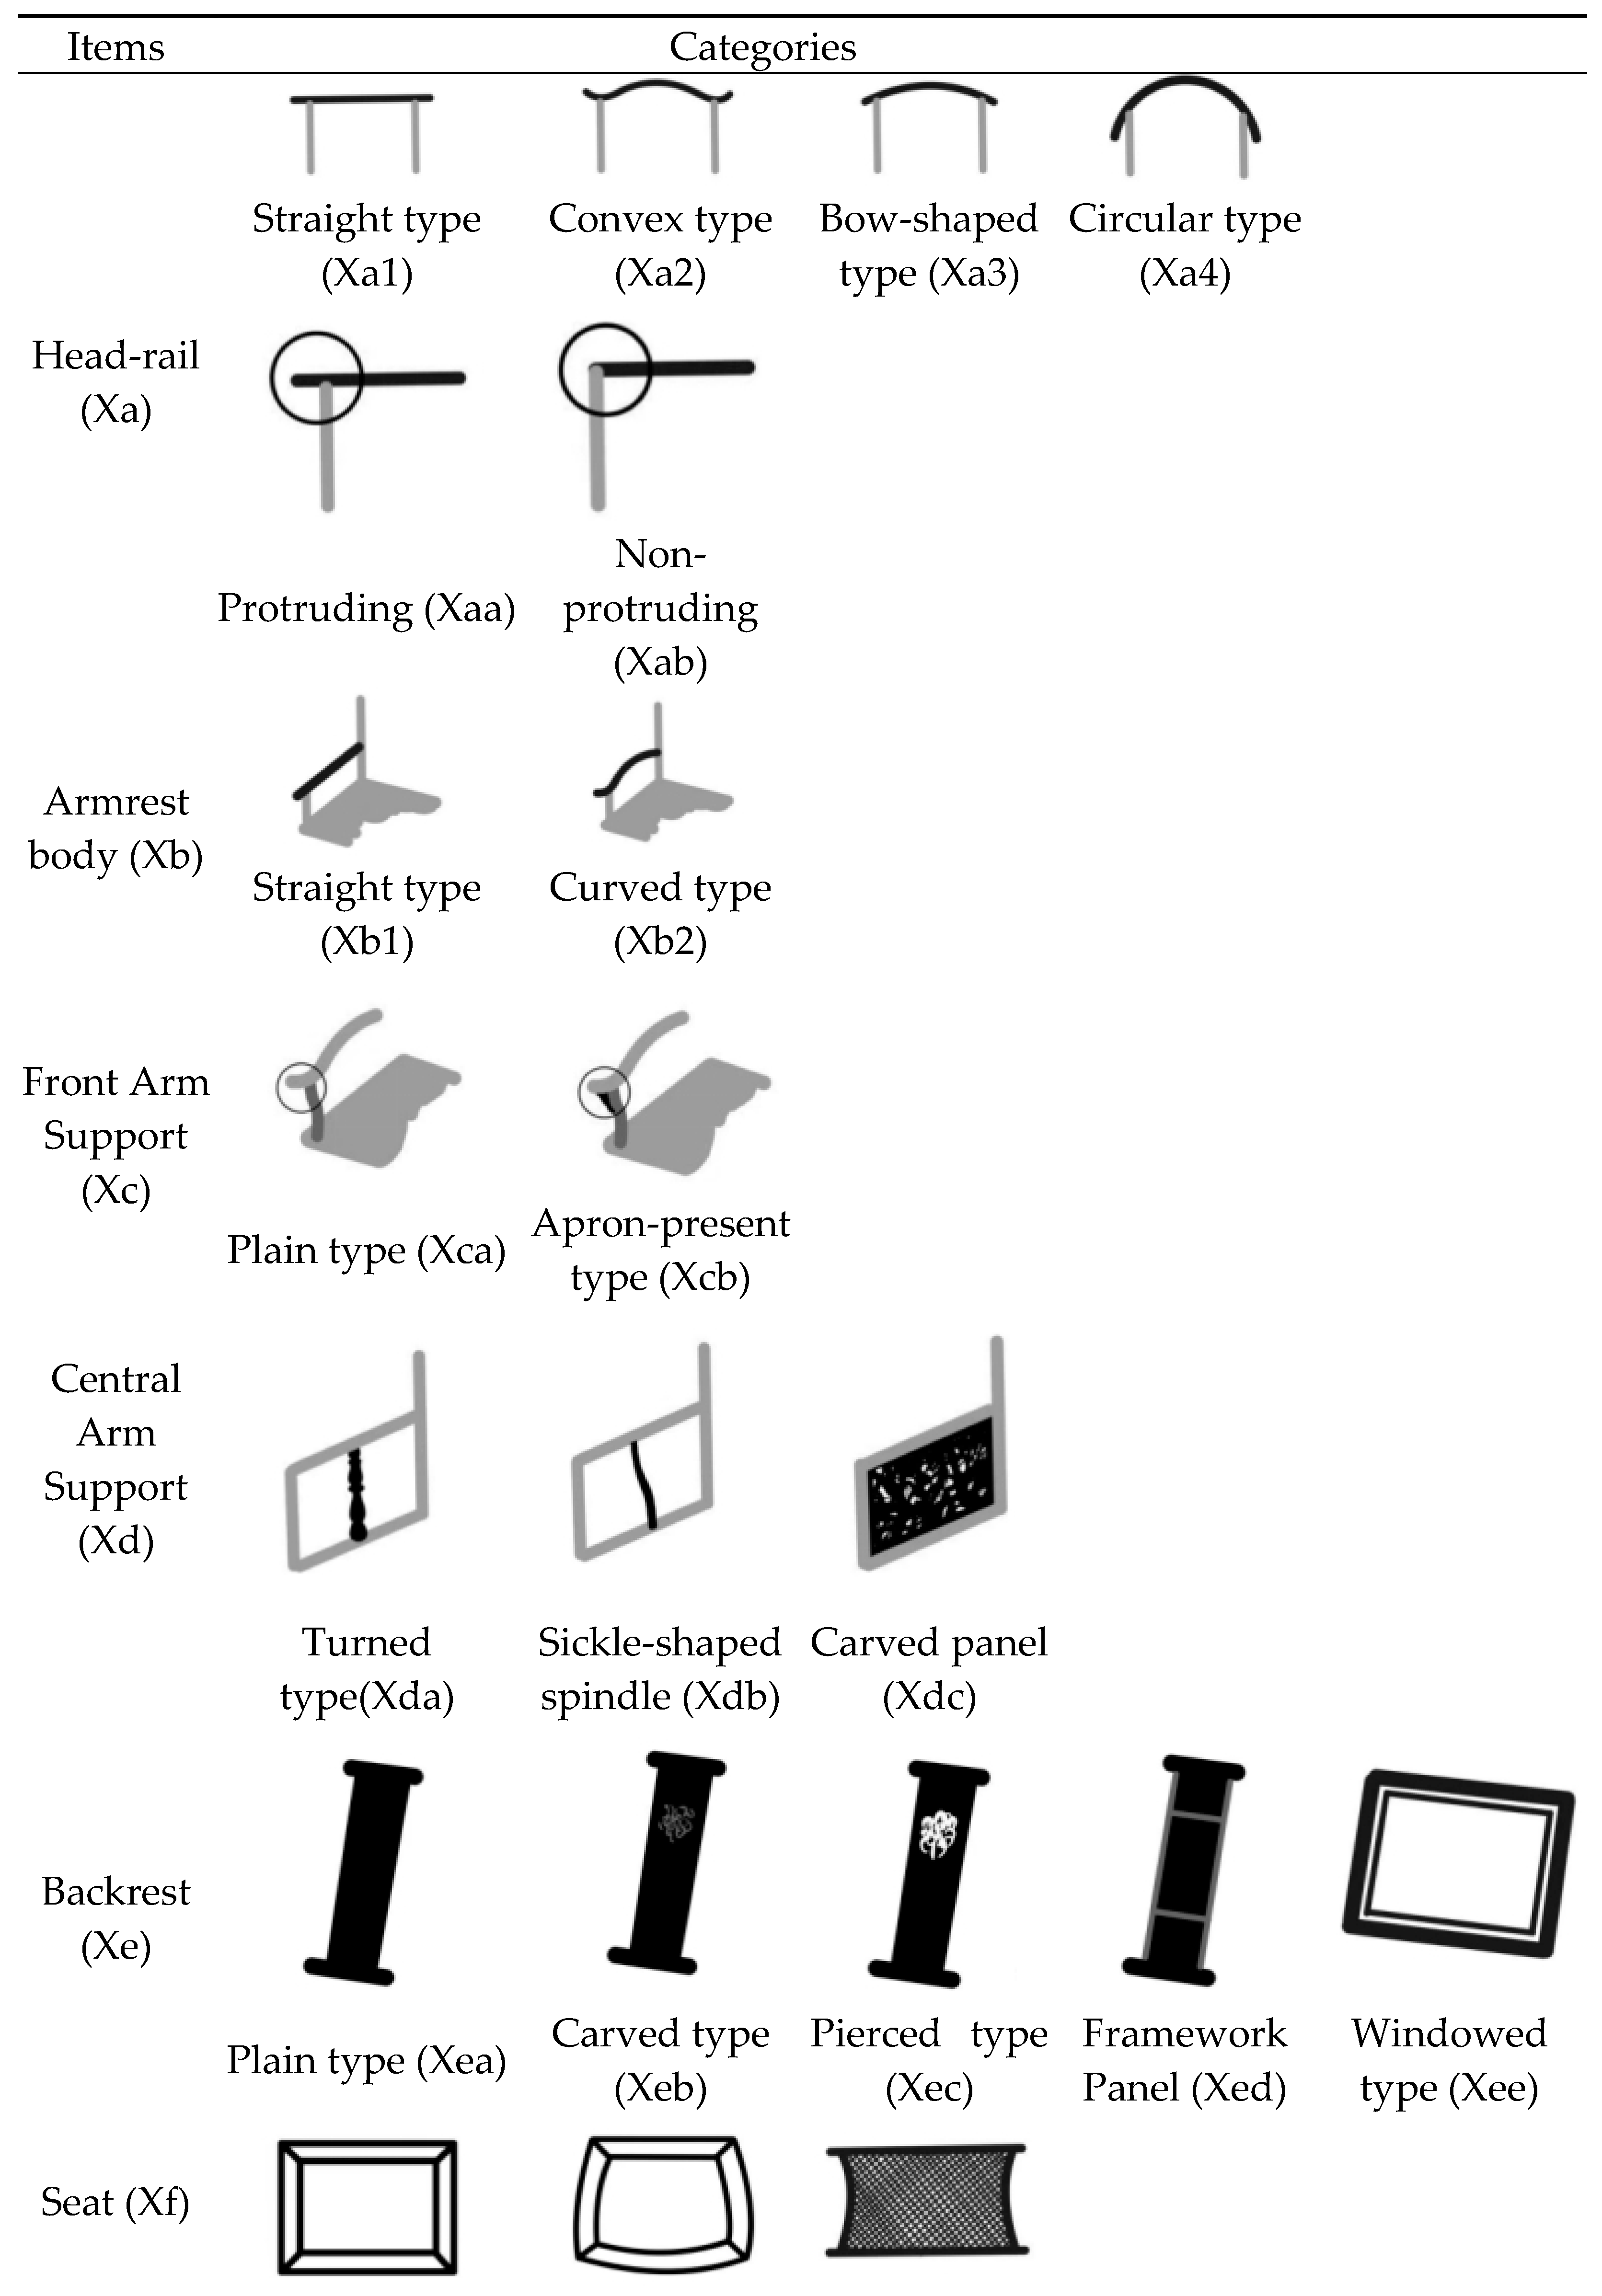
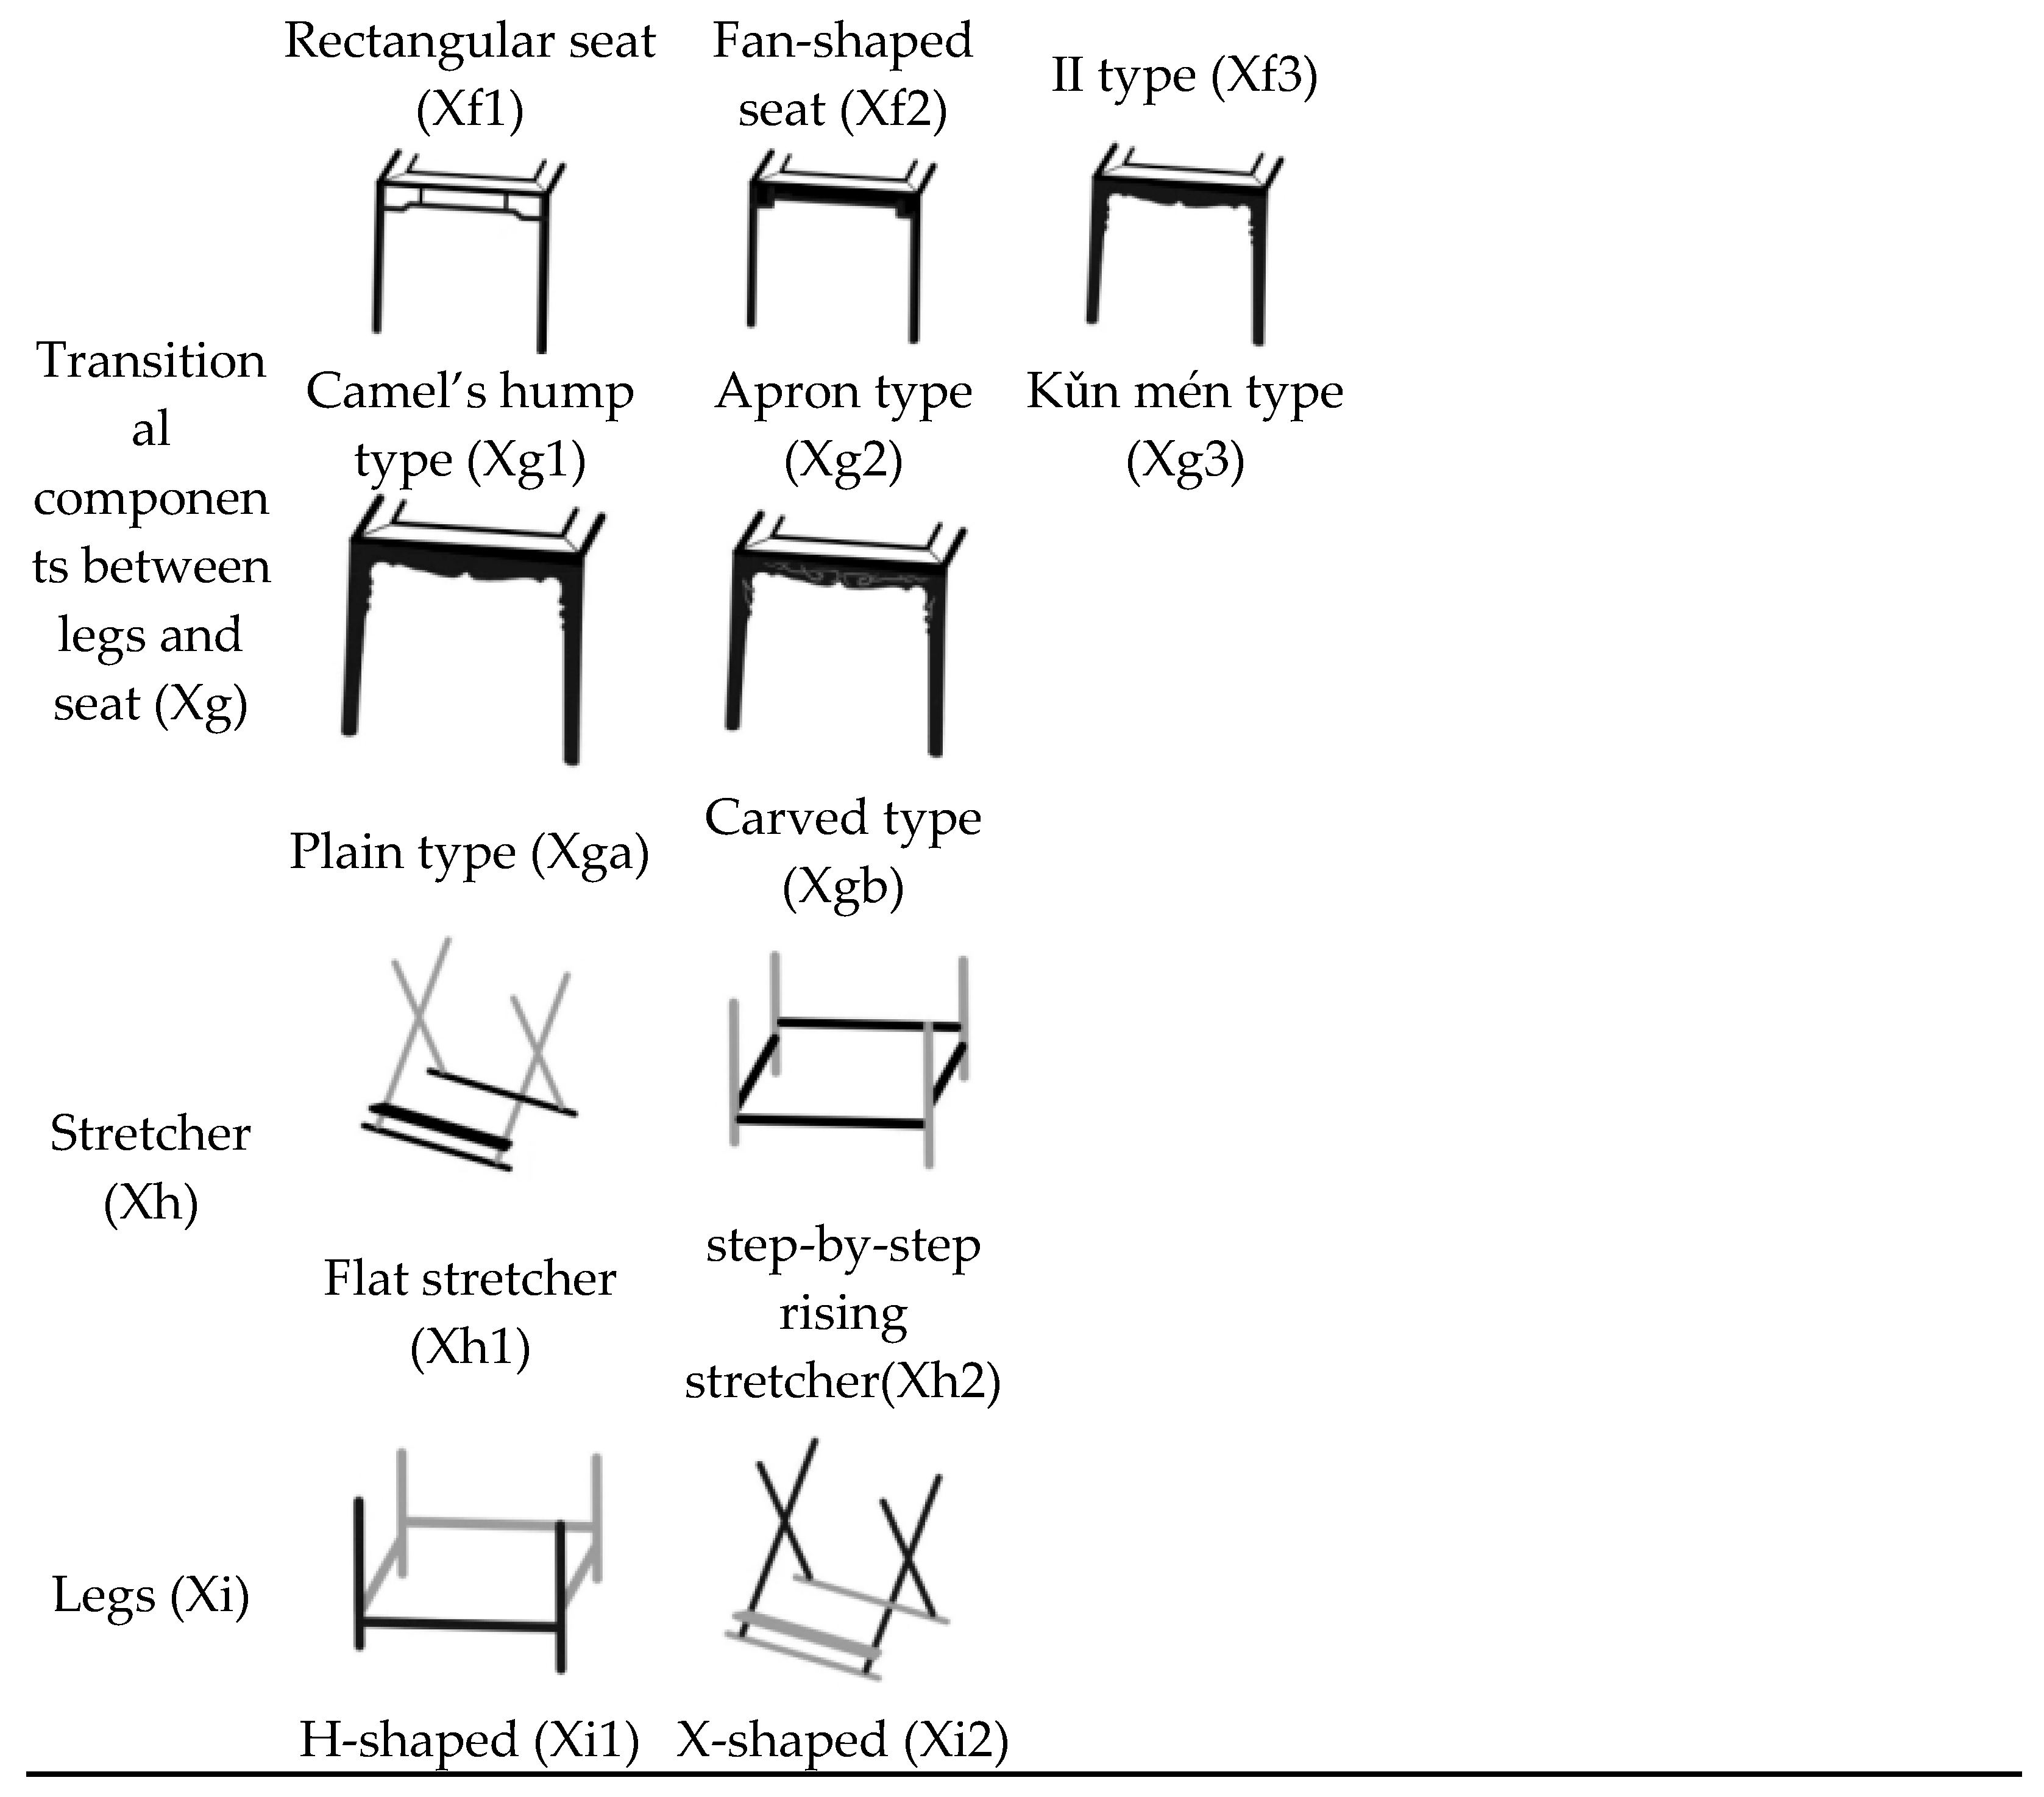
Table 4.
Binary coding matrix of 10 representative Ming-style chair samples.
| NO. | Xa1 | Xa2 | Xa3 | Xa4 | Xa-a | Xa-b | Xb1 | Xb2 | Xc-a | Xc-b | Xd-a | Xd-b | Xd-c | Xe-a | Xe-b | Xe-c | Xe-d | Xe-e | Xf1 | Xf2 | Xf3 | Xg1 | Xg2 | Xg3 | Xga | Xgb | Xh1 | Xh2 | Xi1 | Xi2 |
| A18 | 0 | 0 | 0 | 1 | 0 | 1 | 0 | 0 | 0 | 1 | 0 | 1 | 0 | 0 | 1 | 0 | 0 | 0 | 1 | 0 | 0 | 0 | 0 | 1 | 1 | 0 | 0 | 1 | 1 | 0 |
| A24 | 0 | 0 | 0 | 1 | 0 | 1 | 0 | 0 | 0 | 1 | 0 | 1 | 0 | 0 | 0 | 1 | 0 | 0 | 1 | 0 | 0 | 0 | 0 | 1 | 1 | 0 | 0 | 1 | 1 | 0 |
| B11 | 0 | 1 | 0 | 0 | 1 | 0 | 0 | 1 | 0 | 1 | 0 | 1 | 0 | 1 | 0 | 0 | 0 | 0 | 1 | 0 | 0 | 0 | 0 | 1 | 0 | 1 | 0 | 1 | 1 | 0 |
| B18 | 0 | 1 | 0 | 0 | 1 | 0 | 0 | 1 | 1 | 0 | 1 | 0 | 0 | 1 | 0 | 0 | 0 | 0 | 1 | 0 | 0 | 0 | 0 | 1 | 1 | 0 | 0 | 1 | 1 | 0 |
| C09 | 0 | 0 | 1 | 0 | 0 | 1 | 0 | 1 | 1 | 0 | 0 | 1 | 0 | 0 | 0 | 1 | 1 | 0 | 1 | 0 | 0 | 0 | 1 | 0 | 1 | 0 | 0 | 1 | 1 | 0 |
| C18 | 0 | 0 | 1 | 0 | 0 | 1 | 0 | 1 | 1 | 0 | 0 | 1 | 0 | 0 | 1 | 0 | 0 | 0 | 0 | 1 | 0 | 0 | 0 | 1 | 1 | 0 | 0 | 1 | 1 | 0 |
| D03 | 1 | 0 | 0 | 0 | 0 | 1 | 1 | 0 | 1 | 0 | 0 | 0 | 1 | 0 | 0 | 1 | 0 | 1 | 1 | 0 | 0 | 0 | 0 | 1 | 0 | 1 | 0 | 1 | 1 | 0 |
| D04 | 1 | 0 | 0 | 0 | 0 | 1 | 1 | 0 | 1 | 0 | 0 | 0 | 1 | 0 | 1 | 0 | 0 | 1 | 1 | 0 | 0 | 1 | 0 | 0 | 1 | 0 | 0 | 1 | 1 | 0 |
| E02 | 0 | 0 | 0 | 1 | 0 | 1 | 0 | 0 | 0 | 1 | 0 | 0 | 0 | 0 | 1 | 1 | 1 | 0 | 0 | 0 | 1 | 0 | 0 | 0 | 0 | 1 | 1 | 0 | 0 | 1 |
| E05 | 0 | 0 | 0 | 1 | 0 | 1 | 0 | 0 | 0 | 1 | 0 | 0 | 0 | 0 | 0 | 1 | 1 | 0 | 0 | 0 | 1 | 0 | 0 | 0 | 0 | 1 | 1 | 0 | 0 | 1 |
Table 5.
Sample Demographic Characteristics (N = 389).
| Item | Frequency | Percent(%) | Mean | Median | Std. Deviation | Minimum | Maximum |
| Age Group (years old) | 31.77 | 31 | 4.836 | 23 | 42 | ||
| 25-26 | 11 | 2.8 | |||||
| 26-30 | 172 | 44.2 | |||||
| 31-35 | 120 | 30.8 | |||||
| 36-40 | 65 | 16.7 | |||||
| 40-44 | 21 | 5.4 | |||||
| Gender | |||||||
| Male | 152 | 39.1 | |||||
| Female | 237 | 60.9 | |||||
| Education | |||||||
| Junior high school or below | 2 | 0.5 | |||||
| General high school/Technical secondary school/Technical school/Vocational high school | 13 | 3.3 | |||||
| Junior college | 43 | 11.1 | |||||
| Undergraduate | 259 | 66.6 | |||||
| Master | 66 | 17 | |||||
| Doctor | 6 | 1.5 | |||||
| Occupation | |||||||
| Engineer | 84 | 21.6 | |||||
| Sales and Marketing Professional | 71 | 18.3 | |||||
| Designer/Artist | 62 | 15.9 | |||||
| Self-employed/Freelance Professional | 40 | 10.3 | |||||
| Educator/Teaching Professional | 27 | 6.9 | |||||
| Government Employee/Public Sector Worker | 22 | 5.7 | |||||
| Corporate/Institutional Staff | 21 | 5.4 | |||||
| Service Sector Employee | 17 | 4.4 | |||||
| Administrative/Management Personnel | 17 | 4.4 | |||||
| Manufacturing Sector Worker | 11 | 2.8 | |||||
| Healthcare Practitioner and Technician | 9 | 2.3 | |||||
| Finance and Accounting Professional | 8 | 2.1 | |||||
| Design Field | |||||||
| Yes | 136 | 35 | |||||
| No | 253 | 65 | |||||
| Monthly Income (RMB) | 12811.05 | 10000 | 12559.648 | 0 | 180000 | ||
| <5001 | 28 | 7.19 | |||||
| 5001-10000 | 182 | 46.8 | |||||
| 10001-15000 | 96 | 24.7 | |||||
| 15001-20000 | 58 | 14.9 | |||||
| >20001 | 25 | 6.4 | |||||
| Family Structure | |||||||
| Single | 110 | 28.3 | |||||
| Unmarried couple/In a relationship | 55 | 14.1 | |||||
| Married without children | 18 | 4.6 | |||||
| Married with children | 205 | 52.7 | |||||
| Divorced with children | 1 | 0.3 | |||||
| Family Number | |||||||
| 1 | 37 | 9.5 | |||||
| 2 | 51 | 13.1 | |||||
| 3 | 124 | 31.9 | |||||
| 4 | 96 | 24.7 | |||||
| 5 | 59 | 15.2 | |||||
| 6 | 16 | 4.1 | |||||
| 7 | 6 | 1.5 | |||||
| House Type | |||||||
| Commercial housing/Standard residential apartment | 245 | 63.1 | |||||
| Apartment/Condominium | 74 | 19 | |||||
| Self-built rural house/Village house | 34 | 8.7 | |||||
| Staff dormitory/Student dormitory | 24 | 6.2 | |||||
| Villa/Detached house | 6 | 1.5 | |||||
| Rental/Rented accommodation | 6 | 1.5 | |||||
| Decoration Type | |||||||
| Modern Minimalist Style | 283 | 72.8 | |||||
| Traditional Chinese Style | 72 | 18.5 | |||||
| Contemporary European Style | 18 | 4.6 | |||||
| Rustic/Country Style | 5 | 1.3 | |||||
| Industrial Style | 4 | 1 | |||||
| Basic Functional Style | 3 | 0.8 | |||||
| Luxury/Opulent Style | 2 | 0.5 | |||||
| American Style | 1 | 0.3 | |||||
| Japanese/Zen Style | 1 | 0.3 | |||||
| Housing Area (m2) | 90.29 | 90 | 47.546 | 7 | 400 | ||
| <51 | 91 | 23.4 | |||||
| 51-100 | 161 | 41.4 | |||||
| 101-150 | 118 | 30.3 | |||||
| 151-200 | 12 | 3.1 | |||||
| >200 | 7 | 1.8 |
Table 6.
Demographic Characteristics of Final Participant Samples of Eye Tracking Experiment (N = 30).
Table 6.
Demographic Characteristics of Final Participant Samples of Eye Tracking Experiment (N = 30).
| No. | Initials | Gender | Age | Design Field | No. | Initials | Gender | Age | Design Field |
| 106 | CXY | Female | 25 | Yes | 201 | TX | Male | 39 | No |
| 109 | LJM | Male | 26 | Yes | 205 | HDJ | Female | 30 | No |
| 110 | FWY | Female | 24 | Yes | 206 | LRT | Male | 32 | No |
| 112 | LHP | Male | 31 | Yes | 207 | YEY | Female | 26 | No |
| 113 | HSW | Female | 27 | Yes | 208 | FHL | Male | 42 | No |
| 114 | ZDH | Male | 30 | Yes | 213 | HJB | Male | 38 | No |
| 115 | LZJ | Male | 27 | Yes | 214 | JGQ | Male | 36 | No |
| 117 | MZH | Female | 32 | Yes | 215 | YZJ | Male | 34 | No |
| 118 | HXY | Female | 38 | Yes | 217 | LY | Female | 37 | No |
| 119 | LQJ | Male | 35 | Yes | 218 | HZY | Male | 27 | No |
| 122 | CMZ | Male | 32 | Yes | 219 | CCM | Male | 25 | No |
| 123 | OYWN | Female | 37 | Yes | 221 | LLM | Female | 26 | No |
| 124 | XY | Male | 41 | Yes | 222 | WSM | Male | 39 | No |
| 126 | SYN | Female | 33 | Yes | 223 | DRH | Female | 37 | No |
| 130 | LYC | Male | 36 | Yes | 225 | WXL | Female | 43 | No |
Note: Group 1 (106-130) = Design professionals with formal training and/or professional experience in design-related fields; Group 2 (201-225) = Non-professionals with no design background. Participant identifiers are anonymized codes assigned to ensure confidentiality.
Table 7.
Key Performance Indicators extracted per AOI from the eye-tracking experiment.
| No. | Indicator | Description |
| 1 | Sequence | Order in which the participant’s gaze first visited each AOI |
| 2 | Time to first fixation | Time elapsed from stimulus onset to the first fixation within the AOI (ms) |
| 3 | Total visit duration | Total time spent in a single continuous visit to the AOI, including all fixations (ms) |
| 4 | Visit count | Number of separate entries into the AOI across the trial |
| 5 | Total fixation duration | Sum of all fixation durations within the AOI across the entire trial (ms) — primary weighting metric |
| 6 | Average fixation duration | Mean duration of individual fixations within the AOI (ms) |
| 7 | Fixation count | Total number of fixations recorded within the AOI |
Table 8.
Kansei words retained after frequency screening (N = 62; threshold > 1/3).
| Kansei word | n | % | Kansei word | n | % |
| Classic | 49 | 79.0 | Rhythmic | 29 | 46.8 |
| Stable | 47 | 75.8 | Traditional | 42 | 67.7 |
| Elegant | 44 | 71.0 | Poetic | 33 | 53.2 |
| Exquisite | 33 | 53.2 | Durable | 33 | 53.2 |
| Smooth | 31 | 50.0 | Solid | 27 | 43.5 |
| Practical | 29 | 46.8 | Noble | 25 | 40.3 |
| Concise | 29 | 46.8 | Unadorned | 25 | 40.3 |
| Unique | 25 | 40.3 | Graceful | 21 | 33.9 |
| Natural | 24 | 38.7 |
Table 9.
Mean semantic differential ratings for ten Ming-style chair stimuli (N = 389).
| Stimulus | Y1 Trad.–Fash. | Y2 Prac.–Dec. | Y3 Uniq.–Ord. | Y4 Con.–Comp. | Y5 Nat.–Art. | Y6 Grac.–Clum. |
| A18 | −1.028 | −0.411 | −0.370 | −0.650 | 0.226 | −0.733 |
| A24 | −0.722 | −0.108 | −0.578 | −0.033 | 0.530 | −0.711 |
| B11 | −0.997 | −0.763 | −0.098 | −0.992 | 0.067 | −0.378 |
| B18 | −0.995 | −0.815 | 0.067 | −0.990 | 0.026 | 0.000 |
| C09 | −0.638 | −0.285 | −0.506 | −0.319 | 0.357 | −0.133 |
| C18 | −0.473 | −0.478 | −0.260 | −0.563 | 0.229 | −0.067 |
| D03 | −0.653 | 0.753 | −1.013 | 1.244 | 1.080 | 0.200 |
| D04 | −0.512 | 0.517 | −0.748 | 0.270 | 0.725 | −0.111 |
| E02 | 0.162 | 0.686 | −1.057 | 0.409 | 0.869 | −0.644 |
| E05 | 0.357 | 0.833 | −1.039 | 0.828 | 1.023 | −0.422 |
Table 10.
Total fixation duration (ms) per AOI across ten stimuli, and element-level fixation weight (%).
Table 10.
Total fixation duration (ms) per AOI across ten stimuli, and element-level fixation weight (%).
| Stimulus | AOI-1 Xa | AOI-2 Xb | AOI-3 Xc | AOI-4 Xd | AOI-5 Xe | AOI-6 Xf | AOI-7 Xg | AOI-8 Xh | AOI-9 Xi |
| A18 | 740 | 5367 | 3418 | 4038 | 78724 | 18819 | 10574 | 4927 | 6426 |
| A24 | 1769 | 3308 | 2549 | 2289 | 72078 | 27044 | 11133 | 2908 | 7885 |
| B11 | 10044 | 3228 | 7136 | 2828 | 56857 | 21957 | 11084 | 3918 | 10444 |
| B18 | 2958 | 1739 | 6057 | 5837 | 47262 | 21397 | 7126 | 4537 | 15331 |
| C09 | 1659 | 1629 | 4298 | 2139 | 86520 | 20108 | 7256 | 6426 | 8545 |
| C18 | 1049 | 5887 | 2579 | 3238 | 53089 | 29463 | 8895 | 3758 | 8895 |
| D03 | 1859 | 1179 | 16041 | 2728 | 59915 | 11753 | 24955 | 3138 | 6576 |
| D04 | 8375 | 1509 | 15081 | 4897 | 61884 | 21897 | 20548 | 4587 | 11583 |
| E02 | 3798 | 4927 | 5687 | 0 | 53878 | 12183 | 7226 | 9025 | 12283 |
| E05 | 3318 | 7646 | 3228 | 2439 | 67290 | 14032 | 7426 | 12433 | 10144 |
| Weight (%) | 2.79 | 2.86 | 5.18 | 2.39 | 50.01 | 15.59 | 9.12 | 4.37 | 7.70 |
Table 11.
Coefficient of variation (CV) per AOI per stimulus, mean CV (V̄_bi), and normalised attention weight (w_bi).
Table 11.
Coefficient of variation (CV) per AOI per stimulus, mean CV (V̄_bi), and normalised attention weight (w_bi).
| Sample | AOI-1 Xa | AOI-2 Xb | AOI-3 Xc | AOI-4 Xd | AOI-5 Xe | AOI-6 Xf | AOI-7 Xg | AOI-8 Xh | AOI-9 Xi |
| A18 | 0.941 | 0.820 | 0.677 | 0.650 | 1.278 | 0.187 | 0.179 | 0.224 | 1.295 |
| A24 | 0.597 | 0.159 | 0.862 | 0.493 | 0.711 | 1.280 | 0.083 | 0.932 | 0.737 |
| B11 | 2.166 | 0.197 | 0.112 | 0.140 | 0.588 | 0.373 | 0.092 | 0.578 | 0.242 |
| B18 | 0.200 | 0.904 | 0.117 | 1.825 | 1.407 | 0.273 | 0.768 | 0.361 | 2.112 |
| C09 | 0.634 | 0.957 | 0.490 | 0.591 | 1.943 | 0.043 | 0.746 | 0.302 | 0.484 |
| C18 | 0.837 | 1.067 | 0.855 | 0.127 | 0.910 | 1.711 | 0.466 | 0.634 | 0.351 |
| D03 | 0.567 | 1.170 | 2.003 | 0.206 | 0.327 | 1.447 | 2.277 | 0.852 | 1.238 |
| D04 | 1.609 | 1.014 | 1.799 | 1.211 | 0.159 | 0.362 | 1.525 | 0.343 | 0.678 |
| E02 | 0.080 | 0.611 | 0.195 | 1.938 | 0.842 | 1.370 | 0.751 | 1.214 | 0.946 |
| E05 | 0.080 | 1.903 | 0.717 | 0.395 | 0.302 | 1.040 | 0.717 | 2.410 | 0.127 |
| V̄_bi | 0.842 | 0.578 | 0.713 | 0.503 | 0.184 | 0.282 | 0.504 | 0.512 | 0.266 |
| w_bi | 0.192 | 0.132 | 0.163 | 0.115 | 0.042 | 0.064 | 0.115 | 0.117 | 0.061 |
Table 12.
The form attributes’ parameters for samples.
| NO. | Xa1 | Xa2 | Xa3 | Xa4 | Xb1 | Xb2 | Xc1 | Xc2 | Xd1 | Xd2 | Xe1 | Xe2 | Xe3 | Xf1 | Xf2 | Xf3 | Xg1 | Xg2 | Xg3 | Xg4 | |||||||
| A18 | 0 | 0 | 0 | 0.192 | 0 | 0.132 | 0 | 0.163 | 0.115 | 0 | 0 | 0.042 | 0 | 0.064 | 0 | 0 | 0 | 0 | 0 | 0.115 | |||||||
| A24 | 0 | 0 | 0 | 0.192 | 0 | 0.132 | 0 | 0.163 | 0.115 | 0 | 0 | 0.042 | 0 | 0.064 | 0 | 0 | 0 | 0 | 0 | 0.115 | |||||||
| B11 | 0 | 0.192 | 0 | 0 | 0 | 0.132 | 0 | 0.163 | 0.115 | 0 | 0 | 0 | 0.042 | 0.064 | 0 | 0 | 0 | 0 | 0 | 0.115 | |||||||
| B18 | 0 | 0.192 | 0 | 0 | 0 | 0.132 | 0 | 0.163 | 0.115 | 0 | 0 | 0 | 0.042 | 0.064 | 0 | 0 | 0 | 0 | 0 | 0.115 | |||||||
| C09 | 0 | 0 | 0.192 | 0 | 0 | 0.132 | 0 | 0.163 | 0.115 | 0 | 0 | 0.042 | 0 | 0.064 | 0 | 0 | 0 | 0 | 0.115 | 0 | |||||||
| C18 | 0 | 0 | 0.192 | 0 | 0 | 0.132 | 0 | 0.163 | 0.115 | 0 | 0 | 0 | 0.042 | 0 | 0.064 | 0 | 0 | 0 | 0 | 0.115 | |||||||
| D03 | 0.192 | 0 | 0 | 0 | 0.132 | 0 | 0.163 | 0 | 0 | 0 | 0.042 | 0 | 0 | 0.064 | 0 | 0 | 0 | 0 | 0 | 0.115 | |||||||
| D04 | 0.192 | 0 | 0 | 0 | 0.132 | 0 | 0.163 | 0 | 0 | 0 | 0.042 | 0 | 0 | 0.064 | 0 | 0 | 0 | 0.115 | 0 | 0 | |||||||
| E02 | 0 | 0 | 0 | 0.192 | 0 | 0 | 0 | 0 | 0 | 0 | 0 | 0.042 | 0 | 0.064 | 0 | 0 | 0 | 0 | 0 | 0 | |||||||
| E05 | 0 | 0 | 0 | 0.192 | 0 | 0 | 0 | 0 | 0 | 0 | 0 | 0 | 0.042 | 0.064 | 0 | 0 | 0 | 0 | 0 | 0 | |||||||
| ContinuedTable 12. The form attributes elements parameters for samples | |||||||||||||||||||||||||||
| NO. | Xh1 | Xh2 | Xi1 | Xi2 | Xa-a | Xa-b | Xc-a | Xc-b | Xd-a | Xd-b | Xd-c | Xe-a | Xe-b | Xe-c | Xe-d | Xe-e | Xg-a | Xg-b | |||||||||
| A18 | 0 | 0.117 | 0.061 | 0 | 0 | 0.192 | 0 | 0.163 | 0 | 0.115 | 0 | 0 | 0.042 | 0 | 0 | 0 | 0.115 | 0 | |||||||||
| A24 | 0 | 0.117 | 0.061 | 0 | 0 | 0.192 | 0 | 0.163 | 0 | 0.115 | 0 | 0 | 0 | 0.042 | 0 | 0 | 0.115 | 0 | |||||||||
| B11 | 0 | 0.117 | 0.061 | 0 | 0.192 | 0 | 0 | 0.163 | 0 | 0.115 | 0 | 0.042 | 0 | 0 | 0 | 0 | 0 | 0.115 | |||||||||
| B18 | 0 | 0.117 | 0.061 | 0 | 0.192 | 0 | 0 | 0.163 | 0.115 | 0 | 0 | 0.042 | 0 | 0 | 0 | 0 | 0.115 | 0 | |||||||||
| C09 | 0 | 0.117 | 0.061 | 0 | 0 | 0.192 | 0.163 | 0 | 0 | 0.115 | 0 | 0 | 0 | 0 | 0.042 | 0 | 0.115 | 0 | |||||||||
| C18 | 0 | 0.117 | 0.061 | 0 | 0 | 0.192 | 0.163 | 0 | 0 | 0.115 | 0 | 0 | 0.042 | 0 | 0 | 0 | 0.115 | 0 | |||||||||
| D03 | 0 | 0.117 | 0.061 | 0 | 0 | 0.192 | 0.163 | 0 | 0 | 0 | 0.115 | 0 | 0 | 0 | 0 | 0.042 | 0 | 0.115 | |||||||||
| D04 | 0 | 0.117 | 0.061 | 0 | 0 | 0.192 | 0.163 | 0 | 0 | 0 | 0.115 | 0 | 0 | 0 | 0 | 0.042 | 0.115 | 0 | |||||||||
| E02 | 0.117 | 0 | 0 | 0.061 | 0 | 0.192 | 0 | 0.163 | 0 | 0.115 | 0 | 0 | 0.042 | 0.042 | 0.042 | 0 | 0 | 0.115 | |||||||||
| E05 | 0.117 | 0 | 0 | 0.061 | 0 | 0.192 | 0 | 0.163 | 0 | 0.115 | 0 | 0 | 0 | 0.042 | 0.042 | 0 | 0 | 0.115 | |||||||||
Table 13.
Final regression models for six Kansei dimensions (attention-weighted predictors x*).
| Dim. | Final regression equation | R2 | Adj. R2 | F | p | D–W |
| Y1 | −0.752 + 17.151·Xi2 | .814 | .790 | 35.04 | <.001 | 1.414 |
| Y2 | 0.193 − 4.409·Xdb − 4.646·Xda + 5.974·Xec + 1.713·Xab | .992 | .985 | 161.20 | <.001 | 1.738 |
| Y3 | −0.282 − 13.581·Xec | .534 | .476 | 9.16 | .016 | 0.645† |
| Y4 | −0.514 + 18.797·Xec + 7.550·Xa1 − 8.349·Xf1 + 2.635·Xb2 | .975 | .955 | 48.01 | <.001 | 2.285 |
| Y5 | 0.626 + 7.798·Xec + 3.262·Xa1 − 4.332·Xh2 | .956 | .934 | 42.95 | <.001 | 1.532 |
| Y6 | −0.731 + 8.222·Xca + 2.282·Xgb | .945 | .929 | 60.61 | <.001 | 1.903 |
Note.:†Potential positive autocorrelation for Y3; interpret with caution. All VIF < 3.0.
Table 14.
Model-calculated values (Ycv) and subjective evaluation values (Ysv) for five validation chairs.
Table 14.
Model-calculated values (Ycv) and subjective evaluation values (Ysv) for five validation chairs.
| Chair | Y1cv | Y2cv | Y3cv | Y4cv | Y5cv | Y6cv | Y1sv | Y2sv | Y3sv | Y4sv | Y5sv | Y6sv |
| A04 | −0.752 | −0.444 | −0.282 | −0.703 | 0.132 | −0.731 | −1.149 | −0.106 | −0.404 | −0.426 | 0.426 | −0.833 |
| B10 | −0.752 | 0.513 | −0.282 | −0.703 | 0.132 | −0.731 | −1.085 | −0.851 | −0.021 | −1.213 | −0.043 | −0.278 |
| C14 | −0.752 | 0.758 | −0.839 | 0.068 | 0.452 | −0.073 | −0.894 | −0.043 | −0.681 | −0.362 | 0.340 | −0.111 |
| D01 | −0.752 | 0.758 | −0.839 | 1.143 | 1.062 | 0.183 | −1.064 | 0.915 | −1.234 | 1.340 | 1.362 | −0.833 |
| E03 | 0.260 | −0.444 | −0.282 | −0.177 | 0.626 | −0.475 | −0.298 | 0.255 | −1.043 | 0.021 | 0.830 | −1.056 |
Table 15.
Paired-sample t-test results: model-calculated (Ycv) versus observed (Ysv) scores across five validation chairs.
Table 15.
Paired-sample t-test results: model-calculated (Ycv) versus observed (Ysv) scores across five validation chairs.
| No. | Pair | Mean diff. | SD | SE | 95% CI Lower | 95% CI Upper | t | df | p |
| 1 | Y1cv − Y1sv | 0.348 | 0.150 | 0.067 | 0.161 | 0.535 | 5.176 | 4 | 0.007** |
| 2 | Y2cv − Y2sv | 0.194 | 0.857 | 0.383 | −0.870 | 1.259 | 0.506 | 4 | 0.639 |
| 3 | Y3cv − Y3sv | 0.172 | 0.417 | 0.186 | −0.346 | 0.689 | 0.922 | 4 | 0.409 |
| 4 | Y4cv − Y4sv | 0.053 | 0.383 | 0.171 | −0.422 | 0.528 | 0.311 | 4 | 0.771 |
| 5 | Y5cv − Y5sv | −0.102 | 0.228 | 0.102 | −0.385 | 0.181 | −1.001 | 4 | 0.373 |
| 6 | Y6cv − Y6sv | 0.257 | 0.561 | 0.251 | −0.439 | 0.953 | 1.024 | 4 | 0.364 |
Note: Mean diff. = Ycv − Ysv. **p < 0.01.
Disclaimer/Publisher’s Note: The statements, opinions and data contained in all publications are solely those of the individual author(s) and contributor(s) and not of MDPI and/or the editor(s). MDPI and/or the editor(s) disclaim responsibility for any injury to people or property resulting from any ideas, methods, instructions or products referred to in the content. |
© 2026 by the authors. Licensee MDPI, Basel, Switzerland. This article is an open access article distributed under the terms and conditions of the Creative Commons Attribution (CC BY) license.
Copyright: This open access article is published under a Creative Commons CC BY 4.0 license, which permit the free download, distribution, and reuse, provided that the author and preprint are cited in any reuse.


