
Submitted:
15 June 2026
Posted:
17 June 2026
You are already at the latest version
Abstract
Groundwater depth is a key control on soil salinization in arid irrigation districts, but seasonal groundwater-depth thresholds for different salinization risks remain poorly constrained. Here, we examined the Yichang irrigation area of the Hetao Irrigation District using groundwater-depth observations and 0-60 cm soil-salinity samples collected before spring irrigation and during the crop-growing season. Indicator Kriging was used to map threshold-based probability zones for groundwater depth and soil salinity, and high-probability matching rates were used to identify critical groundwater depths for light and moderate salinization. Groundwater depth showed moderate spatial variability in both seasons, whereas soil salt content showed strong spatial variability. The critical groundwater depths for light and moderate salinization were 2.6 and 2.2 m before spring irrigation, and 2.2 and 1.8 m during the growing season, respectively. Soil salt content in the 0-20, 20-40, 40-60 and 0-60 cm layers decreased with increasing groundwater depth, with the 0-60 cm layer well described by an exponential response function. These findings provide a spatially explicit basis for seasonal groundwater regulation, salinization-risk zoning and field-scale water-salt management in arid irrigation districts.
Keywords:
soil salinization
; groundwater depth
; indicator Kriging
; critical groundwater depth
; Hetao Irrigation District
1. Introduction
Soil salinization is a coupled process driven by climatic aridity, evaporative concentration, shallow groundwater, irrigation and drainage regimes, and land use [1,2,3,4,5,6,7,8]. Groundwater depth directly affects salt accumulation in the surface and cultivated soil layers by regulating capillary rise, salt transport into the root zone and post-irrigation leaching efficiency [6,8,16,18,19,20,21]. Effective control of groundwater depth is therefore a key approach for preventing and mitigating soil salinization in irrigated areas. Previous studies have examined this issue through soil-salinity monitoring, remote-sensing inversion, numerical simulation, geostatistical mapping and risk assessment [9,10,11,12,13,14,15,16,17,20,26]. These studies provide technical support for quantifying the relationship between groundwater depth and soil salinity, but they also indicate that a single observation time or method is insufficient to characterize water-salt dynamics in irrigation districts. Integrated analyses combining field sampling, spatial interpolation, remote sensing and water-salt transport mechanisms are needed [11,20,22,23,26].
Remote sensing is an effective tool for monitoring soil salinization over large areas. Multispectral, hyperspectral and thermal imagery can identify salinization patterns from bare-soil salt-crust reflectance, vegetation salt-stress responses, land-surface temperature and salinity indices [9,10,11,12,13,14,15]. However, remote-sensing inversion mainly reflects surface or canopy responses and is affected by soil moisture, vegetation cover, vertical salt distribution and sampling scale. In irrigation districts, it therefore needs to be combined with ground measurements, groundwater-depth observations and geostatistical models [11,13,14,15,16,17]. After salinity information has been obtained, the integration of hydrological and soil-salinity data through statistical analysis and modelling provides an important basis for identifying groundwater-depth thresholds and salinization-risk zones [16,20,21,26].
Point-scale and regional water-salt transport models, based on Darcy’s law, the Richards equation, convection-dispersion theory, crop water consumption and salt-stress effects, can simulate soil-water and salt migration under different irrigation, drainage and groundwater-depth conditions [22,23,33]. Models such as SaltMod, SWAP, SWAT-Salt and HYDRUS have been used to analyse water-salt balance, long-term salinity evolution and the effects of water-saving irrigation in irrigation districts [18,22,23,33]. These models represent physical mechanisms, but they generally require numerous parameters and boundary conditions. When combined with spatial sampling and geostatistical methods, they can better explain how regional groundwater-depth control affects salt accumulation [20,22,23].
Classical statistics, geostatistics and geographic information systems are also widely used to investigate regional responses of soil salinization to groundwater depth [20,26,27,28,29,30,31,32]. Geostatistics is based on regionalized variable theory and variograms, assuming that nearby samples tend to be more similar in attribute values. Semivariograms, Kriging, co-Kriging and indicator Kriging can therefore be used to reveal spatial structures in soil salinity and groundwater variables [27,30,31]. Indicator Kriging converts continuous variables into probabilities of exceeding predefined thresholds, making it suitable for mapping salinization-risk zones, high-probability shallow-groundwater zones and threshold-related uncertainty [28,29,32]. Previous work has shown that combining geostatistics with remote sensing, GIS and groundwater measurements helps identify the spatial differentiation and controlling factors of salinization risk [20,26,30,31].
Groundwater depth is therefore a central variable for managing soil salt accumulation in arid irrigation districts. Although remote sensing, geostatistical analysis and water-salt transport modelling have improved salinization-risk assessment, most studies have treated soil salinity and groundwater depth as separate spatial variables. Less attention has been paid to whether their threshold-defined high-risk zones coincide in space. Critical groundwater depth is also often treated as a fixed value, despite seasonal shifts in irrigation, evaporation, crop water use and salinization grade. Here, we used field observations from before spring irrigation and the growing season in the Yichang irrigation area to quantify the spatial response of soil-salinization risk to groundwater depth using indicator Kriging. We further established layer-specific response functions between soil salt content and groundwater depth to support zoned salinization control and groundwater-level regulation.
2. Materials and Methods
2.1. Regional Soil-Salinization Survey
A regional survey was conducted in the Yichang irrigation area of the Hetao Irrigation District to examine how soil salinization responds to groundwater depth (Figure 1). The survey included groundwater-depth observations and farmland soil sampling (Figure 2). To capture seasonal differences in the groundwater-salinity relationship, sampling was carried out before spring irrigation and during the crop-growing season. The irrigation area contains 50 long-term observation wells, where groundwater depth was recorded every 5 d from before spring irrigation to the growing season. Field campaigns were conducted from 20 to 25 April 2020 and from 5 to 10 July 2020. Groundwater depth was measured in situ using a water-level meter, and soil sampling sites were selected near observation wells to maintain spatial consistency between soil and groundwater observations (Figure 2). In total, 68 soil sampling sites were established. At each site, samples were collected from 0-60 cm at 10 cm intervals, with three replicates per depth. Samples were weighed, oven-dried, ground, passed through a 2 mm sieve and extracted for soil salt-content determination.
2.2. Construction of the Salinization Risk-Groundwater Depth Relationship Based on Indicator Kriging
(1) Method
Indicator Kriging (IK) is a non-parametric geostatistical method for estimating the probability that a variable exceeds a specified threshold at unsampled locations [27,28,29,32]. It is well suited to skewed distributions, threshold-defined events and spatial uncertainty because indicator transformation reduces the influence of extreme values on variogram estimation and yields probability-based risk maps [28,29]. Groundwater depth and soil salinity in irrigation districts commonly show spatial heterogeneity and non-normal distributions. Although conventional Kriging can estimate continuous surfaces, IK is more appropriate for threshold-based risk identification. We therefore used IK to map groundwater-depth and soil-salinity probability zones and then used high-probability matching to infer salinization-control thresholds.
GS+ 7.0 was first used to determine variogram model parameters for soil salt content and groundwater depth under different thresholds. These parameters were then imported into ArcGIS 10.6 for IK interpolation, producing spatial probability maps of groundwater depth and root-zone soil salinity for the pre-spring-irrigation and growing-season periods. By calculating the proportions of high- and low-probability areas and matching them with salinization-risk thresholds, this approach accounts for both spatial pattern and threshold-event uncertainty and provides a robust technical route for regional salinization-risk identification [26,27,28,29,30,31,32].
(2) Threshold Selection and Indicator Kriging Model Construction
The key to IK is the rational selection of thresholds. Based on previous studies of shallow groundwater, salt accumulation and critical groundwater depth in arid and semi-arid irrigation districts [16,18,19,20,21,24,25], groundwater-depth thresholds of 1.8, 2.2, 2.6 and 3.0 m were selected. When groundwater depth did not exceed a given threshold, the indicator value was set to 1; otherwise, it was set to 0. Soil salt-content thresholds of 2 and 3 g kg-1 were selected to represent light-or-higher and moderate-or-higher salinization, respectively. This threshold design converts continuous groundwater-depth and soil-salinity information into risk probabilities, facilitating comparison of the spatial match between groundwater-depth thresholds and salinization grades [21,26,29,32].
Semivariograms were used to determine the nugget (C0) and sill parameters of spatial variability. The nugget represents short-distance variability or sampling error, whereas the sill represents total variability after the semivariogram reaches a stable state. The C0/Sill ratio indicates the degree of spatial autocorrelation [27,30,31]. A smaller ratio indicates stronger structural control, whereas a larger ratio indicates greater influence from random factors, microtopography, farming practices or measurement error [27]. A probability value of 0.5 was used as the boundary between high- and low-probability zones. Probability maps were produced for groundwater-depth and soil-salinity thresholds, and the spatial matching rates between the two probability-zone types were calculated. This extends salinization-risk identification from point-scale statistical relationships to regional spatial-response relationships [28,29,32].
3. Results
3.1. Spatial Probability Characteristics of Groundwater Depth
3.1.1. Descriptive Statistics of Groundwater Depth
Groundwater depth differed between the two sampling periods (Table 1). Before spring irrigation, it ranged from 1.23 to 6.43 m, with a mean of 2.83 m. During the growing season, it ranged from 0.54 to 8.56 m, with a mean of 2.45 m. The standard deviations were 0.96 and 1.26 m, and the coefficients of variation were 0.34 and 0.64 before spring irrigation and during the growing season, respectively. Both coefficients indicate moderate variability, but the larger value during the growing season suggests stronger spatial fluctuation, probably reflecting irrigation, cultivation and other management or environmental influences. Before spring irrigation, groundwater depth was relatively more stable, partly because residual autumn-irrigation water gradually replenished groundwater. Figure 3 shows the frequency distributions of groundwater depth before spring irrigation and during the growing season. Before spring irrigation, the 2-3 m interval had the highest frequency (16.98%), followed by the 0-1 m interval (14.01%); frequency decreased as depth increased. During the growing season, the 1-2 m interval had the highest frequency (21.04%), whereas the 2-3 m and 0-1 m intervals accounted for 10.99% and 4.92%, respectively. Frequencies again declined with increasing depth. Both periods showed positively skewed distributions, with extreme values in shallow-depth intervals. Therefore, groundwater-depth frequencies were logarithmically transformed (Figure 4). Although the transformed frequencies approached a normal distribution, outliers remained, indicating that groundwater depth contained extreme values under different data-processing methods.
3.1.2. Construction of Indicator Variogram Models for Groundwater Depth
The variogram model was first selected. Compared with exponential, Gaussian and linear models, the spherical model has broader applicability and a clear range of spatial correlation. It was therefore used to obtain variogram parameters for different groundwater-depth thresholds before spring irrigation and during the growing season. The groundwater-depth thresholds were 1.8, 2.2, 2.6 and 3.0 m. The theoretical indicator variogram models are shown in Table 2. Nugget values ranged from 0.046 to 0.076, and sill values ranged from 0.092 to 0.156. Both increased with the threshold, indicating that spatial variability strengthened as groundwater depth increased. Nugget values during the growing season were generally higher than those before spring irrigation, indicating greater spatial variability in groundwater depth. C0/Sill represents spatial correlation: C0/Sill < 0.25 indicates strong large-scale spatial correlation, 0.25 <= C0/Sill < 0.75 indicates moderate spatial correlation, and C0/Sill >= 0.75 indicates weak spatial autocorrelation, with most variability arising from small-scale variation or measurement error. For all thresholds in both periods, C0/Sill ranged from 43.22% to 53.54%, indicating moderate spatial autocorrelation. The higher C0/Sill during the growing season suggests a larger random component. The A0 values were similar between the two periods, indicating no substantial seasonal difference in the spatial correlation range of groundwater depth.
3.1.3. Spatial Probability Distribution of Groundwater Depth Before Spring Irrigation
The constructed indicator Kriging models were used to predict spatial probability distributions for different groundwater-depth thresholds before spring irrigation (Figure 5). In the legend, blue denotes low-probability zones and red denotes high-probability zones. At a threshold of 1.8 m, most of the area was in the low-probability zone, with only some high-probability areas along the western and eastern margins, indicating a low probability of groundwater depth being shallower than 1.8 m across most of the region. At 2.2 m, high-probability zones increased markedly and displayed a banded pattern, mainly in the eastern and central-eastern areas. At 2.6 m, red areas expanded substantially, and most of the region became high probability, with low-probability zones remaining only in the northern and eastern margins. At 3.0 m, high-probability areas expanded further, leaving only scattered local low-probability zones.
A probability value of 0.5 was used as the boundary between high- and low-probability zones. The proportions and areas of the two probability classes under each threshold are summarized in Table 3. As the groundwater-depth threshold increased, the proportion of high-probability zones increased from 16% to 83%, and their area increased from 523.52 to 2715.76 km2. This pattern is consistent with the frequency distribution before spring irrigation in Table 1, where the 2-3 m groundwater-depth interval had the highest frequency.
3.1.4. Spatial Probability Distribution of Groundwater Depth During the Growing Season
Using the variogram parameters in Table 2, IK was applied to predict spatial probability distributions of groundwater depth during the growing season (Figure 6), and the proportions of high- and low-probability zones were calculated (Table 4). At a threshold of 1.8 m, most of the area was classified as low probability, although probabilities in the north were higher than those in the south; the high-probability area accounted for 16%. At 2.2 m, high-probability zones increased significantly, mainly in the western, central and central-eastern parts of the irrigation area, accounting for 36% of the total area. At 2.6 m, red areas expanded further, with higher probabilities mainly in the south; the high-probability area accounted for 74%. At 3.0 m, 82% of the irrigation area was high probability, while low-probability zones were concentrated in northern and eastern piedmont areas. Compared with the pre-spring-irrigation period (Figure 5), groundwater depth became shallower during the growing season because of irrigation. Most areas had groundwater depths of 1-2 m, so high-probability areas increased markedly under larger thresholds.
3.2. Spatial Probability Characteristics of Soil Salt Content
3.2.1. Descriptive Statistics of Soil Salt Content
Soil salt content also varied strongly between sampling sites (Table 5). Before spring irrigation, it ranged from 0.46 to 33.56 g kg-1, with a mean of 3.87 g kg-1. During the growing season, it ranged from 0.21 to 29.40 g kg-1, with a mean of 3.54 g kg-1. The slightly higher mean before spring irrigation indicates stronger spring salt return, although both periods showed broad distributions. The coefficients of variation were 1.42 before spring irrigation and 1.63 during the growing season, indicating strong spatial variability in both periods and greater heterogeneity during the growing season. Figure 7 shows the frequency distributions of soil salt content before spring irrigation and during the growing season. In both periods, the 0-5 g kg-1 interval had the highest frequency, accounting for 54.99% and 56.95%, respectively. Frequency declined as salt content increased, and the distributions were positively skewed, similar to groundwater depth. After logarithmic transformation, the frequency distribution approached normality (Figure 8), but outliers remained. Given the data structure, IK, which is better suited for skewed data, was used to analyse spatial probability distributions.
3.2.2. Construction of Indicator Variogram Models for Soil Salt Content
Following the groundwater-depth modelling procedure, the spherical model was also used to obtain variogram parameters for soil salt content under different thresholds before spring irrigation and during the growing season. The resulting indicator variogram parameters are shown in Table 6. Nugget values ranged from 0.048 to 0.066, sill values from 0.105 to 0.134, ranges from 7.07 to 7.14 km, and C0/Sill from 35.82% to 62.86%, indicating moderate spatial autocorrelation. Before spring irrigation, C0/Sill was 61.29% at the 2 g kg-1 threshold, close to 75%, indicating that random small-scale variation or measurement error contributed substantially to total variation and that spatial indication was relatively weak. At the 3 g kg-1 threshold, C0/Sill was 41.88%, indicating stronger spatial dependence. During the growing season, C0/Sill was 35.82% at the 2 g kg-1 threshold, suggesting that spatial variation in soil salt content was more strongly controlled by spatial autocorrelation. At the 3 g kg-1 threshold, C0/Sill increased to 62.86%, indicating weaker spatial dependence. The stronger spatial dependence during the growing season under the low-salinity threshold is related to irrigation, rainfall and farming practices.
3.2.3. Soil-Salinization Risk Before Spring Irrigation
Using the variogram parameters for soil salt-content thresholds of 2 and 3 g kg-1 in Table 6, IK was applied to predict spatial probability distributions (Figure 9), and the proportions of high- and low-risk zones before spring irrigation were calculated (Table 7). At the 2 g kg-1 threshold, 76% of the area was high risk and 24% was low risk. High-risk zones were concentrated mainly in the central-northern area, with probabilities increasing northward. At the 3 g kg-1 threshold, 46% of the area was high risk and 54% was low risk; high-risk zones were mainly located in the northern and eastern areas. Because elevation decreases from southwest to northeast, lower-lying areas have shallower groundwater and a higher probability of salinization risk.
3.2.4. Soil-Salinization Risk During the Growing Season
The spatial probabilities of soil salinization under light and moderate soil salt-content thresholds during the growing season are shown in Figure 10. When the threshold was 2 g kg-1, high-risk zones accounted for 84% of the irrigation area and were mainly distributed in the western, central and central-eastern areas. When the threshold was 3 g kg-1, the high-risk area decreased markedly to 16%, mainly along the southern and eastern margins. Comparing the two seasons, the high-risk area at the 2 g kg-1 threshold was larger during the growing season than before spring irrigation, indicating a higher risk of light salinization during the growing season. At the 3 g kg-1 threshold, the high-risk area was larger before spring irrigation, indicating a higher risk of moderate salinization in spring. Much of the high-risk area before spring irrigation shifted to low risk during the growing season, indicating a transition from moderate to light salinization. This occurred because irrigation and farming practices leached surface and shallow soil salts into deeper layers or groundwater, reducing salt content in the cultivated layer. Before spring irrigation, evaporation promoted stronger salt return, causing salts from deeper soil and groundwater to accumulate near the surface and increasing the risk of moderate salinization.

Table 8.
Area proportions of soil-salinity risk zones under different thresholds during the growing season in 2020.
Table 8.
Area proportions of soil-salinity risk zones under different thresholds during the growing season in 2020.
| Threshold/g kg-1 | High-risk zone | High-risk zone | Low-risk zone | Low-risk zone |
| Proportion/% | Area/km2 | Proportion/% | Area/km2 | |
| 2.0 | 84 | 2748.48 | 16 | 523.52 |
| 3.0 | 16 | 523.52 | 84 | 2748.48 |
4. Discussion
4.1. Spatiotemporal Groundwater-Depth Variation and the Distribution of Salinized Soil Types
The spatial probability distributions under different groundwater-depth thresholds were compared with those under different soil salt-content thresholds, and high-probability matching rates were used to determine groundwater-depth thresholds for controlling different salinization-risk grades. Comparing Figure 5 with Figure 9 shows that the high-probability area under the 2.6 m groundwater-depth threshold overlapped strongly with the high-risk area under the 2 g kg-1 soil salt-content threshold. The high-probability area under the 2.2 m groundwater-depth threshold also matched the high-risk area under the 3 g kg-1 threshold. Further matching analysis (Figure 11) showed that, when the soil salt-content threshold was 2 g kg-1, the matching rates with groundwater-depth thresholds of 1.8, 2.2, 2.6 and 3.0 m were 26%, 34%, 62% and 43%, respectively. The highest match occurred at 2.6 m, indicating that the critical groundwater depth for light salinization before spring irrigation was 2.6 m. When the soil salt-content threshold was 3 g kg-1, the matching rates were 34%, 68%, 44% and 35%, respectively, with the highest match at 2.2 m. Therefore, the critical groundwater depth for moderate salinization before spring irrigation was 2.2 m.
For the growing season, spatial probability distributions under soil salt-content thresholds of 2 and 3 g kg-1 were compared with those under groundwater-depth thresholds of 1.8, 2.2, 2.6 and 3.0 m. Comparing Figure 4 with Figure 10 shows that the high-probability area under the 2.2 m groundwater-depth threshold overlapped strongly with the high-risk area under the 2 g kg-1 salt-content threshold. The high-probability area under the 1.8 m threshold also showed a high matching rate with the high-risk area under the 3 g kg-1 threshold. Further matching analysis (Figure 12) showed that, when the soil salt-content threshold was 2 g kg-1, the matching rates with groundwater-depth thresholds of 1.8, 2.2, 2.6 and 3.0 m were 14%, 58%, 45% and 42%, respectively. The highest matching rate was 58% at 2.2 m, so 2.2 m can be regarded as the critical threshold for controlling light salinization during the growing season. When the soil salt-content threshold was 3 g kg-1, the matching rates were 43%, 36%, 33% and 18%, respectively. The highest match occurred at 1.8 m, indicating that the critical groundwater depth for moderate salinization during the growing season was 1.8 m.
The seasonal groundwater-depth thresholds identified here show that critical groundwater depth should not be treated as a single fixed value. In the Yichang irrigation area, the thresholds for light and moderate salinization were 2.6 and 2.2 m before spring irrigation, but shifted to 2.2 and 1.8 m during the growing season. This seasonal difference is consistent with changes in water-salt transport direction, irrigation leaching and crop growth stage [6,18,19,20,21,22,23,24,25]. Before spring irrigation, stronger evaporation and limited crop cover promote upward salt transport from shallow groundwater. During the growing season, irrigation leaching, crop water use and root-zone redistribution jointly reshape soil salinity. Separating critical groundwater depth by season and salinization grade therefore provides a more realistic basis for arid-district water-salt management.
Mechanistically, the threshold difference reflects a seasonal shift among three processes: evaporative salt return, irrigation leaching and crop water consumption. Before spring irrigation, a larger bare-soil fraction strengthens upward salt movement and makes shallow-groundwater areas more prone to salt accumulation in surface and near-surface layers. During the growing season, irrigation can leach salts downward, while crop water uptake modifies root-zone moisture gradients and redistributes salts among soil layers [6,18,20,24,25].
The high-probability matching approach provides information that cannot be obtained from mean groundwater depth alone. It identifies where shallow-groundwater probability zones coincide with salinization-risk zones, thereby linking groundwater regulation to spatially explicit risk control. The results suggest that management should avoid applying a single groundwater-control level across the whole irrigation area. Instead, seasonal thresholds should be defined separately for preventing light salinization and mitigating moderate salinization [21,26,29,32].
4.2. Quantitative Relationship Between Groundwater Depth and Soil Salinity
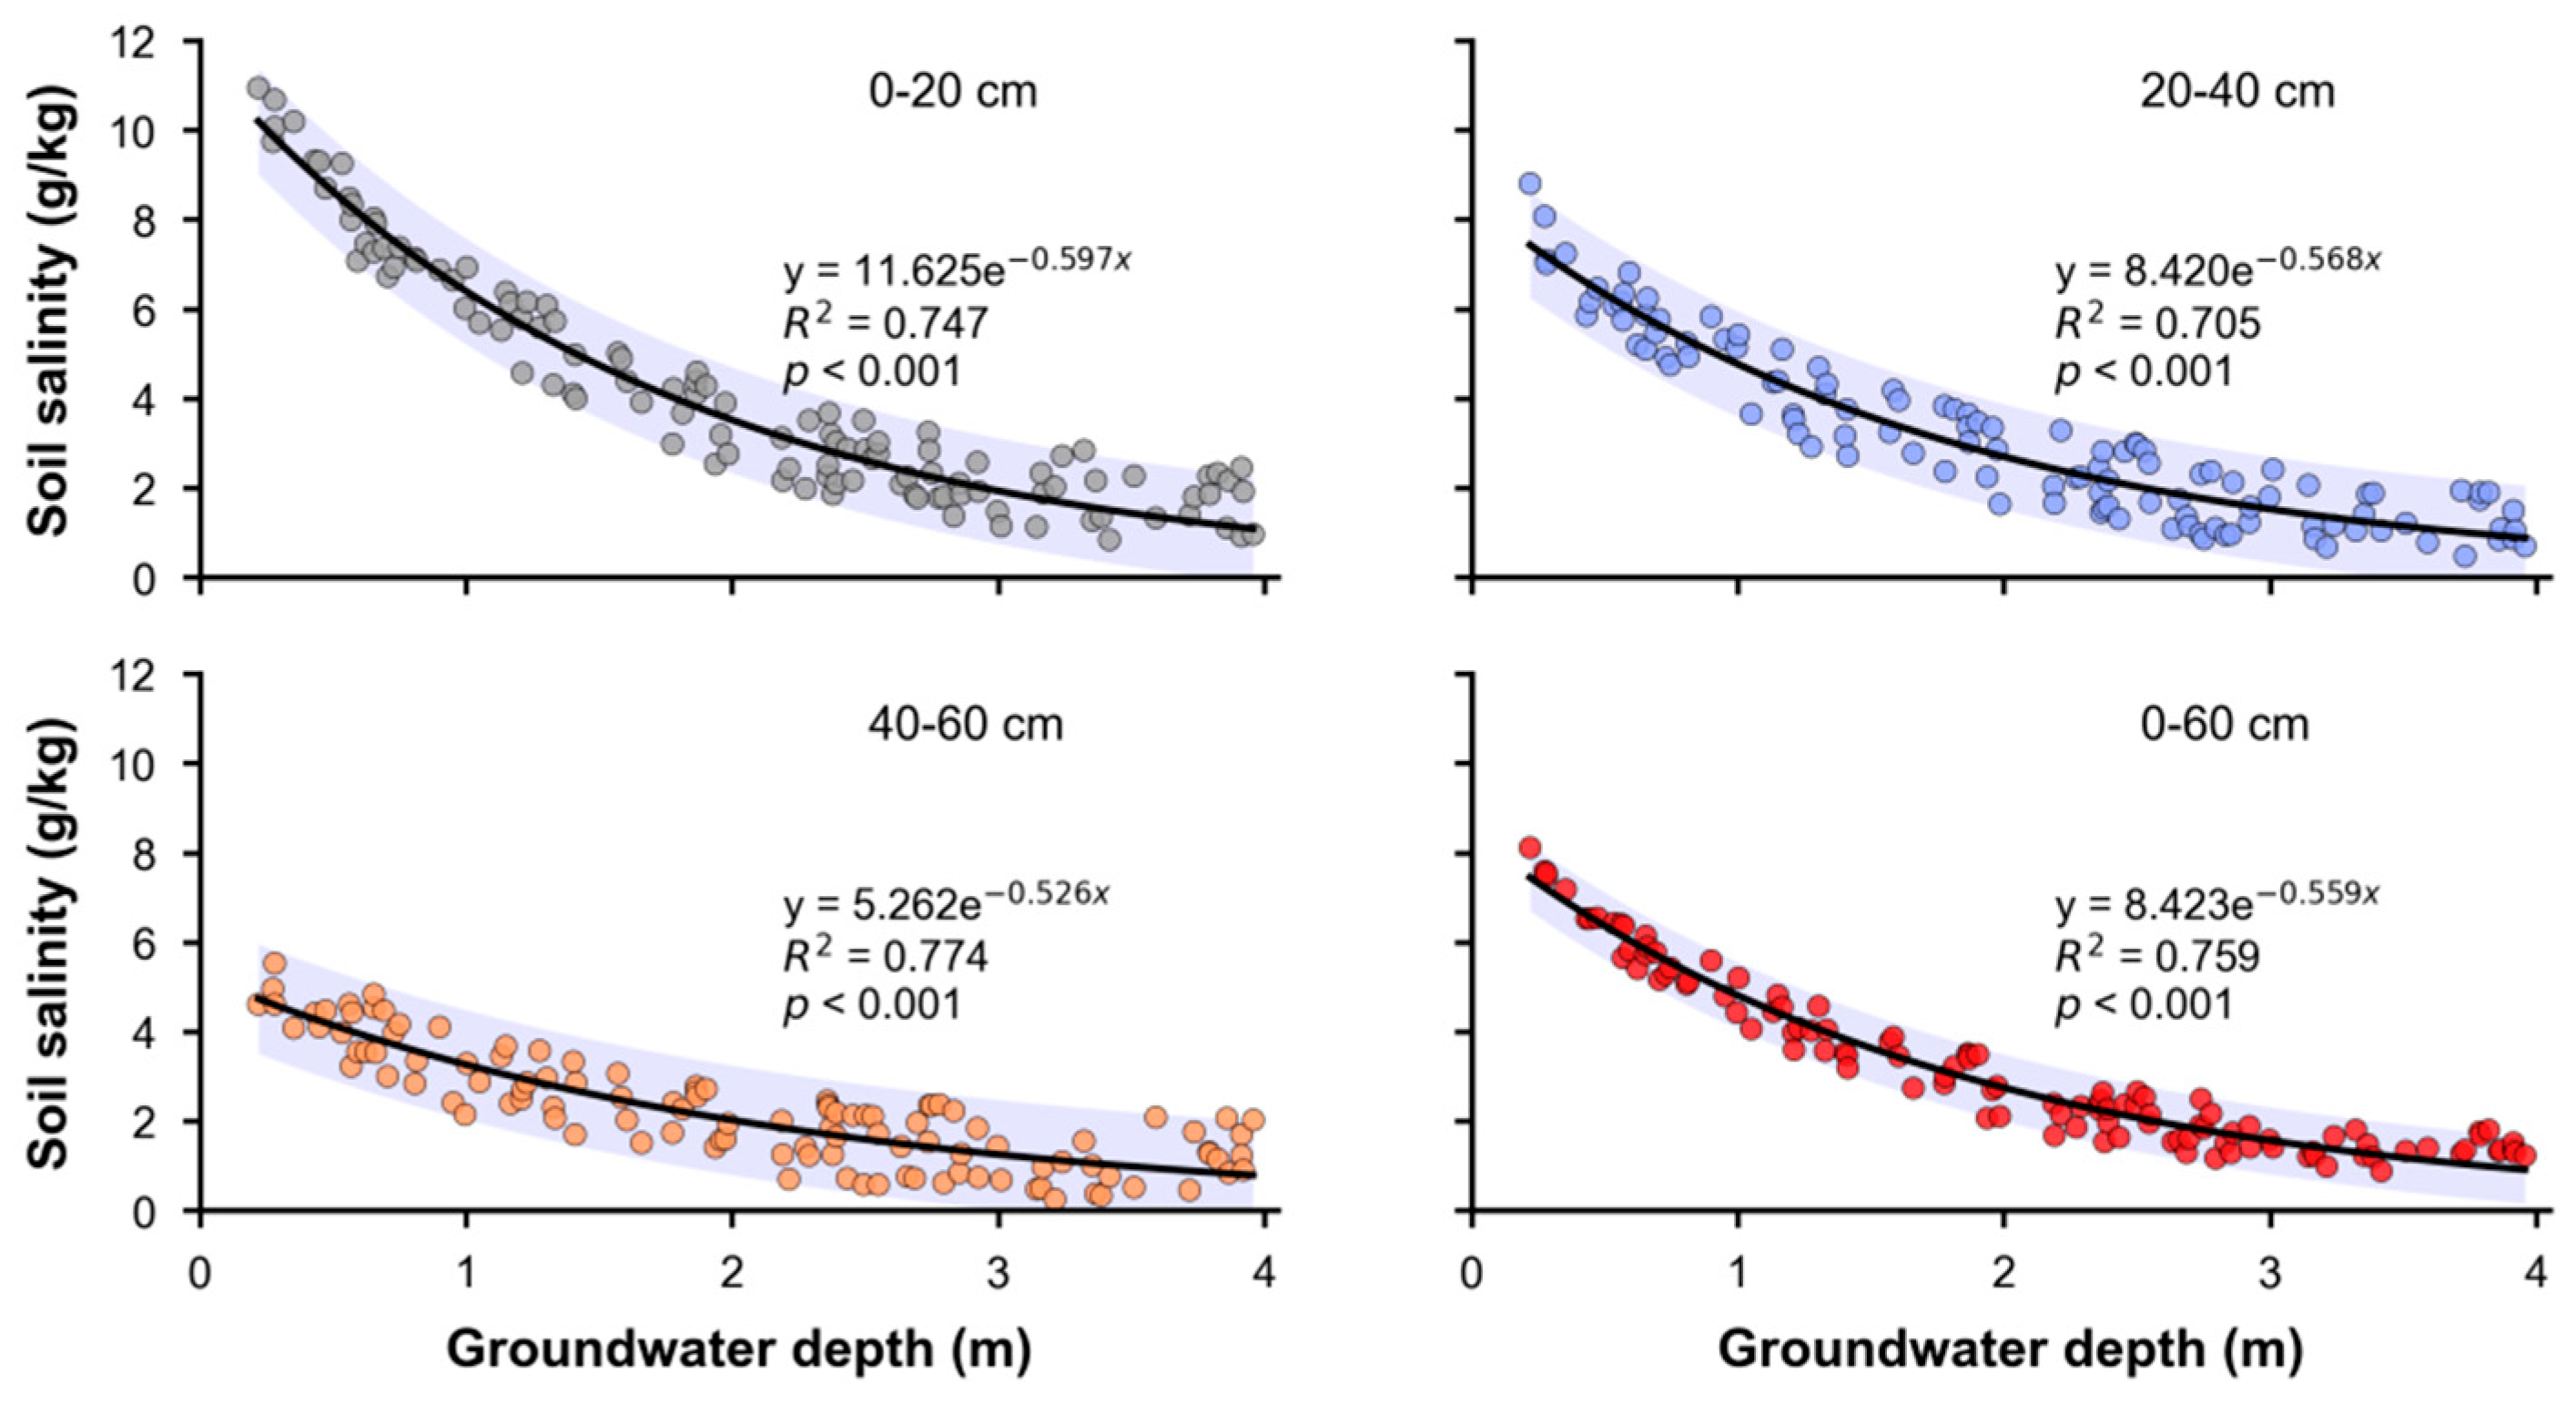
To determine the response of soil salinity in different soil layers to groundwater depth, groundwater-depth data from 50 observation wells and soil salt-content data from 68 sampling sites were jointly analysed. Outliers were removed to reduce noise. Scatter plots of soil salt content versus groundwater depth for different soil layers are shown in Figure 13. In all four soil layers, soil salt content decreased as groundwater depth increased. The scatter-plot patterns were consistent with logarithmic relationships, so logarithmic functions were used to describe the responses.
Figure 14. shows fitted curves between groundwater depth and soil salt content for the 0-20, 20-40, 40-60 and 0-60 cm soil layers. All four response relationships were significant (p < 0.001), with coefficients of determination greater than 0.7. The fitted relationships indicate that soil salinity in the cultivated layer generally decreased as groundwater depth increased, consistent with the understanding that capillary salt transport, evaporative concentration and irrigation leaching jointly control salinity profiles in shallow-groundwater areas [6,18,19,20,21,22,23,24,25,33]. Groundwater depth, however, is not the only factor affecting soil salinity. Groundwater mineralization, topographic gradient, soil texture, irrigation quota, drainage conditions, crop cover and farming system can all alter water-salt transport pathways and salt accumulation intensity [6,16,20,22,23,24,25,34]. Therefore, the response functions developed here are best interpreted as regional empirical relationships under the current irrigation-drainage pattern and sampling periods of the Yichang irrigation area, and should not be directly extrapolated to areas with different hydrogeological conditions. For management, the mean salt content of the 0-60 cm cultivated layer can be estimated as y = 8.432e-0.559x when groundwater-depth regulation is the objective; however, groundwater mineralization, drainage capacity and seasonal irrigation regimes should also be considered in groundwater-control planning [18,21,22,23,24,25].
Figure 14.
Frequency distribution of groundwater depth.
Several boundary conditions should be considered when interpreting these results. Groundwater mineralization, soil texture, microtopography and irrigation-drainage infrastructure may all change the strength of the groundwater-depth and soil-salinity relationship. IK outputs also depend on sampling density, threshold selection and variogram-model choice. Finally, spatial interpolation describes risk patterns at specific observation times. Long-term management should therefore combine repeated groundwater monitoring with dynamic calibration using water-salt transport models [11,20,22,23,27,28,29,30,31,32,33,34].
5. Conclusions
(1) groundwater depth showed moderate spatial variability before spring irrigation and during the growing season, whereas soil salt content showed strong spatial variability. The indicator variograms for groundwater depth and soil salt content under different thresholds all indicated moderate spatial correlation, suggesting that their spatial distributions were jointly affected by structural and random factors.
(2) Second, based on IK spatial probability distributions and high-probability matching rates, the critical groundwater depths corresponding to different salinization grades were identified for the Yichang irrigation area. Before spring irrigation, the critical groundwater depths for preventing light and moderate salinization were 2.6 and 2.2 m, respectively; during the growing season, they were 2.2 and 1.8 m, respectively. This indicates that critical groundwater depth varies with both season and salinization grade.
(3) soil salt content in different soil layers decreased with increasing groundwater depth and was well described by exponential functions. In particular, the response relationship for the 0-60 cm layer can characterize overall salinity changes in the cultivated layer and provides a reference for groundwater-level regulation and soil-salinization control in the irrigation area.
Author Contributions
Conceptualization, R.Z., L.L. and J.W.; methodology, R.Z., F.W. and W.D.; software, R.Z. and F.W.; validation, L.L., J.W. and H.W.; formal analysis, R.Z.; investigation, R.Z., W.D. and H.W.; resources, L.L. and J.W.; data curation, R.Z., F.W. and H.W.; writing—original draft preparation, R.Z.; writing—review and editing, L.L., J.W. and F.W.; visualization, R.Z. and W.D.; supervision, L.L. and J.W.; project administration, L.L.; funding acquisition, J.W. and R.Z. All authors have read and agreed to the published version of the manuscript.
Funding
This research was funded by the Key Research and Development Program of Inner Mongolia Autonomous Region, grant number 2023JBGS0003; the National Natural Science Foundation of China, grant numbers 2379047 and 52209067; and the Provincial Department-Level Projects of Hubei Province (Water Conservancy Research and Technical Services), grant number 2025-218-006-001. The APC was funded by Jingwei Wu and Rui Zhang.
Data Availability Statement
The data supporting the findings of this study are available from the corresponding author upon reasonable request.
Conflicts of Interest
The authors declare no conflicts of interest.
Abbreviations
The following abbreviations are used in this manuscript:
| IK | indicator Kriging |
| GIS | geographic information system |
| C0 | nugget |
| A0 | range |
References
- FAO, ITPS Status of the World’s Soil Resources: Main Report. Food and Agriculture Organization of the United Nations, 2015.
- FAO Global Map of Salt-Affected Soils. Food and Agriculture Organization of the United Nations, 2021.
- Rengasamy, P. World salinization with emphasis on Australia. Journal of Experimental Botany, 2006, 57(5): 1017-1023. [CrossRef] [PubMed]
- Qadir, M., Quillérou, E., Nangia, V., Murtaza, G., Singh, M., Thomas, R. J., Drechsel, P., Noble, A. D. Economics of salt-induced land degradation and restoration. Natural Resources Forum, 2014, 38(4): 282-295. [CrossRef]
- Munns, R., Tester, M. Mechanisms of salinity tolerance. Annual Review of Plant Biology, 2008, 59: 651-681. [CrossRef] [PubMed]
- Nachshon, U. Cropland soil salinization and associated hydrology: Trends, processes and examples. Water, 2018, 10(8): 1030. [CrossRef]
- Ghassemi, F., Jakeman, A. J., Nix, H. A. Salinisation of Land and Water Resources: Human Causes, Extent, Management and Case Studies. CAB International, 1995.
- Rhoades, J. D., Kandiah, A., Mashali, A. M. The Use of Saline Waters for Crop Production. FAO Irrigation and Drainage Paper 48, 1992.
- Metternicht, G. I., Zinck, J. A. Remote sensing of soil salinity: Potentials and constraints. Remote Sensing of Environment, 2003, 85(1): 1-20. [CrossRef]
- Allbed, A., Kumar, L. Soil salinity mapping and monitoring in arid and semi-arid regions using remote sensing technology: A review. Advances in Remote Sensing, 2013, 2(4): 373-385. [CrossRef]
- Scudiero, E., Corwin, D. L., Anderson, R. G., Skaggs, T. H. Moving forward on remote sensing of soil salinity at regional scale. Frontiers in Environmental Science, 2016, 4: 65. [CrossRef]
- Dehaan, R. L., Taylor, G. R. Field-derived spectra of salinized soils and vegetation as indicators of irrigation-induced soil salinization. Remote Sensing of Environment, 2002, 80(3): 406-417. [CrossRef]
- Masoud, A. A. Mapping soil salinity using spectral mixture analysis of Landsat 8 OLI images to identify factors influencing salinization in an arid region. International Journal of Applied Earth Observation and Geoinformation, 2019, 83: 101944. [CrossRef]
- Abuelgasim, A., Ammad, R. Mapping soil salinity in arid and semi-arid regions using Landsat 8 OLI satellite data. Remote Sensing Applications: Society and Environment, 2019, : 415-425. [CrossRef]
- Allbed, A., Kumar, L., Sinha, P. Assessing soil salinity using soil salinity and vegetation indices derived from IKONOS high-spatial resolution imageries: Applications in a date palm dominated region. Geoderma, 2014, 230-231: 1-8. [CrossRef]
- Jin, X. M., Vekerdy, Z., Zhang, Y. K., Liu, J. T. Soil salt content and its relationship with crops and groundwater depth in the Yinchuan Plain, China, using remote sensing. Arid Land Research and Management, 2012, 26(3): 227-235. [CrossRef]
- Guo, S., Ruan, B., Chen, H., Guan, X., Wang, S., Xu, N., Li, Y. Characterizing the spatiotemporal evolution of soil salinization in Hetao Irrigation District (China) using a remote sensing approach. International Journal of Remote Sensing, 2018, 39(20): 6805-6825. [CrossRef]
- Feng, Z. Z., Wang, X. K., Feng, Z. W. Soil N and salinity leaching after the autumn irrigation and its impact on groundwater in Hetao Irrigation District, China. Agricultural Water Management, 2005, 71(2): 131-143. [CrossRef]
- Xu, X., Huang, G. H. Assessing the groundwater dynamics and impacts of water saving in the Hetao Irrigation District, Yellow River basin. Agricultural Water Management, 2010, 98: 301-313. [CrossRef]
- Ren, D. Y., Wei, B. Y., Xu, X., Engel, B., Li, G., Huang, Q., Xiong, Y., Huang, G. Analyzing spatiotemporal characteristics of soil salinity in arid irrigated agro-ecosystems using integrated approaches. Geoderma, 2019, 356: 113935. [CrossRef]
- Cui, C., Yang, G., Li, S., Wang, H., Song, Y. Spatial characteristics and critical groundwater depth of soil salinization in arid artesian irrigation area of northwest China. Agricultural Water Management, 2025, 307: 109196. [CrossRef]
- Chang, X., Gao, Z., Wang, S., Chen, H. Modelling long-term soil salinity dynamics using SaltMod in Hetao Irrigation District, China. Computers and Electronics in Agriculture, 2019, 156: 447-458. [CrossRef]
- Ao, C., Jiang, D., Bailey, R. T., Dong, J., Zeng, W., Huang, J. Water, salt, and ion transport and its response to water-saving irrigation in the Hetao Irrigation District based on the SWAT-Salt model. Agronomy, 2024, 14(5): 953. [CrossRef]
- Zhao, Y., Shi, H., Miao, Q., Yang, S. Analysis of spatial and temporal variability and coupling relationship of soil water and salt in cultivated and wasteland at branch canal scale in the Hetao Irrigation District. Agronomy, 2023, 13(9): 2367. [CrossRef]
- Hu, Z., Miao, Q., Shi, H., Feng, W., Yu, C., Mu, Y. Spatial variations and distribution patterns of soil salinity at the canal scale in the Hetao Irrigation District. Water, 2023, 15(19): 3342. [CrossRef]
- Wang, Z., Zhang, F., Zhang, X., Chan, N. W., Kung, H.-t., Zhou, X., Wang, Y. Quantitative evaluation of spatial and temporal variation of soil salinization risk using GIS-based geostatistical method. Remote Sensing, 2020, 12(15): 2405. [CrossRef]
- Goovaerts, P. Geostatistics for Natural Resources Evaluation. Oxford University Press, 1997.
- Pardo-Iguzquiza, E., Dowd, P. A. Multiple indicator cokriging with application to optimal sampling for environmental monitoring. Computers & Geosciences, 2005, 31(1): 1-13. [CrossRef]
- Goovaerts, P. AUTO-IK: A 2D indicator kriging program for the automated non-parametric modeling of local uncertainty in earth sciences. Computers & Geosciences, 2009, 35(6): 1255-1270. [CrossRef] [PubMed]
- Eldeiry, A. A., Garcia, L. A. Comparison of ordinary kriging, regression kriging, and cokriging techniques to estimate soil salinity using LANDSAT images. Journal of Irrigation and Drainage Engineering, 2010, 136(6): 355-364. [CrossRef]
- Eldeiry, A. A., Garcia, L. A. Evaluating the performance of ordinary kriging in mapping soil salinity. Journal of Irrigation and Drainage Engineering, 2012, 138(12): 1046-1059. [CrossRef]
- Cemek, B., Güler, M., Kılıç, K., Demir, Y., Arslan, H. Spatial and temporal mapping of groundwater salinity using ordinary kriging and indicator kriging: The case of Bafra Plain, Turkey. Agricultural Water Management, 2012, 113: 57-63. [CrossRef]
- van Dam, J. C., Groenendijk, P., Hendriks, R. F. A., Kroes, J. G. Advances of modeling water flow in variably saturated soils with SWAP. Vadose Zone Journal, 2008, 7(2): 640-653. [CrossRef]
- Corwin, D. L., Lesch, S. M. Apparent soil electrical conductivity measurements in agriculture. Computers and Electronics in Agriculture, 2005, 46(1-3): 11-43. [CrossRef]
- Richards, L. A. Diagnosis and Improvement of Saline and Alkali Soils. USDA Agriculture Handbook 60, 1954.
Figure 1.
Distribution of groundwater observation wells and soil-salinity sampling sites.
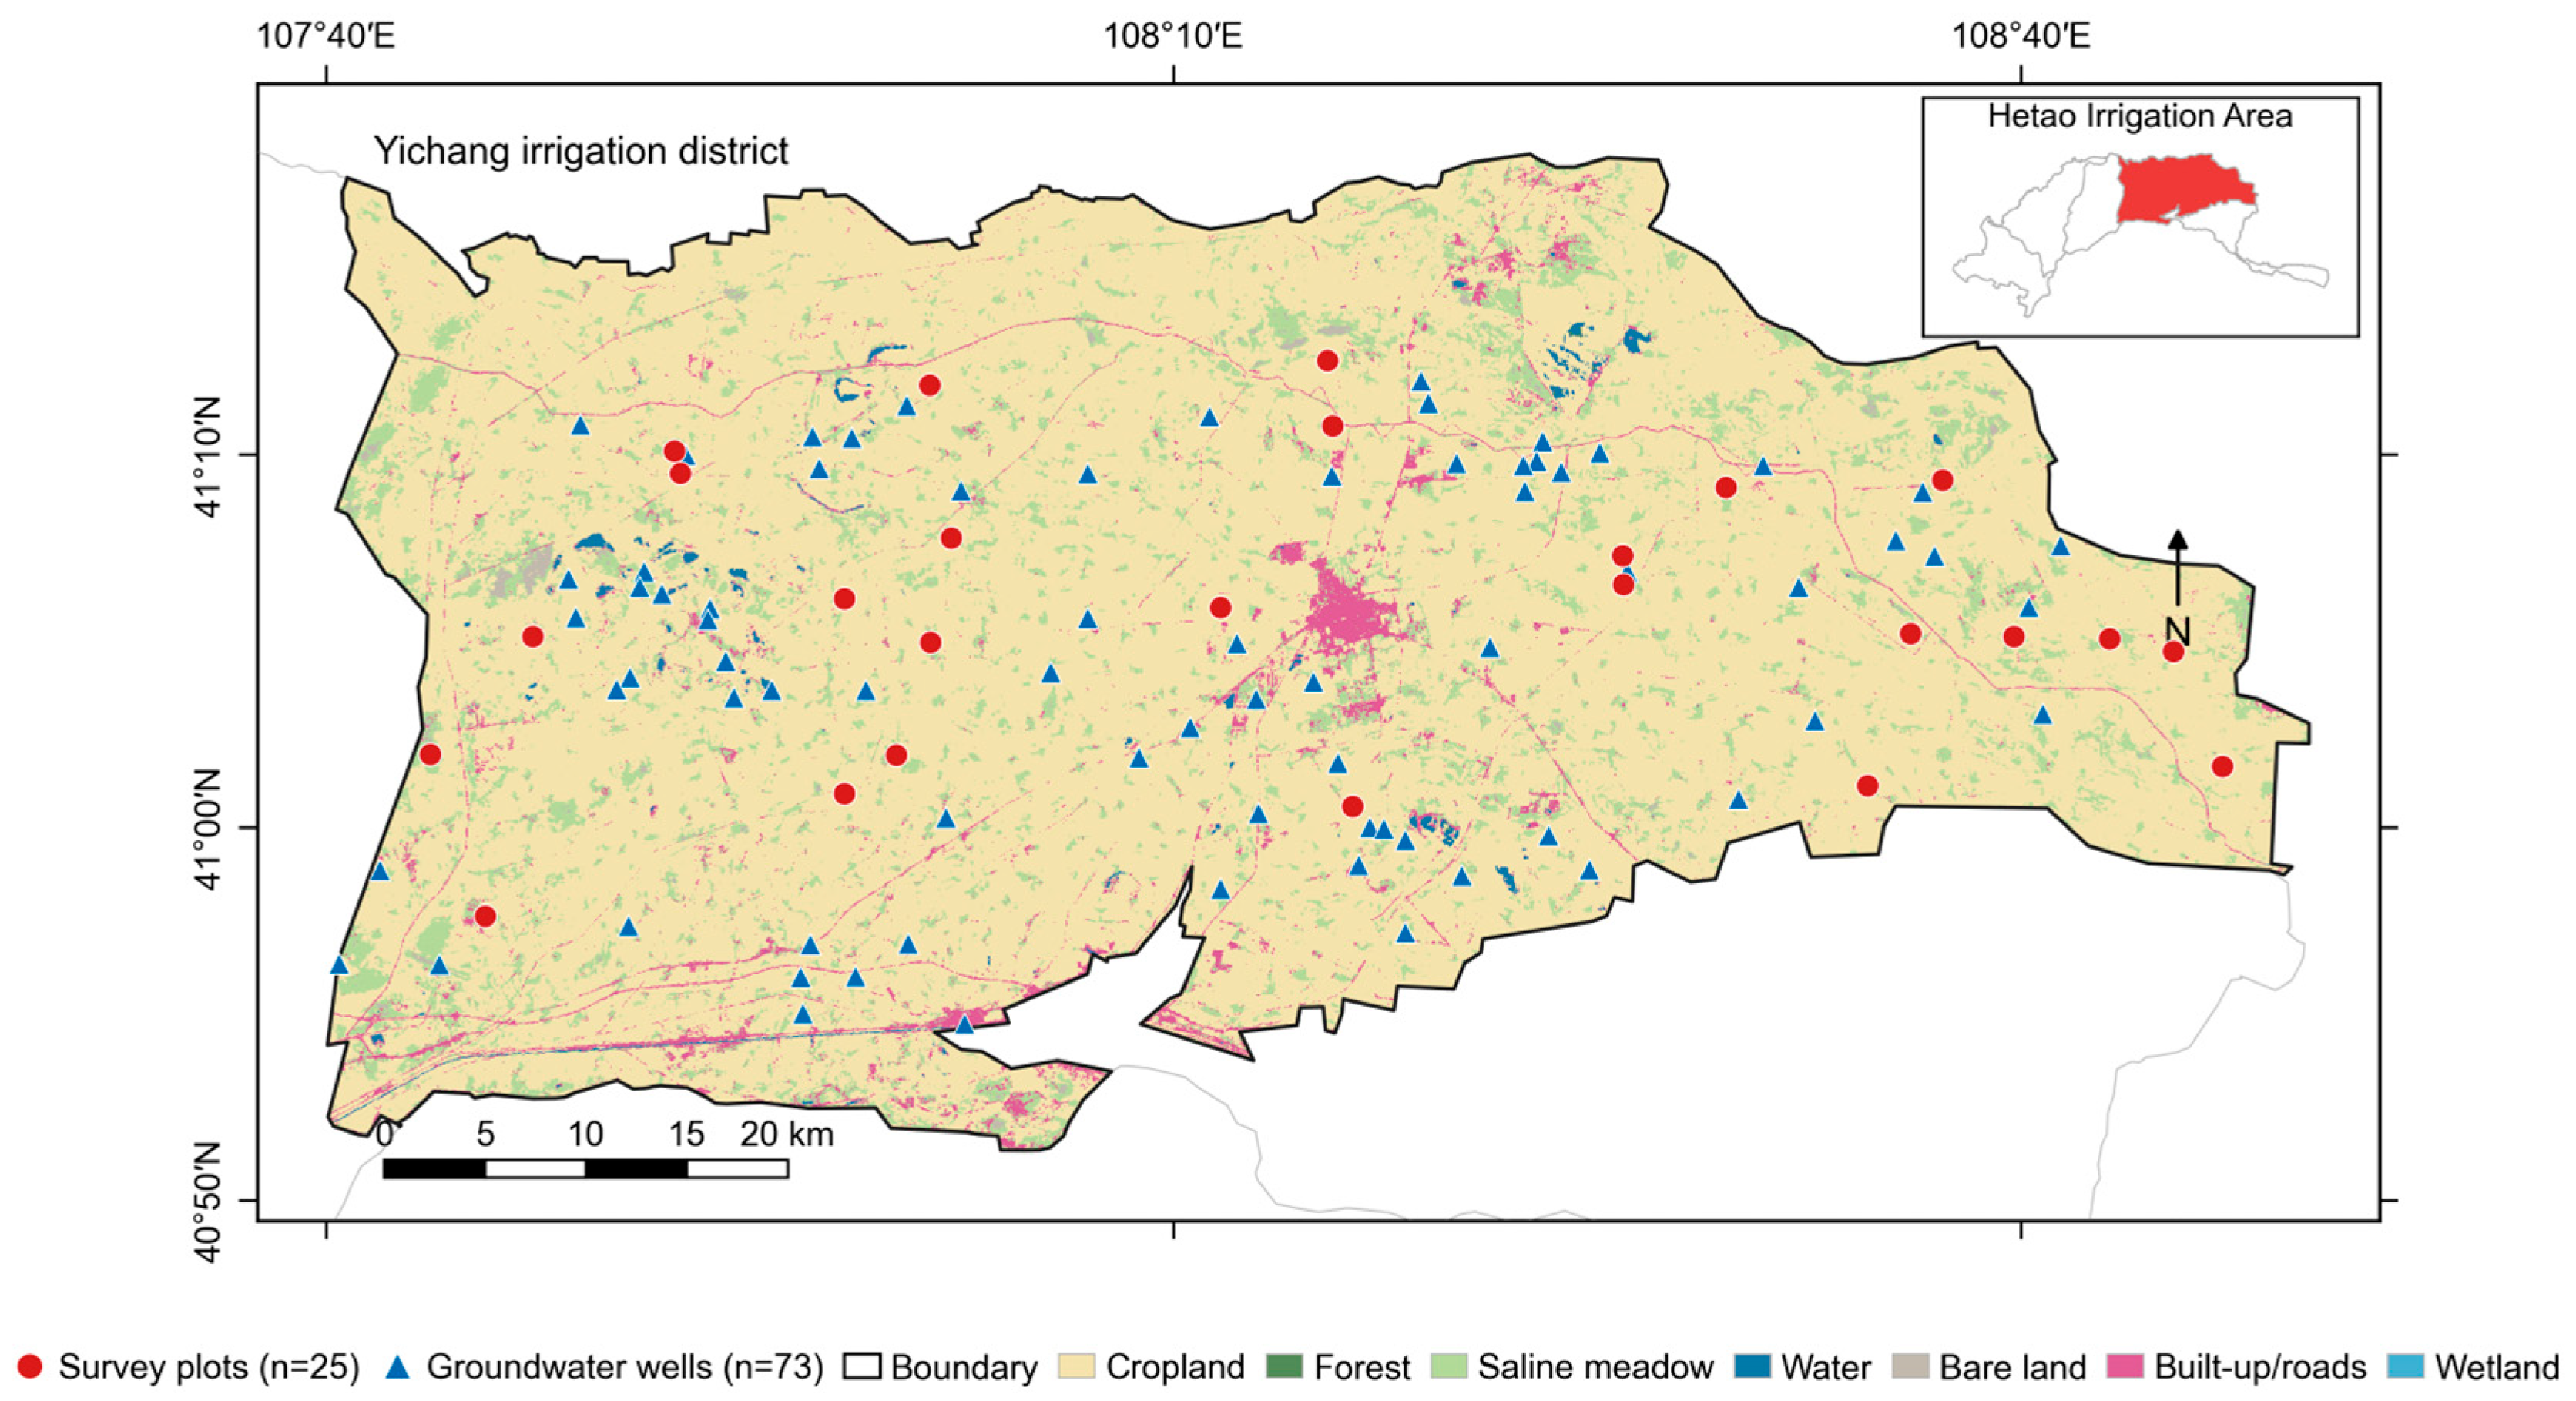
Figure 2.
Groundwater-depth observation, soil sampling and laboratory analysis.
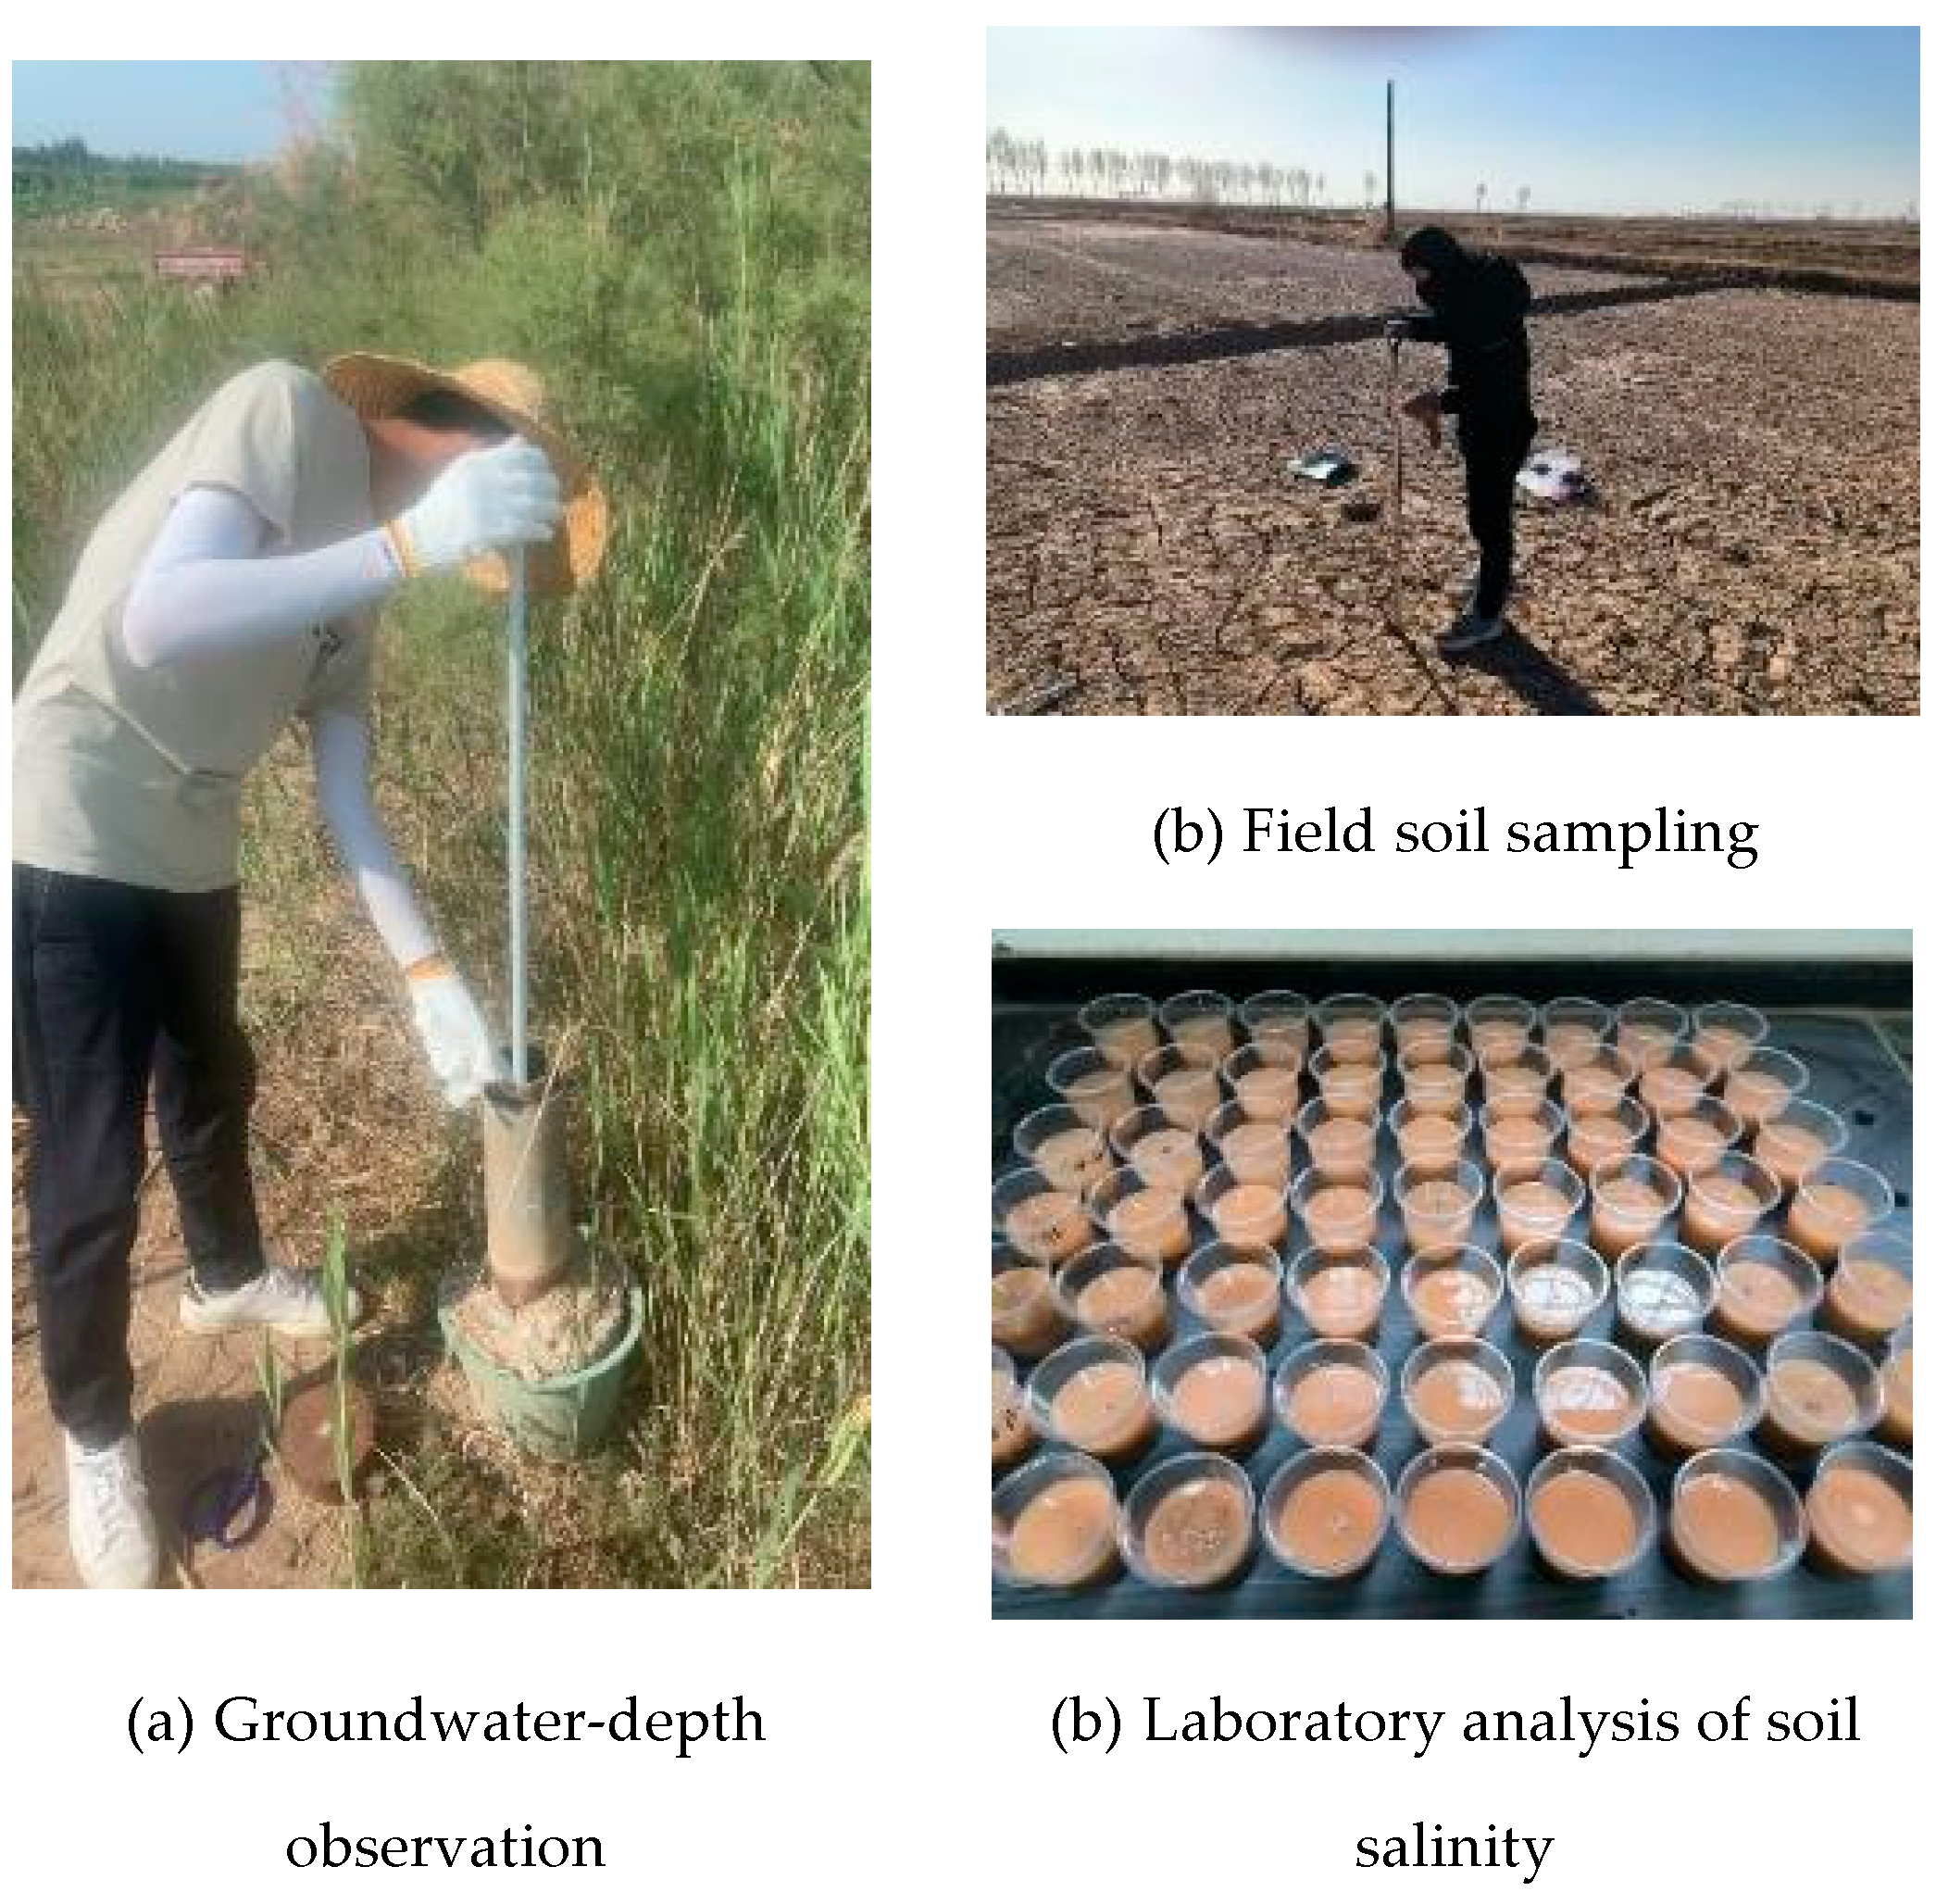
Figure 3.
Frequency distribution of groundwater depth.
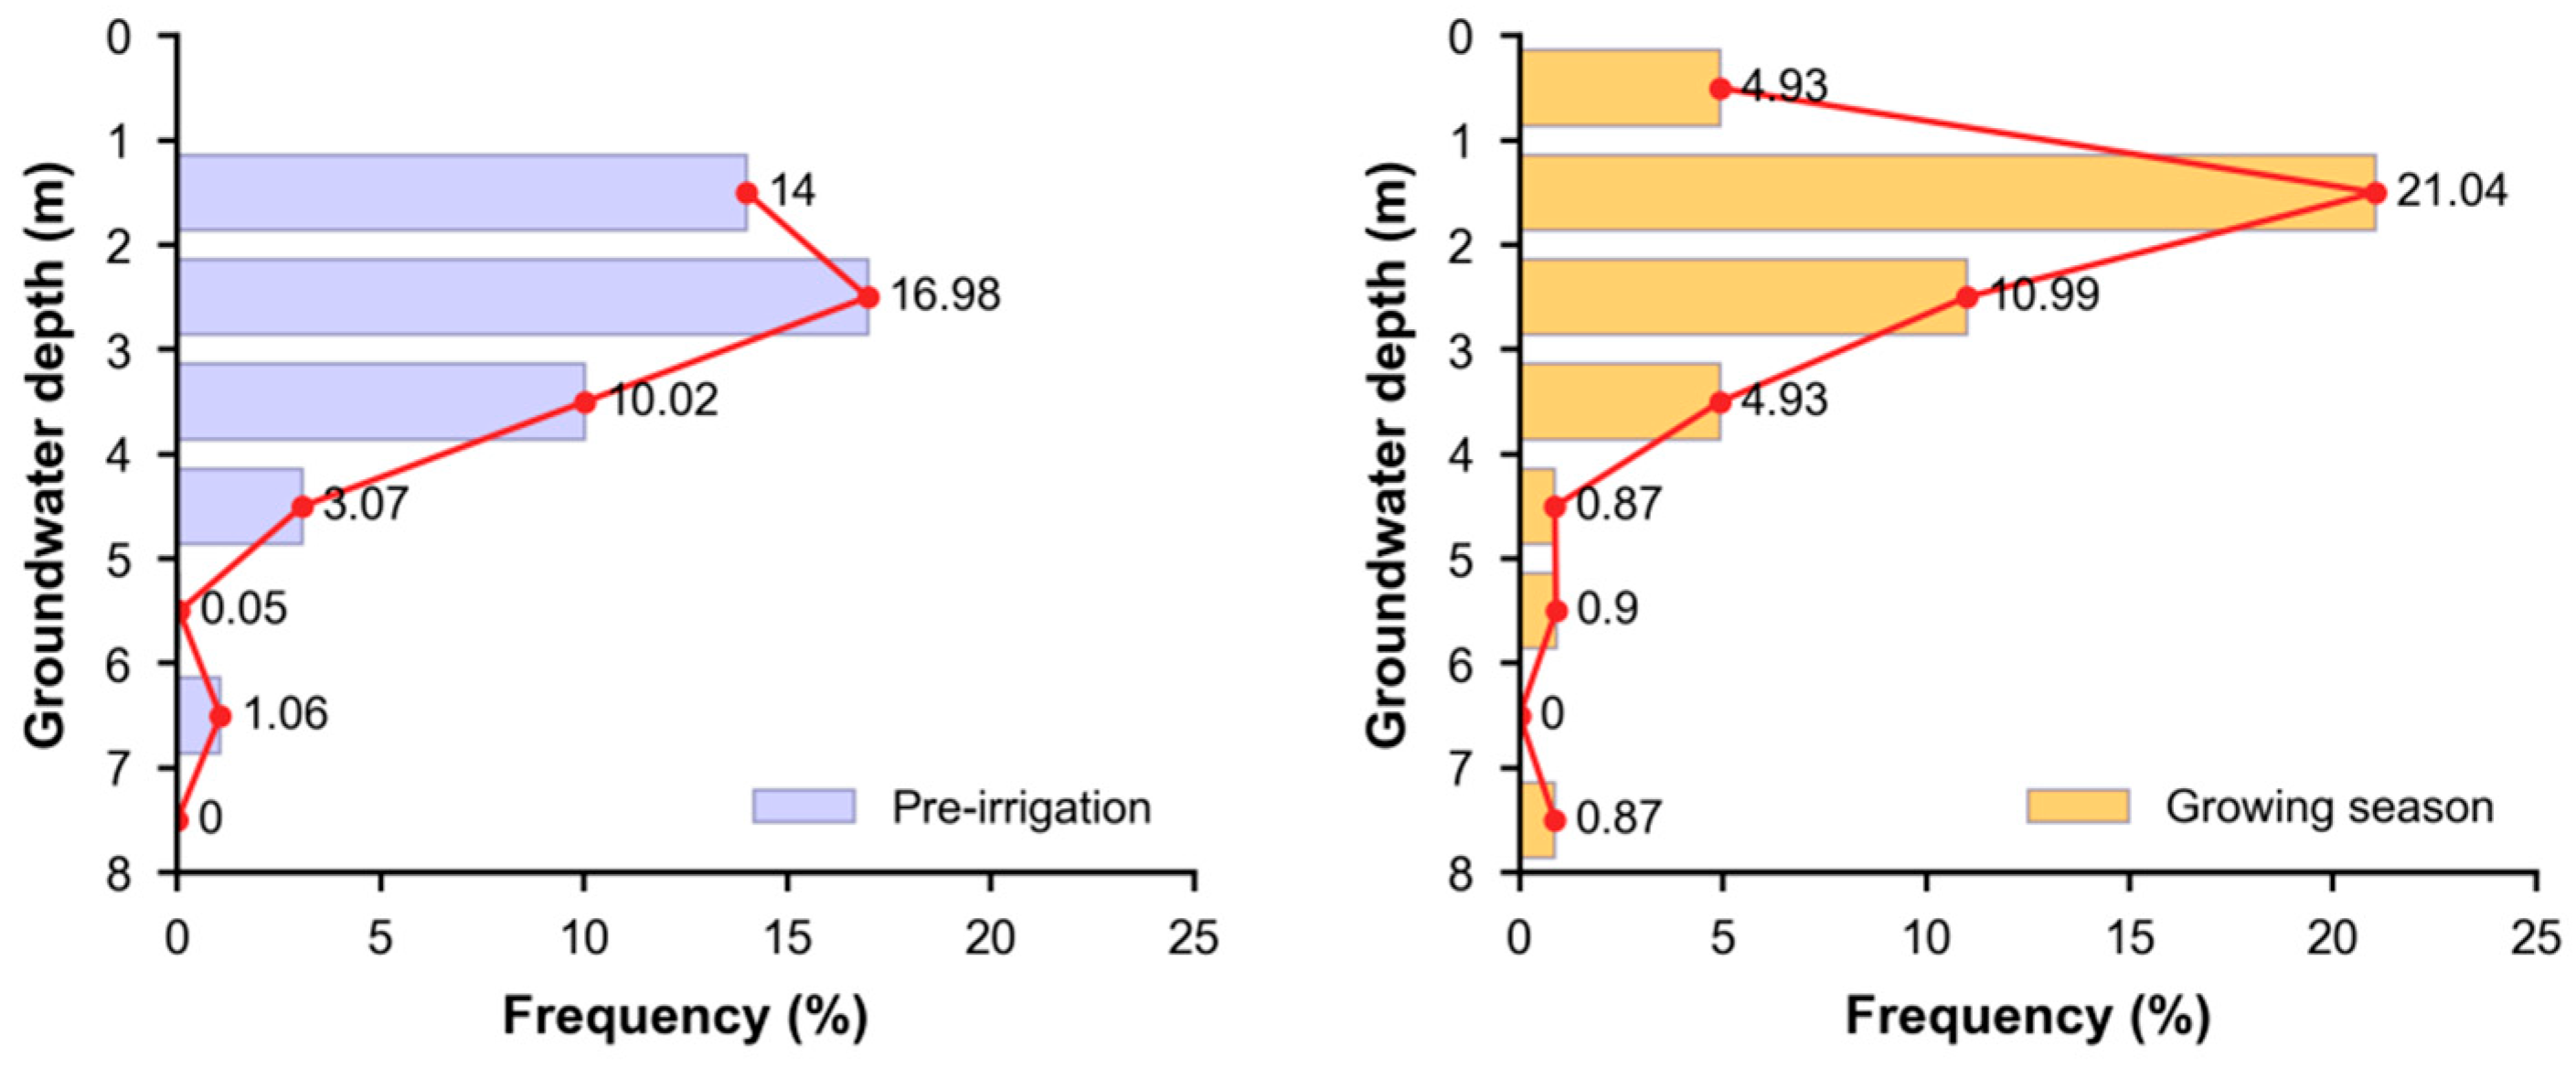
Figure 4.
Frequency distribution of logarithmically transformed groundwater depth.
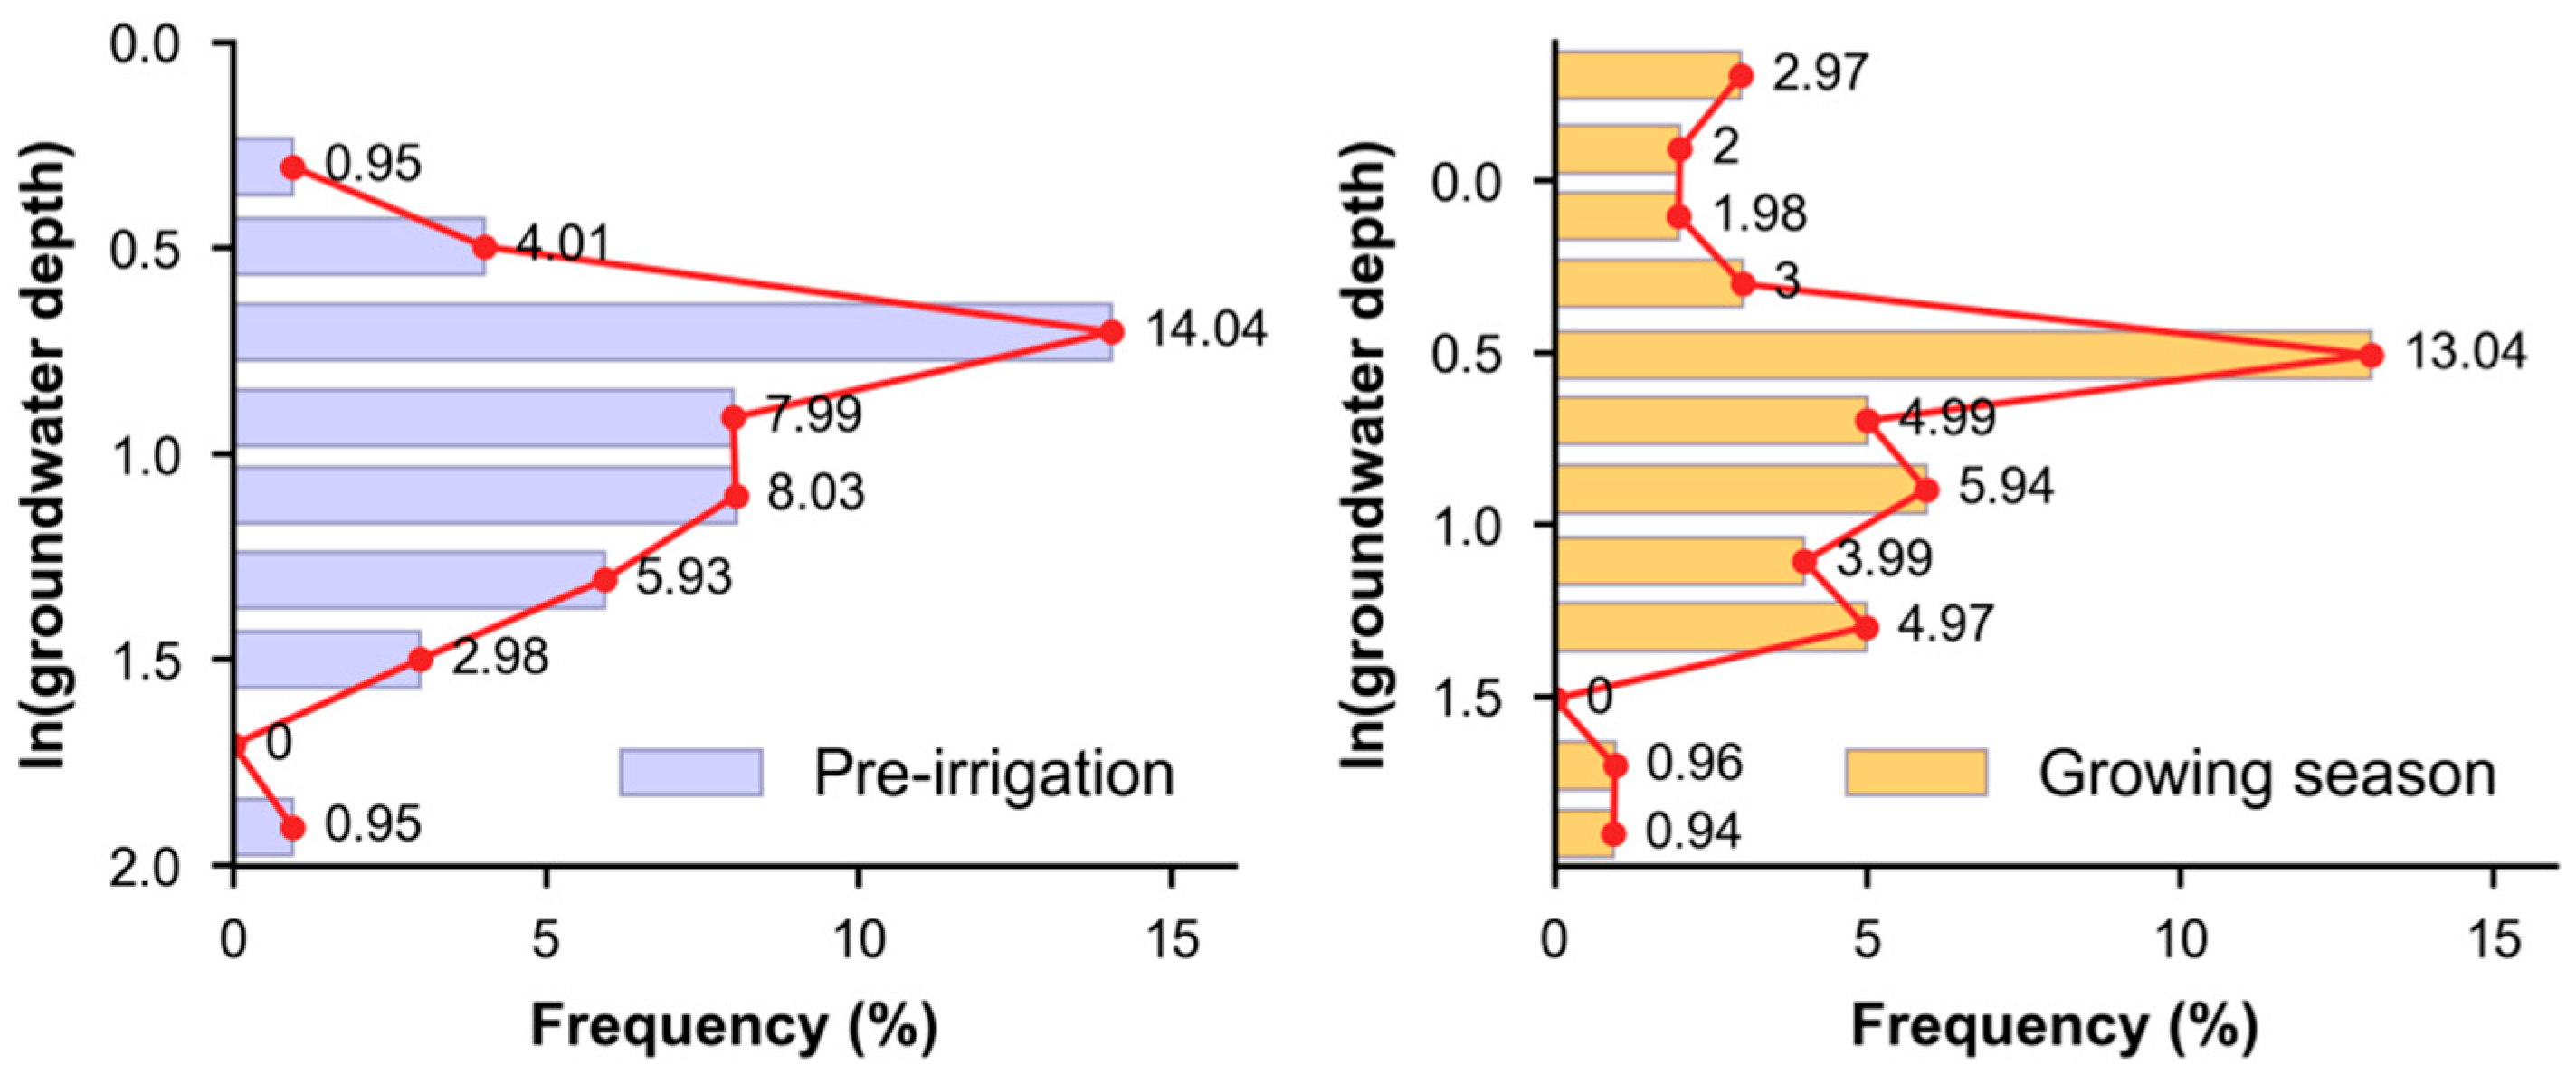
Figure 5.
Spatial probability distribution of groundwater depth before spring irrigation in 2020.
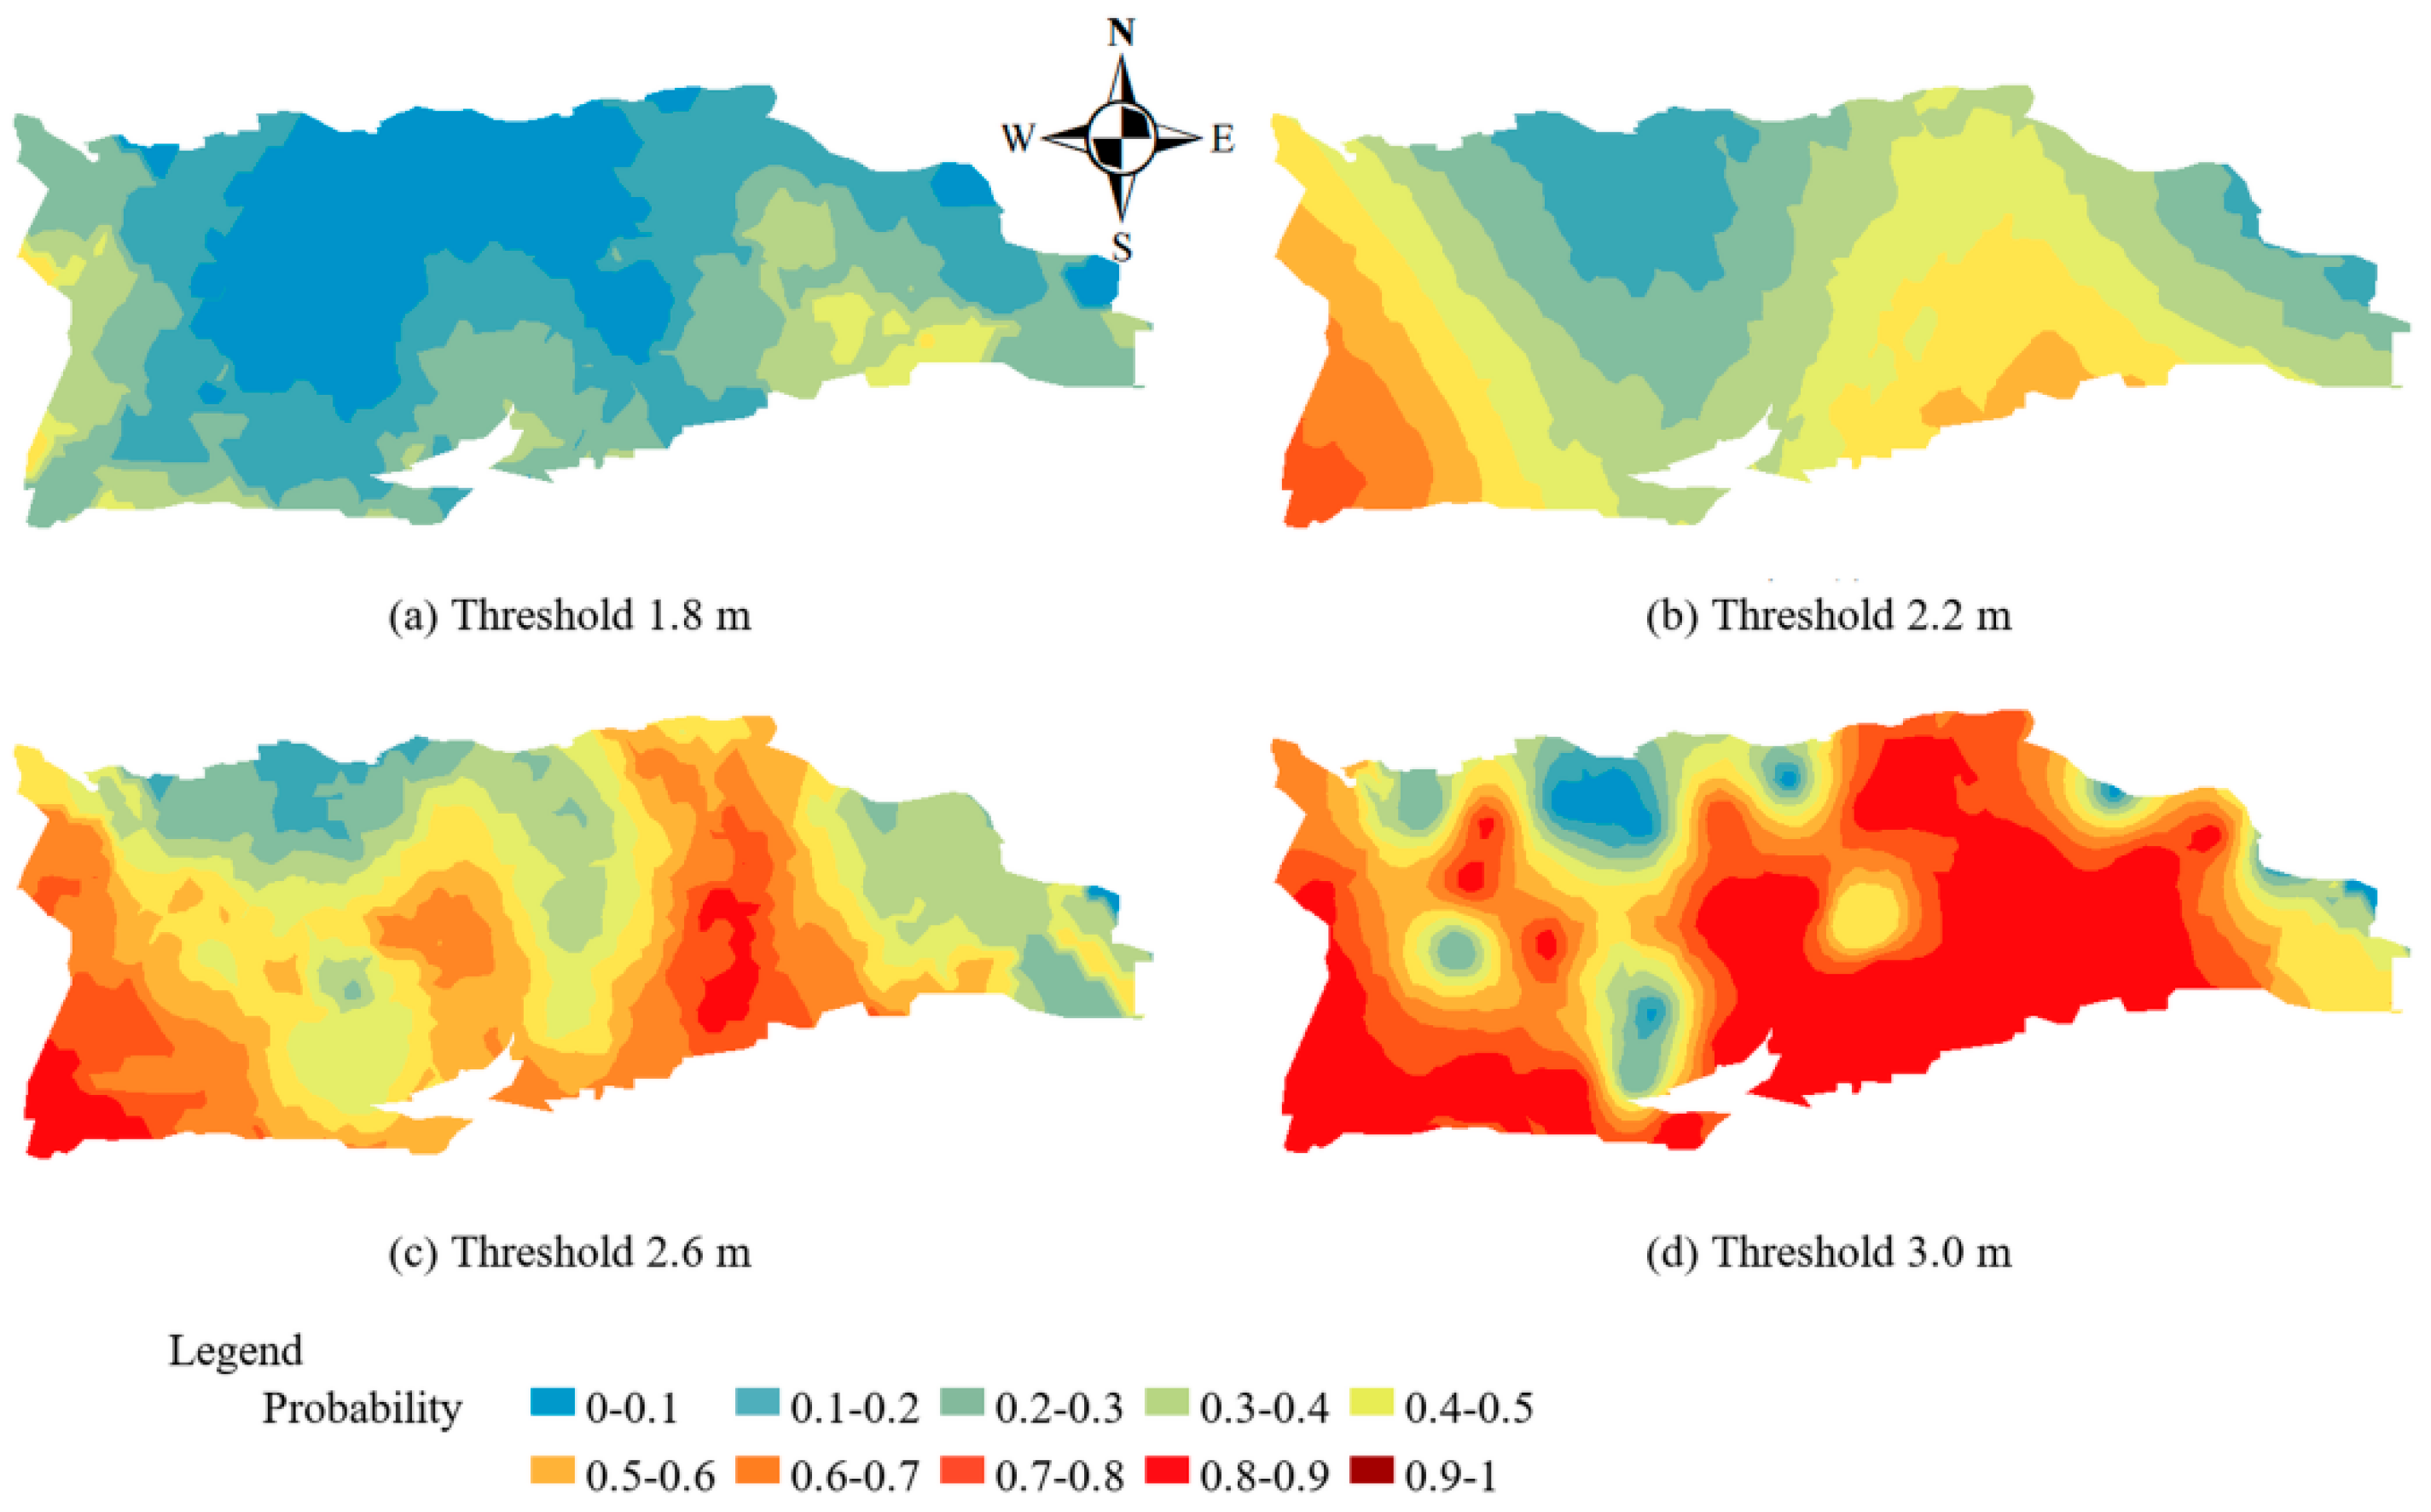
Figure 6.
Spatial probability distribution of groundwater depth during the growing season in 2020.
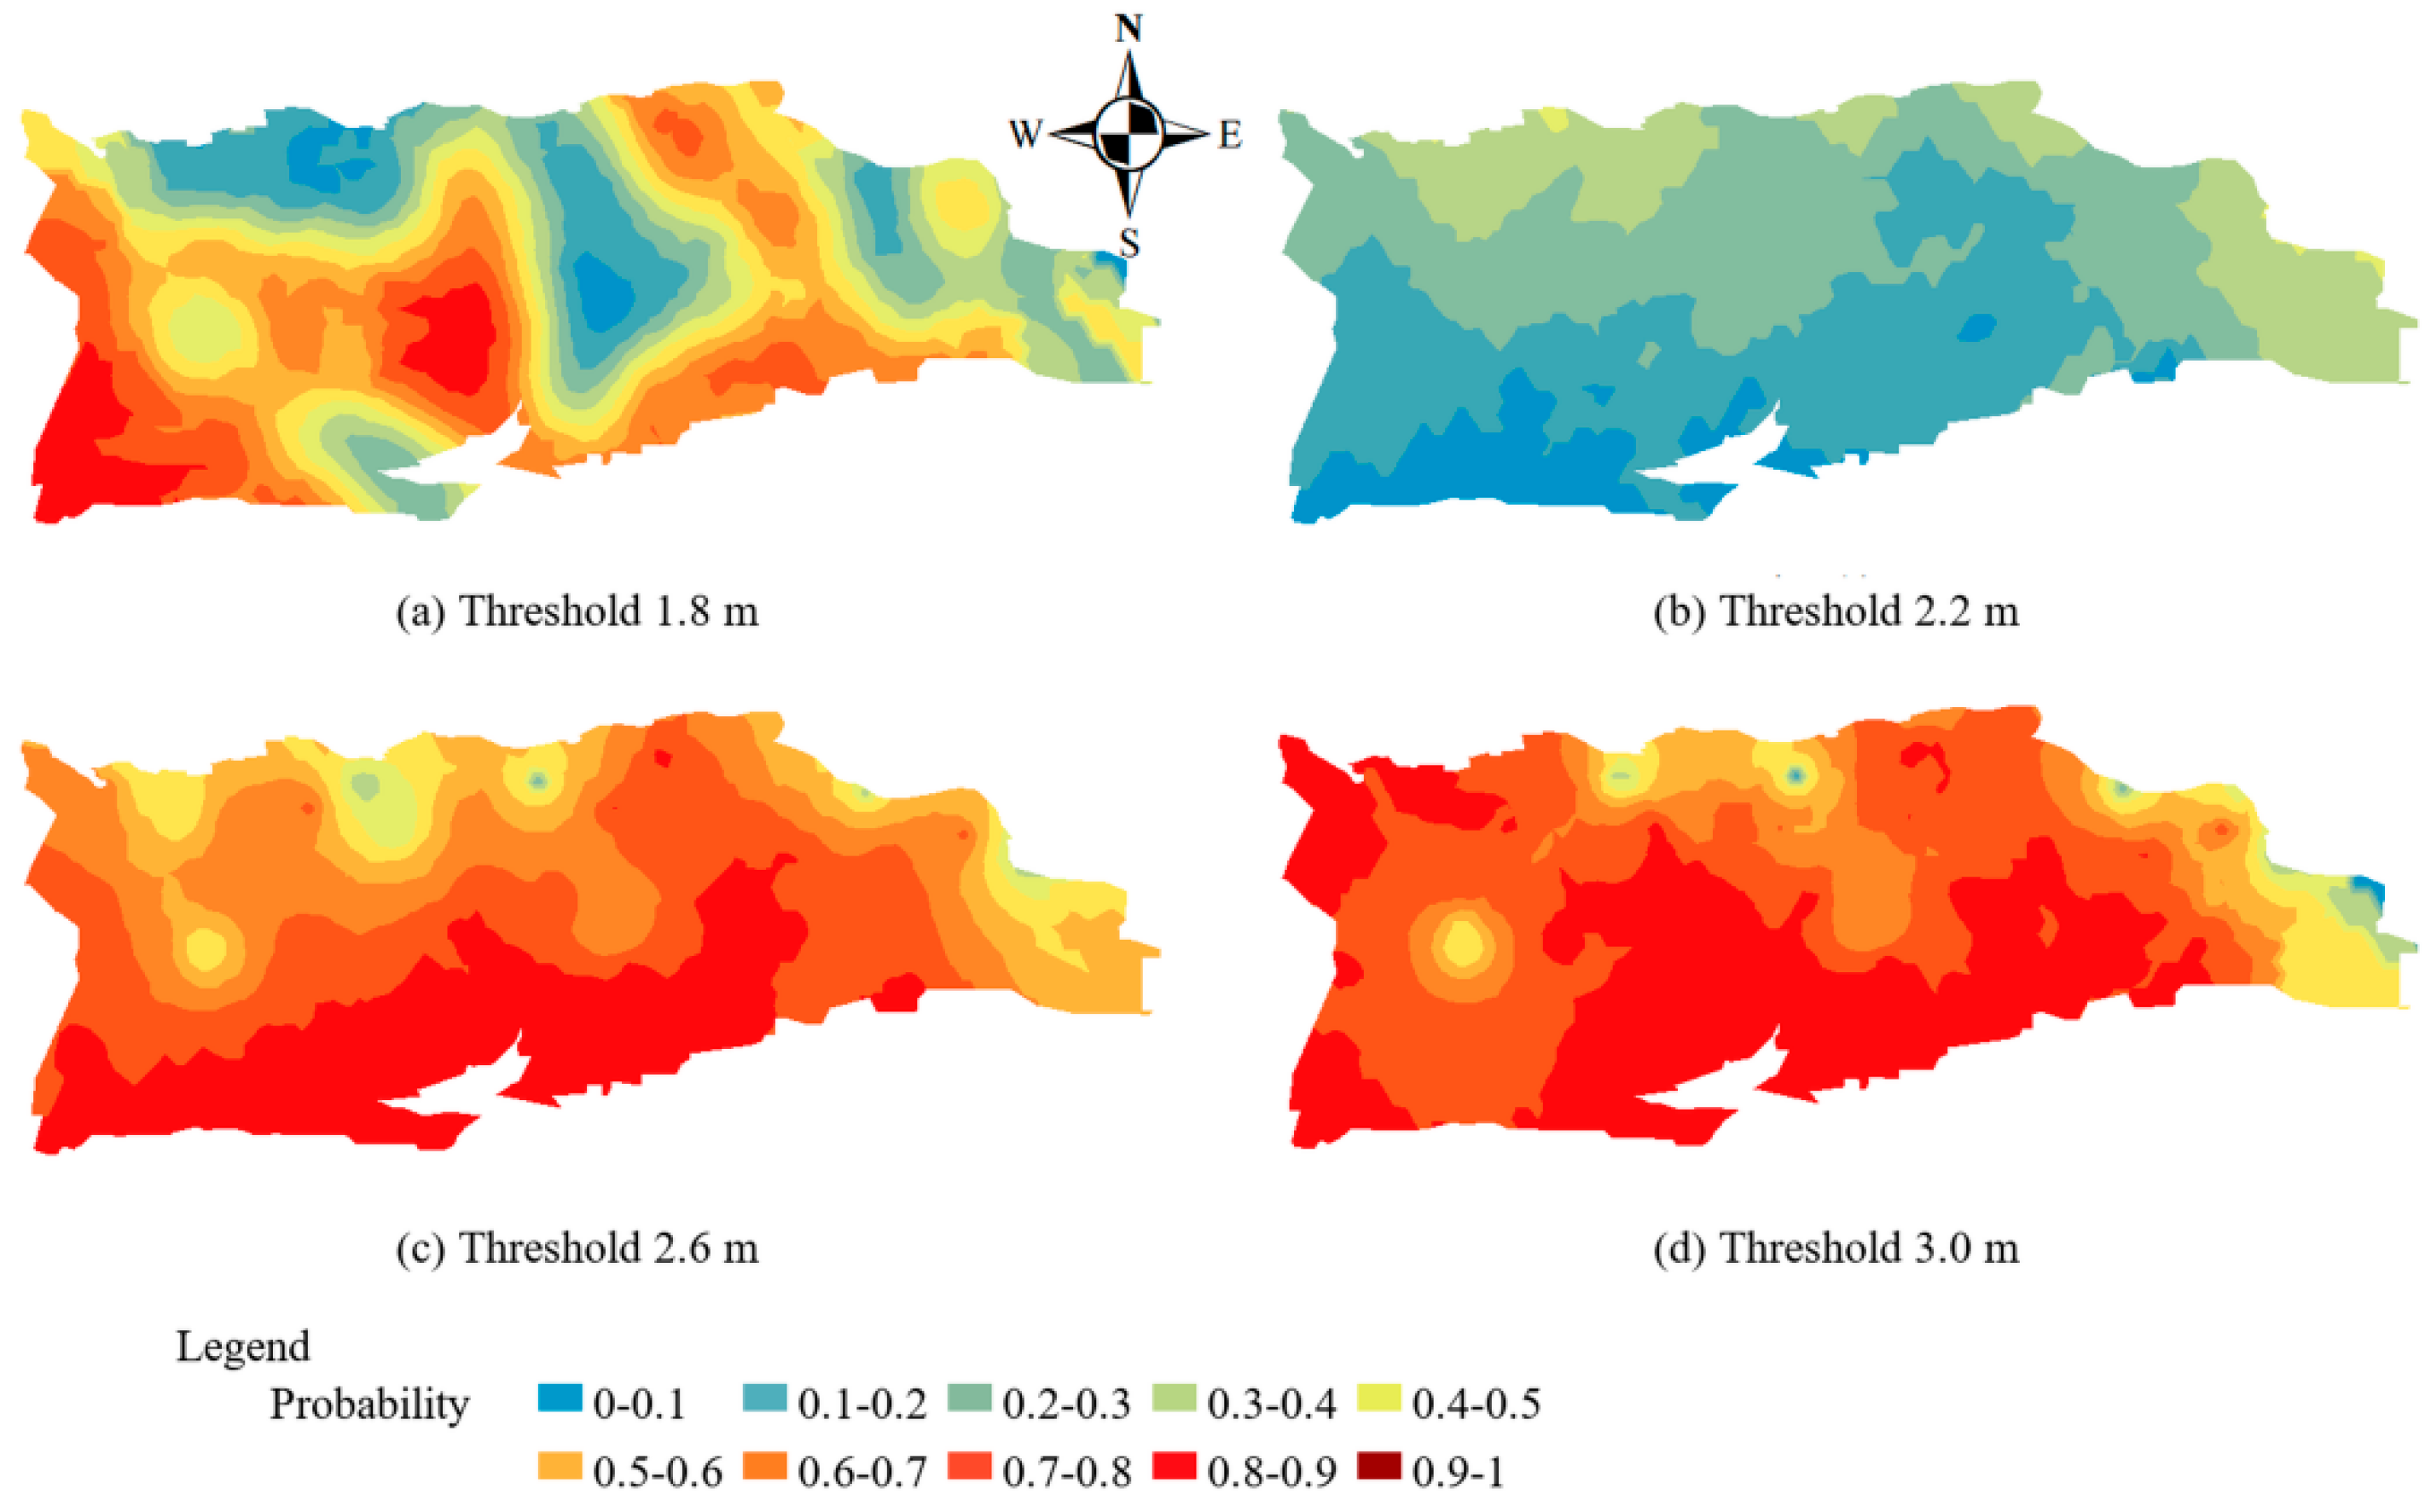
Figure 7.
Frequency distribution of soil salt content.
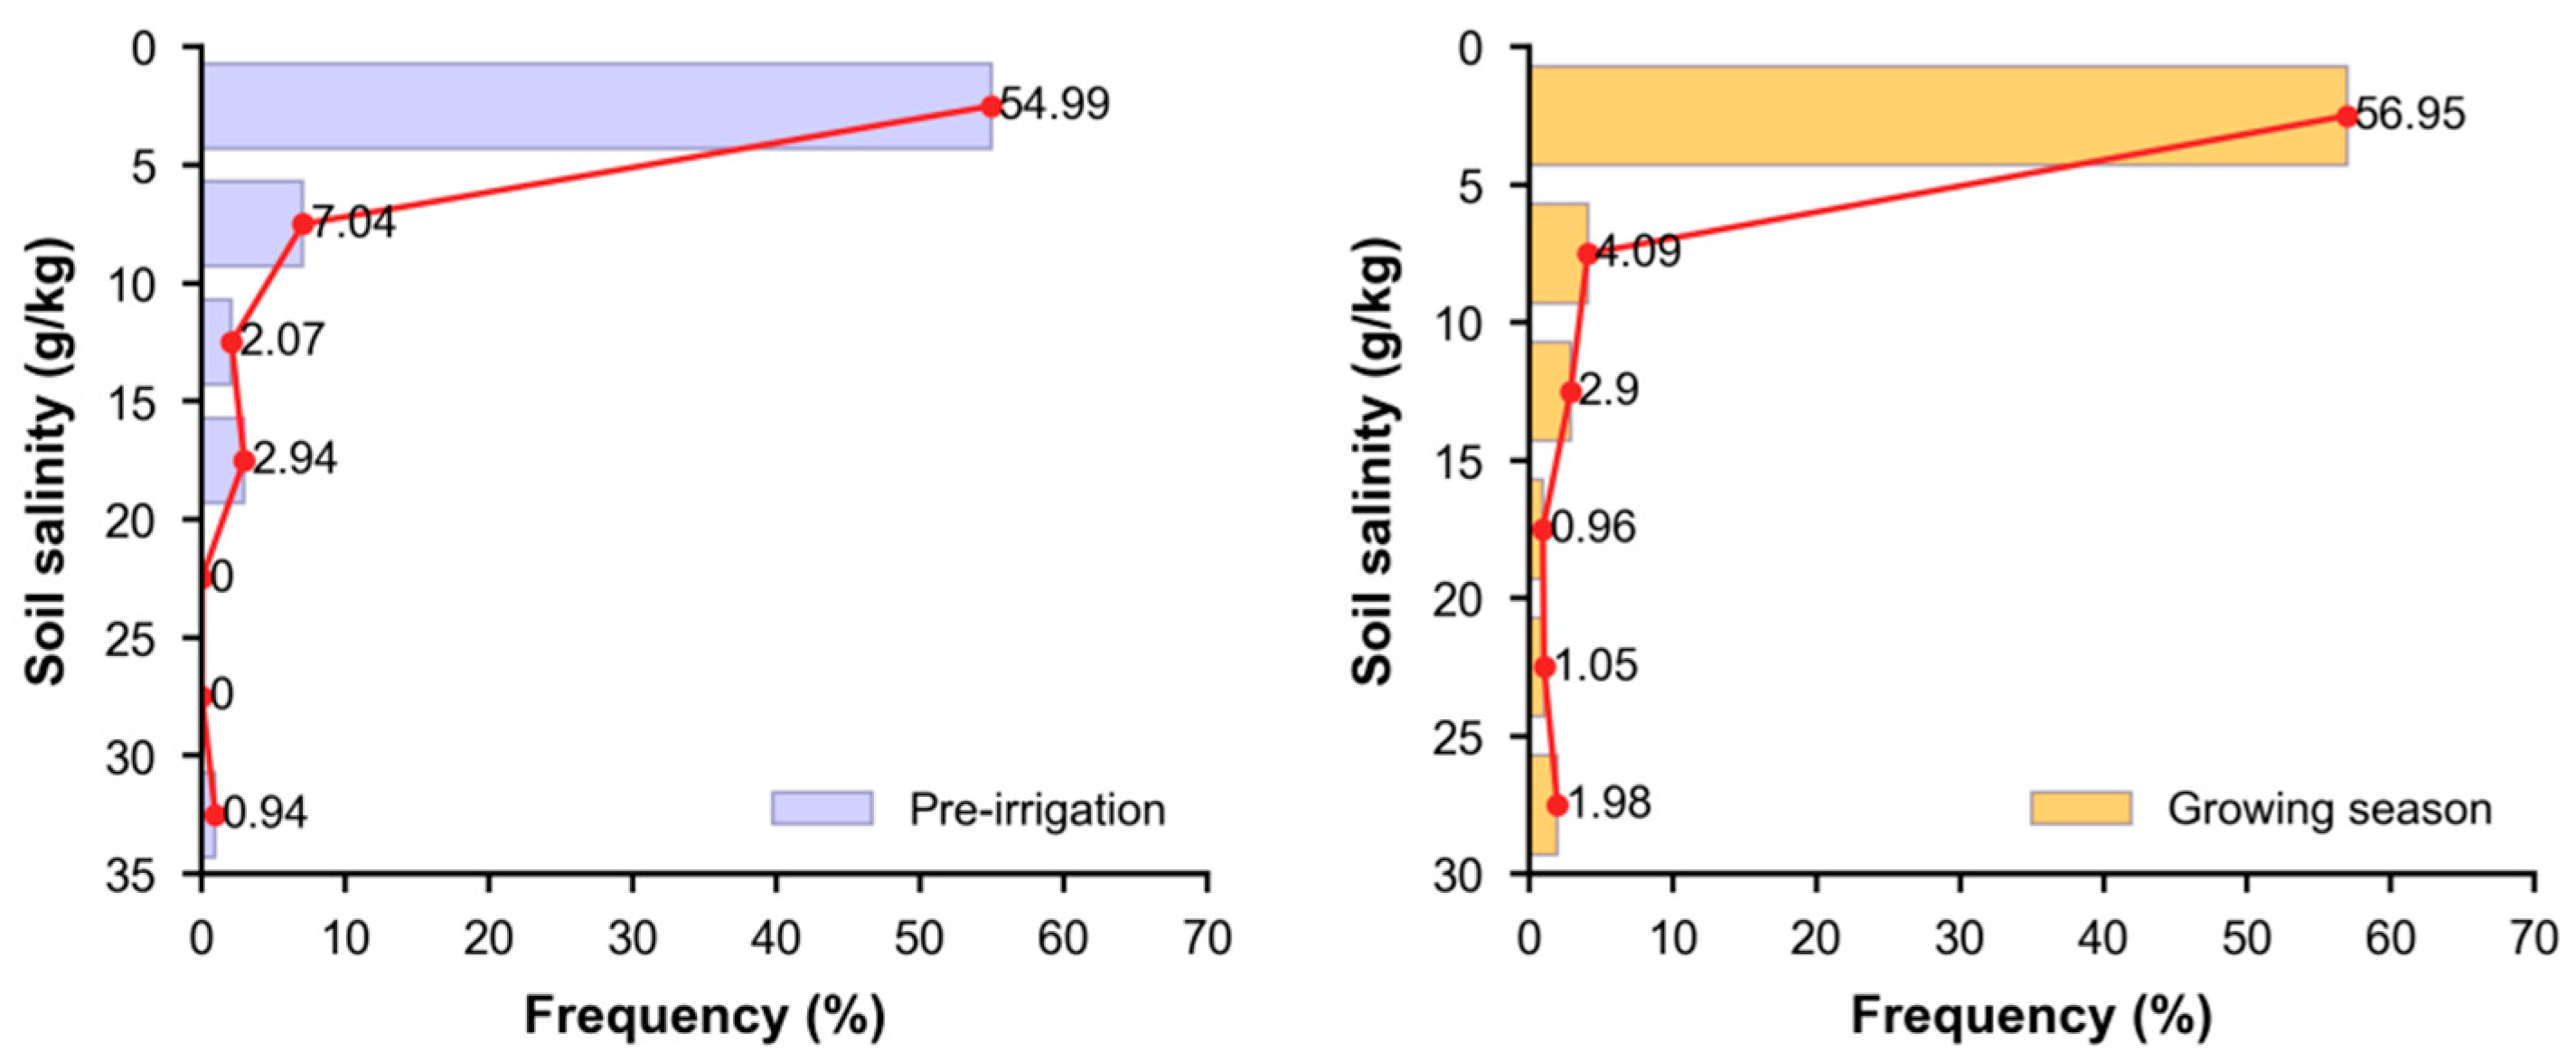
Figure 8.
Frequency distribution of logarithmically transformed soil salt content.
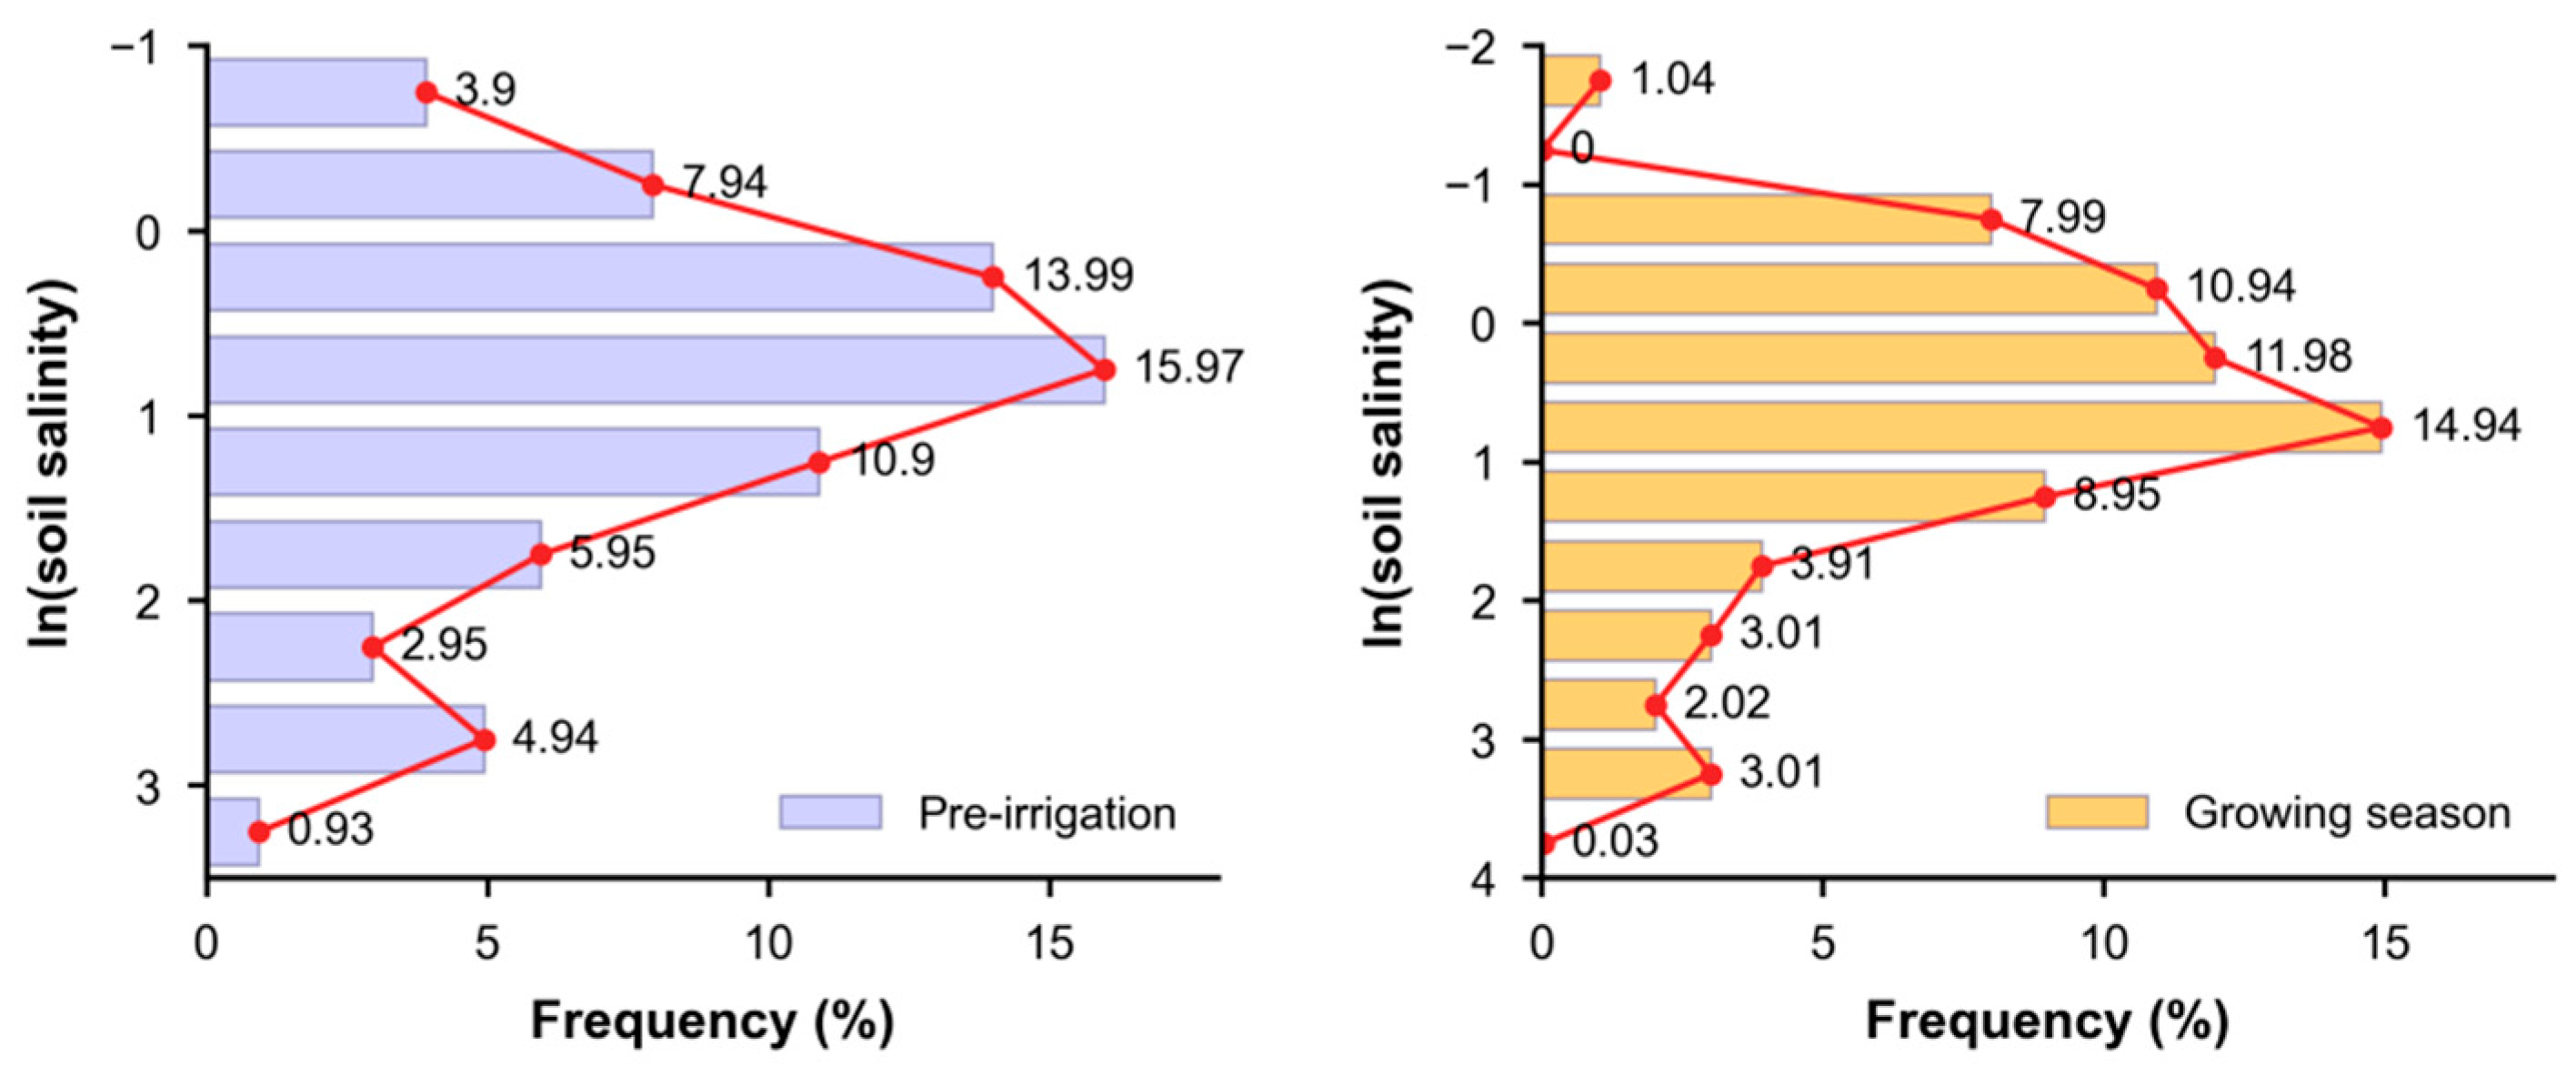
Figure 9.
Spatial probability distribution of soil salt content under different thresholds before spring irrigation in 2020.
Figure 9.
Spatial probability distribution of soil salt content under different thresholds before spring irrigation in 2020.
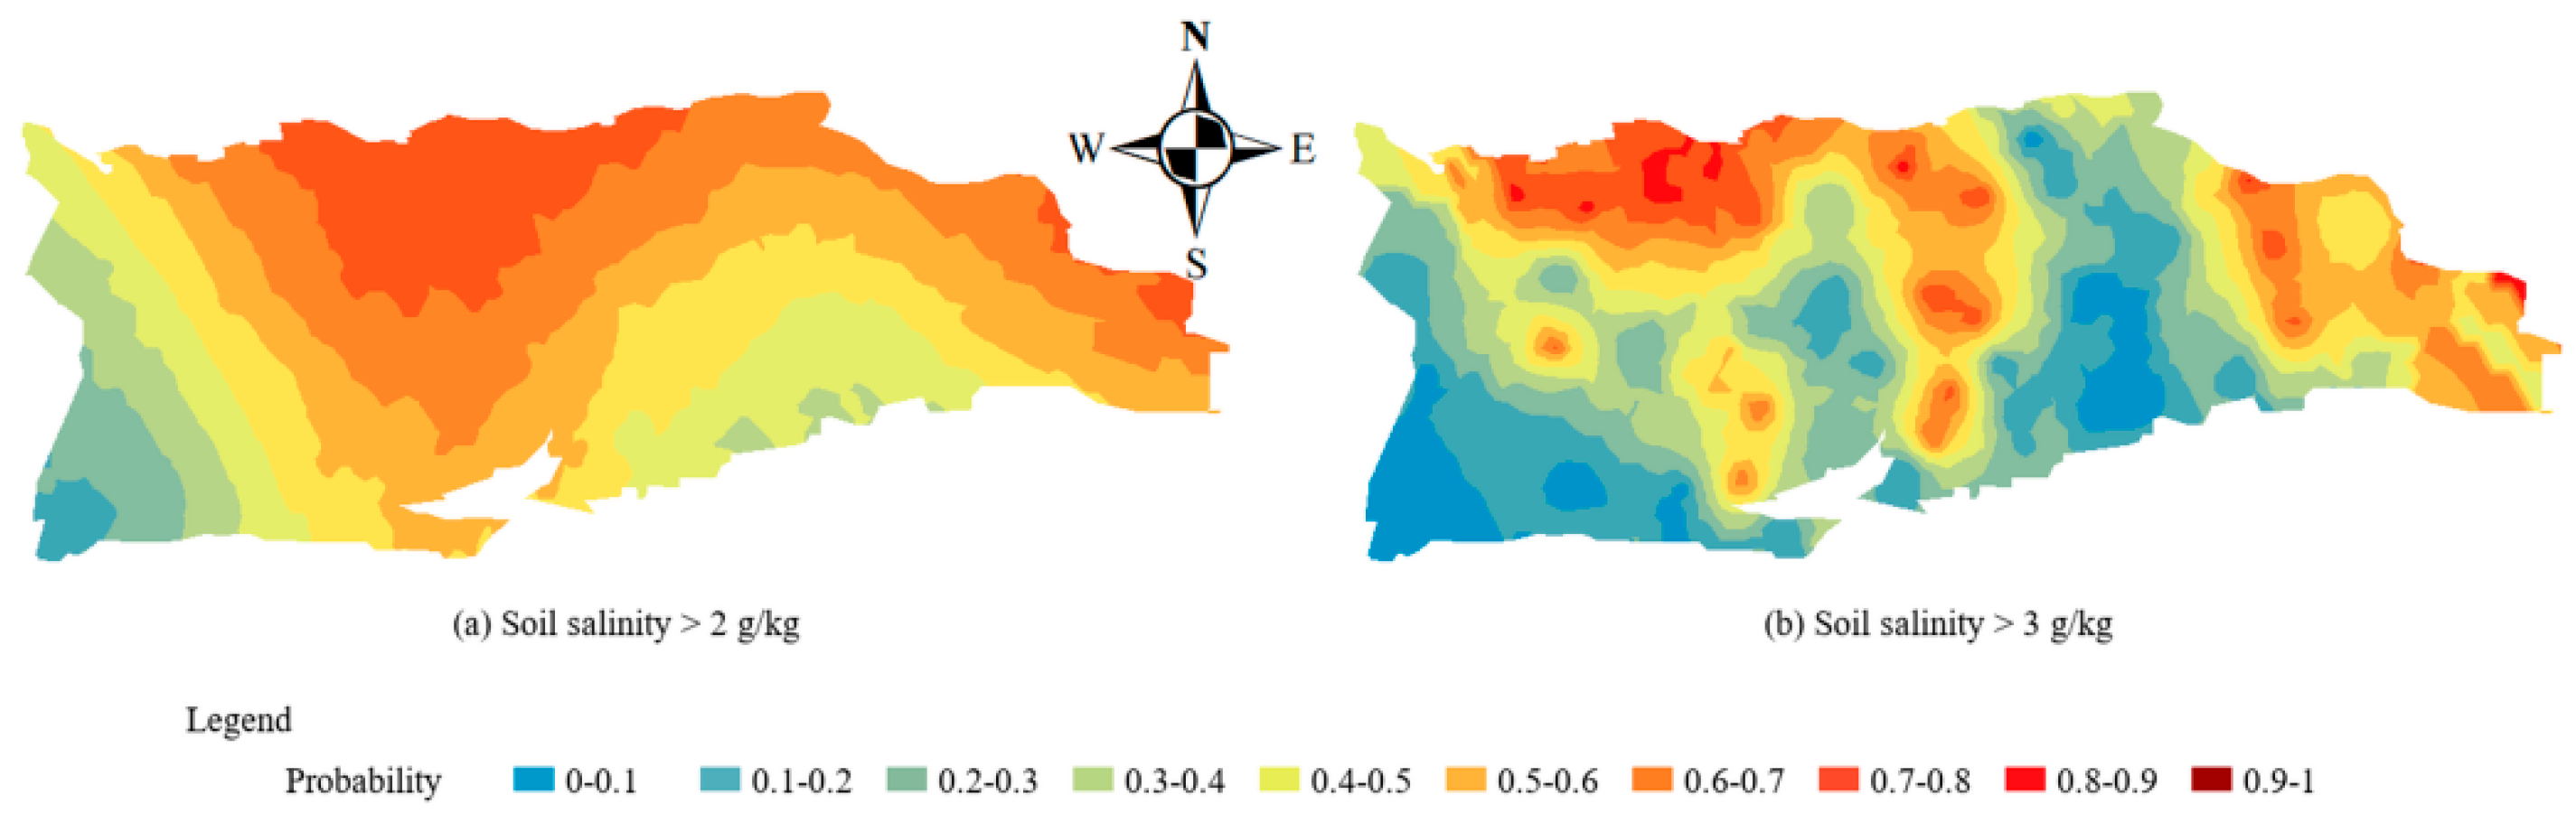
Figure 10.
Spatial probability distribution of soil salt content under different thresholds during the growing season in 2020.
Figure 10.
Spatial probability distribution of soil salt content under different thresholds during the growing season in 2020.
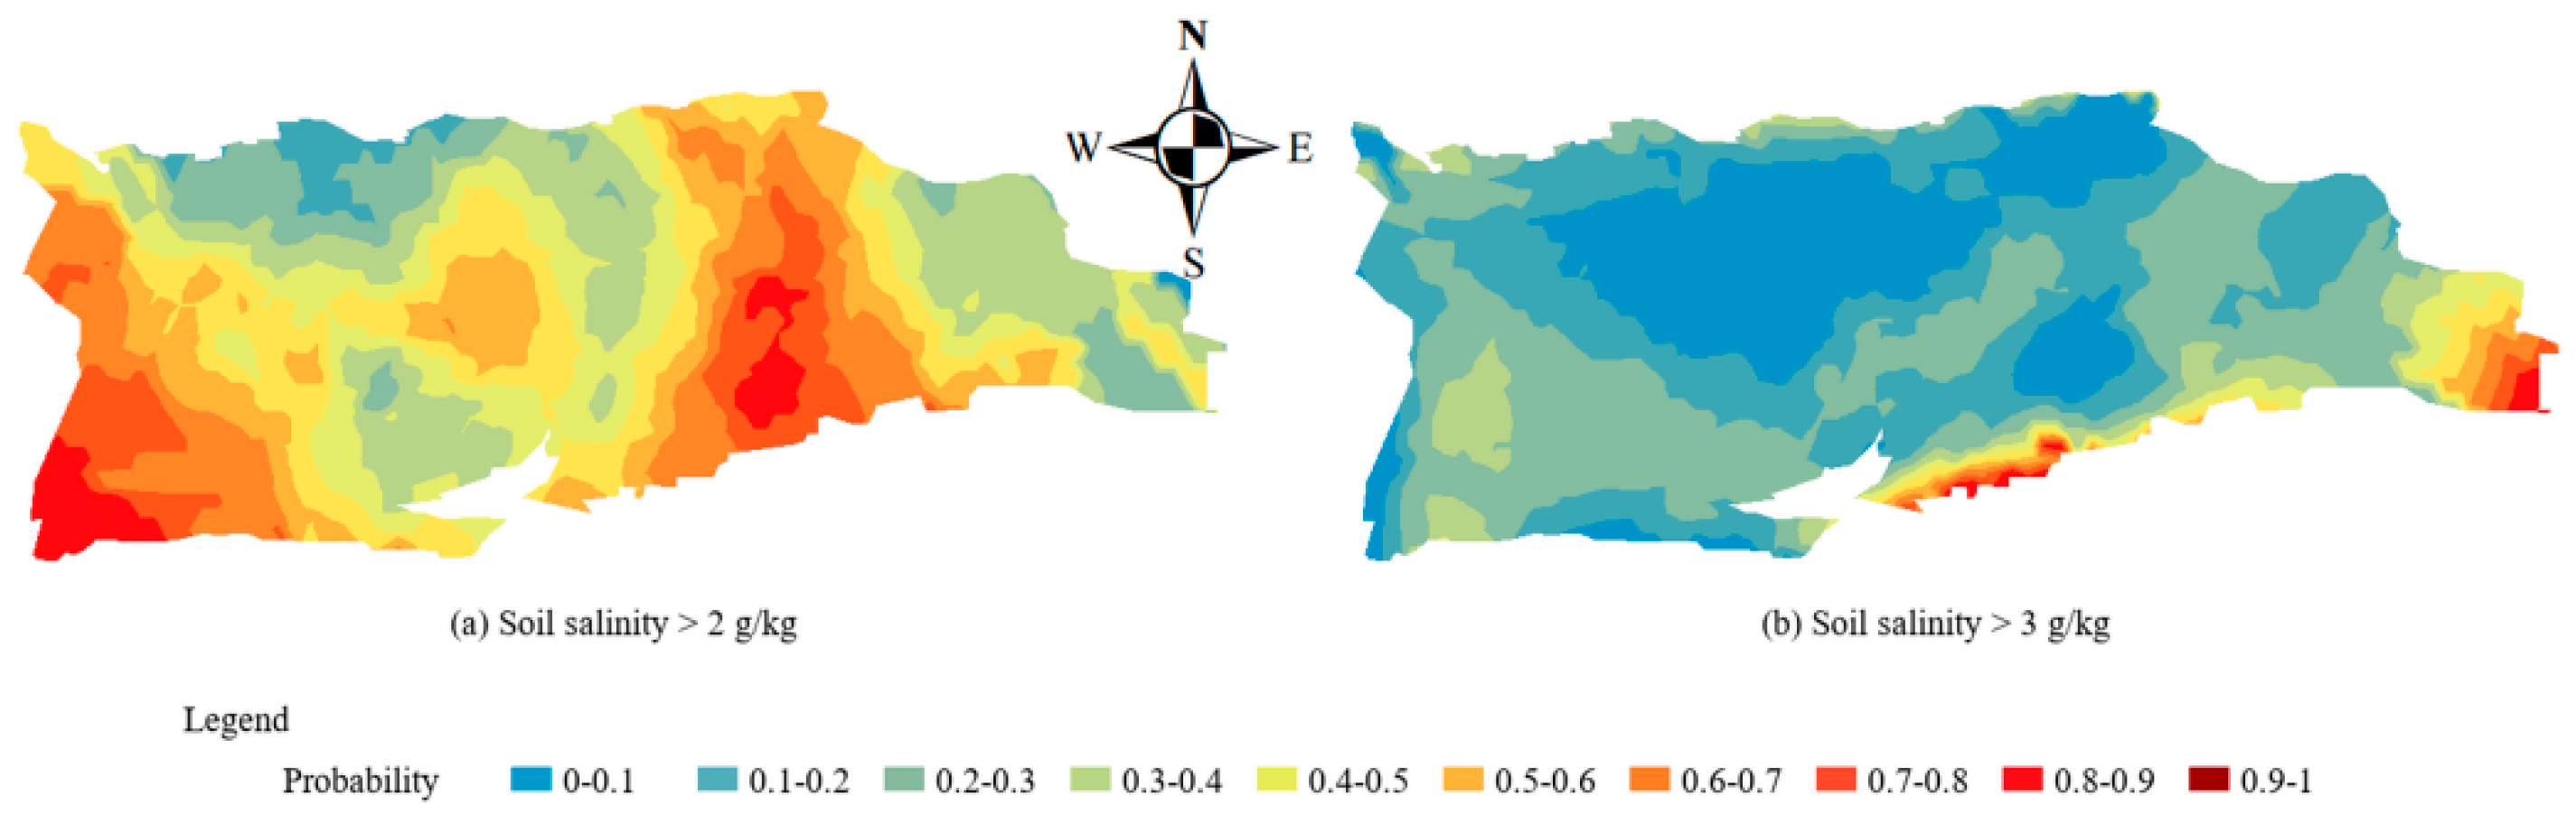
Figure 11.
Matching rates between soil salt-content and groundwater-depth probability zones under different thresholds before spring irrigation in 2020.
Figure 11.
Matching rates between soil salt-content and groundwater-depth probability zones under different thresholds before spring irrigation in 2020.
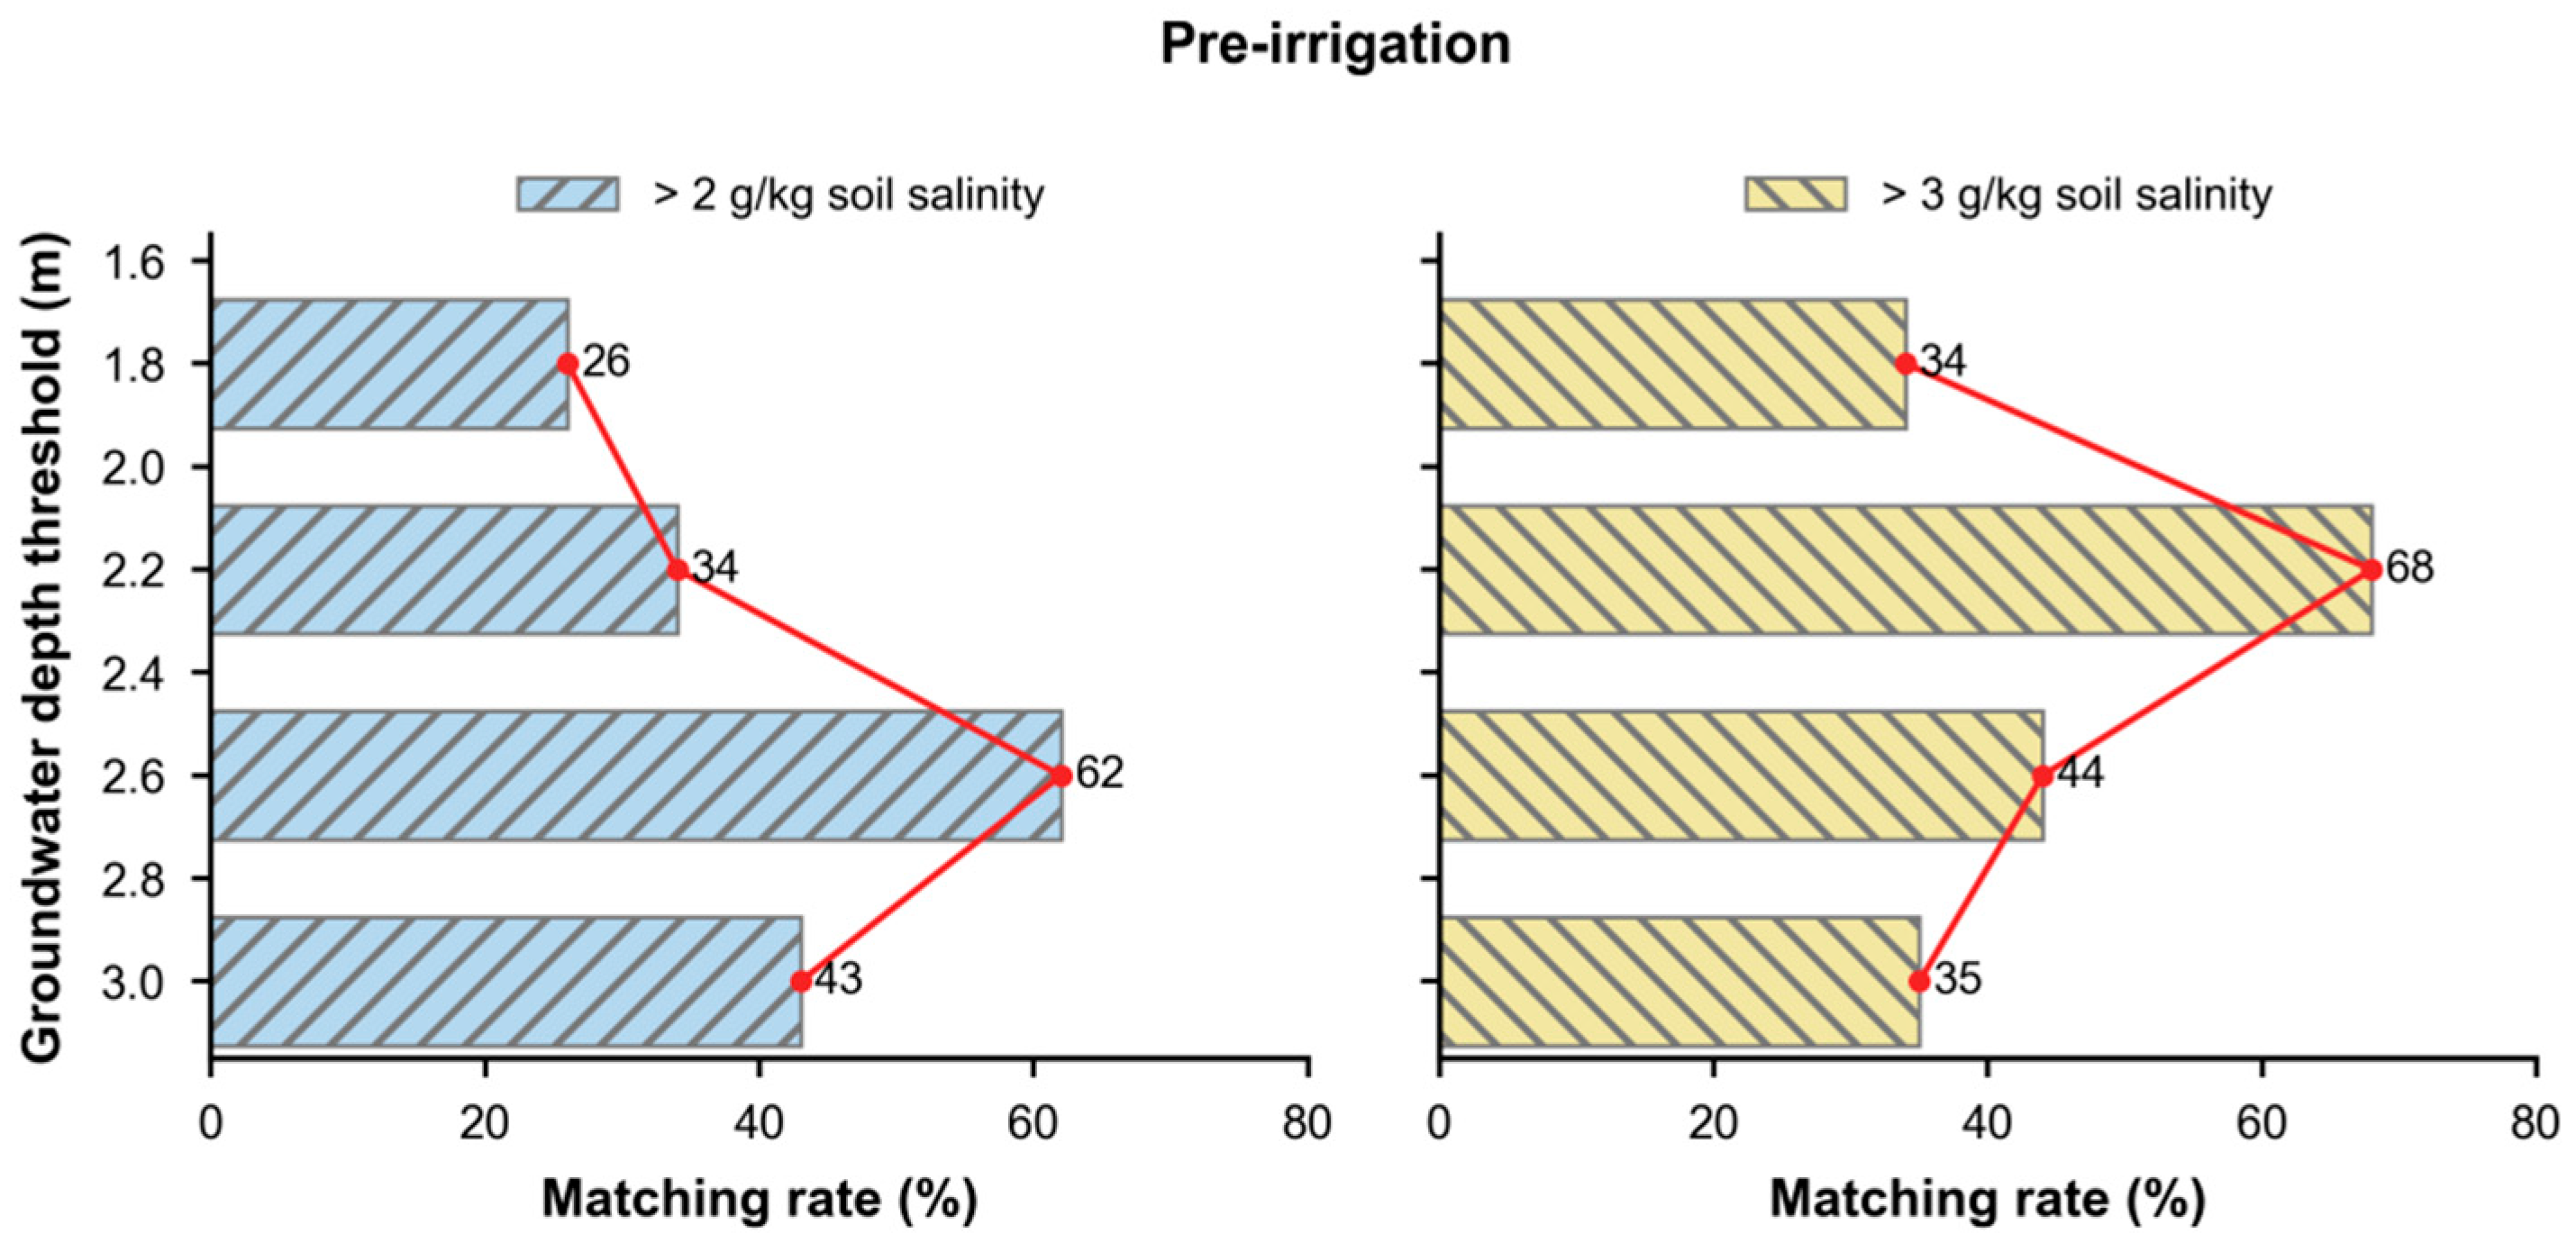
Figure 12.
Matching rates between soil salt-content and groundwater-depth probability zones under different thresholds during the growing season in 2020.
Figure 12.
Matching rates between soil salt-content and groundwater-depth probability zones under different thresholds during the growing season in 2020.
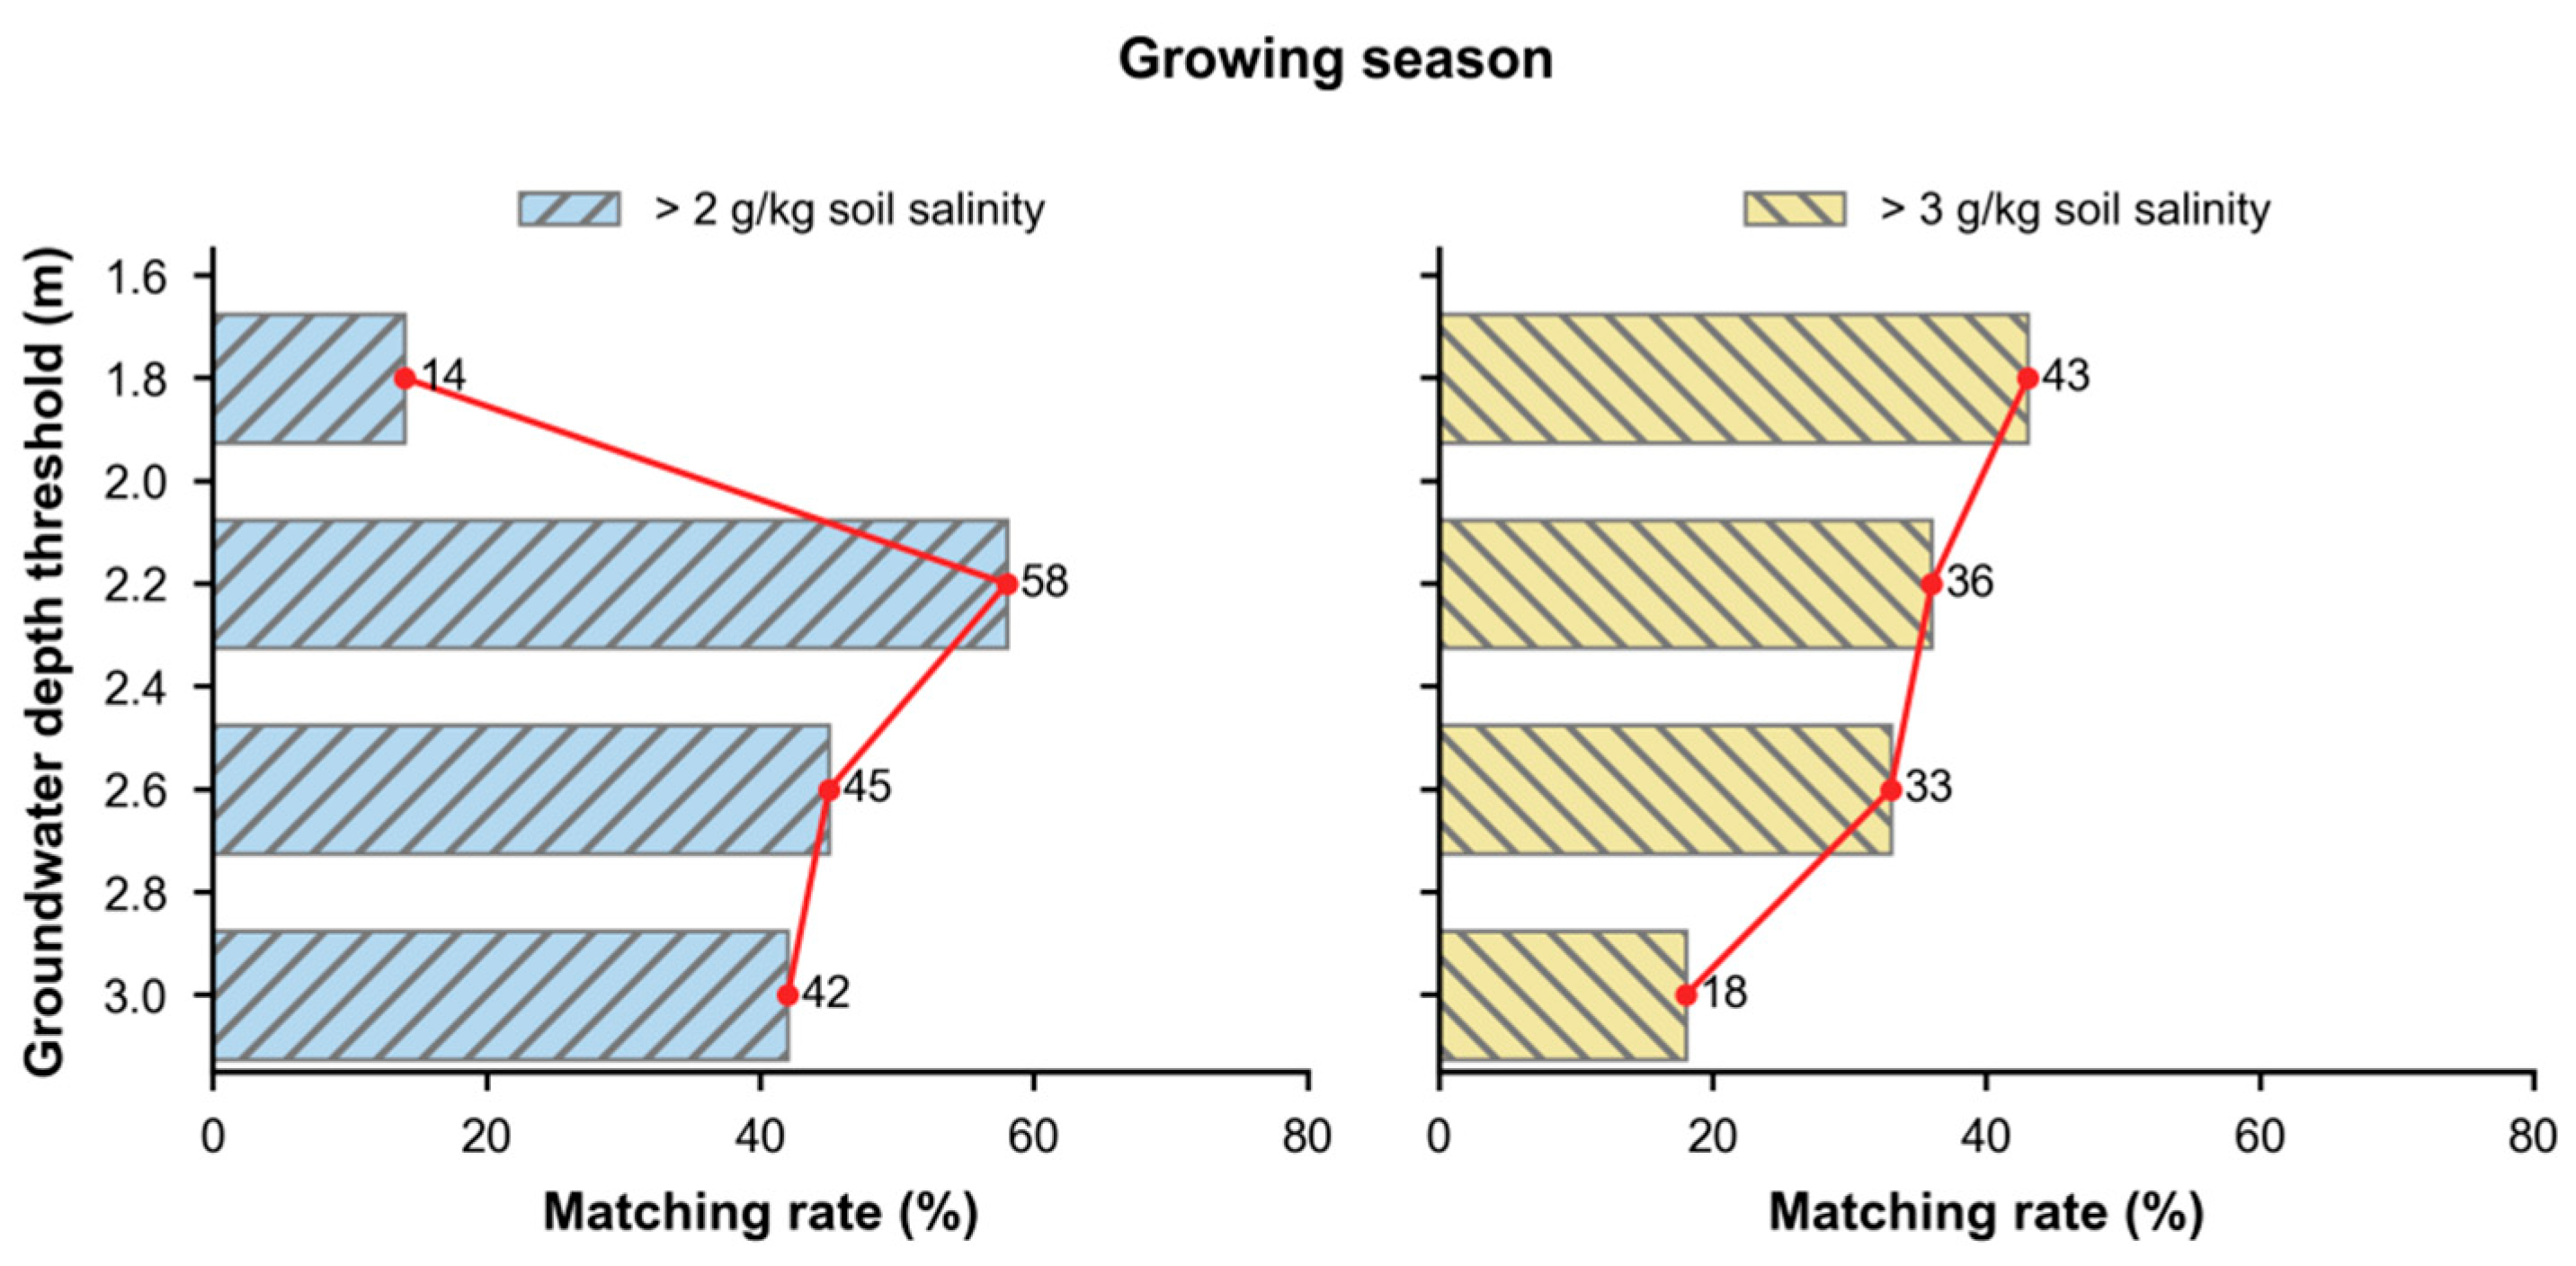
Figure 13.
Variation in soil salt content with groundwater depth in different soil layers.
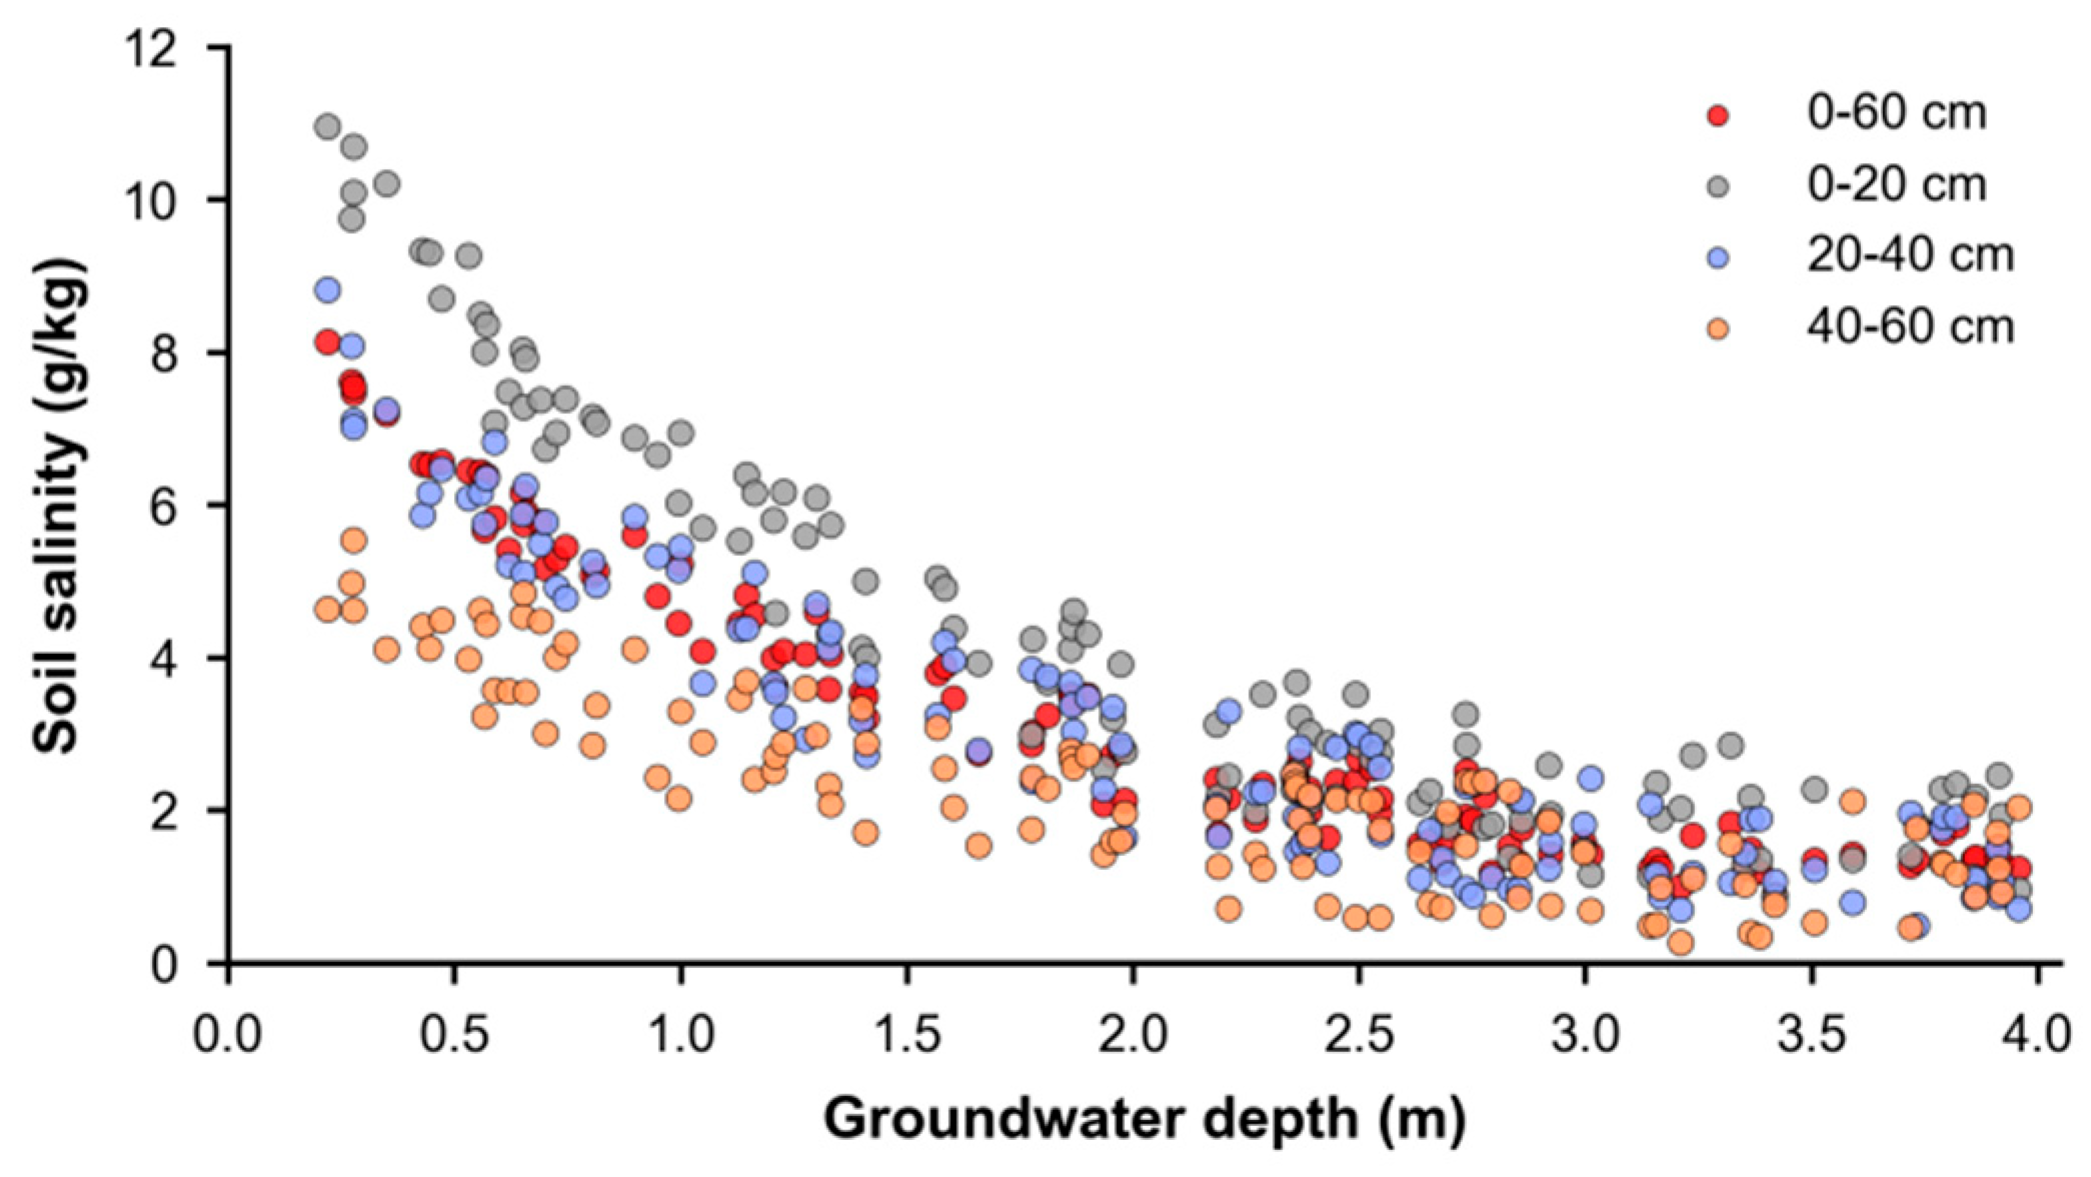
Table 1.
Statistical characteristics of groundwater depth before spring irrigation and during the growing season in 2020.
Table 1.
Statistical characteristics of groundwater depth before spring irrigation and during the growing season in 2020.
| Period | Minimum/m | Maximum/m | Mean/m | Standard deviation/m | Coefficient of variation |
| Before spring irrigation | 1.23 | 6.43 | 2.83 | 0.96 | 0.34 |
| Growing season | 0.54 | 8.56 | 2.45 | 1.26 | 0.64 |
Table 2.
Theoretical indicator variogram models for groundwater depth before spring irrigation and during the growing season in 2020.
Table 2.
Theoretical indicator variogram models for groundwater depth before spring irrigation and during the growing season in 2020.
| Period | Threshold/m | Theoretical model | Nugget (C0) | Sill | Range (A0)/km | Nugget/Sill (C0/Sill)/% |
| Before spring irrigation | 1.8 | Spherical model | 0.046 | 0.102 | 7.49 | 45.10 |
| Before spring irrigation | 2.2 | Spherical model | 0.048 | 0.092 | 7.42 | 52.17 |
| Before spring irrigation | 2.6 | Spherical model | 0.051 | 0.118 | 7.16 | 43.22 |
| Before spring irrigation | 3.0 | Spherical model | 0.057 | 0.122 | 7.10 | 46.72 |
| Growing season | 1.8 | Spherical model | 0.060 | 0.113 | 7.13 | 53.10 |
| Growing season | 2.2 | Spherical model | 0.065 | 0.123 | 7.14 | 52.85 |
| Growing season | 2.6 | Spherical model | 0.068 | 0.127 | 7.12 | 53.54 |
| Growing season | 3.0 | Spherical model | 0.075 | 0.156 | 7.44 | 48.08 |
Table 3.
Area proportions of groundwater-depth probability zones under different thresholds before spring irrigation in 2020.
Table 3.
Area proportions of groundwater-depth probability zones under different thresholds before spring irrigation in 2020.
| Threshold/m | High-probability zone | High-probability zone | Low-probability zone | Low-probability zone |
| Threshold/m | Proportion/% | Area/km2 | Proportion/% | Area/km2 |
| 1.8 | 16 | 523.52 | 84 | 2748.48 |
| 2.2 | 38 | 1243.36 | 62 | 2028.64 |
| 2.6 | 64 | 2094.08 | 36 | 1177.92 |
| 3.0 | 83 | 2715.76 | 17 | 556.24 |
Table 4.
Area proportions of groundwater-depth probability zones under different thresholds during the growing season in 2020.
Table 4.
Area proportions of groundwater-depth probability zones under different thresholds during the growing season in 2020.
| Threshold/m | High-probability zone | High-probability zone | Low-probability zone | Low-probability zone |
| Threshold/m | Proportion/% | Area/km2 | Proportion/% | Area/km2 |
| 1.8 | 14 | 458.08 | 86 | 2813.92 |
| 2.2 | 36 | 1177.92 | 64 | 2094.08 |
| 2.6 | 74 | 2421.28 | 26 | 850.72 |
| 3.0 | 82 | 2683.04 | 18 | 588.96 |
Table 5.
Statistical characteristics of soil salt content before spring irrigation and during the growing season in 2020.
Table 5.
Statistical characteristics of soil salt content before spring irrigation and during the growing season in 2020.
| Period | Minimum | Maximum | Mean | Standard deviation | Coefficient of variation |
| Period | /g kg-1 | /g kg-1 | /g kg-1 | /g kg-1 | Coefficient of variation |
| Before spring irrigation | 0.46 | 33.56 | 3.87 | 5.23 | 1.42 |
| Growing season | 0.21 | 29.40 | 3.54 | 5.82 | 1.63 |
Table 6.
Theoretical indicator variogram models for soil salt content before spring irrigation and during the growing season in 2020.
Table 6.
Theoretical indicator variogram models for soil salt content before spring irrigation and during the growing season in 2020.
| Period | Threshold/g kg-1 | Theoretical model | Nugget (C0) | Sill | Range (A0)/km | Nugget/Sill (C0/Sill)/% |
| Before spring irrigation | 2.0 | Spherical model | 0.057 | 0.093 | 7.04 | 61.29 |
| Before spring irrigation | 3.0 | Spherical model | 0.049 | 0.117 | 7.15 | 41.88 |
| Growing season | 2.0 | Spherical model | 0.048 | 0.134 | 7.11 | 35.82 |
| Growing season | 3.0 | Spherical model | 0.066 | 0.105 | 7.14 | 62.86 |
Table 7.
Area proportions of soil-salinity risk zones under different thresholds before spring irrigation in 2020.
Table 7.
Area proportions of soil-salinity risk zones under different thresholds before spring irrigation in 2020.
| Threshold/g kg-1 | High-risk zone | High-risk zone | Low-risk zone | Low-risk zone |
| Proportion/% | Area/km2 | Proportion/% | Area/km2 | |
| 2.0 | 76 | 2486.72 | 24 | 785.28 |
| 3.0 | 46 | 1505.12 | 54 | 1766.88 |
Disclaimer/Publisher’s Note: The statements, opinions and data contained in all publications are solely those of the individual author(s) and contributor(s) and not of MDPI and/or the editor(s). MDPI and/or the editor(s) disclaim responsibility for any injury to people or property resulting from any ideas, methods, instructions or products referred to in the content. |
© 2026 by the authors. Licensee MDPI, Basel, Switzerland. This article is an open access article distributed under the terms and conditions of the Creative Commons Attribution (CC BY) license (http://creativecommons.org/licenses/by/4.0/).
Copyright: This open access article is published under a Creative Commons CC BY 4.0 license, which permit the free download, distribution, and reuse, provided that the author and preprint are cited in any reuse.


