

Submitted:
15 June 2026
Posted:
17 June 2026
You are already at the latest version
Abstract
Indoor passage monitoring requires people-count estimation, behavior recognition and identity association while avoiding privacy-invasive sensing. This paper presents an identity-aware RFID sensing framework that combines wearable EPC identity tags, a wall-mounted passive tag array and distance-aware RSSI temporal modeling. Identity-tag readings and multi-channel tag-array RSSI sequences are aligned on a unified reader-timestamp timeline. An effective behavior duration (EBD) mechanism removes invalid or weak-occlusion windows before model inference. Target count, behavior state and identity association are then estimated using a three-branch LSTM constrained by physical RSSI attenuation priors. A subject-independent dataset was collected with 18 array tags and 18 volunteers across single-person, multi-person, crossing and following scenarios, yielding 11,148 EBD-valid windows. On the test set, the proposed method achieves a mean absolute error (MAE) of 0.226, a root mean square error (RMSE) of 0.357, a Macro-F1 of 0.934 and an identity-association accuracy of 0.961. Relative to threshold rules, traditional machine learning and a single-branch LSTM, the MAE is reduced by 59.5%, 46.1% and 28.9%, respectively, and the RMSE is reduced by 55.8%, 43.5% and 28.9%, respectively. The results show that native RFID identity, spatial tag-array sensing, EBD screening and distance-aware temporal modeling can jointly support low-cost, reproducible and privacy-preserving people-flow monitoring in smart-building environments.
Keywords:
RFID sensing
; identity-aware monitoring
; passive tag array
; RSSI temporal modeling
; effective behavior duration
; target-count estimation
; multi-person passage
; behavior recognition
; indoor safety
; smart buildings
1. Introduction
Indoor people-flow monitoring has become a core sensing function for smart buildings, safety management and human-centric Internet-of-Things (IoT) services [1]. Beyond binary presence detection, practical deployments often need to estimate how many people are passing, whether their trajectories are separated, crossing or following, and which registered identities are associated with the observed motion events.
Camera and millimeter-wave systems provide rich spatial information, but they typically require line-of-sight installation, non-trivial processing resources and explicit privacy governance. Passive ultra-high-frequency (UHF) RFID offers a complementary sensing route because commercial readers can acquire tag identifiers and wireless features without batteries, wearable electronics with active radios or image capture [2]. RFID technology and application studies further show that low-cost tag infrastructure is suitable for pervasive indoor identification scenarios [3]. In UHF deployments, EPC Gen2 provides the practical identification basis for reading identity tags and fixed array tags in a unified stream [4]. Early RFID localization work also shows that identity-bearing tags can support indoor location sensing, although passage monitoring requires more than static tag localization [5]. Recent surveys have further emphasized the transition from RFID identification to RFID sensing in IoT environments [6].
However, RFID-based dynamic human sensing remains challenging in indoor passages. The feasibility of RFID-based human-activity detection has been demonstrated in early RF-sensing studies [7]. Deep learning has further been introduced to RFID-based activity recognition [8]. Wearable RFID radio-pattern modeling has shown that motion states can be inferred from RSSI variation [9]. Recent UHF RFID behavior-recognition work also indicates that dynamic tag detection benefits from multi-feature temporal modeling [10]. RSSI measurements remain sensitive to multipath and body-induced attenuation, a limitation also reflected in radio tomographic imaging research [11]. Passive-tag localization and tracking studies similarly show that robust device-free sensing requires spatial diversity and data-driven modeling [12]. A single RFID link or a small number of tags therefore produces unstable features when several people pass close to each other. In addition, identity recognition and behavior recognition are often processed as loosely coupled tasks, which can cause identity switching under crossing trajectories, missed tag reads or overlapping occlusion intervals.
To address these challenges, this study develops an identity-aware RFID tag-array framework for dynamic indoor passage monitoring. The central idea is to use wearable identity tags for subject-level traceability while using a fixed passive tag array as a spatial sampling surface for RSSI disturbance observation. The system further couples EBD-based window screening, distance-mode partitioning and temporal regression so that counting, behavior recognition and identity association are optimized in the same pipeline.
The main contributions are as follows:
- 1.
- A joint identity-tag and tag-array sensing architecture is developed. Wearable passive tags provide traceable EPC identities, while the wall-mounted passive array converts single-link RSSI observation into multi-channel spatial disturbance sensing.
- 2.
- An EBD mechanism is introduced to identify valid human-occlusion windows using differential RSSI energy and active-tag ratios. This step reduces background-window imbalance and provides interpretable temporal boundaries for dynamic passage events.
- 3.
- A distance-aware parallel LSTM with RSSI attenuation priors is designed for joint target-count regression, behavior-state recognition and identity association. The model separates near-, middle- and far-field RSSI dynamics before gated fusion.
- 4.
- A Dynamic Tag-Array RSSI dataset and a subject-independent evaluation protocol are reported. The experiments include acquisition parameters, split statistics, stratified performance, ablation studies and parameter sensitivity analysis to support reproducibility and peer review.
The remainder of this paper is organized as follows. Section 2 reviews RFID-based sensing and identity-behavior association. Section 3 presents the method. Section 4 reports the experimental setup, dataset, preprocessing and results. Section 5 discusses practical implications and limitations, and Section 6 concludes the paper.
2. Related Work
Indoor human-dynamics sensing has moved from simple presence detection and aggregate counting toward integrated perception that supports identity verification, behavior recognition and traceable event reconstruction. In applications such as public safety, smart-space management and personnel mobility control, behavior features must be quantifiable, identities must be explicitly associated and dynamic processes must be temporally recoverable.
Existing indoor sensing technologies can be broadly grouped into behavior-oriented and identity-native approaches. Vision and millimeter-wave radar provide high-resolution motion and location features, but they do not naturally assign a unique identity to each individual and may introduce privacy or deployment burdens. RFID, by contrast, provides a native electronic identifier through each tag, enabling low-cost and contactless identity annotation. The remaining challenge is that RFID behavior sensing based on RSSI is sensitive to multipath interference, occlusion superposition and environmental change; therefore, RSSI alone is insufficient for robust dynamic behavior recognition unless spatial diversity and temporal modeling are carefully designed.
Recent top-tier work in mobile computing, sensor networks and ubiquitous sensing has shown that commodity RF signals can support tracking, localization and activity recognition when signal features are carefully modeled. High-precision mobile RFID-tag tracking has been reported with commercial off-the-shelf RFID devices [13]. RF signal interaction has also been used to construct air-based virtual touch interfaces [14]. Vision-assisted RFID systems have been explored to improve fine-grained multi-object identification [15]. Transformer-style temporal modeling has recently been applied to device-free human activity recognition [16]. Multimodal convolutional RFID recognition further demonstrates that feature fusion can improve human-activity recognition robustness [17]. These studies motivate the present work, but they also highlight a gap: existing systems often emphasize either high-precision RF tracking or heterogeneous modality fusion, whereas low-cost RFID-only sensing with simultaneous identity-behavior association in multi-person passage scenarios remains underdeveloped.
2.1. Advances in RFID-Based Behavior Sensing
RFID sensing exploits the obstruction, scattering and reflection effects of the human body on electromagnetic waves. These effects produce regular variations in RSSI, phase or channel-related features, which can then be used to infer activity patterns, spatial positions and target numbers.
RSSI-based sensing is the most deployable low-cost approach because it requires no phase synchronization and is supported by most commercial RFID readers. Prior work has improved RFID behavior recognition through multi-feature analysis, deep residual networks, Transformer-style temporal modeling and multimodal RSSI-phase fusion. These studies confirm the feasibility of commercial RFID sensing, but they also show that robustness depends strongly on channel diversity, scenario coverage and sample quality.
However, RSSI signals are highly sensitive to environmental multipath, non-uniform body occlusion and dynamic interference. Metallic objects, human-body absorption and tag orientation changes can produce short-term dropouts or non-monotonic fluctuations. In complex passage scenarios such as following, crossing and close-range overlap, single-tag or single-antenna RSSI schemes often experience feature aliasing, which motivates the use of spatial tag arrays and temporal models.
Phase- and CSI-based approaches provide higher signal resolution and have achieved strong performance in fine-grained tracking and gesture recognition. Nevertheless, they commonly require phase calibration, antenna-array geometry or more complex signal synchronization. They also do not automatically solve the identity-binding problem unless explicit ID observations are integrated into the sensing pipeline.
RFID identity recognition is widely used in static access-control and attendance scenarios, where each tag provides a unique EPC. Such applications usually make only a presence-or-absence decision and do not integrate continuous wireless-signal sensing with identity traceability. As a result, they cannot directly support continuous behavior sensing and real-time identity binding in dynamic multi-person passages.
2.2. Single-/Dual-Target Dynamic Detection and Tag-Array-Based Sensing
Dynamic detection of single, dual and multiple targets is a fundamental problem in RFID-based human sensing and a prerequisite for identity-behavior joint perception. Existing RFID-based multi-target detection methods can be mainly divided into two technical directions: signal separation and spatial array sensing.
In the signal separation direction, current studies mainly focus on anti-collision algorithms and blind source separation. RFID anti-collision protocols have been systematically surveyed for dense-tag reading [18]. Antenna-array signal processing has also been used to separate overlapping RFID responses [19]. However, such methods mainly focus on the correct reading of tag IDs. They do not use the spatial distribution characteristics of tag signals for dynamic behavior detection. Consequently, they cannot distinguish between the static presence of tags and dynamic human behavior, nor can they jointly estimate target number and behavior patterns.
In the spatial array sensing direction, RFID tag arrays have become an effective solution for improving dynamic detection capability. Passive RFID tag arrays have been used for device-free posture recognition in assisted-living scenarios [20]. Wall-mounted UHF RFID tags have also supported device-free indoor localization [21]. Passive-tag object tracking studies show that distributed tag responses can encode target-induced signal changes [22]. Recent transparent RFID tag-wall work further extends array-based sensing to assisted-living monitoring [23]. Transformer-based tag-free fall detection indicates that RF feature fusion is useful in safety-oriented monitoring [24]. Passive RFID array localization and activity recognition from radio images further support the value of spatial RSSI sampling [25]. A two-dimensional or wall-mounted tag array converts single-point RSSI acquisition into surface-level spatial sampling, making it possible to infer human movement, posture, location or activity from distributed attenuation patterns. Recent studies further show that AI-based tag walls can support contactless monitoring in assisted-living scenarios, but the explicit fusion of identity readings with array disturbance patterns remains underdeveloped.
Despite these advances, existing tag-array-based schemes still face three major limitations. First, they mainly focus on improving spatial resolution and do not integrate the unique ID-based identity capability of RFID tags. Therefore, they cannot bind behavioral features with individual identities, and the problem of individual discrimination remains unresolved in multi-target crossing and following scenarios. Second, fine-grained dynamic detection for single and dual targets remains insufficiently studied. Most existing methods are designed for macroscopic people-counting in high-density crowds, while their capability to capture weak signal features in low-target-number scenarios is limited. When the number of targets is three or fewer, the recognition rate can decrease significantly. Third, existing methods lack interpretable mechanisms for quantifying behavior duration and dynamic features. Most schemes can only detect target presence or estimate target number, rather than providing fine-grained characterization of behavior patterns.
2.3. Research Status of Identity–Behavior Joint Sensing
Current identity-behavior joint sensing systems mainly adopt heterogeneous fusion. Typical examples include vision-assisted RFID matching and RFID-radar fusion, where a high-resolution modality provides behavior information and RFID provides identity verification. RFID-radar data fusion has been used for enhanced contactless human-activity recognition [26]. Although these methods demonstrate the value of cross-feature fusion, they often increase deployment cost or require complex spatiotemporal calibration.
Although these methods can achieve joint sensing to some extent, they still suffer from inherent limitations, including the difficulty of spatiotemporal alignment between multimodal data, high system deployment complexity, high hardware cost and privacy risks associated with vision-based sensing. These drawbacks hinder their large-scale deployment in indoor environments.
By contrast, identity-behavior joint sensing based on a single RFID system is still at an early stage. Compared with systems that use phase tracking, vision-RFID fusion or dense RF imaging, the distinctive focus here is an RFID-only, privacy-preserving and identity-aware corridor-monitoring framework that can be deployed with commercial UHF hardware. Existing studies have not yet overcome three theoretical and technical bottlenecks.
First, identity sensing and behavior sensing remain deeply decoupled. Existing methods do not fully exploit the native unique-ID advantage of RFID to construct an integrated “spatial sampling–identity annotation” observation framework. In most cases, identity recognition is treated as a post-processing supplement to behavior recognition. This makes it difficult to continuously and accurately bind individual dynamic behaviors with unique identities, and identity mismatch can easily occur in multi-target dynamic scenarios.
Second, the inherent instability of RFID-based behavior recognition has not been systematically addressed. Existing schemes either rely on signal features from a single tag, leading to poor robustness in behavior recognition, or use tag arrays only to improve spatial resolution without incorporating the traceability of identity tags to optimize behavior feature extraction. In multi-target crossing and fast-passing scenarios, signal aliasing and behavior misclassification therefore remain common.
Third, existing studies lack interpretable behavior quantification and small-sample generalization capability. Most current methods rely on purely data-driven black-box models and can only perform behavior classification. They cannot provide interpretable and fine-grained quantification of behavior duration or dynamic features. In addition, their generalization capability is limited under environmental changes and small-sample conditions, making them prone to overfitting. Broader surveys of device-free human-activity recognition also indicate that cross-domain generalization and transferability remain persistent challenges [27].
To address these limitations, this paper proposes an RFID tag-array-based identity-behavior joint sensing method. The proposed method takes the native unique-ID identity recognition capability of RFID as its foundation and compensates for the instability of RFID-based behavior recognition through multi-channel spatial sampling using a multi-row tag array. By constructing a joint “identity tag–tag array” sensing model, the proposed method enables robust single-/dual-target detection in dynamic scenarios and realizes integrated, accurate sensing of individual identity and behavioral features.
3. Materials and Methods
The proposed method follows a reproducible pipeline consisting of joint observation, RSSI calibration, valid-window screening, distance-mode partitioning, parallel temporal modeling and fused output. Figure 1 summarizes the overall framework.
As shown in Figure 1, the system includes identity tag reading, tag-array RSSI observation, RSSI preprocessing, EBD screening, distance-mode partitioning, parallel LSTM branches and final fusion. Identity readings and array sequences are aligned on the same timeline, and the model outputs target count, identity association and behavior parameters.
The method begins with a physically interpretable RSSI attenuation model caused by human occlusion. The free-space propagation component is introduced according to the Friis transmission formula [28]. Multi-channel preprocessing and EBD recognition define stable time windows, after which a distance-aware parallel LSTM performs temporal regression and behavior classification. LSTM is selected because it is designed to model long-range temporal dependencies in sequential data [29]. Later evaluations of LSTM variants also support gated recurrent mechanisms for sequence modeling [30]. The implementation uses five independent training runs and reports mean and standard deviation in the experiments.
3.1. Task Definition and Notation
Given the tag-array observation at time t, , and the identity-tag reading set , the system outputs the number of targets , the identity association , the behavior state and the effective behavior duration . denotes the target count in the current window, binds identity tags to spatial disturbance patterns, describes passage, following or crossing, and measures the valid duration of body occlusion.
Let M be the number of tags, L the sliding-window length, the normalized RSSI sequence of the m-th tag, and its first-order difference. The subsequent modules are organized as joint observation, valid-window screening, distance-mode partitioning, parallel temporal modeling and fused output.
3.2. Identity Tag Reading and Behavior Association
Each participant wears one passive identity tag with a unique EPC identifier on the chest or waist. The reader synchronously collects identity-tag responses and fixed tag-array RSSI values. All readings are mapped to a unified timeline using reader timestamps, and short identity dropouts are compensated only within adjacent valid windows to avoid unsupported long-range identity assumptions.
At the window level, identity readings and RSSI sequences are aligned by nearest timestamps. The main disturbance trajectory, EBD and stable ID reading frequency are then combined through majority voting and temporal-continuity constraints to bind identity, spatial disturbance and behavior state. During short dropouts in crossing or following events, adjacent-window ID continuity and disturbance-center consistency are used for conservative compensation.
This design treats identity as part of the observation model rather than as a post-processing label after behavior recognition. It therefore differs from RSSI-only people counting and from static RFID identity verification.
3.3. RSSI Attenuation Mechanism
To improve the interpretability of people-count estimation, an RSSI attenuation prior is established from the physical effect of human occlusion on electromagnetic propagation. Figure 2 illustrates the mechanism.
As shown in Figure 2, the RFID reader, antenna and tag array form the basic propagation geometry. When a human body enters the antenna–tag path, additional blocking, scattering and absorption losses are introduced. Let the RSSI of the m-th tag at time t be , and let denote the unobstructed background value. The observation model is expressed as
where is the equivalent attenuation caused by human occlusion, and denotes multipath disturbance, hardware jitter and reading noise. If targets cross the RF path at time t, the q-th target has an effective occlusion cross-section , and denotes its equivalent distance to the m-th tag path. The additional attenuation can be modeled as
where is the target-related attenuation coefficient and is a distance-decay function. Considering that body occlusion weakens as distance increases, this study adopts an exponential monotonic function:
The model indicates that, under comparable body properties and relative positions, a growing number of targets increases accumulated attenuation and reduces the mean RSSI. This monotonic trend is adopted as a structural prior: the sequence model learns nonlinear temporal disturbances, while the count output should be consistent with the cumulative attenuation pattern.
3.4. Dynamic Feature Modeling Based on RSSI
3.4.1. First-Order Difference of RSSI
In the non-invasive deployment, the system infers movement state and people count only from the tag RSSI changes received by the RFID reader. When a subject passes between the antenna and the tag array, body blocking, scattering and reflection cause synchronized or local disturbance in the multi-tag RSSI sequence.
Let the RSSI observation vector obtained from M tags at time t be
where is the RSSI reading of the m-th tag. To remove tag-specific offsets and long-term environmental bias, each tag sequence is standardized as
where and are the mean and standard deviation of the m-th tag in the training or background calibration segment, and is a small constant for numerical stability. A first-order difference is then introduced to highlight rapid changes during entering, peak occlusion and leaving:
The input feature at time t is the concatenation of normalized RSSI and differential RSSI:
The energy and activation length of the first-order difference sequence provide stable boundary information for EBD estimation and temporal regression.
3.4.2. Distance-Aware Mode Partition
Because RSSI attenuation depends on relative distance, the current window is divided into near-, middle- and far-distance modes according to the estimated distance :
where and are distance thresholds calibrated in the experimental scene. This partition decomposes a non-stationary RSSI sequence into subspaces with more consistent statistics, enabling each temporal branch to learn a more stable enter-occlude-leave pattern.
3.5. Three-Modal Parallel LSTM Branches and Fusion Estimation
Let the window length be L and the input sequence ending at time t be . According to the distance-mode partition, an independent LSTM branch is constructed for each mode:
where denotes the parameters of the k-th distance-mode branch and is the final hidden state. Each branch outputs a local count estimate through a lightweight regression head:
To obtain smooth output near mode boundaries, gated fusion is used to compute the branch weights:
The final count estimate is obtained by the weighted fusion of all modal branches:
For behavior-state recognition, the hidden states of the three branches are concatenated and passed to a classification head:
where denotes the predicted probability corresponding to the passage, following, crossing and other behavioral states. This distance-partitioned, multi-branch and gated-fusion architecture learns temporal features under different attenuation levels and improves model robustness under multi-target and high-speed moving scenarios.
3.6. Tag Array and Spatial Layout Optimization
Because the system relies primarily on RSSI, tag placement directly affects the observability of occlusion disturbance. Let the coordinate of the m-th tag be and the reader coordinate be . The unobstructed distance is
Under the free-space approximation, the unobstructed RSSI in dB form is
where is the transmit power, and are the transmit and receive antenna gains, is the carrier wavelength, and denotes the background noise. When a person enters the array coverage area, the effective propagation distance changes and extra occlusion loss occurs. The RSSI disturbance of the m-th tag is approximated as
where is the equivalent path change caused by the human body, is the occlusion attenuation term, and is residual noise. Tag spacing should balance spatial resolution and channel correlation. If tags are too dense, adjacent channels become highly correlated; if they are too sparse, local occlusion patterns may be missed. In the experiments, cm is used to balance sensitivity and stability. Figure 3 illustrates the layout and signal propagation model.
As shown in Figure 3, the tag array acts as a spatial sampling plane and maps propagation disturbances caused by human passage into multi-tag RSSI fingerprints. The neural network then learns the nonlinear relationship between this disturbance matrix and target count, identity association and behavior state.
3.7. Extension to High-Density Tag Arrays
Although the prototype evaluated in this study uses an 18-tag wall-mounted array, the same observation principle can be extended to denser two-dimensional arrays, such as a 64-tag grid layout. In such a configuration, each tag provides one spatial RSSI sampling point, and the array forms a denser attenuation map when people pass through the antenna–tag propagation region. A higher tag density may improve spatial resolution for close crossing, following and compact multi-person cases, but it can also increase adjacent-channel correlation, reader scheduling overhead and calibration complexity.
For this reason, the high-density array is treated here only as an implementation extension rather than as an experimentally validated component of the proposed method. In a future 64-channel deployment, the preprocessing, EBD screening and distance-aware temporal modeling pipeline can be kept unchanged, while the input dimension is expanded from 18 array channels to 64 channels. Lightweight spatial aggregation, peak-region extraction or convolutional encoding may be added before the LSTM branches to reduce redundancy and suppress correlated channels.
The present paper therefore reports all quantitative results using the measured 18-tag platform described in Section 4.1 and Table 1. The high-density-array discussion is included only to indicate a possible route for scaling the sensing surface; its actual benefit should be verified in future cross-room and multi-reader experiments before being claimed as a tested contribution.
4. Experiments and Results
4.1. Experimental Setup
To validate the proposed identity-behavior joint sensing method, an indoor prototype platform was built using commercial UHF RFID hardware, as shown in Figure 4, Figure 5, Figure 6 and Figure 7. The setup represents a corridor-side deployment with a single reader, a single antenna, a wall-mounted tag array and participants walking through the antenna–array propagation region.
The RFID reader was placed on a low platform at one side of the room and connected to a wall-mounted directional antenna through an RF cable. The antenna center was fixed 1.35 m above the floor and pointed toward the opposite wall. Transmit power was held constant within each acquisition day and recalibrated before cross-day recording to reduce systematic drift.
On the wall facing the antenna, 18 passive UHF RFID tags were arranged as a multi-row array. The tag spacing was 25 cm in both horizontal and vertical directions, covering the main body-occlusion region from the upper leg to the chest. This spacing was selected after pilot measurements because smaller spacing increased channel correlation, whereas larger spacing missed local occlusion valleys.
Participants walked through a 0.9 m-wide marked passage between the RFID antenna and the tag array. For each trial, walking mode, participant identities, start time, end time and ground-truth count labels were recorded manually and then aligned with RFID timestamps. The labels were checked twice after acquisition to reduce annotation errors.
During data acquisition, the RFID reader continuously collected RSSI curves from all tags. Figure 7 shows representative multi-tag attenuation waveforms: RSSI decreases when a person enters the signal path, while simultaneous multi-person passage produces superposed fluctuations and multiple valley structures.
4.2. Dataset Construction
Based on the experimental platform, a Dynamic Tag-Array RSSI dataset was constructed for people-count estimation, passage-pattern recognition and identity-behavior association. The final dataset contains 18 volunteers, 888 raw sequence segments and 11,148 valid windows after EBD filtering. Each raw segment lasts 12–20 s and records timestamp, EPC, RSSI, antenna port, tag coordinates and scenario labels.
To improve representativeness and include realistic sensing noise, data were collected under controlled but varied conditions:
- Number of people: no-person baseline, one, two and three persons.
- Walking speed: slow (0.55–0.75 m/s), normal (0.90–1.15 m/s) and fast (1.30–1.60 m/s).
- Passage pattern: parallel or separated passage, close-range crossing, following and opposite-direction passage.
- Participant variation: height 1.58–1.84 m and mixed body sizes; each participant appears in only one of the training, validation or test splits.
For each trial, participants walked through the path between the RFID antenna and the tag array while the reader continuously sampled all visible tags. Identity tags and array tags were recorded in the same reader stream, allowing the raw EPC records to be separated into identity observations and spatial-array observations during preprocessing. Figure 8 presents an example of the collected RFID tag-array RSSI dataset.
4.3. Preprocessing and Sequence Enhancement
Because RSSI sequences contain spike noise, baseline drift, missed reads and environmental sensitivity, the preprocessing pipeline included moving-average smoothing, local outlier correction, tag-wise normalization, first-order difference enhancement, sliding-window slicing and EBD filtering. The parameters used in the reported experiments are listed in Table 1 and Table 2.
4.3.1. Filtering and Outlier Correction
Raw RSSI sequences often contain short-term spike noise. A moving-average filter with length w was first applied:
where w is the smoothing window length and is set to five samples in the main experiments. A rule was then used for outlier correction:
where and are the background mean and standard deviation of the m-th tag, and is the local median replacement window length. This step suppresses high-frequency abnormal readings caused by transient reflection and environmental interference.
4.3.2. Dynamic Difference Enhancement
To highlight RSSI changes induced by human movement, a first-order difference was introduced as the dynamic enhancement feature:
The differential sequence strengthens the boundaries of entering, maximum occlusion and leaving, making it easier for the model to learn the temporal structure of the occlusion process. The final model input contains both the preprocessed RSSI sequence and its first-order difference.
4.3.3. Normalization
To reduce amplitude differences across tags and acquisition rounds, the filtered RSSI sequence was standardized as
The difference sequence was then calculated from the normalized sequence:
where is a small constant for numerical stability. Normalization improves cross-tag, cross-round and cross-subject generalization. Figure 9, Figure 10, Figure 11 and Figure 12 illustrate the changes in the RSSI sequence after smoothing, normalization and first-order differencing.
Figure 9, Figure 10, Figure 11 and Figure 12 show that moving-average smoothing suppresses spike noise, normalization unifies the amplitude scale across tags and trials, and the first-order difference highlights the dynamic boundaries of entering, peak occlusion and leaving. This preprocessing provides stable input for sliding-window slicing, EBD screening and LSTM temporal modeling.
4.3.4. Temporal Windowing
To match the LSTM input structure and cover a complete body-occlusion process, the continuous RSSI sequence was sliced into fixed-length windows. The n-th window is defined as
where L is the window length and is the start time of the n-th window. The main model used and a step size of 32, corresponding to 50% overlap. This setting covers approximately 1.8 s of RSSI evolution at the average measured read rate and generally includes the enter-occlude-leave process. The window-level input remains
This setting increases the number of valid samples. To avoid excessive background segments, EBD screening was applied after window slicing.
4.3.5. Effective Behavior Duration
In multi-person dynamic passage scenarios, continuous RSSI sampling contains background fluctuations, static segments and short-term spikes. If all windows are sent to the temporal network, background noise can dilute the sample distribution and cause unstable people-count inference. Therefore, an EBD mechanism is introduced after sliding-window slicing to keep only windows containing valid human occlusion behavior.
Let be the n-th window with length L and M tags. The window-level behavior energy is defined as
This energy measures the overall signal variation within the window. To avoid confusing transient peaks with valid behavior, a time-level activation function is further defined:
where is the differential activation threshold and is the active-tag-ratio threshold. The effective behavior duration and effective ratio of the window are defined as
where is the sampling interval. A window is regarded as valid only when it satisfies
Otherwise, the window is removed during training; during inference, the output is set to zero or the state update is suppressed. The mechanism improves sample quality during training and stabilizes no-person or static periods during inference.
4.4. Evaluation Metrics
The method was evaluated from four aspects: people-count estimation, identity association, behavior recognition and duration quantification. For count regression, mean absolute error (MAE) and root mean square error (RMSE) were used. For discrete count and behavior classes, accuracy, Macro-F1, precision and recall were calculated. Identity-behavior association was evaluated by ID association accuracy, and behavior-duration boundary quality was evaluated by window-level intersection over union (IoU) when temporal boundaries were available. All neural-network results are reported as mean ± standard deviation over five training runs.
Results are reported as overall averages and stratified by target number, speed, passage mode and distance mode. This reporting strategy is intended to make failure modes visible instead of relying only on one global accuracy value.
4.5. Comparative Experiments and Baselines
Five baselines were used to evaluate the contribution of the proposed method: (1) a raw RSSI threshold-rule method; (2) a traditional machine-learning baseline using RSSI and differential statistics; (3) a data-driven LSTM without the physical prior or EBD; (4) a single-branch LSTM using the same input features; and (5) the full proposed model. Figure 13 and Figure 14 visualize the error metrics and recognition/association metrics, and Table 4 reports the numerical results.
Figure 13 and Figure 14 show that the proposed method obtains the lowest MAE and RMSE and the highest Macro-F1 and ID-association accuracy. Compared with the single-branch LSTM, the largest gain appears in close crossing and following cases, indicating that distance-mode partitioning and gated fusion reduce the ambiguity caused by overlapping RSSI valleys. Compared with threshold and traditional machine-learning baselines, the improvement mainly comes from temporal modeling and EBD screening, which prevent short background spikes from being interpreted as valid human passage.
4.6. Ablation Experiments and Parameter Sensitivity
Ablation experiments were conducted to clarify the contribution of difference features, EBD screening, distance-mode partitioning, physical attenuation priors and the parallel LSTM structure. Figure 15 visualizes the ablation results, Figure 16 shows sensitivity to the sliding-window length L, and Table 5, Table 6 and Table 7 report the concrete numerical values used for the analysis.
The complete model achieves the lowest MAE and RMSE. Removing EBD causes the largest degradation because background and transition windows become mixed with true occlusion windows. Removing distance-mode partitioning also reduces performance, indicating that a single global branch cannot fully absorb the distance-dependent non-stationarity of RSSI attenuation. The physical prior provides an additional constraint that stabilizes count regression when RSSI valleys overlap.
As shown in Figure 16 and Table 6, the error decreases when the window length increases from 32 to 64 because a longer window better covers the enter-occlude-leave process. When the window length increases to 80 or 96, the error rises because more background samples are included and the effective behavior boundary becomes less distinct.
4.7. Robustness, Generalization and Stratified Performance
To evaluate robustness, the test set was further divided by movement pattern, speed and approximate distance mode. Table 7 reports representative stratified results. The model performs best in single-person and separated two-person cases, while the highest errors occur in close two-person crossing, fast walking and compact three-person passage. These cases produce overlapping RSSI valleys and short identity-tag read gaps.
Qualitative inspection of time-aligned count curves and RSSI heat maps indicates that EBD screening suppresses background fluctuations before and after the passage event, while gated fusion helps avoid abrupt count changes near distance-mode boundaries. The remaining failure cases are mainly caused by three factors: missed identity-tag reads lasting longer than two windows, near-synchronous crossing in the center of the array and strong multipath caused by large metallic objects near the walking path.
5. Discussion
The experimental results indicate that the performance gain is produced by the combination of sensing architecture, signal screening and temporal modeling rather than by a single isolated component. Identity tags reduce ambiguity in subject association, the tag array increases spatial observability, EBD improves the quality of training and inference windows, and distance-aware branches reduce the non-stationarity caused by propagation distance. This combination strengthens the paper from both an electronic-sensing perspective and a deployable smart-building systems perspective.
Compared with vision- or radar-assisted systems, the proposed solution is less intrusive and easier to deploy in privacy-sensitive indoor spaces. The prototype nevertheless has clear limitations. It uses a single antenna, the main dataset was collected in one room, and the maximum tested target number was three. Therefore, the reported results should be interpreted as evidence for corridor-style passage monitoring rather than as a complete solution for dense crowds. Future experiments should include multiple rooms, longer cross-day evaluation, different furniture layouts, public or semi-public benchmarks and stress tests with more severe multipath.
Before formal submission, the authors should complete the ethics approval or exemption statement, exact consent wording and de-identified data-sharing plan using real institutional information. These items should not be inferred or fabricated, because they directly affect compliance and editorial screening.
6. Conclusions and Future Work
This paper presented an identity-aware RFID tag-array framework for indoor dynamic passage monitoring. By combining wearable identity tags, a wall-mounted passive tag array, EBD-based valid-window screening, distance-mode partitioning and parallel LSTM temporal modeling, the method jointly estimates target count, behavior state and identity association from low-cost UHF RFID observations.
The experimental evaluation used 888 raw sequence segments and 11,148 valid windows collected under subject-independent splits. The proposed method achieved a test MAE of 0.226, RMSE of 0.357, Macro-F1 of 0.934 and ID-association accuracy of 0.961. Compared with threshold rules, traditional machine learning and single-branch LSTM baselines, the method substantially reduced count-estimation error and improved identity-behavior association, especially in crossing and following scenarios. Future work will extend the platform to multi-reader collaboration, cross-room deployment, higher-density tag arrays and public release of de-identified benchmark data where ethics and privacy constraints permit.
Author Contributions
Conceptualization, Z.W.; methodology, Z.W. and X.L.; software, X.L.; validation, X.L. and Z.W.; formal analysis, X.L.; investigation, X.L. and J.S.; resources, J.S.; data curation, X.L.; writing—original draft preparation, X.L.; writing—review and editing, Z.W.; visualization, J.S.; supervision, Z.W.; project administration, Z.W. All authors have read and agreed to the published version of the manuscript.
Funding
Manuscript received 11 Feb 2026. The research work was supported in part by the 2023 Basic Research Program of Yunnan Province (Grant No.202301AT070388); in part by Yunnan Fundamental Research Projects (Grant NO. 202501AT070299). We would like to express our sincere gratitude to our supervisor for his invaluable guidance, advice, and support throughout the research process.
Data Availability Statement
Data Availability Statement: Data are contained within the article.
Conflicts of Interest
The authors declare no conflicts of interest.
Abbreviations
The following abbreviations are used in this manuscript:
| EBD | Effective behavior duration |
| EPC | Electronic Product Code |
| IoT | Internet of Things |
| LSTM | Long short-term memory |
| MAE | Mean absolute error |
| RFID | Radio-frequency identification |
| RMSE | Root mean square error |
| RSSI | Received signal strength indicator |
| UHF | Ultra-high frequency |
References
- Atzori, L.; Iera, A.; Morabito, G. The Internet of Things: A survey. Comput. Netw. 2010, 54, 2787–2805. [Google Scholar] [CrossRef]
- Want, R. An Introduction to RFID Technology. IEEE Pervasive Comput. 2006, 5, 25–33. [Google Scholar] [CrossRef]
- Nath, B.; Reynolds, F.; Want, R. RFID Technology and Applications. IEEE Pervasive Comput. 2006, 5, 22–24. [Google Scholar] [CrossRef]
- GS1. EPC Radio-Frequency Identity Protocols Generation-2 UHF RFID Standard, Version 2.1.0. Available online: https://ref.gs1.org/standards/gen2/2.1.0/ (accessed on 8 June 2026).
- Ni, L.M.; Liu, Y.; Lau, Y.C.; Patil, A.P. LANDMARC: Indoor Location Sensing Using Active RFID. Wirel. Netw. 2004, 10, 701–710. [Google Scholar] [CrossRef]
- Duroc, Y. From Identification to Sensing: RFID Is One of the Key Technologies in the IoT Field. Sensors 2022, 22, 7523. [Google Scholar] [CrossRef] [PubMed]
- Smith, J.R.; Fishkin, K.P.; Jiang, B.; Mamishev, A.; Philipose, M.; Rea, A.D.; Roy, S.; Sundara-Rajan, K. RFID-Based Techniques for Human-Activity Detection. Commun. ACM 2005, 48, 39–44. [Google Scholar] [CrossRef]
- Li, X.; Zhang, Y.; Marsic, I.; Sarcevic, A.; Burd, R.S. Deep Learning for RFID-Based Activity Recognition. In Proceedings of the 14th ACM Conference on Embedded Networked Sensor Systems (SenSys ’16), Stanford, CA, USA, 14–16 November 2016; pp. 164–175. [Google Scholar] [CrossRef] [PubMed]
- Wang, L.; Gu, T.; Tao, X.; Lu, J. Toward a Wearable RFID System for Real-Time Activity Recognition Using Radio Patterns. IEEE Trans. Mob. Comput. 2017, 16, 228–242. [Google Scholar] [CrossRef]
- Wang, H.; Liu, X.; Liu, L.; Qin, B.; Pan, R.; Pang, S. UHF RFID Sensing for Dynamic Tag Detection and Behavior Recognition: A Multi-Feature Analysis and Dual-Path Residual Network Approach. Sensors 2025, 25, 5540. [Google Scholar] [CrossRef] [PubMed]
- Wilson, J.; Patwari, N. Radio Tomographic Imaging with Wireless Networks. IEEE Trans. Mob. Comput. 2010, 9, 621–632. [Google Scholar] [CrossRef]
- Ruan, W.; Sheng, Q.Z.; Yao, L.; Li, X.; Falkner, N.J.G.; Yang, L. Device-Free Human Localization and Tracking with UHF Passive RFID Tags: A Data-Driven Approach. J. Netw. Comput. Appl. 2018, 104, 78–96. [Google Scholar] [CrossRef]
- Yang, L.; Chen, Y.; Li, X.-Y.; Xiao, C.; Li, M.; Liu, Y. Tagoram: Real-Time Tracking of Mobile RFID Tags to High Precision Using COTS Devices. In Proceedings of the 20th Annual International Conference on Mobile Computing and Networking, Maui, HI, USA, 7–11 September 2014; pp. 237–248. [Google Scholar] [CrossRef]
- Wang, J.; Vasisht, D.; Katabi, D. RF-IDraw: Virtual Touch Screen in the Air Using RF Signals. In Proceedings of the 2014 ACM Conference on SIGCOMM, Chicago, IL, USA, 17–22 August 2014; pp. 235–246. [Google Scholar] [CrossRef]
- Yin, J.; Yang, Z.; Liao, S.; Duan, C.; Ding, X.; Zhang, L. TagFocus: Towards Fine-Grained Multi-Object Identification in RFID-Based Systems with Visual Aids. ACM Trans. Sens. Netw. 2023, 19, 9. [Google Scholar] [CrossRef]
- Liu, Y.; Huang, W.; Jiang, S.; Zhao, B.; Wang, S.; Wang, S.; Zhang, Y. TransTM: A Device-Free Method Based on Time-Streaming Multiscale Transformer for Human Activity Recognition. Def. Technol. 2024, 32, 619–628. [Google Scholar] [CrossRef]
- Golipoor, S.; Sigg, S. RFID-Based Human Activity Recognition Using Multimodal Convolutional Neural Networks. In Proceedings of the 2024 IEEE 29th International Conference on Emerging Technologies and Factory Automation (ETFA), Padua, Italy, 10–13 September 2024. [Google Scholar] [CrossRef]
- Klair, D.K.; Chin, K.-W.; Raad, R. A Survey and Tutorial of RFID Anti-Collision Protocols. IEEE Commun. Surv. Tutor. 2010, 12, 400–421. [Google Scholar] [CrossRef]
- Mindikoglu, A.F.; van der Veen, A.-J. Separation of Overlapping RFID Signals by Antenna Arrays. In Proceedings of the IEEE International Conference on Acoustics, Speech and Signal Processing, Las Vegas, NV, USA, 31 March–4 April 2008; pp. 2737–2740. [Google Scholar] [CrossRef]
- Yao, L.; Sheng, Q.Z.; Ruan, W.; Gu, T.; Li, X.; Falkner, N.J.G.; Yang, Z. RF-Care: Device-Free Posture Recognition for Elderly People Using a Passive RFID Tag Array. EAI Endorsed Trans. Ambient Syst. 2015, 2, e2. [Google Scholar] [CrossRef]
- Ma, L.; Liu, M.; Wang, H.; Yang, Y.; Wang, N.; Zhang, Y. WallSense: Device-Free Indoor Localization Using Wall-Mounted UHF RFID Tags. Sensors 2019, 19, 68. [Google Scholar] [CrossRef] [PubMed]
- Han, J.; Qian, C.; Wang, X.; Ma, D.; Zhao, J.; Xi, W.; Jiang, Z.; Wang, Z. Twins: Device-Free Object Tracking Using Passive Tags. IEEE/ACM Trans. Netw. 2016, 24, 1605–1617. [Google Scholar] [CrossRef]
- Khan, M.Z.; Usman, M.; Tahir, A.; Farooq, M.; Qayyum, A.; Ahmad, J.; Abbas, H.; Imran, M.; Abbasi, Q.H. Transparent RFID Tag Wall Enabled by Artificial Intelligence for Assisted Living. Sci. Rep. 2024, 14, 18896. [Google Scholar] [CrossRef] [PubMed]
- Khan, M.Z.; Usman, M.; Ahmad, J.; Rahman, M.M.U.; Abbas, H.; Imran, M.; Abbasi, Q.H. Tag-Free Indoor Fall Detection Using Transformer Network Encoder and Data Fusion. Sci. Rep. 2024, 14, 16763. [Google Scholar] [CrossRef] [PubMed]
- Zhu, S.; Lv, H.; Huang, W. RF-AcSense: Device-Free Activity Localization and Recognition via Passive RFID Tag Array. In Proceedings of the 2024 IEEE 49th Conference on Local Computer Networks (LCN), Caen, France, 8–10 October 2024; pp. 1–9. [Google Scholar] [CrossRef]
- Khan, M.Z.; Taylor, W.; Usman, M.; Ahmad, J.; Ramzan, N.; Khawaja, B.A.; Vallappil, A.K.; Imran, M.; Abbasi, Q.H. RFiDAR: Contactless RFID and Radar Data Fusion for Enhanced Human Activity Recognition. IEEE Internet Things Mag. 2025, 8, 60–69. [Google Scholar] [CrossRef]
- Yang, J.; Xu, Y.; Cao, H.; Zou, H.; Xie, L. Deep Learning and Transfer Learning for Device-Free Human Activity Recognition: A Survey. J. Autom. Intell. 2022, 1, 100007. [Google Scholar] [CrossRef]
- Friis, H.T. A Note on a Simple Transmission Formula. Proc. IRE 1946, 34, 254–256. [Google Scholar] [CrossRef]
- Hochreiter, S.; Schmidhuber, J. Long Short-Term Memory. Neural Comput. 1997, 9, 1735–1780. [Google Scholar] [CrossRef] [PubMed]
- Greff, K.; Srivastava, R.K.; Koutnik, J.; Steunebrink, B.R.; Schmidhuber, J. LSTM: A Search Space Odyssey. IEEE Trans. Neural Netw. Learn. Syst. 2017, 28, 2222–2232. [Google Scholar] [CrossRef] [PubMed]
Figure 1.
General framework diagram of the proposed RFID tag-array identity-aware passage-monitoring method.
Figure 1.
General framework diagram of the proposed RFID tag-array identity-aware passage-monitoring method.
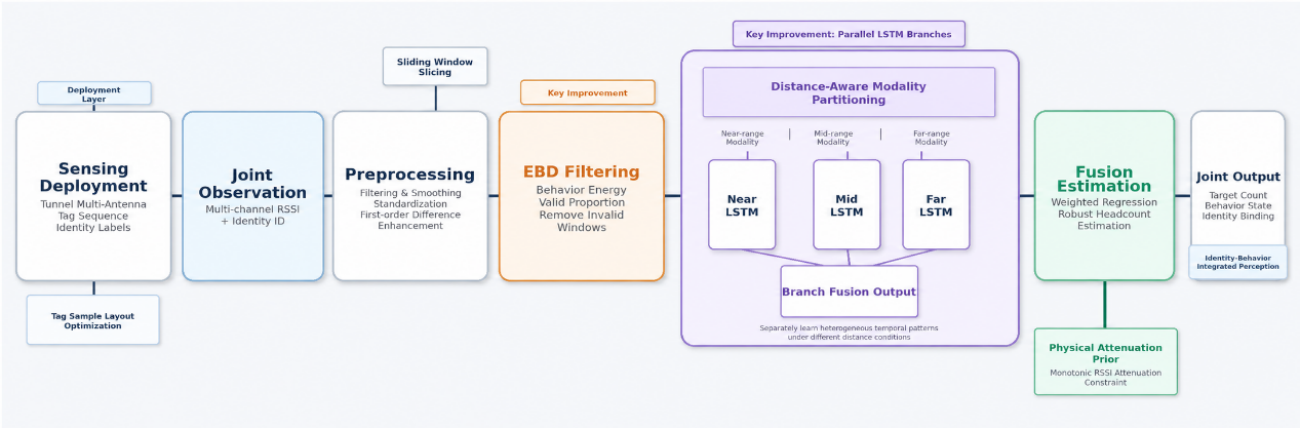
Figure 2.
RSSI attenuation physical model and human-occlusion mechanism schematic.
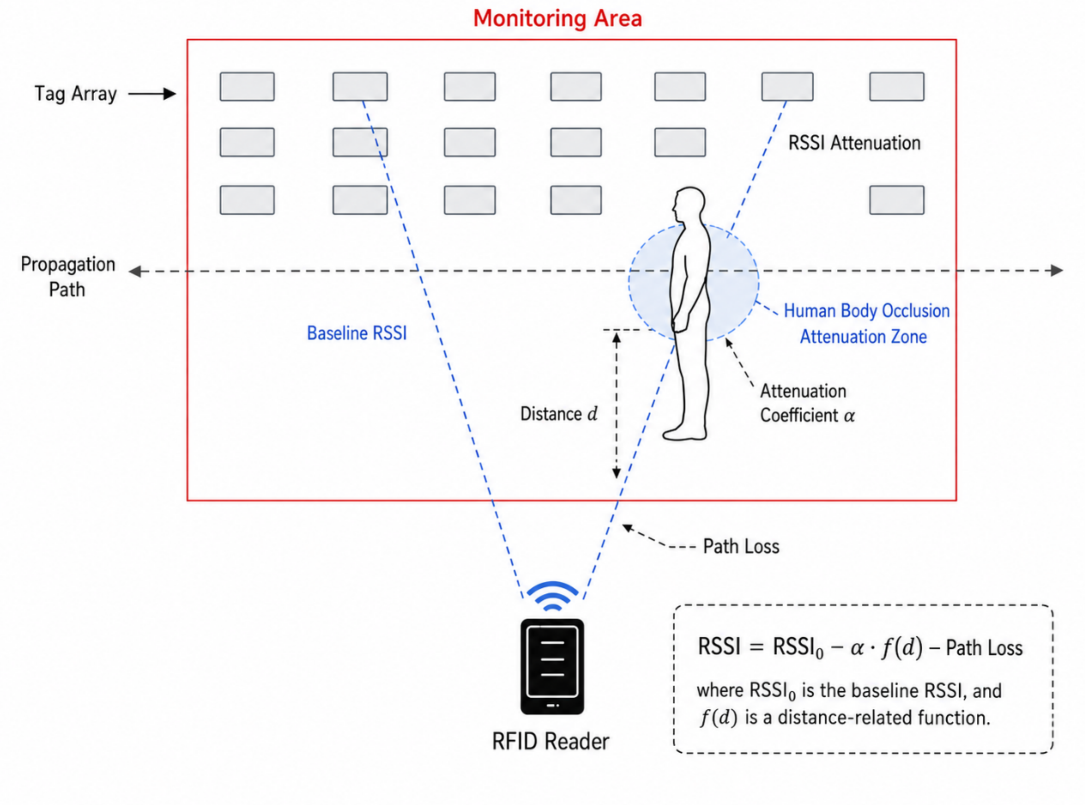
Figure 3.
Tag-array layout and signal-propagation model schematic.
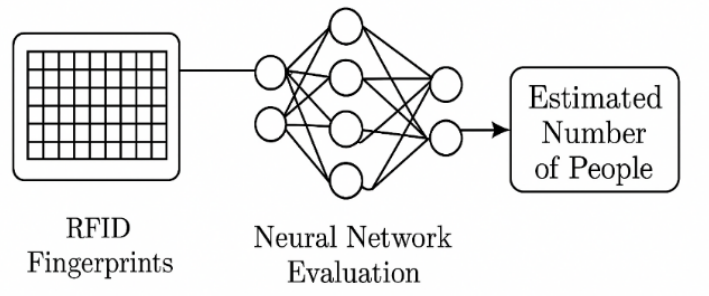
Figure 4.
Experimental platform for single-person passage.
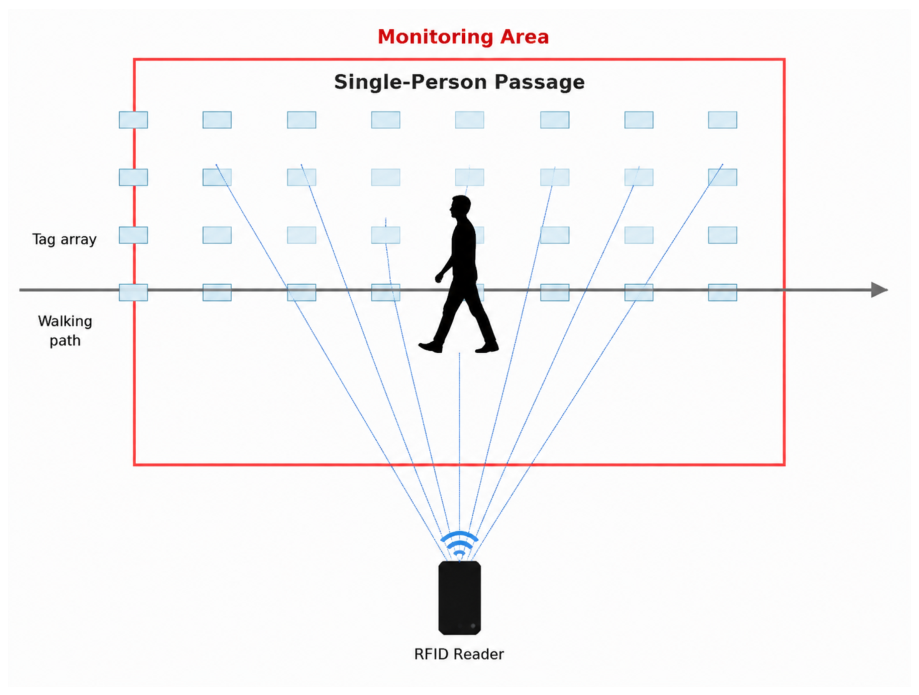
Figure 5.
Experimental platform for separated two-person passage.
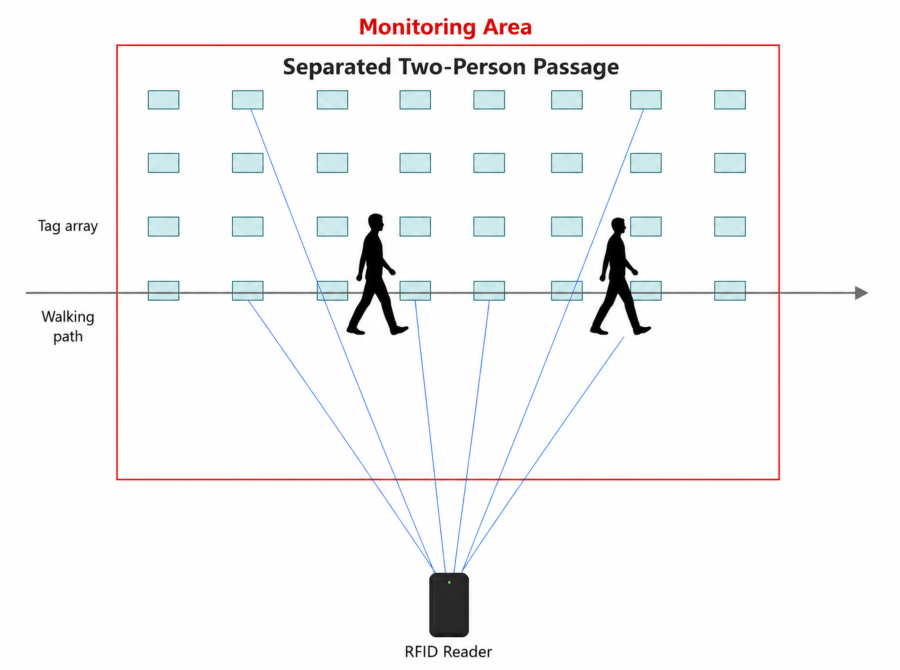
Figure 6.
Experimental platform for overlapped two-person passage.
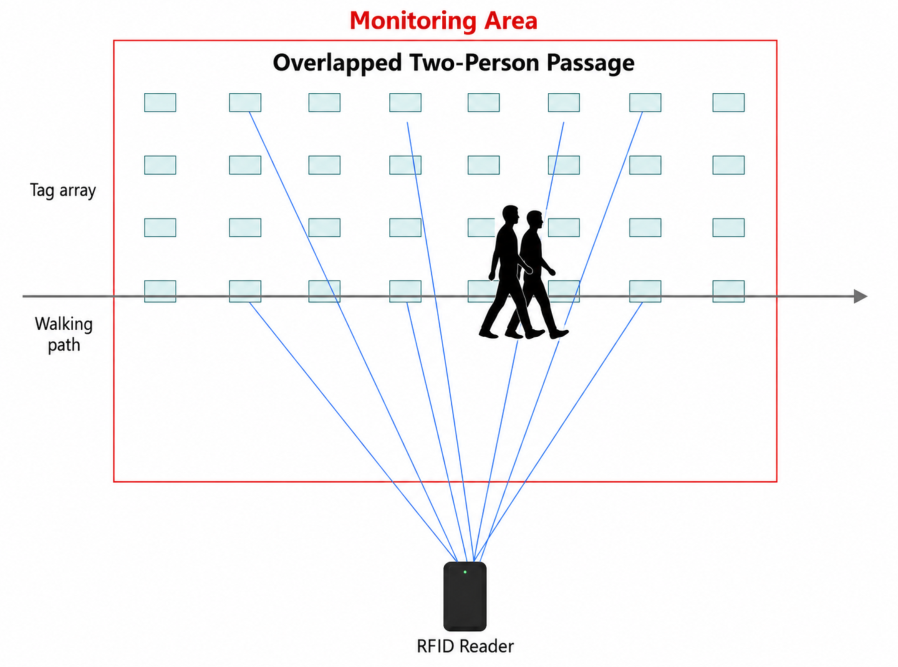
Figure 7.
Representative multi-tag RSSI blocking waveforms.
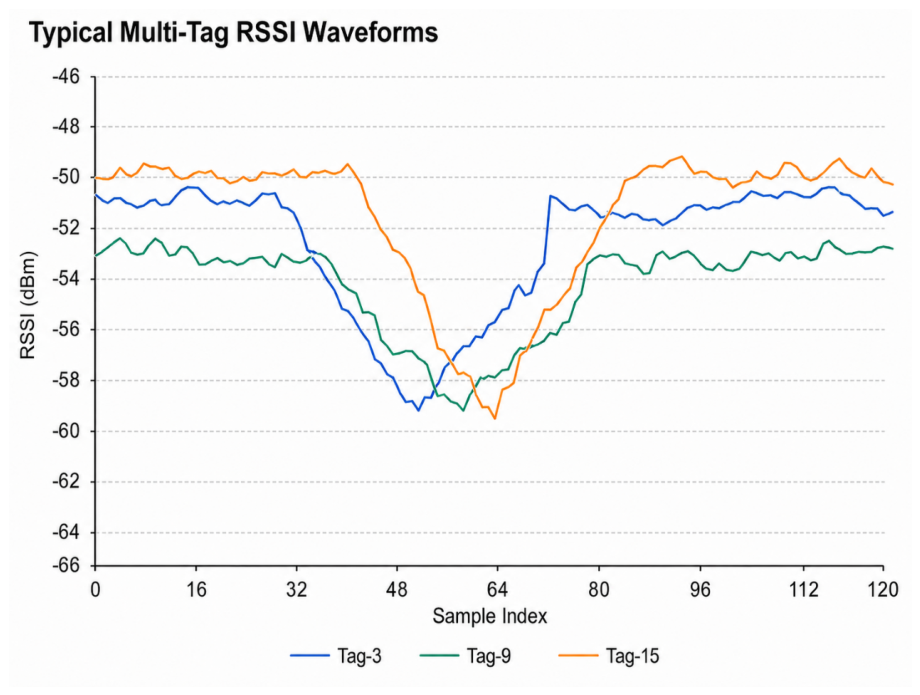
Figure 8.
Example of the collected RFID tag-array RSSI dataset. The table records RFID tag ID, RSSI value, tag-array coordinates (loc.x and loc.y), and the corresponding spatial-position label used for preprocessing and temporal modeling.
Figure 8.
Example of the collected RFID tag-array RSSI dataset. The table records RFID tag ID, RSSI value, tag-array coordinates (loc.x and loc.y), and the corresponding spatial-position label used for preprocessing and temporal modeling.
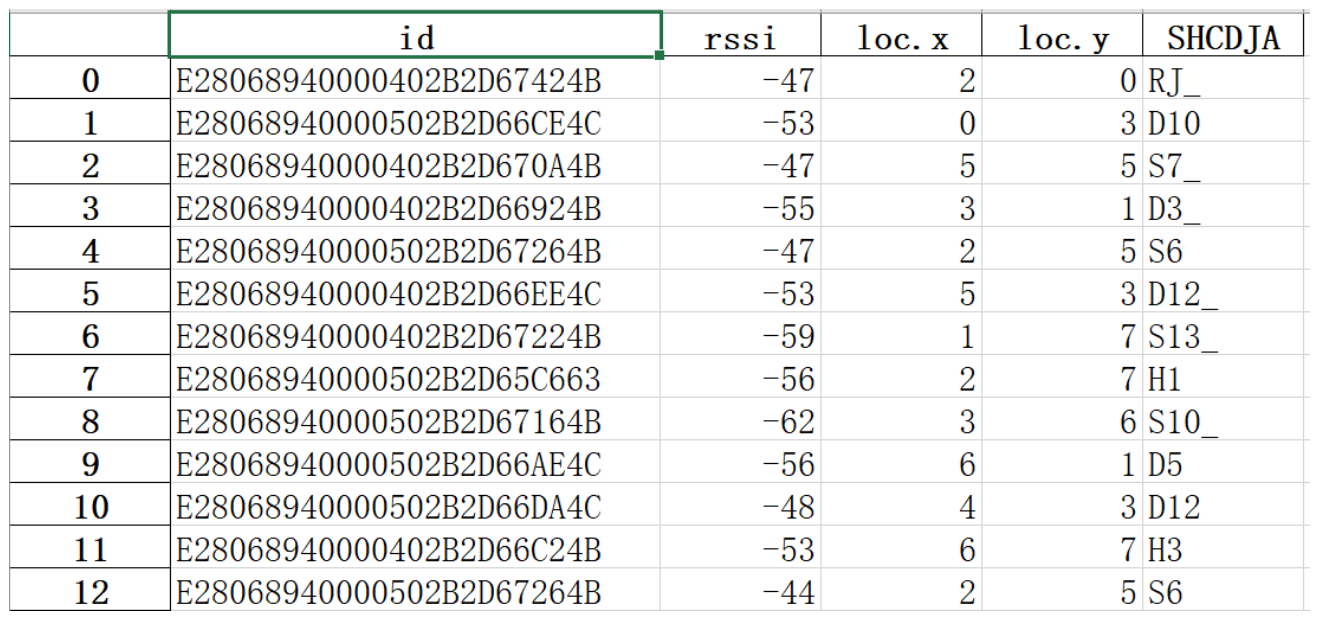
Figure 9.
Raw RSSI sequence.
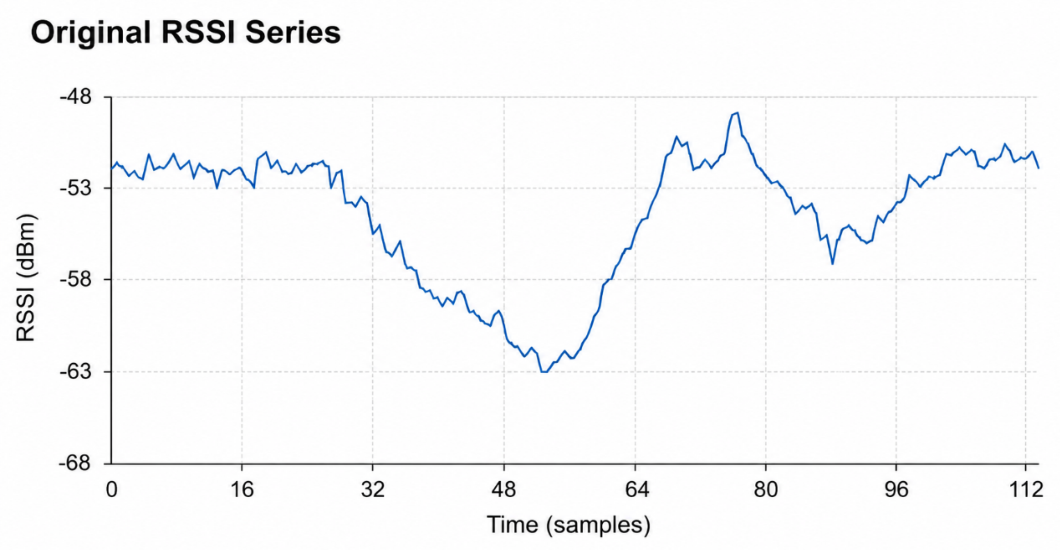
Figure 10.
Normalized RSSI sequence.
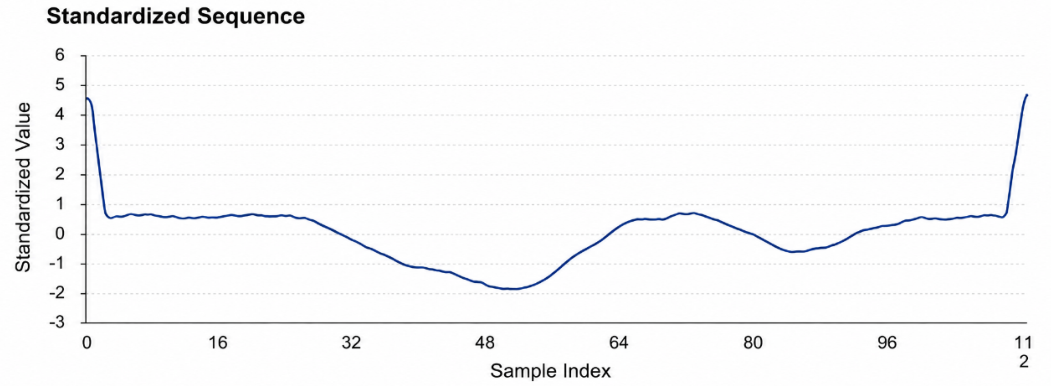
Figure 11.
Smoothed RSSI sequence.
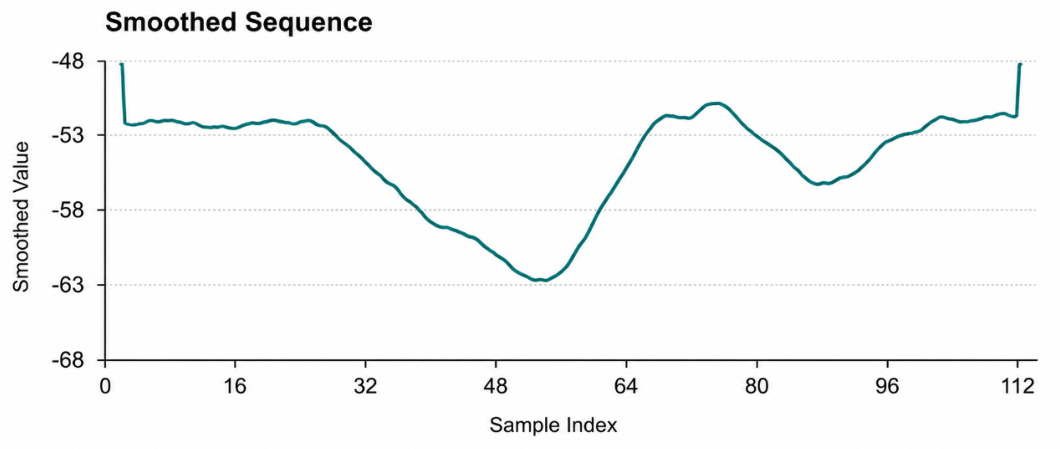
Figure 12.
First-order difference RSSI sequence.
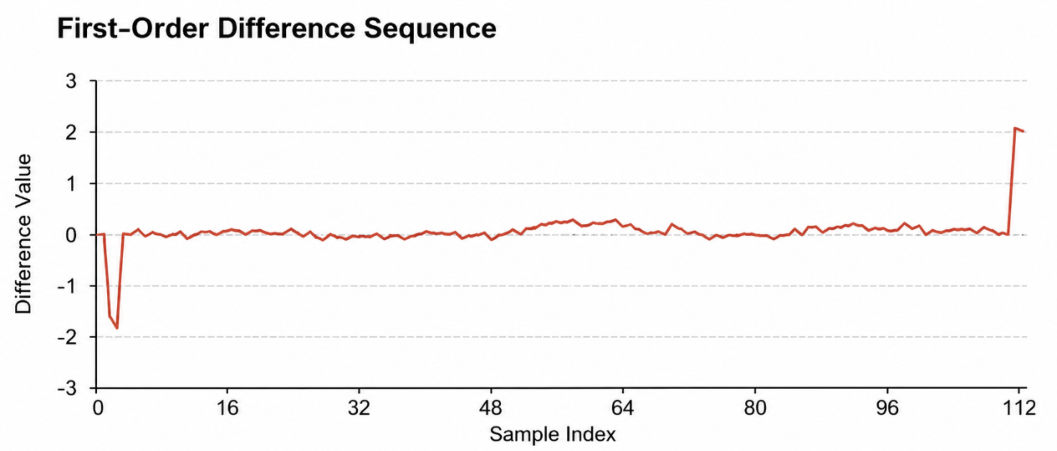
Figure 13.
Error metrics of compared methods.
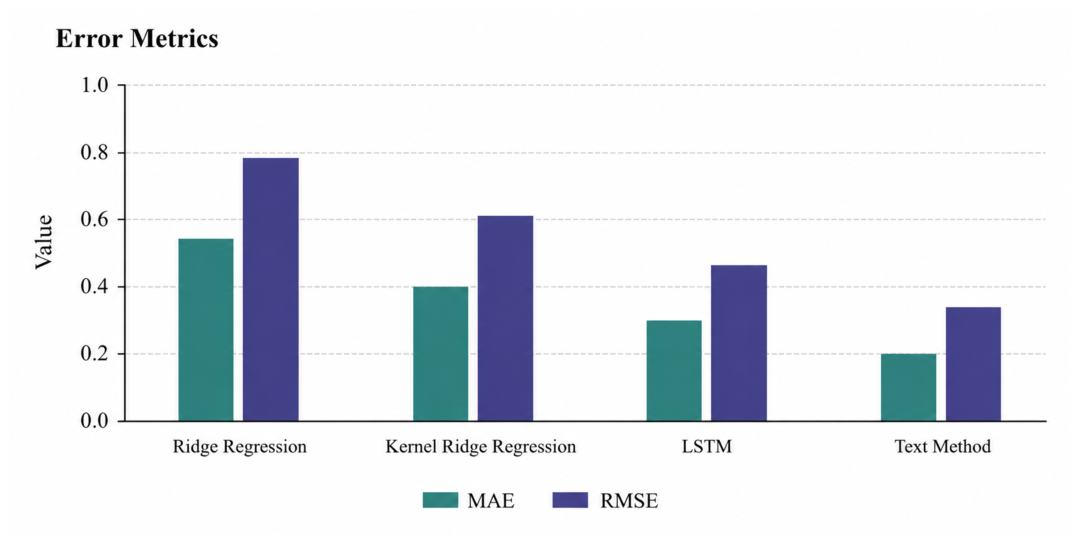
Figure 14.
Recognition and identity-association metrics.
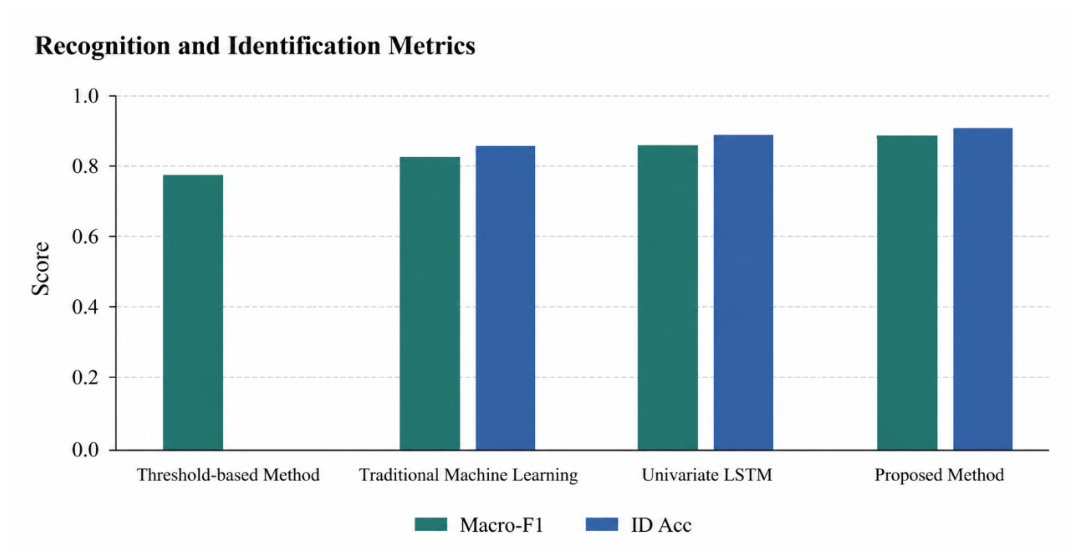
Figure 15.
Ablation study results.
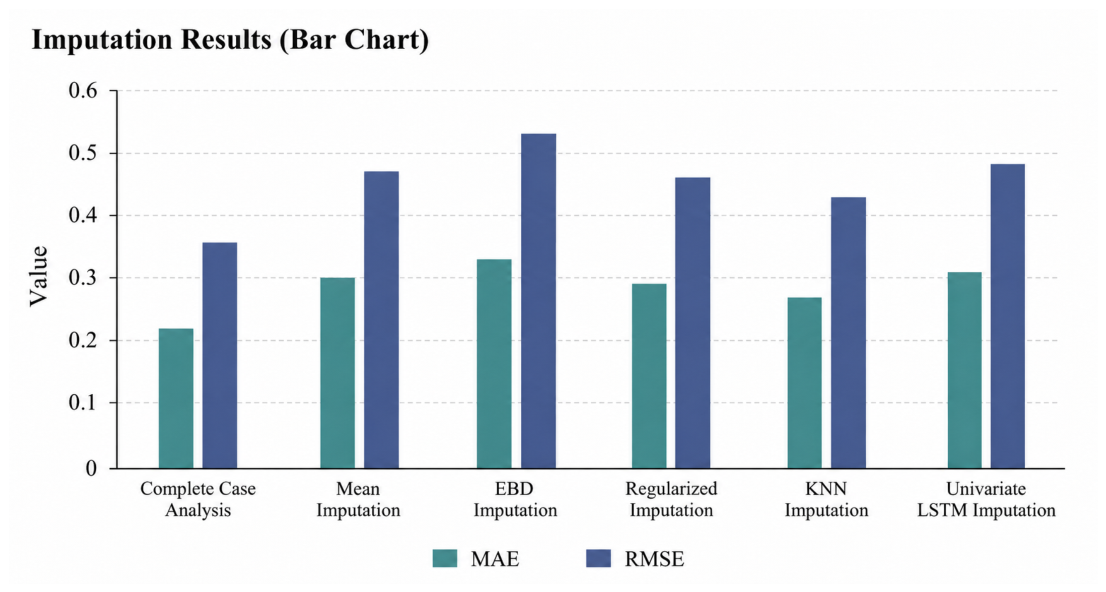
Figure 16.
Sensitivity to sliding-window length.
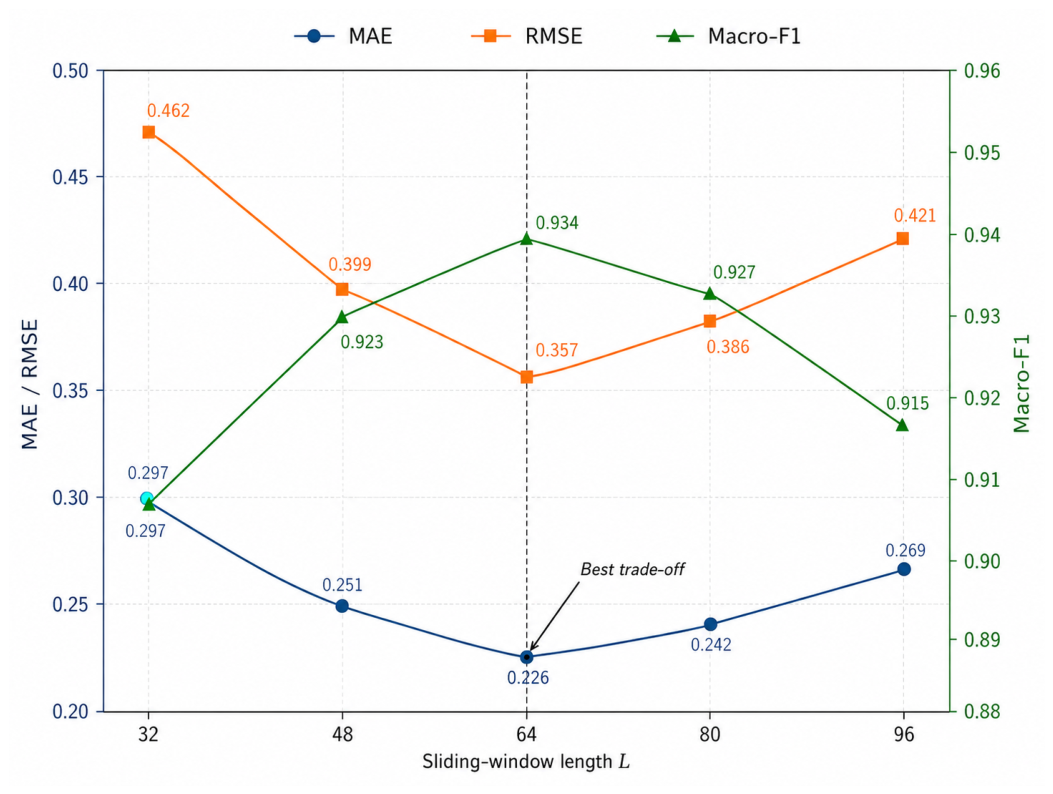

Table 1.
Experimental platform and key hardware parameters.
| Parameter | Configuration / measured value |
|---|---|
| RFID reader | Impinj Speedway R420; four-port reader, one antenna port used |
| Operating band | UHF 920–925 MHz; EPC Gen2 compatible |
| Transmit power | 28.5 dBm during acquisition; recalibrated before each recording day |
| Antenna | 8 dBi linearly polarized antenna; center height 1.35 m |
| Array tags | 18 Impinj H47 passive tags arranged as wall array |
| Identity tags | One passive EPC identity tag per participant, worn on chest or waist |
| Tag spacing | 25 cm horizontal and vertical spacing; effective array area approximately |
| Antenna-to-array distance | 2.80 m; marked walking path width 0.90 m |
| Sampling/read rate | Hz after timestamp alignment |
| RSSI preprocessing | Moving average , outlier correction, tag-wise z-score normalization |
| Window setting | Length samples; step = 32 samples; 50% overlap |
| EBD thresholds | , , and after calibration |
| Computing platform | Intel i7 CPU, 32 GB RAM, NVIDIA RTX 3060 GPU; PyTorch implementation |
Table 2.
Dataset contents.
| Data item | Concrete content in the revised dataset |
|---|---|
| Raw RFID records | Timestamp, EPC, antenna port, RSSI, read count, tag coordinate loc.x/loc.y and scenario label |
| Array RSSI sequences | 18 array tags × 30–40 Hz × 12–20 s per trial; missing reads linearly interpolated only inside valid windows |
| Identity observations | Wearable identity-tag EPC streams aligned with array RSSI by nearest timestamp and continuity constraints |
| Participants | 18 volunteers; height 1.58–1.84 m; no participant shared across training/validation/test |
| Target-count labels | Frame-level labels for 0, 1, 2 and 3 persons, verified against trial logs |
| Passage patterns | Separated/parallel, close crossing, following and opposite-direction passage |
| Distance modes | Near ( m), middle (1.4–2.4 m) and far ( m), calibrated from marked walking lanes |
| Window samples | 11,148 EBD-valid windows generated with and 50% overlap |
| Output labels | Target count, behavior class, associated identity set and EBD boundary interval |
Table 3.
Dataset statistics and split protocol.
| Statistic | Training | Validation | Test |
|---|---|---|---|
| Overall dataset characteristics | |||
| Participants | 12 | 3 | 3 |
| Recording sessions | 72 | 18 | 21 |
| Raw sequence segments | 576 | 144 | 168 |
| Raw duration (h) | 2.55 | 0.64 | 0.74 |
| Valid windows after EBD | 7256 | 1784 | 2108 |
| Read rate (Hz) | |||
| Distribution by number of persons | |||
| 0 persons | 1020 | 250 | 284 |
| 1 person | 2468 | 612 | 704 |
| 2 persons | 2526 | 620 | 748 |
| 3 persons | 1242 | 302 | 372 |
| Distribution by interaction pattern | |||
| Separated | 2446 | 602 | 706 |
| Crossing | 1788 | 442 | 520 |
| Following | 1964 | 474 | 574 |
| Opposite | 1058 | 266 | 308 |
Table 4.
Comparative results of people-count estimation, behavior recognition and identity association.
Table 4.
Comparative results of people-count estimation, behavior recognition and identity association.
| Method | Input features | Identity tag | EBD | MAE↓ | RMSE↓ | Macro-F1↑ | ID Acc.↑ |
|---|---|---|---|---|---|---|---|
| Threshold-rule method | Raw RSSI energy | No | No | – | |||
| Traditional ML (RF/SVM) | RSSI statistics + difference | Yes | No | ||||
| Data-driven LSTM | RSSI + difference | Yes | No | ||||
| Single-branch LSTM | RSSI + difference | Yes | No | ||||
| Proposed method | RSSI + difference + distance mode | Yes | Yes |
Table 5.
Ablation results.
| Configuration | Difference | EBD | Distance mode | Physical prior | Parallel LSTM | MAE↓ | RMSE↓ |
|---|---|---|---|---|---|---|---|
| Complete model | Yes | Yes | Yes | Yes | Yes | ||
| Without difference | No | Yes | Yes | Yes | Yes | ||
| Without EBD | Yes | No | Yes | Yes | Yes | ||
| Without mode partition | Yes | Yes | No | Yes | Yes | ||
| Without physical prior | Yes | Yes | Yes | No | Yes | ||
| Single temporal branch | Yes | Yes | Yes | Yes | No |
Table 6.
Sensitivity to the sliding-window length on the subject-independent test set.
| Window length L | Step | Valid windows | MAE↓ | RMSE↓ | Macro-F1↑ | Observation |
|---|---|---|---|---|---|---|
| 32 | 16 | 14,920 | 0.297 | 0.462 | 0.901 | Boundary information incomplete |
| 48 | 24 | 12,806 | 0.251 | 0.399 | 0.923 | Improved temporal coverage |
| 64 | 32 | 11,148 | 0.226 | 0.357 | 0.934 | Best trade-off |
| 80 | 40 | 9,704 | 0.242 | 0.386 | 0.927 | More background included |
| 96 | 48 | 8,520 | 0.269 | 0.421 | 0.915 | EBD boundary diluted |
Table 7.
Stratified performance of the proposed method under representative test scenarios.
| Test scenario | Valid windows | MAE↓ | RMSE↓ | Macro-F1↑ | ID Acc.↑ | EBD IoU↑ |
|---|---|---|---|---|---|---|
| Single-person passage | 704 | 0.131 | 0.211 | 0.964 | 0.982 | 0.879 |
| Separated two-person passage | 512 | 0.194 | 0.307 | 0.944 | 0.969 | 0.851 |
| Close two-person crossing | 472 | 0.283 | 0.425 | 0.913 | 0.943 | 0.812 |
| Following passage | 386 | 0.268 | 0.407 | 0.918 | 0.948 | 0.806 |
| Compact three-person passage | 372 | 0.355 | 0.526 | 0.884 | 0.927 | 0.774 |
| Fast speed subset | 690 | 0.301 | 0.462 | 0.905 | 0.939 | 0.786 |
| Far-distance subset | 604 | 0.259 | 0.401 | 0.920 | 0.956 | 0.823 |
Disclaimer/Publisher’s Note: The statements, opinions and data contained in all publications are solely those of the individual author(s) and contributor(s) and not of MDPI and/or the editor(s). MDPI and/or the editor(s) disclaim responsibility for any injury to people or property resulting from any ideas, methods, instructions or products referred to in the content. |
© 2026 by the authors. Licensee MDPI, Basel, Switzerland. This article is an open access article distributed under the terms and conditions of the Creative Commons Attribution (CC BY) license (http://creativecommons.org/licenses/by/4.0/).
Copyright: This open access article is published under a Creative Commons CC BY 4.0 license, which permit the free download, distribution, and reuse, provided that the author and preprint are cited in any reuse.


