Submitted:
12 June 2026
Posted:
15 June 2026
You are already at the latest version
Abstract
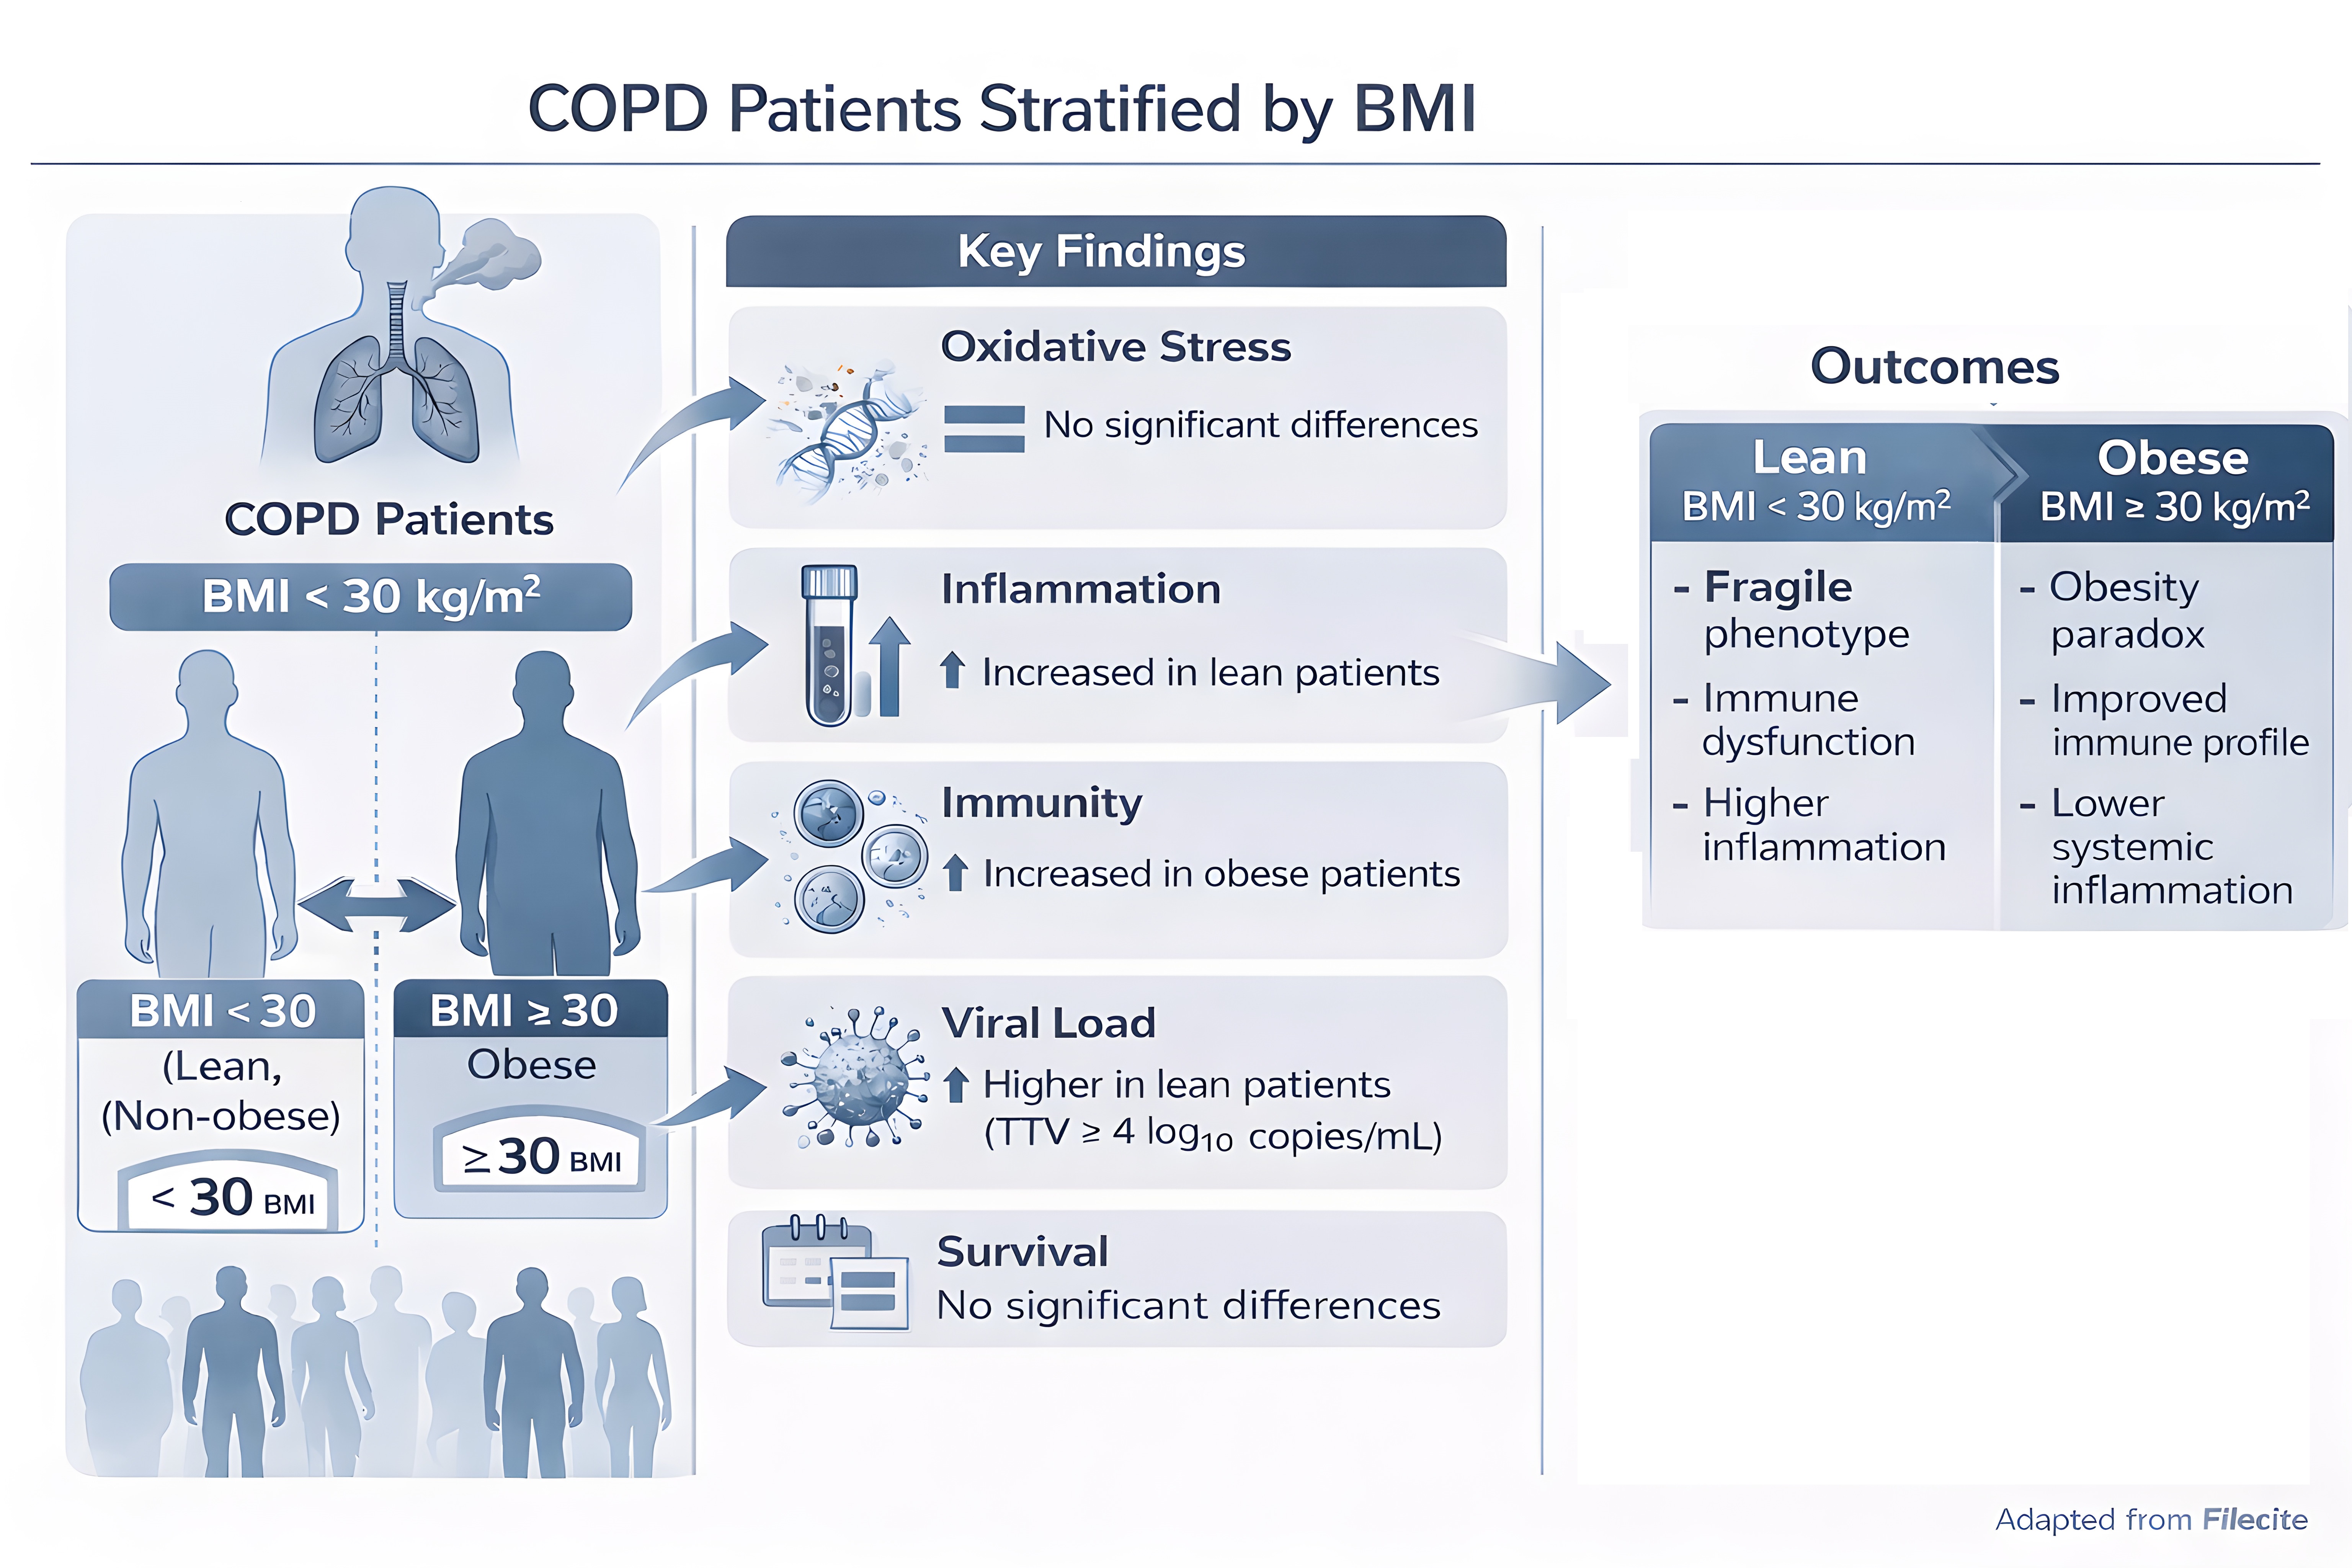
Chronic obstructive pulmonary disease (COPD) is characterized by systemic inflammation, immune dysregulation, and increased susceptibility to infections. Obesity may influence these processes and has been proposed as a potential contributor to the so-called “obesity paradox”, although its effects on immune competence, viral burden, and survival are not yet fully understood. Seventy patients with severe to very severe COPD (GOLD stage 3–4) were stratified according to BMI (<30 vs. ≥30 kg/m²). Clinical and functional parameters were assessed together with biomarkers of oxidative stress, DNA damage, systemic inflammation, and T-cell subsets. A comprehensive viral panel, including Torque Teno virus (TTV), was also analyzed. Five-year survival was evaluated using Kaplan–Meier curves and Cox regression models. Patients with BMI ≥30 showed higher lymphocyte counts and increased CD4⁺ and CD8⁺ T-cell levels, accompanied by lower systemic inflammatory indices. No significant differences were observed in oxidative stress or DNA damage markers. In addition, TTV viremia (>4 log₁₀ copies/mL) was more frequently observed among patients with lower BMI. Despite these differences, five-year survival did not significantly differ between the two groups. These findings suggest that BMI alone may have limited value as a predictor of outcomes in patients with advanced COPD. Conversely, immune-inflammatory indices and viral burden, particularly TTV viremia, could provide complementary information for risk assessment and may deserve further investigation as potential tools for personalized patient stratification.
Keywords:
COPD
; obesity paradox
; systemic inflammation
; T-cell immunity
; Torque Teno virus (TTV)
; viral biomarkers
; oxidative markers
; rehabilitation
1. Introduction
Obesity is a major global health challenge, affecting over 2 billion adults worldwide and projected to involve more than half of the adult population by 2050 [1]. By mid-century, nearly one in four individuals with obesity may be over 65 years old, and in high-income countries, rising obesity coincides with population aging and declining fertility, further straining healthcare [2]. While obesity is well recognized for its cardiometabolic consequences, it also profoundly impairs immune function, increasing susceptibility to infections across the lifespan [3]. The COVID-19 pandemic highlighted this risk, with individuals with obesity experiencing disproportionately severe outcomes [4]. Large-scale analyses of Finnish cohorts and the UK Biobank covering 925 bacterial, viral, parasitic, and fungal infections reported that adults with obesity (BMI ≥30 kg/m²) had a 1.7-fold higher risk of severe infection, rising to nearly threefold for class III obesity (BMI ≥40 kg/m²) [3]. Viral infections were particularly affected, with hazard ratios ranging from 1.3 for herpesvirus infections to 2.3 for acute viral infections. Globally, obesity may account for up to 15% of infection-related deaths, particularly during pandemic periods [5].Obesity also alters respiratory physiology, inducing structural and functional remodeling of the lungs [6]. Excess thoracic adiposity, airway smooth muscle thickening, and extracellular matrix expansion reduce lung compliance and disrupt respiratory mechanics, while airway hyper-responsiveness, premature airway closure, and ventilation–perfusion mismatches increase susceptibility to both acute and chronic pulmonary infections.
The relationship between obesity and chronic obstructive pulmonary disease (COPD) is complex and influenced by smoking, which affects 30–40% of COPD patients and is often associated with lower body weight, complicating obesity-related risk assessments [7]. Among never-smokers, higher BMI correlates with increased COPD risk [8], with central or visceral adiposity exerting stronger effects than general obesity [9].
Obesity exerts important effects on the respiratory system through interconnected mechanical, structural, and inflammatory mechanisms. Excess adipose tissue accumulation in the thoracic and abdominal compartments restricts chest wall expansion and diaphragmatic excursion, leading to reduced lung compliance, lower functional residual capacity (FRC), and decreased expiratory reserve volume (ERV) [10,11,12]. In severe obesity, total lung capacity (TLC) may also decline, contributing to a restrictive ventilatory pattern [11].
Obesity is additionally associated with structural airway abnormalities, including dysanapsis, a mismatch between airway caliber and lung size characterized by relatively smaller airways in proportion to lung volume [13,14]. This condition is typically associated with preserved or mildly reduced FEV₁, increased or preserved FVC, and a lower FEV₁/FVC ratio. Adipose tissue infiltration and airway wall thickening have been demonstrated in both experimental and human studies, suggesting a direct contribution of obesity to airway remodeling [15,16].
At the microscopic level, obesity promotes lipid accumulation in alveolar cells, extracellular matrix deposition, vascular congestion, and alterations in immune cell populations [17,18,19]. Increased airway smooth muscle thickness, impaired mucociliary clearance, and chronic low-grade inflammation have also been described [20,21,22,23]. Adipokines, particularly leptin, appear to contribute to these processes by stimulating inflammatory pathways, fibroblast activation, and airway smooth muscle proliferation [24,25].
Functionally, these changes increase the work of breathing, airway resistance, and airway hyper-responsiveness, while reducing respiratory endurance and lung volumes [28]. Premature airway closure and ventilation/perfusion mismatch are more frequent in obesity, especially in the lower lung regions, potentially impairing gas exchange and favoring chronic respiratory diseases such as asthma and COPD [26,27,28,29]. Respiratory dysfunction is generally more pronounced in individuals with central obesity because of the greater mechanical limitation imposed on diaphragmatic movement [30]. In severe obesity, conditions such as obesity hypoventilation syndrome (OHS) and obstructive sleep apnea (OSA) may further aggravate pulmonary dysfunction through hypoxia-driven inflammatory and vascular mechanisms [31].
Recent evidence suggests that obesity should be considered not only a comorbidity but also a potential independent contributor to COPD development and progression [8] . Excess adiposity, particularly abdominal obesity, mechanically restricts lung expansion, increases respiratory workload, and contributes to chronic low-grade systemic inflammation through adipose tissue dysfunction [32]. A dose–response relationship between obesity severity and COPD risk has also been reported in nonsmokers, supporting the need for increased COPD surveillance in older obese populations [8].
In this context, visceral adiposity has emerged as a clinically relevant factor. A recent study including 16,167 participants, of whom 1,397 had COPD, demonstrated a significant positive association between the Visceral Adiposity Index (VAI) and COPD prevalence, independent of major confounding variables. The association was particularly evident in women and hypertensive individuals, with a threshold effect observed at a VAI value of 2.55 [33]. These findings suggest that assessment of visceral adipose dysfunction may improve early risk stratification and personalized management strategies in populations at high risk for COPD.
The relationship between obesity and COPD is further complicated by the so-called “obesity paradox,” whereby overweight or moderately obese patients may show better survival despite worse respiratory symptoms. [34,35].
Although the long-standing assumption that the lungs are sterile has been definitively challenged [36], knowledge of the respiratory virome remains considerably less advanced than that of the respiratory bacteriome. Globally, obesity may account for up to 15% of infection-related deaths, particularly during pandemic periods [5] The introduction of conventional PCR-based methods markedly improved the detection of known respiratory viruses, but research has mainly concentrated on well-recognized pathogens such as influenza viruses, respiratory syncytial virus (RSV), and coronaviruses [36]. While these agents play a major role in acute respiratory infections and in exacerbations of chronic lung diseases [36], they likely represent only a limited portion of the highly diverse viral communities inhabiting the respiratory tract.
The association between obesity and severe viral respiratory infections became evident during the 2009 H1N1 influenza pandemic, when obesity was identified as an independent risk factor for increased hospitalization, morbidity, and mortality [37,38]. Individuals with severe obesity (BMI ≥ 40 kg/m²) were disproportionately represented among influenza-related hospitalizations and deaths, and obesity was associated with more severe disease outcomes across multiple countries [39].
A WHO study involving 20 countries identified obesity, asthma, and pregnancy as risk factors for severe H1N1 outcomes [39]. However, other studies found no significant association between obesity and influenza susceptibility, leading to inconsistent evidence regarding the role of obesity in influenza risk and the potential benefit of earlier antiviral treatment in obese patients [40]. The conflicting evidence limits a clear understanding of the impact of obesity on influenza risk and makes it challenging to determine the potential value of initiating antiviral therapy earlier in obese compared with non-obese individuals.
More recently, obesity has also emerged as a major risk factor for severe COVID-19. Furthermore, a long-term cohort study showed that individuals with obesity have an increased risk of respiratory tract infections during both influenza and non-influenza periods, suggesting a broader obesity-related susceptibility to respiratory infections [41].
In this contest Torque Teno Virus (TTV) is assuming a great importance. THUS, Torque Teno Virus (TTV) is a highly prevalent, non-pathogenic single-stranded DNA anellovirus that is increasingly recognized as a potential biomarker of immune competence [42,43]. Because of its widespread distribution, stable viral kinetics, low intra-individual variability, and the availability of standardized PCR-based quantification methods, TTV has attracted growing interest as a functional indicator of immune status in both transplantation and chronic inflammatory diseases [42,44,45]. In transplant medicine, elevated or increasing TTV DNA levels have been associated with excessive immunosuppression and a higher risk of infectious complications, whereas low viral loads have been linked to acute rejection episodes [44,46]. In allogeneic hematopoietic stem cell transplantation, TTV kinetics may also reflect the process of immune reconstitution, although interpretation remains influenced by disease severity, conditioning regimens, and lymphocyte recovery dynamics [45].
In COPD, TTV may provide insight into the relationship between immune dysregulation, inflammation, and the so-called “obesity paradox.” In the cohort analyzed by Vitiello et al. [47], patients with higher TTV viremia (≥4 log₁₀ copies/mL) showed significantly lower CD3⁺, CD4⁺, and CD8⁺ T-cell counts, suggesting impaired cellular immune surveillance. In contrast, conventional hematological parameters and respiratory function measures did not differ significantly according to TTV levels, indicating that TTV may capture immunological alterations not reflected by routine clinical markers. Higher TTV load was also associated with increased frequencies of regulatory T cells (Treg), together with a positive correlation between Treg percentage and viral load, supporting the hypothesis of an immunosuppressive or immune-tolerant microenvironment. Furthermore, patients with lower TTV viremia exhibited higher expression of α7 nicotinic acetylcholine receptor (α7nAChR) on CD4⁺ T cells, suggesting a possible link between cholinergic anti-inflammatory pathways and immune control of viral replication.
Overall, these findings support the concept that TTV is not merely a bystander virus, but rather a surrogate marker of immune competence and immunological balance. Monitoring TTV viral load may therefore help identify COPD patients with impaired immune resilience, contributing to more accurate immune profiling and potentially improving personalized risk stratification in chronic inflammatory lung disease.
The present study aimed to investigate the role of obesity in modulating clinical, immunological, and virological outcomes in elderly patients with advanced chronic obstructive pulmonary disease (COPD). Specifically, the objectives were to:
(i) evaluate the impact of body mass index (BMI) on clinical and functional characteristics;
(ii) assess oxidative stress and DNA damage as indicators of systemic biological burden;
(iii) analyze the relationship between BMI and systemic inflammation, including composite inflammatory indices;
(iv) characterize immune profiles with particular focus on T-cell subsets (CD3⁺, CD4⁺, CD8⁺);
(v) investigate susceptibility to viral infections, such as: anellovirus, polyomavirus, adenovirus, human herpes virus, influenza virus H1N1, with emphasis on Torque Teno virus (TTV) as a marker of immune competence;
(vi) determine the association between BMI, immune-inflammatory parameters, viral load, and long-term survival.
By integrating clinical, immunological, and virological data, this study sought to identify more accurate predictors of prognosis and to contribute to the development of personalized risk stratification strategies in advanced COPD.
2. Materials and Methods
2.1. Study design, participants and biological sample collection
An observational study was carried out in 70 patients aged 72.6±8.8 years suffering from severe or very severe COPD (GOLD stage 3 or 4) and admitted to the Pulmonary Rehabilitation (PR) Unit of the IRCCS San Raffaele Roma between September 2013 and December 2015 for a comprehensive 3 weeks PR program. Peripheral blood samples were collected and centrifuged to collect plasma and serum, that was stored at −80 °C at admission. Inclusion and Exclusion Criteria Participants eligible for inclusion were adults aged ≥18 years with a confirmed diagnosis of stable chronic obstructive pulmonary disease (COPD). All patients were in a non-acute phase of the disease at the time of enrollment and were admitted for pulmonary rehabilitation. Exclusion criteria included:
(i) inability to understand or communicate in the Italian language;
(ii) current or previous diagnosis of cancer;
(iii) Mini-Mental State Examination (MMSE) score <24, indicating significant cognitive impairment; and
(iv) acute COPD exacerbation at the time of evaluation.
The plasma depleted blood was reconstituted with PBS and used to separate PBMC. To this aim, Leucosep tube 12 ml with leucosep separation medium (Greiner Bio-One) were used, according to manufacturer’s instruction. After separation, PBMC were washed two times in PBS, then resuspended in cryopreservative buffer (FBS 10% DMSO) and quickly stored at -80° C for 2 hours, then transferred into liquid nitrogen tank. Additional detail of the study population can be found [47]. A follow up of study subjects was per-formed tracing back all subjects to their residence. Vital status and cause of death were obtained by the municipality of residence. The study covered a period of 5 years after the hospital discharge. Study samples come from the biobank of an institutional project designed to test a personalized approach to rehabilitation. It was approved by the ethics committee of the IRCCS San Raffaele Roma (Prot. 15/2013), and all participants signed the consent to participate in the study at admission.
Patient characteristics were assessed through a multidimensional evaluation based on routinely collected clinical, functional, biochemical, and instrumental parameters. Data collected included demographics (age, sex, marital status, employment, and educational level), medical history and lifestyle factors (smoking and alcohol habits, family history of COPD and other diseases, and comorbidities), body mass index (BMI), pharmacological therapy, and use of long-term oxygen therapy (LTOT).
Clinical assessment included symptom burden, quality of life, and functional status evaluated using the Borg scale, Medical Research Council (MRC) dyspnea scale, Barthel Index, Activities of Daily Living (ADL/IADL), Maugeri Foundation Respiratory Failure Questionnaire (MRF-26), St. George’s Respiratory Questionnaire (SGRQ), and Short Form-36 (SF-36). Functional exercise capacity was assessed using the six-minute walk test (6MWT), while cognitive function was evaluated using the Mini-Mental State Examination (MMSE) and Montreal Cognitive Assessment (MoCA).
Comorbidity burden and clinical complexity were assessed using the Cumulative Illness Rating Scale (CIRS) Severity and Comorbidity indices, with particular attention to cardiovascular disease and type 2 diabetes. Instrumental and physiological evaluations included spirometry (FEV₁), pulse oximetry, electrocardiography, heart rate, blood pressure, arterial blood gas analysis (pO₂, pCO₂, pH), SpO₂, and SpCO₂. Laboratory assessment included hematological and biochemical parameters, including electrolytes (Na⁺, K⁺), hemoglobin, glucose, azotemia, creatinine, bilirubin, and liver enzymes (ALT, AST, γGT), as previously described [47].
All patients received daily inhaled corticosteroid therapy (beclomethasone dipropionate 0.4 mg/mL) in combination with two bronchodilators (salbutamol and ipratropium bromide) during the 3-week rehabilitation program. Acute exacerbations were managed according to clinical practice using systemic corticosteroids, including prednisone, betamethasone, or methylprednisolone.
Smoking status was assessed according to the National Health Interview Survey (NHIS) criteria and verified by urinary cotinine testing at admission. Current smokers were defined as individuals who had smoked at least 100 cigarettes during their lifetime and were actively smoking at the time of evaluation; former smokers as individuals who had smoked at least 100 cigarettes during their lifetime but had quit smoking; and never smokers as individuals who had never smoked or had smoked fewer than 100 cigarettes during their lifetime. In our cohort, all former smokers had abstained from smoking for at least 10 years. Urine samples were collected at admission, stored at −20 °C, and analyzed for cotinine using a CE-marked Sure Screen Instant Cotinine Testing Kit (ISO 9001 and ISO 13485 certified).
2.2. Inflammatory parameters, oxidative and DNA damage analysis, and flow cytometry analysis
Blood test: The number and percentage of peripheral blood cells were evaluated during routine laboratory analysis using standard blood count automated methods (Beckman Coulter LH500). LMR (Lymphocyte-to-Monocyte Ratio), NLR (Neutrophil-to-Lymphocyte Ratio) and PLR (Platelet-to-Lymphocyte Ratio), were calculated for each patient diving the absolute cell numbers of the indicated subpopulation, taken from complete blood count. Subsequently, the mean and standard deviation for observed values has been calculated.
Biochemical assay: Blood samples were centrifuged at 2700 g for 10 minutes. The serum was collected and immediately analyzed. These assays were carried out in a biochemical auto-analyzer Dade XL® (USA), using Dade Behring® kits (Dade Behring, Inc., Newark, NJ).
Malondialdehyde (MDA), and 8-hydroxy-2′-deoxyguanosine (8OHdG) quantification were determined reported by [47]. Interleukin 6 (IL-6) and c reactive protein (CRP) levels were determined as previous described [48] in serum samples stored at –80° C for at least one year.
Alkaline comet assay: The complete detailed procedure for the assay can be found in our previous work. In summary, according to [49], damage of DNA from lymphocytes was evaluated after lymphocytes lysation, DNA denaturation, electrophoresis on agarose gel and staining, using the Comet assay IV software (Instem, London, UK). Tail intensity values (TI, % DNA in comet tail) were calculated from 100 comets for each individual. A previous study analyzing a dataset of 8293 subjects [50], reported an overall tail intensity percentage of 7.4 ± 8.8 (10.5 ± 11.2 for individuals over 60 years).
PBMC stored in liquid nitrogen, where thawed and resuspended in RPMI plus 10% FBS, 2 mM L-Glutamine, 1% Sodium Piruvate, 1% Non-essential amino acids, 1% penicil-lin/streptomycin (all from SIAL, Rome, Italy), at 1x10⁶ cells/ml. Cells were seeded in 24 well plates and incubated at 37 °C, 5% CO2 overnight. To identify T lymphocytes population, cells were stained with the following mouse anti human antibodies: anti-CD45 BUV395, anti-CD3 APC-R700, anti-CD4 BUV737, anti-CD8 BV785, anti-CD25 BV421, an-ti-CD127 BB700, anti-CD183 PE, anti-CD194 BV510, anti-CD196 BV650, all from BD Bio-sciences (Milan, Italy) and anti-Nicotinic Acetylcholine Receptor alpha 7/CHRNA7 Alexa Fluor 488 (Santa Cruz Biotechnology, Dallas, Texas, U.S.A.). After 20 minutes incubation at 4 °C, cells where washed and resuspended in PBS, then were acquired on a LSR Fortessa X-20 flow cytometer (Becton Dickinson). Data were analyzed using FACS Diva software v 8.0.2. Treg and Th17 lymphocytes were identified by the expression of the following combination of markers on CD4+ T lymphocytes: CD25high CD127- (Treg), CD194+ CD196+ (Th17) [51,52]. Lymphocytes immunophenotyping was performed on thawed samples, and in some samples the number of cells recovered from thawing wasn’t sufficient for the analysis, lymphocyte subset analyses could only be performed in a subset of 50 samples.
2.4. Virus detection and quantification
TTV load was assessed in PBMCs where the highest viral load has been reported [53,54]. TTV loads were expressed as the number of viral DNA copies per μg of genomic DNA extracted by PBMCs. The lower limit of detection was 10 copies of TTV per μg of genomic. Reference values in healthy cohorts are typically 2.3 ± 0.7 or 2.8 ± 1.09 log₁₀ copies/mL, with no significant sex-related differences [55] . Based on these findings, a plasma TTV load of approximately 4 log₁₀ copies/mL has been proposed as a practical threshold indicating altered immune function [56]. Due to the small size of the study sample, we decided to examine the association between viral infection and all variables considered by dividing patients into two groups: (1) TTV viremia < 4 log10 copies/mL, (2) TTV viremia with > 4 log10 copies/mL or higher.
All other virus including influenza A (H1N1); human polyomaviruses such as BKPyV and JCPyV; human adenoviruses such as Ad11, Ad34, and Ad35; human herpesviruses such as HHV-6, HHV-7, HSV-1, EBV, CMV, and VZV, were detected as previously de-scribed [57].
2.5. Statistical methods
Descriptive statistics are reported as percentages or mean ± SD. Group differences were assessed by Student’s t-test or Mann–Whitney U test. Survival time was defined as the number of days from baseline to death. Patients who were alive at the last follow up were censored. Cox proportional hazards regression models were used to evaluate the association between covariates and survival. The proportional hazards assumption was assessed using Schoenfeld residuals (cox.zph), and no major violations were detected for the final models. Hazard ratios (HRs) with 95% confidence intervals (CIs) were reported. We applied the Kolmogorov–Smirnov test to formally evaluate deviations from a Gaussian distribution. In addition, for biomarkers with a well established biological tendency toward symmetric distribution (e.g., cell counts), we also considered their expected bio-logical behavior when interpreting normality. Variables that did not meet normality assumptions were analyzed using non parametric methods.
Statistical significance was set at α = 0.05. Analyses were conducted using R (version 4.5.2) with the survival and survminer packages.
3. Results
3.1. The COPD Cohort Analysis
A total of 70 participants were included in the baseline analysis (Table 1). Participants were stratified by BMI (<30 vs. ≥30) to investigate systemic inflammation evaluating inflammatory indices (NLR, PLR, MLR, SII, SIRI, AISI), immunological profiles (CD3⁺ T lymphocytes), DNA damage (% tail intensity by comet assay), oxidative stress markers (8-OHdG, malondialdehyde), susceptibility to viral infections, response to pulmonary rehabilitation, and 5-year survival. Of the cohort, 50 patients (71.4%) had BMI <30, and 20 (28.6%) were classified as obese (BMI ≥30) according to WHO criteria [https://www.who.int/news-room/fact-sheets/detail/obesity-and-overweight].
The mean age was 70.5 ± 8.3 years, with the BMI <30 group being older than the BMI ≥30 group (71.9 ± 8.6 vs. 67.2 ± 6.8 years; p = 0.033). All patients were GOLD stage 3 or 4 (30% ≤ FEV₁ < 50% and FEV₁ < 30%, respectively). Patients with BMI ≥30 showed numerically higher FEV₁ values compared with patients with BMI <30 (55.7 ± 24.5 vs. 43.4 ± 20.8), although the difference did not reach statistical significance (p = 0.090) and longer 6MWT distances (120.5 ± 85 vs. 102.2 ± 86 m; p = 0.072) compared with non-obese patients. Cognitive performance (MMSE) and the global assessment of the level of autonomy (ADL/IADL scores) were similar between groups (Table 2). Mild depressive symptoms were more frequent in the BMI ≥30 group (16.0 ± 10.2 vs. 9.7 ± 4.9; p = 0.049). Patients were further stratified according to smoking status (current, former, and never smokers). As reported in Table 1, no significant differences were observed among the three groups for any of the variables examined (p 0.782).
3.2. Oxidative Markers
No significant differences were observed between groups (BMI ≥30 vs. <30) for oxidative stress or DNA damage markers (Table 3). Specifically, malondialdehyde (MDA) levels were 40.21 ± 12.47 µM in the obese group versus 41.51 ± 13.04 µM in the non-obese group (p = 0.767). Similarly, 8-Oxo-dG levels were 23.93 ± 9.91 pg/mL versus 25.40 ± 12.57 pg/mL (p = 0.721), IL-6 levels (Table 4) were 124.51 ± 155.50 pg/mL versus 108.78 ± 136.45 pg/mL (p = 0.778), and DNA damage (% tail intensity) was 20.11 ± 8.24% versus 19.62 ± 7.52% (p = 0.826).
3.3. Hematological, immunological and inflammatory markers
All data are presented in Table 4. No significant differences were observed in standard hematological parameters, including RBC (p = 0.359), WBC (p = 0.506), or platelets (p = 0.227; data not shown). Total lymphocyte counts were significantly higher in patients with BMI ≥30 compared to those with BMI <30 (81.3% increase; p = 0.001).
Inflammatory indices were affected by BMI (Table 5). IL-6, CRP and LMR did not differ between groups (p =0.778, p = 0.108 and p = 0.382, respectively), whereas NLR, PLR, and MLR were lower in patients with BMI ≥30 (NLR: −50.6%, p = 0.001; PLR: −49.8%, p = 0.002; MLR: −38.1%, p = 0.066). Similarly, the Systemic Immune-Inflammation Index (SII) was reduced by 41% (p = 0.003), the Systemic Immune Response Index (SIRI) by 57.1% (p = 0.046), and the Aggregate Index of Systemic Inflammation (AISI) by 45.1% (p = 0.051) in the obese cohort. No significant differences were observed for the Albumin-Bilirubin (ALBI) score (p = 0.392) or the Platelet-Albumin-Bilirubin (PALBI) score (p = 0.232).
Analysis of T-cell subsets showed increased CD3⁺ T cells in the BMI ≥30 group (p = 0.025). with significant elevations in both CD4⁺ (p = 0.030) and CD8⁺ (p = 0.032) cells. as reported in Table 6. The CD4/CD8 ratio was not significantly different between groups (p = 0.216). No differences were observed in the percentage of regulatory T cells (%Treg; p = 0.247). Th17 cells (p = 0.168). or the Treg/Th17 ratio (p = 0.230).
3.4. Virological status analysis
All data are reported in Table 7. A panel of viruses was analyzed. including influenza A (H1N1); human polyomaviruses such as BKPyV and JCPyV; human adenoviruses such as Ad11. Ad34. and Ad35; human herpesviruses including HHV-6. HHV-7. HSV-1. EBV. CMV. and VZV; and Anelloviridae such as TTV (Table 7).
Serological transaminases—alanine aminotransferase (ALT). aspartate aminotransferase (AST). and gamma-glutamyl transferase (γGT). reported in Table 4—were measured as indirect biomarkers of liver injury caused by viral infections, particularly hepatotropic viruses (HAV. HBV. HCV. HDV. HEV). All serum biomarkers were within the normal range. Specifically, ALT levels were 16.50 ± 9.21 U/L in patients with BMI <30 and 20.15 ± 10.75 U/L in those with BMI ≥30 (p = 0.269); AST levels were 20.33 ± 12.92 U/L (<30 BMI) and 25.46 ± 11.27 U/L (≥30 BMI) (p = 0.229); and γGT levels were 38.96 ± 47.84 U/L (<30 BMI) and 47.00 ± 30.89 U/L (≥30 BMI) (p = 0.586). collectively suggesting no evidence of hepatotropic viral involvement.
Among all tested viruses. only TTV viremia (>4 log10 copies/mL) was significantly associated with BMI <30 (p = 0.04). OR indicates that COPD patients with BMI <30 had higher odds of being positive for higher TTV levels.
3.5. Survival
Kaplan–Meier survival curve (Figure 1) compares overall survival probability between two BMI categories (<30 kg/m² blue line; ≥30 kg/m² red line) over approximately 2000 days of follow-up. Overall. the difference between the two curves is not statistically significant (p = 0.48). indicating that BMI category does not have a strong impact on survival in this sample. This is further supported by the substantial overlap of the 95% confidence intervals. At baseline 23 participants were included in the BMI <30 group and 12 in the BMI ≥30 group with the number of individuals at risk gradually decreasing to zero in both groups over time. A trend can nonetheless be observed: patients with BMI ≥30 show slightly better survival in the early phase suggesting lower initial mortality compared to those with BMI <30. However, this apparent early advantage does not persist. Survival in the BMI ≥30 group declines more rapidly during later follow-up resulting in relatively earlier mortality toward the end of the observation period. In terms of mean survival time patients with BMI <30 had a mean survival of 714.2 ± 564.8 days, whereas those with BMI ≥30 had a mean survival of 607.2 ± 493.5 days. In conclusion although there is a modest early survival advantage in patients with higher BMI the overall survival distributions remain comparable between groups with no statistically significant difference.
Kaplan–Meier estimates of cumulative survival in patients with COPD undergoing pulmonary rehabilitation, stratified by BMI (<30 kg/m² vs. ≥30 kg/m²). Survival time is expressed in days from study entry to death or censoring. Both groups showed a progressive decline in survival over the follow-up period, with substantial overlap between the survival curves, suggesting comparable long-term survival probabilities across BMI categories. Tick marks indicate censored observations, where applicable. The number of patients at risk at predefined time points is displayed below the x-axis to facilitate interpretation of the survival estimates, particularly during the later stages of follow-up when the number of remaining participants decreases.
4. Discussion
This study provides further insight into the complex interplay between BMI, systemic inflammation, immune status, oxidative stress, viral burden, and survival in patients with advanced COPD. In our cohort—characterized by severe airflow limitation a high burden of multimorbidity, and advanced age—BMI alone does not emerge as a dominant determinant of prognosis. Survival analysis showed largely overlapping Kaplan–Meier curves between BMI categories (<30 vs ≥30 kg/m²) with no statically significant difference (p = 0.48) indicating that patients with lower and higher BMI experienced comparable long-term survival. Although individuals with BMI ≥30 kg/m² initially demonstrated slightly higher survival probabilities, this advantage was not sustained over time, and the survival curves ultimately converged reinforcing the concept that BMI alone does not independently determine prognosis in this cohort.
These findings are partially consistent with the concept of the “obesity paradox” in COPD. according to which overweight or moderately obese individuals often exhibit more favorable biological and clinical profiles compared with lean patients [35,58,59,60,61,62,63,64].
In our cohort patients with BMI ≥30 kg/m² demonstrated a more favorable immunological, biochemical, and virological profile including higher lymphocyte and T-cell counts. lower systemic inflammatory indices (NLR, PLR, MLR, SII, SIRI, AISI), and reduced TTV viremia suggesting better immune competence and viral control (Figure 2). In this respect our results are aligned with the “obesity paradox” at the biological level supporting the notion that higher BMI in advanced COPD may be associated with preserved immune function and a comparatively attenuated inflammatory state. However, this pattern was not reflected in survival outcomes as no significant differences were observed between BMI groups. Therefore, in our elderly population with advanced COPD the “obesity paradox” appears to be context-dependent manifesting in immunological and virological parameters but not translating into a survival advantage.
Chronic obstructive pulmonary disease (COPD) is characterized by persistent systemic inflammation and immune dysregulation. In the present cohort, patients with BMI < 30 kg/m² exhibited a less favorable biological profile, including higher levels of inflammatory markers (NLR, SII, PLR, MLR, and systemic inflammation indices), lower lymphocyte counts, and increased Torque teno virus (TTV) viremia, suggesting impaired immune competence and a potentially greater viral burden. These patients also showed poorer pulmonary function and markedly reduced exercise capacity, reflected by shorter 6-minute walk distance (6MWD), consistent with greater tissue wasting, reduced physiological reserve, and increased disease severity. Conversely, patients with BMI ≥ 30 kg/m² demonstrated a comparatively more preserved immunological profile, characterized by higher lymphocyte counts, lower inflammatory marker levels, and reduced TTV viremia. Obese patients also exhibited better lung function and exercise performance, suggesting greater metabolic and functional reserves despite advanced COPD. These findings are consistent with the concept of the “obesity paradox”, whereby increased body mass may provide protective physiological reserves in chronic diseases. Despite these biological and functional differences, Kaplan–Meier survival analysis revealed no statistically significant differences in long-term survival between BMI groups, with substantial overlap of the survival curves throughout follow-up. This observation suggests that BMI alone is insufficient to explain prognosis in patients with advanced COPD. Rather, mortality is likely influenced by the complex interaction among age, disease severity, systemic inflammation, immune competence, comorbidity burden, nutritional status, and functional capacity. Overall, these findings indicate that BMI modulates the inflammatory and immunological phenotype of advanced COPD without translating into measurable differences in long-term survival. A multidimensional approach integrating anthropometric, functional, inflammatory, virological, and clinical variables may therefore provide a more accurate assessment of prognosis and risk stratification than BMI alone. Figure has been improved using ChatGPT.
In our cohort patients with BMI ≥30 kg/m² tended to exhibit slightly higher FEV₁ values and longer six-minute walk test (6MWT) distances compared with non-obese individuals, although these differences were borderline significant in line with previous observations suggesting greater functional reserve in overweight or obese COPD patients [58]. Data from the large international SUMMIT trial further support a non-linear relationship between BMI and mortality in COPD with the highest mortality observed at the extremes of body weight—underweight (<20 kg/m²) and severe obesity (≥40 kg/m²)—and lower mortality in moderately overweight individuals [64]. Mechanistically, low BMI in advanced COPD is often associated with muscle wasting, systemic catabolism, and cachexia all of which significantly increase morbidity and mortality [65,66,67]. Conversely, higher BMI may reflect greater energy reserves capable of buffering the metabolic demands imposed by chronic respiratory disease. According to the muscle mass hypothesis. metabolically healthy overweight or obese patients with preserved lean mass may better tolerate acute illness and systemic inflammatory stress [68,69,70] . Importantly, BMI does not distinguish between metabolically healthy adiposity and sarcopenic obesity [71], reinforcing the need for more refined phenotyping.
With regard to oxidative stress, no significant differences were observed between BMI groups, in contrast with findings in the general population linking obesity to increased oxidative burden [39]. Similarly, after stratification by smoking status (current, former, and never smokers), no significant differences were detected among the three groups. Given the absence of significant differences across smoking categories, smoking status was not found to be a significant determinant of the outcomes evaluated in our cohort. Furthermore, inclusion of smoking status in the analyses did not materially affect the observed associations. Therefore, smoking status was not retained in the final multivariable models, as its inclusion did not improve model performance nor alter the study conclusions (data not shown).
Markers of oxidative stress and inflammation—including malondialdehyde, 8-hydroxy-2’-deoxyguanosine, interleukin-6, and DNA damage—were markedly elevated across the entire COPD cohort compared with healthy individuals, suggesting that the high baseline oxidative and inflammatory burden characteristic of advanced COPD may obscure any additional contribution of adiposity or smoking status. For example, urinary 8-OHdG levels are typically around 8.1 ng/mg in healthy individuals and 12.2 ng/mg in COPD patients [40], whereas mean values in our cohort exceeded 23 ng/mL. Similarly, IL-6 concentrations in healthy populations are generally below 6–7 pg/mL [41], while our cohort exhibited mean levels of 77.7 ± 126.7 pg/mL. These findings indicate that, in advanced COPD, systemic oxidative stress is predominantly disease-driven rather than BMI- or smoking-dependent. Consistent with this interpretation, bilirubin—an endogenous antioxidant capable of scavenging peroxyl radicals and inhibiting NADPH oxidase [42]—did not differ between BMI groups, despite previous associations with improved lung function and reduced mortality in COPD [43]. Although long-term effects of smoking on oxidative stress, inflammation, and immune function have been reported [72] , no significant differences were detected among current, former, and never smokers in the present cohort, suggesting that smoking status is unlikely to have materially influenced our findings.
An additional key finding was that several systemic inflammatory indices—including neutrophil-to-lymphocyte ratio (NLR), PLR, monocyte-to-lymphocyte ratio (MLR), systemic immune-inflammation index (SII), systemic inflammation response index (SIRI), and aggregate index of systemic inflammation (AISI)—were significantly lower in patients with BMI ≥30. These indices are widely used as markers of systemic inflammation and have demonstrated prognostic value across multiple diseases. SII, originally developed in oncology, reflects neutrophil–platelet–lymphocyte interactions and predicts outcomes in hepatocellular carcinoma and lupus nephritis [73,74], while AISI has shown prognostic relevance in stroke, hypertension, idiopathic pulmonary fibrosis, and COPD [75], and SIRI has been associated with COPD incidence and progression [76]. In our cohort SIRI values were generally elevated (mean 4.20 ± 3.92) reflecting the systemic inflammation typical of advanced COPD; however, patients with BMI ≥30 exhibited significantly lower values compared with those with BMI <30 (p = 0.049). Notably PLR was markedly reduced (−49.8%) in obese patients (p = 0.006). This consistent reduction in inflammatory indices may indicate a comparatively attenuated inflammatory phenotype potentially reflecting preserved nutritional status or differences in immune regulation.
Considering the immune system, we observed a marked difference in T lymphocytes numbers between patients with BMI>30 and patients with BMI<30. Notably, patients with lower BMI showed very low lymphocytes counts, while in patients with higher BMI lymphocytes numbers were normal to high. Indeed, in BMI>30 patients CD4+ and CD8+ T lymphocytes were higher than in BMI<30 patients, while the CD4/CD8 ratio and regulatory T-cell populations remained unchanged. These data suggest that obesity in this clinical context is associated with a conserved T lymphocytes population without evidence of overt immune dysregulation. The advanced age of the cohort is particularly relevant. as aging is associated with immunosenescence characterized by thymic involution, contraction of the naïve T-cell pool, and expansion of memory and cytotoxic subsets [77]. Adipose tissue may partially counteract these processes through immunometabolic signaling, as it is now recognized as an active immunological organ secreting adipokines and cytokines capable of modulating immune cell development and survival [78,79]. Mediators such as leptin, IL-6, and TNF-α influence T-cell proliferation, survival, and differentiation potentially sustaining lymphocyte homeostasis even in aging individuals. Moreover. moderate increases in BMI in elderly populations may reflect better nutritional status, including greater protein availability for lymphopoiesis [80] whereas lower BMI may indicate sarcopenia, frailty, or subclinical malnutrition conditions strongly associated with lymphopenia and impaired immune responses [81].
Virological analysis further revealed that among the panel of viruses tested only TTV viremia was associated with BMI. TTV positivity (>4 log₁₀ copies/mL) was significantly more frequent in patients with BMI <30, suggesting reduced immune control in leaner individuals. TTV is increasingly recognized as a surrogate biomarker of immune competence with higher viral loads reflecting impaired immune surveillance [82]. Previous work from our group has demonstrated that elevated TTV viremia predicts poor survival in COPD patients [54].
Taken together, these results demonstrate that BMI alone is an insufficient predictor of outcomes in advanced COPD. Instead, a multidimensional approach integrating immune-inflammatory indices and viral biomarkers provides a more accurate assessment of biological vulnerability. Lower BMI identifies a subgroup characterized by higher systemic inflammation, reduced lymphocyte counts, and increased TTV positivity, suggesting impaired immune resilience. Integrating BMI with biomarkers such as PLR and TTV load may therefore improve risk stratification and guide personalized rehabilitation strategies. PLR which reflects both inflammatory and coagulation pathways is particularly attractive due to its low cost and availability from routine blood tests. Platelet-derived mediators such as platelet-activating factor may exacerbate airway inflammation and promote thrombosis, impairing pulmonary circulation and contributing to post-rehabilitation exacerbations. A recent study evaluating multiple biomarkers identified PLR, eosinophil percentage, and NLR as the most reliable predictors of acute exacerbation risk following pulmonary rehabilitation [83]. TTV measurement is also feasible in clinical practice, as commercially available assays allow relatively simple and cost-effective testing. Together, these markers offer a favorable cost–benefit profile for identifying high-risk COPD patients and tailoring interventions aimed at improving nutritional status, immune competence, and long-term survival. Overall, these findings reinforce the concept of COPD as a systemic disease in which metabolic status, immune regulation, and viral surveillance interact dynamically to shape clinical outcomes.
Strengths and Limitations
This study has several strengths. First, it provides a multidimensional characterization of patients with advanced COPD integrating clinical, functional, inflammatory, oxidative, immunological, and virological parameters within the same cohort. This comprehensive approach enabled exploration of the complex interactions between BMI, systemic inflammation, immune competence, and viral burden moving beyond the traditional evaluation of anthropometric measures alone. Second, the study incorporates detailed immune profiling and systemic inflammatory indices (NLR, PLR, MLR, SII, SIRI, and AISI), together with Torque Teno virus (TTV) viremia, an emerging biomarker of immune competence. The integration of these parameters allowed the identification of immune-inflammatory and virological markers associated with prognosis highlighting determinants that extend beyond BMI.
However, several limitations should be acknowledged. First, this was a single-center observational cohort study conducted in a relatively small sample of 70 elderly patients with advanced COPD, of whom only 20 had a BMI ≥30 kg/m². This limited sample size, particularly within the obesity subgroup, may have reduced the statistical power to detect differences in clinical outcomes and may affect the generalizability of the findings.
Second, BMI was used as the primary anthropometric measure and does not distinguish between fat mass and lean body mass, thereby limiting the interpretation of body composition effects. In particular, the absence of a comprehensive body composition assessment may have prevented a more accurate characterization of the relationship between adiposity, muscle mass, and clinical outcomes. However, it should be noted that this study was conducted in a real-world pulmonary rehabilitation setting, and detailed body composition analyses are not routinely performed in clinical practice within the regional rehabilitation pathways currently adopted according to Lazio Regional Health Service guidelines [84].
Furthermore, because lymphocyte immunophenotyping was performed on thawed samples and, in some cases, the number of viable cells recovered after thawing was insufficient for analysis, lymphocyte subset characterization could only be performed in a subset of 50 patients. This may have reduced the statistical power of the immunological analyses and increased the risk of type II error.
In addition, adjustment for potential confounding factors was necessarily limited by the sample size, and residual confounding cannot be excluded. Finally, the cohort consisted predominantly of elderly patients with advanced COPD (GOLD stages 3–4), which may limit the applicability of these findings to younger populations or to patients with milder stages of the disease.
Despite these limitations, this study offers preliminary insights into the complex relationships among body mass, immune-inflammatory status, and viral burden in elderly patients with advanced COPD. Our findings suggest that immune-inflammatory and virological biomarkers may be associated with biological vulnerability more consistently than BMI alone. While the observed immunological, biochemical, and virological profiles are broadly consistent with the concept of an “obesity paradox,” these differences were not accompanied by significant survival advantages across BMI categories in this cohort. Given the exploratory nature of the study and its limited sample size, these observations should be interpreted cautiously. Nevertheless, they highlight the potential value of integrating virological and immune-inflammatory markers with traditional clinical assessments to improve patient characterization and risk stratification in advanced COPD.
5. Conclusions and Future Directions
In this cohort study of 70 elderly patients with advanced COPD, including 20 individuals with a BMI ≥30 kg/m², viral burden—particularly elevated Torque teno virus (TTV) load—and immune-inflammatory markers such as the platelet-to-lymphocyte ratio (PLR) appeared to be associated with biological vulnerability more consistently than BMI alone. Although patients with higher BMI tended to exhibit a more favorable immune-inflammatory and virological profile, these differences were not accompanied by significant survival advantages during follow-up.
Markers of oxidative stress and DNA damage were elevated across the cohort, suggesting that the systemic burden associated with advanced COPD may partially outweigh potential BMI-related influences on clinical outcomes. In this context, our findings are consistent with the hypothesis that the so-called “obesity paradox” in COPD may be context-dependent. While higher BMI was associated with more favorable immunological and virological characteristics, this pattern did not translate into measurable survival benefits in the present population.
Taken together, these observations suggest that immune competence and viral burden may contribute to the heterogeneity of clinical outcomes in advanced COPD and might provide complementary information beyond traditional anthropometric measures. From a rehabilitation perspective, these findings further suggest that BMI alone may not fully capture the biological complexity and vulnerability of patients undergoing pulmonary rehabilitation. The integration of immune-inflammatory and virological parameters into clinical assessment could help improve patient phenotyping and identify subgroups with differing degrees of physiological reserve and risk.
However, these findings should be interpreted with caution given the observational cohort design, the relatively small sample size, and the limited number of patients with obesity. These factors may have reduced the statistical power to detect differences in survival outcomes and limit the generalizability of the results. Moreover, the study was not specifically designed to evaluate the impact of obesity on mortality.
Further prospective studies involving larger and more balanced cohorts are warranted to clarify the complex interplay among body composition, immune competence, systemic inflammation, oxidative stress, and viral burden in COPD. The integration of viral monitoring, immune profiling, and more detailed assessments of body composition may help refine patient characterization and support the development of more personalized clinical and rehabilitation strategies in advanced COPD.
Author Contributions
Conceptualization. L.V., P.R.. and S.B..; methodology. L.V., D.L., C.P., S.P..; software. S.P..; validation. S.P..; formal analysis. S.P..; investigation. L.V., D.L., C.P., S.P.; resources. G.A, P.R..; data curation. L.V., C.M; writing—original draft preparation. L.V., P.R..; writing—review and editing. L.V., P.R., S.B., M. C., G.A, F.M..; supervision. S.B..; project administration. P.R, D.L..; funding acquisition. G.A., P.R., D.L. All authors have read and agreed to the published version of the manuscript.
Funding
PRIN: PROGETTI DI RICERCA DI RILEVANTE INTERESSE NAZIONALE–: TTV-virome prediction of dysregulated Immunity and clinical differential diagnosis, [B53D23003760006/G53D23000700001]] awarded by Ministero dell’Università e della Ricerca. The work of L.V., P.R., D.L.C.P., P.F. and S.B. was supported by current research funding from the Ministry of Health [Ricerca Corrente], Rome, Italy.
Institutional Review Board Statement
The study was approved by the ethics committee of the IRCCS San Raffaele Roma [Prot. 15/2013] on September 2nd 2013. The study was conducted in accordance with the Declaration of Helsinki. Informed Consent Statement: Informed consent was obtained from all subjects involved in the study.
Data Availability Statement
The data that support the findings of this study are openly available in Zenodo at https://doi.org/10.5281/zenodo.18386515.
Acknowledgments
During the preparation of this manuscript we used ChatGPT plus (GPT-5.5), for the purposes of improving and refining of the iconography in Figure 2 based on our previous development and design work. The authors have reviewed and edited the out-put and take full responsibility for the content of this publication.
Conflicts of Interest
The authors declare no conflicts of interest.:
Abbreviations
The following abbreviations are used in this manuscript:
| 6MWT | 6 Minutes walking Test |
| 8-OHdG | 8’-hydroxy-2’-deoxyguanosine |
| Ad11 | Adenovirus 11 |
| Ad34 | Adenovirus 34 |
| Ad35 | Adenovirus 35 |
| ADL | Activities of Daily Living |
| AISI | Aggregate Index of Systemic Inflammation |
| ALBI | Albumin-Bilirubin Score |
| ALT | alanine aminotransferase |
| AST | aspartate aminotransferase |
| BDI-II | Beck Depression Inventory-II |
| BKPyV | BK Polyoma Virus |
| BMI | Body Mass Index |
| CD | Cluster of Differentiation |
| CES-D | Center for Epidemiologic Studies Depression Scale |
| CIRS | Cumulative Illness Rating Scale |
| CMV | Cytomegalovirus |
| COPD | Chronic Obstructive Pulmonary Disease |
| CRP | C reactive protein |
| DMSO | Dimethylsulfoxide |
| EBV | Epstein Barr Virus |
| ESR | Erythrosedimentation rate |
| FBS | Foetal Bovine Serum |
| FEV1/FVC% | Forced Expiratory Volume in 1 second/Forced Vital Capacity |
| GT | gamma- glutamyl transferase |
| GOLD | Global initiative for chronic Obstructive Lung Diseases |
| HHV-6 | Human Herpes Virus-6 |
| HHV-7 | Human Herpes Virus-7 |
| HSV-1 | Human Herpes Simples-1 |
| IADL | Instrumental Activities of Daily Living |
| IL-6 | interleukine-6 |
| JCPyV | JC Polyoma Virus |
| MDA | malondialdehyde |
| MLR | Monocytes to Lymphocytes Ratio |
| MMSE | Mini-Mental State Examination |
| MRC | modified Medical Research Council (Dyspnoea Scale) |
| MRF-26 | Maugeri Respiratory Failure 26 questions; |
| NLR | Neutrophils to Lymphocytes Ratio |
| PALBI | Platelet-Albumin-Bilirubin Score |
| PBMC | Peripheral Blood Mononuclear Cells |
| PBS | Phosphate Buffered Saline |
| PLR | Platelets to Lymphocytes Ratio |
| PLT | platelets |
| PR | Pulmonary Rehabilitation |
| QoL | Quality of Life |
| RBC | Red Blood Cells |
| SF-36 | 36-Item Short Form Health Survey—General Health domain; |
| SII | Systemic Immune Inflammation Index |
| SIRI | Systemic Inflammation Response Index |
| TTV | Torque Teno Virus |
| VZV | Varicella Zoster Virus |
| WBC | white blood cells |
| ZUNG | Zung Self-Rating Depression Scale |
References
- Ng, M.; Gakidou, E.; Lo, J.; Abate, Y.H.; Abbafati, C.; Abbas, N.; Abbasian, M.; Abd ElHafeez, S.; Abdel-Rahman, W.M.; Abd-Elsalam, S.; et al. Global, Regional, and National Prevalence of Adult Overweight and Obesity, 1990–2021, with Forecasts to 2050: A Forecasting Study for the Global Burden of Disease Study 2021. The Lancet 2025, 405, 813–838. [CrossRef]
- Edwards, C.H.; Aas, E.; Kinge, J.M. Body Mass Index and Lifetime Healthcare Utilization. BMC Health Serv Res 2019, 19, 696. [CrossRef]
- Nyberg, S.T.; Frank, P.; Ahmadi-Abhari, S.; Pentti, J.; Vahtera, J.; Ervasti, J.; Suominen, S.B.; Strandberg, T.E.; Sipilä, P.N.; Meri, S.; et al. Adult Obesity and Risk of Severe Infections: A Multicohort Study with Global Burden Estimates. The Lancet 2026, 407, 951–962. [CrossRef]
- Gao, M.; Piernas, C.; Astbury, N.M.; Hippisley-Cox, J.; O’Rahilly, S.; Aveyard, P.; Jebb, S.A. Associations between Body-Mass Index and COVID-19 Severity in 6·9 Million People in England: A Prospective, Community-Based, Cohort Study. The Lancet Diabetes & Endocrinology 2021, 9, 350–359. [CrossRef]
- Muscogiuri, G.; Pugliese, G.; Laudisio, D.; Castellucci, B.; Barrea, L.; Savastano, S.; Colao, A. The Impact of Obesity on Immune Response to Infection: Plausible Mechanisms and Outcomes. Obesity Reviews 2021, 22, e13216. [CrossRef]
- Fröhlich, E. The Effects of Obesity on Lung Physiology, the Prevalence and Severity of Chronic Pulmonary Diseases, and Inhalation Treatment. DDDT 2025, Volume 19, 11885–11900. [CrossRef]
- Vozoris, N.T.; Stanbrook, M.B. Smoking Prevalence, Behaviours, and Cessation among Individuals with COPD or Asthma. Respiratory Medicine 2011, 105, 477–484. [CrossRef]
- Fuller-Thomson, E.; Howden, K.E.N.; Fuller-Thomson, L.R.; Agbeyaka, S. A Strong Graded Relationship between Level of Obesity and COPD: Findings from a National Population-Based Study of Lifelong Nonsmokers. Journal of Obesity 2018, 2018, 1–9. [CrossRef]
- Martin, M.; Almeras, N.; Després, J.-P.; Coxson, H.; Washko, G.; Vivodtzev, I.; Wouters, E.; Rutten, E.; Williams, M.; Murchison, J.; et al. Ectopic Fat Accumulation in Patients with COPD: An ECLIPSE Substudy. COPD 2017, Volume 12, 451–460. [CrossRef]
- Zerah, F.; Harf, A.; Perlemuter, L.; Lorino, H.; Lorino, A.-M.; Atlan, G. Effects of Obesity on Respiratory Resistance. Chest 1993, 103, 1470–1476. [CrossRef]
- Jones, R.L.; Nzekwu, M.-M.U. The Effects of Body Mass Index on Lung Volumes. Chest 2006, 130, 827–833. [CrossRef]
- Littleton, S.W.; Tulaimat, A. The Effects of Obesity on Lung Volumes and Oxygenation. Respiratory Medicine 2017, 124, 15–20. [CrossRef]
- McGinn, E.A.; Mandell, E.W.; Smith, B.J.; Duke, J.W.; Bush, A.; Abman, S.H. Dysanapsis as a Determinant of Lung Function in Development and Disease. American Journal of Respiratory and Critical Care Medicine 2023, 208, 956–963. [CrossRef]
- Green, M.; Mead, J.; Turner, J.M. Variability of Maximum Expiratory Flow-Volume Curves. Journal of Applied Physiology 1974, 37, 67–74. [CrossRef]
- Elliot, J.G.; Donovan, G.M.; Wang, K.C.W.; Green, F.H.Y.; James, A.L.; Noble, P.B. Fatty Airways: Implications for Obstructive Disease. Eur Respir J 2019, 54, 1900857. [CrossRef]
- Wang, C.J.; Noble, P.B.; Elliot, J.G.; Choi, Y.S.; James, A.L.; Wang, K.C.W. Distribution, Composition, and Activity of Airway-Associated Adipose Tissue in the Porcine Lung. American Journal of Physiology-Lung Cellular and Molecular Physiology 2023, 324, L179–L189. [CrossRef]
- Lestari, I.P.; Chozin, I.N.; Sartono, T.R.; Sasiarini, L.; Yudhanto, H.S. Effect of a High-Calorie Diet on pro- to Anti-Inflammatory Macrophage Ratio through Fat Accumulation in Rat Lung Tissue. Med J Indones 2024, 32, 212–216. [CrossRef]
- Torday, J.S.; Powell, F.L.; Farmer, C.G.; Orgeig, S.; Nielsen, H.C.; Hall, A.J. Leptin Integrates Vertebrate Evolution: From Oxygen to the Blood–Gas Barrier. Respiratory Physiology & Neurobiology 2010, 173, S37–S42. [CrossRef]
- Lv, Y.-Q.; Dhlamini, Q.; Chen, C.; Li, X.; Bellusci, S.; Zhang, J.-S. FGF10 and Lipofibroblasts in Lung Homeostasis and Disease: Insights Gained From the Adipocytes. Front. Cell Dev. Biol. 2021, 9, 645400. [CrossRef]
- Tanaka, Y.; Fujisawa, T.; Yazawa, S.; Ohta, I.; Takaku, Y.; Ito, M.; Inoue, Y.; Yasui, H.; Hozumi, H.; Karayama, M.; et al. Obesity Impairs Ciliary Function and Mucociliary Clearance in the Murine Airway Epithelium. American Journal of Physiology-Lung Cellular and Molecular Physiology 2024, 327, L406–L414. [CrossRef]
- Hornung, F.; Rogal, J.; Loskill, P.; Löffler, B.; Deinhardt-Emmer, S. The Inflammatory Profile of Obesity and the Role on Pulmonary Bacterial and Viral Infections. IJMS 2021, 22, 3456. [CrossRef]
- Oppenheimer, B.W.; Berger, K.I.; Ali, S.; Segal, L.N.; Donnino, R.; Katz, S.; Parikh, M.; Goldring, R.M. Pulmonary Vascular Congestion: A Mechanism for Distal Lung Unit Dysfunction in Obesity. PLoS ONE 2016, 11, e0152769. [CrossRef]
- Whitsett, J.A. Airway Epithelial Differentiation and Mucociliary Clearance. Annals of the American Thoracic Society 2018, 15, S143–S148. [CrossRef]
- Watanabe, K.; Suzukawa, M.; Arakawa, S.; Kobayashi, K.; Igarashi, S.; Tashimo, H.; Nagai, H.; Tohma, S.; Nagase, T.; Ohta, K. Leptin Enhances Cytokine/Chemokine Production by Normal Lung Fibroblasts by Binding to Leptin Receptor. Allergology International 2019, 68, S3–S8. [CrossRef]
- Ihrie, M.D.; McQuade, V.L.; Womble, J.T.; Hegde, A.; McCravy, M.S.; Lacuesta, C.V.G.; Tighe, R.M.; Que, L.G.; Walker, J.K.L.; Ingram, J.L. Exogenous Leptin Enhances Markers of Airway Fibrosis in a Mouse Model of Chronic Allergic Airways Disease. Respir Res 2022, 23, 131. [CrossRef]
- Bidan, C.M.; Veldsink, A.C.; Meurs, H.; Gosens, R. Airway and Extracellular Matrix Mechanics in COPD. Front. Physiol. 2015, 6. [CrossRef]
- Peters, U.; Dixon, A.E.; Forno, E. Obesity and Asthma. Journal of Allergy and Clinical Immunology 2018, 141, 1169–1179. [CrossRef]
- Salome, C.M.; King, G.G.; Berend, N. Physiology of Obesity and Effects on Lung Function. Journal of Applied Physiology 2010, 108, 206–211. [CrossRef]
- Plopper, C.G.; Nishio, S.J.; Schelegle, E.S. Tethering Tracheobronchial Airways within the Lungs. American Journal of Respiratory and Critical Care Medicine 2003, 167, 2–3. [CrossRef]
- Srikanthan, P.; Seeman, T.E.; Karlamangla, A.S. Waist-Hip-Ratio as a Predictor of All-Cause Mortality in High-Functioning Older Adults. Annals of Epidemiology 2009, 19, 724–731. [CrossRef]
- Masa, J.F.; Pépin, J.-L.; Borel, J.-C.; Mokhlesi, B.; Murphy, P.B.; Sánchez-Quiroga, M.Á. Obesity Hypoventilation Syndrome. Eur Respir Rev 2019, 28, 180097. [CrossRef]
- Franssen, F.M.E.; O’Donnell, D.E.; Goossens, G.H.; Blaak, E.E.; Schols, A.M.W.J. Obesity and the Lung: 5 {middle Dot} Obesity and COPD. Thorax 2008, 63, 1110–1117. [CrossRef]
- Zhang, S.; Lin, Y.; Fang, Z.; Wu, X.; Jiang, J.; Zeng, Y.; Liu, J.; Li, J.; Wang, K.; Song, X.; et al. Association between Visceral Adiposity Index and Chronic Obstructive Pulmonary Disease: A Cross-Sectional Analysis. Science Progress 2025, 108, 00368504251406570. [CrossRef]
- Jee, S.H.; Sull, J.W.; Park, J.; Lee, S.-Y.; Ohrr, H.; Guallar, E.; Samet, J.M. Body-Mass Index and Mortality in Korean Men and Women. N Engl J Med 2006, 355, 779–787. [CrossRef]
- Landbo, C.; Prescott, E.; Lange, P.; Vestbo, J.; Almdal, T.P. Prognostic Value of Nutritional Status in Chronic Obstructive Pulmonary Disease. American Journal of Respiratory and Critical Care Medicine 1999, 160, 1856–1861. [CrossRef]
- Purcell, M.; Ackland, J.; Staples, K.J.; Freeman, A.; Wilkinson, T.M.A. The Respiratory Tract Virome: Unravelling the Role of Viral Dark Matter in Respiratory Health and Disease. Eur Respir Rev 2025, 34, 240284. [CrossRef]
- Morgan, O.W.; Bramley, A.; Fowlkes, A.; Freedman, D.S.; Taylor, T.H.; Gargiullo, P.; Belay, B.; Jain, S.; Cox, C.; Kamimoto, L.; et al. Morbid Obesity as a Risk Factor for Hospitalization and Death Due to 2009 Pandemic Influenza A(H1N1) Disease. PLoS ONE 2010, 5, e9694. [CrossRef]
- Louie, J.K.; Acosta, M.; Samuel, M.C.; Schechter, R.; Vugia, D.J.; Harriman, K.; Matyas, B.T.; the California Pandemic (H1N1) Working Group A Novel Risk Factor for a Novel Virus: Obesity and 2009 Pandemic Influenza A (H1N1). Clinical Infectious Diseases 2011, 52, 301–312. [CrossRef]
- Van Kerkhove, M.D.; Mounts, A.W.; Mall, S.; Vandemaele, K.A.H.; Chamberland, M.; Dos Santos, T.; Fitzner, J.; Widdowson, M.-A.; Michalove, J.; Bresee, J.; et al. Epidemiologic and Virologic Assessment of the 2009 Influenza A (H1N1) Pandemic on Selected Temperate Countries in the Southern Hemisphere: Argentina, Australia, Chile, New Zealand and South Africa: Southern Hemisphere H1N1pdm. Influenza and Other Respiratory Viruses 2011, 5, e487–e498. [CrossRef]
- Coleman, L.A.; Waring, S.C.; Irving, S.A.; Vandermause, M.; Shay, D.K.; Belongia, E.A. Evaluation of Obesity as an Independent Risk Factor for Medically Attended Laboratory-confirmed Influenza. Influenza Resp Viruses 2013, 7, 160–167. [CrossRef]
- Cilloniz, C.; Luna, C.M.; Hurtado, J.C.; Marcos, M.Á.; Torres, A. Respiratory Viruses: Their Importance and Lessons Learned from COVID-19. Eur Respir Rev 2022, 31, 220051. [CrossRef]
- Focosi, D.; Antonelli, G.; Pistello, M.; Maggi, F. Torquetenovirus: The Human Virome from Bench to Bedside. Clinical Microbiology and Infection 2016, 22, 589–593. [CrossRef]
- Maggi, F.; Bendinelli, M. Human Anelloviruses and the Central Nervous System. Reviews in Medical Virology 2010, 20, 392–407. [CrossRef]
- Görzer, I.; Haloschan, M.; Jaksch, P.; Klepetko, W.; Puchhammer-Stöckl, E. Plasma DNA Levels of Torque Teno Virus and Immunosuppression after Lung Transplantation. The Journal of Heart and Lung Transplantation 2014, 33, 320–323. [CrossRef]
- Albert, E.; Solano, C.; Giménez, E.; Focosi, D.; Pérez, A.; Macera, L.; Piñana, J.L.; Boluda, J.C.H.; Maggi, F.; Navarro, D. The Kinetics of Torque Teno Virus Plasma DNA Load Shortly after Engraftment Predicts the Risk of High-Level CMV DNAemia in Allogeneic Hematopoietic Stem Cell Transplant Recipients. Bone Marrow Transplant 2018, 53, 180–187. [CrossRef]
- Fernández-Ruiz, M.; Albert, E.; Giménez, E.; Ruiz-Merlo, T.; Parra, P.; López-Medrano, F.; San Juan, R.; Polanco, N.; Andrés, A.; Navarro, D.; et al. Monitoring of Alphatorquevirus DNA Levels for the Prediction of Immunosuppression-Related Complications after Kidney Transplantation. American Journal of Transplantation 2019, 19, 1139–1149. [CrossRef]
- Vitiello, L.; Proietti, S.; Limongi, D.; Prezioso, C.; Checconi, P.; Fortugno, P.; Quaranta, M.; Maggi, F.; Antonelli, G.; Bonassi, S.; et al. TTV Virome Marks Immune Exhaustion, α7nAChR Alteration, and Mortality in Elderly Patients with Severe COPD. GeroScience 2026. [CrossRef]
- Ilari, S.; Vitiello, L.; Russo, P.; Proietti, S.; Milić, M.; Muscoli, C.; Cardaci, V.; Tomino, C.; Bonassi, G.; Bonassi, S. Daily Vegetables Intake and Response to COPD Rehabilitation. The Role of Oxidative Stress, Inflammation and DNA Damage. Nutrients 2021, 13, 2787. [CrossRef]
- Bonassi, S.; Ceppi, M.; Møller, P.; Azqueta, A.; Milić, M.; Neri, M.; Brunborg, G.; Godschalk, R.; Koppen, G.; Langie, S.A.S.; et al. DNA Damage in Circulating Leukocytes Measured with the Comet Assay May Predict the Risk of Death. Sci Rep 2021, 11, 16793. [CrossRef]
- Milić, M.; Ceppi, M.; Bruzzone, M.; Azqueta, A.; Brunborg, G.; Godschalk, R.; Koppen, G.; Langie, S.; Møller, P.; Teixeira, J.P.; et al. The hCOMET Project: International Database Comparison of Results with the Comet Assay in Human Biomonitoring. Baseline Frequency of DNA Damage and Effect of Main Confounders. Mutation Research/Reviews in Mutation Research 2021, 787, 108371. [CrossRef]
- Brucklacher-Waldert, V.; Steinbach, K.; Lioznov, M.; Kolster, M.; Hölscher, C.; Tolosa, E. Phenotypical Characterization of Human Th17 Cells Unambiguously Identified by Surface IL-17A Expression. The Journal of Immunology 2009, 183, 5494–5501. [CrossRef]
- Coursey, T.G.; Gandhi, N.B.; Volpe, E.A.; Pflugfelder, S.C.; De Paiva, C.S. Chemokine Receptors CCR6 and CXCR3 Are Necessary for CD4+ T Cell Mediated Ocular Surface Disease in Experimental Dry Eye Disease. PLoS ONE 2013, 8, e78508. [CrossRef]
- Ali, S.; Fevery, J.; Peerlinck, K.; Verslype, C.; Schelstraete, R.; Gyselinck, F.; Emonds, M.; Vermylen, J.; Hiem Yap, S. TTV Infection and Its Relation to Serum Transaminases in Apparently Healthy Blood Donors and in Patients with Clotting Disorders Who Have Been Investigated Previously for Hepatitis C Virus and GBV-C/HGV Infection in Belgium. Journal of Medical Virology 2002, 66, 561–566. [CrossRef]
- Russo, P.; Milani, F.; Limongi, D.; Prezioso, C.; Novazzi, F.; Ferrante, F.D.; Maggi, F.; Antonelli, G.; Bonassi, S. The Effect of Torque Teno Virus (TTV) Infection on Clinical Outcomes, Genomic Integrity, and Mortality in COPD Patients. Mechanisms of Ageing and Development 2025, 224, 112024. [CrossRef]
- Focosi, D.; Spezia, P.G.; Macera, L.; Salvadori, S.; Navarro, D.; Lanza, M.; Antonelli, G.; Pistello, M.; Maggi, F. Assessment of Prevalence and Load of Torquetenovirus Viraemia in a Large Cohort of Healthy Blood Donors. Clinical Microbiology and Infection 2020, 26, 1406–1410. [CrossRef]
- Giacconi, R.; Maggi, F.; Macera, L.; Pistello, M.; Provinciali, M.; Giannecchini, S.; Martelli, F.; Spezia, P.G.; Mariani, E.; Galeazzi, R.; et al. Torquetenovirus (TTV) Load Is Associated with Mortality in Italian Elderly Subjects. Experimental Gerontology 2018, 112, 103–111. [CrossRef]
- Russo, P.; Milani, F.; De Iure, A.; Proietti, S.; Limongi, D.; Prezioso, C.; Checconi, P.; Zagà, V.; Novazzi, F.; Maggi, F.; et al. Effect of Cigarette Smoking on Clinical and Molecular Endpoints in COPD Patients. IJMS 2024, 25, 5834. [CrossRef]
- Yao, S.; Zeng, L.; Wang, F.; Chen, K. Obesity Paradox in Lung Diseases: What Explains It? Obes Facts 2023, 16, 411–426. [CrossRef]
- Chittal, P.; Babu, A.S.; Lavie, C.J. Obesity Paradox: Does Fat Alter Outcomes in Chronic Obstructive Pulmonary Disease? COPD: Journal of Chronic Obstructive Pulmonary Disease 2015, 12, 14–18. [CrossRef]
- Body-Mass Index and Mortality in Korean Men and Women. N Engl J Med 2006, 355, 2701–2702. [CrossRef]
- Cao, C.; Wang, R.; Wang, J.; Bunjhoo, H.; Xu, Y.; Xiong, W. Body Mass Index and Mortality in Chronic Obstructive Pulmonary Disease: A Meta-Analysis. PLoS ONE 2012, 7, e43892. [CrossRef]
- Gorecka, D.; Gorzelak, K.; Sliwinski, P.; Tobiasz, M.; Zielinski, J. Effect of Long-Term Oxygen Therapy on Survival in Patients with Chronic Obstructive Pulmonary Disease with Moderate Hypoxaemia. Thorax 1997, 52, 674–679. [CrossRef]
- Blum, A.; Simsolo, C.; Sirchan, R.; Haiek, S. “Obesity Paradox” in Chronic Obstructive Pulmonary Disease. Isr Med Assoc J 2011, 13, 672–675.
- Brigham, E.P.; Anderson, J.A.; Brook, R.D.; Calverley, P.M.A.; Celli, B.R.; Cowans, N.J.; Crim, C.; Diserens, J.E.; Martinez, F.J.; McCormack, M.C.; et al. Challenging the Obesity Paradox: Extreme Obesity and COPD Mortality in the SUMMIT Trial. ERJ Open Res 2021, 7, 00902–02020. [CrossRef]
- Sun, Y.; Milne, S.; Jaw, J.E.; Yang, C.X.; Xu, F.; Li, X.; Obeidat, M.; Sin, D.D. BMI Is Associated with FEV1 Decline in Chronic Obstructive Pulmonary Disease: A Meta-Analysis of Clinical Trials. Respir Res 2019, 20, 236. [CrossRef]
- Wagner, P.D. Possible Mechanisms Underlying the Development of Cachexia in COPD. Eur Respir J 2008, 31, 492–501. [CrossRef]
- Yu, X.-Y.; Song, P.; Zou, M.-H. Obesity Paradox and Smoking Gun: A Mystery of Statistical Confounding? Circulation Research 2018, 122, 1642–1644. [CrossRef]
- Carbone, S.; Lavie, C.J.; Arena, R. Obesity and Heart Failure: Focus on the Obesity Paradox. Mayo Clinic Proceedings 2017, 92, 266–279. [CrossRef]
- Marquis, K.; Debigaré, R.; Lacasse, Y.; LeBlanc, P.; Jobin, J.; Carrier, G.; Maltais, F. Midthigh Muscle Cross-Sectional Area Is a Better Predictor of Mortality than Body Mass Index in Patients with Chronic Obstructive Pulmonary Disease. American Journal of Respiratory and Critical Care Medicine 2002, 166, 809–813. [CrossRef]
- Wouters, E.F.M. Obesity and Metabolic Abnormalities in Chronic Obstructive Pulmonary Disease. Annals of the American Thoracic Society 2017, 14, S389–S394. [CrossRef]
- Sweatt, K.; Garvey, W.T.; Martins, C. Correction: Strengths and Limitations of BMI in the Diagnosis of Obesity: What Is the Path Forward? Curr Obes Rep 2024, 13, 831–831. [CrossRef]
- Khudhur, Z.O.; Smail, S.W.; Awla, H.K.; Ahmed, G.B.; Khdhir, Y.O.; Amin, K.; Janson, C. The Effects of Heavy Smoking on Oxidative Stress, Inflammatory Biomarkers, Vascular Dysfunction, and Hematological Indices. Sci Rep 2025, 15, 18251. [CrossRef]
- Rabrenović, V.; Petrović, M.; Rabrenović, M.; Pilčević, D.; Rančić, N. The Significance of Biomarkers of Inflammation in Predicting the Activity of Lupus Nephritis. J Med Biochemistry 2024, 43, 116–125. [CrossRef]
- Hu, B.; Yang, X.-R.; Xu, Y.; Sun, Y.-F.; Sun, C.; Guo, W.; Zhang, X.; Wang, W.-M.; Qiu, S.-J.; Zhou, J.; et al. Systemic Immune-Inflammation Index Predicts Prognosis of Patients after Curative Resection for Hepatocellular Carcinoma. Clinical Cancer Research 2014, 20, 6212–6222. [CrossRef]
- Zinellu, A.; Collu, C.; Nasser, M.; Paliogiannis, P.; Mellino, S.; Zinellu, E.; Traclet, J.; Ahmad, K.; Mangoni, A.A.; Carru, C.; et al. The Aggregate Index of Systemic Inflammation (AISI): A Novel Prognostic Biomarker in Idiopathic Pulmonary Fibrosis. JCM 2021, 10, 4134. [CrossRef]
- Jia, S.; Chen, Q.; Huang, W.; Wang, P.; Zeng, Y. Relationship between Systemic Immune Response Index (SIRI) and COPD: A Cross-Sectional Study Based on NHANES 2007–2012. Sci Rep 2025, 15, 7887. [CrossRef]
- Song, N.; Elbahnasawy, M.A.; Weng, N.-P. General and Individualized Changes in T Cell Immunity during Aging. The Journal of Immunology 2025, 214, 872–879. [CrossRef]
- Trim, W.V.; Lynch, L. Immune and Non-Immune Functions of Adipose Tissue Leukocytes. Nat Rev Immunol 2022, 22, 371–386. [CrossRef]
- Tilg, H.; Ianiro, G.; Gasbarrini, A.; Adolph, T.E. Adipokines: Masterminds of Metabolic Inflammation. Nat Rev Immunol 2025, 25, 250–265. [CrossRef]
- Babakhani, K.; Kucinskas, A.L.; Ye, X.; Giles, E.D.; Sun, Y. Aging Immunity: Unraveling the Complex Nexus of Diet, Gut Microbiome, and Immune Function. Immunometabolism 2025, 7, e00061. [CrossRef]
- Curtis, M.; Swan, L.; Fox, R.; Warters, A.; O’Sullivan, M. Associations between Body Mass Index and Probable Sarcopenia in Community-Dwelling Older Adults. Nutrients 2023, 15, 1505. [CrossRef]
- Badillo-Pazmay, G.V.; Fortunato, C.; Cianfruglia, L.; Novazzi, F.; Spezia, P.G.; Rosa, L.; Limongi, D.; Prezioso, C.; D’Argenio, V.; Scudiero, O.; et al. The Gut and Circulating Virome: Emerging Players in Aging and Longevity. Front. Aging 2026, 6, 1731621. [CrossRef]
- Lv, P.; Zhao, X.; Zhang, H.; Lu, Q.; Liang, X. Nomogram Integrating Inflammatory Biomarkers Predicts Chronic Obstructive Pulmonary Disease Exacerbation Post-Rehabilitation. BMC Pulm Med 2026, 26, 115. [CrossRef]
- Lazio Regional Health Service guidelines Riorganizzazione Dei Percorsi Riabilitativi in Ambito Ospedaliero e Territoriale; 2016;
Figure 1.
Kaplan–Meier survival curve according to BMI category .

Figure 2.
Proposed biological mechanisms linking BMI, immune function, inflammation, functional status, and survival in advanced COPD.
Figure 2.
Proposed biological mechanisms linking BMI, immune function, inflammation, functional status, and survival in advanced COPD.


Table 1.
Demographical and clinical features of COPD patients, stratified by BMI.
| Variable | All patients |
BMI<30 50 (71.4%) |
BMI>30 20(28.6%) |
p value |
| Age at admission | 70.5 ± 8.3 | 71.8 ± 8.6 | 67.2 ± 6.8 | 0.033 |
| Sex (F/M) | 34/36 | 23/27 | 11/9 | 0.677 |
| BMI | 27.3 ± 7.9 | 23.3 ± 3.5 | 37.1 ± 7.2 | <0.001 |
|
Education (years) 5 8 10-18 |
22 (31.4%) 23 (32.8%) 25 (35.7%) |
16 (32%) 15 (30%) 19 (38%) |
6 (20%) 8 (40%) 6 (20%) |
0.782 |
|
Smoking Current Former Never |
29 (41.4%) 32 (45.7%) 9 (12.9%) |
22 (44%) 22 (44%) 6 (12%) |
7 (35%) 10 (50%) 3 (15%) |
0.782 |
| Clinical features | ||||
| 6MWT (m) | 107.43 ± 85.40 | 102.20 ± 85.9 | 120.50 ± 84.7 | 0.422 |
| Barthel Index (normal value 100) | 73.2 ± 19.0 | 72.9 ± 18.3 | 73.2 ± 19.0 | 0.849 |
| Borg Scale | 7.81 ± 0.9 | 7.86 ± 0.9 | 7.70 ±0.9 | 0.508 |
| MRC | 4.0±0.0 | 4.0±0.0 | 4.0±0.0 | -- |
| MRF-26 | 71.4 ± 14.4 | 70.9 ± 15.2 | 72.8 ± 12.2 | 0.635 |
| StGeorge Score (%) | 47.3 ± 15.9 | 45.9 ± 14.9 | 51.1 ± 18.0 | 0.246 |
| FEV1/FVC% | 47.2 ± 22.4 | 43.4 ± 20.7 | 55.6 ±24.5 | 0.09 |
| CIRS severity | 1.5 ± 0.2 | 1.5 ± 0.2 | 1.5 ± 0.2 | 0.663 |
| CIRS comorbidity | 2.5 ± 1.3 | 2.4 ± 1.3 | 2.7 ± 1.5 | 0.414 |
| Survival (days) | 677.5 ± 493.5 | 714.22 ± 564.8 | 607.2 ± 493.5 | 0.550 |
Variables were measured at patients’ admission. Abbreviations: 6MWT, six minutes walking test; MRC, modified Medical Research Council (Dyspnea Scale); MRF-26, Maugeri Respiratory Failure 26 questions; FEV1/FVC%, Forced Expiratory Volume in the first second / Forced Vital Capacity (ratio expressed as percentage); CIRS, Cumulative Illness Rating Scale.
Table 2.
Cognitive, psychological and QoL (Quality of Life) values, measured at patients’ admission.
Table 2.
Cognitive, psychological and QoL (Quality of Life) values, measured at patients’ admission.
| Variable | All patients |
BMI<30 50 (71.4%) |
BMI>30 20(28.6%) |
p value |
| ADL | 5.13 ± 1.5 | 5.2 ± 1.5 | 5.0 ± 1.6 | 0.671 |
| IADL | 12.0 ± 3.8 | 11.9 ± 4.2 | 12.1 ± 3.3 | 0.925 |
| MMSE | 27.1 ± 2.9 | 27.3 ± 2.9 | 26.7 ±3.1 | 0.479 |
| BDI-II | 11.2 ± 6.9 | 9.7 ± 4.9 | 16.0 ± 10.2 | 0.049 |
| CES-D | 11.6 ± 10.6 | 11.2 ± 6.9 | 10.9 ±10.2 | 0.453 |
| ZUNG | 29.4 ± 9.0 | 28.4 ± 8.1 | 32.1 ± 10.9 | 0.161 |
| SF-36 General Health (QoL) | 72.3 ± 12.5 | 73.5 ±12.6 | 68.9 ± 11.9 | 0.241 |
| SF-36 Mental Health (QoL) | 62.9 ± 9.9 | 63.6 ± 8.1 | 60.8 ± 14.1 | 0.379 |
Abbreviations: ADL, Activities of Daily Living; IADL, Instrumental Activities of Daily Living; MMSE, Mini-Mental State Examination; BDI-II, Beck Depression Inventory-II; CES-D, Center for Epidemiologic Studies Depression Scale; ZUNG, Zung Self-Rating Depression Scale; SF-36 General Health (QoL), 36-Item Short Form Health Survey—General Health domain; SF-36 Mental Health (QoL), 36-Item Short Form Health Survey—Mental Health domain.
Table 3.
DNA Damage and oxidative stress markers analysis.
| Variable | All patients |
BMI<30 50 (71.4%) |
BMI>30 20(28.6%) |
p value |
|
Comet Assay (Tail intensity) |
19.7 ± 7.6 | 19.6 ± 7.5 | 20.1 ± 8.2 | 0.826 |
|
MDA (Malondialdehyde) |
41.1 ± 12.7 | 41.5 ± 13.0 | 40.2 ± 12.5 | 0.767 |
|
8-hydroxy-2’ -deoxyguanosine (OH8dG) |
24.9 ± 11.7 | 25.4 ±12.6 | 23.9 ± 9.9 | 0.721 |
Table 4.
Blood analysis parameters.
| Variable | All patients |
BMI<30 50 (71.4%) |
BMI>30 20(28.6%) |
p value |
| RBC (x106/ml) | 4.4 ± 0.7 | 4.4 ± 0.7 | 4.5 ± 0.7 | 0.359 |
| Hgb (g/dL) | 12.8 ± 1.8 | 12.6 ± 1.8 | 13.4 ± 1.6 | 0.011 |
| PLT (x103/ml) | 259.9 ± 96.5 | 268.9 ± 105.0 | 237.7 ± 68.8 | 0.227 |
| WBC (x103/ml) | 10.7 ± 3.9 | 10.5 ± 3.9 | 11.2 ± 4.4 | 0.506 |
| Neutrophils (x103/ml) | 8.0 ± 3.6 | 8.2 ± 3.6 | 7.7 ± 3.5 | 0.636 |
| Eosinophils (x103/ml) | 0.1 ± 0.1 | 0.1 ± 0.1 | 0.1 ± 0.1 | 0.122 |
| Basophils (x103/ml) | 0.02 ± 0.02 | 0.02 ± 0.02 | 0.02 ± 0.02 | 0.433 |
| Lymphocytes (x103/ml) | 1.9 ± 1.7 | 1.5 ± 0.8 | 2.9 ± 2.7 | 0.001 |
| ESR mm/h | 28.5 ± 28.8 | 31.3 ± 30.3 | 21.6 ± 24.6 | 0.894 |
| Blood glucose (mg/dL) | 110.3 ± 54.6 | 109.0 ± 53.1 | 114.0 ±61.5 | 0.797 |
| Azotemia (mg/dL) | 54.8 ± 25.8 | 56.4 ± 28.9 | 51.2 ± 17.8 | 0.478 |
| Creatinine (mg/dL) | 0.9 ± 0.3 | 0.9 ± 0.3 | 0.9 ± 0.3 | 0.998 |
| ALT (UI/L) | 17.6 ± 9.7 | 16.4 ± 9.2 | 20.1 ± 10.7 | 0.269 |
| AST (UI/L) | 22.0 ± 12.5 | 20.3 ± 12.9 | 25.5 ± 11.3 | 0.229 |
| GT (UI/L) | 41.6 ± 42.7 | 38.9 ± 47.8 | 47.0 ± 30.9 | 0.586 |
| Albumin (g/dL) | 3.9 ± 0.4 | 3.8 ± 0.3 | 3.9 ± 0.5 | 0.324 |
Abbreviations: RBC, Red Blood Cells; PLT, platelets; WBC, white blood cells; ESR, erythro sedimentation rate; ALT, alanine aminotransferase; AST, aspartate aminotransferase; γGT, gamma- glutamyl transferase.
Table 5.
Inflammation markers.
| Variable | All patients |
BMI<30 50 (71.4%) |
BMI>30 20(28.6%) |
p value |
| IL-6 (pg/mL) | 113.1 ± 139.6 | 108.8 ± 136.4 | 124.5 ± 155.5 | 0.778 |
| CRP (mg/dL) | 1.4 ± 2.6 | 1.9 ± 3.2 | 0.5 ± 0.6 | 0.108 |
| LMR | 2.9 ± 2.2 | 2.7 ± 2.4 | 3.2 ± 1.8 | 0.382 |
| MLR | 0.06±0.08 | 0.07±0.07 | 0.05±0.09 | 0.066 |
| NLR | 5.6 ± 3.8 | 6.6 ± 4.1 | 3.3 ± 1.7 | 0.001 |
| PLR | 190.0 ± 141.7 | 222.9 ± 152.8 | 110.9 ± 61.2 | 0.002 |
| SII | 1520.7 ± 1400.9 | 1840.0 ± 1544.7 | 754.4 ± 376.7 | 0.003 |
| SIRI | 4.2 ± 3.9 | 4.8 ± 4.5 | 2.7 ± 1.3 | 0.046 |
| AISI | 1158.2 ± 1461 | 1385.1 ± 1686.8 | 625.2 ± 325.2 | 0.051 |
| ALBI | -2.7 ± 0.4 | -2.6 ± 0.3 | -2.6 ± 0.5 | 0.392 |
| PALBI score | -2.4 ± 0.4 | -2.4 ± 0.3 | -2.5 ± 0.5 | 0.232 |
Abbreviations: IL-6, interleukine-6; CRP, C reactive protein; LMR. Lymphocyte-to-Monocyte Ratio; NLR. Neutrophil-to-Lymphocyte Ratio; PLR. Platelet-to-Lymphocyte Ratio; SII. Systemic Immune-Inflammation Index; SIRI. Systemic Inflammation Response Index; AISI. Aggregate Index of Systemic Inflammation; ALBI. Albumin-Bilirubin Score; PALBI score. Platelet-Albumin-Bilirubin Score.
Table 6.
Immunophenotype of circulating T lymphocytes.
| Variable | All patients |
BMI<30 50 (71.4%) |
BMI>30 20(28.6%) |
p value |
| CD3+ T (number) |
1413.2 ± 1849.1 | 862.22 ± 607.7 | 2515.3 ± 2877.1 | 0.025 |
| CD3+ CD4+ T (number) | 841.9 ± 1049.6 | 538.2 ± 442.8 | 1449 ± 1594.1 | 0.030 |
| CD3+ CD8+T (number) | 410.9 ± 1049.6 | 227.3 ± 214.6 | 778.0 ± 1003.8 | 0.032 |
| CD3+ CD4+ CD25hi CD127-Treg (percentage) |
0.6 ± 0.8 | 0.7 ± 0.9 | 0.5 ± 0.5 | 0.725 |
| CD3+ CD4+ CD194+ CD196+ Th17 (percentage) | 15.0 ± 16.6 | 12.3 ± 12.5 | 20.4 ± 22.7 | 0.268 |
| Treg/Th17 ratio | 0.09± 0.16 | 0.11 ± 0.18 | 0.05 ± 0.09 | 0.450 |
Table 7.
Viremia in COPD patients. stratified by BMI.
| Virus | BMI<30 | BMI>30 | OR (IC 95%) | p-value | |||
| Yes | No | Yes | No | ||||
| Anelloviruses | |||||||
| TTVa | 36 (72.00%) | 14 (28.00%) | 9 (45.00%) | 11 (55.00%) | 0.32 (0.11–0.93) | 0.04 | |
| Polyomaviruses | |||||||
| BKV | 16 (32.00%) | 28 (68.00%) | 4 (20.00%) | 13 (65.00%) | 0.54 (0.15–1.92) | 0.34 | |
| JCV | 21 (42.00%) | 23 (46.00%) | 10 (50.00%) | 7 (35.00%) | 1.56 (0.51–4.76) | 0.45 | |
| Adenoviruses | |||||||
| ADENO-11 | 37 (74.00%) | 7 (14.00%) | 12 (60.00%) | 5 (25.00%) | 0.45 (0.12–1.69) | 0.30 | |
| ADENO-34 | 0 (0.00%) | 44 (88.00%) | 0 (0.00%) | 17 (85.00%) | 2.56 (0.10–100.00) | 1.00 | |
| ADENO-35 | 0 (0.00%) | 42 (84.00%) | 2 (10.00%) | 17 (85.00%) | 12.50 (0.56–∞) | 0.20 | |
| Human Herpesviruses | |||||||
| HHV7 | 0 (0.00%) | 44 (88.00%) | 0 (0.00%) | 17 (85.00%) | 2.56 (0.10–100.00) | 1.00 | |
| EBV | 2 (4.00%) | 42 (84.00%) | 0 (0.00%) | 17 (85.00%) | 0.49 (0.02–11.11) | 0.60 | |
| CMV | 10 (20.00%) | 34 (68.00%) | 3 (15.00%) | 14 (70.00%) | 0.73 (0.17–3.03) | 0.70 | |
| HSV-1 | 6 (12.00%) | 38 (76.00%) | 5 (25.00%) | 12 (60.00%) | 2.63 (0.68–10.00) | 0.20 | |
| VZV | 20 (40.00%) | 24 (48.00%) | 10 (50.00%) | 7 (35.00%) | 1.72 (0.56–5.26) | 0.30 | |
| Influenza virus H1N1 | |||||||
| H1N1 | 0 | 0 | 0 | 0 | |||
a. for TTV a value of viremia <4log10/ml was considered as “No”. For the other viruses. we reported presence (Y) or absence (N). OR reflects the possibility of patients with BMI>30 of being positive for a certain virus. compared to BMI<30 patients.
Disclaimer/Publisher’s Note: The statements, opinions and data contained in all publications are solely those of the individual author(s) and contributor(s) and not of MDPI and/or the editor(s). MDPI and/or the editor(s) disclaim responsibility for any injury to people or property resulting from any ideas, methods, instructions or products referred to in the content. |
© 2026 by the authors. Licensee MDPI, Basel, Switzerland. This article is an open access article distributed under the terms and conditions of the Creative Commons Attribution (CC BY) license (http://creativecommons.org/licenses/by/4.0/).
Copyright: This open access article is published under a Creative Commons CC BY 4.0 license, which permit the free download, distribution, and reuse, provided that the author and preprint are cited in any reuse.


