

Submitted:
12 June 2026
Posted:
15 June 2026
You are already at the latest version
Abstract
The scarcity of resources has constrained the supply of conventional feedstuffs for livestock production. Consequently, mulberry, known for its high protein and bioactive compounds, has been developed as a promising alternative feed. However, the optimal water-fertilizer ratio for cultivating feed mulberry in the North China Plain and the underlying physiological and agronomic mechanisms remain poorly understood. To address this, a two-year field experiment (2023–2024) was conducted to investigate the effects of water-fertilizer coupling on feed mulberry yield, water use efficiency (WUE), and soil quality. This experiment employed a split-plot design with three irrigation levels (I1=45, I2=90, and I3=135 mm) and four fertilizer rates (F1=0, F2=150, F3=225, and F4=300 kg·ha⁻¹). The results demonstrated that: (1) with variation trends in SWC consistent with those of soil available nitrogen (N), phosphorus (P), and potassium (K) contents. Under water-fertilizer coupling, the total water consumption in the I3F3 treatment reached its peak, increasing by 11.8% and 9.0% compared to I1F1, respectively. (2) Feed mulberry yield increased with elevated irrigation and fertilizer application. The highest yield, along with the peak leaf N, P, and K contents, was achieved under the I3F3 treatment (135 mm irrigation and 225 kg·ha⁻¹ fertilizer). (3) Water and fertilizer use efficiencies exhibited parabolic trends in response to increasing irrigation and fertilizer inputs. The I3F3 treatment emerged as the most effective management strategy, achieving high yield while maintaining superior WUE. However, the highest agronomic nitrogen efficiency (AEN) was observed in I2F2. (4) The AMOS 26 model indicates that water-driven improvement of soil conditions and soil nutrient effects are the key determinants affecting yield; and the content of soil nutrients significantly affects the nitrogen, phosphorus, and potassium contents of the feed mulberry leaves. In summary, feed mulberry exhibits significant potential for providing feed biomass, particularly by maintaining sufficient forage supply during dry seasons. This study provides critical insights for developing efficient water-fertilizer management practices to support China’s intensified animal production systems.
Keywords:
water-fertilizer coupling
; drip irrigation
; soil available NPK
; water use efficiency (WUE)
1. Introduction
Within China’s dairy industry chain, feed development is a critical component [1,2]. In recent years, rising raw material costs have increased feeding expenses in China’s livestock sector [3]. The competition for grains between human food and livestock feed has emerged as a new challenge to national food security [4]. It is projected that China’s demand for feed grains will reach 179.4 million tons by 2030 [5]. While corn and soybean are primary feed grains in China, the country’s dependence on soybean imports exceeds 80% [6]. The international trade market is highly volatile and unpredictable, influenced by factors such as trade wars and shifting geopolitical relations. Relying solely on feed grain imports is not a sustainable long-term strategy for ensuring China’s feed grain security and, consequently, its meat security [7]. Therefore, one pathway to address this is to seek alternative feedstuffs to meet meat production demands while simultaneously safeguarding food security [8]. Feed quality varies substantially depending on plant species and management practices [9]. Moreover, the quality of products from dairy production systems is directly linked to feed quality [8]. Consequently, high-quality forage represents a vital resource and has been a major focus of extensive research.
Mulberry (Morus spp.) is highly valued as livestock forage due to its rich nutrient profile. A primary advantage of mulberry is its high crude protein (CP) content [10], ranging from 10% to 30%, which is crucial for promoting livestock growth, muscle development, and milk production [11]. Beyond protein, mulberry leaves are rich in carbohydrates, dietary fiber, amino acids, and minerals, which are vital for maintaining skeletal health, supporting enzymatic functions, and ensuring electrolyte balance in animals [12]. Apart from its key role in sericulture, particularly in China, mulberry leaves have garnered increasing attention in recent years for their nutritional and medicinal properties [13]. Phytochemicals such as phenolics (flavonoids, chlorogenic acid) and alkaloids (1-deoxynojirimycin and fagomine) confer various bioactive properties to feed mulberry, including antimicrobial, anti-inflammatory, and anthelmintic activities [14,15]. Dietary inclusion of mulberry can benefit animals by enhancing the total antioxidant capacity in serum and the activities of catalase and superoxide dismutase [16,17]. Polysaccharides in mulberry leaves are natural, residue-free, and non-resistance-inducing active components, showing promising potential as feed additives [18,19,20]. Feeding studies have found that mulberry leaves exhibit excellent palatability, digestibility, and absence of anti-nutritional factors, which improve livestock productivity increasing the yield of milk, meat, and eggs [21,22,23,24,25] and offer a sustainable, climate-resilient forage solution. A second major advantage of mulberry is its exceptional adaptability and high biomass yield [26]. It is distributed globally and thrives under diverse climatic and soil conditions, ranging from tropical to temperate regions [27]. In China, the mulberry cultivation area exceeds 6.3×10⁵ ha, capable of producing 15–37 t·ha⁻¹ of leaves harvested every eight to ten weeks [28]. This affords it both geographical and yield advantages as a forage source. Simultaneously, its perennial nature ensures a consistent, year-round forage supply, unlike seasonal forages, which are vulnerable to climatic fluctuations. Studies have shown that mulberry can be ensiled to serve as an important supplemental forage for ruminants even outside the growing season [29]. Therefore, feeding mulberry represents a promising solution to seasonal forage shortages and climate-induced pasture instability [30].
Appropriate fertilizer management can enhance both the quality and yield of mulberry leaves. Fertilization is widely recognized as a crucial factor in boosting global agricultural productivity. However, the long-term overuse of chemical fertilizers in agricultural production, aimed at increasing crop yields, poses a significant challenge to the sustainability of soil and groundwater resources [31]. Studies have found that the long-term intensive cultivation of forage crops such as corn and wheat has led to severe ecological consequences, including excessive nitrogen fertilizer application [32]. Approximately 45% of the applied nitrogen is not utilized by crops but is instead lost from farmland [33]. This, in turn, increases production costs, degrades soil quality, and exacerbates environmental issues such as greenhouse gas emissions, water pollution, and soil acidification [34]. Consequently, there is an urgent need for fertilization strategies that can ensure feed supply while reducing synthetic fertilizer use and enhancing environmental sustainability. In this context, mulberry, with its relatively low fertilizer and pesticide requirements, emerges as a sustainable and climate-resilient alternative to conventional forage crops [35]. Evidence shows that appropriate fertilizer management can increase crop yield, including feed mulberry, by 35–40% [36]. Preliminary research indicates that water-saving and fertilizer-controlled practices influence mulberry leaf quality [10]. Therefore, investigating suitable fertilization strategies for feed mulberry may help reduce dependence on imported forage and soybean, while simultaneously mitigating nitrogen (N) surpluses.
Mulberry is recognized as an environmentally friendly plant due to its relatively low water requirement. Agricultural irrigation in the North China Plain (NCP) heavily depends on groundwater [37]. The availability of groundwater, along with the water-holding and retention capacities of different soil types, is crucial for optimal agricultural productivity and for maintaining the ecological balance of groundwater systems [38]. To alleviate the imbalance between water consumption and supply, water-saving measures such as drip irrigation have been adopted to enhance agricultural water productivity and narrow water-related yield gaps [39]. Investigations have shown that the average maize yield ranges from 8.0 to 10.6 t·ha⁻¹; however, achieving such yields typically requires substantial irrigation [40]. Consequently, in severely water-scarce regions like the North China Plain (NCP), maize is not a suitable feedstock. In contrast, mulberry thrives in arid and semi-arid conditions. Its deep and extensively distributed root system enables the plant to extract water from deeper soil layers, conferring strong drought resistance [35]. This trait makes it particularly valuable in water-limited areas [41]. It can be cultivated with minimal irrigation while maintaining satisfactory yields, rendering it highly suitable for regions facing water scarcity [42]. Furthermore, mulberry can also be grown under conditions of abundant water or in rainfed systems [43], with an annual rainfall range of 600–2500 mm [44]. Thus, its broad adaptability allows it to perform well under both waterlogged and drought conditions. By minimizing the need for water-intensive crop cultivation, this adaptability reduces the environmental constraints associated with livestock feed production. Therefore, mulberry serves as an alternative source of roughage with the potential to improve water use efficiency and alleviate environmental pressures [30].
The role of water-fertilizer coupling in improving agricultural practices is gaining increasing importance [45,46]. Due to its natural adaptability to poor soils and arid climates, feed mulberry shows significant potential for ecological restoration in dry and semi-arid regions [42,47]. Consequently, extensive research has focused primarily on stress-resistant genotypes of feed mulberry [41,48,49]. Fertilization practices in these areas have largely been based on local farmers’ empirical knowledge, leading to excessive and imbalanced soil nutrient levels. Research on the effects of water-fertilizer coupling on feed mulberry yield in the NCP remains relatively scarce, and the optimal water-fertilizer ratio remains undefined. Therefore, to optimize the synergy between fertilization and irrigation to enhance feed mulberry growth, a two-year field experiment on water-fertilizer coupling was conducted at the Shandong Sericulture Research Institute’s experimental station. This study hypothesized that different drip irrigation and fertilizer application rates could improve feed mulberry yield, soil quality, and WUE. To test this hypothesis, the experiment was designed to (1) investigate the effects of low, medium, and high fertilizer strategies under varying irrigation levels on crop evapotranspiration, soil nutrients, and plant nutrient status; (2) examine the impact of water-fertilizer coupling on feed mulberry yield and leaf nitrogen (N), phosphorus (P), and potassium (K) contents; and (3) determine the optimal water-fertilizer ratio for local feed mulberry production to simultaneously enhance soil quality, crop yield, and resource use efficiency. This study provides practical guidance for water-fertilizer management and soil nutrient sustainability in feed mulberry cultivation in the North China Plain.
2. Materials and Methods
2.1. Experimental Site
The field experiment was conducted at the Shandong Sericulture Research Institute’s experimental station during the 2023–2024 growing season. The site is located in Yantai City, Shandong Province, China (36°16’56” N, 121°11’34” E), at an altitude of 65 m. The region has a mean annual temperature of 13.4 °C and receives an average annual precipitation of 637.7 mm. The soil at the experimental site is classified as Arenosol, and its physical and chemical properties are shown in Table 1. The area experiences a warm temperate continental monsoon climate. The monthly rainfall and temperature patterns during the mulberry growing seasons of 2023 and 2024 are presented in Figure 1.
2.2. Experimental Materials
The hybridization of mulberry and the adoption of their naturalized planting methods have changed the traditional way of growing mulberry. Accordingly, the locally adapted cultivar Fengyuan No. 1, characterized by high yield, superior quality, strong stress resistance, and cold tolerance, was selected for the experiment.
2.3. Experimental Design
A split-plot design arranged in randomized complete blocks was implemented (Table 2). The experiment included three blocks (replicates). Within each block, the main plots were assigned three irrigation levels: I1 (45 mm), I2 (90 mm), and I3 (135 mm) in a random order. Drip irrigation tapes were installed along the mulberry rows, positioned adjacent to the plant root zone. Irrigation was applied three times during the growing season (May, July, and September), scheduled on rain-free days. Within each main plot, the sub-plots were assigned four fertilizer application rates: F1, control (0 kg·ha⁻¹); F2, 150 kg·ha⁻¹ applied as urea (46% N); F3, 225 kg·ha⁻¹ applied as urea; and F4, 300 kg·ha⁻¹ applied as urea. The full dose of fertilizer for each treatment was divided into three equal installments, each timed to coincide with an irrigation cycle. In total, the experiment comprised 12 treatments (3 irrigation levels × 4 fertilizer rates), replicated three times (three blocks), for a sum of 36 individual plots.
2.4. Measurements
2.4.1. Measurement of Soil Water Content and Water Consumption
Soil water content was determined using the gravimetric method with aluminum boxes. Measurements were taken from the 0–100 cm soil profile at 20 cm intervals during the bud-break, active-growth, and harvest stages. To account for root-zone dynamics in feed mulberry, soil moisture was measured 1 day before and 2 days after each irrigation event. Each treatment was sampled in triplicate [50].
The mass water content was calculated as:
where Mf represents the mass moisture content (%); M0 is the weight of the soil after drying (g); M is the weight of the soil before drying (g). Hi represents the volume moisture content (%); ρi is the dry bulk density of the soil sample (the average dry bulk density of each soil layer is g·cm-3); ρw is the density of water (g·cm-3). ET represents evaporation (mm); P is the effective precipitation during the growth period of feeding mulberry (mm), provided by the meteorological station; I is the irrigation amount (mm); ΔS is the change in soil water storage (mm); ΔSi is the change in soil water content within a given period in a certain soil layer; Zi is the thickness of the soil layer (cm); i and m represent the soil layers from the first (i = 1) to the last (i = m) soil layer measured. Due to the absence of significant precipitation events during the growing season, surface runoff and infiltration were not considered in this experiment.
Mf = [(M – M₀) / M₀] × 100%
Hi =Mf×ρi/ρw
ET=ΔS+I+P
ΔS=10∑ (ΔSi×Zi)
2.4.2. Measurement of Soil Available N, P, K Content
During the harvest seasons of 2023 and 2024, soil samples were collected from each plot using a 5.0-cm diameter auger. Five random cores were taken from each of the following depths: 0–20, 20–40, 40–60, 60–80, and 80–100 cm. Soil from the same layer was composited into one sample per plot. The samples were air-dried, ground, and sieved through a 1.00 mm stainless-steel sieve. Soil available nitrogen (AN, NH₄⁺, and NO₃⁻) was extracted with 0.5 M K₂SO₄ and determined colorimetrically. Soil available phosphorus (AP) was measured using the sodium bicarbonate extraction–molybdenum blue method. Soil available potassium (AK) was determined by ammonium acetate extraction followed by atomic absorption spectroscopy on 5.00 g of air-dried soil [51].
2.4.3. Yield Measurement
Fifteen representative mulberry plants were randomly selected from each plot. All leaves and shoots were harvested. Yield was determined in June, August, and October each year. Fresh weight of leaves and stems was measured using an electronic balance. The total annual leaf yield per square meter was calculated by summing the yields from all harvests.
2.4.4. Measurement of Leaf N, P, and K Content
Following each yield measurement, approximately 100 g of fresh leaves were collected from each plot. The leaves were dried at 105 °C for 30 min and then at 75 °C to constant weight. The dried material was ground into a fine powder and passed through a 0.5-mm sieve. A 0.5 g subsample was accurately weighed for digestion. Nitrogen concentration was determined using the Kjeldahl method, phosphorus concentration by the molybdenum blue method, and potassium concentration by atomic absorption spectrophotometry. The total uptake of N, P, and K per hectare was calculated from the leaf yield and their respective concentrations.
2.4.5. Agronomic Nutrient Use Efficiency
Agronomic nitrogen use efficiency (AEN) was calculated as:
where Y is the feed mulberry leaf yield (kg·ha⁻¹) under a given fertilizer treatment; Y₀ is the leaf yield (kg·ha⁻¹) under the same irrigation level but without fertilizer application (control); and Nₜ represents the total amounts of nitrogen (kg·ha⁻¹).
AEN = (Y – Y₀) / Nₜ
2.4.6. Water Use Efficiency and Irrigation Water Efficiency
The WUE was calculated as:
where Y (g·m-2) is the dry weight of mulberry leaves, ET (mm) is the evapotranspiration during the feeding mulberry growing season.
WUE = Y/ET
The IWE was calculated as:
IWE=Y/I
IWE represents irrigation water efficiency (kg·m-3), Y (g·m-2) is the grain yield, and I is the total irrigation volume during the growing season of the feed mulberry (mm).
2.5. Statistical Analysis
Given the split-plot design arranged in randomized complete blocks, a split-plot ANOVA model was employed. The main-plot factor was irrigation (I, three levels), and the sub-plot factor was fertilizer (F, four levels). Blocks (replicates, i=1,2,3) were treated as random effects. The linear model for each observation Yijk was:
where μ is the overall mean; Ri = effect of the i-th block; Ij = effect of the j-th irrigation level (j=1,2,3); (R×I) ij is main-plot error; Fk= effect of the k-th fertilizer rate (k=1,2,3,4); (I×F) jk = irrigation × fertilizer interaction; εijk = sub-plot error.
Yijk=μ+Ri+Ij+(R×I) ij+Fk+(I×F) jk+εijk
Expected mean squares (EMS)
The expected mean squares for each source of variation are as follows, where variance components are denoted by σ2 with appropriate subscripts, and Q (⋅) represents the quadratic form of fixed effects divided by its degrees of freedom:
| Source | EMS |
| Block (R) | σ2+4σ2R×I+12σ2R |
| Irrigation (I) | σ2+4σ2R×I +Q(I) |
| Main-plot error (R×I) | σ2+4σ2R×I |
| Fertilizer (F) | σ2+Q(F) |
| I×F | σ2+Q(I×F) |
| Sub-plot error (ε) | σ2 |
F-tests:
The irrigation effect (I) was tested against the main-plot error (R×I). The fertilizer effect (F) and the irrigation × fertilizer interaction (I×F) were tested against the sub-plot error (ε).
Analysis of variance (ANOVA) was performed at α=0.05 using DPS software. When significant effects were detected, the least significant difference (LSD) test was used for multiple comparisons. Structural equation modeling (AMOS) was used to assess correlations among production, soil, and water consumption parameters. All graphs were plotted using Origin 9.1.
3. Results
3.1. Soil Moisture Dynamics
3.1.1. Soil Water Content
The mean soil water content (SWC) during the feed mulberry growing seasons in 2023–2024 is shown in Figure 2. Irrigation significantly affected the SWC within the 0–100 cm soil profile. The effect of fertilizer application on SWC generally exhibited a trend of initial decrease followed by an increase, with the F3 treatment showing the lowest values. Specifically, in the 0–20 cm surface layer, the I3 treatment had the highest SWC, while I2 was the lowest; I3 was significantly higher than I2 by 18.1% and 31.5%, respectively. Regarding fertilizer treatments, F1 showed the highest SWC and F3 the lowest; F1 was significantly higher than F3 by 57.8% and 41.1%. In the 20–40 cm layer, F1 maintained the highest SWC. Within the 40–100 cm depth, I3 recorded the highest SWC, while F3 again showed the lowest among fertilizer treatments.
3.1.2. Evapotranspiration
The water consumption (evapotranspiration, ET) of feed mulberry during the 2023–2024 growing seasons is presented in Figure 3. Water-fertilizer treatments significantly affected ET. Results from both years showed that the I3F3 treatment had the highest ET, while I1F1 exhibited the lowest. Regarding irrigation treatments, ET followed the order I1 < I2 < I3, with I3 being significantly higher than I1 by 7.5% and 5.1%, respectively. For fertilizer treatments, the order was F3 > F4 > F2 > F1, and ET under F1 was significantly lower than that under F3 by 5.5% and 4.1%, respectively. The interaction between irrigation and fertilization indicated that ET under I3F3 was significantly higher than that under I1F1, with increases of 11.8% and 9.0%, respectively. In summary, ET increased with rising irrigation levels and showed an initial increase followed by a decrease with increasing fertilizer application. Under the water-fertilizer coupling regime, the I3F3 treatment reached the peak ET.
3.2. Soil Nutrient Distribution Characteristics
3.2.1. Soil Available Nitrogen (AN) Distribution
The content of soil available nitrogen (AN) at feed mulberry harvest is shown in Figure 4. Both irrigation and fertilizer treatments affected the AN content across soil layers. Under the I1 irrigation level, the soil AN content within the 0–100 cm profile showed an initial decrease followed by an increase, reaching its minimum at the F3 fertilizer rate. Under I2, the AN content exhibited a gradual decreasing trend. Under I3, a pattern of initial decrease followed by increase was again observed, with the lowest value also at F3. Overall, the fertilizer effect on AN followed a trend of initial decrease followed by increase. At the same fertilizer level, the I3 treatment resulted in the lowest soil AN content. In the 0–40 cm surface layer, the AN content under I2 was significantly lower than under I1 by 20.9% and 16.4%, respectively. Conversely, within the 40–100 cm layer, the AN content under I2 was significantly higher than under I1 by 13.3% and 20.1%.
3.2.2. Soil Available Phosphorus (AP) Distribution
During 2023–2024, at the same fertilizer level, the I3 treatment yielded the lowest AP content in the 0–20 cm surface soil (Figure 4). Within the 40–100 cm layer, the highest P content was found under I1, which was significantly higher than under I2 by 42.2% and 43.8%, respectively. Regarding the effect of fertilizer under fixed irrigation: under I1, soil AP content in the 0–100 cm profile showed an initial decrease followed by an increase, with the minimum at F3; under I2, a gradual decreasing trend was observed; under I3, the pattern was again an initial decrease followed by an increase, with the lowest value at F3. In terms of the overall fertilizer effect, a decreasing trend was observed in 2023, whereas in 2024, a pattern of initial decrease followed by increase was noted.
3.2.3. Soil Available Potassium (AK) Distribution
For AK, at the same fertilizer level, the I3 treatment resulted in the highest AK content within the 0–100 cm soil profile (Figure 4), following the order I1 < I2 < I3. Over the two years, the AK content under I3 was significantly higher than under I1 by 9.0% and 33.1%, respectively. When the irrigation level was fixed, the soil AK content exhibited an initial decrease followed by an increase. Specifically, under I1, AK content in the 0–100 cm profile showed an initial decrease followed by an increase, with the minimum at F3; under I2, a gradual decreasing trend was observed; under I3, the pattern was again an initial decrease followed by an increase, with the lowest value at F3.
3.3. Yield and Plant Nutrient Content
3.3.1. Feed Mulberry Yield and Yield Components
The yield and yield components of feed mulberry during the growing seasons are presented in Table 3. Both irrigation and fertilization significantly affected leaf fresh weight, leaf number, shoot fresh weight, shoot number, and total yield. Over the 2023–2024 period, the I3 treatment produced the highest values for all yield components and the maximum yield. Yield under I3 was 77.8% and 62.3% higher than under I1 in 2023 and 2024, respectively. Yield exhibited a pattern of initial increase followed by a decrease with rising fertilizer input (F3 > F4 > F2 > F1). The highest yield was achieved under F3, which exceeded that under F1 by 75.6% and 54.6% in the two respective years. Under water-fertilizer coupling, the I3F3 treatment gave the highest yield. With irrigation level fixed, the yield ranking among fertilizer treatments was: under I1, F3 > F4 > F2 > F1; under I2, F4 > F3 > F2 > F1; and under I3, F3 > F4 > F2 > F1. These results indicate that the combination of irrigation and fertilizer rates determines the optimal values of yield and its components.
3.3.2. Leaf N, P, and K Content
Irrigation (I1, I2, I3) and fertilizer rate (F1–F4) significantly influenced leaf nitrogen (N) content (Figure 5). Leaf N increased with both irrigation and fertilizer inputs, following the orders I3 > I2 > I1 and F3 > F4 > F2 > F1. Under coupled water-fertilizer conditions, the ranking of leaf N among fertilizer treatments within each irrigation level was consistent: F3 and F4 treatments yielded higher N content than F2 and F1. The highest leaf N content was observed in the I3F3 treatment, while the lowest was in I1F1. Compared to I3, leaf N under I1 was 39.6–56.3% lower across the two years. Similarly, leaf N under F1 was 43.3–63.2% lower than under F3. Notably, leaf N in the I1F1 treatment was 86.1% and 81.7% lower than that in the I3F3 treatment in 2023 and 2024, respectively.
Leaf phosphorus (P) content was also significantly affected by irrigation and fertilization in both years (Figure 5). The I3 treatment resulted in significantly higher leaf P than I1 and I2, with differences ranging from 22.2% to 95.2%. Similarly, F3 and F4 treatments yielded significantly higher leaf P than F1 and F2 (26.0–97.8%). Under water-fertilizer coupling, leaf P followed the same within-irrigation ranking as leaf N, with I3F3 showing the highest and I1F1 the lowest values. Leaf P in the I1F1 treatment was 66.5% and 79.0% lower than in the I3F3 treatment in 2023 and 2024, respectively.
For leaf potassium (K) content, I3 was significantly higher than I1 and I2 (23.3–113.0%), and F3 was significantly higher than F1 and F2 (31.5–113.2%) across the two years. The coupling effect (Figure 5) showed that I3F3 had the highest leaf K content, while I1F1 had the lowest. The same ranking pattern observed for leaf N and P was repeated for leaf K across irrigation levels. Leaf K in the I1F1 treatment was 85.8% and 71.5% lower than that in the I3F3 treatment in 2023 and 2024, respectively.
3.4. Water Productivity and Agronomic Nutrient Use Efficiency
3.4.1. Crop Water Use Efficiency (WUE)
Both irrigation and fertilization significantly influenced water use efficiency (WUE) (Figure 6). The interaction between water and fertilizer inputs indicated that WUE under I1F1 was significantly lower than under I3F3, by 70.7% and 58.3% in 2023 and 2024, respectively. Within each irrigation level, WUE followed a consistent ranking: under I1, F3 > F4 > F2 > F1; under I2, F4 > F3 > F2 > F1; and under I3, F3 > F4 > F2 > F1. Regarding irrigation effect alone, WUE under I3 was 13.9% to 64.1% higher than under I1 and I2. In terms of fertilization, WUE under F1 and F2 was significantly lower (by 19.2% to 42.0%) than under F3 and F4. In summary, all treatments demonstrated that both irrigation and fertilization enhanced the WUE of feed mulberry.
3.4.2. Irrigation Water Efficiency (IWE)
As shown in Figure 7, results from both years indicated that the I1F3 treatment achieved the highest irrigation water efficiency (IWE), followed by the I1F4 treatment. Under the I1 irrigation level, IWE exhibited an initial increase followed by a decrease with rising fertilizer input, indicating a significant fertilizer effect. A gradual increasing trend was observed under I2, while under I3, the pattern reverted to an initial increase followed by a decrease. Overall, IWE decreased with increasing irrigation amount.
3.4.3. Agronomic Use Efficiency of Nitrogen
Figure 8 shows that water-fertilizer coupling significantly affected the agronomic use efficiency of nitrogen (AEN) in feed mulberry. Results from both years revealed that the I2 irrigation level generally resulted in higher AEN compared to other levels, with the I2F2 treatment showing the peak AEN value. The AEN under I2F2 was 2.38 and 1.62 times higher than that under I3F2 in 2023 and 2024, respectively. Significant inter-annual variations were observed for AEN. Taking I3F3 as an example, its AEN in 2023 were 54.9% higher than those in 2024.
3.5. Path Analysis of Yield Formation in Feed Mulberry Under Variable Water and Fertilizer Inputs
The structural equation model (Figure 9) illustrates the direct and indirect effects of irrigation (I) and fertilization (F) on feed mulberry yield (C) and related variables. Irrigation significantly increased total water consumption (H, 0.58**) and improved soil nutrient availability (T, 0.29**). Fertilization also had a significant positive effect on soil nutrient status (T, 0.12**). Total water consumption enhanced soil nutrient availability (0.64**) and water use efficiency (W, 0.47**). Soil nutrient content exerted the strongest direct positive effect on yield (0.68**), followed by total water consumption (0.33**) and water use efficiency (0.39**). Soil nutrients also significantly increased leaf nutrient concentrations (Y, 0.77**), although the direct effect of leaf nutrients on yield was not significant (p > 0.05). The model fit indices were χ²/df = 2.26, RMSEA = 0.07, indicating an acceptable model fit.
4. Discussion
4.1. Effects of Water-Fertilizer Coupling on Soil Water and Nutrient Balance in Feed Mulberry
Different water and fertilizer management practices influence the distribution and content of soil water and nutrients [52]. In this study, when irrigation volume was equal across treatments, the soil water content (SWC) in the root zone was relatively higher under F1 and F2. Moreover, SWC in the surface layer was generally greater than in deeper soil. These differences may be related to the short-term infiltration dynamics of water-fertilizer mixtures in the soil [53]. Studies indicate that increased fertilizer input can enhance cohesion between soil particles [54]. The high viscosity and pore-blocking effects of fertilizers reduce water infiltration, thus increasing soil water content (SWC) in the surface root zone [53]. This pattern of SWC distribution corresponded with higher nutrient concentrations in the topsoil, underscoring that water availability is crucial for fertilizer function. From a long-term perspective, increased soil aggregation implies improved soil structural stability, which subsequently enhances soil water-holding capacity [55].
Total seasonal water consumption (ET) increased with higher irrigation supply across treatments. This may be attributed to improved soil physical and hydraulic properties due to fertilization, which promotes root growth and enhances the plant’s capacity to acquire both water and nutrients [56]. However, under I1 and I3 irrigation levels, ET first increased and then decreased with increasing fertilizer rate; under I2, a gradual increasing trend was observed. This is a critical and interesting shift, indicating that more irrigation is not always better. Under low irrigation (I1), water is the primary limiting factor for feed mulberry growth. An appropriate fertilizer rate (F3) maximized nutrient use efficiency and promoted plant growth. Further increase in fertilizer (F4), however, raised soil solution salinity, inducing “physiological drought” [57,58]. Under such water stress, plants enter a “survival mode,” with root uptake capacity constrained by reduced photosynthesis, thereby inhibiting water and nutrient absorption. Under the I2 irrigation level combined with a higher fertilizer rate (F4), an optimal water-fertilizer balance was achieved within the water-limited condition, promoting uptake. Under high irrigation (I3), excessive water displaced air from soil pores, leading to poor aeration, root hypoxia, and inhibited respiration, which impaired water and nutrient uptake [59]. Simultaneously, nutrient leaching occurred—especially for mobile nutrients such as nitrogen—which percolated into deeper soil layers, resulting in fertilizer waste and environmental risk [60]. Therefore, water-fertilizer coupling has important implications for guiding soil water conservation and moisture retention practices.
4.2. Water-Fertilizer Coupling Enhances Feed Mulberry Yield
Water and fertilizer, as the most critical environmental factors influencing crop growth and development, not only participate in cellular structure and metabolic processes but also provide the basis for material transport, photosynthesis, and nutrient uptake [61]. Increased irrigation significantly enhanced leaf weight, shoot weight, and yield of feed mulberry. Therefore, in arid and semi-arid regions, improving soil water retention and nutrient supply is key to achieving stable and increased crop yield. Under low irrigation (I1), the F3 treatment achieved significantly higher yield than other fertilizer rates (P < 0.05), representing an optimal water-fertilizer balance under water-limited conditions. The combination of I2 irrigation with F4 ensured both adequate water and nutrient supply, synergistically promoting the highest yield. Under high irrigation (I3), the F3 treatment represented the critical point of water-fertilizer coupling; further increasing fertilizer to F4 led to a yield reduction. In summary, both irrigation and fertilization exhibited compensatory effects on feed mulberry yield, with the I3F3 treatment achieving the maximum yield.
Appropriate field management practices can enhance the accumulation of nitrogen (N), phosphorus (P), and potassium (K). Leaf N content in mulberry is influenced by yield and soil N input [62]. The higher N input in the F3 treatment improved cellular metabolic capacity for N absorption and utilization, thereby increasing leaf N concentration with elevated N fertility. However, with further fertilizer increase (F4), N not promptly absorbed or immobilized on the soil surface could be lost via runoff. Moreover, soil has a limited capacity to retain nitrate. Excessive N application produces nitrate beyond the retention capacity of both soil and plants [52], making it highly susceptible to leaching into deeper layers by rainfall or irrigation. This reduced soil N content and consequently lowered N content in the yield, a finding consistent with Hou et al. (2025) [63]. Feed mulberry leaves exhibited relatively high P content. Phosphorus is a key raw material supporting rapid growth and high yield [64] and is essential for energy metabolism (ATP) and nucleic acid synthesis (DNA/RNA) in plants [65]. Thus, vigorous physiological activity drove P accumulation in leaves. Regarding potassium, the results showed that leaf K content ranged from 3.35 to 17.87 kg·ha⁻¹, substantially lower than N and P contents. Physiologically, mulberry prioritizes the allocation of mobile K to new tissues and storage organs, leaving less in mature leaves. Functionally, as photosynthetic organs, mulberry leaves are primarily dedicated to photosynthesis, carbohydrate production, and protein synthesis [66,67]. Therefore, the I2F3 treatment, as an optimized water-fertilizer coupling practice, not only significantly improved soil fertility but also increased leaf N, P, and K contents, contributing to sustainable agricultural development in arid and semi-arid regions.
4.3. Optimizing Water-Fertilizer Management for Efficient Forage Production
The WUE of feed mulberry is jointly determined by water consumption and yield, whereas IWE is influenced by irrigation volume and yield. Higher WUE alongside relatively stable yield can be achieved under limited water supply. Under low irrigation (I1), the F3 treatment attained the highest WUE under water-limited conditions. The combination of I2 irrigation with F4 ensured both adequate water and nutrient supply, synergistically promoting high yield and consequently the highest WUE. Under high irrigation (I3), the F3 treatment represented the critical point of water-fertilizer coupling; further increasing fertilizer to F4 reduced both yield and WUE. The effect of fertilizer rate on WUE is twofold. Within an optimal range, fertilizer application supplies appropriate levels of N, P, and K, which expands leaf area, enhances photosynthetic rate and dry matter accumulation, and thereby increases yield [68]. When the increase in yield surpasses the increase in water consumption, WUE rises. Conversely, exceeding this optimal fertilizer range reduces WUE [32], as excessive nutrients alter the plant’s tolerance to water stress [69]. Under water stress, stomatal closure reduces photosynthesis, decreasing leaf-level water use efficiency and yield per unit of transpired water [70]. In contrast, IWE is primarily governed by irrigation amount, with lower irrigation leading to higher IWE—a phenomenon attributable to the diminishing marginal return of irrigation on yield.
Regarding the agronomic use efficiency of N under low irrigation and fertilizer rates, fertilization significantly boosted yield, thereby improving agronomic efficiency [71]. However, as fertilizer input increased, the crop’s demand for additional nutrients gradually diminished, leading to smaller marginal yield gains and lower agronomic efficiency. When fertilizer application reached a certain threshold, the nutrient uptake capacity of both soil and crop roots approached saturation [59]. Further increases in fertilizer not only failed to enhance uptake but also promoted nutrient losses, reducing efficiency. Irrigation level also significantly affected agronomic nutrient use efficiency. Under a given fertilizer rate, agronomic efficiency followed a parabolic trend with increasing irrigation, indicating that appropriate irrigation improves soil moisture conditions, promotes nutrient dissolution and root uptake, and thus enhances efficiency [59]. However, excessive irrigation can cause waterlogging and poor aeration, inhibiting root growth and nutrient uptake, thereby reducing efficiency. Therefore, moderate irrigation helps achieve a synergistic effect between water and nutrients, optimizing their absorption and utilization [72,73]. Consequently, the I3F3 treatment can be regarded as the optimal water and fertilizer management strategy in the study region, balancing yield with resource-use efficiency.
The AMOS results revealed significant irrigation × fertilization interactions on yield, ET, and WUE (P < 0.05), indicating that the response of feed mulberry to fertilization depended strongly on irrigation level. The structural equation model further revealed that soil nutrient availability was the most direct driver of yield (standardized path coefficient = 0.68, P < 0.05), followed by total water consumption (0.33, P < 0.05) [74,75]. This is consistent with previous studies showing that improved soil nutrient status enhances biomass accumulation, particularly under adequate water supply [76].
Limitations of this study should also be acknowledged. First, this experiment was conducted under site-specific soil and climatic conditions in the North China Plain, and the results may not be directly extrapolated to other regions. Second, the experiment lasted only two years, and long-term water-fertilizer effects on soil quality and production stability remain unclear. Third, only one mulberry cultivar was used, and genotypic differences may exist. Future studies should extend the experimental duration, include more cultivars, and explore long-term impacts on soil health and environmental sustainability under varied water-fertilizer regimes.
5. Conclusions
In summary, under the specific experimental conditions of this study in the North China Plain, feed mulberry yield varied substantially from 9.84 to 41.66 t·ha⁻¹. The I3F3 treatment (135 mm irrigation combined with 225 kg·ha⁻¹ urea) produced the highest yield, water consumption, and favorable water use efficiency. The optimal water-fertilizer regime identified herein is applicable only to the soil, climate, and cultivar used in this study. These findings provide a theoretical basis for efficient water-fertilizer management for feed mulberry production in the North China Plain.
Author Contributions
Author Contributions: Methodology, Yujie Ren; data curation, Yujie Ren; writing—original draft preparation, Yujie Ren; formal analysis, Bing Geng; project administration, Bing Geng; investigation, Dongxiao Zhao; software, Xinqin Shi; writing—review and editing, Guang Guo; funding acquisition, Zhaohong Wang. All authors have read and agreed to the published version of the manuscript.
Funding
This study was funded by the Agricultural Sciences & Technology Innovation Project of Shandong Academy of Agricultural Sciences (CXGC2025C18), the Yantai Comprehensive Test Station of National Silkworm Industry Technology System (CARS-18-SYZ08).
Data Availability Statement
The original contributions presented in this study are included in the article/supplementary material. Further inquiries can be directed to the corresponding author(s).
Conflicts of Interest
The authors declare no conflicts of interest.
References
- Eriksson K., Brichet N., Nielsen L. Situated analysis of food supply, land-use dynamics, and feed-food competition at organic farms with dairy cattle. Agric. Syst.,2025,228,104389. [CrossRef]
- Zhu Z., Zhang X., Dong H., Wang S., Reis S., Li Y., Gu B. Integrated livestock sector nitrogen pollution abatement measures could generate net benefits for human and ecosystem health in China. Nat. Food, 2022,3(2):161-168. [CrossRef]
- He D., Deng X., Wang X., Zhang Fan. Livestock greenhouse gas emission and mitigation potential in China. J. Environ. Manage., 2023,348, 119494. [CrossRef]
- Zhang Z., Chi L., Wu J., Zhu M., Shen C. Industrial clustering and environmental pollution: Spatial-temporal dynamics and driving factors of China’s feed processing industry. J. Cleaner Prod., 2025, 498,145173.
- Liang X., Dou Y., Ohuru R., By de R., Jin X., Feng S., Meng F., Zhou Y. Local food system resilience in China integrating supply and demand. Glob. Food Sec., 2025,44,100830. [CrossRef]
- Yang S., Cui X. Large-scale production: A possible way to the balance between feed grain security and meat security in China. J. Agr. Food Res., 2023,14. [CrossRef]
- Julian J., Sylvia Tr., Fred K., Günther F., Taher K. Sustainable intensification of fodder crop production can mitigate feed shortage and seasonality in East Africa. Environ. Dev., 2025, 54: 101158. [CrossRef]
- Bouchon M., Martin B., Bord C., Ferlay A., Bloor J.M.G., Eugène M., Delacroix-Buchet A., Cebo C., Michalski M.C., Graulet B., Verdier-Metz I., Delbes C. Adaptation strategies to manage summer forage shortages improve animal performance and better maintain milk and cheese quality in grass- versus corn-based dairy systems. J. Dairy Sci., 2025,108(5):4796-4817. [CrossRef]
- Zebeli M.U. B., Aydemir S. A., Terler G., Zebeli Q. Feeding of high-quality hay modulates hepatic lipid and energy metabolism in weaned dairy calves. JDS commun., 2025,6(5):700-704. [CrossRef]
- Ren Y., Guo G., Wang Z., Zhu L., Geng B. Response of Yield and Protein Content of Forage Mulberry to Irrigation in North China Plain. Agronomy, 2025,15(5):1016-1016. [CrossRef]
- Ma J., Wang J., Jin X., Liu S., Tang S., Zhang Z., Long S., Piao X. Effect of Dietary Supplemented with Mulberry Leaf Powder on Growth Performance, Serum Metabolites, Antioxidant Property and Intestinal Health of Weaned Piglets. Antioxidants, 2023, 12, 307. [CrossRef]
- Zhao C., Li T., Zhang C., Li H., Wang Y., Li C., Wang Z., Zhao M., Shen M., Zhao W. Drying methods affect nutritional value, amino acids, bioactive compounds, and in vitro function of extract in mulberry leaves. Food chem., 2025,481,144018. [CrossRef]
- Jin P., Peng H.X., Zhang Y., Jiang H., Zhao Y. L., Du Y., Quan T. D. Integrating 16S rDNA sequencing analysis and targeted tryptophan metabolomics to reveal potential mechanism of mulberry leaf extract in treating type 2 diabetes mellitus mice. J. Pharm. Biomed. Anal., 2025,265,117065. [CrossRef]
- Xu Z., Li R., Chen Y., Yuan Y., Wang L., Wang Y. Characterization of the antimicrobial activity and mechanism of the peptide Squ8 isolated from fermented mulberry leaves. Biochem. Biophys. Res. Commun., 2025,780,152486. [CrossRef]
- Liu Y., Peng Y., Chen C., Ren H., Zhu J., Deng Y., Cui Q., Hu X., He J., Li H., Zhu X., Yin Y., He J., Xiao Y. Flavonoids from mulberry leaves inhibit fat production and improve fatty acid distribution in adipose tissue in finishing pigs. Anim. Nutr., 2024,16147-157. [CrossRef]
- Yang J., Zhang X., Wu N., Hu Q., Sheng J., Zhong X., Pan Y., Yu Y., Luo T., Zhang B., Deng Z., Chen F. Research on the anti-aging activity of different mulberry leaf Products: Based on mulberry leaf powder and mulberry leaf extract. Food Biosci., 2025,69,106785. [CrossRef]
- Abbas Z., Zhang J., Tong Y., Ahmad B., Wang J., Zhang H., Li Z., Wei X., Zhang R., Si D. Production and characterization of novel antioxidant peptides from mulberry leaf ferment using B. subtilis H4 and B. amyloliquefaciens LFB112. Food Chem., 2025,482144022. [CrossRef]
- Ma J., Yan X., Xu H., Pan L., Zhai X., Xue Y., Chen Y., Liu H., Zhao M., Luo L. Effects of mulberry leaf extract on growth, digestion, liver lipid metabolism and hypoglycaemic ability in mandarin fish (Siniperca chuatsi). Aquacult. Rep., 2024,39102513-102513. [CrossRef]
- Xiao Q., Wei L., Yin L., Jiang Y., Zheng Q., Wang J., Ye T., Wang Y., Zhou T., Nie L., Mao Z., Qu F., Cao S., Wan M., Liu Z., Tao M., Tang J. Mulberry leaf polysaccharide alleviates liver damage and glucose metabolism disorder in largemouth bass (Micropterus salmoides) induced by high-starch. Aquacult. Rep., 2025,43,102963. [CrossRef]
- Jiang W., Gu Z., Qian L., Lu S., Mu Q., Lin Y., Miao L., Ge X. Mulberry leaf polysaccharides ameliorate lipid metabolic disorders in high-fat diet-fed Megalobrama amblycephala: changes in transcriptome, metabolome, and intestinal flora. Int. J. Biol. Macromol, 2025,320(P4):146006. [CrossRef]
- Xia H. G., Wu R. C., Zhou M. J., Chen C., Yang F. Y., Hao J. Pre-fermented juices for clean and efficient production of mulberry silage: Insights from the microbiome, metabolome and in vitro rumen fermentation. Environ. Technol. Innov., 2025, 37,103982. [CrossRef]
- Liu Q., Zhuo Z., Zhang J., Chen G., Xu D., Wang X., Ali H. Nutritional quality assessment of mulberry leaves from different varieties as an alternative feed in ruminant nutrition. J. Food Compos. Anal., 2025, 140, 107213. [CrossRef]
- Cui Y., Liu Z., Deng D., Tian Z., Song M., Lu Y., Yu M., Ma X. Influence of fermented mulberry leaves as an alternative animal feed source on product performance and gut microbiome in pigs. F&FI, 2024, 10(4): 215. [CrossRef]
- Wang R., Wang X., Xiong Y., Cao J., Nussio G. L., Ni K., Lin Y., Wang X., Yang F. Dietary Paper Mulberry Silage Supplementation Improves the Growth Performance, Carcass Characteristics, and Meat Quality of Yangzhou Goose. Animals-Basel, 2024,14(3), 359. [CrossRef]
- Huang Z., Dai H., Li S., Wang Z., Wei Q., Ning Z., Guo Y., Shi F., Lv Z. Maternal supplementation with mulberry-leaf flavonoids improves the development of skeletal muscle in the offspring of chickens. Anim. Nutr., 2024,1872-83. [CrossRef]
- González-García E., Martín G.M. Biomass yield and nutrient content of a tropical mulberry forage bank: Effects of season, harvest frequency and fertilization rate. Grass Forage Sci. 2017, 72, 248–260. [CrossRef]
- Rao L., Li S., Cui X. Leaf morphology and chlorophyll fluorescence characteristics of mulberry seedlings under waterlogging stress. Sci. Rep. 2021, 11, 13379. [CrossRef]
- Wang K., Kang S., Li F., Wang X., Xiao Y., Wang J., Xu H. Relationship between fruit density and physicochemical properties and bioactive composition of mulberry at harvest. J. Food Compos. Anal. 2022, 106, 104322. [CrossRef]
- Wang X., Qian Y., Wei M. Widely Targeted Metabolomics Analysis to Reveal Metabolite of Morus alba L. in Different Medicinal Parts. Molecules, 2024, 29, 3981. [CrossRef]
- Rohela G. K., Saini P., Rudramani K., Roy P., Syam S., Bhardwaj S., Ayoub B. O., Aziz D., Khan A. G., Singh S. Mulberry (Morus spp.): A Promising Field Crop for Livestock Forage. Anim. Feed Sci. Tech., 2025, 116558. [CrossRef]
- Shi X., Wu L., Xiang J., Liang H., Sun R., Kalkhajeh Y. K., Wang Z., Fang H., Ma C. Straw return decreases N surface runoff losses in croplands: Evidence from a global meta-analysis. Agric. Water Manage., 2025, 315: 109515. [CrossRef]
- Wang Y., Hua Y., Mei L., Meng Y., Guo Y., Cai J., Huang M., Zhong Y., Wang X., Jiang D., Zhou Q. The combined application strategy of controlled-release fertilizers can balance the yield and quality of soft wheat while meeting its nutrient requirements. J. Integr. Agric., 2025. [CrossRef]
- Yang W., Yu J., Li Y., Jia B., Jiang L., Yuan A., Ma Y., Huang M., Cao H., Liu J., Qiu W., Wang Z. Optimized NPK fertilizer recommendations based on topsoil available nutrient criteria for wheat in drylands of China. J. Integr. Agric., 2024, 23(7): 2421-2433. [CrossRef]
- Zhang X., Wang Z., Wang Y., Tian X., He K., Chen Z., Ying H., Yin Y., Cui Z. Contribution of nitrogen to main cereal crops yield and the key drivers in China. Resour Conserv Recy., 2025, 212: 107995. [CrossRef]
- Mogili, T., Sarkar, T., Gnanesh, B.N. Mulberry breeding for higher leaf productivity[M]//The Mulberry Genome. Springer Plus, 2023: 57-114.
- Yu C., Hu X., Deng W., Li Y., Xiong C., Ye C., Han G., Li X. Changes in soil microbial community structure and functional diversity in the rhizosphere surrounding mulberry subjected to long-term fertilization. Appl. Soil Ecol., 2015,8630-40. [CrossRef]
- Wu L., Min L., Liu M., Kinzelbach W., Wang S., Mady A., Shen Y. Observation-constrained long-term simulations of water dynamics and groundwater recharge under intensive agriculture in the North China Plain. Groundwater Sust. Dev., 2025,311: 01516. [CrossRef]
- Shu J., Bai Y., Chen Q., Weng C., Zhang F. Dynamic simulation of the water-land-food nexus for the sustainable agricultural development in the North China Plain. Sci. total environ., 2023, 912:168771. [CrossRef]
- Jing B., Shi W., Chen T., Zhai Z., Song J. Optimizing root distribution and water use efficiency in maize/soybean intercropping under different irrigation levels: The role of underground interactions. Soil Till. Res., 2025, 249: 106490. [CrossRef]
- Weidhuner A., Zandvakili R. O., Koduru S., Cook R. L., Hanauer A., Jones K., Sadeghpour A. Effect of long-term tillage practices on soil physical properties, corn and soybean yield, and nutrient balance. Field Crops Res., 2026, 336:110210. [CrossRef]
- Lin Y., Liu C., Wu H., Lu Z., Wang D., Xin Y. The MnBPC6-MnPLATZ5 module regulates the salt stress tolerance of mulberry. Plant Physiol. Biochem., 2025,229(Pt C):110601. [CrossRef]
- Salman M. H., Sudipta K., Sourav K., Palash M., Swarnendu R. Zinc oxide nano-flowers improve the growth and propagation of mulberry cuttings grown under different irrigation regimes by mitigating drought-related complications and enhancing zinc uptake. Plant Physiol. Biochem., 2023, 202:107910. [CrossRef]
- Hu J., Chen W., Duan Y., Ru Y., Cao W., Xiang P., Huang C., Zhang L., Chen J., Gan L. Response Mechanisms to Flooding Stress in Mulberry Revealed by Multi-Omics Analysis. PHYTON., 2024,93(2):227-245. [CrossRef]
- Khan G. R., Shukla P.M., Rajesh K., Roy S. C. Mulberry (Morus spp.): An Ideal Plant for Sustainable Development. Trees Forest People, 2020,2(prepublish):100011. [CrossRef]
- Shi J., Gao H., Liu Y., Liu E., Whalen K. J., Niu X., Yan Y., Zhang H., Yu J., Mei X. Optimizing water and fertilizer management reduces carbon and water footprints for winter wheat production in China. Farming System, 2026,4(1):100185-100185. [CrossRef]
- Yang X., Zhang L., Liu X. Optimizing water-fertilizer integration with drip irrigation management to improve crop yield, water, and nitrogen use efficiency: A meta-analysis study. Sci. Hortic., 2024,338(1):13653. [CrossRef]
- Liu L., Cao X., Zhai Z., Ma S., Tian Y., Cheng J. Direct evidence of drought stress memory in mulberry from a physiological perspective: Antioxidative, osmotic and phytohormonal regulations. Plant Physiol. Biochem., 2022,186:76-87. [CrossRef]
- Zhu C., Qin Y., Liu C., Hou Z., He J., Wang P., Hu D., Wang X. Unraveling phenotypic diversity and genetic structure of mulberry germplasm via GWAS: Key candidate genes and their molecular breeding potential. Scientia Horticulturae, 2025,349114226-114226. [CrossRef]
- Song F., Li Y., Huang J., Lu W., Guo Z., Deng W. Integrated transcriptomic and proteomic analyses reveal the impact of drought and heat stress combination on Morus alba. Environ. Exp. Bot., 2024,228(PA):105988. [CrossRef]
- Yan Z., Zhang W., Liu X., Wang Q., Liu B., Mei X. Grain yield and water productivity of winter wheat controlled by irrigation regime and manure substitution in the North China Plain. Agric. Water Manage., 2024, 295: 108731. [CrossRef]
- Wang N., Ai Z., Zhang Q., Leng P., Qiao Y., Li Z., Tian C., Cheng H., Chen G., Li F. Impacts of nitrogen (N), phosphorus (P), and potassium (K) fertilizers on maize yields, nutrient use efficiency, and soil nutrient balance: Insights from a long-term diverse NPK omission experiment in the North China Plain. Field Crops Res., 2024, 318: 109616. [CrossRef]
- Liu D., Chen P., Zhang T., Liu T., Ye M., Li C., Jiang L., Zhang D., Ge S., Chen X., Ma J. Optimizing water-fertilizer management to regulate soil environment can reduce greenhouse effect and enhance net eco-economic efficiency of wheat production. Agric. Water Manage., 2026, 323: 110103. [CrossRef]
- Hu M., Li Y., Chen Z., Lv K., Xiong Y., Huang G. Drip irrigation combined with organic fertilizers improves crop N uptake and yield by reducing soil salinity and N loss in saline–alkali sunflower farmlands. Soil Till. Res. 2026, 255: 106789. [CrossRef]
- Tian L., Wang X., Liu E. Greater than 5 mm soil mechanical stability aggregates reduce carbon dioxide emissions after application of different proportions of manure and chemical fertilisers under equal nitrogen conditions. Chem. Eng. Sci. 2025,521: 166732. [CrossRef]
- Shi W., Zhang Y., Wei Z., Weihermüller L., Schaap M. G., Vereecken H. Identifying and characterizing bimodal soil hydraulic properties through water retention curve analysis. J. Hydrol. 2026, 666: 134808. [CrossRef]
- Nayak J., Chattopadhyay D., Giri M. K., Singh N. Unearthing the secrets of drought-driven root system architecture: Nutrient acquisition and rhizosphere microbe interplay. Plant Sci. J. 2026, 363: 112855. [CrossRef]
- Deng X., Khan Y., Jan M. F., Miao L., Yang F. Sex-specific responses in photosystem regulation, antioxidant defence, and energy metabolic adaptations in mulberry (Morus alba L.) to waterlogging stress. Plant Stress. 2026, 19: 101176. [CrossRef]
- Miao Q., Liu L., Wang C., Ying H., Guo Y., Wang D., Hu Y., Cui Z., Sun J., Li J., Tian J. Tobacco–rapeseed system with moderate mineral fertiliser promotes yield by synergistically improving bacterial network complexity and soil fertility. Eur. J. Agron. 2026, 174: 127955. [CrossRef]
- Fozia D. M., Xie Y., Gong Y., Muhammad A., Lu S., Hui W., Wang J., Gong W. Optimizing organic fertilizer nitrogen substitution to enhance growth, nutrient uptake, and use efficiency in Zanthoxylum armatum. Soil Till. Res. 2026, 258: 107057. [CrossRef]
- Wang H., Hao H., Zhao X., Guo Z., Yu D., Li C., Liu W., Lou Y., Pan H., Yang Q., Yang Z., Sun Y., Hu G., Zhuge Y. Interactive effects of enhanced-efficiency N fertilizers and fulvic acid on ammonia volatilization and inorganic N leaching in saline soil. Environ. Res., 2026, 291: 123550. [CrossRef]
- Yang W., Zhao C., Chen Z., Deng X., Li J., Sun J., Wang P., Zhu B., Wang B., Xiong Z., Li Y., Wang B. Integrating chemical, organic, water-soluble and microbial fertilizers achieve mutually benefits of high nutrient utilization, improved yield and quality in tobacco cultivation. J. Agr. Food Res. 2026, 26: 102667. [CrossRef]
- Shi S., Li H., Wang X., Huang L., Yu P., Xu J., Yang Z., He X. Elevated CO2 and fertilization enhance nutrient use efficiency and carbon allocation in mulberry: A pathway for sustainable horticulture. Sci. Hortic. 2026, 355: 114554. [CrossRef]
- Hou P., Li B., Cao E., Jian S., Liu Z., Li Y., Sun Z., Ma C. Optimizing maize yield and mitigating salinization in the Yellow River Delta through organic fertilizer substitution for chemical fertilizers. Soil Till. Res., 2025, 249: 106498. [CrossRef]
- Kari Y., Risto U., Johanna N., Andrea B., Antonio D. Phosphorus mobilization induced by bio-based fertilizers from soils with varying phosphorus retention capacities. Resour. Environ. Sustain. 2026, 100297. [CrossRef]
- Luo L., Li N., Sha W., Li Z., Chai R., Zhang L., Zhang C., Kadambot H.M. Siddique. Novel phosphorus fertilizers enhance rice yield, efficiency, and environmental sustainability by optimizing soil phosphorus pools in paddy fields. Soil Till. Res. 2026, 255: 106833. [CrossRef]
- Xia Y., Shan C., Wu Z., Zhao J. Tetramethoxyluteolin, an active constituent in mulberry leaves, promotes osteogenesis of jaw bone marrow mesenchymal stem cells in periodontitis microenvironment via NF-κB inhibition. Arch. Oral Biol. 2026, 182: 106459. [CrossRef]
- Liu T., Deng F., Zhu Y., Wang L., He C., Liu R., Liu Y., Yang J., Li Q., Yuan Y., Ai X., Wang R., Peng Y., Hu X., Cheng H., Tao Y., Zhou W., Lei X., Chen Y., Ren W. Potassium fertilizer management improves rice yield by optimizing the morphological and physiological characteristics of leaves under shading stress. J. Integr. Agric. 2025. [CrossRef]
- Yang X., Sun S., Li H., Guo Z., Ma C., Liu B., Zhang W., Ding R., Zhang P., Liu T., Zhang X., Han Q. Optimizing fertilizer and planting density to stabilize yields and improve water use efficiency in rain-fed wheat–maize rotations. Eur. J. Agron. 2026, 173: 127916. [CrossRef]
- Dong X., Vera A., García-Díaz C., García C., Zhang W., Bastida F. Excessive phosphorus (P) fertilization reduces the soil priming effect in a Mediterranean soil. Appl. Soil Ecol. 2026, 218: 106715. [CrossRef]
- Zhang P., He Q., She D. Trade-offs and synergies among soil salinity, water use efficiency, and yield under subsurface drip irrigation: Evidence from a global meta-analysis. Field Crops Res. 2026, 338(15): 110315. [CrossRef]
- Peng L., Deng S., Yi W., Wu Y., Zhang Y., Yao X., Xing P., Cui B., Tang X. Partial organic fertilizer substitution and water-saving irrigation can reduce greenhouse gas emissions in aromatic rice paddy by regulating soil microorganisms while increasing yield and aroma. J. Integr. Agric. 2026, 25(1): 273-289. [CrossRef]
- Pramanick B., Choudhary S., Kumar M., Singh S.K., Jha R.K., Singh S.K., Salmen S.H., Ansari M.J., Hossain A. Can site-specific nutrient management improve the productivity and resource use efficiency of climate-resilient finger millet in calcareous soils in India? Heliyon,2024, 10(12), e32774. [CrossRef]
- Chrysargyris A., Tzortzakis N. Optimizing nitrogen, phosphorus, and potassium requirements to improve Origanum dubium Boiss. growth, nutrient and water use efficiency, essential oil yield and composition. Ind.Crops Prod. 2025, 224: 120291. [CrossRef]
- Ball M., Ramirez H.G. Nitrous oxide emissions and yields from potato production systems as influenced by nitrogen fertilization and irrigation: A meta-analysis. Agron. J., 2024,117(1): e21720. [CrossRef]
- Gbedourorou K. S., Tovihoudji G. P., Zakari S., Vanclooster M., Irenikatché Akponikpè P. B. Effect of water-saving technologies on nitrogen losses in rice fields: A meta-analysis. Agric. Water Manage., 2025, 312, 109400. [CrossRef]
- Fan Q., Fei L., Peng Y., Gao Y., Shen F. Grain yield and resource efficiency responses to water-nitrogen coupled input reduction: A global meta-analytical perspective. Agric. Water Manage., 2026, 323, 110059-110059. [CrossRef]
Figure 1.
Monthly total rainfall and mean monthly air temperature in the 2023 and 2024 mulberry growing seasons.
Figure 1.
Monthly total rainfall and mean monthly air temperature in the 2023 and 2024 mulberry growing seasons.
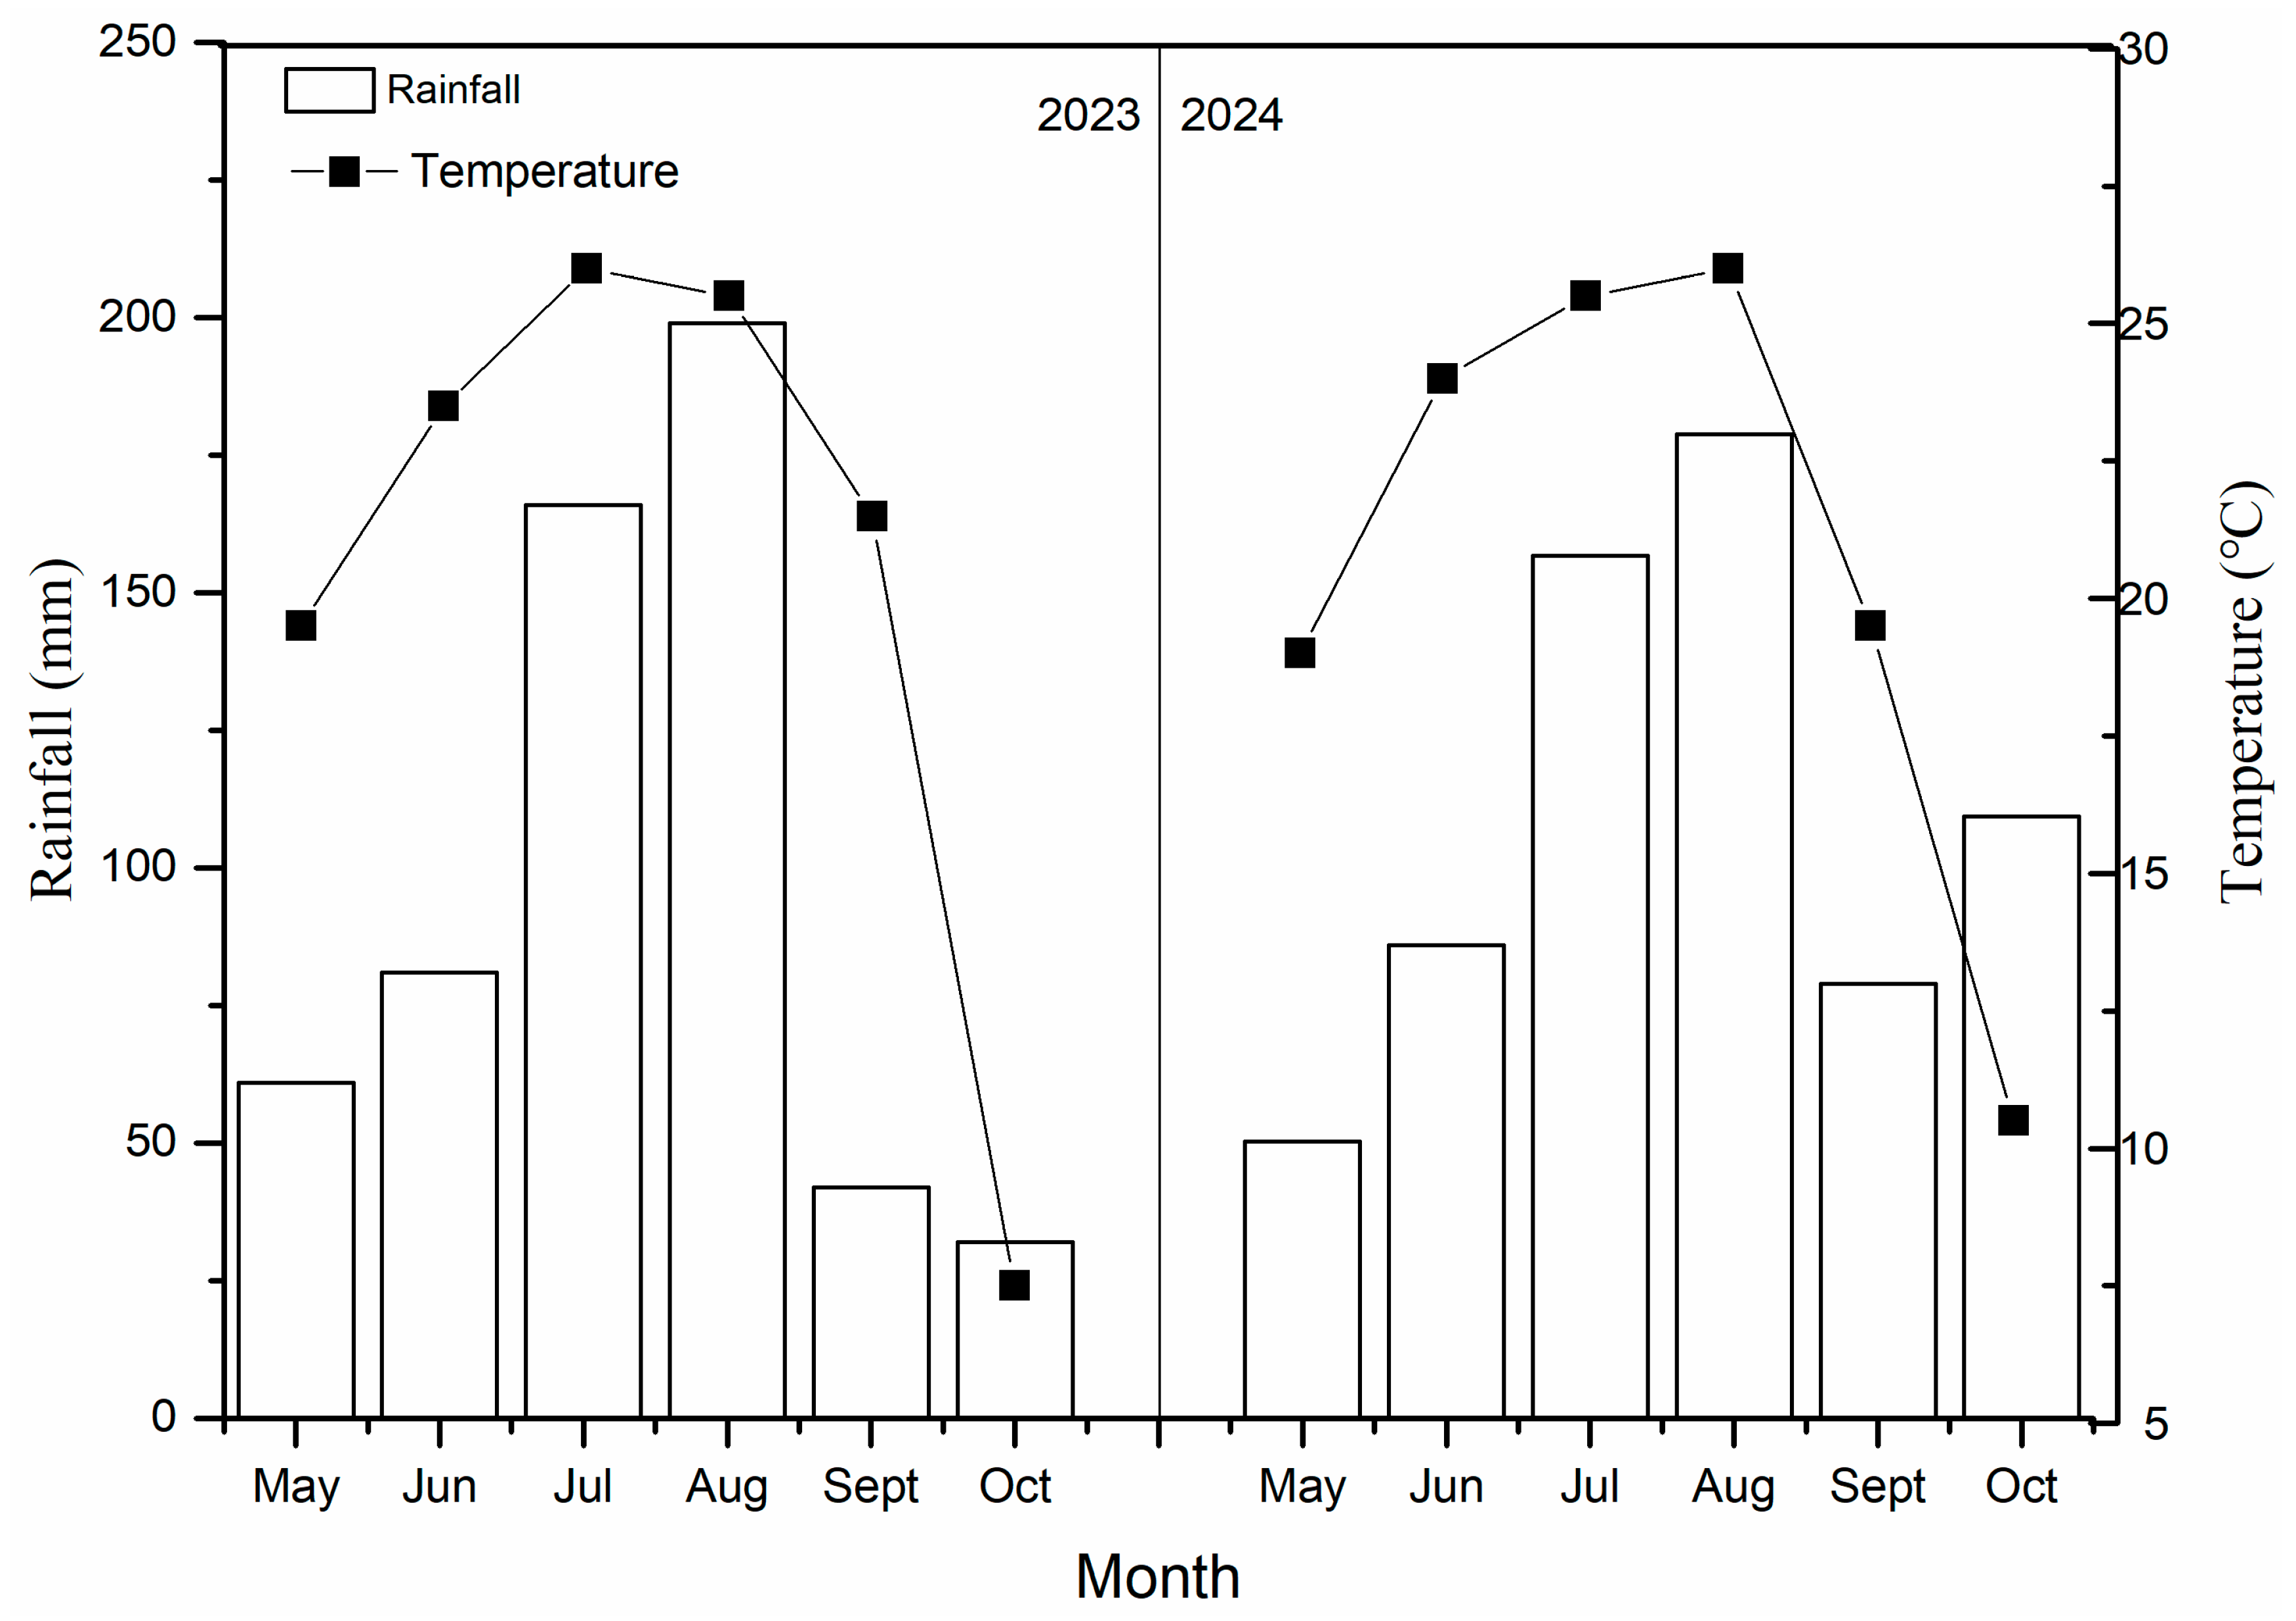
Figure 2.
The average soil water content during the growth period of mulberry under different water and fertilizer treatments in 2023 and 2024. “I” stands for irrigation and “F” for fertilization, and “W × F” for interaction effect. The vertical bars represent standard errors. The bars labeled at the top of the columns with different letters are significantly different (p < 0.05) among the treatments using the LSD post hoc test.
Figure 2.
The average soil water content during the growth period of mulberry under different water and fertilizer treatments in 2023 and 2024. “I” stands for irrigation and “F” for fertilization, and “W × F” for interaction effect. The vertical bars represent standard errors. The bars labeled at the top of the columns with different letters are significantly different (p < 0.05) among the treatments using the LSD post hoc test.
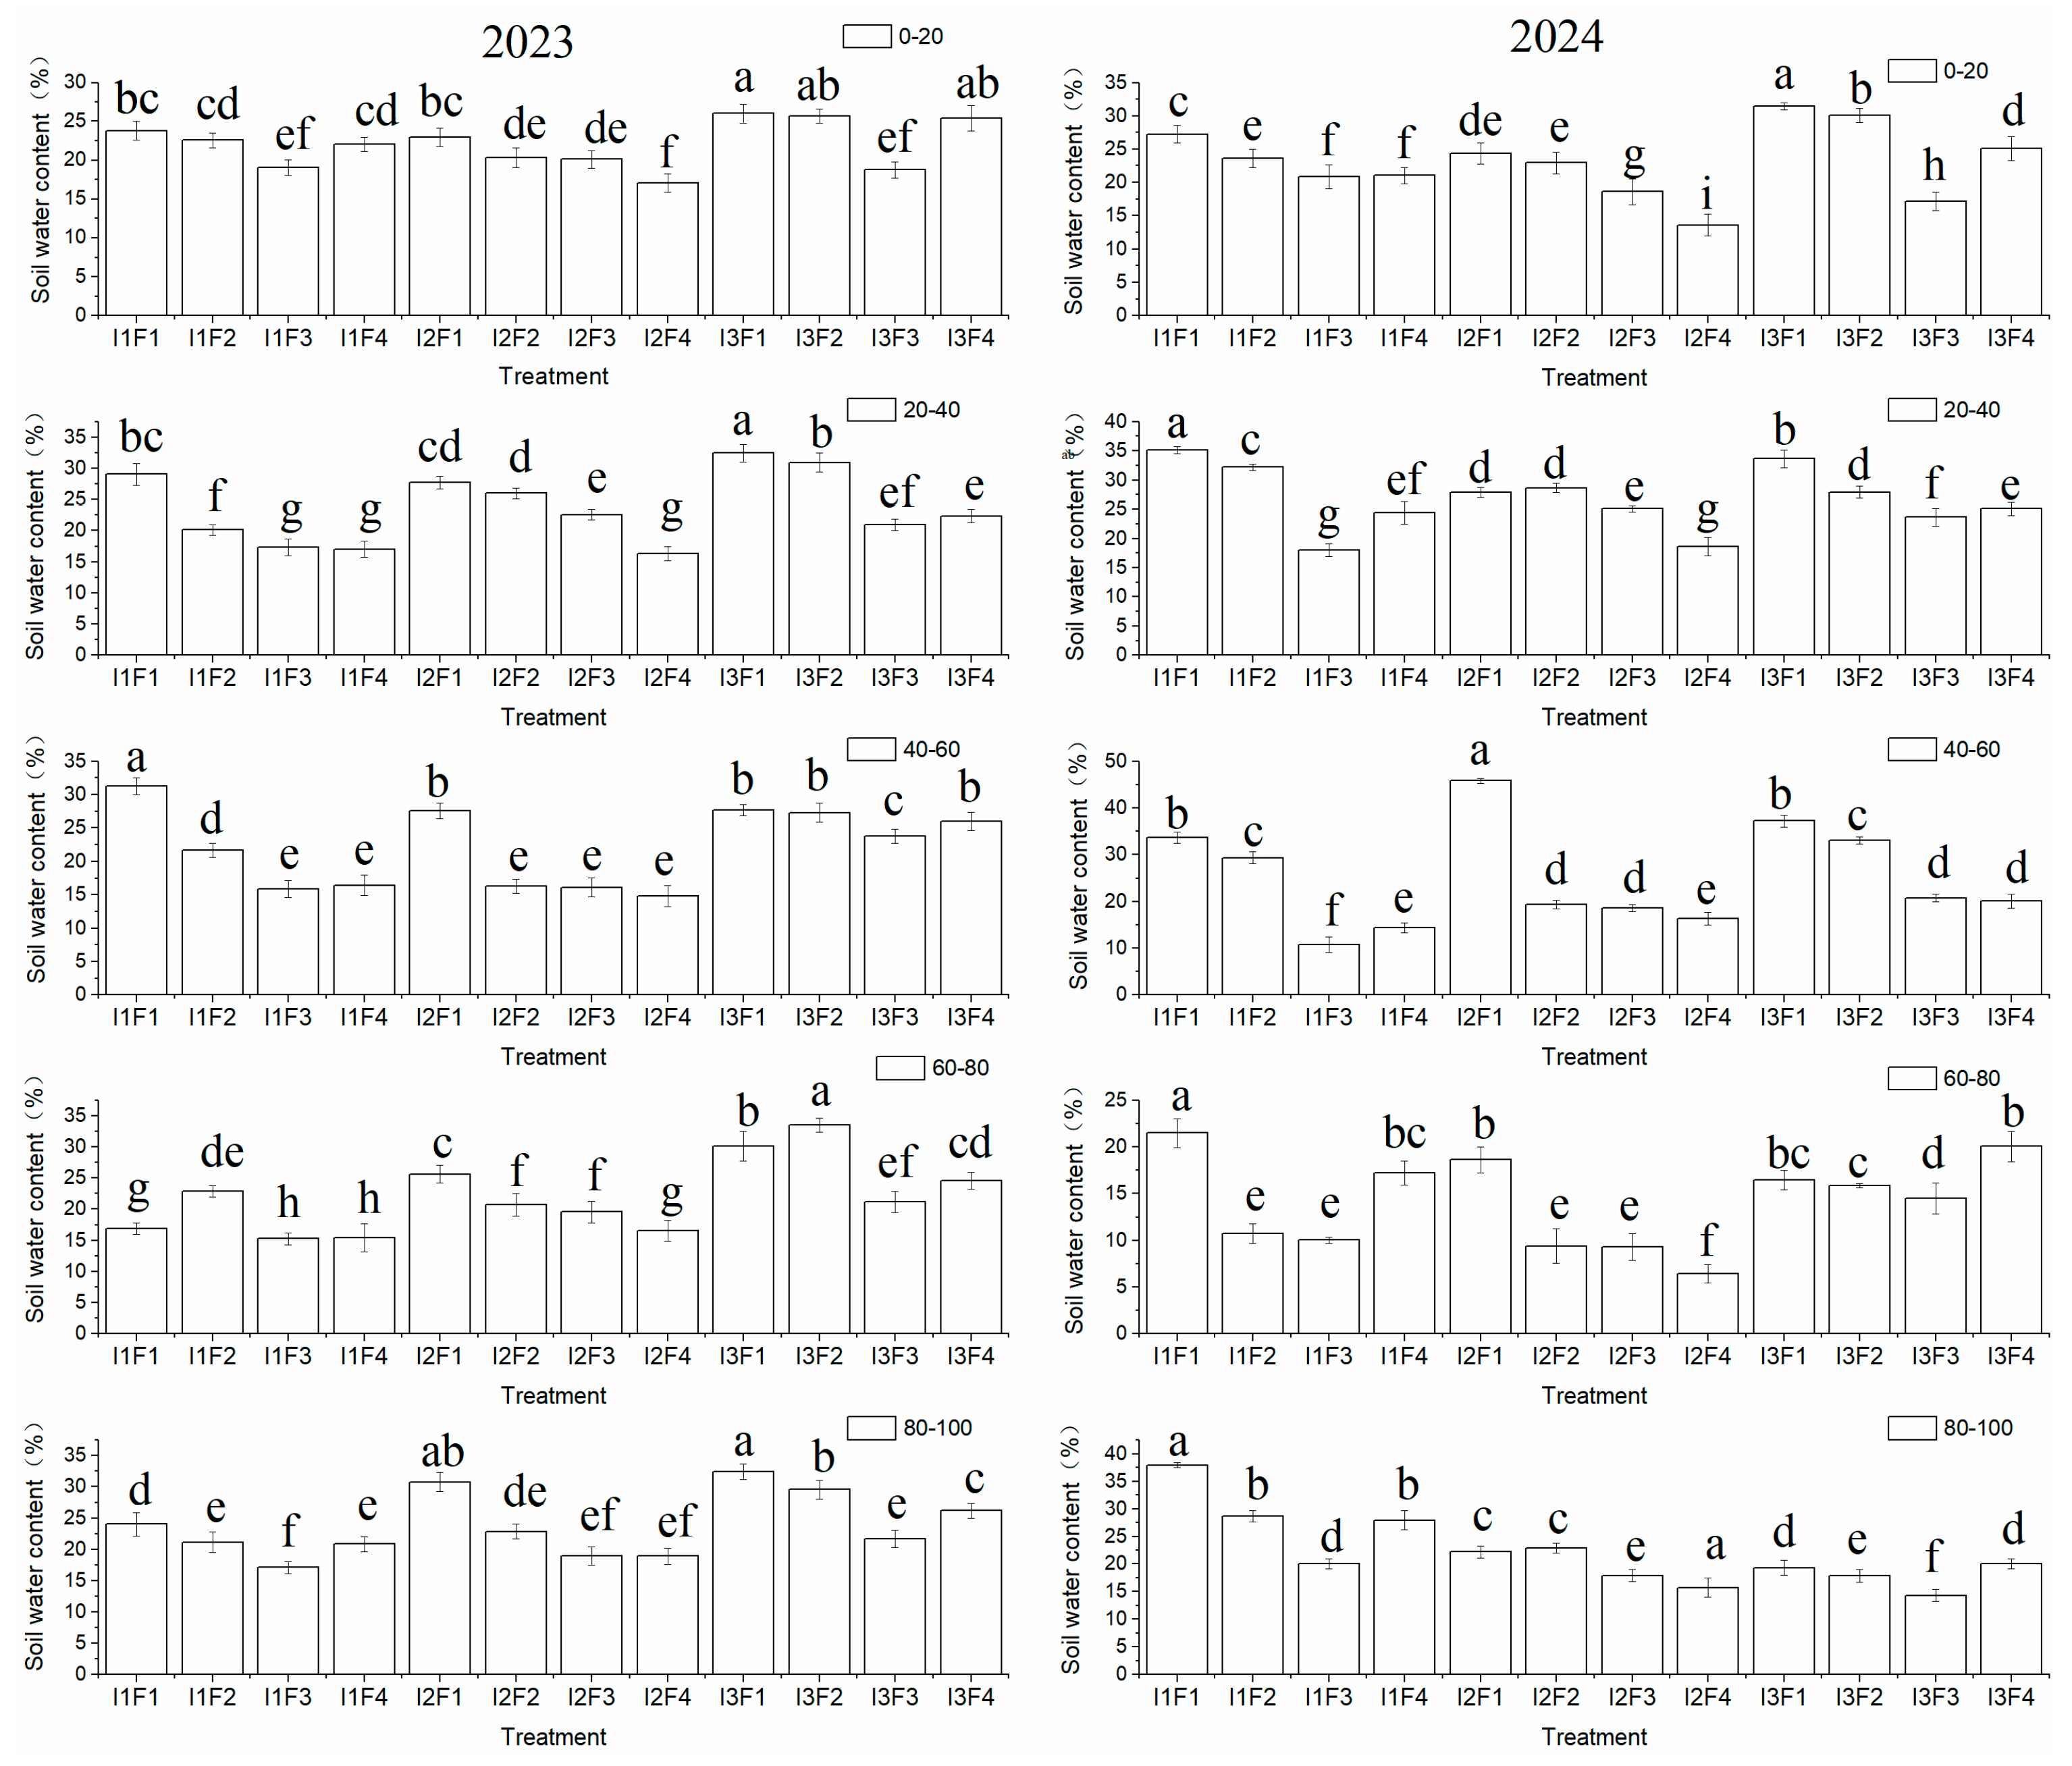
Figure 3.
The Evapotranspiration of feed mulberry with different water and fertilizer treatments in 2023-2024. ΔS represents the change in soil water storage (mm);”I” stands for irrigation and “F” for fertilization, and “W × F” for interaction effect. The vertical bars represent standard errors. The bars labeled at the top of the columns with different letters are significantly different (p < 0.05) among the treatments using the LSD post hoc test.
Figure 3.
The Evapotranspiration of feed mulberry with different water and fertilizer treatments in 2023-2024. ΔS represents the change in soil water storage (mm);”I” stands for irrigation and “F” for fertilization, and “W × F” for interaction effect. The vertical bars represent standard errors. The bars labeled at the top of the columns with different letters are significantly different (p < 0.05) among the treatments using the LSD post hoc test.
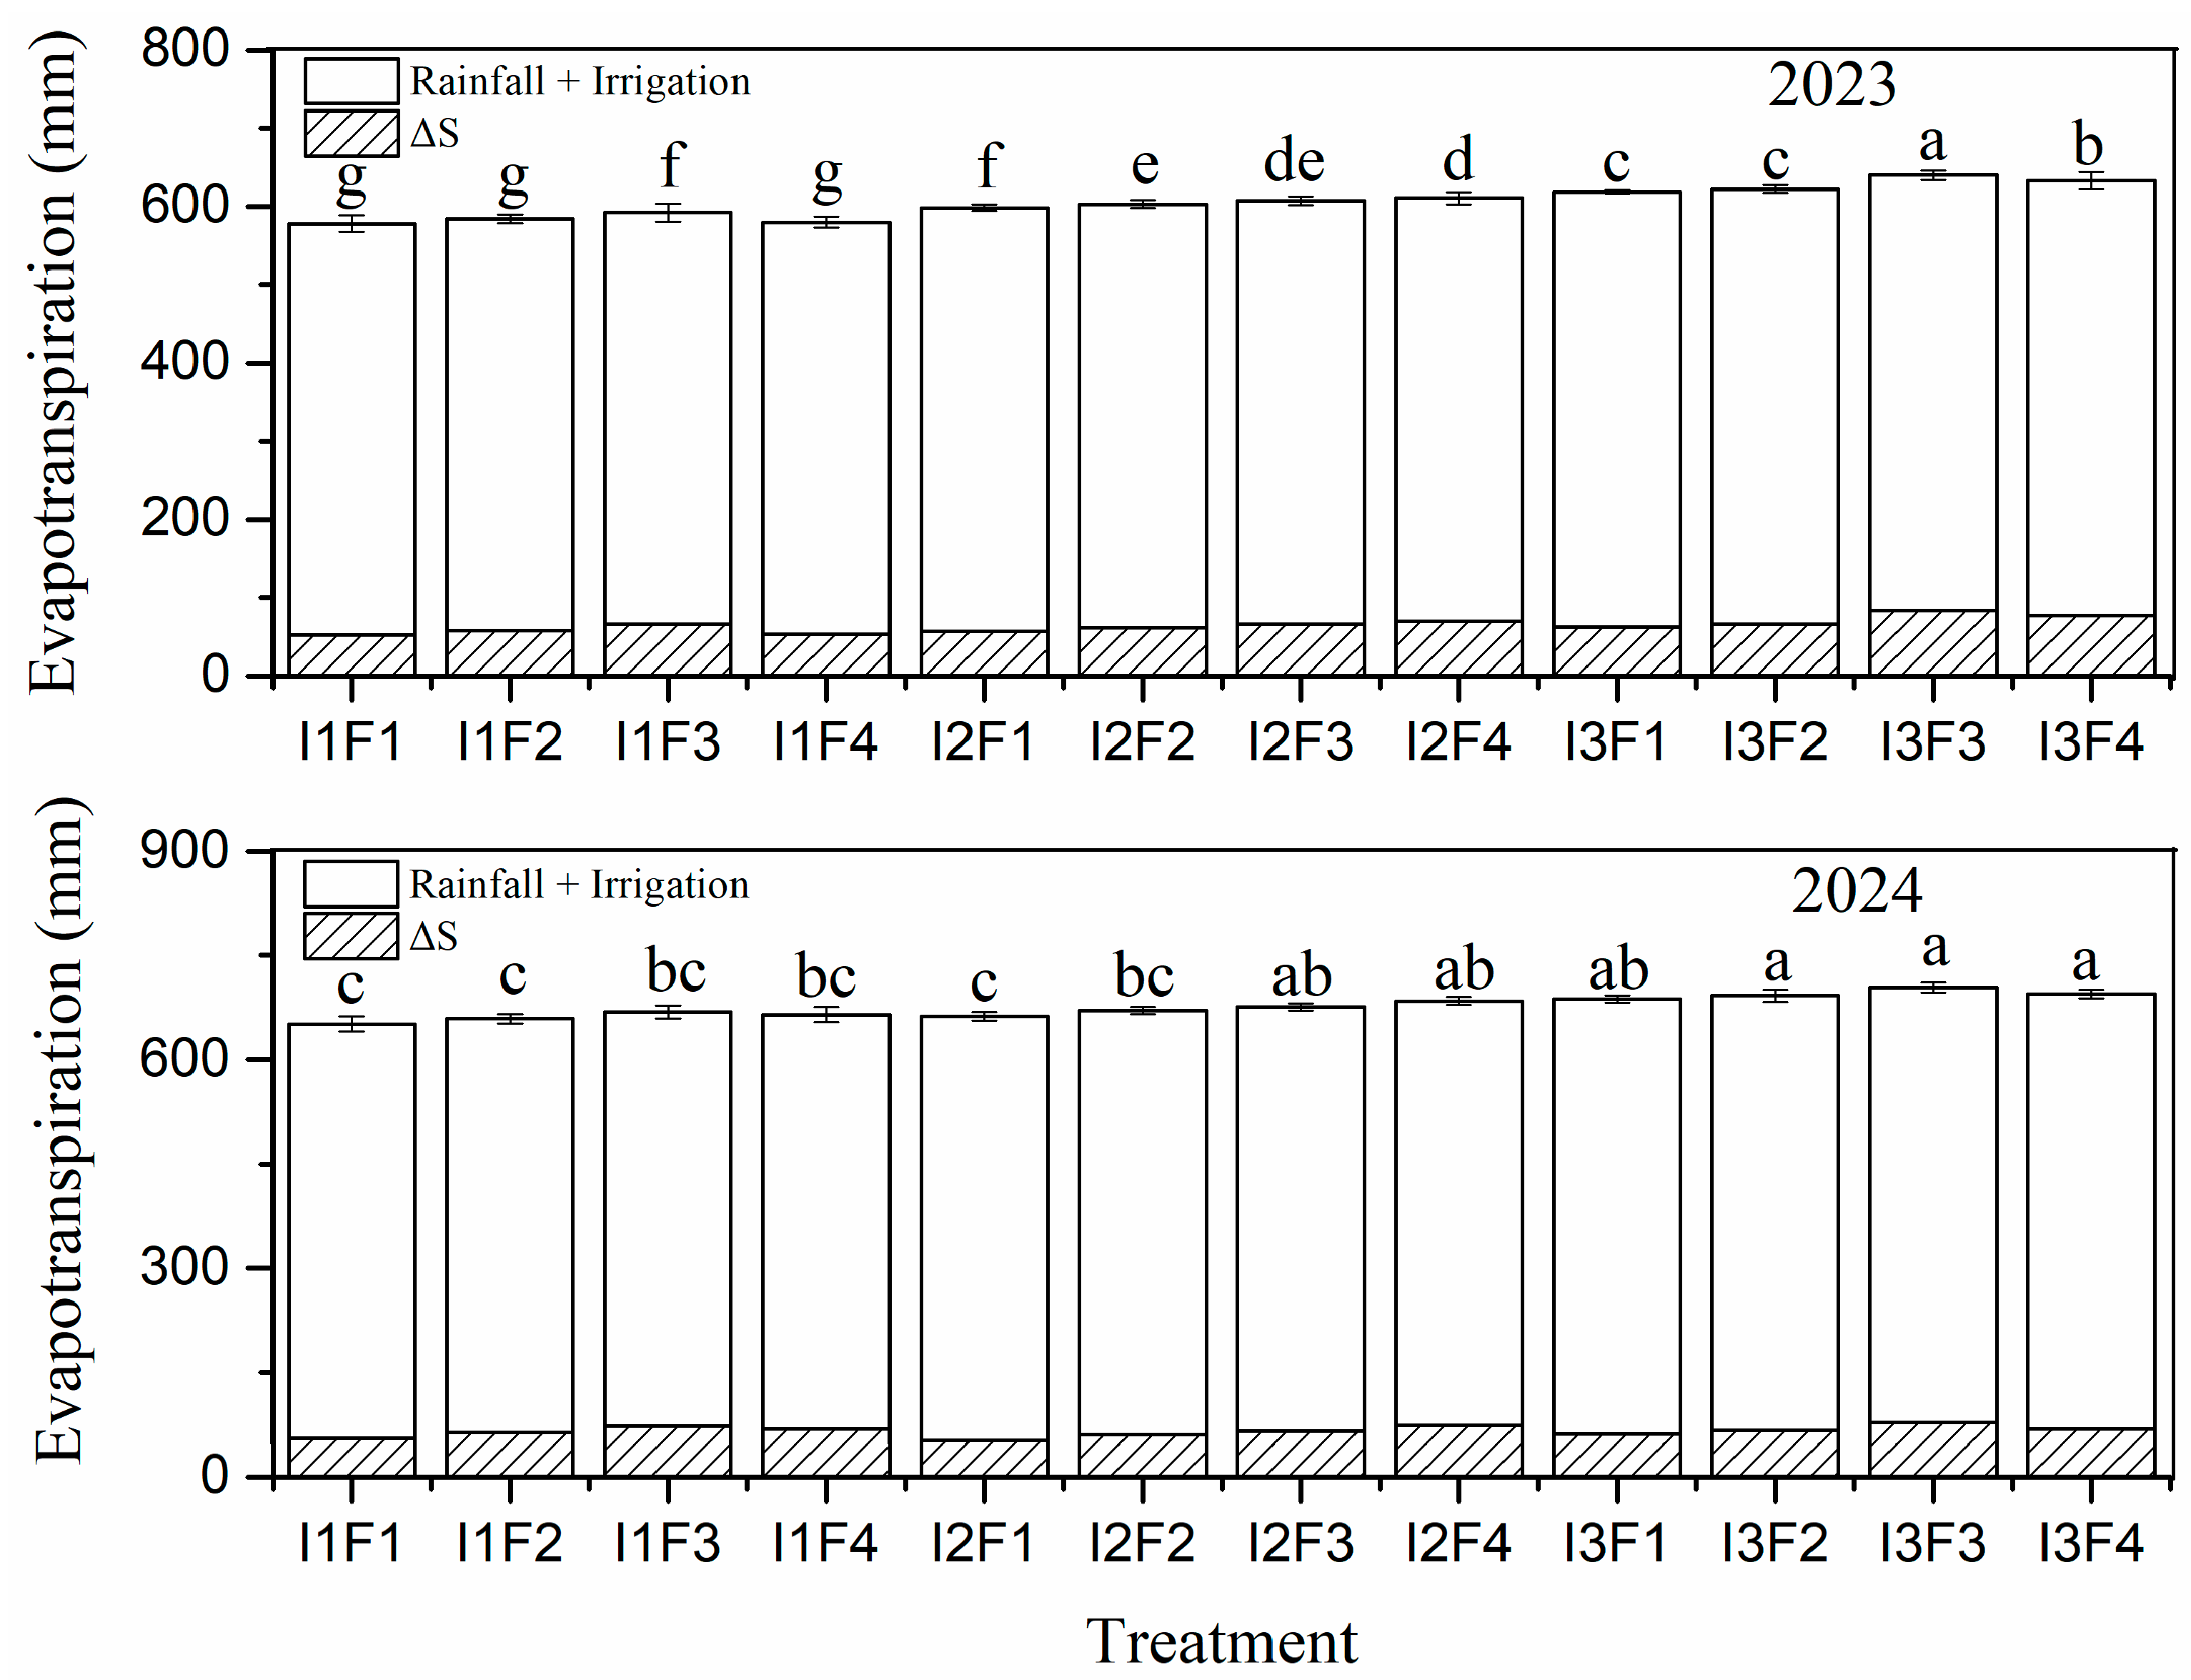
Figure 4.
Soil available N, P, K content in 2023-2024. “I” stands for irrigation and “F” for fertilization, and “W × F” for interaction effect. The vertical bars represent standard errors. The bars labeled at the top of the columns with different letters are significantly different (p < 0.05) among the treatments using the LSD post hoc test.
Figure 4.
Soil available N, P, K content in 2023-2024. “I” stands for irrigation and “F” for fertilization, and “W × F” for interaction effect. The vertical bars represent standard errors. The bars labeled at the top of the columns with different letters are significantly different (p < 0.05) among the treatments using the LSD post hoc test.
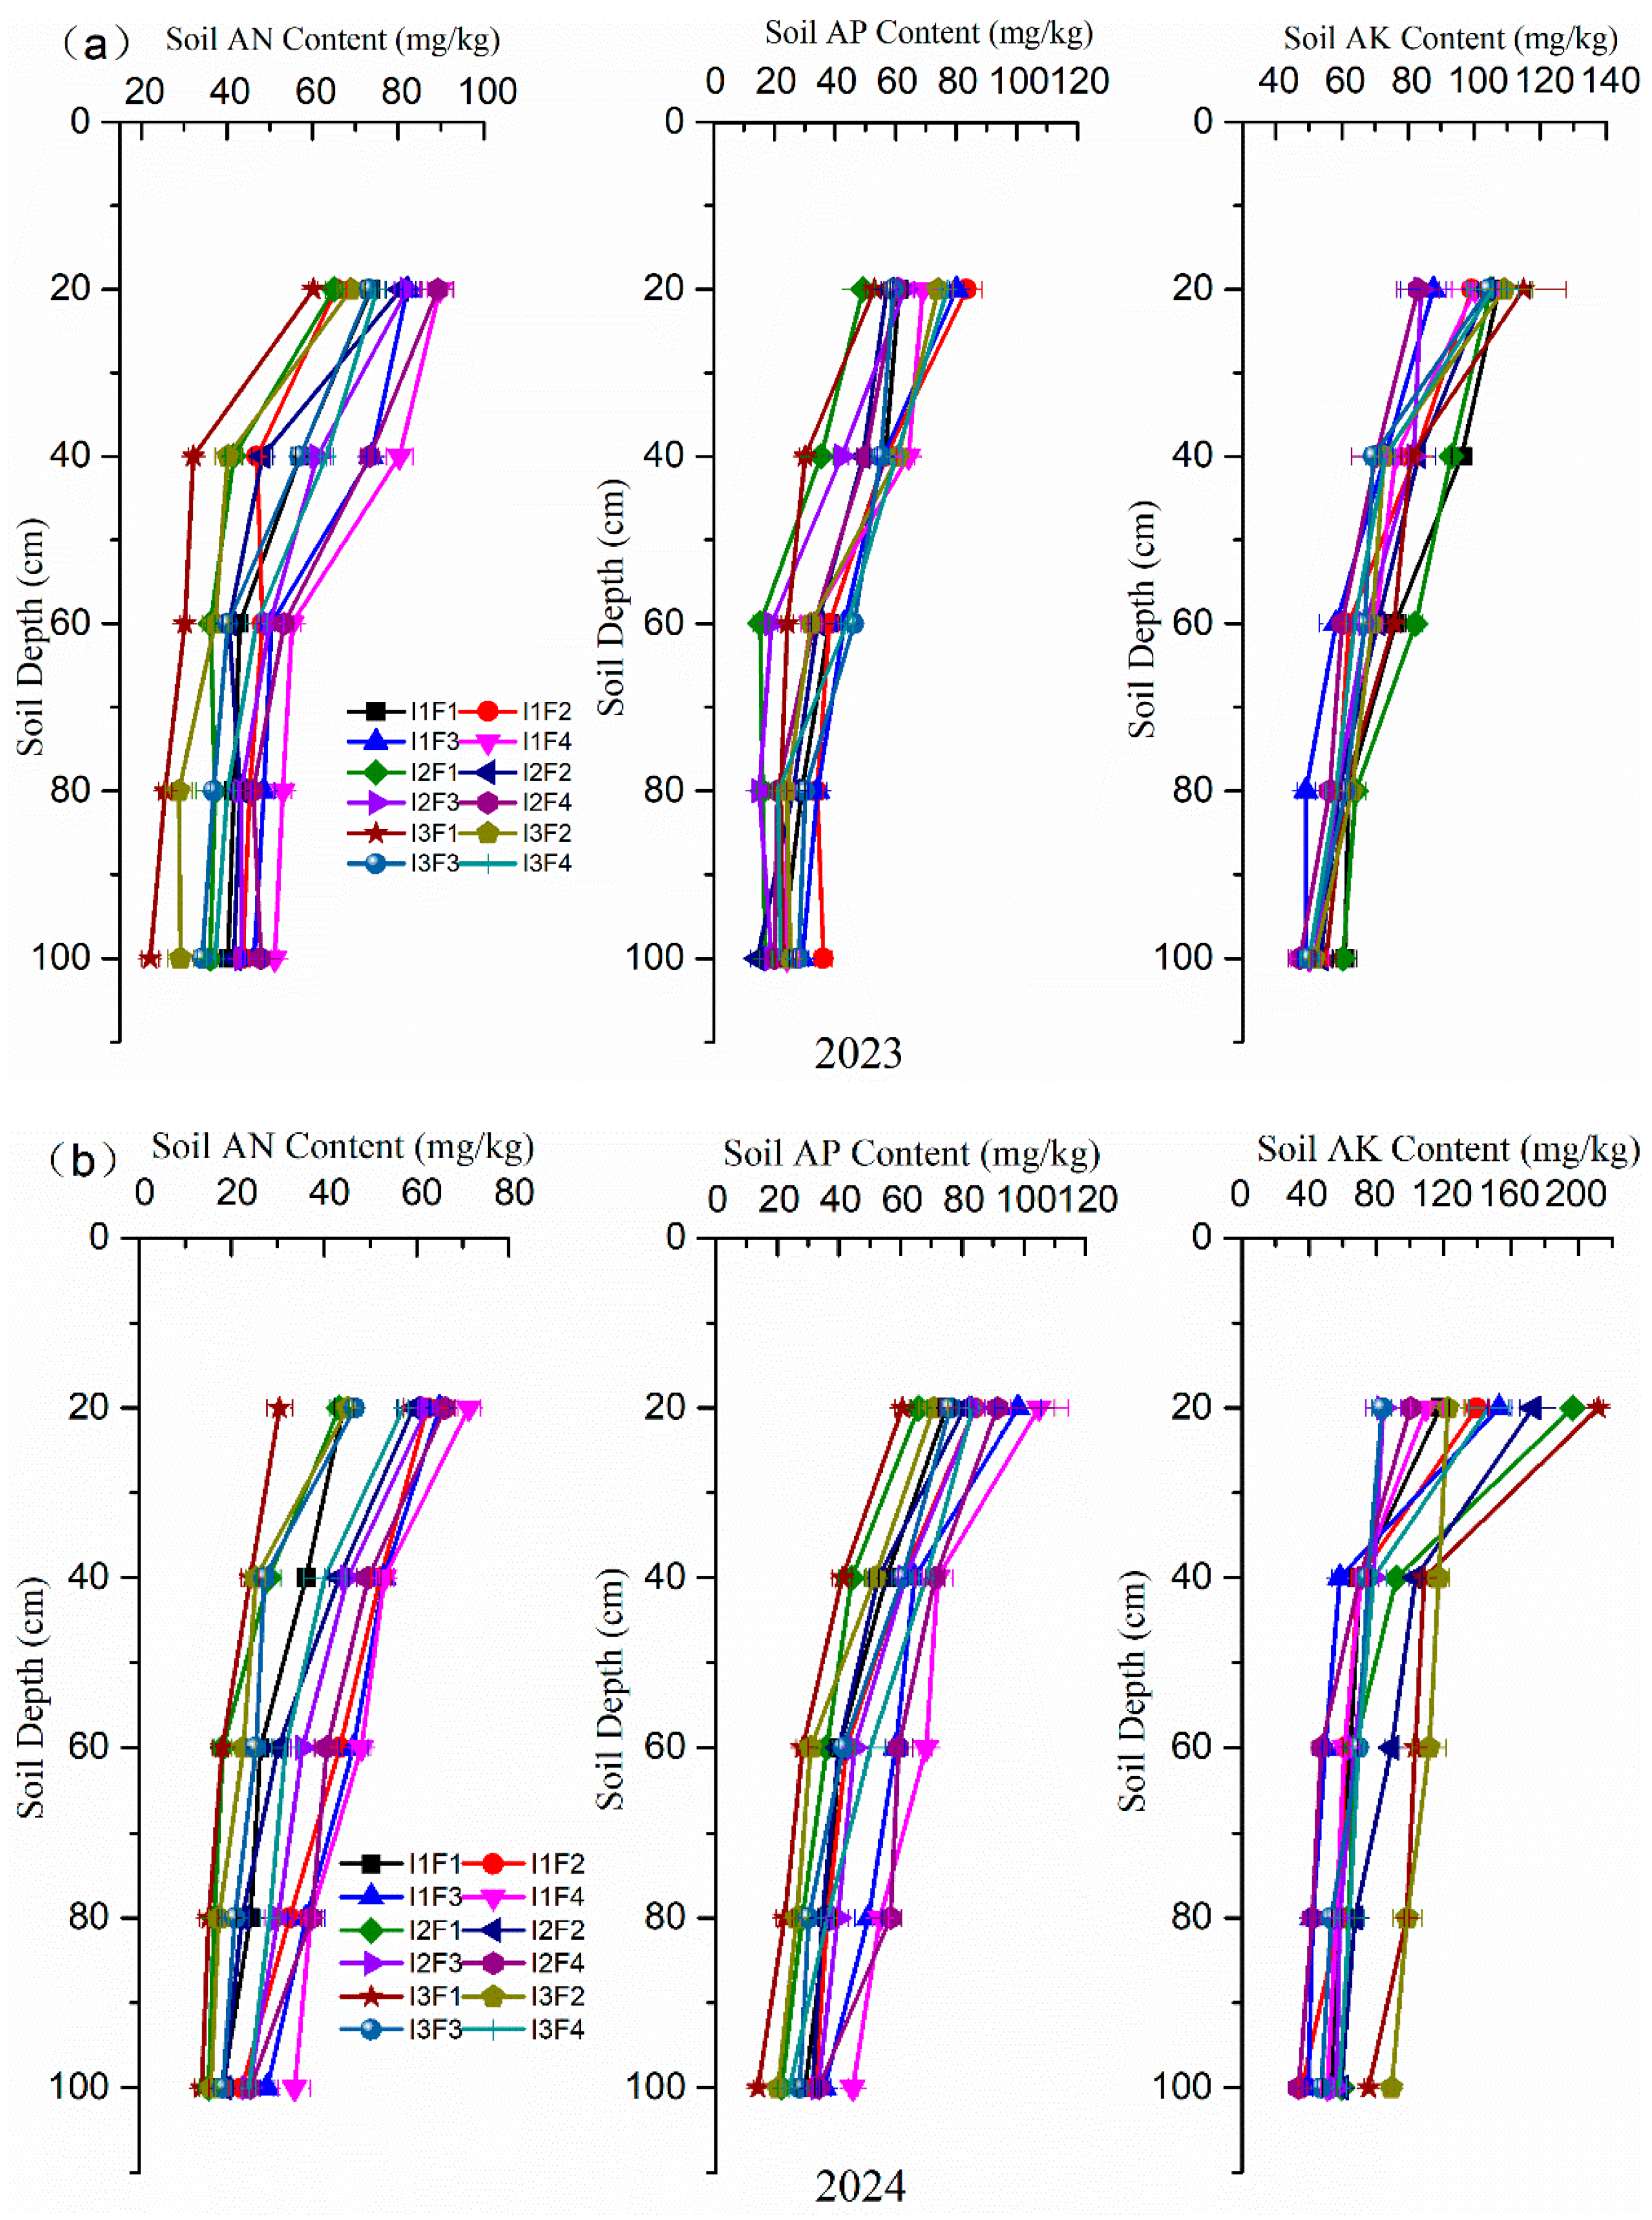
Figure 5.
The nitrogen, phosphorus and potassium content chart of feed mulberry leaves in 2023-2024. “I” stands for irrigation and “F” for fertilization, and “W × F” for interaction effect. The vertical bars represent standard errors. The bars labeled at the top of the columns with different letters are significantly different (p < 0.05) among the treatments using the LSD post hoc test.
Figure 5.
The nitrogen, phosphorus and potassium content chart of feed mulberry leaves in 2023-2024. “I” stands for irrigation and “F” for fertilization, and “W × F” for interaction effect. The vertical bars represent standard errors. The bars labeled at the top of the columns with different letters are significantly different (p < 0.05) among the treatments using the LSD post hoc test.
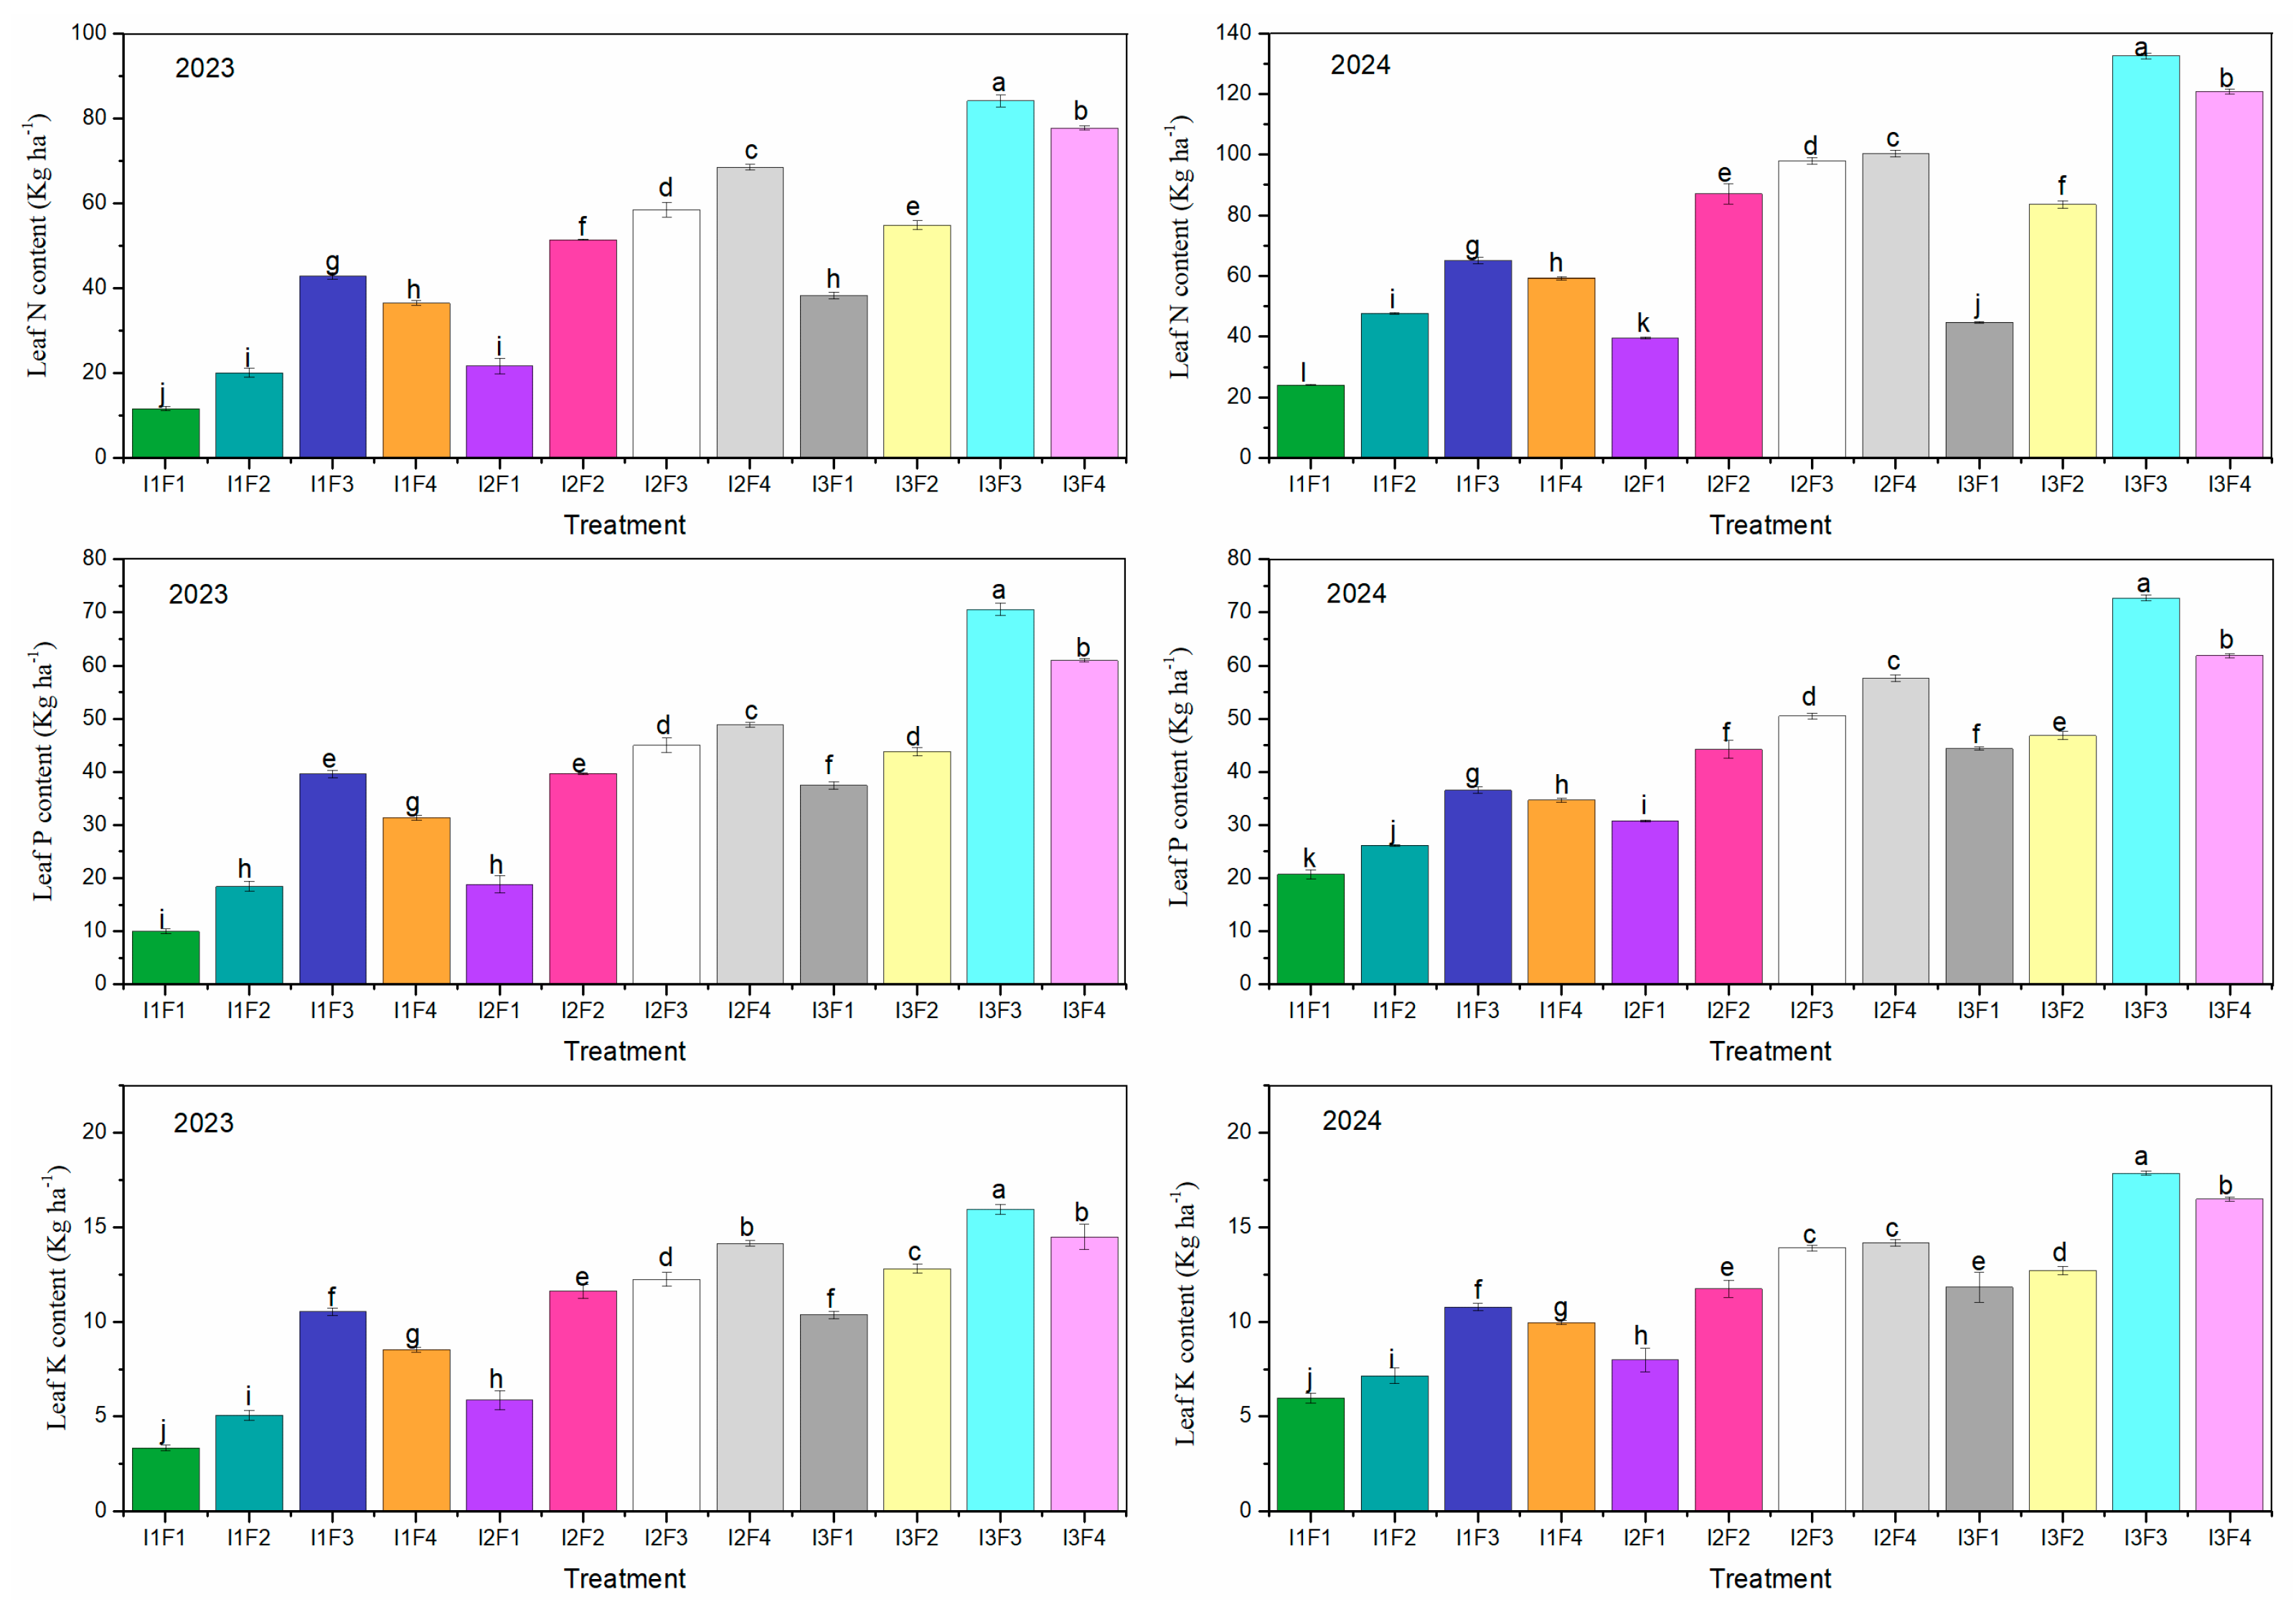
Figure 6.
The water use efficiency chart of feed mulberry in 2023-2024. “I” stands for irrigation and “F” for fertilization, and “W × F” for interaction effect. The vertical bars represent standard errors. The bars labeled at the top of the columns with different letters are significantly different (p < 0.05) among the treatments using the LSD post hoc test.
Figure 6.
The water use efficiency chart of feed mulberry in 2023-2024. “I” stands for irrigation and “F” for fertilization, and “W × F” for interaction effect. The vertical bars represent standard errors. The bars labeled at the top of the columns with different letters are significantly different (p < 0.05) among the treatments using the LSD post hoc test.
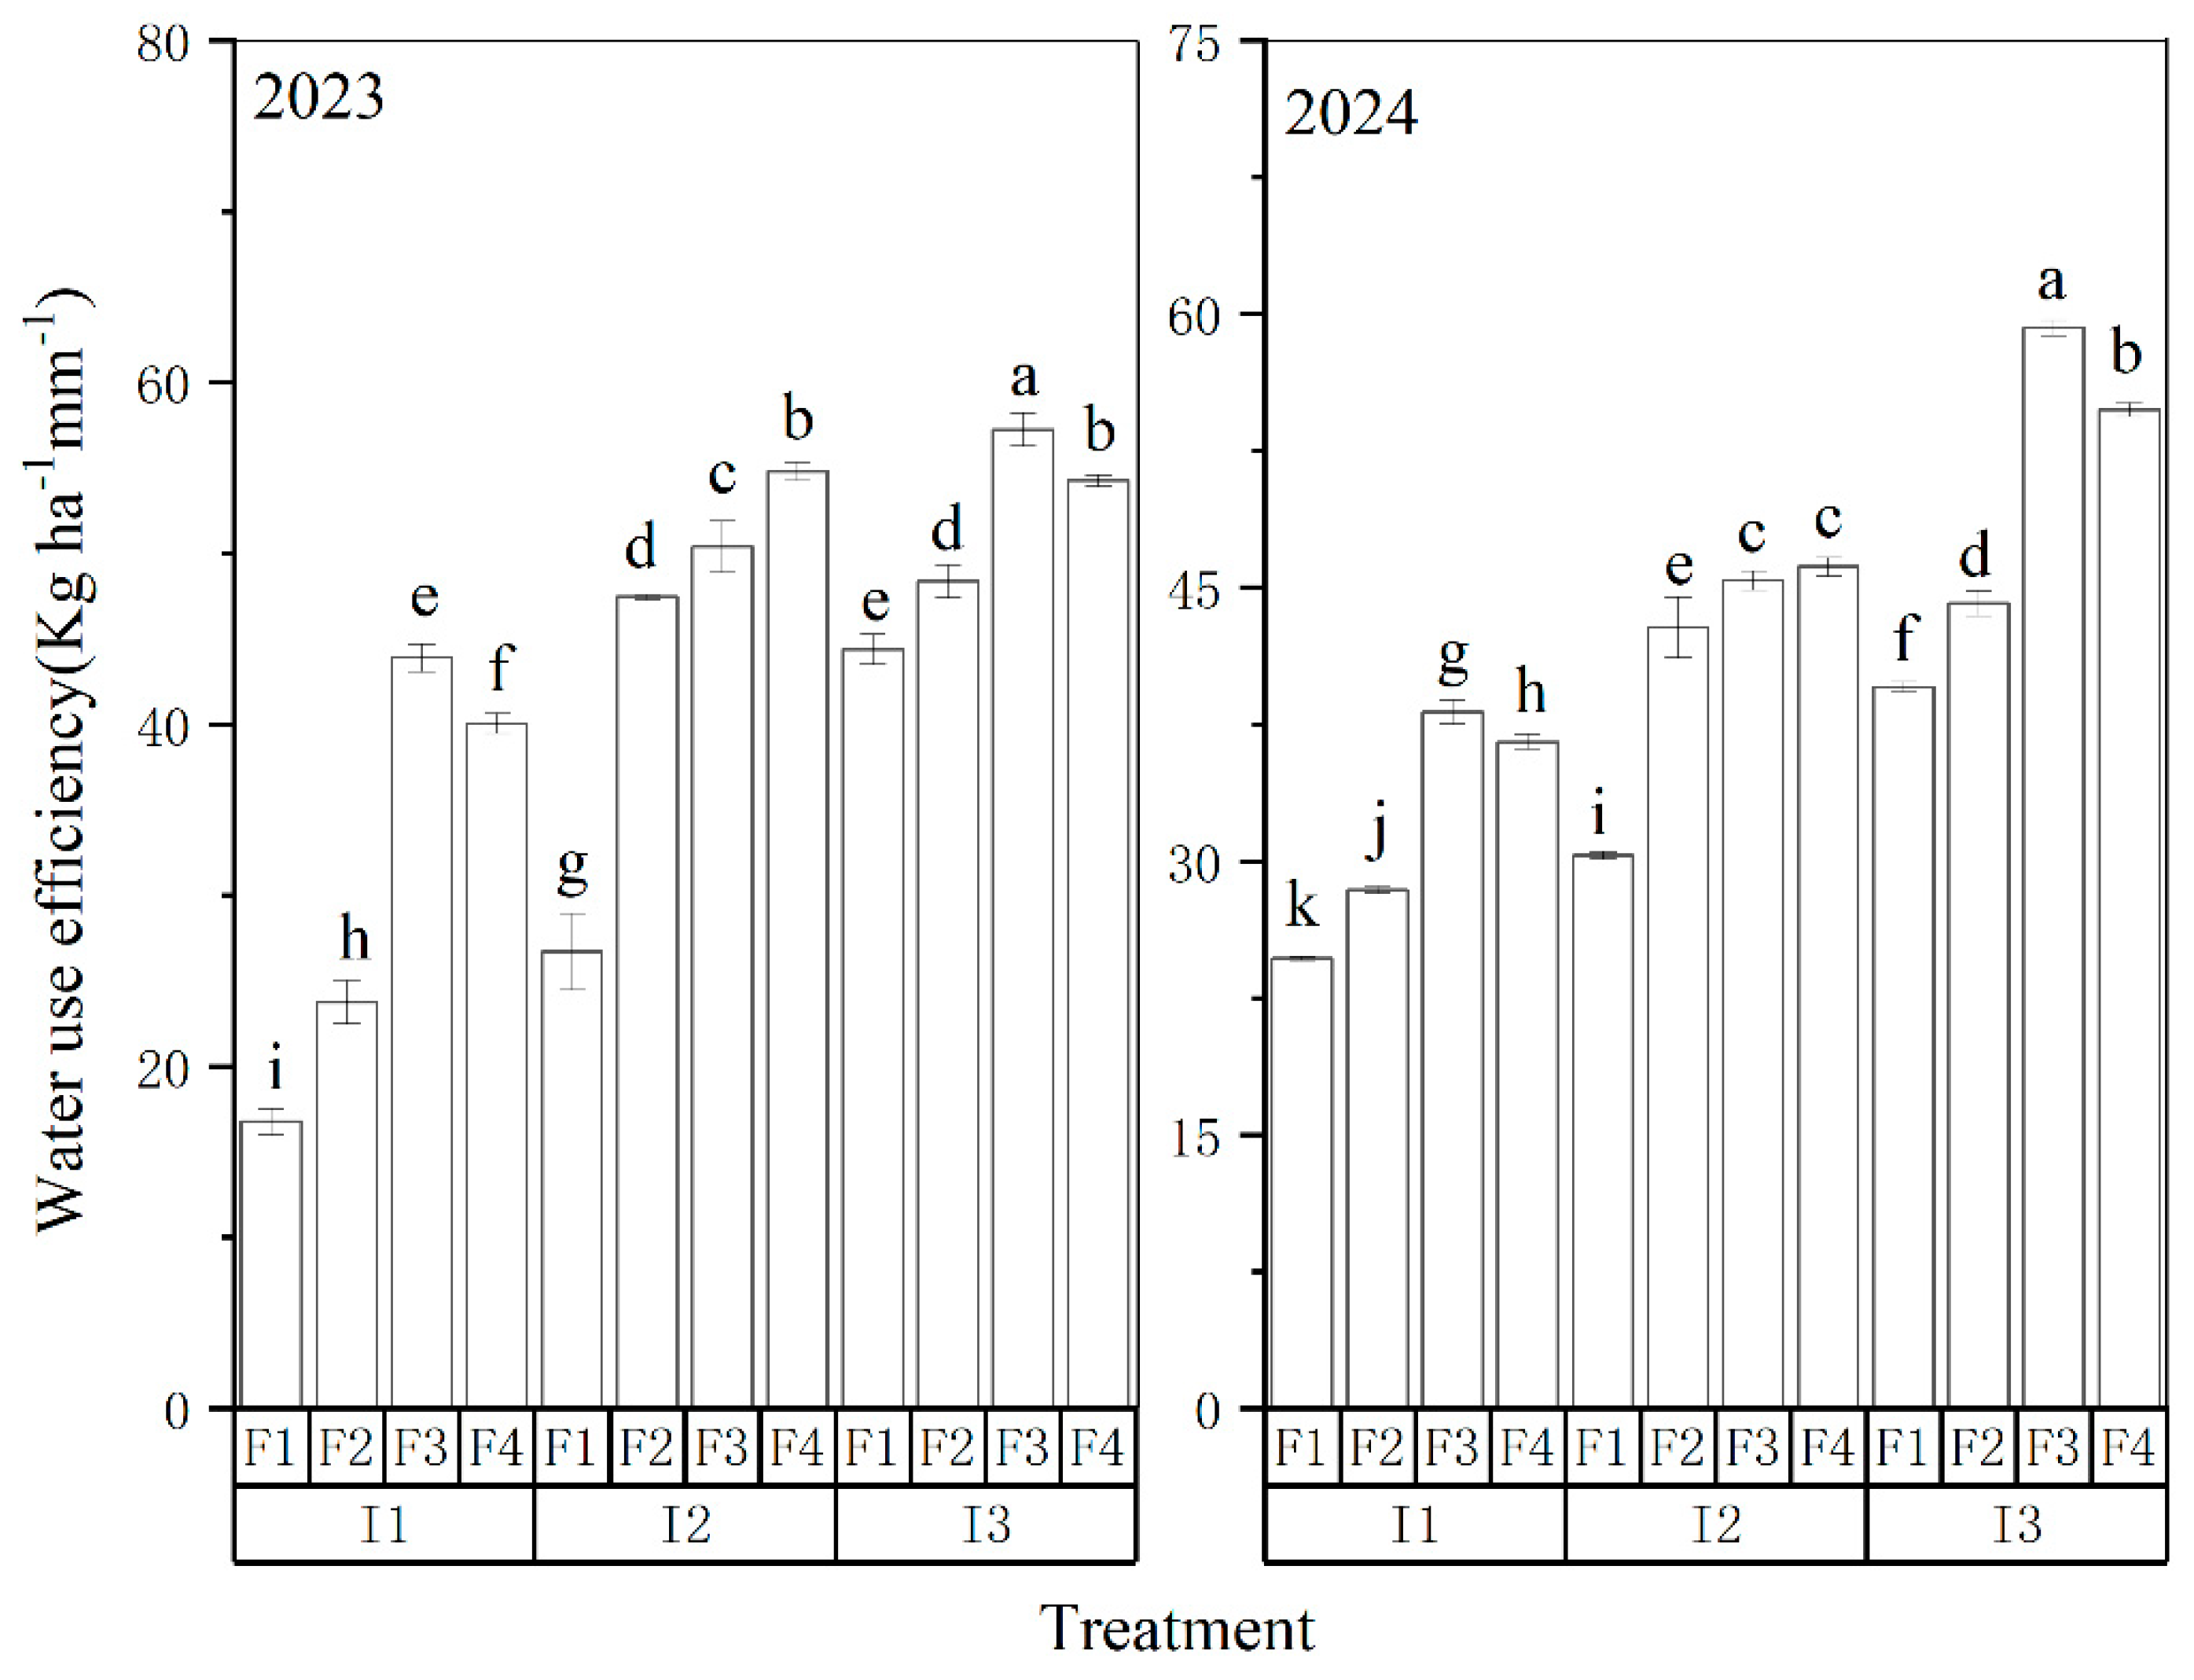
Figure 7.
The irrigation water efficiency of feed mulberry in 2023-2024. “I” stands for irrigation and “F” for fertilization, and “W × F” for interaction effect. The vertical bars represent standard errors. The bars labeled at the top of the columns with different letters are significantly different (p < 0.05) among the treatments using the LSD post hoc test.
Figure 7.
The irrigation water efficiency of feed mulberry in 2023-2024. “I” stands for irrigation and “F” for fertilization, and “W × F” for interaction effect. The vertical bars represent standard errors. The bars labeled at the top of the columns with different letters are significantly different (p < 0.05) among the treatments using the LSD post hoc test.
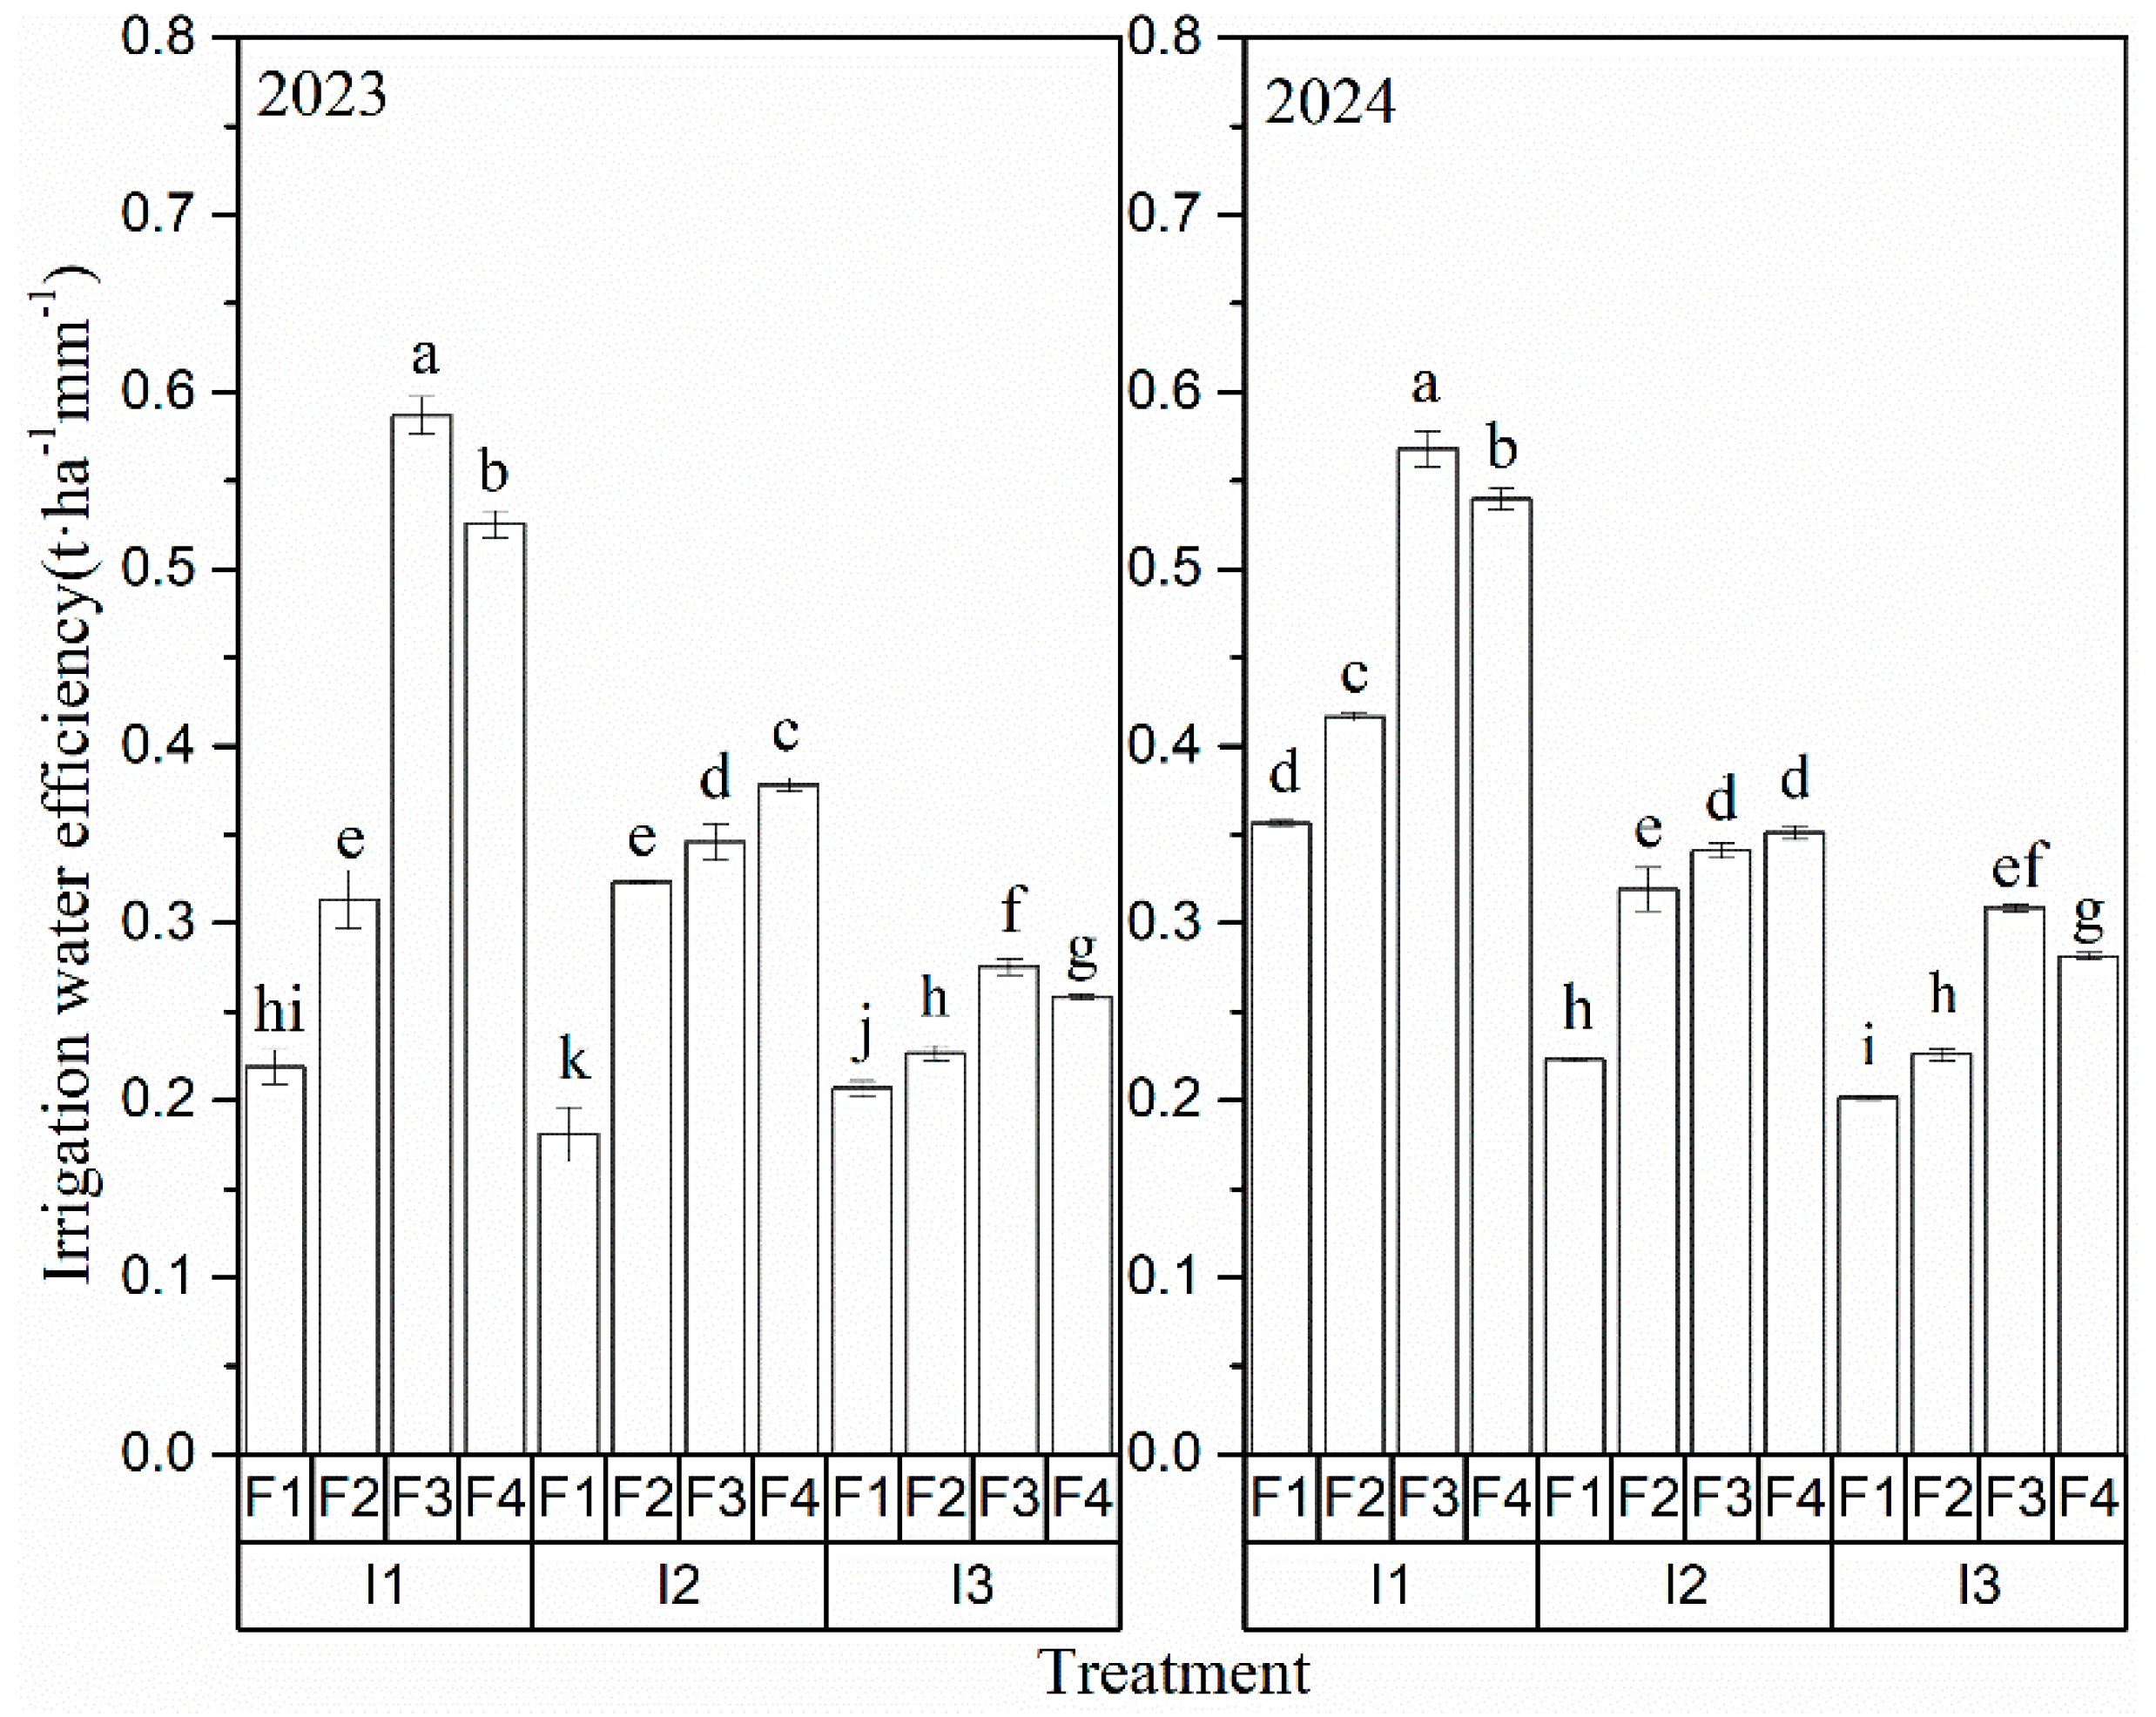
Figure 8.
The agronomic utilization efficiency of nitrogen in feed mulberry. “I” stands for irrigation and “F” for fertilization, and “W × F” for interaction effect. The vertical bars represent standard errors. The bars labeled at the top of the columns with different letters are significantly different (p < 0.05) among the treatments using the LSD post hoc test.
Figure 8.
The agronomic utilization efficiency of nitrogen in feed mulberry. “I” stands for irrigation and “F” for fertilization, and “W × F” for interaction effect. The vertical bars represent standard errors. The bars labeled at the top of the columns with different letters are significantly different (p < 0.05) among the treatments using the LSD post hoc test.
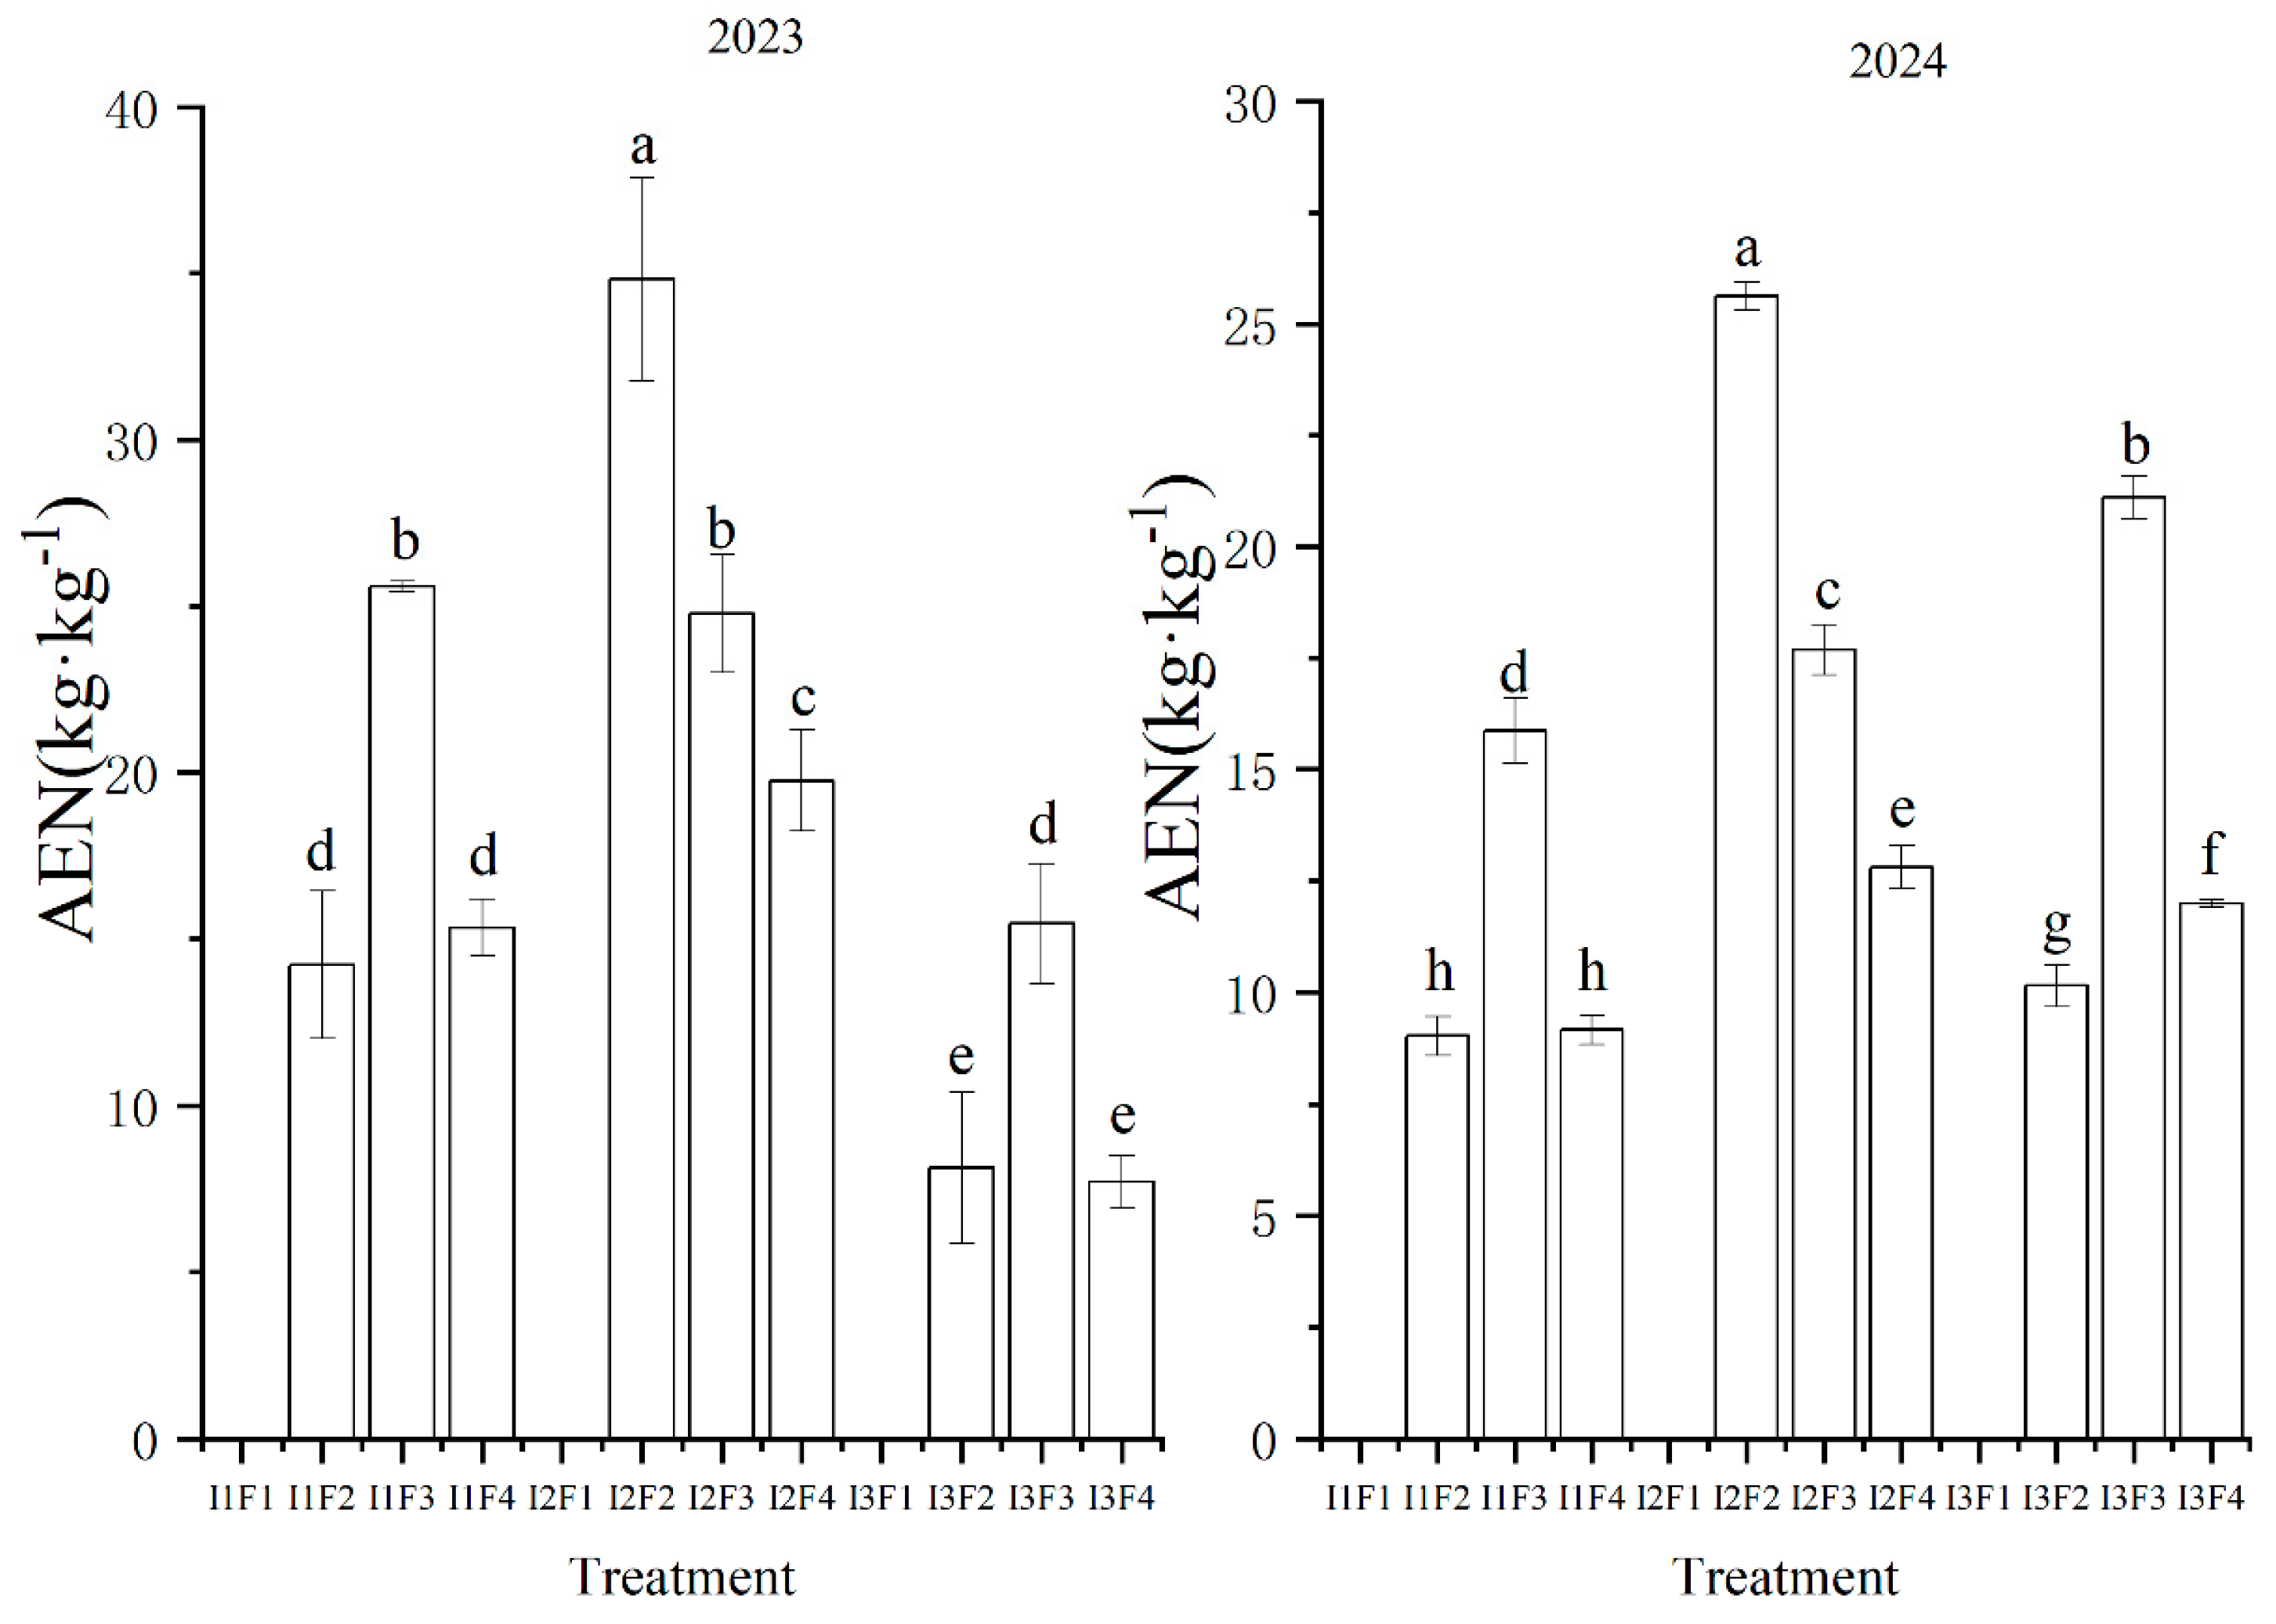
Figure 9.
shows the Structural Equation model (AMOS), which describes the factors influencing crop yield. Each box represents the observed variable or latent variable. Blue arrows indicate positive effects, while red arrows indicate negative effects. Solid lines represent paths that passed the significance test, whereas dashed lines denote non-significant paths. ** indicates p < 0.05. I, irrigation; F, fertilization;H, total water consumption; T, soil nitrogen, phosphorus and potassium content; Y, nitrogen, phosphorus and potassium content in leaves; W, soil moisture use efficiency; C. Yield.
Figure 9.
shows the Structural Equation model (AMOS), which describes the factors influencing crop yield. Each box represents the observed variable or latent variable. Blue arrows indicate positive effects, while red arrows indicate negative effects. Solid lines represent paths that passed the significance test, whereas dashed lines denote non-significant paths. ** indicates p < 0.05. I, irrigation; F, fertilization;H, total water consumption; T, soil nitrogen, phosphorus and potassium content; Y, nitrogen, phosphorus and potassium content in leaves; W, soil moisture use efficiency; C. Yield.
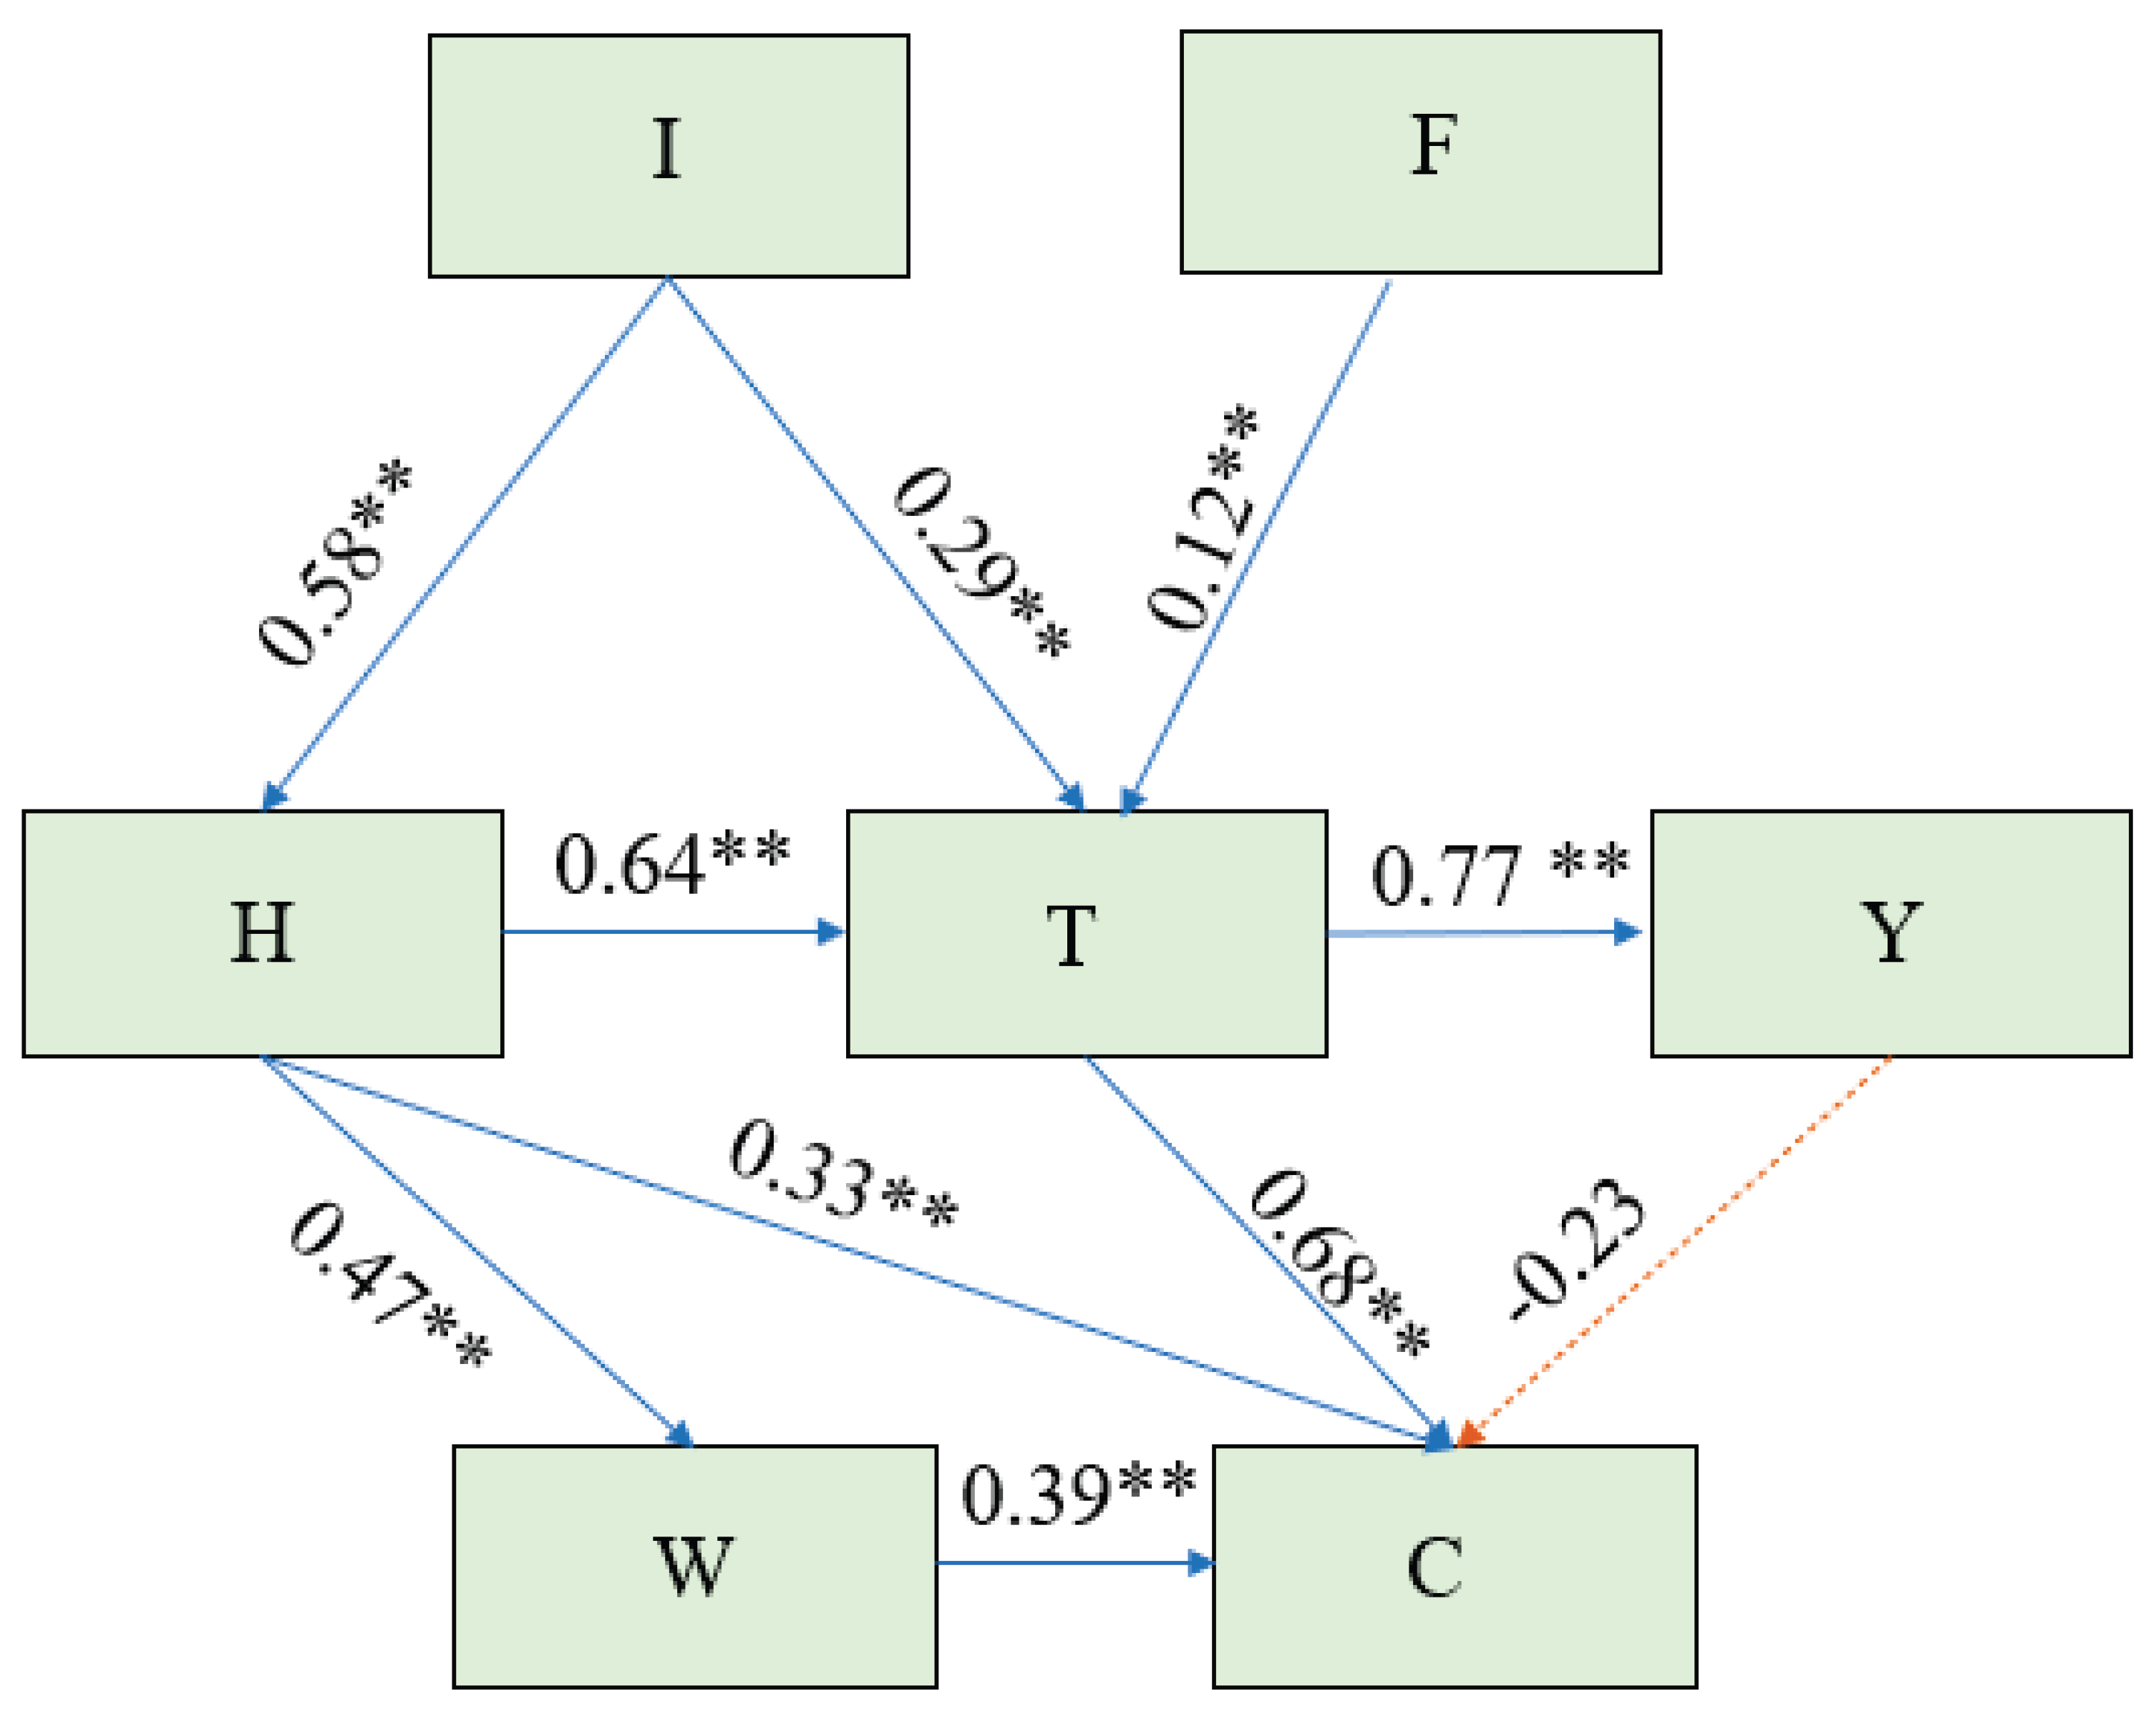

Table 1.
Main chemical properties of test soil.
| soil (cm) |
pH | Organic matter (g kg-1) |
Quick-release nitrogen (AN) (mg kg-1) |
Quick-release phosphorus (AP) (mg kg-1) |
Available potassium (AK) (mg kg-1) |
| 0-20 | 6.94 | 9.63 | 50.72 | 10.36 | 152 |
| 20-40 | 7.44 | 6.83 | 56.17 | 5.96 | 122 |
| 40-60 | 7.36 | 3.68 | 23.29 | 5.79 | 59 |
Table 2.
Table 2. The amount of irrigation water and fertilizer.
| treatment | main plots | subplots |
|---|---|---|
| Irrigation(mm) | fertilizer(kg ha-1) | |
| I1F1 | I1=45 | F1= 0 |
| I1F2 | I1=45 | F2= Urea 150 |
| I1F3 | I1=45 | F3= Urea 225 |
| I1F4 | I1=45 | F4= Urea 300 |
| I2F1 | I2=90 | F1= 0 |
| I2F2 | I2=90 | F2= Urea 150 |
| I2F3 | I2=90 | F3= Urea 225 |
| I2F4 | I2=90 | F4= Urea 300 |
| I3F1 | I3=135 | F1= 0 |
| I3F2 | I3=135 | F2= Urea 150 |
| I3F3 | I3=135 | F3= Urea 225 |
| I3F4 | I3=135 | F4= Urea 300 |
Table 3.
Mulberry yield and yield components in 2023 - 2024.
| Time | Leaf weight | Leaf number | Branches weight | Branches Number | Yield |
|---|---|---|---|---|---|
| (g/piece) | (piece/plant) | (g/plant) | (branch/plant) | (t/ ha) | |
| 2023 | |||||
| Interaction | |||||
| I1 | 2.76c | 85.53c | 213.62c | 5.20c | 18.50c |
| I2 | 3.47b | 97.76b | 321.69b | 6.92b | 27.63b |
| I3 | 3.98a | 106.56a | 390.84a | 8.05a | 32.89a |
| F1 | 2.49c | 86.26c | 204.59d | 5.33d | 18.01c |
| F2 | 3.07b | 91.16b | 281.25c | 6.36c | 24.59b |
| F3 | 4.08a | 105.12a | 380.71a | 7.73a | 31.62a |
| F4 | 3.98a | 103.93a | 368.31a | 7.44b | 30.84b |
| Coupling | |||||
| I1F1 | 1.80e | 77.00g | 102.35k | 4.21j | 9.84i |
| I1F2 | 2.19de | 83.34f | 148.89j | 5.00i | 14.10h |
| I1F3 | 3.63b | 91.67e | 312.40g | 6.03g | 26.40e |
| I1F4 | 3.43bc | 90.11e | 290.82h | 5.56h | 23.64f |
| I2F1 | 3.08c | 83.56f | 181.20i | 5.04i | 16.26g |
| I2F2 | 3.42bc | 91.78e | 337.37f | 6.70f | 29.08d |
| I2F3 | 3.53bc | 103.59cd | 373.67d | 7.78d | 31.13c |
| I2F4 | 3.85b | 112.11b | 394.53c | 8.16c | 34.04b |
| I3F1 | 2.58d | 98.22d | 330.21f | 6.74f | 27.92e |
| I3F2 | 3.62b | 98.37d | 357.50e | 7.39e | 30.59c |
| I3F3 | 5.09a | 120.11a | 456.79a | 9.48a | 37.19a |
| I3F4 | 4.65a | 109.56bc | 418.87b | 8.60b | 35.85b |
| 2024 | |||||
| Interaction | |||||
| I1 | 2.42c | 73.18c | 239.15c | 6.30c | 21.16c |
| I2 | 3.15b | 115.04b | 361.34b | 7.68ba | 27.77b |
| I3 | 3.29a | 130.91a | 445.06a | 8.24a | 34.34a |
| F1 | 2.15d | 78.39d | 232.54d | 6.46c | 21.10d |
| F2 | 2.90c | 105.41c | 317.94c | 7.26b | 26.44c |
| F3 | 3.55a | 125.90a | 433.46a | 8.00a | 32.63a |
| F4 | 3.25b | 115.81b | 410.13b | 7.90a | 29.39b |
| Coupling | |||||
| I1F1 | 1.92i | 49.30g | 155.01j | 6.05g | 16.04k |
| I1F2 | 2.28g | 67.86f | 202.97i | 6.25fg | 18.75j |
| I1F3 | 3.01e | 95.35e | 313.87g | 6.49f | 25.56g |
| I1F4 | 2.46f | 80.21f | 284.77h | 6.41f | 24.28h |
| I2F1 | 2.05h | 73.39f | 207.02i | 6.18fg | 20.07i |
| I2F2 | 3.17d | 120.97cd | 365.63e | 7.68d | 30.05e |
| I2F3 | 3.61c | 133.75bc | 433.57c | 8.35c | 31.01cd |
| I2F4 | 3.75b | 132.05bc | 439.16c | 8.53bc | 31.60c |
| I3F1 | 2.33g | 112.48d | 335.60f | 7.15e | 27.20f |
| I3F2 | 3.26d | 127.40bc | 385.23d | 7.83d | 30.51de |
| I3F3 | 3.89a | 148.60a | 552.93a | 9.16a | 41.66a |
| I3F4 | 3.68bc | 135.17b | 506.48b | 8.80b | 37.99b |
“I” stands for irrigation and “F” for fertilization, and “W × F” for interaction effect. Values followed by different letters are significantly (P < 0.05). Using LSD post-hoc test different treatments.
Disclaimer/Publisher’s Note: The statements, opinions and data contained in all publications are solely those of the individual author(s) and contributor(s) and not of MDPI and/or the editor(s). MDPI and/or the editor(s) disclaim responsibility for any injury to people or property resulting from any ideas, methods, instructions or products referred to in the content. |
© 2026 by the authors. Licensee MDPI, Basel, Switzerland. This article is an open access article distributed under the terms and conditions of the Creative Commons Attribution (CC BY) license.
Copyright: This open access article is published under a Creative Commons CC BY 4.0 license, which permit the free download, distribution, and reuse, provided that the author and preprint are cited in any reuse.


