Submitted:
11 June 2026
Posted:
12 June 2026
You are already at the latest version
Abstract
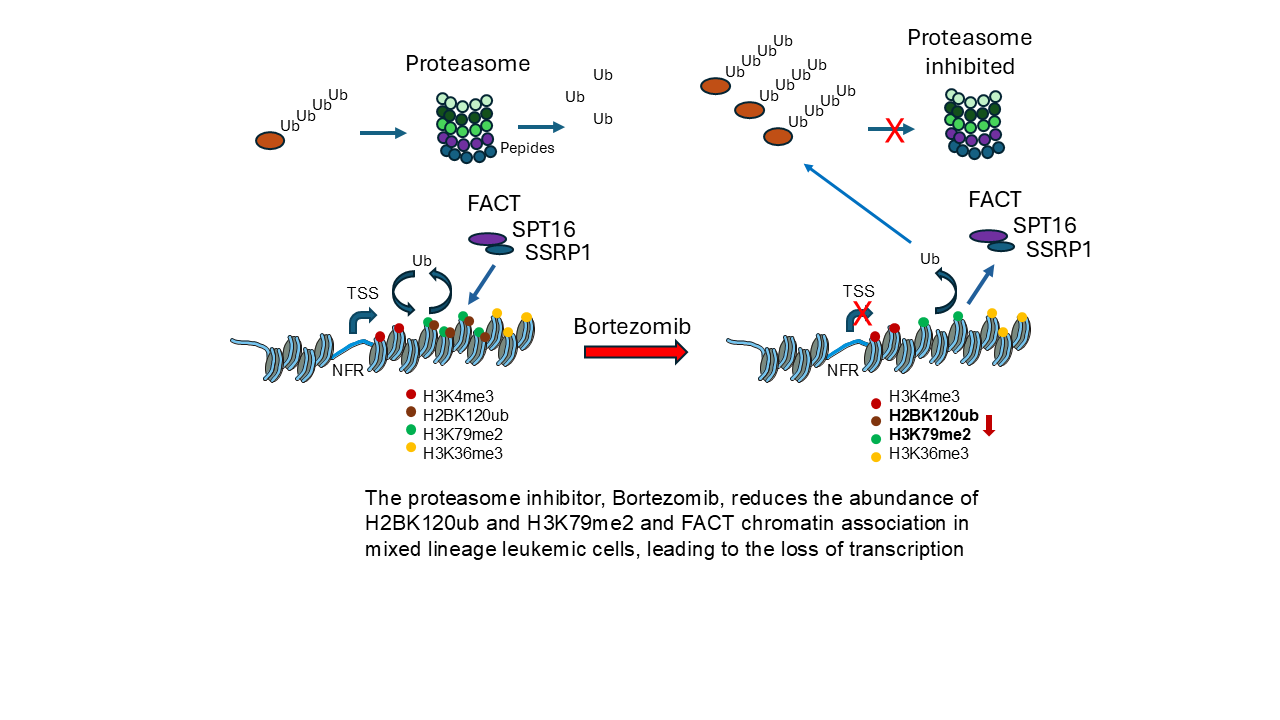
Histone-modifying enzymes and histone post-translational modifications (PTMs) play key roles in the organization (euchromatin versus heterochromatin) and function (active versus silenced genes) of chromatin. The abundance and activity of these enzymes, along with their associated histone PTMs, are often altered in cancer cells, leading to deregulated gene expression. The expression of the KMT2A-MLLT3 protein, resulting from a chromosomal translocation in mixed-lineage leukemia (MLL), a subtype of acute myeloid leukemia, augments transcription elongation, promoting the expression of HOXA9 and MEIS1, genes that play critical roles in MLL development. Bortezomib, a proteasome inhibitor, has been effective in treating various cancers. In this study, we compared the impact of bortezomib on histone PTMs in the MLL cell line MOLM-13 and the chronic myeloid leukemic (CML) cell line K562. We report that MOLM-13 had a greater level of histone H2B monoubiquitinated at lysine 120 (H2BK120ub) and histone H3 dimethylated at lysine 79 (H3K79me2) (modifications involved in elongation) and similar levels of histone H2A monoubiquitinated at lysine 119 (H2AK119ub). Bortezomib treatment resulted in significant reductions in H2BK120ub and H2AK119ub levels, the loss of FAcilitates Chromatin Transcription (FACT) chromatin association in both cell lines, and the reduced transcript levels of genes involved in the development of MLL.
Keywords:
proteasome
; bortezomib
; histone H2B ubiquitinated at lysine 120
; histone H2A ubiquitinated at lysine 119
1. Introduction
Acute myeloid leukemia (AML) is an aggressive blood cancer that affects both adults and children but mainly occurs in pediatric patients. MLL, a subtype of AML, is characterized by a KMT2A rearrangement at 11q23 that can fuse with over 80 partner genes, including but not limited to AFF1/AF4, MLLT10/AF10, MLLT3/AF9, and MLLT1/EN [1]. The KMT2A-MLLT3 fusion protein, resulting from the t(9;11)(p22;q23) translocation, is one of the most common and well-studied fusions in KMT2A-rearranged leukemia. In AML, the KMT2A gene, which codes for an H3K4 lysine methyltransferase, fuses with another protein-coding gene, generating an oncoprotein. In this fusion, KMT2A retains its N-terminus (KMT2AN), which is placed in frame with the C-terminus of one of several fusion partners, creating an oncogenic chimeric protein. In this translocation, although KMT2A does not contain the H3K4 methylation SET domain, it does contain a CXXC domain that can bind to nonmethylated CpG-rich promoter regions of target genes of KMT2A, like the HOXA9 gene. Upon binding to CpG regions, the fusion protein can recruit DOT1L (KMT4), the Super Elongation Complex, and other chromatin-modifying enzymes involved in transcription elongation, thereby increasing the rate of elongation of target genes such as HOXA9 [2]. The Polycomb Repressive Complex 1.1, which deposits H2AK119ub at promoter regions of transcribed genes, also plays a critical role in KMT2A-rearranged leukemias [3,4].
The 26S proteasome is a large proteolytic complex responsible for the degradation and recycling of proteins, a process that requires metabolic energy. It recognizes, unfolds, and cleaves proteins destined for removal, usually by prior attachment to ubiquitin polymers, a 76-amino-acid protein with a molecular mass of approximately 8.5 kDa. This tagging process, called ubiquitination, involves a cascade of enzymes: E1 (ubiquitin-activating enzyme), E2 (ubiquitin-conjugating enzyme), and E3 (ubiquitin-ligase enzyme) [5]. The 26S proteasome macromolecular machine comprises two subcomplexes, the 19S regulatory particle and the 20S core particle. The 20S proteasome is the catalytic part of the 26S proteasome involved in the proteolysis of proteins marked for degradation by the ubiquitin system [5].
Proteasomes are classified into two main groups: the constitutive proteasome and the immunoproteasome. The constitutive proteasome is present in almost all cell types and degrades intracellular proteins under normal physiological conditions. It contains three distinct catalytic β subunits: β1 (Y, PSMB6), β2 (Z, PSMB7), and β5 (X, PSMB5), which cleave peptide bonds after acidic, basic, and hydrophobic residues, respectively. The immunoproteasome is a specialized form of the proteasome found predominantly in immune cells, such as lymphocytes and antigen-presenting cells [5]. In these cells, the immunoproteasome primarily degrades antigens, yielding short polypeptides that are presented to the MHC-I pathway. The immunoproteasome has three active sites, including β1i (LMP2, low molecular weight protein 2, PSMB9), β2i (MECL1, multi-catalytic endopeptidase complex-like 1, PSMB10), and β5i (LMP7, low molecular weight protein 7, PSMB8).
Proteasome inhibitors profoundly affect protein homeostasis, leading to increased polyubiquitinated proteins and decreased free ubiquitin levels [6]. The two prominently ubiquitinated histones, H2A monoubiquitinated at K119 (H2AK119ub), and H2B monoubiquitinated at K120 (H2BK120ub), are deubiquitinated when cells are treated with proteasome inhibitors [7,8].
H2AK119ub is typically 5–15-fold more abundant than H2BK120ub in mammalian cell chromatin [9]. These two ubiquitinated histones have distinct chromatin locations: H2AK119ub is associated with silenced and transcriptionally active genes in heterochromatin and euchromatin, respectively, whereas H2BK120ub is associated with transcriptionally active genes in euchromatin [4,10,11,12].
The canonical Polycomb repressive complex 1 (PRC1) and non-canonical PRC1.1 complex (the writers) catalyze the formation of H2AK119ub [4], while removal of ubiquitin from H2AK119ub is catalyzed by deubiquitinases (USP16, the erasers) [10,13]. H2AK119ub plays a significant role in gene silencing and gene expression. Proteins and enzymes that bind to the H2AK119ub-nucleosome (the readers) include Jumonji and AT-Rich Interaction Domain 2 (JARID2), a component of the Polycomb repressive complex 2 (PRC2) complex, and DNA methyltransferase 3A (DNMT3A). Together, these readers reinforce the gene’s silenced state [13]. In contrast to the canonical PRC1 complex, the non-canonical PRC1.1 targets active genes [4].
H2BK120ub plays a major role in transcription elongation. Ubiquitination of H2BK120 is catalyzed by the Ring Finger 20/40 (RNF20/40) (the writer), which is recruited to the elongating form of RNA polymerase II (RNAP II) by the WW-containing adaptor protein with a coiled coil. Ubiquitin is removed from H2BK120ub by ubiquitin-specific peptidase enzymes (the eraser), such as USP22. This cycle of rapid ubiquitination and deubiquitination of H2BK120ub results in chromatin decondensation and compaction, thereby aiding elongation and transcription fidelity. H2BK120ub destabilizes the nucleosome, recruiting FACT, which facilitates H2A:H2B dimer removal and aids RNAP II passage [11,12,14,15]. In addition to FACT, several other proteins involved in elongation and chromatin modification associate with H2BK120ub-nucleosome [16]. The DOT1L’s catalytic activity to methylate H3K79 is stimulated when bound to the H2BK120ub-nucleosome [17]. H2BK120ub also enhances the noncatalytic nucleosome destabilizing activity of DOT1L [18].
In this study, we determined the effects of the proteasome inhibitor bortezomib and the immunoproteasome inhibitor ONX-0194 (PR-957) on H2BK120ub and H2AK119ub in the human leukemic cell lines MOLM-13, in which the immunoproteasome is active, and K562, in which it is not. We demonstrate that MOLM-13 cells, which express the KMT2A-MLLT3 fusion protein, have a greater level of H2BK120ub and H3K79me2 than K562 cells, which do not express KMT2A-MLLT3, consistent with the increased rate of elongation in KMT2A-MLLT3 MLL cells. Bortezomib, but not ONX-0194, reduced H2BK120ub and H2AK119ub levels in K562 and MOLM-13 cells. In MOLM-13 cells, bortezomib reduced H3K79me2 and the mRNA levels of HOXA9, DOT1L, MYC, and MEIS1.
2. Results
2.1. PTM Profiling of K562 and MOLM-13 Histones.
MOLM-13, but not K562 cells, express the oncofusion protein KMT2A-MLLT3, which alters multiple epigenetic processes (e.g., the recruitment and targeting of the DOT1L enzyme) and deregulates the expression of genes (HOXA9) involved in MLL. Before assessing the effects of proteasome inhibition, we first compared untreated K562 and MOLM-13 cells to determine whether they had different basal levels of histone PTMs. The PTMs examined included histone H3 trimethylated at lysine 4 (H3K4me3), H2AK119ub, H2BK120ub, H3K79me2, and histone H3 trimethylated at lysine 36 (H3K36me3), which are associated with gene activation, gene silencing, and transcription elongation. Histones isolated from K562 and MOLM-13 cells were initially resolved by SDS-PAGE and stained with Coomassie Blue to determine their concentrations. The amount of histones was then adjusted to achieve equal histone loading per lane in comparative immunoblot analyses of histone PTMs. Ponceau S staining of the immunoblot before immunostaining showed the amount of histone in each sample.
The relative abundance of the active mark, H3K4me3, and the active/silent mark, H2AK119ub, in K562 and MOLM-13 cells was determined by immunoblotting. H3K4me3 is a histone PTM located on either side of the transcription start site of expressed genes. Although H2AK119ub is associated with gene silencing, it is also found with transcriptionally active chromatin [12]. Figure 1 shows that the abundance of H3K4me3 and H2AK119ub was similar in K562 and MOLM-13 cells. Biological repeats of the immunoblotting studies are shown in Supplementary Materials, Figures S1 and S2.
Histone PTMs associated with transcription elongation include H2BK120ub, H3K79me2, and H3K36me3. The abundance of H3K36me3 was similar in K562 and MOLM-13 cells (Figure 2A). In contrast, the abundance of H2BK120ub (Figure 2B) and H3K79me2 (Figure 3A) was higher in MOLM-13 than in K562 cells (Supplementary Materials, Figures S3–S5).
Histone H3 has three variants, H3.1, H3.2 and H3.3. The H3 variants were electrophoretically resolved on acetic acid-urea-Triton X-100 gels, which separate histones by size, charge, and hydrophobicity [19,20]. All three H3 variants were dimethylated at K79 in K562 and MOLM-13 cells, with the abundance of the K79me2 H3 variants being higher in MOLM-13 cells (Figure 3B).
DOT1L (KMT4) is the only lysine methyltransferase known to methylate H3K79. To determine whether the increased abundance of H3K79me2 in MOLM-13 cells compared with K562 cells was due to elevated DOT1L levels, we measured DOT1L transcript and protein levels (Figure 4). Both the transcript and protein levels of DOT1L were similar in the two cell lines. It should be noted that, in measuring DOT1L protein levels, we obtained only one successful immunoblot. Other attempts were compromised by non-specific DOT1L antibodies and by DOT1L protein degradation.
In summary, MOLM-13 and K562 cells differ in their levels of elongation-related histone PTMs, H2BK120ub and H3K79me2, with MOLM-13 cells exhibiting higher levels of both. Although the expression of DOT1L was similar in K562 and MOLM-13 cells, the increased abundance of H3K79me2 in MOLM-13 cells suggested that DOT1L’s enzymatic activity was enhanced and/or genomic targeting of DOT1L was altered in MOLM-13 cells.
2.2. Sensitivity of Leukemic Cell Lines to Bortezomib.
The viability of K562 (CML) and MOLM-13 (AML) cells was assessed after 72 hours of treatment with bortezomib at varying concentrations. Figure 5 shows that K562 and MOLM-13 cells were sensitive to bortezomib inhibition. Fifty percent growth inhibition (IC50) of K562 and MOLM-13 cells was observed at concentrations of 15.2 and 2.78 nM, respectively (Table 1).
2.3. Effect of Bortezomib on Histone PTMs.
Previously, we reported that the levels of ubiquitinated histones (H2Aub; H2Bub) were diminished in SKBr3 human breast tumor cells treated with the proteasome inhibitor N-acetyl-leucyl-leucyl-norlucinal (100 µM) for 4 hours [7]. We therefore treated K562 and MOLM-13 cells with 5 nM bortezomib for 4 hours (the same conditions used by Kamens et al [8] to inhibit proteasome activity in acute lymphoblastic leukemia (ALL) cells), and H2AK119ub immunoblot analysis was performed on the isolated histones. A decrease in H2AK119ub after 4 hours of bortezomib treatment in both cell lines was more noticeable than at 2 hours (Figure 6, Supplementary Materials, Figure S6). In bortezomib-treated K562 and MOLM-13 cells, H2AK119ub levels were reduced to 0.62% and 0.70%, respectively, compared with the untreated controls.
H2BK120ub levels were also reduced in K562 and MOLM-13 cells after 2 and 4 hours of treatment with bortezomib (Figure 7, Supplementary Materials, Figures S7 and S8). In bortezomib-treated MOLM-13 cells, H2BK120ub levels were 0.47% of untreated cells (Figure 10).
Immunoblot analyses for H3K79me2 in the bortezomib-treated leukemic cells (5 nM for 2 and 4 hours) showed no significant change in the K562 cells (Figure 8A, Supplementary Materials, Figure S9). In MOLM-13 cells, there was a slight decrease in H3K79me2 abundance at 2 hours (Figure 8B, Supplementary Materials, Figure S10), which was more pronounced at 4 hours (a 13% decline compared to untreated control; Figure 10). Electrophoretic resolution of the histones from control and bortezomib-treated (5 nM, 4 h) cells by AUT 15% PAGE showed that the intensity of the three H3 variants dimethylated at K79 decreased in the treated cells (Supplementary Materials, Figure S11).
Immunoblot analyses of H3K36me3 isolated from K562 and MOLM-13 cells treated with 5 nM bortezomib for 2 and 4 hours revealed no changes (Figure 9; Supplementary Materials, Figures S12 and S13).
In summary, 5 nM bortezomib treatment reduced the abundance of ubiquitinated histones H2A and H2B in K562 and MOLM-13 cells (Figure 10). H3K79me2 abundance was reduced in bortezomib-treated MOLM-13 cells. No change in H3K36me3 abundance was observed in either cell line.
Figure 10.
Effect of bortezomib on H3K36me3, H3K79me2, H2BK120ub and H2AK119ub in MOLM-13 cells. MOLM-13 cells were treated with 5 nM bortezomib for 4 hours. The error bars represent the standard error of the mean (SEM) (3 biological repeats).
Figure 10.
Effect of bortezomib on H3K36me3, H3K79me2, H2BK120ub and H2AK119ub in MOLM-13 cells. MOLM-13 cells were treated with 5 nM bortezomib for 4 hours. The error bars represent the standard error of the mean (SEM) (3 biological repeats).

2.4. Effect of Immunoproteasome Inhibitor ONX-0914 on H2BK120ub and H2AK119ub.
Previous studies showed that the immunoproteasome inhibitor ONX-0914 reduced H2BK120ub levels in SEM but not RS4;11cells, even though both are ALL cell lines that express the immunoproteasome [21]. MOLM-13 cells treated with ONX-0914 for 2 hours showed no change in H2BK120ub or H2AK119ub (Figure 11). Even at 200 nM for 4 hours, no change in H2BK120ub or H2AK119ub levels in MOLM-13 or K562 cells was observed (Supplementary Materials, Figures S14 and S15).
2.5. Effect of Bortezomib on SSRP1 Cellular Distribution.
Structure-Specific Recognition Protein 1 (SSRP1) and Suppressor of Ty 16 (SPT16) are the subunits of the FACT complex. H2BK120ub plays a role in the recruitment of FACT, which promotes transcriptional elongation [21]. In this study, we determined whether the cellular level and chromatin association of SSRP1 were altered in K562 and MOLM-13 cells treated with bortezomib (5 nM for 4 hours; 50 nM for 2 hours). Neither 5 nM (4 hours) nor 50 nM (2 hours) bortezomib treatment had a marked effect on SSRP1 abundance in the total lysates from K562 and MOLM-13 cells. The abundance of SSRP1 in the chromatin fraction from K562 cells incubated with 5 nM bortezomib (4 hours) decreased relative to the core histones (Supplementary Materials, Figure S16). However, a marked decrease in SSRP1 and H2BK120ub in the chromatin fraction of K562 and MOLM-13 cells was noted relative to the core histones when cells were treated with 50 nM bortezomib for two hours (Figure 12, Supplementary Materials, Figure S17). Given the reciprocal relationship between H2BK120ub and H2BK120ac, we investigated whether loss of H2BK120ub in bortezomib-treated cells would increase H2BK120ac levels [22]. The abundance of H2BK120ac was not altered in the control and treated cells (Supplementary Materials, Figure S18).
2.6. Effect of Bortezomib on Transcript Levels.
MOLM-13 cells were treated with 5 nM bortezomib for 14 hours, and the levels of KMT2A-MLLT3 target (HOXA9, MEIS1) and non-target genes (DOT1L, MYC) were determined (Figure 13). HOXA9 and MEIS1 transcript levels were reduced (0.62 and 0.86, respectively) in MOLM-13-treated cells, although in three biological repeats the reduction in MEIS1 in the treated cells failed to reach statistical significance. The transcript levels of MYC and DOT1L fell lower (0.53 and 0.57, respectively) than the KMT2A-MLLT3 target transcripts in MOLM-13-treated cells.
3. Discussion
The distribution of nucleosomes with histone PTMs associated with transcribed genes follows the order of H3K4me3 nucleosomes on either side of the transcription start site, followed by H2BK120ub and H3K79me2 along the gene body, which is followed by H3K36me3 along the gene body [23,24,25]. H3K4me3 levels were similar in K562 and MOLM-13 cells. In contrast, the elongation marks, H2BK120ub and H3K79me2, were higher in MOLM-13 cells than in K562 cells, while the levels of H3K36me3 and DOT1L were similar. The increased levels of these two histone PTMs in MOLM-13 cells could be explained by the KMT2A-MLLT3 super-elongation complex associated with the elongating form of RNAP II [26,27]. The expression of the KMT2A-MLLT3 enhances the rate of transcriptional elongation in MOLM-13 AML cells. The ubiquitination of H2BK120 is dependent on ongoing elongation, and DOT1L’s activity to methylate H3K79 is stimulated when binding the H2BK120ub-modified nucleosome [28]. The higher basal levels of H2BK120ub and H3K79me2 in MOLM-13 cells suggest enhanced transcription elongation-associated chromatin activity in the KMT2A-MLLT3-rearranged cell line. This relationship is consistent with the known role of H2BK120ub in supporting DOT1L-mediated H3K79 methylation. Following bortezomib treatment, the reduction of H2BK120ub, together with the decrease in H3K79me2 in MOLM-13 cells, suggests that proteasome inhibition disrupts this H2BK120ub-H3K79me2 elongation-associated axis. In contrast, the lack of change in H3K36me3 indicates that bortezomib does not broadly reduce all elongation-associated histone PTMs in the short term (four hours), but may preferentially affect ubiquitin-dependent histone modifications and downstream H3K79 methylation. These findings support a model in which bortezomib interferes with chromatin features that contribute to transcriptional elongation and MLL-associated gene expression in MOLM-13 cells
There are several possible explanations for why H3K36me3 was not increased in MOLM-13 cells. The main enzyme that tri-methylates H3K36 is SETD2, which is associated with the elongating RNAP II apparatus [29,30]. The protein complexes (and/or their enzymatic activities) bound to the RNAP II complex may change as RNAP II travels along the gene body. There is crosstalk between H3K36me3 and H3K79me2 via SETD2, with a loss of SETD2 activity resulting in decreased H3K36me3, increased H3K79me2, and increased RNAP II activity [25,31]. Alternatively, the increased levels of the KDM4s (KDM4A,B,C,D), which demethylate H3K36me3, observed in cells with KMT2A-MLLT3, may mute an elongation-driven increase of H3K36me3 [32]. For example, increased KDM5B activity in MCF7 breast cancer cells lowers steady-state levels of H3K4me3 relative to those in MDA-MB-231 breast cancer cells with lower KDM5B expression [33]. Further studies will be required to explain why some elongation-related histone PTMs show increased levels, while others do not. Unlike H2BK120ub, H2AK119ub is not dependent upon ongoing transcription [34]. The steady-state level of H2AK119ub was similar in K562 and MOLM-13 cells.
The level of H2BK120ub is often lower in cancer cells than in their normal counterparts [35,36]. However, genes involved in cancer development show elevated levels of H2BK120ub across their gene bodies. Our results suggest that, unlike other cancers, H2BK120ub levels in KMT2a-rearranged leukemia (AML, ALL) will be higher than in their normal hematopoietic counterparts. To the best of our knowledge, this remains undetermined.
Previous studies have demonstrated the sensitivity of AML and ALL cells to the proteasome inhibitor bortezomib [8]. In immunoblot analyses, Kamens et al. reported that 50 nM bortezomib treatment reduced H2BK120ub levels in ALL cells after 30-120 min of exposure [8]. Both K562 and MOLM-13 showed reduced levels of H2BK120ub and H2AK119ub after 4 hours of treatment with 5 nM bortezomib and after 2 hours at 50 nM. Both ubiquitinated histones have rapid turnovers (t½ 90 min for H2AK119ub) [37]. Among the enzymes that deubiquitinate ubiquitinated histones are ubiquitin-specific proteases (USPs), which deubiquitinate H2AK119ub and H2BK120ub (e.g., USP3, USP7, USP22) [38,39,40]. Proteasome inhibition reduces free ubiquitin levels, thereby increasing polyubiquitination of proteins. Ubiquitinated histones are “sacrificed” to serve the high demand for free ubiquitin. The action of the histone deubiquitinating enzymes releases free ubiquitin, which is used to polyubiquitinate specific proteins [7].
Bortezomib inhibits the canonical and immunoproteasomes. Inhibition of the immunoproteasome did not decrease the steady-state levels of H2BK120ub and H2AK119ub in ONX-0914-treated MOLM-13 cells. This result suggests that in MOLM-13 cells, the canonical proteasome’s activity exceeds that of the immunoproteasome in the processing and degradation of polyubiquitinated proteins. In cases in which immunoproteasome inhibition results in decreased H2BK120ub levels in SEM (ALL) cells, the immunoproteasome activity may exceed that of the canonical proteasome [21].
Within hours following the addition of bortezomib to leukemic cells, the loss of H2BK120ub, the decline of FACT chromatin association, and perhaps H2AK119ub will hinder transcription elongation [7,38,41,42]. A noticeable decrease in transcription was reported after four hours following proteasome inhibition [7]. In measuring specific cellular transcript levels, the reduction in these levels following transcription inhibition would depend, in part, on the transcript's stability. Following treatment of MOLM-13 cells with 5 nM bortezomib for 14 hours, the transcript levels of MYC, DOT1L, and HOXA9 were reduced. MYC transcripts, which have a rapid turnover rate, showed the largest reproducible decrease in bortezomib-treated MOLM-13 cells [43].
The treatment of KMT2a-rearranged leukemic cells with bortezomib and the reduction of H2BK120ub and H2AK119ub would affect several epigenetic events deregulated in leukemia, thereby altering gene expression (e.g., HOXA9) that drives the leukemic state. The loss of H2BK120ub will attenuate DOT1L-mediated H3K79me2, while the loss of H2AK119ub will impact the PRC1 pathways [4,10,44,45]. A phase 3 trial found that bortezomib, when combined with standard therapy, did not improve treatment outcomes in pediatric AML patients [46]. However, a reverse-phase protein array-based proteomic study of peripheral blood samples from AML patients reported that patients with high HME (16 histone- and chromatin-modifying enzymes) expression had significantly improved survival when treated with bortezomib-containing chemotherapy [47]. The HME included the histone modifying enzymes KDM1A, ASH2L, HDAC6, HDAC3, HDAC1, JMJD6, SIRT6, HDAC2, and SIRT1. Given that several of the histone-modifying enzymes identified belong to the histone deacetylases (HDACs) family, it is noteworthy that combined treatment with bortezomib and the HDAC inhibitor vorinostat has been reported to improve clinical responses in patients with AML and ALL [8]. Of note, vorinostat potently reduces KDM1A expression [48]. Also, the DOT1L inhibitor EPZ5676 reduces KDM1A and HOXA9 [49]. The inclusion of histone-modifying enzymes involved in KMT2a-rearranged leukemia (e.g., RNF20, BCOR (PRC1.1 complex), KDM4s) may help further identify AML patients' response to bortezomib-containing therapies.
4. Materials and Methods
4.1. Cell Lines and Cell Culture
The human leukemic cell lines MOLM-13 (acute myeloid leukemia) and K562 (chronic myeloid leukemia) were used in this study. MOLM-13 cells were obtained from DSMZ (Leibniz Institute - DSMZ German Collection of Microorganisms and Cell Cultures GmbH), and K562 cells were obtained from ATCC (ATCC.ORG). Both cell lines were cultured in Roswell Park Memorial Institute-1640 (RPMI-1640) medium (Fisher Scientific, #MT10041CV) supplemented with 10% fetal bovine serum (FBS, #MT35077CV) and 1% penicillin-streptomycin (Fisher Scientific, #15140122) in 175 cm² tissue culture flasks (#10-126-13) at 37°C in a humidified atmosphere of 5% CO₂. The cells were subcultured when they reached 80–90% confluency. Trypan Blue stain (Flow Laboratories, USA) was used for cell counting and cell viability assessment.
4.2. MTS Assay for Inhibitor Dose-Response Studies
MOLM-13 and K562 cells were seeded into 96-well plates with 90 µL of medium containing 1.1 × 10⁵ cells/mL per well. Subsequently, 10 µL of medium containing bortezomib was added to achieve final concentrations ranging from 0 to 50 µM in a final volume of 100 µL per well, while ensuring the final DMSO concentration did not exceed 1%. After 72 hours, 10 µL of MTS reagent (CellTiter 96® AQueous One Solution Cell Proliferation Assay; Promega, UK) was added to each well, and the plates were incubated for an additional 3 hours. After incubation, the absorbance of the samples was measured at 490 nm (Synergy H1 microplate reader, BioTek Co., USA) to assess cell viability, expressed as a percentage of the control group. The data for each cell line and drug were fit to a four-parameter logistic regression model, and the IC₅₀ values for each inhibitor were derived using SigmaPlot 14.5.
4.3. Bortezomib Treatment
Ten mM bortezomib (MilliporeSigma, #504314) was prepared by reconstitution in Dimethyl sulfoxide (DMSO) (MilliporeSigma, #D4540). Bortezomib at 10 μM with 0.1% DMSO was prepared by diluting the 10 mM stock in PBS (137 mM NaCl, 2.7 mM KCl, 10 mM Na2HPO4, 1.8 mM KH2PO4, pH 7.4). K562 and MOLM-13 cells at 70-90% confluency were treated with five or fifty nM bortezomib in 0.1% DMSO and incubated for 2, 4 or 14 hours under the same conditions as described above. 0.1% DMSO was used as the vehicle for the control conditions. Cell counts and cell viability were measured before and after treatment using the Olympus Model R1 automated cell counter after staining 10 μL of the cells with 10 μL trypan blue. The live cell counts for K562 and MOLM-13 cells were 2.59±0.30 million cells/mL and 1.50±0.11 million cells/mL, respectively. Following treatment, the live cell counts were 2.40±0.35 million cells/mL for K562 cells and 1.53±0.19 million cells/mL for MOLM-13 cells
4.4. Histone Extraction
4.5. Cellular Lysate Preparation
To determine DOT1L protein levels, MOLM-13 and K562 cells cultured under standard conditions were harvested for cell lysate preparation as described in Tempel et al, 2025 [50]. The lysates were then separated by SDS-PAGE, and immunoblotting was performed to determine DOT1L levels in both cell lines using a DOT1L antibody.
4.6. Cell Fractionation and Total Cell Lysates
Fifty million cells were harvested post-treatment of K562 and MOLM-13 cells with fifty nM bortezomib for 2 hours as described above. The cell pellet was resuspended in extraction buffer (10 mM HEPES (pH 7.9), 10 mM KCl, 1.5 mM MgCl2, 0.34 M sucrose, 10% (v/v) glycerol, 5 mM sodium butyrate) containing 0.2% IGEPAL, protease and phosphatase inhibitors (PPI, Thermo Scientific, Halt ™ Protease and Phosphatase Inhibitor Cocktail, #78441, added as per manufacturer’s instructions), and 2 mM PMSF. The cell suspension was incubated on ice for 10 min with occasional rotation, followed by centrifugation at 6500 × g for 5 min at 4°C and collection of the supernatant (cytoplasmic fraction). The pellet was resuspended in the extraction buffer containing PPI and 2 mM PMSF, incubated on ice for 1 min, then centrifuged at 6500 × g for 5 min at 4°C, and the supernatant collected (wash buffer supernatant). The nuclei pellet was resuspended in no-salt buffer (3 mM EDTA, 0.2 mM EGTA, 5 mM sodium butyrate, with PPI and 2 mM PMSF), mixed intermittently for 1 min (10 s on, 10 s off), and incubated for 30 mins at 4°C on a rotator. The nuclei were collected by centrifugation (6500 × g for 5 min at 4°C), and the supernatant (nucleoplasm fraction) was collected. The chromatin-containing pellet was resuspended in RIPA Buffer (ThermoFisher, #89900) with PPI and 2 mM PMSF, then sonicated (Power = 2, continuous mode (3 cycles, 30s on, 30s off, Fisher Scientific, Model 100, Ultrasonic Dismembrator) to yield the chromatin fraction. A260 measurements were taken for all fractions.
To obtain the total cellular lysate, 25 million cells were harvested after 2 h of treatment with 50 nM bortezomib, as described above. The cell pellet was washed once with PBSB buffer (137 mM NaCl, 2.7 mM KCl, 10 mM Na2HPO4, 1.8 mM KH2PO4, 5 mM sodium butyrate, pH 7.4) containing protease and phosphatase inhibitors (Thermo Sicentific, Pierce ™ Protease and Phosphatase Inhibitor Mini Tablet, #A32961, added as per manufacturer’s instructions) and 2 mM PMSF, followed by resuspension in 750 µL of RIPA Buffer (ThermoFisher, #89900; with PPI and 2 mM PMSF) and sonication (Power = 2, continuous mode, 3 cycles, 30s on, 30s off, Fisher Scientific, Model 100, Ultrasonic Dismembrator) to yield the total cellular lysate.
4.7. SDS-PAGE and Immunoblotting
SDS-PAGE gels and immunoblots were prepared as outlined by Tempel et al, 2025 [50]. Protein ladders (ThermoFisher, #26619 or BioRad, #1610395) were run alongside the samples to verify target protein detection by molecular mass. Antibodies used in this research are listed in Supplementary data, Table S1.
4.8. Acetic Acid-Urea-Triton-X100 Polyacrylamide Gel (AUT) Electrophoresis and Immunoblotting
Fifteen % polyacrylamide AUT (acetic acid/ 6 M urea/ 0.375 % Triton X-100) minilab gel was prepared [19]. The acid-extracted histones were mixed with 2X AUT-sample buffer (0.75 M KAc pH 4.0, 30% (w/v) sucrose, 0.1% (w/v) pyronin Y) and loaded onto an AUT gel. A running buffer of 0.9 N acetic acid was used, and the gel was electrophoresed at 200V for 2 hours at room temperature (for more details see [52]). For immunoblotting, the AUT gel was equilibrated in two steps before being transferred to the nitrocellulose membrane. First, the gel was submerged in 50 mM glacial acetic acid and 0.5% SDS (equilibration buffer 1) for two 30-minute incubations, followed by two 30-minute incubations in a Tris-SDS buffer (equilibration buffer 2) containing 1 M Tris-HCl (pH 6.8), 2.3% SDS, and 5% β-mercaptoethanol. After equilibration, the gel was transferred to a nitrocellulose membrane using the Trans-Blot Turbo Transfer System (Bio-Rad). The membrane was processed as described above for SDS 15% polyacrylamide gels.
4.9. Total RNA Extraction and cDNA Synthesis
Total RNA extraction was performed using the RNeasy Plus Mini Kit (Qiagen, #74134) following the manufacturer's instructions with the addition of washing the harvested cell pellet with ice-cold PBS prior to lysis with Buffer RLT Plus containing β-mercaptoethanol. Additionally, the homogenized lysate was run through a QIAshredder spin column (Qiagen, #79656) prior to transfer to a gDNA eliminator spin column to increase RNA yield. Eluted RNA concentration and purity were assessed using the A260/A280 and A260/A230 ratios with a Nanodrop 2000 (Thermo Fisher Scientific). Following RNA isolation, DNase I treatment was performed using the DNA-free™ DNA removal kit (Thermo Fisher Scientific, #AM1906) as per manufacturer’s instructions. Purification of RNA was assessed by PCR using primers designed across exons of housekeeping genes. cDNA synthesis was performed using the iScript™ Reverse Transcription Supermix for RT-qPCR (Bio-Rad, #1708840) according to the manufacturer's instructions. Synthesized cDNA was stored at -20°C.
4.10. Primer Design, Primer Sequencing
Gene transcripts were obtained from Ensembl (https://www.ensembl.org/), and the transcript variant best suited to the experimental needs was selected. Once identified, the transcript sequence was retrieved and primers were designed using Integrated DNA Technologies (IDT’s) RealTime qPCR Assay Entry or PrimerQuest tools. Primer specificity was confirmed using UCSC’s in-silico PCR tool (https://genome.ucsc.edu/cgi-bin/hgPcr?hgsid=3979505939_DDUWj3GVsYwSq3isne9v5FbIc9zX). Following primer design, a gradient real-time PCR was performed to confirm the absence of primer dimers for each primer, with annealing temperatures selected based on melt curve analysis. Finally, PCR products were run on a 1-2% agarose gels to verify their lengths. The primer sequences used for the reverse transcriptase quantitative PCR (RT-qPCR) experiments and analysis are detailed in Supplementary data, Table S2.
4.11. RT-qPCR (Reverse Transcription Quantitative PCR)
For each PCR sample, a mixture was prepared by combining 10 microliters of PowerUp™ SYBR™ Green master mix (Fisher Scientific, #A25741), 1 microliter each of forward and reverse primers, 7 microliters of nuclease-free water, and 1 microliter of previously synthesized cDNA, resulting in a total reaction volume of 20 microliters. Following preparation, 96-well plates were utilized, and the QuantStudio™ thermocycler (Thermo Fisher Scientific) was employed for amplification. The PCR conditions were set as follows. The reaction mixture was denatured at 95°C for 2 minutes, followed by denaturation at 95°C for 30 seconds, annealing at 60°C for 30 seconds, and extension at 72°C for 1 minute for 40 cycles. Subsequently, a melt curve analysis was performed by heating the samples to 95°C for 15 seconds, annealing at 50°C for 1 minute, and finally denaturing at 95°C for 15 seconds. The cycle threshold (Ct) values obtained were normalized to the corresponding GAPDH or PPIB expression using the ΔCt method, where higher ΔCt values indicated lower amounts of the transcript. In certain experiments, target levels were determined using the ΔΔCt method, in which ΔCt values for each cell line were normalized to an appropriate control. Fold changes were calculated using the 2^ΔΔCt formula.
4.12. Statistical Analysis
Changes in histone post-translational modifications (PTMs), histone variants, or the RNA polymerase II subunit RPB1 were analyzed using the Student t-test. Statistical evaluations were conducted with Prism v10 software (GraphPad Software, San Diego, CA, USA). Data were presented as the mean ± standard error of the mean (SEM) from three independent experiments.
5. Conclusions
In summary, low concentrations of bortezomib reduced H2AK119ub, H2BK120ub and, to a lesser extent, H3K79me2 in an MLL subtype of AML cells. Transcriptional elongation is augmented in MLL. The reduction in H2BK120ub and H3K79me2, and the loss of FACT binding to chromatin, are consistent with bortezomib reducing elongation, leading to the silencing of genes (HOXA9) that propagate MLL. Thus, incorporating bortezomib into a therapeutic regimen for this form of MLL would be beneficial. Current studies report that profiling of histone/chromatin-modifying enzymes aids in identifying patient response to the treatment. Further identification of histone/chromatin-modifying enzymes that play important roles in AML subtypes could yield combinations of bortezomib and histone-modifying enzyme inhibitors better tailored to the patient’s cancer.
Informed Consent Statement:
.
Supplementary Materials
The following supporting information can be downloaded at the website of this paper posted on Preprints.org.
Author Contributions
Hedieh Sattarifard: Writing - original draft, Review & editing, Visualization, Methodology, Investigation, Conceptualization. Marvellous Oyeyode: Writing - original draft, Review & editing, Visualization, Methodology, Investigation. Dhanvi Prajapati: Review & editing, Visualization, Methodology, Investigation, Conceptualization, Data curation. Angela Duaqui: Visualization, Methodology, Investigation. Gurlovleen Kaur: Writing - original draft, Methodology, Investigation, Conceptualization. Ishdeep Muker: Review & editing, Methodology, Investigation, Conceptualization. Wenxia Luo: Writing - original draft, Methodology, Investigation, Conceptualization. Ted M. Lakowski: Writing - original draft, Review & editing, Visualization, Methodology, Investigation, Conceptualization, Supervision, Funding acquisition, Resources. James R. Davie: Writing - original draft, Review & editing, Visualization, Methodology, Investigation, Conceptualization, Supervision, Project administration, Funding acquisition, Resources.
Funding
This research was supported by funding from the Natural Sciences and Engineering Research Council of Canada (RGPIN-2023-04780) to JRD, and the Canadian Institutes of Health Research (CIHR) (PJT175226) to TML, Emmanuel A Ho and JRD.
Institutional Review Board Statement
.
Data Availability Statement
Data will be made available on request.
Acknowledgments
We acknowledge that the University of Manitoba campuses are located on the original lands of the Anishinaabeg, Cree, Oji-Cree, Dakota, and Dene peoples and the homeland of the Métis Nation. We thank Jonah Prado for isolation of K562 and MOLM-13 histones. .
Conflicts of Interest
The authors declare no conflicts of interest.
References
- Marschalek, R. Systematic Classification of Mixed-Lineage Leukemia Fusion Partners Predicts Additional Cancer Pathways. Ann. Lab. Med. 2016, 36, 85–100. [Google Scholar] [CrossRef] [PubMed]
- Luo, Z.; Lin, C.; Guest, E.; Garrett, A.S.; Mohaghegh, N.; Swanson, S.; Marshall, S.; Florens, L.; Washburn, M.P.; Shilatifard, A. The super elongation complex family of RNA polymerase II elongation factors: gene target specificity and transcriptional output. Mol. Cell. Biol. 2012, 32, 2608–2617. [Google Scholar] [CrossRef] [PubMed]
- Schurer, A.; Glushakow-Smith, S.G.; Gritsman, K. Targeting chromatin modifying complexes in acute myeloid leukemia. Stem Cells Transl. Med. 2025, 14. [Google Scholar] [CrossRef] [PubMed]
- van den Boom, V.; Maat, H.; Geugien, M.; Rodríguez López, A.; Sotoca, A.M.; Jaques, J.; Brouwers-Vos, A.Z.; Fusetti, F.; Groen, R.W.J.; Yuan, H.; et al. Non-canonical PRC1.1 Targets Active Genes Independent of H3K27me3 and Is Essential for Leukemogenesis. Cell Rep. 2016, 14, 332–346. [Google Scholar] [CrossRef] [PubMed]
- Mao, Y. Structure, Dynamics and Function of the 26S Proteasome. Subcell. Biochem. 2021, 96, 1–151. [Google Scholar] [CrossRef] [PubMed]
- Dantuma, N.P.; Groothuis, T.A.M.; Salomons, F.A.; Neefjes, J. A dynamic ubiquitin equilibrium couples proteasomal activity to chromatin remodeling. J. Cell Biol. 2006, 173, 19–26. [Google Scholar] [CrossRef] [PubMed]
- Mimnaugh, E.G.; Chen, H.Y.; Davie, J.R.; Cells, J.E.; Neckers, L. Rapid deubiquitination of nucleosomal histones in human tumor cells caused by proteasome inhibitors and stress response inducers: effects on replication, transcription, translation, and the cellular stress response. Biochemistry 1997, 36, 14418–14429. [Google Scholar] [CrossRef] [PubMed]
- Kamens, J.L.; Nance, S.; Koss, C.; Xu, B.; Cotton, A.; Lam, J.W.; Garfinkle, E.A.R.; Nallagatla, P.; Smith, A.M.R.; Mitchell, S.; et al. Proteasome inhibition targets the KMT2A transcriptional complex in acute lymphoblastic leukemia. Nat. Commun. 2023, 14. [Google Scholar] [CrossRef] [PubMed]
- Mattiroli, F.; Penengo, L. Histone Ubiquitination: An Integrative Signaling Platform in Genome Stability. Trends Genet. 2021, 37, 566–581. [Google Scholar] [CrossRef] [PubMed]
- Zhang, Y.; Xu, K.; Zhang, K.; Chen, C.; Gu, Y. Regulation, functions and therapeutic strategies of H2AK119ub1. Biochem. Pharmacol. 2025, 240. [Google Scholar] [CrossRef] [PubMed]
- Davie, J.R.; Sattarifard, H.; Sudhakar, S.R.N.; Roberts, C.T.; Beacon, T.H.; Muker, I.; Shahib, A.K.; Rastegar, M. Basic Epigenetic Mechanisms. Subcell. Biochem. 2025, 108, 1–49. [Google Scholar] [CrossRef] [PubMed]
- Li, W.; Nagaraja, S.; Delcuve, G.P.; Hendzel, M.J.; Davie, J.R. Effects of histone acetylation, ubiquitination and variants on nucleosome stability. Biochem. J. 1993, 296 Pt 3, 737–744. [Google Scholar] [CrossRef] [PubMed]
- Wu, D.; Zhong, H.; Cai, L.; Wang, G.G. Mono-ubiquitination of histone H2A lysine 119 (H2AK119Ub): its multifaceted role in biology and implication in diseases. MedScience 2026. [Google Scholar] [CrossRef] [PubMed]
- Hicks, C.W.; Rahman, S.; Gloor, S.L.; Fields, J.K.; Husby, N.L.; Vaidya, A.; Maier, K.E.; Morgan, M.; Keogh, M.C.; Wolberger, C. Ubiquitinated histone H2B as gatekeeper of the nucleosome acidic patch. Nucleic Acids Res. 2024, 52, 9978–9995. [Google Scholar] [CrossRef] [PubMed]
- Baweja, L.; Wereszczynski, J. Mechanistic basis for the opposing effects of H2A and H2B ubiquitination on nucleosome stability and dynamics. Epigenet. Chromatin 2025, 18. [Google Scholar] [CrossRef] [PubMed]
- Marsh, D.J.; Ma, Y.; Dickson, K.A. Histone Monoubiquitination in Chromatin Remodelling: Focus on the Histone H2B Interactome and Cancer. Cancers 2020, 12, 1–24. [Google Scholar] [CrossRef] [PubMed]
- Spangler, C.J.; Yadav, S.P.; Li, D.; Geil, C.N.; Smith, C.B.; Wang, G.G.; Lee, T.H.; McGinty, R.K. DOT1L activity in leukemia cells requires interaction with ubiquitylated H2B that promotes productive nucleosome binding. Cell Rep. 2022, 38. [Google Scholar] [CrossRef] [PubMed]
- Jang, S.; Kang, C.; Yang, H.S.; Jung, T.; Hebert, H.; Chung, K.Y.; Kim, S.J.; Hohng, S.; Song, J.J. Structural basis of recognition and destabilization of the histone H2B ubiquitinated nucleosome by the DOT1L histone H3 Lys79 methyltransferase. Genes Dev. 2019, 33, 620–625. [Google Scholar] [CrossRef] [PubMed]
- Davie, J.R. Two-dimensional gel systems for rapid histone analysis for use in minislab polyacrylamide gel electrophoresis. Anal. Biochem. 1982, 120, 276–281. [Google Scholar] [CrossRef] [PubMed]
- Delcuve, G.P.; R. Davie, J. Protein Blotting of Basic Proteins Resolved on Acid-Urea-Triton-Polyacrylamide Gels. In Protein Protoc. Handbook; 2002; pp. 337–341. [Google Scholar] [CrossRef]
- Jenkins, T.W.; Fitzgerald, J.E.; Park, J.; Wilson, A.M.; Berry, K.L.; Wong, K.S.; Houry, W.A.; Lee, I.; Maksimenko, A. V.; Panizzi, P.R.; et al. Highly specific Immunoproteasome inhibitor M3258 induces proteotoxic stress and apoptosis in KMT2A::AFF1 driven acute lymphoblastic leukemia. Sci. Rep. 2025, 15. [Google Scholar] [CrossRef] [PubMed]
- Gatta, R.; Dolfini, D.; Zambelli, F.; Imbriano, C.; Pavesi, G.; Mantovani, R. An acetylation-mono-ubiquitination switch on lysine 120 of H2B. Epigenetics 2011, 6, 630–637. [Google Scholar] [CrossRef] [PubMed]
- Wood, K.; Tellier, M.; Murphy, S. DOT1L and H3K79 Methylation in Transcription and Genomic Stability. Biomolecules 2018, 8. [Google Scholar] [CrossRef] [PubMed]
- Skucha, A.; Ebner, J.; Schmöllerl, J.; Roth, M.; Eder, T.; César-Razquin, A.; Stukalov, A.; Vittori, S.; Muhar, M.; Lu, B.; et al. MLL-fusion-driven leukemia requires SETD2 to safeguard genomic integrity. Nat. Commun. 2018, 9. [Google Scholar] [CrossRef] [PubMed]
- Bu, J.; Chen, A.; Yan, X.; He, F.; Dong, Y.; Zhou, Y.; He, J.; Zhan, D.; Lin, P.; Hayashi, Y.; et al. SETD2-mediated crosstalk between H3K36me3 and H3K79me2 in MLL-rearranged leukemia. Leukemia 2018, 32, 890–899. [Google Scholar] [CrossRef] [PubMed]
- Perner, F.; Gadrey, J.Y.; Armstrong, S.A.; Kühn, M.W.M. Targeting the Menin-KMT2A interaction in leukemia: Lessons learned and future directions. Int. J. Cancer 158 342–356. [CrossRef]
- Olsen, S.N.; Godfrey, L.; Healy, J.P.; Choi, Y.A.; Kai, Y.; Hatton, C.; Perner, F.; Haarer, E.L.; Nabet, B.; Yuan, G.C.; et al. MLL::AF9 degradation induces rapid changes in transcriptional elongation and subsequent loss of an active chromatin landscape. Mol. Cell 2022, 82, 1140–1155.e11. [Google Scholar] [CrossRef] [PubMed]
- Valencia-Sánchez, M.I.; De Ioannes, P.; Wang, M.; Vasilyev, N.; Chen, R.; Nudler, E.; Armache, J.P.; Armache, K.J. Structural Basis of Dot1L Stimulation by Histone H2B Lysine 120 Ubiquitination. Mol. Cell 2019, 74, 1010–1019.e6. [Google Scholar] [CrossRef] [PubMed]
- Walshe, J.L.; Ochmann, M.; Neef, U.; Dybkov, O.; Dienemann, C.; Oberthür, C.; Zheenbekova, A.; Urlaub, H.; Cramer, P. Molecular mechanism of co-transcriptional H3K36 methylation by SETD2. Nat. Commun. 2025, 16. [Google Scholar] [CrossRef] [PubMed]
- Markert, J.W.; Soffers, J.H.; Farnung, L. Structural basis of H3K36 trimethylation by SETD2 during chromatin transcription. Science 2025, 387, 528–533. [Google Scholar] [CrossRef] [PubMed]
- Zhou, Y.; Yan, X.; Feng, X.; Bu, J.; Dong, Y.; Lin, P.; Hayashi, Y.; Huang, R.; Olsson, A.; Andreassen, P.R.; et al. Setd2 regulates quiescence and differentiation of adult hematopoietic stem cells by restricting RNA polymerase II elongation. Haematologica 2018, 103, 1110–1123. [Google Scholar] [CrossRef] [PubMed]
- Wu, W.; Cao, X.; Mo, L. Overexpression of KDM4D promotes acute myeloid leukemia cell development by activating MCL-1. Am. J. Transl. Res. 2021, 13, 2308–2319. [Google Scholar] [PubMed]
- Khan, D.H.; Gonzalez, C.; Tailor, N.; Hamedani, M.K.; Leygue, E.; Davie, J.R. Dynamic Histone Acetylation of H3K4me3 Nucleosome Regulates MCL1 Pre-mRNA Splicing. J. Cell. Physiol. 2016, 231, 2196–2204. [Google Scholar] [CrossRef] [PubMed]
- Davie, J.R.; Murphy, L.C. Level of ubiquitinated histone H2B in chromatin is coupled to ongoing transcription. Biochemistry 1990, 29, 4752–4757. [Google Scholar] [CrossRef] [PubMed]
- Marsh, D.J.; Ma, Y.; Dickson, K.A. Histone Monoubiquitination in Chromatin Remodelling: Focus on the Histone H2B Interactome and Cancer. Cancers . 2020, 12, 1–24. [Google Scholar] [CrossRef] [PubMed]
- Melling, N.; Grimm, N.; Simon, R.; Stahl, P.; Bokemeyer, C.; Terracciano, L.; Sauter, G.; Izbicki, J.R.; Marx, A.H. Loss of H2Bub1 Expression is Linked to Poor Prognosis in Nodal Negative Colorectal Cancers. Pathol. Oncol. Res. 2016, 22, 95–102. [Google Scholar] [CrossRef] [PubMed]
- Seale, R.L. Rapid turnover of the histone-ubiquitin conjugate, protein A24. Nucleic Acids Res. 1981, 9, 3151–3158. [Google Scholar] [CrossRef] [PubMed]
- Roy, S.; Ghosh, M.K. Ubiquitin proteasome system (UPS): a crucial determinant of the epigenetic landscape in cancer. Epigenomics 2025, 17, 625–644. [Google Scholar] [CrossRef] [PubMed]
- Fang, Y.Z.; Jiang, L.; He, Q.; Cao, J.; Yang, B. Deubiquitination complex platform: A plausible mechanism for regulating the substrate specificity of deubiquitinating enzymes. Acta Pharm. Sin. B 2023, 13, 2955–2962. [Google Scholar] [CrossRef] [PubMed]
- Atanassov, B.S.; Koutelou, E.; Dent, S.Y. The role of deubiquitinating enzymes in chromatin regulation. FEBS Lett. 2011, 585, 2016–2023. [Google Scholar] [CrossRef] [PubMed]
- Luo, A.; Kong, J.; Chen, J.; Xiao, X.; Lan, J.; Li, X.; Liu, C.; Wang, P.Y.; Li, G.; Li, W.; et al. H2B ubiquitination recruits FACT to maintain a stable altered nucleosome state for transcriptional activation. Nat. Commun. 2023, 14. [Google Scholar] [CrossRef] [PubMed]
- Volokh, O.; Studitsky, V.M.; Sokolova, O.S. Beyond Chaperoning: The Multifaceted Role of FACT in Chromatin Transactions. Int. J. Mol. Sci. 2025, 26. [Google Scholar] [CrossRef] [PubMed]
- Jones, T.R.; Cole, M.D. Rapid cytoplasmic turnover of c-myc mRNA: requirement of the 3’ untranslated sequences. Mol. Cell. Biol. 1987, 7, 4513–4521. [Google Scholar] [CrossRef]
- Wang, E.; Kawaoka, S.; Yu, M.; Shi, J.; Ni, T.; Yang, W.; Zhu, J.; Roeder, R.G.; Vakoc, C.R. Histone H2B ubiquitin ligase RNF20 is required for MLL-rearranged leukemia. Proc. Natl. Acad. Sci. U. S. A. 2013, 110, 3901–3906. [Google Scholar] [CrossRef] [PubMed]
- Lillico, R.; Lawrence, C.K.; Lakowski, T.M. Selective DOT1L, LSD1, and HDAC Class i Inhibitors Reduce HOXA9 Expression in MLL-AF9 Rearranged Leukemia Cells, but Dysregulate the Expression of Many Histone-Modifying Enzymes. J. Proteome Res. 2018, 17, 2657–2667. [Google Scholar] [CrossRef] [PubMed]
- Aplenc, R.; Meshinchi, S.; Sung, L.; Alonzo, T.; Choi, J.; Fisher, B.; Gerbing, R.; Hirsch, B.; Horton, T.; Kahwash, S.; et al. Bortezomib with standard chemotherapy for children with acute myeloid leukemia does not improve treatment outcomes: a report from the Children’s Oncology Group. Haematologica 2020, 105, 1879–1886. [Google Scholar] [CrossRef] [PubMed]
- van Dijk, A.D.; Hoff, F.W.; Qiu, Y.; Hubner, S.E.; Go, R.L.; Ruvolo, V.R.; Leonti, A.R.; Gerbing, R.B.; Gamis, A.S.; Aplenc, R.; et al. Chromatin Profiles Are Prognostic of Clinical Response to Bortezomib-Containing Chemotherapy in Pediatric Acute Myeloid Leukemia: Results from the COG AAML1031 Trial. Cancers . 2024, 16. [Google Scholar] [CrossRef] [PubMed]
- Lillico, R.; Sobral, M.G.; Stesco, N.; Lakowski, T.M. HDAC inhibitors induce global changes in histone lysine and arginine methylation and alter expression of lysine demethylases. J. Proteom. 2016, 133, 125–133. [Google Scholar] [CrossRef] [PubMed]
- Lillico, R.; Lawrence, C.K.; Lakowski, T.M. Selective DOT1L, LSD1, and HDAC Class I Inhibitors Reduce HOXA9 Expression in MLL-AF9 Rearranged Leukemia Cells, But Dysregulate the Expression of Many Histone-Modifying Enzymes. J. Proteome Res. 2018, 17, 2657–2667. [Google Scholar] [CrossRef] [PubMed]
- Tempel, M.; Green, K.; Prajapati, D.; Duaqui, A.; Norouzi, M.; Sattarifard, H.; Ashraf, A.; Wu, E.; Zovoilis, A.; Lakowski, T.M.; et al. Doxorubicin, a DNA intercalator, inhibits transcription elongation. Biochem. Cell Biol. 2025, 103. [Google Scholar] [CrossRef] [PubMed]
- Analike, G.; Prajapati, D.; Davie, J.R.; Ausio, J. An improved version of the early histone HCl extraction protocol. Biochem. Cell Biol. 2026, 104. [Google Scholar] [CrossRef] [PubMed]
- Sattarifard, H.; Winnipeg, W. Role of DOT1L in epigenetic regulation of the HOXA9 gene expression in mixed lineage leukemia. 2024. [Google Scholar] [CrossRef]
Figure 1.
Relative abundance of H3K4me3 and H2AK119ub in K562 and MOLM-13 cells. The Ponceau S-stained blot of histones resolved by SDS 15% PAGE (left panels), and the accompanying blot immunostained with antibodies against H3K4me3 (A) and H2AK119ub (B) are shown (right panels).
Figure 1.
Relative abundance of H3K4me3 and H2AK119ub in K562 and MOLM-13 cells. The Ponceau S-stained blot of histones resolved by SDS 15% PAGE (left panels), and the accompanying blot immunostained with antibodies against H3K4me3 (A) and H2AK119ub (B) are shown (right panels).

Figure 2.
Relative abundance of H3K36me3 and H2BK120ub in K562 and MOLM-13 cells. (right panel). The Ponceau S-stained blot of histones resolved by SDS 15% PAGE (left panels), and the accompanying blot immunostained with antibodies against H3K36me3 (A) and H2BK120ub (B) is shown (right panels). .
Figure 2.
Relative abundance of H3K36me3 and H2BK120ub in K562 and MOLM-13 cells. (right panel). The Ponceau S-stained blot of histones resolved by SDS 15% PAGE (left panels), and the accompanying blot immunostained with antibodies against H3K36me3 (A) and H2BK120ub (B) is shown (right panels). .

Figure 3.
Relative abundance of H3K79me2 in K562 and MOLM-13 cells. (A). The Ponceau S-stained blot of histones resolved by SDS 15% PAGE (left panel), and the accompanying blot immunostained with antibodies against H3K79me2 is shown (right panel). (B) The Ponceau S-stained blot of histones resolved by AUT 15% PAGE (left panel), and the accompanying blot immunostained with antibodies against H3K79me2 (right panel) is shown.

Figure 4.
Relative expression of DOT1L in MOLM-13 and K562 cells. (A) Total cellular protein was electrophoretically separated by SDS-8% PAGE for DOT1L, and SDS-15% PAGE for β-actin. The immunoblots for DOT1L and β-actin are shown. (B) The relative transcript levels of DOT1L in K562 and MOLM-13 cell lines, normalized to the housekeeping gene GAPDH. The error bars represent the standard error of the mean (SEM) (3 biological repeats).

Figure 5.
Shown are the cell viability curves for MOLM-13 (filled circles) and K562 (gray triangles) cells treated with bortezomib. Points represent means and error bars SD for 3 replicates. In most cases, the error bars are smaller than the point size and are therefore not visible. Data were fit to a 4-Parameter logistic regression using SigmaPlot 14.5 with the parameters min, max, Hill slope (nH) and IC50 listed in Table 1. .

Figure 6.
Effect of bortezomib on H2AK119ub levels in K562 and MOLM-13 cells. The cells were treated with 5 nM bortezomib or vehicle (DMSO) for 4 hours. (A) Ponceau S-stained immunoblot of acid-extracted histones (left panel) and immunostained blot with anti-H2AK119ub antibody. (B) Quantification of H2AK119ub following bortezomib treatment of K562 and MOLM-13 cells. The error bars represent the standard error of the mean (SEM) (3 biological repeats).

Figure 7.
Effect of bortezomib on H2BK120ub levels in K562 and MOLM-13 cells. The cells were treated with 5 nM bortezomib for 2 and 4 hours. Control-treated cells were incubated with DMSO. Ponceau S-stained immunoblot of acid-extracted histones (left panel) and immunostained blot with anti-H2BK120ub antibody. (A) K562, (B) MOLM-13. Quantification of the H2BK120ub level in MOLM-13 bortezomib (4 hours) treated cells is shown in Figure 10).

Figure 8.
Effect of bortezomib on H3K79me2 abundance in K562 and MOLM-13 cells. The cells were treated with 5 nM bortezomib for 2 and 4 hours. Control-treated cells were incubated with DMSO. Ponceau S-stained immunoblot of acid-extracted histones (left panel) and immunostained blot with anti-H3K79me2 antibody. (A) K562, (B) MOLM-13. Quantification of the H3K79me2 levels in MOLM-13 bortezomib (4 hours) treated cells is shown in Figure 10).

Figure 9.
Effect of bortezomib on H3K36me3 abundance in K562 and MOLM-13 cells. The cells were treated with 5 nM bortezomib for 2 and 4 hours. Control-treated cells were incubated with DMSO. Ponceau S-stained immunoblot of acid-extracted histones (left panel) and immunostained blot with anti-H3K36me3 antibody. (A) K562, (B) MOLM-13. Quantification of the H3K36me3 levels in MOLM-13 bortezomib (4 hours) treated cells is shown in Figure 10).

Figure 11.
Effect of ONX-0194 on H2BK120ub and H2AK119ub abundance in MOLM-13 cells. The cells were treated with 50 nM ONX-0194 or vehicle control for 2 hours. Ponceau S-stained immunoblot of acid-extracted histones (left panel) and immunostained blot with anti-H2BK120ub (A) and H2AK119ub (B)antibodies.

Figure 12.
Effect of bortezomib on SSRP1 chromatin association. K562 and MOLM-13 cells were treated with DMSO (C) 50 nM bortezomib (B) for 2 hours and then subjected to cellular fractionation. The upper panels show blots of proteins resolved by SDS 8% PAGE and immunoblotted with an antibody against SSRP1. The center panels show protein blots resolved by SDS 15% PAGE and stained with Ponceau S. The bottom panels are the immunoblots of the center panels, immunostained with an antibody against H4.

Figure 13.
Effect of bortezomib (5 nM for 14 hours) treatment of MOLM-13 cells on transcript levels of HOXA9, DOT1L, MYC, and MEIS1. The transcripts in the treated MOLM-13 cell lines were normalized to PPIB. The error bars represent the standard error of the mean (SEM) (3 biological repeats).
Figure 13.
Effect of bortezomib (5 nM for 14 hours) treatment of MOLM-13 cells on transcript levels of HOXA9, DOT1L, MYC, and MEIS1. The transcripts in the treated MOLM-13 cell lines were normalized to PPIB. The error bars represent the standard error of the mean (SEM) (3 biological repeats).


Table 1.
Fit parameters for K562 and MOLM-13 cells treated with bortezomib.
 |
Disclaimer/Publisher’s Note: The statements, opinions and data contained in all publications are solely those of the individual author(s) and contributor(s) and not of MDPI and/or the editor(s). MDPI and/or the editor(s) disclaim responsibility for any injury to people or property resulting from any ideas, methods, instructions or products referred to in the content. |
© 2026 by the authors. Licensee MDPI, Basel, Switzerland. This article is an open access article distributed under the terms and conditions of the Creative Commons Attribution (CC BY) license (http://creativecommons.org/licenses/by/4.0/).
Copyright: This open access article is published under a Creative Commons CC BY 4.0 license, which permit the free download, distribution, and reuse, provided that the author and preprint are cited in any reuse.


