

Submitted:
11 June 2026
Posted:
12 June 2026
You are already at the latest version
Abstract
Background: With the growing prevalence of cybercrime, individuals increasingly face risks such as copyright infringements, obscenity, defamation, fraud, personal data theft, communication interception, and bank/card information theft, making awareness of these dangers a fundamental necessity. This study aims to develop a valid and reliable scale to measure ‘Cybersafety,’ defined as a holistic state of digital security and functioning in online environments. Methods: The research, conducted using a quantitative method and a survey model, collected data from 1100 participants aged 15-70 residing in Istanbul. Results: A scale consisting of 30 items and 6 factors (Technology-Based Threats & Phishing, Internet Addiction, Password Practices and Management, Privacy in Networks, Foreign Threat, Body-Orientedness) was obtained, and the total variance explained was found to be 52%. The Cronbach Alpha was found to be 0.83. Confirmatory factor analysis indicated acceptable model fit and validated the structure, while the participants’ mean score of 61.66 showed that cybersafety was at a medium level and posed a moderate threat. Conclusions: The study showed that social media use and prior digital risk experiences influence cybersafety levels, and that Generation Z (under 25 years old) faces the highest risk in the Technology‑Based Threats & Phishing dimension.
Keywords:
cyber
; safety
; cybersafety
; scale development
1. Introduction
In the digital age, internet-connected portable devices and smartphones are used more and more frequently, and the time spent on these devices is increasing every day. With the diversification of user profiles, individuals of all ages face various security risks and may experience some problems in their daily lives. It is stated that various concepts such as cybersecurity, online security, online safety, and internet security are used interchangeably to describe the security risks created by the digital environment [1]. It is noted that within conceptual discussions, the concept of Cybersecurity is used quite broadly to explain security in the digital realm. However, there are studies that state that this concept focuses more on technical security [2,3,4,5]. Another perspective focuses more on a human-centered approach to digital awareness or digital well-being, and these studies have introduced different terms such as cybersafety, cyber wellbeing, and cyber awareness [6,7,8,9,10].
Nowadays, the increasing prevalence of cybercrime as a field of study is due to the multifaceted problems people face in their lives, such as copyright infringements, obscenity, defamation, interactive fraud, theft of personal data, communication disruption, and theft of bank/card information in the digital realm [11,12,13]. In a study that examines the multidimensional social and psychological effects of cybercrime on individuals, Holt et al. clearly demonstrate that cybercrime is not merely a technical threat; it affects individuals’ lives in many ways through its psychological, social, economic, legal, and technical dimensions [14].
Khadka and Ullah’s study demonstrates that cybersecurity is not merely a technical issue; a large portion of online risks stem from human behavior, decision-making processes, and organizational culture [15]. Many studies strongly suggest that cybersecurity awareness has become a fundamental need today [14,16]. However, since most of these studies focus on technical and structural issues, the necessity of placing the individual and individual awareness at the center of the holistic structure of cybersecurity is also being debated.
Accordingly, studies using the concept of cybersafety show that researchers are increasingly adopting an approach that centers on the holistic safety of individuals in the digital environment. These studies treat cybersafety not merely as protection against technical threats, but as a broad framework encompassing all psychological, social, behavioral, privacy-based, and relational risks [17,18,19,20]. In this context, studies in the cybersafety literature have extended the concept of individual safety in the digital environment beyond technical threats.
These studies highlight the multifaceted nature of the dangers individuals face in digital environments; they demonstrate that, in addition to technical security behaviors, areas such as personal data management, social interaction risks, communication with strangers, body-focused sharing, digital privacy, online manipulation, and psychological effects should be considered within the framework of cybersafety.
In conclusion, cybersafety awareness, which refers to individuals feeling safe in the cyber environment, has been addressed as a fundamental concept in this study due to its multifaceted nature. Within this scope, the aim was to develop a scale based on this concept and contribute to the literature with the quantitative findings obtained.
1.1. Cybersafety Conceptual Framework
Cybersafety is a broad concept that refers to existing safely and healthily in the digital environment. This means not only protection from threats, but also ensuring the proper functioning of systems and preventing user harm. Safety is a state in which the probability of harm to individuals, systems, or the environment is reduced to acceptable levels. This is considered not only as a result but also in conjunction with the rules, precautions, and practices that achieve this result. According to Leszek Korzeniowski, safety is a state based on the absence of threats. Korzeniowski emphasizes that safety has both objective and subjective components [21]. Blokland and Reniers state that in modern literature, safety is not merely an outcome, but a concept shaped by organizational arrangements, management systems, and policy frameworks [22]. This shows that the concept of safety can be used in studies as a kind of organizational framework. The same study also emphasizes that safety is constantly reproduced through operational practices, behaviors, and management practices. This approach reveals that safety is not merely a “state”, but a dynamic process built through practices [23]. Therefore, the concept of “Cybersafety” is a suitable choice for studying a comprehensive state of security in the digital environment.
On the other hand, the term Cyber, as expressed by Wiener, originates from cybernetics [24]. Wiener first defined cybernetics as control and communication in animals and machines. Cybersafety can initially be defined as a general concept aiming to protect digital environments and materials such as computers, servers, mobile devices, electronic systems, networks, and data from malicious attacks. In one study, cybersafety was explained as the technical skills that individuals need to acquire to ensure their own safety against certain cyber threats and was considered together with digital citizenship [25]. In yet another recent study, cybersafety is discussed together with Cybersecurity [26]. Accordingly, while cybersecurity encompasses technical issues such as password management, compliance with security policies, system security, data protection, and security protocols; the concept of cybersafety refers to a state of being safe, encompassing more human-involved processes such as avoiding harmful content, account safety, and protection against threats and risks.
As understood, cybersafety refers to a multidimensional state of security perceived by an individual in digital environments, encompassing a broad framework for explaining a holistic state of security and functionality that includes technical applications, behavioral choices, psychological responses, social interactions, privacy management, and awareness of online risks. It covers multidimensional processes that include how an individual behaves in digital environments, what risks they are exposed to, how they manage these risks, how they are sociologically affected, and how safe they feel. Therefore, we can say that cybersafety is a multidimensional structure shaped by the interaction of cognitive, affective and psychological, behavioral, sociological, and technical security processes. In the literature, it is seen that cognitive-affective-behavioral models (e.g., CAB model) and socio-technical approaches support this multidimensionality, especially in human-centered cybersecurity studies [27]. This study aims to develop a measurable tool that explains the multidimensional level of security by addressing the concept of cybersafety within a holistic framework. Accordingly, the Cybersafety Scale will be used to measure the dimensional level of security, contributing to the scientific literature with this measurement tool.
1.2. Measuring Cybersafety
The increase in cybercrime and the disruption of the digital balance are leading to negative consequences that affect people’s lives. This situation has brought to the forefront the need to control cyber life [28]. Effectively ensuring safety in the cyber environment requires understanding individuals’ awareness levels and current safety status. Therefore, scientific studies frequently focus on developing tools to measure these factors.
A review of the literature reveals the “Personal Cyber Security Provision Scale” developed by Erol, Şahin, Yılmaz, and Haseski [29]. This 5-point Likert-type scale, consisting of 25 items, comprises 5 factors: “Personal Privacy Protection”, “Avoiding Unreliable Sources”, “Prevention and Precaution”, “Payment Information Security” and “Remaining Anonymous”. The Cronbach-α reliability coefficient of the scale is 0.73.
Furthermore, Arpaci and Ateş developed the Cybercrime-Awareness Scale (CAS) in two separate samples of 500 and 494 individuals to measure awareness of cybercrimes, revealing a three-factor structure (i.e., information systems crimes, personal data crimes, and privacy and security). The reliability coefficients of the subscales were found to be 0.95, 0.92, and 0.90, respectively [30]. Additionally, the Cybercrime Awareness on Social Media Scale (CASM-S) was developed with 1045 individuals. This scale, with a single-dimensional factor structure, consisted of 22 items and explained 52.51% of the variance. The Cronbach-α reliability coefficient was found to be 0.95 [31]. In another study, Arpaci and Sevinç developed a scale called the “Cybersecurity Scale (CS-S)” to measure individuals’ cybersecurity practices and perceptions [30]. This 24-item, 5-point Likert-type scale, with an internal consistency reliability of 0.88, consists of 6 factors: Confidentiality, Control/Possession, Integrity, Authenticity, Availability, and Utility.
One study aimed to develop internet addiction, cyber bullying, netiquette, online privacy, inappropriate online content, copyright, and cyber security scales oriented to secondary school students within the scope of cyber wellness framework [32]. Based on data obtained from 528 middle school students in grades 6, 7, and 8, the scales, each rated on a 4-point Likert scale, were found to consist of: the Internet Addiction Scale with 11 items, the Cyberbullying Scale with 8 items, the Online Politeness Scale with 8 items, the Online Privacy Scale with 4 items, the Online Inappropriate Content Scale with 7 items, the Copyright Scale with 5 items, and the Online Safety Scale with 11 items.
On the other hand, according to research indicating that the concept of literacy has been extended beyond reading, writing, speaking, and listening skills due to the influence of new media and digital technologies, the concept of literacy now refers to the ability to understand new media content, know its cultural characteristics, and effectively use the language of new media [33,34]. In this context, digital media literacy means an individual’s ability to protect themselves from harmful content in digital environments, to select useful content, to exhibit appropriate behavior, and to protect themselves against unsafe situations. Therefore, the concepts of cybersecurity and digital literacy are often considered together, and digital literacy scales are used in research conducted in these areas [35,36,37].
Several findings have been obtained in various studies conducted on different sample groups. Accordingly, in a study conducted using the CSS developed by Erol et al [29]. in 2015, the cybersecurity behaviors of 170 university students were examined. The results showed that the students' cybersecurity behaviors were generally at an adequate level. It was determined that the students were able to protect their personal privacy, avoid unreliable applications, take necessary security measures, protect payment information such as credit cards and debit cards, and largely conceal their tracks while browsing the internet [4].
Another study conducted with the scale developed by Erol and colleagues involved 172 teachers and found that their cybersecurity levels were moderate. A significant difference was found in favor of women based on gender and in favor of those using the internet for 3-6 hours a day based on daily internet usage time. However, no significant difference was found based on the purpose of internet use or the number of social media accounts owned [38]. In another study using the same scale, the cybersecurity behaviors of 420 university students were examined according to personality traits, gender, class level, department, having received information security training, and weekly internet usage time. The results showed that the students’ cybersecurity behaviors were at an acceptable level [39].
In a study conducted to measure the information security awareness levels of university students, the “Information Security Awareness Scale (ISAS)” was developed. This scale consists of 34 items and 4 factors: privacy and safe browsing, attacks and threats, general security, and cyber bullying. In the study conducted with 200 people, the internal consistency reliability of the scale was found to be 0.94, and the total variance explained was 50.42% [40].
In a study conducted with a sample of 407 secondary school students to determine their information security awareness levels, the “Information Security Awareness Scale (ISAS)” was developed. This scale consists of 36 items and 3 factors: attacks and threats, privacy, and the protection of personal data. The Cronbach-α reliability coefficient of the scale was found to be 0.95 [41]. Another scale in this field was developed by Erdoğmuş in 2017 [42]. This scale, consisting of 18 items and 5 factors, includes the following factors: internet security, social media use, internet browser and network security, password creation, and social media traps. The Cronbach-α value of this scale is 0.83.
A study conducted with a sample of 88 individuals aged 18-29, using the Personal Cybersecurity Awareness Scale, the Information Security Awareness Scale, and semi-structured open-ended questions, found that university students generally have a high level of awareness regarding personal cybersecurity and information security. However, the results also indicate that some students have no awareness or very low awareness. This situation varied according to departments or the number of social media accounts [43].
A study conducted by Alzubaidi collected data from 1230 individuals in Saudi Arabia using an online survey created by the researcher [44]. Current cybersecurity awareness levels were measured in terms of cybersecurity practices, awareness levels, and incident reporting behaviors. According to the survey results, 31.7% of participants use public Wi-Fi to access the internet, 51% use personal information when creating passwords, 32.5% stated they had no knowledge of phishing attacks, and while 21.7% were victims of cybercrime, only 29.2% of them reported the crime. These findings reflect the general level of awareness.
A study conducted with 253 high school seniors in the Philippines used an adapted questionnaire to measure awareness of cybercrime [45]. The results showed that students had a “very high” level of awareness regarding cybercrime. Awareness was particularly high regarding cyberbullying, cyberpornography, and identity theft. This indicates that students possess the knowledge to avoid becoming victims of cybercrime or engaging in such behaviors.
In this field, a different approach was taken in 2024 to evaluate the digital competencies of employees in the public and private sectors, with the “Digital Competency Scale” [46]. This scale consists of three dimensions: employees' perception of digital competence, perception of digital compliance, and perception of digital anxiety, and contains a total of 21 items. As a result of the analyses, the scale was determined to be valid and reliable, with an internal consistency coefficient of 0.96.
With the advancement of technology, the threats encountered in the cyber environment are becoming more diverse and numerous every day. A review of the literature reveals a lack of a comprehensive measurement tool that focuses on the individual and holistically assesses cybersecurity within the framework of “cybersafety”. Furthermore, no scale directly based on and developed under the name “cybersafety” has been found.
The Cybersafety framework encompasses awareness in the cyber environment from many perspectives, including technical security behaviors, psychological effects, password management, privacy and social relationships, stranger threats, and body-focused sharing. Therefore, since Cybersafety describes a multi-dimensional state of digital safety, the need to develop a scale that can measure this concept highlights the necessity of this study.
2. Materials and Methods
The research was conducted using a quantitative method, taking into account the statistical analyses in the scale development process. A survey model was used because data was collected with measurement tools to determine the current situation.
2.1. Ethical Approval
This study received ethical approval from the Uskudar University Non-Interventional Research Ethics Committee report number of 61351342/April 2021-27 (30 April 2021). This study was performed according to the principles set out by the Declaration of Helsinki involving the use of humans in experimental research.
2.2. Participants
The study sample consisted of 1100 people. 50.4% of the participants were female (n=554), and 49.6% were male (n=546). Their ages ranged from 15 to 75, with an average age of 35. When age groups were examined according to generations, the distribution was as follows: 38.4% (n=422) belonged to Generation Z (15–25 years), 30% (n=330) to Generation Y (26–45 years), 24.8% (n=273) to Generation X (46–60 years), and 6.8% (n=75) to BB Generation (61–70 years). Regarding educational status, 50% of participants are university graduates (n=550), 28.5% are postgraduate graduates (n=313), 17.5% are high school graduates (n=193), 2.9% are college graduates (n=32), and 1.1% are primary/secondary school graduates (n=12). 49.1% (n=540) of participants are currently students. In terms of relationship status, 52.4% are single, 38.5% are married, 1.1% are engaged/betrothed, and 8.1% are divorced or widowed. Regarding children, 62.4% have no children (n=686); 15.5% have one child, 18.5% have two children, and 3.8% have three or more children.
2.3. Data Collection Tools
A questionnaire was used to collect data in this study. This form consisted of demographic information, the items of the scale to be developed, and a valid and reliable Digital Literacy Scale from the literature to ensure criterion validity.
Demographic Form: Participants were asked demographic questions such as age, gender, education level, whether they were students, relationship status, and number of children. In addition, questions regarding usage behaviors such as duration of social media use, preferred platforms, number of accounts, and control habits were included, as well as questions measuring digital security concerns such as account theft, financial loss, and receiving fake messages.
Digital Literacy Scale (DLS): This scale was developed by Bayrakcı and Narmanlıoğlu in 2021, on a sample of 1287 participants [36]. Validity and reliability analyses revealed that the scale consists of 29 items and 6 factors: Ethics and Responsibility, General Information and Functional Skills, Daily Use, Advanced Production, Privacy and Security, Social Dimension. The total Cronbach-α value of the scale was found to be 0.91. DLS and the developed scale cover similar areas in terms of digital awareness. Therefore, DLS was included in the application to ensure criterion validity.
Cybersafety Scale (CYSAF): The validity and reliability stages of the Cybersafety Scale were followed throughout the study. To this end, necessary statistical studies were conducted within the scope of content validity, construct validity, discriminant validity, internal consistency reliability, confirmatory factor analysis, and goodness-of-fit calculations. First, the item pool creation and in-depth literature review studies were carried out simultaneously. After the item pool was created, an assessment inventory was used for content validity. In this inventory, each item is evaluated by experts using the options “The item is appropriate to remain in the scale”, “The item can remain in the scale but is unnecessary”, and “The item is not appropriate to remain in the scale”. An expert group was formed to obtain evaluations from various fields. This evaluation forms were sent to the experts via email, and the obtained data were converted into numerical values and transferred to a spreadsheet program. Subsequently, item agreement rates were calculated using the formula proposed by Miles and Huberman [47]. The formula used for calculating the agreement rate is as follows:
Reliability =
This formula is used to measure the agreement between researchers (coders), and the resulting value is expected to be above 70% [47]. The calculations for content validity were conducted using data obtained from the evaluation form. Based on the 0–1 rating in the form and the results of the formula, items with an agreement rate below .70 were removed from the draft scale. However, no items were excluded from the initial 37-item version at this stage. Therefore, it was decided to collect data using a 37-item instrument with a five-point Likert scale (Never, Rarely, Sometimes, Often, Always).
Exploratory Factor Analysis (EFA) is a technique used in scale development to ensure construct validity, and before applying it, the suitability of the dataset must be tested. The appropriateness of the data is evaluated using two statistical tests: the Bartlett’s test of sphericity and the Kaiser-Meyer-Olkin (KMO) measure [48]. Based on the KMO value (>,90 “excellent”; >,80–<,89 “very good”; >,70–<,79 “good”; >,60–<,69 “moderate”; >,50–<,59 “poor”; <,50 “unacceptable”) and the statistical significance of Bartlett’s test of sphericity (p < 0.05), a decision is made regarding whether Exploratory Factor Analysis can be performed.
When factor analysis is applied, the number of factors is determined based on eigenvalue statistics. A factor is considered to exist if the eigenvalue is equal to or greater than 1 (Eigenvalue ≥ 1) [49]. Another important outcome of factor analysis is the explained variance ratio. The adequacy of the explained variance is also evaluated. In the social sciences, an explained variance ratio ranging between 40% and 60% is generally considered acceptable [48].
The next validity step is discriminant validity, which tests whether the scale can measure the intended construct effectively. For this purpose, total scores obtained from the scale are ranked, and the upper 27% and lower 27% groups are formed. These groups are then compared using an independent samples t-test. In this study, groups of 202 participants each were compared from a dataset of 750 individuals. The following step is criterion validity. In this stage, data are collected using both the developed scale and another previously validated and reliable scale from the related literature. The correlation coefficient (r) between the two scales is calculated to examine the relationship (r < .30 “low”; .30–.70 “moderate”; r > .70 “high”). In the reliability stage, the Cronbach-α coefficient is calculated based on item variance for the overall scale and, if applicable, for its subscales.
In this study, confirmatory factor analysis (CFA) is applied to test the accuracy of the scale structures identified in construct validity studies and to confirm the proposed model. CFA is used to determine the final structure of the scale. Special software such as AMOS is used for this analysis, and a model is constructed based on the factors identified in Exploratory Factor Analysis (EFA). After running the model, the goodness-of-fit indices are examined to evaluate whether they fall within the acceptable ranges reported in the literature.
2.4. Criteria of Inclusion and Exclusion
Participants aged 15 and older were included in the study, while individuals younger than 15 were excluded as an exclusion criterion.
2.5. Procedure
The data collection process in the study consisted of two stages. The first stage was a pilot application, in which the questionnaire, including the scales, was administered to 10 participants for testing purposes. The clarity and comprehensibility of the items were evaluated, and no problems were encountered. The second stage was the field study. In this stage, the data collection instrument was distributed digitally in accordance with the principle of voluntariness for four weeks between November 1 and November 30, 2025, following the approval of the Ethics Committee dated April 30, 2021.
2.6. Data Analysis and Statistical Analysis
In the validity and reliability analyses of the CYSAF, several statistical techniques were applied to a dataset of 750 participants using SPSS 26.0, including Exploratory Factor Analysis (EFA), Pearson correlation coefficient, independent samples t-test, and Cronbach-α. The remaining 350 participants were used for Confirmatory Factor Analysis (CFA). For this purpose, AMOS 22.0 software was employed, and goodness-of-fit indices were calculated within the framework of Structural Equation Modeling (χ²/df, RMSEA, NFI, NNFI, CFI, GFI, AGFI). For the initial results of the scale development process, the full dataset of 1100 participants were used. When the distribution characteristics of the variables were examined, skewness values ranged between –0.35 and +0.61, and kurtosis values ranged between –0.72 and +0.54. Since these values fall within ±1, they do not indicate a significant deviation from normal distribution. In addition, it is known that in large samples (n > 300), minor deviations in skewness and kurtosis coefficients do not affect the validity of parametric tests [50]. Based on these findings, the data were considered to meet the assumption of normal distribution, and the use of independent samples t-test and one-way ANOVA analyses was deemed appropriate.
3. Results
This section presents the validity and reliability analyses of the Cybersafety Scale (CYSAF). First, it was examined whether the dataset of 750 participants was suitable for scale development analyses using factor analysis. In this context, the Kaiser-Meyer-Olkin (KMO) measure of sampling adequacy and Bartlett’s test of sphericity were conducted to assess the suitability of the data for factor analysis. The KMO value was found to be .81. The result of Bartlett’s test of sphericity was statistically significant (χ² = 10509.569; df = 435; p = 0.000). Accordingly, the dataset was considered suitable for factor analysis [48]. Following the development of the item pool based on literature review and expert opinions, and after ensuring content validity for the 37-item draft scale, Exploratory Factor Analysis (EFA) was applied to the dataset obtained from 750 participants. At the EFA stage, eigenvalues greater than 1 indicated the factor structure for the CYSAF, and a 6-factor structure was identified [49].
As shown in Table 1, the eigenvalues of the factors ranged between 5.73 and 1.45. The total explained variance of the scale was 52.04%. During the determination of the factor structure, item factor estimates were also examined, and items with cross-loadings or low estimates (12, 14, 15, 18, 19, 32, and 37) were removed from the scale. As a result, a 30-item scale was obtained after eliminating 7 items, and the item factor estimates of this final structure are presented in Table 2. Overall, the item factor estimates were above .50, while only two items showed estimates between .40 and .50 (.40 and .46).
As shown in Table 2, after determining the factors and item distributions that form the scale structure, the factors were named accordingly. Based on the newly arranged item numbering, the factors were labeled as follows: the first factor (items 1–7) “Technology-Based Threats & Phishing”, the second factor (items 8–13) “Internet Addiction”, the third factor (items 14–19) “Password Practices and Management”, the fourth factor (items 20–24) “Privacy in Networks”, the fifth factor (items 25–28) “Foreign Threat”, and the sixth factor (items 29–30) “Body- Orientedness.” In addition, item-total correlations were found to be within acceptable ranges for all items (r>.30). During the reliability analysis, Cronbach-α coefficients were calculated for internal consistency, and the results are presented in Table 2. The values ranged between .67 and .87, and the overall reliability of the scale was found to be relatively high (α=.83).
Another representation of the factor structure is the Scree Plot, and the graphical representation of the 6-factor CYSAF structure is presented in Figure 1.
With the factorial structure of the CYSAF established, the relationships between the factors and the total scale were determined using the Pearson Correlation Coefficient (r), and the results are presented in Table 3.
According to Table 3, the factors were found to be moderately correlated with each other, with varying coefficients (r > 0.30 < 0.70). When the relationship of the factors with the total scale was examined, it was revealed that each of them was moderately correlated (r > 0.30 < 0.70).
Another study conducted within the scope of validity studies is discriminant validity. Accordingly, to perform discriminant validity, two groups of 27% each were created from the dataset, one containing the lowest score and the other the highest score. Thus, considering the dataset of 750 individuals, 202 individuals were selected from each group (ranked in ascending and descending order) to create a new dataset of 404 individuals. Independent groups t-tests were then applied to both groups regarding factors and total scores. The results of the differences between the groups, obtained to evaluate the scale’s ability to measure the intended characteristic, are given in Table 4.
Table 4 shows that the independent group t-test results are significantly different, confirming that the scale effectively distinguishes between groups. After establishing this discriminative power, the next step was to examine the relationship between the CYSAF and the Digital Literacy Scale (DLS), which was selected as a comparable measure. This relationship was analyzed using the Pearson Correlation Coefficient (r), and the findings are presented in Table 5.
When Table 5 is examined, it is seen that there is a moderately strong relationship between the CYSAF and the DLS factors, as the correlation value is at the upper limit of the reference range (r=0.70; r>.30<.70; “moderate”).
Within the scope of the reliability analyses, Cronbach-α internal consistency coefficients were calculated for both the factors and the overall scale. As shown in Table 2, the results indicate acceptable reliability at the factor level, while the overall scale reliability was found to be high (α=.83). The factor-level α values ranged between 0.67 and 0.87. Following the validity and reliability findings, it was decided to test the factorial structure obtained through Exploratory Factor Analysis (EFA) using Confirmatory Factor Analysis (CFA). Accordingly, the factor structure of the CYSAF was modeled using a new dataset of 350 participants with the AMOS 22.0 software, as shown in Figure 2, and standardized factor estimates are presented in Table 6.
The results of the confirmatory factor analysis indicated that the model generally met acceptable goodness-of-fit criteria (X2/sd=2.63<3; RMSEA=.06<.08; NFI=.91>.90; NNFI=.96>.95; CFI=.96>.95; GFI=.92>.90; AGFI=.87>.85).

Table 7.
Standardized Factor Estimates.
| Factor | Items | Standardized Factor Estimates |
| Technology Based Threats & Phishing | I23 | ,77 |
| I25 | ,72 | |
| I24 | ,66 | |
| I22 | ,63 | |
| I11 | ,51 | |
| I10 | ,46 | |
| I13 | ,45 | |
| Internet Addiction | I27 | ,70 |
| I29 | ,73 | |
| I30 | ,74 | |
| I26 | ,56 | |
| I28 | ,63 | |
| I31 | ,62 | |
| Password Practices and Management | I16 | ,63 |
| I33 | ,53 | |
| I17 | ,52 | |
| I36 | ,45 | |
| I35 | ,47 | |
| I34 | ,52 | |
| Privacy in Networks | I4 | ,73 |
| I3 | ,83 | |
| I5 | ,63 | |
| I1 | ,40 | |
| I2 | ,40 | |
| Foreign Threat | I8 | ,69 |
| I7 | ,80 | |
| I6 | ,67 | |
| I9 | ,47 | |
| Body-Orientedness | I21 | ,96 |
| I20 | ,86 |
In this study, which examined the validity, reliability, and psychometric properties of the Cybersafety Scale (CYSAF), preliminary descriptive statistical analyses conducted on a dataset of 1100 participants indicated that the mean score obtained from the scale was 61.66.
The total scores obtained from the scale were evaluated based on percentile rankings within a normative sample of 1100 participants. The raw scores corresponding to the P10, P25, P75, and P90 percentiles were found to be 43, 50, 63, and 70, respectively. Accordingly, the total scores were classified into five levels: “none” (<43), “low” (43–49), “moderate” (50–62), “high” (63–69), and “very high” (≥70) (Appendix A). Similarly, all sub-dimensions were evaluated according to percentile rankings within the normative sample. Based on these results, the overall mean score of 61.66 indicated that the sample was at a moderate level of risk and a moderate level of cybersafety. At the dimension level, the first factor, Technology-Based Threats & Phishing, had a mean score of 18.43, indicating a high level of risk and low level of cybersafety. The second factor, Internet Addiction, had a mean score of 12.45, indicating a moderate level of both risk and safety. The third factor, Password Practices and Management, with a score of 13.48, also indicated a moderate level of risk and safety. The fourth factor, Privacy in Networks, with a score of 7.70, reflected a moderate level of risk and safety. The fifth factor, Foreign Threat, with a score of 6.28, similarly indicated a moderate level of risk and safety. Finally, the sixth factor, Body-Orientedness, with a score of 3.29, indicated a low level of risk and a good level of cybersafety.
After the validity and reliability analyses of the scale, several comparisons were conducted between independent variables and both the total CYSAF scores and its sub-dimensions, based on the dataset of 1100 participants. The observed differences and effect sizes indicated by Cohen’s d values are presented in Table 8.
Table 8 shows that there are significant differences in three sub-dimensions of the CYSAF according to gender (p<0.05). Accordingly, in the Password Practices and Management dimension, males perceive themselves as being less at risk compared to females, while females report higher perceived risk levels than males. According to Cohen’s d effect size analysis, this difference reflects a small effect size (d<0.30). On the other hand, in the Foreign Threat dimension, females obtained lower scores compared to males, indicating higher awareness levels. This suggests that males have lower levels of cybersafety awareness and perceive themselves as being at greater risk in relation to foreign threats. The effect size for this difference was found to be moderate (0.30<d<0.70). The significant difference observed in the Body-Orientedness dimension indicates that males are at higher perceived risk and have lower levels of cybersafety awareness (p<0.05). No statistically significant differences were found for the total scale score and the other three sub-dimensions not reported in the table (p<0.05).
The other comparison analysis focused on generational differences in cybersafety awareness based on age groups. One-Way ANOVA was applied to compare the groups, and the LSD test was used to examine within-group categorical differences. The results are presented in Table 9. According to the analysis, no significant difference was found only in the “Privacy in Networks” dimension (p>0.05). However, statistically significant differences were observed at a high level in the total scale score and in the other five sub-dimensions (p<0.01).
Table 9 shows that in the Technology-Based Threats & Phishing dimension, Generation Z obtained the highest mean score and was classified at the “high risk, low cybersafety” level. Accordingly, Generation Z was identified as the most at-risk group compared to other generations. This group differed significantly from the Baby Boomers, X, and Y generations, indicating lower levels of cybersafety (p<0.01). In the Internet Addiction dimension, Generation Z again showed the highest risk level (“high risk, low safety”), followed by Generation Y. The findings indicate that internet addiction risk increases as generations become younger, while cybersafety decreases accordingly. In the Password Practices and Management dimension, the highest risk levels were observed in Generations Z and Y. The average scores corresponded to a “moderate risk, moderate safety” level (p<0.01). Thus, while BB and X generations can be considered relatively safer and less at risk in password management, all generations overall still fall within a moderate risk level. In the Foreign Threat dimension, Generation Z had the highest risk level and showed a significant difference compared to all other generations (p<0.01), followed by Generation Y. These findings indicate that susceptibility to foreign threats increases in younger generations. Based on scores, X and BB generations were at a low-risk level, whereas Y and Z were at a moderate-risk level. A similar pattern was observed in the Body-Orientedness dimension, where risk levels increased as the generations became younger (p<0.01). Generation Z was at a moderate-risk level regarding body-focused sharing behaviors, while Generations Y, X, and BB were at a low-risk level. Overall, the results across all dimensions are reflected in the total CYSAF scores. As age decreases, cybersafety decreases and perceived risk increases. Generation Z emerged as the highest-risk group, followed by Generation Y. Both generations were classified at a “high risk, low cybersafety” level based on their scores. Generation X was found to be less safe than Generation BB. According to total scale scores, both X and BB generations were at a “moderate risk, moderate safety” level. In conclusion, cybersafety increases with age, while it decreases as age decreases.
Finally, the total CYSAF scores were compared based on certain social media usage habits and negative experiences in the cyber environment, and the results are presented in Table 10.
Table 10 shows that participants who use social media for 4 hours or more per day are at a “high risk, low cybersafety” level, while those who use it for 1–3 hours and less than 1 hour are at a “moderate risk, moderate cybersafety” level. The results of the categorical comparison indicate that as daily social media usage increases, perceived risk increases and cybersafety decreases. Regarding the frequency of opening live chat sessions on social media, participants who selected “often” and “sometimes” were found to be at a high-risk, low-safety level, whereas those who selected “rarely” or “never” were at a moderate-risk, moderate-safety level. Accordingly, as the frequency of chat usage increases, risk increases and cybersafety decreases. In terms of preferred social media platforms, TikTok users were found to be at a very high-risk level with no cybersafety. X platform users were at a high-risk, low-safety level, while Instagram, YouTube, and Facebook users were at a moderate-risk, moderate-safety level. Participants who engage in reciprocal liking behavior (i.e., liking content in response to others’ likes) were found to be at a high-risk, low-safety level, whereas those who like content based on its quality or do not use likes at all were at a moderate-risk, moderate-safety level. When examining the number of social media profiles, participants using nickname-based accounts were at a high-risk, low-safety level. Similarly, those using multiple profiles even under their real name were also found to be at high risk with low cybersafety. In contrast, participants with a single profile were at a moderate-risk, moderate-safety level.
When digital safety anxiety, perceived level of knowledge adequacy, account theft, money theft, and receiving fake messages/calls were examined, participants who reported rarely experiencing safety anxiety and rarely perceiving their knowledge level as sufficient were found to be at a “high risk, low cybersafety” level, while other groups were at a “moderate risk, moderate cybersafety” level. Participants who had experienced account or money theft more than once were found to be at a very high level of risk with no cybersafety, while those who had experienced it once were also at a high-risk level. In contrast, participants who had never experienced such incidents were found to be at a moderate-risk and moderate-safety level. Similarly, participants who had received fake messages or calls once or multiple times were found to be at a high-risk, low-safety level, whereas those who had never experienced them were still found to be at a moderate-risk, moderate-safety level.
4. Discussion and Conclusion
In this study, a scale named CYSAF, consisting of 30 items and 6 factors (Technology-Based Threats & Phishing, Internet Addiction, Password Practices and Management, Networks in Privacy, Foreign Threat, and Body-Orientedness), was developed. Using the dataset of 1100 participants aged between 15 and 70, collected within the scope of the study, various comparisons were conducted and initial scores were obtained. The findings of this research indicate that previous cyber security studies should be re-evaluated in light of current data, thereby offering a potential contribution to the literature.
In a study conducted by the Cybercrime Awareness Clinic team, focus group discussions and individual interviews were carried out to better understand older adults’ perceptions and experiences of cybercrime. The findings revealed that older adults have specific cyber awareness needs, highlighting the importance of developing more tailored prevention and reporting mechanisms [51]. While education on cyber risks and prevention methods is crucial, it is more effective when designed according to the specific needs of the target group. In this study, it was found that especially Generation Z (ages 15–25) and Generation Y (ages 26–45) fall into the “high risk, low cybersafety” category. This indicates the need to prioritize these age groups and implement urgent education and awareness programs targeting them.
The finding that individuals who have experienced account or money theft multiple times are at a very high level of risk with no cybersafety, and even those who experienced it once are at a high-risk level, highlights the urgent need for awareness efforts and provides direction for future studies. The results show that in the sample, 100 participants had experienced money theft at least once in a digital environment, and 208 participants had experienced account theft at least once. These numbers are considerable and have the potential to provide valuable quantitative data to the literature. This issue, referred to in the literature as repeat victimization and multiple victimization, has been examined in a recent study, which found that the risk profiles of first-time victims and repeat victims are significantly different. Repeat victimization was identified as a much stronger indicator of risk [52]. The study also emphasizes that a “one-size-fits-all” prevention approach is insufficient and that individuals experiencing repeated victimization require targeted and specialized interventions.
The finding that users of TikTok—the most frequently used and most preferred social media platform—are at a very high level of risk with almost no cybersafety, highlights the importance of examining platform choice in terms of cybersafety. Users of X were found to be at a high-risk, low-safety level, while users of Instagram, YouTube, and Facebook were at a moderate-risk, moderate-safety level. These results suggest that awareness efforts can be designed specifically for different platforms. A study has shown that differences in platform design, content structure, and security features directly affect user risk, and that some platforms have a higher threat surface than others [53]. This supports the idea that differences in risk and cyber safety across platforms are scientifically meaningful.
A study that systematically reviewed findings from cybersecurity awareness research on children, examining 56 peer-reviewed studies, identified key cybersecurity risk factors [1]. Similar risk factors addressed in our study include online privacy, online harassment, stranger danger, social engineering, content-related risks, sexual solicitation, technology-based threats, economic risks, internet addiction, and password practices and management. In this context, CYSAF can be considered a measurement tool that enables the assessment of these risk factors and has the potential to provide concrete data to the scientific literature.
In addition, it was found that the psychology of social media communities also affects the level of cybersafety. The tendency to “like back” (liking others’ posts without considering the content) was associated with a higher level of risk, and individuals who reported this behavior were found to have low levels of cybersafety. This finding highlights the importance of engaging with content more consciously and selectively. Another striking result is that heavy users—those who spend 4 hours or more per day on social media—and individuals who frequently initiate live chats are at a “high risk, low cybersafety” level. Studies on social media addiction also emphasize that reciprocal liking behavior and spending more than 4 hours per day on social media are common characteristics of high-risk groups [54,55].
In comparisons made using CYSAF based on gender, women were found to be at higher risk in terms of password practices and management, while men were at higher risk in the dimensions of foreign threats and body-focused sharing. These differences were reflected in their levels of cybersafety. However, no significant gender difference was found in the total scale score. Previous studies have reported mixed results regarding gender differences. For example, a study conducted with university students found that female students scored higher than males in the personal privacy protection dimension. However, this difference varied by department, with the opposite result observed in engineering programs [4]. Such differences can sometimes be explained by generational factors. Even within the same country or city, variations in habits, values, attitudes, and technology use may occur across different communities [56,57]. Therefore, it is recommended that future studies include more in-depth analyses of gender through focused group research. In this context, the newly developed and multidimensional CYSAF scale is considered important for contributing initial findings to the literature and providing quantitative data for future cybersafety research. The English translation is presented in Appendix B to facilitate its use in international research. It is envisaged that the scale may be employed in future studies, on the condition that its psychometric properties—namely validity and reliability—are re-examined and re-established in the respective target language.
Author Contributions
Conceptualization, A.T.Ü. and L.D.; methodology, A.T.Ü.; software, A.T.Ü.; validation, A.T.Ü., L.D. and B.Ş.; formal analysis, A.T.Ü.; investigation, B.Ş..; resources, B.Ş.; data curation, A.T.Ü..; writing—original draft preparation, A.T.Ü., L.D..; writing—review and editing, A.T.Ü., L.D. and B.Ş.; visualization, A.T.Ü.; supervision, L.D.; project administration, A.T.Ü. and L.D.; funding acquisition, A.T.Ü. All authors have read and agreed to the published version of the manuscript.
Funding
This research received no external funding.
Data Availability Statement
Data is unavailable due to privacy or ethical restrictions. Please contact the email aylin.tutgununal@yeniyuzyil.edu.tr to get the access of data.
Acknowledgments
-
Conflicts of Interest
The authors declare no conflicts of interest.
Abbreviations
The following abbreviations are used in this manuscript:
| CYSAF | Multidisciplinary Digital Publishing Institute |
Appendix A
Cybersafety Scale (CYSAF) Original Form-Turkish (Validated in This Study)
| Madde Nu. | Maddeler | Hiçbir zaman | Nadiren | Bazen | Sık Sık | Her zaman |
| 1 | Web tarayıcımın güvenlik ayarlarını (çerez yönetimi, site izinleri, gizlilik kontrolleri vb.) düzenlerim. | 5 | 4 | 3 | 2 | 1 |
| 2 | Bilgisayarımda/telefonumda virüs yazılımımın güncel olmasına dikkat ederim. | 5 | 4 | 3 | 2 | 1 |
| 3 | Sosyal medya hesaplarımın güvenlik ayarlarını düzenlerim. | 5 | 4 | 3 | 2 | 1 |
| 4 | Bilgisayarımda/telefonumda anti virüs yazılımı kullanırım. | 5 | 4 | 3 | 2 | 1 |
| 5 | Girdiğim web sitelerinin güvenilirliğini https:// protokolüne bakarak kontrol ederim. | 5 | 4 | 3 | 2 | 1 |
| 6 | Resmi kurum/kuruluşlardan gelen mesajların doğru olup olmadığını kontrol ederim. | 5 | 4 | 3 | 2 | 1 |
| 7 | Herhangi bir haberi/bilgiyi paylaşmadan önce kaynağın doğruluğunu teyit ederim. | 5 | 4 | 3 | 2 | 1 |
| 8 | Çevrimiçi ortamlarda geçirdiğim süreden dolayı günlük rutinlerime (kişisel bakım, spor vs.) fırsat bulamam. | 1 | 2 | 3 | 4 | 5 |
| 9 | Çevrimiçi ortamda bulunma sürem uyku düzenimi bozar. | 1 | 2 | 3 | 4 | 5 |
| 10 | Çevrimiçi ortamda bulunma sürem fiziksel sağlığımı (baş, eklem ağrısı vs.) etkiler. | 1 | 2 | 3 | 4 | 5 |
| 11 | Çevrimiçi ortamlarda geçirdiğim süreden dolayı yüz yüze ilişkilere fırsat bulamam. | 1 | 2 | 3 | 4 | 5 |
| 12 | Günlük problemlerden uzaklaşmak için sosyal medyayı daha fazla kullanırım. | 1 | 2 | 3 | 4 | 5 |
| 13 | Çevrimiçi olmadığım zamanlarda dahi sosyal medyada neler olup bittiğini düşünürüm. | 1 | 2 | 3 | 4 | 5 |
| 14 | Kişisel bilgisayarımda/ telefonumda şifrelerimi otomatik hatırla ile saklasam da bilgisayarımı/ telefonumu başkalarının kullanmasına izin veririm. | 1 | 2 | 3 | 4 | 5 |
| 15 | Şifrelerimi tekrar yazmamak için otomatik hatırla özelliğini kullanırım. | 1 | 2 | 3 | 4 | 5 |
| 16 | Kişisel bilgisayarımda/telefonumda web geçmişimi temizlemem ama başkaları da cihazı kullanabilir. | 1 | 2 | 3 | 4 | 5 |
| 17 | Farklı uygulamalarda hatırlamak kolay olacağı için her zaman aynı şifreyi kullanırım. | 1 | 2 | 3 | 4 | 5 |
| 18 | Şifrelerimi hatırlayabilmek için doğum yılı gibi aklımda kolay tutabileceğim dizilimler kullanırım. | 1 | 2 | 3 | 4 | 5 |
| 19 | Şifrelerimi işlerimi halledebilmek için bir başkasına veririm. | 1 | 2 | 3 | 4 | 5 |
| 20 | Ailemin (çocuğum, annem, eşim vb.) fotoğraflarını onların izni olmadan sosyal medyada paylaşırım. | 1 | 2 | 3 | 4 | 5 |
| 21 | Arkadaşlarımın fotoğraflarını onların izni olmadan sosyal medyada paylaşırım. | 1 | 2 | 3 | 4 | 5 |
| 22 | Sosyal medyada fotoğraf paylaştığımda kişileri izin almaya gerek duymadan etiketlerim. | 1 | 2 | 3 | 4 | 5 |
| 23 | Sosyal medyada konumumu paylaşırım. | 1 | 2 | 3 | 4 | 5 |
| 24 | Sosyal medyada kişisel bilgilerimi (T.C. No, Doğum tarihi, GSM No vb.) paylaşırım. | 1 | 2 | 3 | 4 | 5 |
| 25 | Doğrudan tanımadığım kişilerle sosyal medya üzerinden sohbet ederim. | 1 | 2 | 3 | 4 | 5 |
| 26 | Doğrudan tanımadığım kişilere bağlantı isteği gönderirim. | 1 | 2 | 3 | 4 | 5 |
| 27 | Tanımadığım kişilerden gelen bağlantı isteklerini kabul ederim. | 1 | 2 | 3 | 4 | 5 |
| 28 | İnternet ortamındaki içeriklere üzerinde çok fazla düşünmeden beğeni, yorum gibi geribildirimler veririm. | 1 | 2 | 3 | 4 | 5 |
| 29 | Bedenimin ön planda olduğu fotoğraflar paylaşırım. | 1 | 2 | 3 | 4 | 5 |
| 30 | Bedenimin ön planda olduğu profil fotoğrafı kullanırım. | 1 | 2 | 3 | 4 | 5 |
Dimensions and Assessment:
The highest possible score on the scale is 150. Since the highest observed score in the norm study was 134, the “very high” level is defined as being in the range of 70–134. Accordingly; 30-42 points means “No Risk, High Safety”; 43-49 points means “Low Risk, Good Safety”; 50-62 points means “Medium Risk, Moderate Safety”; 63-69 points means “High Risk, Low Safety”; 70-134 points means “Very High Risk, No Safety”.
Technology-Based Threats & Phishing (Items 1-7) scores range from 7-35; 7-12 points means “No Risk”; 13-13 points means “Low Risk”; 14-17 points means “Medium Risk”; 18-19 points means “High Risk”; 20-35 points means “Very High Risk”.
Internet Addiction (Items 8-13) scores range from 6-30; 6-7 points means “No Risk”; 8 points means “Low Risk”; 9-14 points means “Medium Risk”; 15-17 points means “High Risk”; 18-30 points means “Very High Risk”.
Password Practices and Management (Items 14-19) scores range from 6-30; 6-7 points means “No Risk”; 8 points means “Low Risk”; 9-14 points means “Medium Risk”; 15-17 points means “High Risk"; 18-30 points means “Very High Risk".
Network Privacy (Items 20-24) scores range from 5-25; 5 points means “No Risk”; 6 points means “Low Risk”; 7-8 points means “Medium Risk”; 9-10 points means “High Risk”; 11-22 (>=11) points means “Very High Risk”.
Foreign Threat (Items 25-28) scores range from 4-20; 4 points means “No Risk”; 5 points means “Low Risk”; 6-7 points means “Medium Risk”; 8-9 points means “High Risk”; 10-17 (>=10) points means “Very High Risk”.
Body-Orientedness (Items 29-30) scores range from 2-10; 2 points means “No Risk”; 3 points means “Low Risk”; 4-5 points means “Medium Risk”; 6-7 points means “High Risk”; 8-10 points means “Very High Risk”.
Appendix B
Cybersafety Scale (CYSAF) English Version (Only Translated, Not Validated)
| Item No. | Items | Never | Rarely | Sometimes | Often | Always |
| 1 | I manage my web browser’s security settings (cookie management, site permissions, privacy controls, etc.). | 5 | 4 | 3 | 2 | 1 |
| 2 | I make sure my antivirus software on my computer/phone is up to date. | 5 | 4 | 3 | 2 | 1 |
| 3 | I adjust the security settings of my social media accounts. | 5 | 4 | 3 | 2 | 1 |
| 4 | I use antivirus software on my computer/phone. | 5 | 4 | 3 | 2 | 1 |
| 5 | I check the trustworthiness of the websites I visit by looking for the https:// protocol. | 5 | 4 | 3 | 2 | 1 |
| 6 | I verify the accuracy of messages received from official institutions/organizations. | 5 | 4 | 3 | 2 | 1 |
| 7 | I verify the accuracy of the source before sharing any news or information. | 5 | 4 | 3 | 2 | 1 |
| 8 | Because of the time I spend online, I don’t have time for my daily routines (personal care, exercise, etc.). | 1 | 2 | 3 | 4 | 5 |
| 9 | The amount of time I spend online disrupts my sleep schedule. | 1 | 2 | 3 | 4 | 5 |
| 10 | The amount of time I spend online affects my physical health (headaches, joint pain, etc.). | 1 | 2 | 3 | 4 | 5 |
| 11 | I don’t get opportunities for face-to-face relationships because of the amount of time I spend online. | 1 | 2 | 3 | 4 | 5 |
| 12 | I use social media more to escape from daily problems. | 1 | 2 | 3 | 4 | 5 |
| 13 | I31: Even when I’m not online, I think about what’s happening on social media. | 1 | 2 | 3 | 4 | 5 |
| 14 | Even if I use auto-remember passwords on my personal computer/phone, I still allow others to use my computer/phone. | 1 | 2 | 3 | 4 | 5 |
| 15 | I use the auto-remember feature to avoid typing my passwords again. | 1 | 2 | 3 | 4 | 5 |
| 16 | I don’t clear my web history on my personal computer/phone, and others might use the device. | 1 | 2 | 3 | 4 | 5 |
| 17 | I always use the same password because it’s easier to remember across different applications. | 1 | 2 | 3 | 4 | 5 |
| 18 | To remember my passwords, I use sequences that are easy to memorize, like my year of birth. | 1 | 2 | 3 | 4 | 5 |
| 19 | I give my passwords to someone else so they can handle my affairs. | 1 | 2 | 3 | 4 | 5 |
| 20 | I share photos of my family (my child, mother, wife, etc.) on social media without their permission. | 1 | 2 | 3 | 4 | 5 |
| 21 | I share my friends’ photos on social media without their permission. | 1 | 2 | 3 | 4 | 5 |
| 22 | When I share photos on social media, I tag people without needing their permission. | 1 | 2 | 3 | 4 | 5 |
| 23 | I share my location on social media. | 1 | 2 | 3 | 4 | 5 |
| 24 | I share my personal information (ID number, date of birth, mobile phone number, etc.) on social media. | 1 | 2 | 3 | 4 | 5 |
| 25 | I chat with people I don’t know personally on social media. | 1 | 2 | 3 | 4 | 5 |
| 26 | I send connection/friend requests to people I don’t know directly. | 1 | 2 | 3 | 4 | 5 |
| 27 | I accept connection/friend requests from people I don’t know. | 1 | 2 | 3 | 4 | 5 |
| 28 | I often give feedback (likes or comments) on online content without thinking too much about it. | 1 | 2 | 3 | 4 | 5 |
| 29 | I share photos where my body is prominently displayed. | 1 | 2 | 3 | 4 | 5 |
| 30 | I use a profile picture where my body is prominently displayed. | 1 | 2 | 3 | 4 | 5 |
References
- Quayyum, F.; Cruzes, D.S.; Jaccheri, L. Cybersecurity awareness for children: A systematic literature review. Int. J. Child-Comput. Interact. 2021, 30, 100343. [Google Scholar] [CrossRef]
- Bayuk, J.L.; et al. Cyber security policy guidebook; John Wiley & Sons, 2012. [Google Scholar]
- Craigen, D.; Diakun-Thibault, N.; Purse, R. Defining cybersecurity. Technol. Innov. Manag. Rev. 2014, 4(10), 13–21. [Google Scholar] [CrossRef]
- Karacı, A.; Akyüz, H.İ.; Bilgici, G. Investigation of cyber security behaviors of university students. Kastamonu Educ. J. 2017, 25(6), 2079–2094. [Google Scholar]
- Von Solms, R.; Van Niekerk, J. From information security to cyber security. Comput. Secur. 2013, 38, 97–102. [Google Scholar] [CrossRef]
- Lewin, C.; et al. Safe and responsible internet use in a connected world: Promoting cyber-wellness. Can. J. Learn. Technol. 2021, 47(4), 1–17. [Google Scholar] [CrossRef]
- McCormac, A.; et al. Individual differences and Information Security Awareness. Comput. Hum. Behav. 2017, 69, 151–156. [Google Scholar] [CrossRef]
- McGregor, R.; et al. Consumer perceptions of personal cyber awareness, knowledge, and risk. J. Cybersecur. 2025, 11(1). [Google Scholar] [CrossRef]
- Riek, M.; Böhme, R.; Moore, T. Measuring the Influence of Perceived Cybercrime Risk on Online Service Avoidance. Ieee Trans. Dependable Secur. Comput. 2016, 13(2), 261–273. [Google Scholar]
- Vanden Abeele, M.M.P. Digital wellbeing as a dynamic construct. Commun. Theory 2021, 31(4), 932–955. [Google Scholar]
- Blaskovic, A.K.; et al. Cybercrime and intellectual property theft: An analysis of modern digital forensics. In in Future Technologies Conference; Springer International Publishing: Cham, 2022. [Google Scholar]
- Hawdon, J. Cybercrime: Victimization, perpetration, and techniques. Am. J. Crim. Justice 2021, 46(6), 837–842. [Google Scholar] [CrossRef] [PubMed]
- Karaca, M.; Mutlu, T.; Gencer, G. Cyber victimization: A conceptual study. Anadolu Akad. Soc. Sci. J. 2021, 3(1), 177–191. [Google Scholar]
- Holt, T.; Bossler, A.; Seigfried-Spellar, K. Cybercrime and digital forensics: An introduction; Routledge, 2022. [Google Scholar]
- Khadka, K.; Ullah, A. Human factors in cybersecurity: an interdisciplinary review and framework proposal. Int. J. Inf. Secur. 2025, 24(3). [Google Scholar] [CrossRef]
- Rodríguez-Priego, N.; et al. Framing Effects on Online Security Behavior . In Frontiers in Psychology; 2020. [Google Scholar]
- Cassidy, W.; Faucher, C.; Jackson, M. Cyberbullying among youth: A comprehensive review of current international research and its implications and application to policy and practice. Sch. Psychol. Int. 2013, 34(6), 575–612. [Google Scholar] [CrossRef]
- Jones, L.M.; Mitchell, K.J. Defining and measuring youth digital citizenship. New Media Soc. 2016, 18(9), 2063–2079. [Google Scholar] [CrossRef]
- Kopecky, K.; et al. Digital safety and its importance in teacher education. Analysis of children's online behaviour in the Czech and Polish context. Rev. Interuniv. De Form. Del. Profr.-Rifop 2022, 97, 79–92. [Google Scholar]
- Livingstone, S.; Stoilova, M. The 4Cs: Classifying Online Risk to Children. (CO:RE Short Report Series on Key Topics), in CO:RE- Children Online: Research and Evidence; Leibniz-Institut für Medienforschung Hamburg, 2021. [Google Scholar]
- Korzeniowski, L. Securitology – The Concept of Safety. Komunikácie Commun. 2005, 3, 20–23. [Google Scholar]
- Blokland, P.J.; Reniers, G.L. The concepts of risk, safety, and security: A fundamental exploration and understanding of similarities and differences. In The Coupling of Safety and Security: Exploring Interrelations in Theory and Practice; Springer International Publishing: Cham, 2020. [Google Scholar]
- Hanewald, R. Confronting the Pedagogical Challenge of Cyber Safety. Aust. J. Teach. Educ. 2008, 33(3), 1–16. [Google Scholar] [CrossRef]
- Wiener, N. Cybernetics in animals and machines, or control and communication; MIT Press: Ankara, Turkey, 2019. [Google Scholar]
- Von Solms, R.; Von Solms, S. Cyber safety education in developing countries. Syst. Cybern. Inform. 2015, 13(2), 14–19. [Google Scholar]
- Oroni, C.Z.; et al. Enhancing cyber safety in e-learning environment through cybersecurity awareness and information security compliance: PLS-SEM and FsQCA analysis. Comput. Secur. 2025, 150. [Google Scholar]
- Desolda, G.; et al. MORPHEUS: A Multidimensional Framework for Modeling, Measuring, and Mitigating Human Factors in Cybersecurity. arXiv arXiv:2512.18303.
- Umeugo, W. Cybercrime awareness on social media: A comparison study. Int. J. Netw. Secur. Its Appl. 2023, 15(2), 23–35. [Google Scholar] [CrossRef]
- Erol, O.; et al. Personal cyber security provision scale development study. Int. J. Hum. Sci. 2015, 12(2), 75–91. [Google Scholar] [CrossRef]
- Arpaci, I.; Sevinc, K. Development of the cybersecurity scale (CS-S): Evidence of validity and reliability. Inf. Dev. 2022, 38(2), 218–226. [Google Scholar]
- Arpaci, I.; Aslan, O. Development of a scale to measure cybercrime-awareness on social media. J. Comput. Inf. Syst. 2023, 63(3), 695–705. [Google Scholar]
- Mıhçı, P.; Çakmak, E.K. A study on student cyberwellness scales development. J. Gazi Fac. Educ. 2017, 37(2), 457–491. [Google Scholar]
- Turner, K.H.; et al. The importance of digital media literacy, in Handbook of Children and Screens; Springer, Christakis, D.A., Hale, L., Eds.; Springer: Cham, 2025. [Google Scholar]
- UNESCO. Global media and information literacy assessment framework: Country readiness and competencies. 2013. Available online: https://unesdoc.unesco.org/ark:/48223/pf0000224655.
- Altun, O.; Yukselturk, E. Investigation of digital literacy and cyber security awareness of high school students. Kırıkkale Univ. J. Soc. Sci. 2024, 14(2), 321–346. [Google Scholar]
- Bayrakcı, S.; Narmanlıoğlu, H. Digital Literacy as Whole of Digital Competences: Scale Development Study. Soc. Sci. J. Thought Soc. 2021, 4, 1–30. [Google Scholar]
- Pala, Ş.M.; Başıbüyük, A. A study of developing digital literacy scale for 10-12 age group students. Mediterr. Educ. Res. J. 2020, 14(33), 542–565. [Google Scholar]
- Kavas, Z.V.; Özbudak, S.; Çetkin, E. Examining teachers’ cyber security. Soc. Sci. Stud. J. 2024, 8(106), 4505–4510. [Google Scholar]
- Yiğit, M.F.; Seferoğlu, S.S. Investigating students’ cyber security behaviors in relation to big five personality traits and other various variables. Mersin Univ. J. Fac. Educ. 2019, 15(1), 186–215. [Google Scholar]
- Güldüren, C. The information security awareness scale (ISAS) for university students: A validity and reliability study. J. Acad. Soc. Sci. Stud. 2024, 14(85), 309–326. [Google Scholar]
- Güldüren, C.; Çetinkaya, L.; Keser, H. Development of Information Security Awareness Scale (ISAS) for Secondary Education Students. Elem. Educ. Online 2016, 15(2), 682–695. [Google Scholar]
- Erdoğmuş, A. An Analysis of the Impact of Information Security Outcomes on Differences Among University Students: The Case of Afyon Kocatepe University.; 2017. [Google Scholar]
- Avcı, Ü.; Oruç, O. Investigation of the Students’ Personal Cyber Security Behaviour and Information Security Awareness. J. Fac. Educ. 2020, 21(1), 284–303. [Google Scholar]
- Alzubaidi, A. Measuring the level of cyber-security awareness for cybercrime in Saudi Arabia. Heliyon 2021, 7(1). [Google Scholar] [CrossRef] [PubMed]
- Toso, C.H.S.; et al. Cybercrime awareness among senior high school students. Mediterr. J. Basic Appl. Sci. (MJBAS) 2023, 7(2), 160–176. [Google Scholar] [CrossRef]
- Tutar, H.; Erdem, A.T.; Şahin, N. Digital Competence Scale (DCS): A Scale Development Study. J. Sch. Soc. Sci. At. Selçuk Univ. 2024, 27(1), 31–47. [Google Scholar]
- Tavşancıl, E.; Aslan, E. Content analysis and application examples for special, written and other materials; Epsilon, 2021. [Google Scholar]
- Büyüköztürk, Ş. A handbook on data analysis for the social sciences; Pegem Publishing, 2018. [Google Scholar]
- Tinsley, H.; Tinsley, D. Uses of factor analysis in counseling psychology research. J. Couns. Psychol. 1987, 34(4), 414–424. [Google Scholar] [CrossRef]
- Tabachnick, B.G.; Fidell, L.S. Using multivariate statistics 5ed; Allyn & Bacon, 2007. [Google Scholar]
- Karagiannopoulos, V.; et al. Cybercrime awareness and victimisation in individuals over 60 years: A Portsmouth case study. Comput. Law. Secur. Rev. 2021, 43. [Google Scholar]
- He, Y.; et al. Once Bitten, Twice Shy? Understanding Repeat and Multiple Victimization in Business Cybercrime. Crime. Delinq. 2026, 00111287261440151. [Google Scholar]
- Herath, T.B.G.; Khanna, P.; Ahmed, M. Cybersecurity Practices for Social Media Users: A Systematic Literature Review. J. Cybersecur. Priv. 2022, 2(1), 1–18. [Google Scholar] [CrossRef]
- Tutgun-Ünal, A. Social media addiction of communication faculty students: Üsküdar University. Kastamonu J. Commun. Stud. 2019, 2, 49–80. [Google Scholar]
- Tutgun-Ünal, A. Social media addiction of new media and journalism students. TOJET Turk. Online J. Educ. Technol. 2020, 19(2), 1–12. [Google Scholar]
- Deniz, L.; Tutgun Ünal, A. Development of a set of scales toward the use ofsocial media and values of generations in socialmedia age. Int. J. Soc. Res. 2019, 11(18), 1025–1057. [Google Scholar]
- Ekşili, N.; Antalyalı, Ö.L. A study to determine the characteristic of generation Y in Turkey: A survey on school administrators Humanities Sciences (NWSAHS) 2017, 12(3), 90–111. [CrossRef]
Figure 1.
CYSAF Scree Plot.
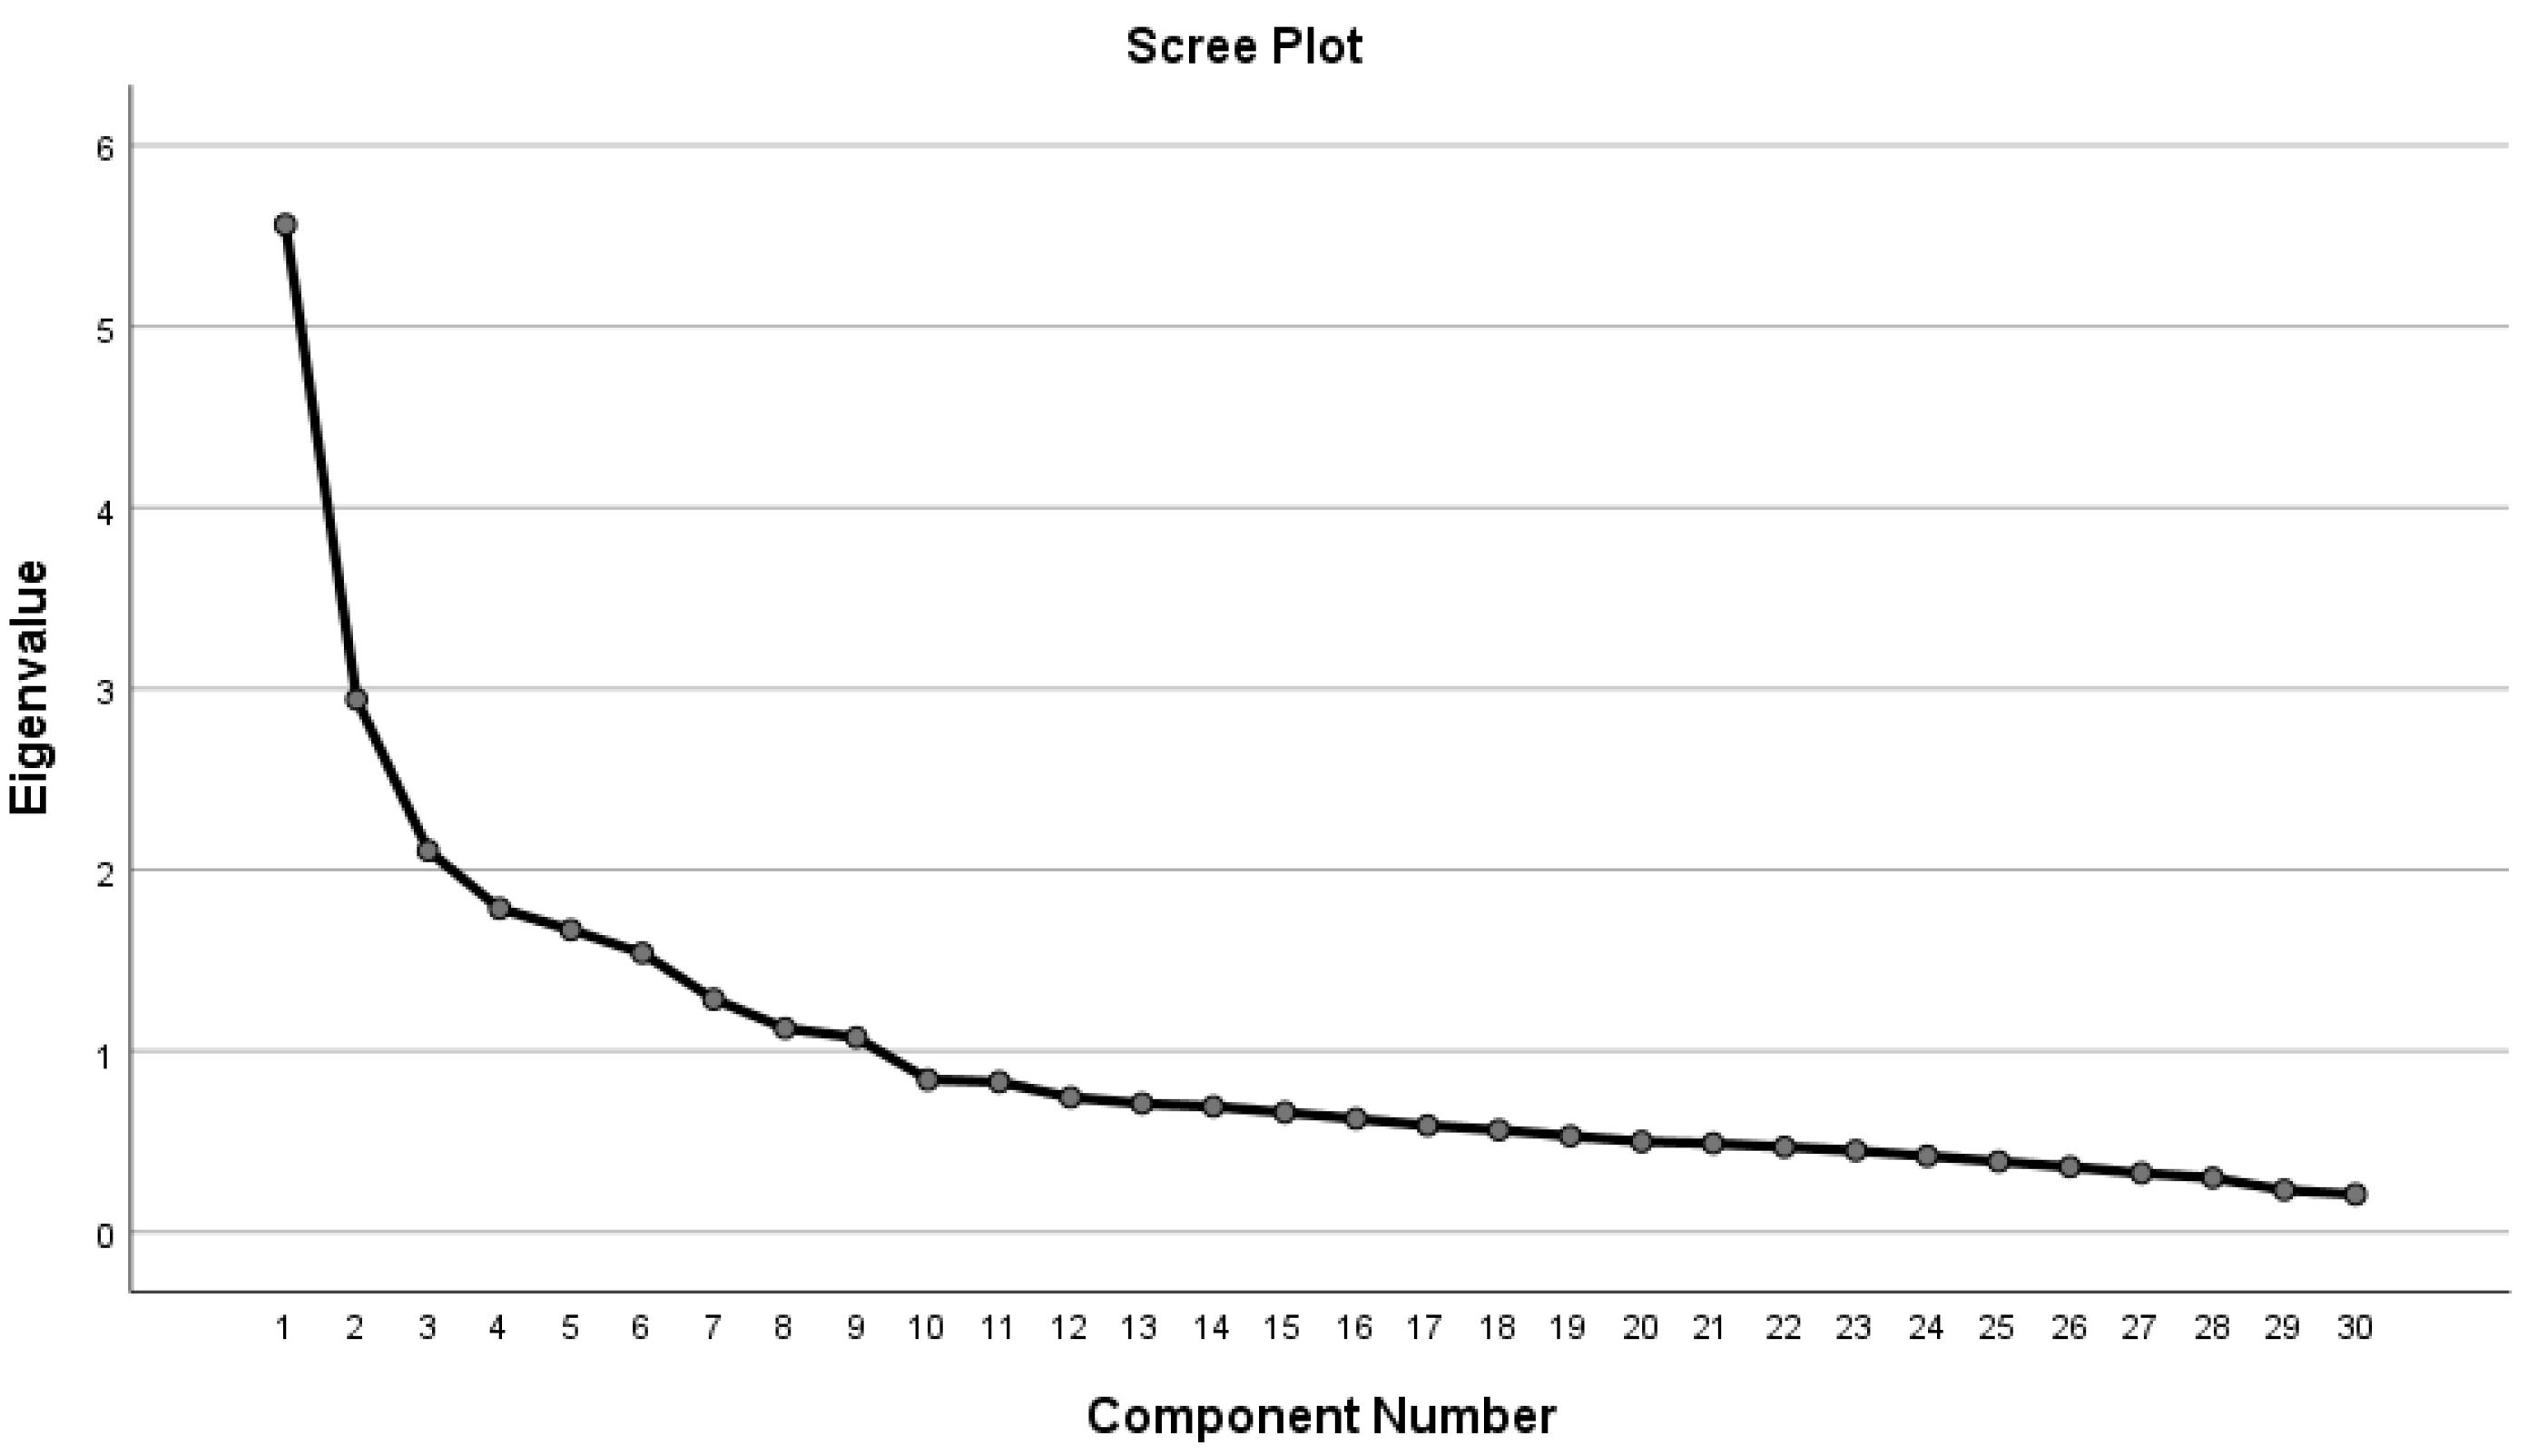
Figure 2.
Standardized Model of CYSAF.
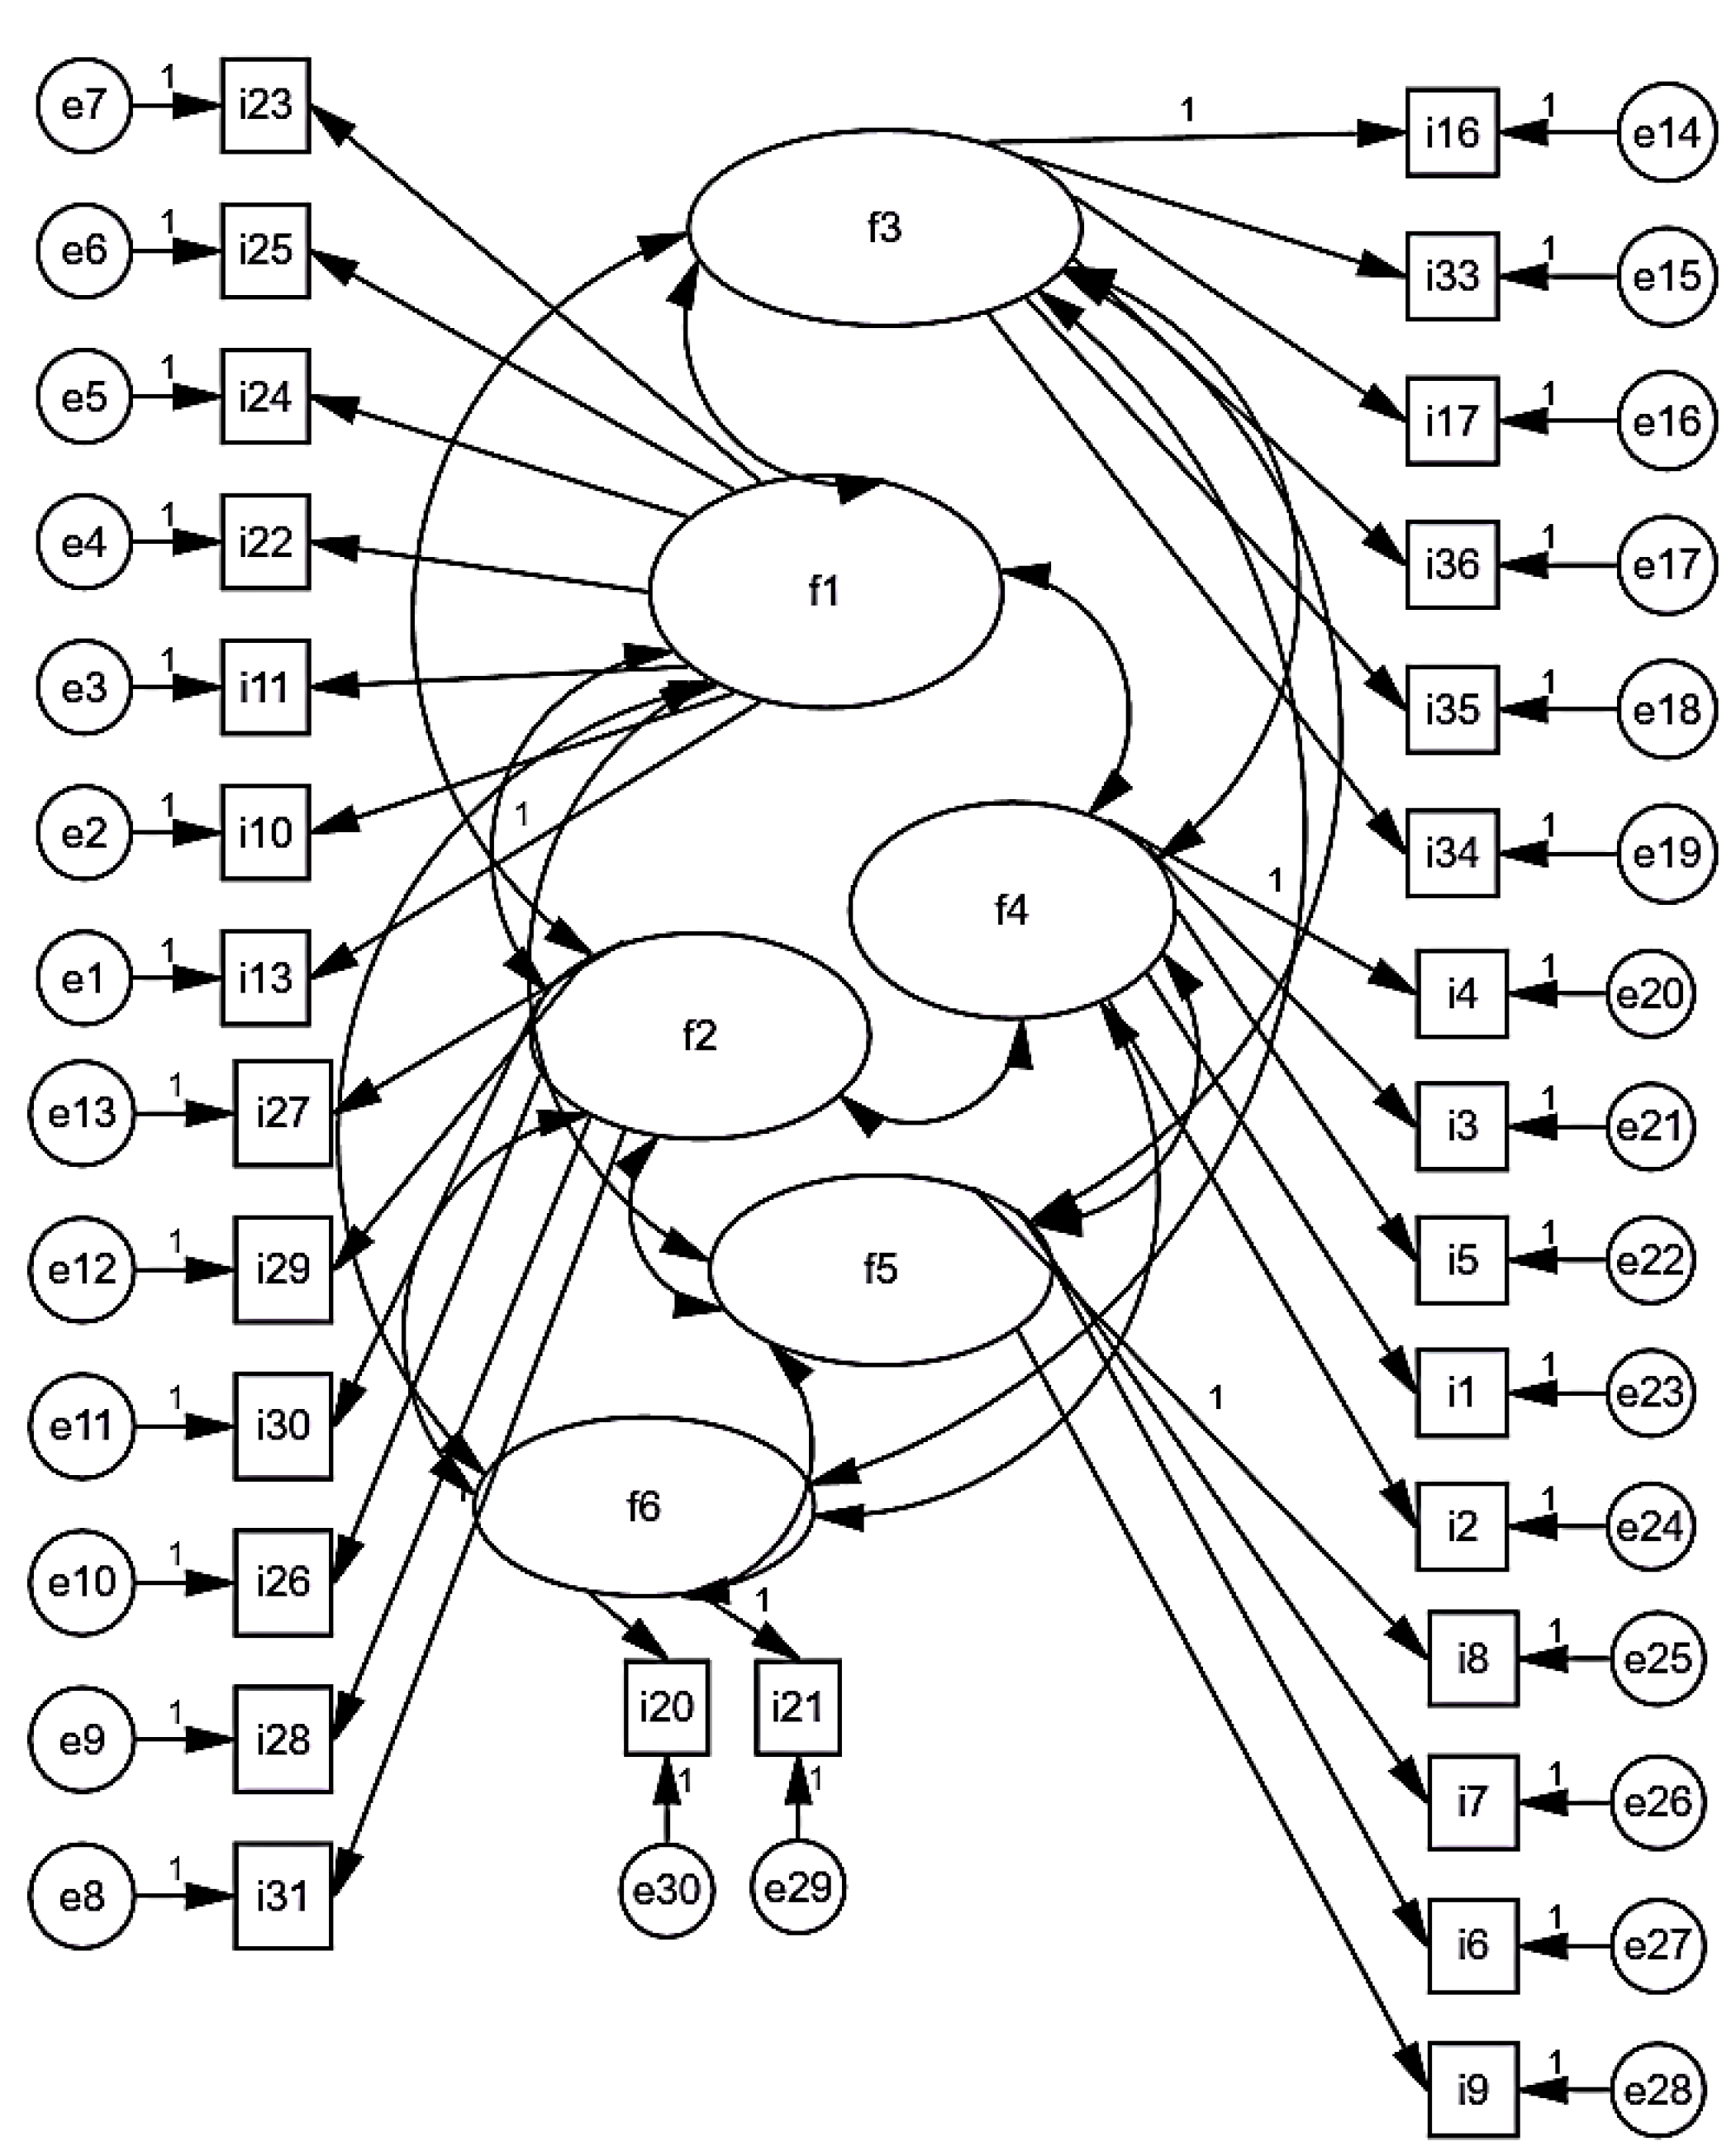
Table 1.
Factor Structure and Explained Variance of CYSAF.
| CYSAF | Eigenvalue | Variance | Cumulative Variance |
| Factor 1 | 5,73 | 19,11 | 19,11 |
| Factor 2 | 2,89 | 9,64 | 28,75 |
| Factor 3 | 2,22 | 7,40 | 36,15 |
| Factor 4 | 1,76 | 5,86 | 42,02 |
| Factor 5 | 1,55 | 5,18 | 47,20 |
| Factor 6 | 1,45 | 4,83 | 52,04 |
Table 2.
CYSAF Item Factor Estimates, Item Total Correlations and Cronbach-α Values.
| Factor | New Item No. | Items | Factor Estimates | Cronbach-α |
| F1 | 1 | I23: I manage my web browser’s security settings (cookie management, site permissions, privacy controls, etc.). | ,77 | ,80 |
| 2 | I25: I make sure my antivirus software on my computer/phone is up to date. | ,74 | ||
| 3 | I24: I adjust the security settings of my social media accounts. | ,74 | ||
| 4 | I22: I use antivirus software on my computer/phone. | ,64 | ||
| 5 | I11: I check the trustworthiness of the websites I visit by looking for the https:// protocol. | ,61 | ||
| 6 | I10: I verify the accuracy of messages received from official institutions/organizations. | ,60 | ||
| 7 | I13: I verify the accuracy of the source before sharing any news or information. | ,56 | ||
| F2 | 8 | I27: Because of the time I spend online, I don’t have time for my daily routines (personal care, exercise, etc.). | ,78 | ,82 |
| 9 | I29: The amount of time I spend online disrupts my sleep schedule. | ,74 | ||
| 10 | I30: The amount of time I spend online affects my physical health (headaches, joint pain, etc.). | ,73 | ||
| 11 | I26: I don’t get opportunities for face-to-face relationships because of the amount of time I spend online. | ,69 | ||
| 12 | I28: I use social media more to escape from daily problems. | ,65 | ||
| 13 | I31: Even when I’m not online, I think about what’s happening on social media. | ,64 | ||
| F3 | 14 | I16: Even if I use auto-remember passwords on my personal computer/phone, I still allow others to use my computer/phone. | ,69 | ,68 |
| 15 | I33: I use the auto-remember feature to avoid typing my passwords again. | ,63 | ||
| 16 | I17: I don’t clear my web history on my personal computer/phone, and others might use the device. | ,62 | ||
| 17 | I36: I always use the same password because it’s easier to remember across different applications. | ,56 | ||
| 18 | I35: To remember my passwords, I use sequences that are easy to memorize, like my year of birth. | ,54 | ||
| 19 | I34: I give my passwords to someone else so they can handle my affairs. | ,50 | ||
| F4 | 20 | I4: I share photos of my family (my child, mother, wife, etc.) on social media without their permission. | ,80 | ,67 |
| 21 | I3: I share my friends’ photos on social media without their permission. | ,76 | ||
| 22 | I5: When I share photos on social media, I tag people without needing their permission. | ,70 | ||
| 23 | I1: I share my location on social media. | ,51 | ||
| 24 | I2: I share my personal information (ID number, date of birth, mobile phone number, etc.) on social media. | ,40 | ||
| F5 | 25 | I8: I chat with people I don’t know personally on social media. | ,77 | ,73 |
| 26 | I7: I send connection/friend requests to people I don’t know directly. | ,75 | ||
| 27 | I6: I accept connection/friend requests from people I don’t know. | ,75 | ||
| 28 | I9: I often give feedback (likes or comments) on online content without thinking too much about it. | ,46 | ||
| F6 | 29 | I21: I share photos where my body is prominently displayed. | ,89 | ,87 |
| 30 | I20: I use a profile picture where my body is prominently displayed. | ,88 | ||
| Total | ,83 |
* As a result of the Exploratory Factor Analysis (EFA), the CYSAF scale structure, consisting of 30 items and 6 factors, was rated on a 5-point Likert scale as “Never”, “Rarely”, “Sometimes”, “Often” and “Always”. Each item can receive a minimum score of “1” and a maximum score of “5”. The first 7 items (all F1 items) must be scored in reverse.
Table 3.
Relationship Between CYSAF and Factors.
| Sub Scale/Scale | Technology Based Threats & Phishing | Internet Addiction | Password Practices and Management | Privacy in Networks | Foreign Threat | Body-Orientedness |
| Technology Based Threats & Phishing | 1 | |||||
| Internet Addiction | ,38 | 1 | ||||
| Password Practices and Management | ,37 | ,41 | 1 | |||
| Privacy in Networks | ,30 | ,34 | ,37 | 1 | ||
| Foreign Threat | ,36 | ,40 | ,38 | ,37 | 1 | |
| Body-Orientedness | ,30 | ,30 | ,32 | ,30 | ,31 | 1 |
| Cybersafety Scale (CYSAF) | ,67 | ,65 | ,68 | ,59 | ,63 | ,46 |
Table 4.
Discriminant Validity of CYSAF.
| Scale & Dimensions | Group | N | X | SS | Sd | t | p |
| Technology Based Threats & Phishing | Upper Group | 202 | 25,03 | 3,23 | 402 | 57,27 | ,000 |
| Lower Group | 202 | 9,70 | 2,00 | ||||
| Internet Addiction | Upper Group | 202 | 17,54 | 3,08 | 402 | 46,92 | ,000 |
| Lower Group | 202 | 7,00 | 0,81 | ||||
| Password Practices and Management | Upper Group | 202 | 18,15 | 2,20 | 402 | 57,17 | ,000 |
| Lower Group | 202 | 7,94 | 1,25 | ||||
| Privacy in Networks | Upper Group | 202 | 10,88 | 2,32 | 402 | 36,05 | ,000 |
| Lower Group | 202 | 5.00 | 0,00 | ||||
| Foreign Threat | Upper Group | 202 | 9,14 | 2,31 | 402 | 31,57 | ,000 |
| Lower Group | 202 | 4,00 | 0,00 | ||||
| Body-Orientedness | Upper Group | 202 | 5,58 | 1,60 | 402 | 31,68 | ,000 |
| Lower Group | 202 | 2,00 | 0,00 | ||||
| Cybersafety Scale (CYSAF) | Upper Group | 202 | 74,73 | 8,08 | 402 | 47,78 | ,000 |
| Lower Group | 202 | 42,64 | 5,06 |
Table 5.
Pearson Correlation Coefficients of CYSAF and DLS.
| Scales/Dimensions | N | X | r | p |
| CYSAF & DLS | 48 | 74,12 | ,70 | ,000 |
| 48 | 109,31 |
Table 8.
Differentiation of CYSAF Dimensions by Gender.
| Scale / Sub Scale | Group | N | X | SS | Sd | t | p | d |
| CYSAF-Password Practices and Management | Women | 554 | 13,95 | 4,20 | 1098 | 3,77 | ,000 | 0.22 |
| Men | 546 | 13,00 | 4,10 | |||||
| CYSAF-Foreign Threat | Women | 554 | 5,69 | 2,14 | 1098 | 7,85 | ,000 | 0.47 |
| Men | 546 | 6,87 | 2,83 | |||||
| CYSAF-Body-Orientedness | Women | 554 | 3,01 | 1,70 | 1098 | 5,10 | ,000 | 0.30 |
| Men | 546 | 3,58 | 1,99 |
Table 9.
Differentiation of CYSAF Dimensions by Generations.
| Scale / Sub Scale | Group | N | X | SS | Sd | F | P | Difference | |
| Technology Based Threats & Phishing | BB | 75 | 17,45 | 6,54 | 1096 | 12,23 | ,000 | Z>BB,X,Y | |
| X | 273 | 16,92 | 6,10 | ||||||
| Y | 330 | 18,31 | 6,11 | ||||||
| Z | 422 | 19,68 | 5,94 | ||||||
| Internet Addiction | BB | 75 | 10,40 | 3,53 | 1096 | 38,47 | ,000 | Z>BB,X,Y Y>X |
|
| X | 273 | 10,82 | 3,73 | ||||||
| Y | 330 | 12,19 | 4,27 | ||||||
| Z | 422 | 14,08 | 4,89 | ||||||
| Password Practices and Management | BB | 75 | 11,64 | 3,59 | 1096 | 23,70 | ,000 | Z>BB,X Y>BB,X |
|
| X | 273 | 12,10 | 3,80 | ||||||
| Y | 330 | 13,90 | 3,83 | ||||||
| Z | 422 | 14,37 | 4,43 | ||||||
| Foreign Threat | BB | 75 | 5,49 | 1,96 | 1096 | 27,71 | ,000 | Z>BB,X,Y Y>X |
|
| X | 273 | 5,45 | 1,74 | ||||||
| Y | 330 | 6,12 | 2,65 | ||||||
| Z | 422 | 7,08 | 2,82 | ||||||
| Body-Orientedness | BB | 75 | 3,22 | 1,68 | 1096 | 11,67 | ,000 | Z>X,Y Y>X |
|
| X | 273 | 2,77 | 1,38 | ||||||
| Y | 330 | 3,32 | 1,79 | ||||||
| Z | 422 | 3,62 | 2,15 | ||||||
| Cybersafety Scale (CYSAF) | BB | 75 | 56,18 | 11,62 | 1096 | 49,41 | ,000 | Z>BB,X,Y Y>BB,X |
|
| X | 273 | 55,58 | 11,45 | ||||||
| Y | 330 | 61,74 | 12,71 | ||||||
| Z | 422 | 66,50 | 12,46 | ||||||
*BB: Baby Boomer.
Table 10.
Differentiation of CYSAF Dimensions by Social Media Use and Negative Experiences.
| Variable | Group | N | X | SS | Sd | F | P | Fark |
| 1) Daily Social Media Usage Time | A: Less than an hour | 109 | 49,97 | 11,13 | 1097 | 123,96 | ,000 | C>B>A |
| B: 1-3 hours | 649 | 59,86 | 11,41 | |||||
| C: 4 hours and above | 342 | 68,79 | 12,63 | |||||
| 2) Frequency of Starting Live Chats on Social Media | A: Never | 195 | 55,38 | 11,69 | 1096 | 24,33 | ,000 | D>C>B>A |
| B: Rarely | 364 | 61,20 | 13,02 | |||||
| C: Sometimes | 280 | 63,47 | 13,35 | |||||
| D: Often | 261 | 65,04 | 11,93 | |||||
| 3) The Most Preferred Social Media Platform | A: Facebook | 44 | 57,81 | 10,80 | 1049 | 8,46 | ,000 | E> D>C>B>A |
| B: YouTube | 206 | 59,16 | 12,59 | |||||
| C: Instagram | 641 | 62,24 | 12,54 | |||||
| D: X | 121 | 63,32 | 14,05 | |||||
| E: Tik Tok | 42 | 70,26 | 14,93 | |||||
| 4) Liking Habits on Social Media | A: It depends on the person (I like whoever likes me) | 52 | 68,07 | 10,17 | 1096 | 8,08 | ,000 | A>B>C |
| B: Based on the content (After reading/seeing) | 888 | 61,64 | 12,95 | |||||
| C: I only browse the feed; I don’t like anything. | 137 | 58,52 | 12,93 | |||||
| 5) Creating Multiple Profiles | A: I don’t have multiple profiles. | 226 | 59,21 | 12,52 | 1097 | 36,75 | ,000 | C>B>A |
| B: I create an account with my own identity. | 214 | 63,32 | 12,14 | |||||
| C: I create an account with a nickname. | 660 | 67,43 | 13,40 | |||||
| 6) Frequency of Security Concerns in The Digital Environment | A: Never | 124 | 59,93 | 12,10 | 1096 | 7,54 | ,000 | B>C>D |
| B: Rarely | 318 | 63,17 | 12,74 | |||||
| C: Sometimes | 478 | 62,46 | 12,93 | |||||
| D: Often | 180 | 58,03 | 13,68 | |||||
| 7) Competency in Knowledge of Digital Security | A: Not enough at all | 133 | 62,13 | 12,46 | 1096 | 12,96 | ,000 | A>D B>C>D |
| B: Slightly enough | 514 | 63,11 | 11,90 | |||||
| C: Quite enough | 397 | 60,95 | 13,78 | |||||
| D: Completely enough | 56 | 52,14 | 14,50 | |||||
| 8) Account Theft in The Digital Environment | A: Never | 892 | 60,83 | 12,69 | 1097 | 14,50 | ,000 | B>A |
| B: Once | 189 | 64,35 | 12,94 | |||||
| C: More than once | 19 | 73,84 | 19,13 | |||||
| 9) Digital Wallet Theft | A: Never | 1000 | 61,08 | 12,49 | 1097 | 21,28 | ,000 | B>A |
| B: Once | 87 | 65,20 | 15,16 | |||||
| C: More than once* | 13 | 82,30 | 18,11 | |||||
| 10) Receiving scam Calls/Messages | A: Never | 685 | 60,72 | 13,07 | 1097 | 4,81 | ,008 | B>A A>C |
| B: Once | 165 | 63,60 | 13,55 | |||||
| C: More than once | 250 | 62,93 | 12,34 |
Disclaimer/Publisher’s Note: The statements, opinions and data contained in all publications are solely those of the individual author(s) and contributor(s) and not of MDPI and/or the editor(s). MDPI and/or the editor(s) disclaim responsibility for any injury to people or property resulting from any ideas, methods, instructions or products referred to in the content. |
© 2026 by the authors. Licensee MDPI, Basel, Switzerland. This article is an open access article distributed under the terms and conditions of the Creative Commons Attribution (CC BY) license (http://creativecommons.org/licenses/by/4.0/).
Copyright: This open access article is published under a Creative Commons CC BY 4.0 license, which permit the free download, distribution, and reuse, provided that the author and preprint are cited in any reuse.