Submitted:
11 June 2026
Posted:
12 June 2026
You are already at the latest version
Abstract
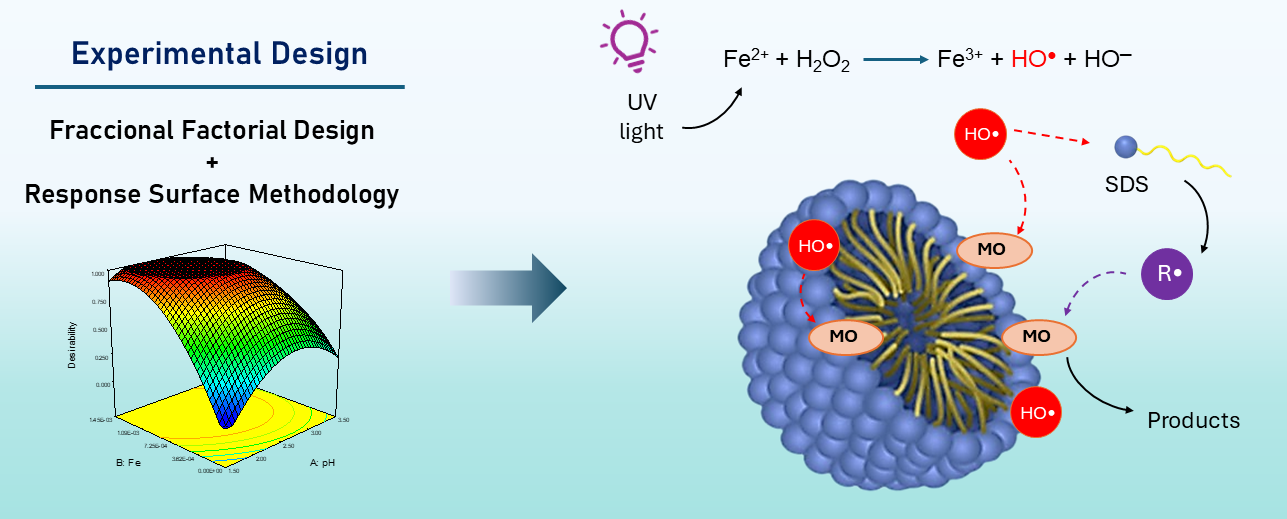
This work investigates the photo-Fenton degradation of azo dyes in an aqueous medium rich in sodium dodecyl sulfate (SDS), using methyl orange (MO) as a model contaminant. Chemometric modeling was integrated with mechanistic analysis to elucidate the role of the micellar pseudophase in radical distribution, dye partitioning, and overall reaction efficiency. A sequential experimental design strategy was applied, combining fractional factorial design and response surface methodology (RSM) to evaluate the individual and interactive effects of key operational variables and determine the optimal operating conditions for maximum degradation efficiency. Under optimized conditions (pH 2.85, [H₂O₂] = 100 mM, [Fe²⁺] = 0.5 mM, [SDS] = 13 mM, [MO] = 0.01 mM), MO degradation reached 98.4% in 5 minutes. Spectroscopic and partitioning studies revealed a strong affinity of MO for the micellar interface, indicating preferential localization in a microheterogeneous environment. Radical scavenging experiments confirmed that hydroxyl radicals are the dominant oxidizing species in water, while the reduction observed in the presence of SDS suggested secondary radical pathways derived from the surfactant under micellar conditions. Kinetic analyses highlighted the role of intermolecular interactions and micellar compartmentalization in radical generation. The optimized system was successfully extended to other azo dyes, underscoring the potential of surfactant-rich organized media to enhance photo-Fenton reactions in complex aqueous environments.
Keywords:
photo-Fenton
; azo dyes
; surfactant
; experimental design
; optimization
1. Introduction
Advanced oxidation processes (AOPs) have undergone significant development in recent years among the most promising technologies for treating water contaminated by persistent organic molecules, such as synthetic dyes [1,2]. These substances are toxic to the environment, as they increase oxygen demand, alter light penetration by inhibiting photosynthesis, and have toxic, mutagenic, and carcinogenic effects for living beings [3,4,5]. Among these, the Fenton and photo-Fenton processes have become very relevant due to their ability to generate highly reactive free radicals, such as the hydroxyl radical (HO•), a species with a high oxidizing capacity (E0 = 2.8 V), highly efficient in completely degrading most organic substrates [6,7,8,9]. In general, the Fenton reaction consists in the decomposition of hydrogen peroxide (H₂O₂) catalyzed by iron salts (Fe²⁺), giving rise to the formation of reactive species (Eq. 1). The regeneration of ferrous ions (Fe²⁺) from its ferric form (Fe³⁺) (Eq. 2) is limited by the very slow reaction rate required by a high concentration of Fe²⁺, which not only increases operating costs, but can also compromise the efficiency of the process under certain conditions [10]. Consequently, a variant incorporating UV radiation is frequently employed, designated as the photo-Fenton process. The photolysis of aqueous Fe³⁺ complexes facilitate their reduction to Fe²⁺ and generates additional HO• radicals, increasing the degradation rate and the efficiency toward organic substrates (Eq. 3). In addition, the photo-Fenton reaction has a higher quantum yield of 0.017 at 360 nm and 0.14 at 313 nm [11], enhancing its effectiveness compared to the conventional reaction. Due to the low solubility of ferric species under neutral conditions, these processes must operate in an acidic medium, typically close to pH 3, which also favors a high proportion of active Fe³⁺ complexes in the solution [12].
Despite its efficacy, the widespread application of the photo-Fenton system is constrained by two main factors: the mandatory acidic operating pH (≈3) required to maintain iron solubility and the inherent kinetic limitations of the iron cycle. Furthermore, the efficiency of these systems can be significantly altered when treating complex wastewater matrices containing industrial additives, such as those from the textile industry [13].
Surfactants are common constituents of textile effluents, where they coexist with dyes at high concentrations [14,15]. Above the critical micelle concentration (cmc), surfactants form organized micellar structures that act as nanoreactors, modifying the distribution and reactivity of chemical species [16,17,18,19,20,21]. To systematically address these matrix effects, sodium dodecyl sulfate (SDS) is widely utilized as a model anionic surfactant [14,22]. Previous studies have shown that surfactants improve the solubilization of contaminants, can alter the accessibility of radicals due to the distribution of species in different environments and significantly modify the degradation efficiency [23,24,25]. The underlying mechanisms governing these effects in AOPs remain insufficiently understood, particularly regarding radical accessibility in different microenvironments and reaction localization, as well as the integrity of the micellar system itself [19,25,26,27].
However, the effect of these systems is not linear, since high concentrations can generate a decrease in efficiency, attributed to phenomena of competition with the pollutant or partial sequestration of reactive species inside the micelles [16,28]. Therefore, optimizing the surfactant-assisted photo-Fenton process remains a challenge due to the interaction of multiple variables, such as the concentrations of H₂O₂, Fe2+, surfactant, the operating pH, temperature, and the intensity of radiation used [29,30,31], among others.
Commonly, in the degradation processes of organic molecules by photo-Fenton, the variables are usually studied in univariate way [31,32,33]. These traditional optimization methodologies, denominated as the "one variable at a time" (OVAT) approach, do not consider the interactions between all variables of the systems. In contrast, statistical experimental design methodologies, such as the response surface methodology (RSM) [34,35], offer a more efficient approach by optimizing conditions and elucidating variable interactions with fewer trials [9,36,37,38]. Among the experimental design methods, factorial design is one of the most recommended options. Fractional factorial design has the advantage of requiring fewer experiments, and only a fraction of the possible combinations is quantified. Therefore, less reagents and time are necessary in the experimental design [39]. Chemometric tools such as RSM have been widely applied to optimize operational parameters in AOPs. However, many studies remain limited to empirical optimization without integrating mechanistic interpretation.
In this context, the present work aims to bridge this gap by combining chemometric optimization with mechanistic analysis to better understand the role of micellar systems in the photo-Fenton process for the degradation of methyl orange, a model azo dye, and its frequent application as a model contaminant in studies evaluating the efficiency of different advanced oxidation processes [40,41,42,43]. In addition to its use in various industries, it is employed as a pH indicator. Its toxicity and genotoxic potential place it among hazardous substances according to environmental criteria [44]. Specifically, this study aims to: (i) employ a sequential experimental design (screening followed by RSM) to identify and optimize the key operational variables affecting degradation efficiency; (ii) investigate the influence of SDS micelles on reaction kinetics and radical-driven mechanisms; and (iii) evaluate the applicability of the optimized system to other azo dyes.
2. Materials and Methods
2.1. Reagents
Methyl orange (Sodium 4-[(4-dimethylamino) phenyldiazenyl] benzenesulfonate) (MO) was supplied by Anedra. Methyl red (2-(4-dimethylaminophenylazo) benzoic acid, 4-dimethylaminoazobenzene-2′-carboxylic acid) (MR) from Mallinckrodt, congo red (sodium 3,3′-([1,1′-biphenyl]-4,4′-diyl)bis(4-aminonaphthalene-1-sulfonic acid) (CR) from Sigma and used as received. Sodium dodecyl sulphate (SDS) was purchased from Sigma-Aldrich and used without further purification. Ferrous sulphate heptahydrate, analytical grade, from Cicarelli, and 30% w/w hydrogen peroxide, from Anedra. 70% perchloric acid, from Cicarelli, and sodium hydroxide from Sigma-Aldrich, with a purity of 98%. 1-Butanol, D-mannitol and cyclohexanol were supplied by Sintorgan. Methylene blue (3,7-bis(dimethylamino)phenothiazin-5-ium chloride) (MB) was obtained from Sigma-Aldrich and used as received. Sodium tetraborate (Na2B4O7) and chloroform were obtained from Sigma-Aldrich and Sintorgan, respectively. Milli-Q water was used for the preparation of all solutions. The micellar solution was prepared by dissolving the surfactant in water. A small amount of azo dye, previously dissolved in water, was added to these micellar solutions, ensuring that the final total analytical concentration of the dye was suitable for the photodegradation experiments.
2.2. Methods
The absorption spectra were obtained using a Hewlett-Packard diode array spectrophotometer (8452A) with Agilent ChemStation general purpose software. A custom-built LED photolyzer system was used to perform the photo-Fenton experiments. This system consists of a cell holder designed to be coupled to the spectrophotometer and a light source composed of two LED lamps with a maximum emission at 364 nm and a power of 3 W each. All experiments were carried out at room temperature in a quartz cell (3 ml), with regular stirring. The reaction cell was placed between the two LEDs at a distance of 1 cm. In all experiments, the absorption spectrum was measured at different photolysis times, and the degradation efficiency was calculated using Eq. 5:
where Abs0 and Abst are the absorbances of MO a λmax, at time 0 and t respectively.
Degradation Efficiency (%) = [(Abs0 - Abst) ⁄ Abs0] ×100 (5)
The degradation kinetics of the dyes by the photo-Fenton process were fitted to a pseudo-first order model, described by the Eq. 6:
where C0 and C are the concentration values at time zero and at different photolysis times, respectively, kap represent the pseudo-first order rate constant and t the photolysis time.
ln C ⁄ C0 = -kap t (6)
The selection of experimental design and response surface modeling was carried out using Stat-Ease Design-Expert 7.0 software (Stat-Ease, Inc., Minneapolis, USA).
To study the involvement of hydroxyl radicals in the photo-Fenton process, scavenger tests were performed using 1-butanol (kHO•= 4.2 × 10⁹ M⁻¹ s⁻¹) and D-mannitol (kHO•= 1.7 × 10⁹ M⁻¹ s⁻¹) [45], at concentrations of 50 and 200 mM. Cyclohexanol, a less polar alcohol, was selected to scavenge HO• in the micellar core region.
The concentration of SDS in the reaction samples was quantified by UV–Vis absorption spectroscopy, using a method based on the formation of an ion pair between the anionic surfactant and methylene blue [46]. In alkaline medium, SDS interacts with methylene blue to form a stable ion pair (MB⁺–SDS⁻), which is selectively extracted into chloroform and exhibits a characteristic absorbance at 650 nm.
2.3. Statistical Experimental Design
2.3.1. Selection of the Design for the Screening Stage
To determine the variables (factors) that are significant in the photo-Fenton process, a preliminary investigation was conducted to evaluate the effects of the variables that had an influence on the photodegradation reaction. These variables were presumed to be related to each other and were therefore studied using a 2k-1 half Fractional Factorial design. The factors studied are shown in Table 1. The input factors were concentrations of H2O2, Fe2+, SDS, methyl orange y pH. The upper and lower limits were selected, as higher pH produces the formation of ferrous hydroxide, the minimum SDS concentration corresponds to the level concentration to form micelles, and the lowest concentration of methyl orange is that which gives the lowest measurable absorbance.
In this design, the number 2 implies the two levels that were studied (low-high), k is the number of explanatory variables and 1 means that it is fractional. In the screening stage, the influence of the effects on the response are determined and eliminate those that are not significant. Furthermore, five repetitions of a mid-point were conducted as an internal control for the method. The model resulted in 21 experiments, which were carried out in three blocks. Details of the conditions of each experiment are shown in Table 1S.
2.3.2. Selection of the Design for the Optimization Stage
The objective is to design an experiment that provides reasonable values of the response variable and subsequently determine the mathematical model that best fits the obtained data. The ultimate goal is to determine the values of the factors that optimize the response. Once a variable has been selected, it may be necessary to shift the experimental region in a new direction or explore the initial region in greater detail. A variety of mathematical and statistical models are used to analyze problems in which a variable of interest can be influenced by other variables. This type of analysis is effectively carried out using RSM. The main objective is to determine the optimal values of the factors that maximize the value of the response by determining the optimal operating conditions for the system. Central composite design (CCD) is a response-surface design with a symmetrical experimental domain and covers a wide range experimental domain of effective factors, applicable for the optimization of parameters, and estimation and evaluation of factors and interaction of variables [35]. CCD is chosen because it can be used as a full or fractional factorial. This allows points to be added on the axes and at the center, in addition to other desirable features. The CCD is composed of i) a factorial portion, ii) a central point with multiple replicates (n0 > 1), and iii) star design or axial points at a distance α from the central point. With k factors, the total number of experiments is N = 2k + 2k + n0. The number of runs to the center and the distance between the axial points are chosen according to the desired properties of the design [47]. None of the variables were discarded in the screening phase, as all were found to be significant. Therefore, for the CCD design, in a more confined experimental region, an experiment of 53 trials divided into 5 blocks was designed, as shown in Table 2S in the Supplementary Material. Experiments number 8, 9 and 21 were ignored in the model because they are outlier.
3. Results and Discussion
3.1. Photophysical Characterization
Azo dyes have an absorption spectrum dependent on the pH and polarity of the solvent. Figure 1a shows the characteristic absorption spectra of MO at pH 3 and pH 5. MO has a pKa of 3.47 [48], therefore according to its structure (scheme 1S) the dye has a negative charge at pH 5 with a maximum at 460 nm (λ= 22600 ± 450 M-1 cm-1) typical of substituted azo-benzenes [49]. At more acidic pH the zwitterionic form would be present whose spectrum presents a maximum at 502 nm (λ= 26400 ± 530 M-1 cm-1) attributed to its hydrazone form. Figure 1b shows the absorption spectra of MO in different media, observing a shift more towards the red in the micellar medium.
In the micelles of SDS the pKa value of MO is slightly changed, being from 3.89 (see Figure 1S), a similar result has been observed for other azo dyes in anionic SDS micelles and nonionic micelles [48,50]. This slight increase in the pKa obtained could be attributed to the proximity of MO to the micelle surface, indicating a shift in the protonation equilibrium in the micellar medium, different from that in aqueous solution. The absorption spectra with different SDS concentrations are shown on Figure 2. The addition of SDS induces a bathochromic shift in the absorption maximum, from 506 nm to 516 nm. At low SDS concentrations (corresponding to premicellar aggregates), the absorbance at the maximum remains virtually unchanged. However, as the SDS concentration exceeds 7.1 mM, an increase in absorbance is observed, accompanied by a red shift in the spectral maximum. This effect stabilizes at concentrations above 16.9 mM, as shown in the inset of Figure 2. The experimentally determined critical micelle concentration (CMC) was 9.6 × 10⁻³ M, which is consistent with values reported in the literature [21].
These spectral changes suggest that MO experiences a microenvironment distinct from pure water, yet of comparable polarity (see Figure 1b). MO is known to exhibit positive solvatochromism, displaying red shifts in its UV-Vis spectrum in environments of higher polarity [46]. The observed shift implies that MO is likely confined to a hydrophilic region, potentially adopting an oriented arrangement at the micellar interface. At pH 3, MO exists predominantly in its cationic form, facilitating electrostatic attraction with the negatively charged sulfate headgroups of SDS. This interaction contributes to the stabilization of MO at the micellar surface, influencing both its spectral properties and its spatial distribution.
From the changes observed in Figure 2, the partition constant (Kp) of MO was determined using the Ketelaar equation [51,52]. A nonlinear least-squares fitting was performed according to Eq. 3S (see Text 1S in Supporting Information). The fitting produced good agreement, providing a Kp value of 5.3 x 10⁴ M-1 as shown in Figure 2S, which is similar to values reported for other dye-micelle systems with opposite charges [23,24,53]. This high value indicates a strong affinity of the dye for the micelles.
3.2. Photodegradation Measurements
3.2.1. Photolysis Direct
MO photostability was evaluated in aqueous solution and SDS micelles. No changes in the absorption spectrum of MO were observed with irradiation time, meaning that it is photostable in both media (see Figure S3). The micelles alone were also irradiated without showing changes over time.
3.2.2. Determination of Fe2+, H2O2, pH and SDS Levels
As mentioned in the section on statistical experimental design, a previous investigation of the variables involved in the photo-Fenton process was carried out to establish the appropriate range of work (data from table 1) and then to be able to apply statistical design and analysis effectively. The results obtained on the photo-Fenton process of MO in the presence of micelles at the screening stage are shown in Figure 3.
As is known, pH is fundamental in this process, MO degradation was more efficient at pH values below 4.0 (see figure 3a), reaching after 30 minutes degradation percentages of 95.2 %, 88.9 % and 71.7 % for pH values of 3, 2 and 4, respectively. In contrast, at pH values greater than 5.0, minimal effects on MO degradation are observed, obtaining degradation percentages of less than 10 % in all cases. This is because above pH 5 the iron in solution is drastically reduced, precipitating in the form of ferric oxyhydroxide which stops the photo-Fenton reaction [10].
On the other hand, the variation of different doses of Fe2+ was studied, setting the initial concentrations of H2O2 and surfactant. Figure 3b shows that the degradation of MO showed a slight improvement when the dose of Fe2+ increased from 0.01 to 0.1 mM, obtaining degradation percentage values of 94.2 % and 96.5 %, respectively. The increased concentration of Fe2+ generates an increase in the production of HO• radicals by catalyzing the breakdown of H2O2 (Eq. 3), which favors the elimination of MO. However, at a Fe2+ concentration above 1 mM, was observed precipitately.
The effect of H2O2 concentration on the reaction is shown in Figure 3c. Increasing the addition of H2O2 from 0.1 to 100 mM resulted in an increase in MO removal from 90.0 % to 94.6 %. This is due to a greater generation of HO• available to attack the dye. Finally, the effect of SDS concentration on the system (Figure 3d) was varied by setting the initial concentrations of Fe2+ and H2O2 at 0.015 and 10 mM, respectively and an initial pH 3. There were no significant changes in the efficiency of the photodegradation reaction. This could be attributed to the competition between SDS and MO for HO•, which would be counteracting the oxidation effect on MO [54].
3.3. Experimental Design
3.3.1. Screening by Full Factorial
A full factorial design with five factors was used to evaluate their effects on the photodegradation of methyl orange. As described below, factors analyzed were pH and concentrations of H2O2, Fe2+, SDS and MO. 2k-1 half Fractional Factorial design was applied, and the response variable determined was the percentage photodegradation of methyl orange. For higher H2O2 concentrations and pH lower than 3.5 the highest percentages of photodegradation were obtained, indicating that the degradation of the dye by the proposed system is highly dependent on pH and H2O2 concentration. For five replicated measurements a percentage coefficient of variation of 4.8 % was obtained, showing the very good reproducibility of the results. Analysis of the Pareto chart revealed that pH and the concentrations of H₂O₂, Fe²⁺, and SDS (factors A, B, C, and E) were statistically significant because they exceeded the Bonferroni cutoff (Figure S4a). Methyl orange (factor D) was considered insignificant because it fell below the t-value threshold. However, for the optimization stage, the methyl orange concentration was included as a factor because the percentage of photodegradation is determined from the methyl orange concentration in solution. Furthermore, the residuals were randomly distributed, satisfying the assumption of homoscedasticity, and exhibiting constant variance across all observations, as shown in Figure 4bS. Information was also obtained regarding the model's predictive capacity, as the values predicted by the model matched the experimental data very well (Figure S4c). Then ANOVA was performed, and the results are shown in Table S3 in the Supplementary Information. A p-value ≤ 0.05 indicates that model terms are significant and rejects the null hypothesis at the 5 % confidence level. Thus, pH and H2O2, Fe2+ and SDS concentrations were significant terms of the model. In addition, the predicted R2 (pred-R2) of 0.9219 was in reasonable agreement with the adjusted R2 (adj-R2) of 0.9814. The R2 values, which is a measure of the quality of the fit when the regression equation is used, was 0.9861 indicating that 98.61 % of the variability can be explained by the model.
3.3.2. Optimization Using Response Surface Methodology
Once selected the significant factors, the optimization of the degradation of methyl orange was performed using RSM. The percentage degradation efficiency of methyl orange at 10 minutes of reaction corresponding to the different blocks are shown in Table S2. The assays in which the highest degradation efficiency was obtained, exceeding 95 %, in general terms have as a common factor a high Fe2+ concentration (0.5 and 0.9 mM), a moderate H2O2 concentration (close to 125 mM) and a pH less than 3.0. A value of degradation efficiency equal to zero was obtained due to ferrous hydroxide precipitation, except for experiment number 52, where the concentration of methyl orange was zero. Tests 44 and 45, carried out in the absence of H2O2 and Fe2+, respectively, show that the degradation of the dye was minimal, with percentages close to 1.0 %. The model was evaluated by ANOVA, and the results obtained are shown in Table 2. The p-value of lack of fit (LOF), which indicates the adequacy of the model, was 0.8331 indicating that the model was fitted correctly to the response. A R2 value of 0.9985 was in good agreement with the experimental results. From Table 2, the p-value can be highlighted. If p is greater than 0.0001, the variation in this factor is not significant in the range of values studied. Therefore, the concentration of H2O2 and methyl orange did not influence the response.
Thus, a logistic model for the percentage of degradation efficiency was obtained by considering the significant terms, and was described by the following equation:
logit (% degradation efficiency) =
where lower and upper correspond to the minimum and maximum values obtained for the % degradation efficiency.
The statistical significance of the logit model was checked by the F-test, and the p-value <0.0001 (see Table 2) confirms that the model is highly significant. The model indicates that the pH, Fe2+ and SDS factors and the simple interactions between pH, Fe2+, methyl orange, SDS, H2O2 showed effects as well as the quadratic terms of pH and Fe2+. Verification of the assumptions was performed for the model that obtained the best ANOVA. The assumption of independence is fulfilled since the residuals were randomly distributed in a horizontal band when the residuals were plotted vs. the run number (Figure 4a). In accordance with the standard probability distribution, these values were observed to align with a straight line, therefore, the assumption of normality of the residuals is also fulfilled (Figure 4b). Also, residuals were randomly distributed, satisfying the assumption of homoscedasticity (Figure 4c).
With the model selected, the response surface was obtained, and the optimization procedure was carried out where the values of the factors that maximize the percentage of degradation efficiency are shown in Table 3.
3.3.3. Verification of Optimal Conditions
To verify the results of the model, the photo-Fenton system was applied by choosing the following conditions from the optimal range provided in the Table 3: pH = 2.85, [H₂O₂] = 100 mM, [Fe²⁺] = 0.5 mM, [SDS] = 13 mM, and [MO] = 0.01 mM. A MO degradation percentage of 98.4 % was achieved within 5 minutes of reaction. These conditions were carried out in pure water without the presence of micelles for comparison. As shown in Figure 5, a higher percentage of degradation was observed in the presence of SDS, at much shorter reaction times compared to pure water. These results can be explained by the confined microenvironment where the dye is located within the micellar system. MO is located at the water-micelle interface or stern layer, close to the reactive radicals generated in the aqueous phase, responsible for photodegradation. Furthermore, there is evidence that SDS can complex especially divalent cations [55] suggesting that Fe²⁺ may also interact at the micellar interface, bringing the generation of reactive radicals in close proximity to MO. The formation of complexes between Fe²⁺ and Fe³⁺ species with SDS was also observed by us, based on the changes obtained in the absorption spectra (Figure 5S). These associations could modify the coordination environment of the metal center at the micellar interface. Since the photo-Fenton process is strongly governed by the Fe²⁺/Fe³⁺ photochemical cycle, these effects could influence the interfacial distribution and speciation of iron species, affecting the local photochemical behavior of the system and the generation of reactive oxygen species near the micellar interface. As mentioned previously, the preferential localization of the metal center in the hydrophilic region of the micellar pseudophase favors its exposure to the generated HO• radicals, given the spatial proximity between the catalyst, reactive oxygen species, and the dye, thus facilitating oxidative attack. Furthermore, the diffusional limitations typically associated with homogeneous systems would not occur in the micellar medium, promoting more efficient dye degradation. Similar results have been reported, where surfactants enhanced the degradation of both organic and inorganic pollutants due to the micellization effect [19,54].
3.4. Kinetic and Mechanistic Analysis
The data obtained for the concentration of MO as a function of time were well fitted following pseudo first-order kinetics according to Eq. 6. The values of kap were 1.15 min-1 y 0.37 min-1 in media micelles and in aqueous solution respectively. In view of these results, MO degrades faster in the presence of micelles of SDS. In addition, to gain further insight into the reactive species involved in the photo-Fenton process, MO degradation was performed by PFF under optimal conditions in the presence of 1-butanol, used as an inhibitor of the reactive HO• species [56]. Figure 6 shows the effect of 1 butanol addition on the photo-Fenton degradation of MO. In both media, the process efficiency decreased, with a more pronounced inhibition observed in aqueous solution. Specifically, MO degradation dropped from 91.7 % to 17.2 % in water, whereas in the presence of SDS micelles it only declined from 98.4 % to 89.5 %. When the alcohol concentration increased to 200 mM, the percentage decreased to 77.8 %. This inhibition confirms that the photo-Fenton process is primarily governed by hydroxyl radicals HO•, which act as the main oxidizing species.
In micellar medium, additional tests were conducted with D-mannitol and cyclohexanol, with scavengers the HO• in the aqueous or interfacial and micellar core regions, respectively [57]. Figure 7 shows that with the addition of cyclohexanol to the system, degradation was less than with 1-butanol and mannitol. It is known that some alcohols can comicelize at the interface of these microaggregates, and therefore 1-butanol will be distributed in the water and in the Stern layer. In contrast, cyclohexanol can penetrate the interior of the micelle due to its greater hydrophobicity. However, since mannitol is more hydrophilic than butanol, it will remain in the aqueous phase, which better reflects the compartmentalization of the radicals. Thus, the radicals generated in the aqueous phase diffuse toward the micellar interface, and some even penetrate further into the micelle where they can react with the various inhibitors.
From these results, it is concluded that in addition to hydroxyl radicals, there are other reactive species responsible for the degradation of MO in the micellar medium. The minor effect observed on photodegradation with inhibitors in the presence of micelles suggests that in addition to hydroxyl radicals, there are other reactive species responsible for the degradation of the MO.
Previous studies have demonstrated that surfactants can interact with hydroxyl radicals, generating reactive intermediates that contribute to pollutant degradation. Das et al. [58]. reported that HO• reacts with Triton X 100 (a nonionic surfactant), producing TX• radicals that promote the reductive degradation of a hydrophobic azo dye. Similarly, Xu et al. found that HO• attacks SDS, leading to its decomposition and the formation of surfactant-derived radicals that contribute to the degradation of a perchlorinated organic contaminant [19]. In addition, Huang et al. [59] investigated Fe²⁺-activated systems in the presence of SDS above the cmc, observing progressive oxidative transformations of the surfactant chains and the formation of intermediates such as olefins and aldehydes. These transformations were proposed to generate alcohols and carboxylic acids, which in turn favor the production of carbon dioxide radicals (CO₂•⁻) through secondary radical pathways. Collectively, these findings highlight that surfactant-rich micellar environments provide additional radical routes, thereby explaining the limited inhibition observed upon 1 butanol addition in our system.
Consistent with these findings, the concentration of SDS was monitored at different reaction times using the standard methylene blue assay in alkaline medium, both in the presence and absence of 1 butanol. The corresponding calibration curve is provided in the Supplementary Information (Figure 6S). The addition of 200 mM 1 butanol markedly suppressed SDS degradation, reducing the removal efficiency from 60.4 % to 34.5 % (See Figure 7S). These results confirm that HO• radicals play a key role in the decomposition of SDS, supporting their involvement in secondary radical pathways under micellar conditions. Thus, SDS may contribute to the generation of reactive species through its own radical-derived intermediates. In this context, the micellar system not only modulates the spatial distribution of reactants but also influences the radical dynamics of the process. Overall, these findings support a dual function of SDS as a structuring component of the reaction medium and as a precursor of reactive species that enhance photo-Fenton degradation.
3.4. Application of the Optimized Photo-Fenton Process to Other azo Dyes
The photo-Fenton process was carried out under optimized conditions for both congo red and methyl red. CR showed a degradation trend like that of methyl orange, although its removal efficiency in the presence of SDS was slightly lower (Figure 8S). In contrast, MR showed the opposite behavior: its degradation was more efficient in pure water than in the SDS-assisted system. This difference can be attributed to its different location, according to the molecular structure (Scheme 1S). At acidic pH MR is found in its protonated form, analogous to MO. This protonation facilitates electrostatic interactions with the sulfonate groups of SDS, in addition to the hydrophobic interactions of the rest of its structure with the less polar part of SDS [60,61]. These interactions likely promote the localization of MR toward the interior of anionic SDS micelles, where it may experience a protective effect that hinders its degradation. This is in accordance with the blue shift of the observed absorption maximum (Figure 9S), and in accordance with the photophysical characterization found [61]. In contrast, CR displayed behavior more similar to that of MO, with a slight red shift in its maximum absorption in the presence of SDS (Figure 10S). At pH 2.85, CR possesses two positive charges due to the protonation of its amino groups, while its sulfonate groups confer a negative charge, resulting in a zwitterionic form [62]. This charge distribution favors its localization near the micellar surface, which could increase its exposure to reactive species.
In Table 4 it summarizes the results of the degradation percentage and the apparent kinetic constant reaction of the three dyes studied. The rate constants found in the presence of SDS micelles reflect the accessibility of HO• radicals to the dye and are consistent with the dye's location in the microheterogeneous medium. The lower value for MR infers reduced access of hydroxyl radicals, which must diffuse into the micellar core. Furthermore, the high removal rates and kinetic constants obtained confirm the effectiveness of the photo-Fenton process for the degradation of azo dyes in the micellar pseudophase of SDS.
4. Conclusions
In this work, the photo-Fenton degradation of methyl orange in SDS micellar solution was systematically studied and compared with the aqueous solution, using a chemometric optimization approach. The optimal experimental conditions were determined by evaluating the effects of key parameters, including dye concentration, surfactant concentration, H₂O₂ and Fe²⁺ concentrations, and solution pH. Through the application of chemometric tools, the following optimal operating conditions were identified: pH = 2.85, [H₂O₂] = 100 mM, [Fe²⁺] = 0.5 mM, [SDS] = 13 mM, and [MO] = 0.01 mM, with a correlation coefficient of the applied model (R2) of 0.9861. Under these conditions, a remarkable degradation efficiency of over 98.4 % was achieved within just 5 minutes of reaction. These results demonstrate the high efficiency and rapid degradation kinetics of the photo-Fenton process in the presence of SDS for the treatment of methyl orange. The micellar medium increases the accessibility of hydroxyl radicals to the dyes, resulting in a highly effective degradation pathway. Furthermore, the breakdown of SDS during the process appears to generate organic intermediates capable of interacting with hydroxyl radicals and forming new reactive species, thereby exerting a major catalytic effect on the overall reaction. Finally, applying this optimized process to other azo dyes (congo red and methyl red) confirmed that degradation performance depends largely on the interaction and location of the contaminant within the microheterogeneous medium. These findings highlight the potential of the micellar pseudophase effect for designing highly efficient and selective photo-Fenton systems for environmental remediation.
Data availability
The data will be available upon request from the corresponding author.
Supplementary Materials
The following supporting information can be downloaded at the website of this paper posted on Preprints.org, Scheme 1S. Molecular structure of the azo dyes studied; Figure 1S Variation of the maximum absorption length of MO as a function of pH in the presence of SDS 30 mM; Text 1S Determination of the partition constant of methyl orange (Kp); Figure 2S Adjustment according to equation (1) for calculation of Kp. The relative error determined by these measures is 0.5%; Figure 3S Change in MO absorbance in water at pH 3 and in micelles [SDS] = 0.02 M. Irradiation source: photolyzer with 2 LEDs of 3 W each and a maximum emission at 365 nm. Figure 4S a) Pareto chart where A represents to pH, B, C, D and E the concentrations of Fe2+, H2O2, MO and SDS respectively; b) Residuals as a function of predicted values; and c) model-predicted vs. actual model data for MO degradation. Figure 5S UV-Vis spectra Fe2+ and Fe3+ in water and in SDS micelles. [SDS]=13 mM. Figure 6S Calibration curve for SDS determination using the methylene blue method. Figure 7S Evolution of SDS concentration during PFF in the absence (•) and presence (•) of 1-butanol (200 mM). Inset: absorbance spectra of the MB⁺–SDS⁻ ion pair in the absence of 1-butanol, recorded in the 450–800 nm range. Initial conditions: [Fe²⁺] = 0.5 mM; [H₂O₂] = 100 mM; [SDS] = 13 mM; pH = 2.85. Figure 8S Percentage degradation of MR and CR as a function of time in: (•) water at pH 2.85, (•) SDS micelles, under optimized conditions. Irradiation source: photolyzer with 2 LEDs of 3 W each and a maximum emission at 365 nm. Figure 9S Normalized absorption spectra of MR in different media. [SDS] = 30 mM. Figure 10S Normalized absorption spectra of CR in different media. [SDS] = 30 mM.
Author Contributions
M. J. Gramaglia: investigation, methodology, formal analysis, writing—original draft preparation. F. J. Arévalo: conceptualization, methodology, formal analysis, writing—original draft preparation. J. E. Natera: formal analysis, writing—original draft preparation W. A. Massad: conceptualization, investigation, formal analysis, writing—review and editing, funding acquisition. G. V. Porcal: conceptualization, methodology, formal analysis, investigation, resources, writing—original draft preparation, writing—review and editing, supervision. All authors have read and agreed to the published version of the manuscript.
Funding
This research was funded by , PICT 2020- SerieA-01726 and PIP Conicet 2023 (11220220122431CO).
Acknowledgments
The authors thank the financial support from Agencia Nacional de Promoción Científica y Tecnológica (ANPCyT), Secretaría de Ciencia y Técnica from Universidad Nacional de Río Cuarto (SECyT UNRC) and Consejo Nacional de Investigaciones Científicas y Técnicas (CONICET), Argentina.
Conflicts of Interest
The authors declare no conflicts of interest.
References
- Al-Tohamy, R.; Ali, S.S.; Li, F.; Okasha, K.M.; Mahmoud, Y.A.-G.; Elsamahy, T.; Jiao, H.; Fu, Y.; Sun, J. A critical review on the treatment of dye-containing wastewater: Ecotoxicological and health concerns of textile dyes and possible remediation approaches for environmental safety. Ecotoxicol. Environ. Saf. 2022, 231, 113160. [Google Scholar] [CrossRef]
- Islam, T.; Repon, Md. R.; Islam, T.; Sarwar, Z.; Rahman, M.M. Impact of textile dyes on health and ecosystem: a review of structure, causes, and potential solutions. Env. Sci. Pollut. Res. 2022, 30, 9207–9242. [Google Scholar] [CrossRef]
- Alsukaibi, A.K.D. Various Approaches for the Detoxification of Toxic Dyes in Wastewater. Processes 2022, 10, 1968. [Google Scholar] [CrossRef]
- Kataria, J.; Rawat, H.; Tomar, H.; Gaurav, N.; Kumar, A. Azo Dyes Degradation Approaches and Challenges: An Overview. SCIENTIFICTEMPER 2022, 13, 384–400. [Google Scholar] [CrossRef]
- Khattab, T.A.; Abdelrahman, M.S.; Rehan, M. Textile dyeing industry: environmental impacts and remediation. Env. Sci. Pollut. Res. 2020, 27, 3803–3818. [Google Scholar] [CrossRef]
- Liu, Y.; Zhao, Y.; Wang, J. Fenton/Fenton-like processes with in-situ production of hydrogen peroxide/hydroxyl radical for degradation of emerging contaminants: Advances and prospects. J. Hazard. Mater. 2021, 404, 124191. [Google Scholar] [CrossRef] [PubMed]
- Fernández, A.P.B.; Brandon, P.V.; Azañero, A.J.V. Optimal concentration and efficiency of the photo Fenton system for the treatment of a synthetic textile effluent. Rev. Ambient ÁGua 2023, 18, 1–15. [Google Scholar] [CrossRef]
- Ismail, G.A.; Sakai, H. Review on effect of different type of dyes on advanced oxidation processes (AOPs) for textile color removal. Chemosphere 2022, 291, 132906. [Google Scholar] [CrossRef] [PubMed]
- Yazici Guvenc, S.; Varank, G. Degradation of refractory organics in concentrated leachate by the Fenton process: Central composite design for process optimization. Front. Environ. Sci. Eng. 2021, 15, 2. [Google Scholar] [CrossRef]
- Pignatello, J.J.; Oliveros, E.; MacKay, A. Advanced Oxidation Processes for Organic Contaminant Destruction Based on the Fenton Reaction and Related Chemistry. Crit. Rev. Environ. Sci. Technol. 2006, 36, 1–84. [Google Scholar] [CrossRef]
- Faust, B.C.; Hoigné, J. Photolysis of Fe (III)-hydroxy complexes as sources of OH radicals in clouds, fog and rain. Atmospheric Environment. Part A. General. Top. 1990, 24, 79–89. [Google Scholar] [CrossRef]
- Bokare, A.D.; Choi, W. Review of iron-free Fenton-like systems for activating H2O2 in advanced oxidation processes. J. Hazard. Mater. 2014, 275, 121–135. [Google Scholar] [CrossRef] [PubMed]
- Yaseen, D.A.; Scholz, M. Textile dye wastewater characteristics and constituents of synthetic effluents: a critical review. Int. J. Environ. Sci. Technol. 2019, 16, 1193–1226. [Google Scholar] [CrossRef]
- Han, B.; Shu, D.; Cao, S.; Lian, Z.; An, F.; Li, W.; Bai, S. Role of surfactants in the degradation and sustainable dyeing for reactive dyeing wastewater. J. Mol. Liq. 2024, 410, 125657. [Google Scholar] [CrossRef]
- Jena, G.; Dutta, K.; Daverey, A. Surfactants in water and wastewater (greywater): Environmental toxicity and treatment options. Chemosphere 2023, 341, 140082. [Google Scholar] [CrossRef]
- Yang, C.W.; Wang, D.; Tang, Q. Effect of sodium dodecyl benzene sulfonate on the process of Fenton degradation of 4-chlorophenol. Desalin. Water Treat. 2015, 55, 1302–1307. [Google Scholar] [CrossRef]
- Ren, B.X. Influence of anionic surfactant on the process of electro-Fenton decolorized methyl orange. Water Sci. Technol. 2010, 61, 1299–1306. [Google Scholar] [CrossRef] [PubMed]
- Badawi, A.M.; Ahmed, S.M.; El-Naggar, A.Y.; El-Zahar, S.M.; Aboul-Gheit, A.K. Chlorophenol wastewater degradation in micellar solutions: A gas chromatographic study. J. Surfact Deterg. 2004, 7, 285–290. [Google Scholar] [CrossRef]
- Xu, Z.; Cai, L.; Yang, R.; Zhou, Z.; Zeng, G.; Lyu, S. Mechanistic insights into surfactant in enhanced reductive degradation of perchlorinated organic contaminants in Fenton system. Sep. Purif. Technol. 2023, 322, 124220. [Google Scholar] [CrossRef]
- Virdi, J.K.; Dusunge, A.; Handa, S. Aqueous Micelles as Solvent, Ligand, and Reaction Promoter in Catalysis. JACS Au 2024, 4, 301–317. [Google Scholar] [CrossRef]
- Kalyanasundaram, K. Photochemistry in microheterogeneous systems; Academic Press: Orlando, 1987. [Google Scholar]
- Ashraf, U.; Chat, O.A.; Dar, A.A. An inhibitory effect of self-assembled soft systems on Fenton driven degradation of xanthene dye Rhodamine B. Chemosphere 2014, 99, 199–206. [Google Scholar] [CrossRef]
- Ali, M.; Usman, M.; Shah, A.; Rehman, A. Encapsulation of ethyl violet by anionic-cationic mixed micellar solution: Spectroscopic and conductometric studies. Colloids Surf. A Physicochem. Eng. Asp. 2021, 629, 127423. [Google Scholar] [CrossRef]
- Tunç, S.; Duman, O.; Kancı, B. Spectrophotometric investigation of the interactions between cationic dye (C.I. Basic Yellow 2) and anionic surfactant (sodium dioctylsulfosuccinate) in the premicellar and micellar region. Dye. Pigment. 2012, 94, 233–238. [Google Scholar] [CrossRef]
- García-Cervilla, R.; Romero, A.; Santos, A.; Lorenzo, D. Surfactant-Enhanced Solubilization of Chlorinated Organic Compounds Contained in DNAPL from Lindane Waste: Effect of Surfactant Type and pH. IJERPH 2020, 17, 4494. [Google Scholar] [CrossRef]
- Gamarra-Güere, C.D.; Dionisio, D.; Santos, G.O.S.; Vasconcelos Lanza, M.R.; De Jesus Motheo, A. Application of Fenton, photo-Fenton and electro-Fenton processes for the methylparaben degradation: A comparative study. J. Environ. Chem. Eng. 2022, 10, 106992. [Google Scholar] [CrossRef]
- Shah, A.; Shahzad, S.; Munir, A.; Nadagouda, M.N.; Khan, G.S.; Shams, D.F.; Dionysiou, D.D.; Rana, U.A. Micelles as Soil and Water Decontamination Agents. Chem. Rev. 2016, 116, 6042–6074. [Google Scholar] [CrossRef] [PubMed]
- Abdel Nour, C.; Rossignol, S.; Samia, B.; Bou Saad, M.; Dieng, N.K.; Lebarillier, S.; Asia, L.; Monod, A.; Wong-Wah-Chung, P. Hydroxyl radical-initiated degradation kinetics of organic pollutants in surfactant-rich environments. Environ. Sci. Process. Impacts 2025, 27, 3119–3131. [Google Scholar] [CrossRef]
- Youssef, N.A.; Shaban, S.A.; Ibrahim, F.A.; Mahmoud, A.S. Degradation of methyl orange using Fenton catalytic reaction. Egypt. J. Pet. 2016, 25, 317–321. [Google Scholar] [CrossRef]
- Roy, M.; Saha, R. Dyes and their removal technologies from wastewater: A critical review. In Intelligent Environmental Data Monitoring for Pollution Management; Elsevier, 2021; pp. 127–160. [Google Scholar] [CrossRef]
- Tarkwa, J.-B.; Oturan, N.; Acayanka, E.; Laminsi, S.; Oturan, M.A. Photo-Fenton oxidation of Orange G azo dye: process optimization and mineralization mechanism. Env. Chem. Lett. 2019, 17, 473–479. [Google Scholar] [CrossRef]
- Quynh, H.G.; Thanh, H.V.; Phuong, N.T.T.; Duy, N.P.T.; Hung, L.H.; Dung, N.V.; Duong, N.T.H.; Long, N.Q. Rapid removal of methylene blue by a heterogeneous photo-Fenton process using economical and simple-synthesized magnetite–zeolite composite. Environ. Technol. Innov. 2023, 31, 103155. [Google Scholar] [CrossRef]
- Urmi, S.A.; Kurny, A.S.W.; Gulshan, F. Decolorization of Methyl Orange Using Mill Scale by Photo-Fenton Reaction. Procedia Eng. 2015, 105, 844–851. [Google Scholar] [CrossRef]
- Ma, L.; Wang, L.; Tang, J.; Yang, Z. Optimization of arsenic extraction in rice samples by Plackett–Burman design and response surface methodology. Food Chem. 2016, 204, 283–288. [Google Scholar] [CrossRef] [PubMed]
- Montgomery, D.C. Design and analysis of experiments; John Wiley & Sons, 2017. [Google Scholar]
- Brereton, R.G. Chemometrics: Data Driven Extraction for Science; Wiley, UK, 2018. [Google Scholar]
- R. Leardi, Experimental design in chemistry: A tutorial. Anal. Chim. Acta 2009, 652, 161–172. [Google Scholar] [CrossRef]
- Parsa, Z.; Motevassel, M.; Khosravi-Nikou, M.R.; Jorfi, S.; Ghasemi, B. Biodegradability enhancement of azo dye Direct Orange-26 using UV/Fenton-like process: optimization using response surface methodology. Desalin. Water Treat. 2017, 81, 233–241. [Google Scholar] [CrossRef]
- Kotz, S.; Johnson, N.L. Breakthroughs in Statistics: Methodology and Distribution; Springer Science & Business Media, 2012. [Google Scholar]
- Abbasi, S.; Li, Z.; Dastan, D.; Tao, L. The effect of individual factors, their binary and ternary interactions on photodegradation rate of organic contaminants using photocatalysts based on multi-walled carbon nanotubes (MWCNTs): statistical analysis based on ANOVA and RSM. Env. Monit. Assess. 2023, 195, 1191. [Google Scholar] [CrossRef] [PubMed]
- Al-Mamun, Md. R.; Kader, S.; Islam, Md. S. Solar-TiO2 immobilized photocatalytic reactors performance assessment in the degradation of methyl orange dye in aqueous solution. Environ. Nanotechnol. Monit. Manag. 2021, 16, 100514. [Google Scholar] [CrossRef]
- Asif, M.; Shafiq, M.; Imtiaz, F.; Ahmed, S.; Alazba, A.A.; Hussain, H.N.; Butt, F.N.; Zainab, S.A.; Khan, M.K.; Bilal, M. Photocatalytic Degradation of Methyl Orange from Aqueous Solution Using ZnO by Response Surface Methodology. Top. Catal. 2025, 68, 814–822. [Google Scholar] [CrossRef]
- Sun, B.-L.; Shi, X.-L.; Hu, Q.; Du, M.; Gong, H.; Wang, J.; Fan, Y.; Zhang, J.; Li, Z. Ultrahigh-Strength Textile Fiber-Supported Schiff Base Copper Complexes for Photocatalytic Degradation of Methyl Orange. ACS Appl. Polym. Mater. 2024, 6, 13077–13088. [Google Scholar] [CrossRef]
- Farhan Hanafi, M.; Sapawe, N. A review on the water problem associate with organic pollutants derived from phenol, methyl orange, and remazol brilliant blue dyes. Mater. Today Proc. 2020, 31, A141–A150. [Google Scholar] [CrossRef]
- Buxton, G.V.; Greenstock, C.L.; Helman, W.P.; Ross, A.B. Critical Review of rate constants for reactions of hydrated electrons, hydrogen atoms and hydroxyl radicals (⋅OH/⋅O− in Aqueous Solution. J. Phys. Chem. Ref. Data 1988, 17, 513–886. [Google Scholar] [CrossRef]
- Jurado, E.; Fernández-Serrano, M.; Núñez-Olea, J.; Luzón, G.; Lechuga, M. Simplified spectrophotometric method using methylene blue for determining anionic surfactants: Applications to the study of primary biodegradation in aerobic screening tests. Chemosphere 2006, 65, 278–285. [Google Scholar] [CrossRef]
- Silva, M.B. Design of Experiments: Applications; BoD – Books on Demand, 2013. [Google Scholar]
- Ahmadi, F.; Daneshmehr, M.A.; Rahimi, M. The effect of anionic and cationic surfactants on indicators and measurement of dissociation constants with two different methods. Spectrochim. Acta Part A Mol. Biomol. Spectrosc. 2007, 67, 412–419. [Google Scholar] [CrossRef]
- Karukstis, K.K.; Litz, J.P.; Garber, M.B.; Angell, L.M.; Korir, G.K. A spectral approach to determine location and orientation of azo dyes within surfactant aggregates. Spectrochim. Acta Part A Mol. Biomol. Spectrosc. 2010, 75, 1354–1361. [Google Scholar] [CrossRef] [PubMed]
- Oakes, J.; Gratton, P. Solubilisation of dyes by surfactant micelles. Part 1; Molecular interactions of azo dyes with nonionic and anionic surfactants. Color. Technol. 2003, 119, 91–99. [Google Scholar] [CrossRef]
- Dutta, R.K.; Bhat, S.N. Interaction of phenazinium dyes and methyl orange with micelles of various charge types. Colloids Surf. A Physicochem. Eng. Asp. 1996, 106, 127–134. [Google Scholar] [CrossRef]
- Ketelaar, J. A. A. C.; van de Stolpe; Gersmann, H.R. Rec. Tray. Chim. 1951, 70, 499. [CrossRef]
- Nazar, M.F.; Shah, S.S.; Khosa, M.A. Interaction of Azo Dye with Cationic Surfactant Under Different pH Conditions. J. Surfactants Deterg. 2010, 13, 529–537. [Google Scholar] [CrossRef]
- Lyu, Y.; Lyu, S.; Tang, P.; Jiang, W.; Sun, Y.; Li, M.; Sui, Q. Degradation of trichloroethylene in aqueous solution by sodium percarbonate activated with Fe(II)-citric acid complex in the presence of surfactant Tween-80. Chemosphere 2020, 257, 127223. [Google Scholar] [CrossRef]
- Hąc-Wydro, K.; Mateja, A.; Ożóg, A.; Miśkowiec, P. Influence of metal ions on the aggregation of anionic surfactants. Studies on the interactions between environmental pollutants in aqueous solutions. J. Mol. Liq. 2017, 240, 514–521. [Google Scholar] [CrossRef]
- Gracia-Pinilla, M.Á.; Ramos-Delgado, N.A.; Rosero-Arias, C.; Sanders, R.; Bartling, S.; Winczewski, J.; Gardeniers, H.; Susarrey-Arce, A. Additive manufacturing of hollow connected networks for solar photo-Fenton-like catalysis. RSC Sustain. 2024, 2, 3897–3908. [Google Scholar] [CrossRef]
- Oliveira, G.D.F.S.; Gouveia, F.S.; Andrade, A.L.; De Vasconcelos, M.A.; Teixeira, E.H.; Palmeira-Mello, M.V.; Batista, A.A.; Lopes, L.G.D.F.; De Carvalho, I.M.M.; Sousa, E.H.S. Minimal Functionalization of Ruthenium Compounds with Enhanced Photoreactivity against Hard-to-Treat Cancer Cells and Resistant Bacteria. Inorg. Chem. 2024, 63, 14673–14690. [Google Scholar] [CrossRef]
- Das, L.; Chatterjee, S.; Naik, D.B.; Adhikari, S. Role of surfactant derived intermediates in the efficacy and mechanism for radiation chemical degradation of a hydrophobic azo dye, 1-phenylazo-2-naphthol. J. Hazard. Mater. 2015, 298, 19–27. [Google Scholar] [CrossRef] [PubMed]
- Huang, J.; Danish, M.; Gu, X.; Jiang, X.; Ali, M.; Shan, A.; Sui, Q.; Lyu, S. Mechanism of carbon tetrachloride reduction in Fe(II) activated percarbonate system in the environment of sodium dodecyl sulfate. Sep. Purif. Technol. 2021, 266, 118549. [Google Scholar] [CrossRef]
- Prasad Tajpuriya, G.; Shah, P.; Shahi, N.; Bhattarai, A. UV–Vis studies of methyl red in the presence of sodium dioctylsulfosuccinate/acetone and sodium dioctylsulfosuccinate/acetone/water. Spectrochim. Acta Part A Mol. Biomol. Spectrosc. 2021, 255, 119646. [Google Scholar] [CrossRef]
- Jirasová, J.; Jiří, B.; Čermáková, L. The effect of surfactants on the acid-base behaviour of methyl red. Part I. A spectrophotometric comparison of the effect of CPB and SDS. Collect.> Czech. Chem. Commun. 1990, 55, 1491–1499. [Google Scholar] [CrossRef]
- Purkait, M.K.; Maiti, A.; DasGupta, S.; De, S. Removal of congo red using activated carbon and its regeneration. J. Hazard. Mater. 2007, 145, 287–295. [Google Scholar] [CrossRef] [PubMed]
Figure 1.
Spectrum of absorption of MO a) in water a different pH levels; b) in different media and [SDS] = 1 × 10⁻² M (normalized spectra).
Figure 1.
Spectrum of absorption of MO a) in water a different pH levels; b) in different media and [SDS] = 1 × 10⁻² M (normalized spectra).

Figure 2.
Absorption spectra of MO in water at pH 3 as a function of SDS concentration. Inset: absorbance at 516 nm as a function of SDS concentration.
Figure 2.
Absorption spectra of MO in water at pH 3 as a function of SDS concentration. Inset: absorbance at 516 nm as a function of SDS concentration.

Figure 3.
Variation of photo-Fenton parameters for MO degradation. a) [Fe2+] = 0.015 mM; [H2O2] = 10 mM; [SDS]= 10 mM. b) pH = 3; [H2O2] = 10 mM; [SDS] = 10 mM. c) pH = 3; [Fe2+] = 0.015 mM [SDS] = 10 mM; d) [Fe2+] = 0.015 mM; [H2O2] = 10 mM; pH = 3.
Figure 3.
Variation of photo-Fenton parameters for MO degradation. a) [Fe2+] = 0.015 mM; [H2O2] = 10 mM; [SDS]= 10 mM. b) pH = 3; [H2O2] = 10 mM; [SDS] = 10 mM. c) pH = 3; [Fe2+] = 0.015 mM [SDS] = 10 mM; d) [Fe2+] = 0.015 mM; [H2O2] = 10 mM; pH = 3.

Figure 4.
Residual diagnostics for the model predicting MO degradation via SDS assisted photo-Fenton process: a) Internally studentized residuals vs. run number, b) Normal probability plot, c) Internally studentized residuals vs. Predicted values.
Figure 4.
Residual diagnostics for the model predicting MO degradation via SDS assisted photo-Fenton process: a) Internally studentized residuals vs. run number, b) Normal probability plot, c) Internally studentized residuals vs. Predicted values.

Figure 5.
Percentage degradation of MO by PFF as a function of time in: (•) water at pH 2.85, (•) SDS micelles. In optimal conditions. Irradiation source: photolyzed with 2 LEDs of 3 W each and a maximum emission at 365 nm.
Figure 5.
Percentage degradation of MO by PFF as a function of time in: (•) water at pH 2.85, (•) SDS micelles. In optimal conditions. Irradiation source: photolyzed with 2 LEDs of 3 W each and a maximum emission at 365 nm.

Figure 6.
Photo-Fenton degradation reaction of MO in aqueous solution and in micellar medium, in the presence and absence of 1-butanol. Initial conditions: [MO] = 10 µM; [Fe²⁺] = 0.5 mM; [H₂O₂] = 100 mM; [SDS] = 13 mM; pH = 2.85.
Figure 6.
Photo-Fenton degradation reaction of MO in aqueous solution and in micellar medium, in the presence and absence of 1-butanol. Initial conditions: [MO] = 10 µM; [Fe²⁺] = 0.5 mM; [H₂O₂] = 100 mM; [SDS] = 13 mM; pH = 2.85.

Figure 7.
Photo-Fenton degradation reaction of MO in SDS micellar medium, in the presence of scavengers the HO•. Initial conditions: [MO] = 10 µM; [Fe²⁺] = 0.5 mM; [H₂O₂] = 100 mM; [SDS] = 13 mM; pH = 2.85.
Figure 7.
Photo-Fenton degradation reaction of MO in SDS micellar medium, in the presence of scavengers the HO•. Initial conditions: [MO] = 10 µM; [Fe²⁺] = 0.5 mM; [H₂O₂] = 100 mM; [SDS] = 13 mM; pH = 2.85.


Table 1.
Factors and levels studied in the selection of variables for the degradation reaction.
| Factors | Lower limit | Upper limit |
|---|---|---|
| pH | 2 | 5 |
| [H2O2] / mM | 0.1 | 100 |
| [Fe2+] / mM | 0.01 | 0.5 |
| [SDS] / mM | 8.3 | 25 |
| [MO] / mM | 0.02 | 0.06 |
Table 2.
ANOVA variance analysis of the for the reduced quadratic model of the response surface.
| Source | Sum of Squares | Degrees of freedom | Mean Square | F Value | p-value Prob > F | |
|---|---|---|---|---|---|---|
| Model | 106.189 | 20 | 5.309 | 454.63 | < 0.0001 | Significant |
| pH (A) | 0.469 | 1 | 0.470 | 40.24 | < 0.0001 | |
| Fe2+(B) | 7.691 | 1 | 7.691 | 658.55 | < 0.0001 | |
| H2O2 (C) | 0.049 | 1 | 0.049 | 4.16 | 0.0607 | |
| MO (D) | 0.006 | 1 | 0.007 | 0.57 | 0.4630 | |
| SDS (E) | 1.187 | 1 | 1.187 | 101.63 | < 0.0001 | |
| AB | 2.492 | 1 | 2.492 | 213.41 | < 0.0001 | |
| AC | 0.154 | 1 | 0.153 | 13.13 | 0.0028 | |
| AD | 0.252 | 1 | 0.252 | 21.60 | 0.0004 | |
| AE | 0.138 | 1 | 0.138 | 11.84 | 0.0040 | |
| BC | 0.707 | 1 | 0.707 | 60.59 | < 0.0001 | |
| BD | 0.847 | 1 | 0.847 | 72.54 | < 0.0001 | |
| BE | 0.368 | 1 | 0.367 | 31.50 | < 0.0001 | |
| CD | 0.002 | 1 | 0.002 | 0.22 | 0.6455 | |
| CE | 0.029 | 1 | 0.029 | 2.47 | 0.1385 | |
| DE | 0.714 | 1 | 0.714 | 61.14 | < 0.0001 | |
| A^2 | 5.658 | 1 | 5.658 | 484.48 | < 0.0001 | |
| B^2 | 5.556 | 1 | 5.556 | 475.78 | < 0.0001 | |
| C^2 | 0.001 | 1 | 0.001 | 0.09 | 0.7668 | |
| D^2 | 0.007 | 1 | 0.007 | 0.63 | 0.4394 | |
| E^2 | 0.035 | 1 | 0.035 | 3.04 | 0.1033 | |
| Residual | 0.1635 | 14 | 0.0117 | |||
| Lack of Fit | 0.06391736 | 8 | 0.00798967 | 0.48139 | 0.8331 | not significant |
Table 3.
Values of the factors that allowed a maximum range of percentage of degradation efficiency.
Table 3.
Values of the factors that allowed a maximum range of percentage of degradation efficiency.
| Variable | Factor |
Maximum % degradation efficiency range |
| A | pH | 2.46 to 3.03 |
| B | Fe2+ | (0.33 to 1.43) mM |
| C | H2O2 | (9.42 to 298) mM |
| E | SDS | (11.9 to 69.3) mM |
Table 4.
Pseudo first-order rate constants and degradation percentages achieved after 5 minutes of reaction for each dye studied in the different media.
Table 4.
Pseudo first-order rate constants and degradation percentages achieved after 5 minutes of reaction for each dye studied in the different media.
| Medium | H2O | SDS micelles | ||||
| Dyes | MO | MR | CR | MO | MR | CR |
| Degradation Efficiency (%) | 91.7 ± 1.3 | 94.2 ± 1.3 | 72.7 ± 1.1 | 98.4 ± 1.5 | 81.9 ± 1.2 | 94.7 ± 1.4 |
| kap (x 102) min-1 | 37.4 ± 0.9 | 12.7 ± 0.3 | 41.2 ± 0.6 | 115.4 ± 2.9 | 8.4 ± 0.1 | 29.8 ± 1.1 |
Disclaimer/Publisher’s Note: The statements, opinions and data contained in all publications are solely those of the individual author(s) and contributor(s) and not of MDPI and/or the editor(s). MDPI and/or the editor(s) disclaim responsibility for any injury to people or property resulting from any ideas, methods, instructions or products referred to in the content. |
© 2026 by the authors. Licensee MDPI, Basel, Switzerland. This article is an open access article distributed under the terms and conditions of the Creative Commons Attribution (CC BY) license (http://creativecommons.org/licenses/by/4.0/).
Copyright: This open access article is published under a Creative Commons CC BY 4.0 license, which permit the free download, distribution, and reuse, provided that the author and preprint are cited in any reuse.


