Submitted:
11 June 2026
Posted:
11 June 2026
You are already at the latest version
Abstract
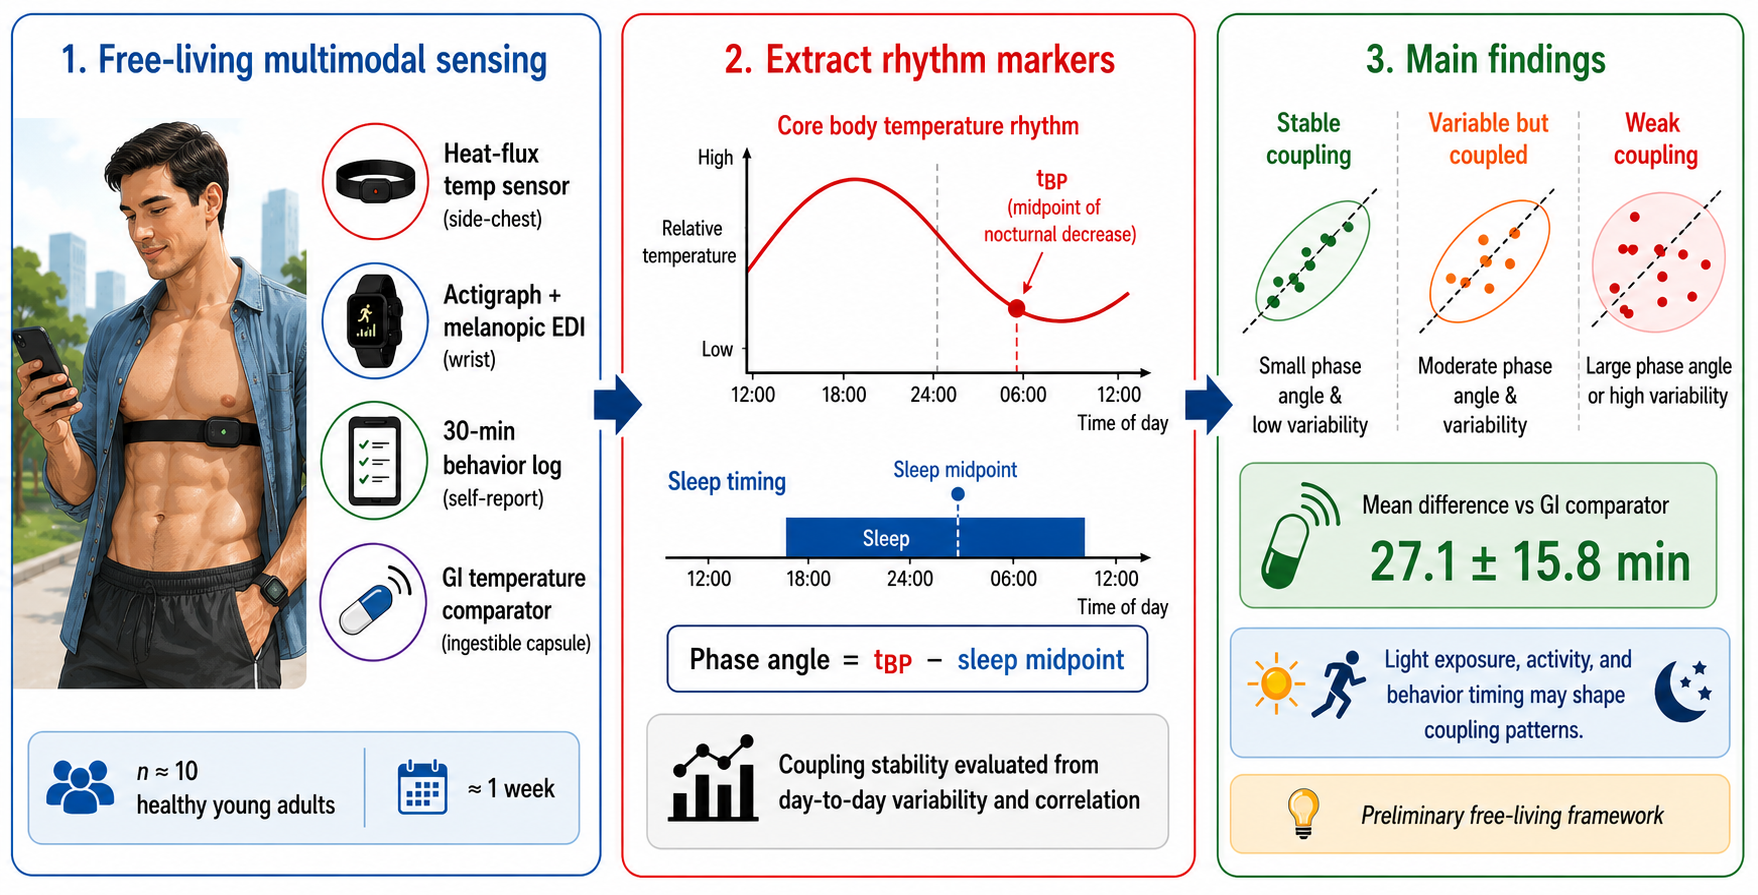
Circadian–behavioral misalignment, defined as a mismatch between internal circadian timing and daily sleep–activity behavior, is associated with sleep quality, daytime function, cognitive performance, and long-term health risks. However, practical approaches for integrating circadian-phase-related physiological markers with daily behavioral and environmental sensing under free-living conditions remain limited. This study presents a multimodal wearable and lifelog monitoring workflow that combines a heat-flux-based wearable temperature-estimation sensor, a wrist-worn actigraph, melanopic equivalent daylight illuminance (EDI) measurement, and 30-min web-based lifelog entries. Ten healthy young adults were monitored for approximately one week in daily life. The midpoint of the nocturnal temperature decline was extracted as a circadian-phase-related temperature rhythm marker, and midsleep time was extracted as a behavioral rhythm marker. In a practical comparison with gastrointestinal temperature measured using an ingestible capsule, the wearable-derived marker showed a mean difference of 27.1 ± 15.8 min. The temporal difference between the two markers was defined as the phase angle, and circadian–behavioral coupling stability was evaluated using phase-angle variability and the correlation between the markers. After excluding one participant who traveled overseas, silhouette analysis supported a two-cluster solution, whereas exploratory principal component and three-pattern interpretations suggested high-variability coupled, low-correlation/weak-coupling, and main coupled patterns. Integrated analysis with melanopic EDI, activity, and lifelog-derived features indicated that light exposure, activity timing, and behavioral timing provide contextual information for interpreting coupling patterns. These results demonstrate the feasibility of multimodal wearable and lifelog data integration for assessing circadian–behavioral coupling in free-living conditions.
Keywords:
actigraphy
; circadian rhythm
; core body temperature
; free-living monitoring
; heat-flux sensors
; liflog
; melanopic EDI
; wearable sensors
1. Introduction
Human physiological functions are temporally regulated by circadian rhythms with an approximately 24-h periodicity [1,2]. Circadian rhythms are involved in sleep-wake behavior, core body temperature, hormone secretion, metabolism, cognitive function, and other physiological processes, and they are maintained through entrainment between the endogenous biological clock and the external environment [2,3,4]. In modern society, shift work, socially constrained schedules, artificial light exposure at night, electronic media use before bedtime, and irregular eating and activity schedules can generate mismatches between endogenous circadian rhythms and daily behavioral rhythms [2,5,6,7]. Figure 1 illustrates a typical example of circadian-behavioral misalignment. Such misalignment has been associated with poor sleep quality, daytime sleepiness, impaired attention and cognitive performance, mood disturbance, and long-term metabolic and cardiovascular health risks [2,5,8,9].
Rhythm assessment under free-living conditions has traditionally relied mainly on actigraphy for long-term monitoring of sleep-wake patterns and physical activity [10,11,12]. Actigraphy is noninvasive and suitable for daily-life use, and it is useful for estimating sleep periods and activity rhythms. However, actigraphy mainly reflects behavioral rhythms and does not directly provide the endogenous circadian phase. Therefore, sleep timing may appear regular while its phase relationship with the internal circadian rhythm is unstable, or conversely, variable sleep timing may still maintain a stable relation to circadian phase. A method that simultaneously measures circadian-phase-related physiological signals and daily behavioral rhythms is therefore needed to visualize and quantify their coupling under free-living conditions.
Core body temperature has been widely used as a physiological indicator of circadian phase [3,13,14]. It typically shows a clear daily rhythm, with higher values in the evening and before bedtime, a decline during sleep, and a minimum in the early morning or around wake time. The phase and amplitude of this rhythm are important markers for circadian assessment [3,14,15]. Strict assessment of core body temperature has used measurement sites close to central circulation, such as esophageal, pulmonary artery, rectal, or bladder temperature. These approaches are limited for repeated long-term daily-life monitoring because of invasiveness, measurement burden, and restrictions on measurement duration [14,16,17]. Ingestible temperature capsules are practical for free-living studies, but their values are affected by gastrointestinal location, transit time, food and fluid intake, local intestinal conditions, and temporal response; therefore, they should not be treated as an absolute gold-standard reference for true core body temperature [16,17,21].
Recent developments in heat-flux-based patch sensors and wearable core-temperature-estimation sensors have expanded the possibility of noninvasive monitoring of core-temperature-related rhythms under free-living conditions [17]. However, existing studies on noninvasive core temperature estimation have mostly focused on sensor-level agreement during heat stress, exercise, or laboratory protocols, and errors may increase with changes in activity intensity, environmental conditions, and attachment state [22,23,24,25,26,27,28,29]. Thus, simply measuring temperature with a commercial sensor provides limited novelty. The novelty of the present study is not a claim of standalone sensor performance; rather, it lies in integrating heat-flux-based temperature estimation, actigraphy, melanopic EDI, and 30-min lifelog entries on a common time axis to visualize and quantify within-person coupling between a circadian-phase-related marker and behavioral timing.
The aim of this study was to develop and evaluate a multimodal wearable and lifelog monitoring workflow for assessing circadian–behavioral coupling under free-living conditions. The workflow integrates a heat-flux-based wearable temperature-estimation sensor, a wrist-worn actigraph, melanopic EDI measurement, and 30-min web-based lifelog entries on a common time axis. The midpoint of the nocturnal temperature decline was used as a circadian-phase-related temperature rhythm marker, and midsleep time was used as a behavioral rhythm marker. Their temporal difference was defined as the phase angle, and coupling stability was evaluated using day-to-day phase-angle variability and the correlation between the two rhythm markers.
The contributions of this study are threefold. First, we implemented a practical multimodal data integration workflow for synchronizing wearable temperature, activity, light exposure, and lifelog data collected in daily life. Second, we compared the wearable-derived temperature rhythm marker with the corresponding marker derived from gastrointestinal temperature measured using an ingestible capsule, treating the latter as a practical comparator rather than an absolute gold standard. Third, we demonstrated how multimodal features, including melanopic EDI, physical activity, and lifelog-derived behavioral timing, can provide contextual information for interpreting individual differences in circadian–behavioral coupling. This study therefore provides a practical sensing framework for daily-life assessment of the temporal relationship between circadian-related temperature rhythms and behavioral rhythms.
2. Wearable System and Rhythm Definitions
2.1. Wearable System
The developed wearable system is shown in Figure 2. The system consists of a heat-flux-based wearable core-temperature-estimation sensor (CALERA Research, greenTEG) for recording temperature rhythms related to circadian rhythms, a wrist-worn actigraph (ActLumus, Condor Instruments) for recording behavioral rhythms, and a web application for lifelog recording. The wearable temperature-estimation sensor was attached to the lateral chest using the supplied chest strap and outputs a core-temperature-related estimate based on local skin temperature and heat flux. In this study, the sensor was worn at the manufacturer-recommended position. In real-life use, however, the attachment site, strap tightness, skin contact pressure, sweating, clothing, bedding, and the local thermal microenvironment may influence the estimated values. The wrist-worn actigraph recorded physical activity, melanopic equivalent daylight illuminance (melanopic EDI), and ambient temperature. The web application was accessible from participants’ own mobile devices and was used to record sleep, meals, bathing, and other daily behaviors in 30-min increments.
2.2. Extraction of Circadian Rhythm Features
The system analyzes the temperature rhythm from the core-body-temperature-related estimate, denoted as TCB, obtained from the wearable temperature-estimation sensor. As a circadian-phase-related marker, the midpoint of the nocturnal decrease in core body temperature or its approximation (tBP) was used [18,19]. As shown in Figure 3, TCB(t) denotes the temperature at time t. For each measurement day, the maximum and minimum values within one cycle, TCB,max and TCB,min, were identified, and TCB,mid was calculated as:
The time at which the temperature decreased from TCB,max and reached TCB,mid was defined as tCB,down, and the time at which the temperature increased from TCB,min and reached TCB,mid was defined as tCB,up:
2.3. Extraction of Daily Behavioral Rhythm Features
Midsleep time (tsleep,mid) was used as the behavioral rhythm feature corresponding to the circadian rhythm marker. It was calculated using sleep onset time (tsleep,onset) and sleep offset time (tsleep,offset):
Sleep onset and offset were estimated from wrist actigraphy using the Cole-Kripke algorithm [20].
2.4. Operational Definition of Circadian-Behavioral Coupling
In this study, circadian-behavioral coupling was operationally defined as the temporal relationship between the circadian-phase-related marker tBP and the behavioral marker tsleep,mid. The daily phase angle was calculated as tBP minus tsleep,mid. For each participant, the standard deviation of the phase angle was used as an index of coupling stability, with lower values interpreted as more stable phase relationships between temperature and behavioral rhythms. The correlation coefficient between tBP and tsleep,mid was also calculated as an index of the extent to which the two rhythm markers varied in the same direction.
3. Experimental Methods
3.1. Participants
Ten healthy young adults voluntarily participated in this study (eight men and two women; age, 23.1 ± 1.2 years). All participants received a detailed explanation of the experimental procedures and potential risks and provided written informed consent before participation. All experimental procedures and protocols conformed to the Declaration of Helsinki and were approved by the Ethics Review Committee of Tokyo Institute of Science (approval number: 2025160). Measurements were conducted from October 2025 to March 2026.
3.2. Experimental Protocols
Temperature and behavioral rhythms were measured during approximately one week of daily life, except during bathing. The wearable temperature-estimation sensor and actigraph recorded the variables described in Section II at 1-min intervals. Participants entered daily behavior logs through the web application every 30 min. In addition, as a practical comparator under free-living conditions, an ingestible thermometer (e-Celsius Performance Pill, BodyCAP) was swallowed with water before measurement, and gastrointestinal temperature was recorded at 1-min intervals until the capsule was excreted [14]. In this study, gastrointestinal temperature was treated as a practical comparator for the wearable-derived temperature rhythm marker, not as an absolute reference standard for true core body temperature.
3.3. Data Analysis
The preprocessing pipeline was as follows. First, timestamps from the wearable temperature-estimation sensor, ingestible capsule, actigraph, and lifelog were synchronized. Next, bathing periods, obvious nonwear periods, missing device data, and blank data sections were excluded. Temperature data from the wearable sensor and the ingestible capsule were resampled to 10-min averages to reduce noise and then smoothed using a moving average over 30 min before and after the center time. For the ingestible capsule, only data obtained more than 6 h after ingestion were used to reduce acute effects of water and food intake [15,16]. This criterion reduces acute ingestion-related disturbances but does not eliminate variation caused by capsule location or gastrointestinal transit.
The nocturnal temperature-decline midpoint tBP was calculated from the preprocessed wearable temperature data using (1)-(4). Midsleep time tsleep,mid was calculated from sleep periods detected by the Cole-Kripke algorithm applied to actigraphy data using (5) [20]. Agreement of tBP was evaluated as the difference between tBP derived from the wearable temperature-estimation sensor and tBP derived from the ingestible capsule.
This study primarily performed exploratory analyses based on daily or participant-level features. Conventional Bland-Altman analysis treating 1-min repeated measurements as independent observations and time-resolved error modeling during state transitions were not performed. The findings should therefore be interpreted as preliminary evidence regarding practical agreement of temperature rhythm features and visualization of coupling patterns, not as a detailed identification of time-resolved error mechanisms.
Subject 1 was excluded from the main analysis because the measurement period included overseas travel and was considered a special case reflecting re-entrainment after time-zone exposure. For the remaining participants, daily tsleep,mid, tBP, and the phase angle (tBP - tsleep,mid) were calculated. Hierarchical clustering using Ward’s method was performed after standardization of circular standard deviation of tsleep,mid, circular standard deviation of tBP, standard deviation of the phase angle, mean absolute day-to-day change in tsleep,mid, mean absolute day-to-day change in tBP, and the correlation coefficient between tsleep,mid and tBP.
To explore the relationship between circadian-behavioral coupling features and living-environment or behavioral features, an integrated principal component analysis (PCA) was performed with additional melanopic EDI, activity, and lifelog-derived features. Melanopic EDI features included mean melanopic EDI during the 3 h before sleep, daily exposure time to melanopic EDI of at least 250 lx, and the percentage of sleep time during which illuminance remained below 10 lx. Activity features included the mean daily total proportional integration mode (PIM) and day-to-day variability in PIM-weighted activity center time. Lifelog-derived features included variability in the timing of major daily behaviors and duration of blue-light-related behavior between 18:00 and 24:00. These features were added to the circadian-behavioral coupling features, standardized, and analyzed using PCA. The integrated PCA was used to explore whether the participant arrangement derived from coupling features was preserved after adding multimodal contextual features; it was not used to determine the number of clusters.
All sensor and lifelog data streams were converted to a common time axis before feature extraction. This preprocessing step was essential for relating temperature rhythm markers, sleep–activity timing, melanopic light exposure, and self-reported daily behaviors at the participant level. The analysis was designed to evaluate rhythm-level features rather than minute-by-minute sensor agreement, and the resulting features were therefore summarized at the daily or participant level.
4. Results
4.1. Agreement of Circadian Estimation
Figure S1 shows the temperatures recorded by the wearable temperature-estimation sensor and ingestible capsule for each participant, together with sleep periods detected by the wrist-worn actigraph. The data length of the ingestible capsule varied among participants (mean ± SD, 24.8 ± 12.6 h), reflecting individual differences in the time until capsule excretion [21]. Therefore, the relative contributions of sleep and daytime activity periods differed across participants, which may have affected the comparison of tBP.
Table I compares tBP values calculated from the wearable sensor and ingestible capsule temperature data. The mean difference between wearable-derived tBP and capsule-derived tBP was 27.1 ± 15.8 min. Wearable-derived tBP was significantly delayed compared with capsule-derived tBP (p < 0.05). Because this difference may include not only wearable sensor estimation error but also changes in gastrointestinal measurement site, temporal response, local thermal conditions, and attachment state, it should be interpreted as agreement between temperature rhythm markers derived from the two methods, not as absolute error relative to true core body temperature.
4.2. Visualization of Rhythm Interaction
Figure 4 shows the day-by-day correspondence between the two rhythm markers, tBP and tsleep,mid, for each participant. In most participants, tBP and tsleep,mid were concentrated in the morning hours, whereas Sub 1, who had overseas travel during the measurement period, showed larger dispersion than the other participants. This visualization enables an intuitive understanding of the relationship between the two rhythms for each individual.
Figure 5 shows representative time-series data for Sub 4, Sub 7, and Sub 8, including core-temperature-related estimates, activity, melanopic EDI, lifelog entries, and the daily relationship between tBP and tsleep,mid. Sub 4 represents a relatively stable relationship with small variability in both markers. Sub 7 represents a case in which both tBP and tsleep,mid varied substantially but moved together. Sub 8 represents a case in which the two markers tended not to move in the same direction. Time-series data for all participants are shown in Figures S1 and S2.
4.3. Quantification of Coupling Stability
For the nine participants excluding Sub 1, representative circadian–behavioral coupling features and corrected cluster assignments are summarized in Table II. The complete set of coupling features, including day-to-day changes in tBP and tsleep,mid, is provided in Table S1. Table II shows clear interindividual differences in both rhythm variability and coupling stability. Sub 7 showed relatively large circular standard deviations of both tBP and tsleep,mid but also showed a high correlation between the two markers, indicating that both rhythm markers varied substantially but tended to move together. In contrast, Sub 2 and Sub 8 showed negative correlations between tBP and tsleep,mid, suggesting that the two markers did not shift in the same direction. These representative features provided the basis for the subsequent clustering and PCA-based visualization of participant-level coupling patterns.
Hierarchical clustering was performed using the standardized circadian–behavioral coupling features after excluding Sub 1, who experienced overseas travel during the measurement period. The Ward dendrogram and silhouette analysis are shown in Figure 6. The silhouette coefficient was highest for k = 2, indicating that a two-cluster solution was the most parsimonious structure in this small dataset. In this solution, Sub 7 was separated from the remaining participants, reflecting its large day-to-day variability in both tBP and tsleep,mid. Because the present study was exploratory and involved a limited number of participants, the clustering results were used primarily to visualize relative individual differences rather than to establish definitive participant subtypes.
An exploratory three-pattern interpretation was also examined to better understand the structure observed in Table II, the dendrogram, and the feature space. In this interpretation, Sub 7 represented a high-variability coupled pattern, characterized by large variability in both rhythm markers but a high correlation between tBP and tsleep,mid. Sub 2 and Sub 8 represented a low-correlation/weak-coupling pattern, characterized by low or negative correlations between the two markers. The remaining participants formed a main coupled pattern with relatively stable phase relationships. This three-pattern interpretation should be regarded as hypothesis-generating and not as a statistically confirmed classification.
Figure 7 shows the PCA based only on circadian–behavioral coupling features. The PCA loadings for this coupling-feature PCA are provided in Table S2. PC1 had positive loadings for circular SD of tsleep,mid, circular SD of tBP, and day-to-day changes in both rhythm markers, indicating that PC1 mainly reflected overall day-to-day variability in sleep and temperature rhythm timing. PC2 had a positive loading for phase-angle variability and a negative loading for the correlation coefficient between tBP and tsleep,mid, indicating that PC2 mainly reflected coupling instability or decoupling between the two markers. The relative arrangement of participants in the PCA space was broadly consistent with the exploratory interpretation based on Table II and Figure 6, suggesting that the selected coupling features captured meaningful interindividual differences in the temporal relationship between temperature and behavioral rhythm markers.
Figure 8 shows the integrated PCA that combined circadian–behavioral coupling features with melanopic EDI, activity, and lifelog-derived behavioral features. The definitions and calculation methods of the additional multimodal features are provided in Table S3. These features included pre-sleep melanopic EDI, daily exposure duration to melanopic EDI of at least 250 lx, the percentage of sleep time under melanopic EDI of 10 lx or lower, day-to-day variability in activity midpoint, mean daily physical activity, timing variability of major daily behaviors, and evening blue-light-related behavior recorded in the lifelog. The PCA loadings for the integrated multimodal PCA are provided in Table S4.
In the integrated PCA, PC1 was interpreted as an axis separating participants with relatively preserved coupling from those showing coupling instability accompanied by differences in light exposure, activity timing, and behavioral timing. PC2 reflected a contrast between variability in sleep, temperature, and behavioral timing and sleep-time low-light conditions. The participant arrangement in the integrated PCA was generally similar to that obtained from coupling features alone. This result suggests that the coupling features captured the dominant participant-level structure in this dataset, while the added light, activity, and lifelog features provided contextual information for interpreting the observed coupling patterns. Therefore, the integrated PCA was used as an exploratory visualization of multimodal feature space rather than as confirmatory cluster validation.
5. Discussion
This study demonstrated the feasibility of a multimodal wearable and lifelog monitoring workflow for assessing circadian–behavioral coupling under free-living conditions. The workflow integrated a heat-flux-based wearable temperature-estimation sensor, a wrist-worn actigraph, melanopic EDI measurement, and 30-min web-based lifelog entries on a common time axis. The main contribution of this study is not the validation of a single sensor alone, but the integration of temperature rhythm estimation, sleep–activity monitoring, light exposure measurement, and self-reported daily behavior to evaluate the temporal relationship between a circadian-phase-related temperature rhythm marker and a behavioral rhythm marker in daily life.
The wearable-derived temperature rhythm marker tBP differed from gastrointestinal-temperature-derived tBP by 27.1 ± 15.8 min on average. Ingestible gastrointestinal temperature is useful as a practical comparator in free-living studies, but it should not be regarded as an absolute gold-standard reference for true core body temperature. Its values may be influenced by capsule location, gastrointestinal transit, food and fluid intake, local intestinal conditions, and temporal response. Therefore, the observed difference should be interpreted as agreement between wearable-derived and gastrointestinal-temperature-derived rhythm markers rather than as an absolute error of the wearable temperature-estimation sensor relative to true core body temperature. Nevertheless, the wearable sensor has practical advantages because it is noninvasive and can continuously record temperature-related rhythms over several days in daily life.
In this study, tBP was used as the circadian-side marker and midsleep time was used as the behavioral-side marker. Their temporal difference was defined as the phase angle, and the standard deviation of the phase angle was used as an index of coupling stability. This approach extends conventional actigraphy-based rhythm assessment by evaluating not only the regularity of sleep timing itself but also how sleep timing is positioned relative to a circadian-phase-related temperature rhythm. In free-living conditions, two individuals may show similar variability in sleep timing but different degrees of alignment with their temperature rhythm. Therefore, combining temperature-derived and behavior-derived rhythm markers may provide additional information that cannot be obtained from activity monitoring alone.
Sub 1 was excluded from the main clustering analysis because the measurement period included overseas travel and was considered a special case reflecting re-entrainment after time-zone exposure. For Sub 2–Sub 10, silhouette analysis supported k = 2 as the most parsimonious clustering solution. In this solution, Sub 7 was separated from the remaining participants, reflecting its large day-to-day variability in both tBP and tsleep,mid. The exploratory k = 3 solution was not statistically established as the optimal number of clusters; rather, it was used to aid interpretation of heterogeneity within this small dataset. Sub 7 showed large variability in both rhythm markers while maintaining a high correlation between them, suggesting a high-variability but coupled pattern. Sub 2 and Sub 8 showed low or negative correlations, suggesting a low-correlation or weak-coupling pattern. The remaining participants showed relatively stable phase relationships. These patterns should not be interpreted as definitive phenotypes or clinical subtypes, but as hypothesis-generating descriptions of individual differences in sleep–temperature rhythm coupling.
The PCA based only on coupling features supported this cautious interpretation. PC1 mainly reflected overall day-to-day variability in tBP and tsleep,mid, whereas PC2 reflected coupling instability characterized by increased phase-angle variability and reduced correlation between the two markers. Thus, PCA provided a compact visualization of how rhythm variability and coupling stability contributed to participant-level differences. Importantly, PCA was used to visualize relative positions in feature space, not to confirm the existence of fixed participant categories.
The integrated PCA that added melanopic EDI, PIM-based activity, and lifelog-derived features showed a participant arrangement generally consistent with the PCA based only on coupling features. This does not mean that the additional multimodal features were uninformative. Rather, the coupling features appeared to capture the dominant interindividual structure in this dataset, whereas light exposure, activity timing, and behavioral timing provided contextual information for interpreting that structure. For example, differences in pre-sleep melanopic EDI, daily exposure to high melanopic EDI, activity timing variability, and evening blue-light-related behavior may help explain why similar coupling patterns arise under different daily-life contexts. From a sensing perspective, these results support the value of integrating physiological, behavioral, environmental, and self-reported data streams when assessing circadian–behavioral relationships in free-living conditions.
The proposed workflow may be useful for future studies on personalized circadian health monitoring. Actigraphy alone can describe sleep–activity patterns, but it cannot directly evaluate the temporal relationship between behavioral timing and a circadian-phase-related physiological marker. By combining wearable temperature estimation, actigraphy, melanopic light exposure, and lifelog data, the proposed approach provides a practical way to visualize how daily behaviors are temporally related to temperature rhythms. Such information may be useful for identifying individuals with unstable coupling, weak coupling, or large but synchronized shifts between sleep and temperature rhythms. In the future, this type of multimodal monitoring may support individualized feedback on sleep timing, light exposure, activity timing, and daily behavior.
This study has several limitations. First, this was a feasibility and exploratory study with a small sample size. Ten participants were included, and the main clustering and PCA analyses were performed in nine participants after excluding one participant who experienced overseas travel. Therefore, the clustering and PCA results should be interpreted as exploratory visualizations of individual differences rather than as definitive evidence for reproducible phenotypes. Second, gastrointestinal temperature measured by an ingestible capsule was used as a practical comparator for the wearable-derived temperature rhythm marker, not as an absolute reference standard for true core body temperature. Capsule location, gastrointestinal transit, food and fluid intake, local intestinal environment, and temporal response may have influenced the measured temperature. Third, although only data obtained more than 6 h after ingestion were analyzed to reduce acute ingestion-related disturbances, this criterion does not eliminate all sources of variation related to capsule transit or gastrointestinal conditions. Fourth, the participants were young adults, mostly male, and were measured within a limited seasonal window; therefore, generalizability to older adults, shift workers, athletes, or patients with sleep and circadian rhythm disorders remains untested. Fifth, lifelog data depended on self-entry through a web application and may have been affected by missing entries or input errors. Finally, this study mainly used daily or participant-level rhythm features and did not perform detailed time-resolved error modeling of the wearable temperature-estimation sensor under different activity, posture, environmental, or behavioral states. Future studies should include larger and more diverse cohorts, longer measurement periods, repeated-measures modeling, and state-dependent sensor error analyses to evaluate the robustness and applicability of the proposed multimodal monitoring workflow.
6. Conclusion
This study presented a multimodal wearable and lifelog monitoring workflow for assessing circadian–behavioral coupling under free-living conditions. The workflow integrated a heat-flux-based wearable temperature-estimation sensor, a wrist-worn actigraph, melanopic EDI measurement, and 30-min web-based lifelog entries on a common time axis. The midpoint of the nocturnal temperature decline was extracted as a circadian-phase-related temperature rhythm marker, and midsleep time was extracted as a behavioral rhythm marker. Their temporal difference was defined as the phase angle, and coupling stability was evaluated using phase-angle variability and the correlation between the two markers.
The wearable-derived temperature rhythm marker showed a mean difference of 27.1 ± 15.8 min compared with the corresponding marker derived from gastrointestinal temperature measured using an ingestible capsule. After excluding one participant who experienced overseas travel, clustering and PCA of the remaining participants suggested meaningful interindividual differences in sleep–temperature rhythm coupling. Although silhouette analysis supported a two-cluster solution, an exploratory three-pattern interpretation provided physiologically interpretable descriptions of high-variability coupled, low-correlation/weak-coupling, and main coupled patterns. These patterns should be interpreted as hypothesis-generating rather than definitive phenotypes.
Integrated analysis with melanopic EDI, activity, and lifelog-derived features indicated that light exposure, activity timing, and behavioral timing provide useful contextual information for interpreting circadian–behavioral coupling patterns. Overall, the findings demonstrate the feasibility of integrating wearable physiological sensing, activity and light monitoring, and self-reported daily behavior to visualize the temporal relationship between circadian-related temperature rhythms and behavioral rhythms in daily life. Future studies with larger and more diverse populations are needed to validate the proposed workflow and to evaluate its potential for personalized circadian health monitoring.
Supplementary Materials
The following supporting information can be downloaded at the website of this paper posted on Preprints.org.
Author Contributions
Conceptualization, Y.H.; methodology, Y.H.; software, S.M. and Y.H.; validation, S.M. and Y.H.; formal analysis, S.M. and Y.H.; investigation, S.M. and Y.H.; resources, Y.H. and Y.N.; data curation, S.M. and Y.H.; writing—original draft preparation, S.M. and Y.H.; writing—review and editing, S.M., Y.H. and Y.N.; visualization, S.M. and Y.H.; supervision, Y.H. and Y.N.; project administration, Y.H.; funding acquisition, Y.H. All authors have read and agreed to the published version of the manuscript.
Funding
This work was partially supported by JSPS KAKENHI Grant Number JP26K00467, the Asahi Glass Foundation, and the Cainz Digital Innovation Foundation.
Institutional Review Board Statement
This work involved human subjects in its research. Approval of all ethical and experimental procedure and protocols was granted by the Human Subject Research Ethics Review Committee of the Institute of Science Tokyo under Application No. 2025160 and performed in line with the Declaration of Helsinki.
Informed Consent Statement
Informed consent was obtained from all subjects involved in the study.
Data Availability Statement
The data are not publicly available because they contain potentially identifiable information from human participants, including free-living physiological time-series data and daily activity/sleep patterns. Data sharing is restricted by ethical and privacy considerations related to the informed consent obtained from participants.
Acknowledgments
The authors are grateful to the colleagues for their essential contributions to the work.
Conflicts of Interest
The authors declare no conflict of interest.
References
- Vitaterna, M.H.; Takahashi, J.S.; Turek, F.W. Overview of Circadian Rhythms. Alcohol Res. Health 2001, 25, 85–93. [Google Scholar] [PubMed]
- Fishbein, A.B.; Knutson, K.L.; Zee, P.C. Circadian disruption and human health. J. Clin. Invest. 2021, 131, e148286. [Google Scholar] [CrossRef]
- Steele, T.A.; Louis, E.K.S.; Videnovic, A.; Auger, R.R. Circadian Rhythm Sleep–Wake Disorders: A Contemporary Review of Neurobiology, Treatment, and Dysregulation in Neurodegenerative Disease. Neurotherapeutics 2021, 18, 53–74. [Google Scholar] [CrossRef]
- Mizuno, K.O.; Mizuno, K. Effects of thermal environment on sleep and circadian rhythm. J. Physiol. Anthropol. 2012, 31, 14. [Google Scholar] [CrossRef]
- Baron, K.G.; Reid, K.J. Circadian misalignment and health. Int. Rev. Psychiatry 2014, 26. [Google Scholar] [CrossRef]
- Caliandro, R.; Streng, A.A.; van Kerkhof, L.W.M.; van der Horst, G.T.J.; Chaves, I. Social Jetlag and Related Risks for Human Health: A Timely Review. Nutrients 2021, 13, 4543. [Google Scholar] [CrossRef] [PubMed]
- Zhong, C.; Masters, M.; Donzella, S.M.; Diver, W.R.; Patel, A.V. Electronic Screen Use and Sleep Duration and Timing in Adults. JAMA Netw. Open. 2025, 8, e252493. [Google Scholar] [CrossRef]
- Boivin, D.B.; Boudreau, P.; Kosmadopoulos, A. Disturbance of the Circadian System in Shift Work and Its Health Impact. J. Biol. Rhythm. 37, 3–28. [CrossRef]
- Tan, C.; Sato, K.; Shiotani, H. The relationship between social jetlag and subjective sleep quality: Differences in young and middle-aged workers. Sleep Biol. Rhythm. 2022, 21, 7–12. [Google Scholar] [CrossRef]
- Smith, M.T.; McCrae, C.S.; Cheung, J.; Martin, J.L.; Harrod, C.G.; Heald, J.L.; Carden, K.A. Use of Actigraphy for the Evaluation of Sleep Disorders and Circadian Rhythm Sleep-Wake Disorders: An American Academy of Sleep Medicine Systematic Review, Meta-Analysis, and GRADE Assessment. 2018, 14, 1209–1230. [Google Scholar] [CrossRef] [PubMed]
- Shah, V.V.; Brumbach, B.H.; Pearson, S.; Vasilyev, P.; King, E.; Kuhta, P.C.; Mancini, M.; Horak, F.B.; Sowalsky, K.; McNames, J.; El-Gohary, M. Opal Actigraphy (Activity and Sleep) Measures Compared to ActiGraph: A Validation Study. Sensors 2023, 23, 2296. [Google Scholar] [CrossRef]
- Rentz, L.E.; Ulman, H.K.; Galster, S.M. Deconstructing Commercial Wearable Technology: Contributions toward Accurate and Free-Living Monitoring of Sleep. Sensors 2021, 21, 5071. [Google Scholar] [CrossRef] [PubMed]
- Togo, F.; Aizawa, S.; Arai, J.; Yoshikawa, S.; Ishiwata, T.; Shephard, R.J.; Aoyagi, Y. Influence on Human Sleep Patterns of Lowering and Delaying the Minimum Core Body Temperature by Slow Changes in the Thermal Environment. Sleep 2007, 30, 797–802. [Google Scholar] [CrossRef]
- Waterhouse, J.; Drust, B.; Weinert, D.; Edwards, B.; Gregson, W.; Atkinson, G.; Kao, S.; Aizawa, S.; Reilly, T. The circadian rhythm of core temperature: Origin and some implications for exercise performance. Chronobiol. Int. 2009, 22, 207–225. [Google Scholar] [CrossRef] [PubMed]
- Bigalke, J.A.; Cleveland, E.L.; Barkstrom, E.; Gonzales, J.E.; Carter, J.R. Core body temperature changes before sleep are associated with nocturnal heart rate variability. 2023, 135, 136–145. [Google Scholar] [CrossRef]
- Byrne, C.; Lim, C.L. The ingestible telemetric body core temperature sensor: A review of validity and exercise applications. Br. J. Sports Med. 2007, 41, 126–133. [Google Scholar] [CrossRef]
- Hashimoto, Y. A Comprehensive Review of Non-Invasive Core Body Temperature Measurement Techniques. 2026, 26, 972. [Google Scholar] [CrossRef]
- Endo, T.; Honma, S.; Hashimoto, S.; Honma, K. After-Effect of Entrainment on the Period of Human Circadian System. Jpn. J. Physiol. 1999, 49, 425–430. [Google Scholar] [CrossRef] [PubMed]
- Hashimoto, S.; Nakamura, K.; Honma, S.; Tokura, H.; Honma, K. Melatonin rhythm is not shifted by lights that suppress nocturnal melatonin in humans under entrainment. Am. J. Physiol. 1996, 270, R1073–R1077. [Google Scholar] [CrossRef]
- Cole, R.J.; Kripke, D.F.; Gruen, W.; Mullaney, D.J.; Gillin, J.C. Automatic Sleep/Wake Identification From Wrist Activity. Sleep 1992, 15, 461–469. [Google Scholar] [CrossRef]
- Monnard, C.R.; Fares, E.-J.; Calonne, J.; Miles-Chan, J.L.; Montani, J.-P.; Durrer, D.; Schutz, Y.; Dulloo, A.G. Issues in continuous 24-h core body temperature monitoring in humans using an ingestible capsule telemetric sensor. Front. Endocrinol. 2017, 8, 130. [Google Scholar] [CrossRef]
- Kimura, S.; Takaoka, Y.; Toyoura, M.; Kohira, S.; Ohta, M. Core body temperature changes in school-age children with circadian rhythm sleep–wake disorder. Sleep Med. 2021, 87, 97–104. [Google Scholar] [CrossRef] [PubMed]
- Dolson, C.M.; Harlow, M.T.; Phelan, D.T.; Gabbett, R.M.; Baker, Z.G. Wearable Sensor Technology to Predict Core Body Temperature: A Systematic Review. Sensors 2022, 22, 7639. [Google Scholar] [CrossRef]
- Buller, M.J.; Tharion, W.J.; Cheuvront, S.N.; Montain, S.J.; Kenefick, R.W.; Castellani, J.; Latzka, W.A.; Santee, W.; Kolka, M.; Moran, L.A.L.; Hoyt, R.W. Estimation of human core temperature from sequential heart rate observations. Physiol. Meas. 2013, 34, 781–798. [Google Scholar] [CrossRef]
- Verdel, N.; Podlogar, T.; Ciuha, U.; Holmberg, H.-C.; Debevec, T.; Supej, M. Reliability and Validity of the CORE Sensor to Assess Core Body Temperature during Cycling Exercise. Sensors 2021, 21, 5932. [Google Scholar] [CrossRef]
- Daanen, H.A.M.; Kruikemeier, V.; Teunissen, L.P.J. Heat flux systems for body core temperature assessment during exercise. J. Therm. Biol. 2023, 112, 103480. [Google Scholar] [CrossRef] [PubMed]
- Tokizawa, K.; Shimuta, T.; Tsuchimoto, H. Validity of a wearable core temperature estimation system in heat using patch-type sensors on the chest. J. Therm. Biol. 2022, 108, 103294. [Google Scholar] [CrossRef] [PubMed]
- Hashimoto, Y.; Tada, S.; Nishida, Y. Improvement of Environmental Robustness in Non-invasive Core Body Temperature Sensor Studied Numerically and Experimentally. Sens. Actuators A Phys. 2024, 368, 115136. [Google Scholar] [CrossRef]
- Hashimoto, Y.; Noto, K.; Tada, S.; Nishida, Y. Wearable Multimodal Sensor Probe for Monitoring Core Body Temperature, Electrocardiogram, Heart Rate, and Sweat Rate. IEEE Access 2025, 13, 70769–70778. [Google Scholar] [CrossRef]
Figure 1.
Conceptual illustration of circadian-behavioral misalignment. The red curve indicates the circadian rhythm represented by core body temperature, whereas the blue blocks indicate daily behavioral rhythm. Misalignment occurs when sleep or activity is scheduled at an unfavorable circadian phase.

Figure 2.
Overview of the multimodal wearable sensing system. The system integrates a heat-flux-based wearable temperature-estimation sensor, a wrist-worn actigraph that records activity and melanopic EDI, and a web application for 30-min lifelog entries. The e-Celsius capsule was used as a practical gastrointestinal-temperature comparator under free-living conditions, not as a strict gold-standard reference for core body temperature.

Figure 3.
Definition of the circadian rhythm marker tBP. The midpoint of the nocturnal decrease in core body temperature was calculated from the descending and ascending crossings of the mid-level between daily maximum and minimum core body temperature.
Figure 3.
Definition of the circadian rhythm marker tBP. The midpoint of the nocturnal decrease in core body temperature was calculated from the descending and ascending crossings of the mid-level between daily maximum and minimum core body temperature.

Figure 4.
Day-by-day relationship between t_BP and t_sleep,mid across participants. Each point represents one day. The inset magnifies the range in which most non-travel days were distributed.
Figure 4.
Day-by-day relationship between t_BP and t_sleep,mid across participants. Each point represents one day. The inset magnifies the range in which most non-travel days were distributed.

Figure 5.
Time-series data and daily phase relationships for three participants. Panels show core body temperature (a-c), physical activity (d-f), melanopic EDI (g-i), and behavioral logs (j-l), alongside the correspondence among daily rhythmic phase markers (tBP, tsleep,mid) (m-o). Data for Sub 4 are presented in (a, d, g, j, m), Sub 7 in (b, e, h, k, n), and Sub 8 in (c, f, i, l, o).

Figure 6.
Corrected hierarchical clustering and silhouette analysis. (a) Ward dendrogram based on standardized circadian-behavioral coupling features after excluding Sub 1. The leaf labels correspond to the correct subject numbers. (b) Silhouette coefficients for k = 2-5. The highest coefficient was observed at k = 2, whereas k = 3 was used as an exploratory interpretation-oriented solution.

Figure 7.
PCA based only on circadian-behavioral coupling features. PC1 mainly represents overall day-to-day variability in tsleep,mid and tBP timing, whereas PC2 represents the degree of phase-angle instability and reduced sleep-CBT correlation. The spatial arrangement was broadly consistent with the exploratory three-phenotype interpretation.

Figure 8.
Integrated PCA using circadian-behavioral coupling, melanopic EDI, activity, and lifelog-derived behavioral features. The PCA was performed using standardized features derived from circadian-behavioral coupling, melanopic EDI, PIM-based activity, and 30-min lifelog data. Each point represents one participant. PC1 mainly separated participants with preserved coupling from those showing coupling instability accompanied by differences in light exposure, activity timing, and behavioral timing. PC2 reflected the contrast between sleep/CBT/behavioral timing variability and sleep-time low-light conditions. This analysis was used for exploratory visualization and not for confirmatory cluster validation.


Table I.
Comparison of tBP estimated from Calera Research and e-Celsius.
| Subject | tBP from Calera (hh:mm) | tBP from e-Celsius (hh:mm) | Difference (min) |
|---|---|---|---|
| Sub 1 | 8:45 | 8:45 | 0 |
| Sub 2 | 7:01 | 6:53 | 8 |
| Sub 4 (day 1) | 5:52 | 5:18 | 34 |
| Sub 4 (day 2) | 5:18 | 4:57 | 21 |
| Sub 5 | 3:27 | 3:13 | 14 |
| Sub 6 | 3:55 | 3:21 | 34 |
| Sub 8 | 4:59 | 4:27 | 32 |
| Sub 9 (day 1) | 2:22 | 1:25 | 57 |
| Sub 9 (day 2) | 2:36 | 1:57 | 39 |
| Sub 10 | 3:56 | 4:28 | -32 |
| Mean ± SD | - | - | 27.1 ± 15.8 |
Table II.
Circadian-behavioral coupling features and corrected cluster assignments.
| Subject | Circular SD of tsleep,mid | Circular SD of tBP | SD of phase angle | Corr. coeff. of tBP and tsleep,mid | Group (k=2) | Group (k=3) | Corrected interpretation (k=3) |
|---|---|---|---|---|---|---|---|
| Sub 2 | 0.59 | 0.92 | 1.24 | -0.30 | 1 | 1 | Low-correlation / weak-coupling phenotype |
| Sub 3 | 0.78 | 0.89 | 0.51 | 0.82 | 1 | 2 | Main coupled phenotype |
| Sub 4 | 0.30 | 0.40 | 0.34 | 0.55 | 1 | 2 | Main coupled phenotype |
| Sub 5 | 0.46 | 1.16 | 0.89 | 0.73 | 1 | 2 | Main coupled phenotype |
| Sub 6 | 1.02 | 0.69 | 0.73 | 0.70 | 1 | 2 | Main coupled phenotype |
| Sub 7 | 1.56 | 1.45 | 0.68 | 0.90 | 2 | 3 | High-variability coupled phenotype |
| Sub 8 | 0.56 | 0.30 | 0.71 | -0.31 | 1 | 1 | Low-correlation / weak-coupling phenotype |
| Sub 9 | 0.53 | 0.33 | 0.31 | 0.85 | 1 | 2 | Main coupled phenotype |
| Sub 10 | 0.80 | 0.68 | 0.32 | 0.92 | 1 | 2 | Main coupled phenotype |
Disclaimer/Publisher’s Note: The statements, opinions and data contained in all publications are solely those of the individual author(s) and contributor(s) and not of MDPI and/or the editor(s). MDPI and/or the editor(s) disclaim responsibility for any injury to people or property resulting from any ideas, methods, instructions or products referred to in the content. |
© 2026 by the authors. Licensee MDPI, Basel, Switzerland. This article is an open access article distributed under the terms and conditions of the Creative Commons Attribution (CC BY) license (http://creativecommons.org/licenses/by/4.0/).
Copyright: This open access article is published under a Creative Commons CC BY 4.0 license, which permit the free download, distribution, and reuse, provided that the author and preprint are cited in any reuse.


