

Submitted:
09 June 2026
Posted:
10 June 2026
You are already at the latest version
Abstract
Diabetes mellitus affects over 500 million people worldwide, yet most machine learning prediction models remain opaque, poorly calibrated, or untested against statistical benchmarks—limiting their clinical utility. This study proposes a comparative explainable machine learning (XML) framework that combines the Marine Predators Algorithm (MPA) for hyperparameter optimization with SHAP-based interpretability to improve both the accuracy and transparency of diabetes risk prediction. Three models—Logistic Regression (LR, baseline), Random Forest (RF), and MPA-optimized XGBoost—were evaluated on a large-scale, class-imbalanced dataset of approximately 100,000 records. A seven-stage preprocessing pipeline incorporating mean imputation, one-hot encoding, Min-Max normalization, and SMOTE class balancing was applied strictly within stratified 10-fold cross-validation folds to prevent data leakage. Model performance was assessed using accuracy, ROC-AUC, F1-score, sensitivity, specificity, precision, and Brier score. Statistical significance was confirmed via Wilcoxon signed-rank tests with Bonferroni correction. MPA-optimized XGBoost achieved 96.72% accuracy, 97.70% precision, 95.70% recall, 96.71% F1-score, and 99.56% ROC-AUC—outperforming both LR and RF across all metrics with statistically significant margins (p < 0.001). Calibration analysis yielded a Brier score of 0.0262. SHAP analysis identified HbA1c level, blood glucose level, and age as the three strongest global predictors, with feature interaction analysis revealing a synergistic effect between HbA1c and blood glucose. While results are specific to the Kaggle-sourced dataset and require external validation before clinical deployment, the framework demonstrates that MPA-driven optimization paired with SHAP explainability can produce models that are both high-performing and clinically interpretable. This work establishes a methodological baseline for transparent, statistically rigorous diabetes prediction systems.
Keywords:
diabetes prediction
; machine learning
; marine predators algorithm
; XGBoost
; SHAP
; explainable artificial intelligence
; SMOTE
; hyperparameter optimization
; clinical decision support
; class imbalance
1. Introduction
A chronic metabolic disease that represents a serious danger to global health is diabetes mellitus, whose prevalence is increasing worldwide, attributed to sedentary lifestyles, poor diets, and aging populations [1]. Early diagnosis is crucial for preventing complications such as neuropathy, renal failure, and cardiovascular problems [2]. Machine learning (ML) techniques are increasingly employed for diabetes prediction by discovering hidden patterns in large healthcare datasets that are normally challenging to identify using conventional techniques [3]. Predictive modeling has become a key component in clinical decision support systems [4]; however, clinicians need explanations in addition to precise forecasts, necessitating explainable AI (XAI) in medical ML systems [5].
Biological, environmental, and lifestyle risk factors contribute to diabetes. Unhealthy diet is a major factor in insulin resistance, while inactivity contributes to obesity and metabolic dysregulation [6]. Hormonal regulation is also impacted by genetic, stress, and sleeping pattern irregularities [7]. Sensitivity to insulin decreases with age, and urbanization, processed foods, smoking, and alcohol consumption are strongly associated with type 2 diabetes [8]. Hypertension and cardiovascular disease complicate diagnosis, and limited access to healthcare results in detection delays, making diabetes prediction a complex multifactorial problem [9].
Several ML models are applied for diabetes prediction. Logistic Regression (LR) is preferred for interpretable results, while Support Vector Machines (SVMs) can handle nonlinear decision boundaries [10]. Decision Trees and Random Forests (RF) exploit complex feature interactions [11]. Gradient boosting algorithms perform well on tabular medical data and K-Nearest Neighbor (KNN) is an instance-specific approach [12,13]. Gradient boosting methods are accurate but computationally expensive and sensitive to hyperparameter settings [14].
Although progress has recently been made, significant challenges remain, including limited explainability, weak calibration robustness, inadequate statistical validation, and lack of holistic comparison. Current approaches are also sensitive to class imbalance, hyperparameter tuning, and dataset bias, resulting in poor generalization. To address these problems, this work presents a comparative XML framework based on LR, RF, and MPA-optimized XGBoost, with SHAP-based interpretability, calibration analysis, and statistical validation to deliver accurate and clinically trustworthy diabetes prediction.
1.1. Key Contributions
The main contributions of this work are as follows:
- A comparative XML framework incorporating LR, RF, and XGBoost is developed to predict diabetes with high accuracy and clinical interpretability.
- A comprehensive preprocessing pipeline with missing-value imputation, categorical encoding, feature normalization, and class balancing is applied to enhance data quality and model performance.
- The Marine Predators Algorithm (MPA) is used to optimize hyperparameters of RF and XGBoost, enhancing classification performance, generalization ability, and robustness.
- SHAP-based explainability provides global and local interpretability for transparent and clinically meaningful diabetes risk investigation.
- The framework is validated using cross-validation, calibration analysis, ablation study, and statistical tests for robust and rigorous evaluation.
The remainder of this paper is organized as follows: Section 2 reviews previous methods for predicting diabetes. Section 3 presents the problem statement. Section 4 describes the proposed approach. Section 5 describes the experimental setup. Section 6 presents results and discussion. Section 7 concludes the paper and outlines future work.
2. Literature Review
Maimaitijiang et al. [15] introduced an explainable diabetes prediction model based on CatBoost, applying SHAP and SMOTE to increase predictive accuracy and explainability, together with an LLM-based chatbot for personalized suggestions. Nevertheless, self-reported information can be subject to bias, and without external validation, clinical applicability remains limited. A fuzzy-empowered ANN model for type 2 diabetes prediction with lifestyle calibration was designed by Ganie and Malik [16]; however, it is regionally biased. Netayawijit et al. [17] presented an interpretable ML framework based on SMOTE, SHAP, RF, XGBoost, and SVM, but it is primarily established on synthetic data and lacks real-world validation.
Hoyos et al. [18] proposed a fusion approach based on statistical analysis, fuzzy clustering, ANN, SVM, and XGBoost, but it lacks robustness against uncertainty. Jasim et al. [19] proposed a hyper-optimized AdaBoost model based on grid search, but it is computationally intensive and less interpretable. Ashisha et al. [20] developed an IoMT-based framework using RF, GBM, LightGBM, and Decision Tree with Boruta and oversampling, but it does not address real-time or edge deployment.
Dharmarathne et al. [21] developed a self-explainable model via DT, KNN, SVC, and XGBoost using SHAP, but scalability to larger datasets is problematic. Rastogi et al. [22] proposed an IoT-based monitoring system with RF and physiological signals, but it focuses more on sensor integration than predictive robustness. Tasin et al. [23] combined XGBoost with SMOTE, ADASYN, LIME, and SHAP but did not perform calibration or uncertainty assessment.
Pang [24] used MARS and RF analysis with SHAP, but feature interaction and fairness analysis are not considered. Curia [25] introduced a multi-classifier scheme composed of DT, DNN, XGBoost, LR, KNN, and SVC with LIME, but it suffers from redundancy and overfitting. Iftikhar et al. [26] presented a deep learning model using SMOTE, SHAP, and LIME; however, it is computationally expensive and infeasible for resource-constrained environments.
In general, the prior literature demonstrates strong predictive performance but suffers from limitations including poor calibration, sensitivity to class imbalance, large computational demands, weak external validation, and limited clinical interpretability. In response, we propose a comparative XML framework integrating LR, RF, and MPA-XGBoost with SHAP interpretability, focusing on calibration reliability, statistical validation, and transparent explanations for clinically trustworthy diabetes prediction.
3. Problem Statement
Previous work on diabetes prediction employs statistical models such as LR, Bayesian networks, or survival analysis, which have limited predictive performance and cannot model nonlinear relations, resulting in low sensitivity in high-risk situations [27]. Rule-based systems apply fixed rules and are not adaptable to variations in patient status. Ensemble methods such as voting and bagging enhance stability, but generalization remains poor due to dataset bias and insufficient external validation [28].
Numerous deep learning models, including CNNs and RNNs, are being applied to medical data; however, their suitability for practical use is limited by the need for substantial computational resources and large datasets [29]. Hybrid optimization and swarm intelligence-based algorithms are employed for feature selection and hyperparameter tuning, which add complexity without improving interpretability. Graph-based and probabilistic models can represent patient relationships but suffer from scalability and real-world deployment challenges [30].
4. Proposed Approach
The proposed diabetes prediction framework is illustrated in Figure 1, summarizing an end-to-end pipeline from data collection to preprocessing, model building, tuning, and testing. The system starts with dataset gathering, then applies preprocessing with mean imputation, one-hot encoding, Min-Max normalization, and SMOTE-based class balancing.
Three models—LR, RF, and XGBoost—are trained and optimized using the MPA. SHAP-based explainability is provided for global, local, and feature interaction analysis. Rigorous performance metrics ensure robust and interpretable diabetes prediction.
4.1. Comparative ML Model Development for Diabetes Prediction
The comparative model-building phase is a crucial component of the proposed XML framework. It compares several classification algorithms under the same experimental setup to identify the best, most stable, and interpretable model. The framework uses a mixture of interpretable and high-performance models by considering baseline, ensemble, and gradient boosting approaches. For fairness, all models are trained on the same preprocessed dataset and evaluated on unseen test data using uniform metrics.
4.1.1. Baseline Model: Logistic Regression for Clinical Interpretability
LR serves as the baseline classifier in the proposed XML framework. It enables straightforward comparison with sophisticated ensemble and boosting approaches through a statistically sound and interpretable baseline. Clinical features are weighted and combined to produce a decision score, which is mapped to a probability via a sigmoid function to classify diabetic and non-diabetic patients (Figure 2).
LR estimates the probability of diabetes by applying a sigmoid function to a linear combination of clinical characteristics, as indicated by Equation (1):
where P(y = 1|x) is the probability of the diabetic condition, β0 is the intercept, β1, ..., βn are the feature weights, x1, ..., xn are the clinical features, and n is the number of features. The predicted probability is transformed into a binary class label as per Equation (2):
where ŷ is the predicted class label (1 = diabetic, 0 = non-diabetic) and P̂ is the predicted probability. The feature influence is interpreted in terms of an odds ratio defined in Equation (3):
where βi is the coefficient of feature i. Positive coefficients correspond to increased risk of diabetes, and negative ones to protective effects.
P(y=1|x) = 1 / (1 + exp(−(β0 + β1x1 + ... + βnxn)))
ŷ = 1 if P̂ ≥ 0.5, else 0
Odds Ratio = exp(βi)
4.1.2. Ensemble Learning Model: Random Forest for Robust Prediction
RF is included to advance the stability and accuracy of the proposed diabetes prediction model, and to reduce overfitting by bagging multiple decision trees from diverse data subsets. It gains robustness for noisy and heterogeneous clinical data by consolidating various decision boundaries. In this work it serves as an intermediate model between LR and XGBoost. Figure 3 illustrates the RF structure in which multiple decision trees are trained using bootstrap-sampled subsets and final predictions are made by majority voting.
RF performs bootstrap sampling to create several training subsets with replacement, as in Equation (4):
where Db is the bootstrap dataset, n is the number of samples, and D is the initial dataset. The final prediction is determined by majority voting, as in Equation (5):
where ht(x) is the prediction from tree t over T total trees. In binary classification, RF node splitting employs the Gini Index to assess impurity, as in Equation (6):
where p0 and p1 represent the probabilities for non-diabetic and diabetic categories. Smaller Gini scores indicate purer subsets and better class separation.
Db = {x1, x2, ..., xn} sampled with replacement from D
ŷ = mode{h1(x), h2(x), ..., hT(x)}
Gini = 1 − (p02 + p12)
4.1.3. Gradient Boosting Model: XGBoost for High-Performance Classification
XGBoost operates as the high-performance gradient boosting classifier in the proposed framework. Its key purpose is to achieve the highest predictive accuracy by sequentially reducing classification errors via additive learning. Unlike bagging-based models, XGBoost trains algorithms step by step and minimizes any differentiable loss function, making it suitable for structured clinical data with nonlinear relations. Figure 4 shows the framework of XGBoost in which decision trees are iteratively trained and added to the ensemble.
XGBoost makes its final prediction by combining weak learners, as in Equation (7):
where T is the total boosting iterations, K is the space of regression trees, and ft is the prediction of the t-th tree. The regularized objective function is defined in Equation (8):
where l is the loss function, yi is the observed label, ŷi is the predicted output, and Ω is the regularization term for model complexity control, as in Equation (9):
where γ is the leaf penalty, T is the number of leaves, wj is the leaf weight, and λ is the L2 regularization parameter.
ŷi = ∑(t=1 to T) ft(xi), ft ∈ K
Obj = ∑i l(yi, ŷi) + ∑t Ω(ft)
Ω(f) = γT + (1/2)λ∑j wj2
| Algorithm 1. Comparative Machine Learning Model Development for Diabetes Prediction. |
| Input: Pre-processed dataset D Output: Trained models, predictions, and best performing model Step 1: Load D; partition into D_train and D_test (stratified split). Step 2: Define LR (baseline), RF (ensemble), and XGBoost (gradient boosting). Step 3: Train LR on D_train using linear probabilistic relationships. Step 4: Train RF using bootstrap aggregation and majority voting. Step 5: Train XGBoost using sequential additive learning. Step 6: For each model, generate probability outputs for D_test; convert to binary labels (0 = non-diabetic, 1 = diabetic). Step 7: Evaluate each model: Accuracy, Precision, Recall, F1, ROC-AUC. Step 8: Compare models; select best performer. Step 9: Return best model, predictions, and comparative performance results. |
4.2. Hyperparameter Optimization Using Marine Predators Algorithm
The hyperparameter tuning step enhances the prediction accuracy and generalization of RF and XGBoost. Rather than manual tuning, MPA efficiently searches for optimal hyperparameters through a balanced exploration-exploitation strategy. LR is not optimized and instead serves as a fixed baseline for comparisons.
4.2.1. Optimization Problem Definition
Hyperparameter tuning is formulated as an optimization problem, as indicated in Equation (10):
where θ is the vector of hyperparameters, F(θ) is the fitness function, and w1, w2 are weight coefficients.
maximize F(θ) = w1·AUC + w2·F1
4.2.2. MPA Mechanism
MPA is a population-based metaheuristic inspired by marine predator-prey interactions. It consists of three stages: high-velocity (exploration), unit-velocity (transition), and low-velocity (exploitation under Lévy/Brownian motion). The update rule is stated in Equation (11):
where xi is the current position, xi’ is the new position, x* is the best solution, α is a stochastic factor, and R is a random disturbance term.
xi’ = xi + α · (x* − xi) + R
4.2.3. Exploration-Exploitation Control Strategy
MPA employs a dynamic control factor, expressed in Equation (12):
where CF is the control factor, t is the current iteration, and T is the maximum number of iterations.
CF = (1 − t/T)^(2t/T)
4.2.4. Fitness Evaluation Strategy
Every hyperparameter setting is tested using k-fold cross-validation, as in Equation (13):
where F(θ) is the aggregate performance, Sk denotes the assessment score of the k-th fold, and K is the total number of folds.
F(θ) = (1/K) ∑(k=1 to K) Sk(θ)
| Algorithm 2. MPA-Based Hyperparameter Optimization for Diabetes Prediction. |
| Input: D_train, RF and XGBoost models Output: Optimized hyperparameters θ* for RF and XGB Step 1: Define hyperparameter search spaces for RF and XGBoost. Step 2: Initialize MPA: population size N, max iterations T. Step 3: Randomly initialize candidate solutions; assign to hyperparameter configs. Step 4: For each candidate, train model, perform K-fold CV, compute fitness. Step 5: Identify candidate with highest fitness as global best θ*. Step 6: For t = 1 to T: 6.1 Compute control factor CF. 6.2 Update candidate positions using MPA rule. 6.3 Enforce hyperparameter bounds. 6.4 Re-evaluate fitness; update global best if improved. Step 7: Apply optimized θ* to RF and XGB; generate final models. |
4.3. Explainable Artificial Intelligence Using SHAP
An XAI stage is incorporated into the proposed diabetes prediction model to increase comprehension, openness, and credibility. Since ensemble approaches like RF and XGBoost operate as black-box models, SHAP is utilized to clarify predictions by representing the contribution of each clinical attribute toward the prediction of diabetes, guaranteeing both high accuracy and clinical interpretability.
4.3.1. SHAP-Based Explainability Framework
SHAP is grounded in cooperative game theory, in which each feature is viewed as a participant influencing the outcome. The SHAP value formulation is provided in Equation (14):
where M is the total number of attributes, S is a feature subset, fS is the model estimated using subset S, and φi is the SHAP value of feature i.
φi = ∑(S⊆M\{i}) [|S|!(|M|−|S|−1)!/|M|!] [fS∪{i}(x) − fS(x)]
4.3.2. Global Interpretability Analysis
Global feature importance is computed as the mean absolute SHAP value, as in Equation (15):
where n is the number of observations, Ii is the global significance of feature i, and φi(xj) is the SHAP value for feature i on sample xj.
Ii = (1/n) ∑(j=1 to n) |φi(xj)|
4.3.3. Local Explanation Mechanism
SHAP explains predictions at the individual level, as in Equation (16):
where M is the number of features, φ0 is the base prediction, φi is the contribution of feature i, and f(x) is the final model prediction.
f(x) = φ0 + ∑(i=1 to M) φi
4.3.4. Feature Interaction Analysis
SHAP also captures interaction effects between clinical variables such as the glucose-BMI relationship, where complex dependencies between features are revealed. SHAP-based explainability contributes to transparency and understanding of individual feature contributions, enabling clinically interpretable diabetes predictions for real-world healthcare use.
5. Experimental Setup
5.1. Dataset Acquisition
The proposed work exploits the publicly accessible Diabetes Prediction Dataset [31] for binary classification. It contains nearly 100,000 samples, consisting of demographic, clinical, and lifestyle features significant for assessing the risk of diabetes. The dataset is class-imbalanced, as shown in Table 1. SMOTE is applied only on the training data to generate synthetic diabetic samples and balance classes without data leakage. The dataset is standardized to 20,000 records after preprocessing and SMOTE augmentation for computational tractability and fair comparison.
5.2. Data Preprocessing
Healthcare data quality heavily influences the reliability of prediction systems. Missing values, heterogeneous records, and imbalanced classes in healthcare datasets lead to unreliable predictions. Hence, preprocessing increases data quality, feature uniformity, and framework effectiveness by standardizing attributes, balancing classes, encoding categorical variables, and handling missing data.
5.2.1. Mean Imputation for Missing Value Handling
Mean imputation substitutes the mean value for any absent attribute, as in Equation (17):
where μ is the mean, n is the total number of samples, and xi is the i-th sample value.
μ = (1/n) ∑(i=1 to n) xi
5.2.2. One-Hot Encoding for Categorical Feature Transformation
Categorical features are converted to binary numerical vectors, as shown in Equation (18):
where e(x) is the encoded representation of categorical variable x.
e(x) = [1 if x=ck else 0] for k=1,...,K
5.2.3. Min-Max Normalization for Feature Scaling
Min-Max normalization transforms numeric features into a fixed range, as in Equation (19):
where x’ is the normalized value of x, and xmin and xmax are the feature’s minimum and maximum values, respectively.
x’ = (x − xmin) / (xmax − xmin)
5.2.4. SMOTE for Class Imbalance Handling
SMOTE creates artificial minority class samples to balance the class distribution, as in Equation (20):
where xnew is the new sample, xi denotes a minority instance, xnn is its nearest neighbor, and λ is the interpolation factor.
xnew = xi + λ · (xnn − xi), λ ∈ [[0,1]
| Algorithm 3. SMOTE for Class Imbalance Handling. |
| Input: X_min (minority class), N (synthetic samples required), k (nearest neighbors) Output: X_syn (synthetic minority class samples) Step 1: Initialize X_syn = ∅. Step 2: For each xi ∈ X_min: 2.1 Locate k nearest neighbors in X_min. Step 3: For i = 1 to N: 3.1 Randomly select xi from X_min. 3.2 Randomly select xnn from k nearest neighbors of xi. 3.3 Generate: xnew = xi + λ × (xnn − xi), λ ∈ [0,1]. 3.4 Add xnew to X_syn. Step 4: Return X_syn. |
5.3. Data Splitting Strategy
5.3.1. Training and Testing Split
The dataset is partitioned into separate training and testing sets to prevent data leakage and facilitate trustworthy evaluation, as formulated in Equations (21) and (22):
where D_train is the training portion, D_test is the testing portion, and D is the complete dataset.
D_train = 0.80 × D,
D_test = 0.20 × D
5.3.2. Stratified 10-Fold Cross-Validation
Stratified 10-fold cross-validation is applied to increase robustness and reduce overfitting while maintaining class distribution across folds, as in Equation (23):
where V is the validation score and Sk is the score of fold k. This technique ensures better stability, generalization, and fairer comparative assessment.
V = (1/K) ∑(k=1 to K) Sk, K = 10
5.4. Experimental Environment
Table 2 lists the hardware and software environment used in this study.
5.5. Hyperparameter Configuration
The hyperparameter settings in Table 3 are designed to give the best performance and a fair comparison among models. LR uses max_iter = 2000, solver = lbfgs, and C = 1.0 as a baseline. RF is configured with n_estimators = 300, max_depth = 15, and class_weight = balanced. The protocol is 80:20 train-test division, stratified 10-fold cross-validation, MPA with population size 10 and 15 epochs, and random seed 42.
5.6. Performance Metrics
To estimate classification performance and robustness against imbalanced data, the framework employs the following metrics. Accuracy measures the proportion of correctly classified samples, Equation (24). Precision measures correctly predicted diabetic individuals among positive predictions, Equation (25). Recall (Sensitivity) measures how well the model detects true positive diabetics, Equation (26). F1-Score is the harmonic mean of Precision and Recall, Equation (27). ROC-AUC shows the classifier’s ability to distinguish between classes across all thresholds, Equation (28). The Brier score measures calibration quality.
where TP, TN, FP, and FN are true positives, true negatives, false positives, and false negatives, respectively.
Accuracy = (TP+TN) / (TP+TN+FP+FN)
Precision = TP / (TP+FP)
Recall = TP / (TP+FN)
F1 = 2 × (Precision × Recall) / (Precision + Recall)
AUC = ∫ TPR(FPR) d(FPR)
6. Results and Discussion
The proposed explainable diabetes prediction framework, incorporating LR, RF, and MPA-enhanced XGBoost, is analyzed in terms of performance, calibration, SHAP interpretation, ablation study, and statistical validation.
6.1. Dataset Distribution and Feature Analysis
Figure 5 shows the distribution of key clinical characteristics and the comparison between diabetic and non-diabetic classes. Diabetic patients predominate in the age group 50-80 years, and a BMI peak of 25-35 kg/m2 is observed for diabetics. HbA1c values for diabetic individuals are mostly in the range 6-9%, and blood glucose levels are mainly concentrated between 150-300 mg/dL. These discriminative patterns justify the use of these features in predictive models.
Figure 6 shows a correlation matrix heatmap of the clinical features. Diabetes shows moderate positive associations with HbA1c_level (0.60), blood_glucose_level (0.53), age (0.48), and BMI (0.34), and weaker positive associations with hypertension (0.27) and heart_disease (0.22). HbA1c_level is also associated with blood_glucose_level (0.33). This analysis informs feature selection and model design.
6.2. Cross-Validation and Comparative Performance
Figure 7 shows the 10-fold cross-validation ROC-AUC scores for LR (0.9603), RF (0.9920), and XGBoost (0.9948). XGBoost achieves the highest discrimination, followed by RF.
Figure 8 shows the comparison of multiple performance metrics for LR, RF, and XGBoost. LR achieves moderate performance. RF outperforms LR across all metrics (accuracy = 0.951, precision = 0.952, recall = 0.950, F1 = 0.951, ROC-AUC = 0.953), and XGBoost outperforms all models (accuracy = 0.967, precision = 0.977, recall = 0.957, F1 = 0.967, ROC-AUC = 0.978).
Figure 9 shows the learning curves with training sample sizes varying from 2,000 to 12,000. LR performs consistently with training and validation accuracy of ~0.890 and ~0.880. RF generalizes better with training accuracy ~0.998 and validation accuracy rising from 0.924 to 0.944. XGBoost shows the best stability, with validation accuracy increasing from 0.922 to 0.956.
6.3. Evaluation of Predictive Probability Calibration
Figure 10 shows the calibration curves for LR (Brier = 0.0785), RF (Brier = 0.0377), and XGBoost (Brier = 0.0262) versus the ideal calibration line. XGBoost lies closest to the ideal diagonal, indicating the most reliable probabilistic predictions and confirming its selection for the proposed framework.
6.4. ROC and Precision-Recall Analysis
Figure 11 illustrates the Precision-Recall and ROC curves for LR (AUC = 0.9625, AP = 0.9649), RF (AUC = 0.9918, AP = 0.9924), and XGBoost (AUC = 0.9958, AP = 0.9957). XGBoost achieves the highest area under both curves, indicating superior discriminative ability and diabetic case detection performance.
6.5. Error Analysis Using Confusion Matrices
Figure 12 shows confusion matrices for LR, RF, and XGBoost. LR correctly predicts 1764 non-diabetic and 1777 diabetic samples, misclassifying 236 and 223 respectively. RF yields 1905 true negatives and 1900 true positives with only 95 and 100 misclassifications. XGBoost achieves maximum efficacy with 1955 true negatives and 1914 true positives, and only 45 and 86 misclassifications respectively.
6.6. Explainable AI Analysis Using SHAP
6.6.1. Global SHAP Analysis
Figure 13 shows SHAP-based feature importance for RF and XGBoost. HbA1c_level has the maximum mean SHAP value in both models (RF ≈ 0.18, XGBoost ≈ 3.5), followed by blood_glucose_level (RF ≈ 0.13, XGBoost ≈ 2.5) and age (RF ≈ 0.08, XGBoost ≈ 0.8). Other features including BMI, hypertension, and heart_disease have average contributions.
6.6.2. SHAP Beeswarm Analysis
Figure 14 illustrates SHAP beeswarm plots for RF and XGBoost. HbA1c_level has the most important effect on model output, followed by blood_glucose_level and age. For RF, SHAP values range approximately from −0.6 to 0.6, while XGBoost shows a wider range of −7.5 to 7.5, indicating greater feature sensitivity.
6.6.3. SHAP Feature Influence and Local Interpretation
Figure 15 shows feature-specific effects for XGBoost, illustrating the impact of HbA1c_level on predicted diabetes risk with SHAP values ranging from approximately −7.5 to 7.5. Blood_glucose_level and HbA1c have a combined synergistic effect on predictions. The SHAP waterfall plot for an individual data point reveals positive contributions from HbA1c (+1.77), blood_glucose_level (+1.61), age (+1.18), BMI (+0.98), and hypertension (+0.85), with mild negative contributions from other features.
6.7. Ablation Study
Table 4 presents the ablation study comparing the proposed model against variants without SMOTE and without MPA optimization. Removing SMOTE drops all metrics slightly. Removing MPA causes a larger drop (accuracy 0.9388, F1 0.9391). The full proposed model achieves the best results across all metrics, confirming each component contributes measurably.
6.8. Statistical Significance Analysis
Table 5 shows the Wilcoxon signed-rank test results comparing the three models. Every comparison is statistically significant, confirming that ensemble and boosting methods produce better prediction accuracy than LR.
6.9. Comparison with State-of-the-Art Methods
Table 6 shows an accuracy comparison with existing approaches. The proposed MPA-Optimized XGBoost achieves the best accuracy of 96.72%, outperforming all compared methods and demonstrating that hyperparameter adaptation combined with explainable AI produces a superior framework for diabetes prediction.
6.10. Discussion
The results demonstrate that the proposed MPA-optimized XGBoost-based XML framework achieves better performance than baseline and ensemble models in predicting diabetes. It outperforms LR and RF on all evaluation metrics and captures nonlinear interactions among clinical features effectively. Cross-validation demonstrates stable, robust results with less overfitting across data partitions. Calibration analysis shows well-calibrated probability estimates, enabling reliable clinical risk estimation. ROC and precision-recall plots demonstrate excellent discrimination in the context of imbalanced data and detection of diabetic cases. Fewer misclassifications are observed in the error analysis, and significance tests confirm that performance improvements are statistically meaningful. SHAP results guarantee global and local interpretability.
7. Conclusions
7.1. Summary
This study presented a comparative explainable ML framework for diabetes prediction, built around LR, RF, and MPA-optimized XGBoost. Evaluated on a large-scale, class-imbalanced clinical dataset of nearly 100,000 records, the framework combined a systematic preprocessing pipeline with stratified 10-fold cross-validation and SHAP-based interpretability.
MPA-optimized XGBoost outperformed both baseline and ensemble models across every metric, reaching 96.72% accuracy, 97.70% precision, 95.70% recall, 96.71% F1-score, and 99.56% ROC-AUC. A Brier score of 0.0262 confirmed reliable probability estimates for clinical use. Confusion matrix results and Wilcoxon signed-rank tests reinforced that performance gains over LR and RF were statistically significant. SHAP analysis identified HbA1c level, blood glucose level, and age as the strongest predictors globally, while local waterfall plots explained individual prediction decisions. The ablation study confirmed that each component earns its place in the pipeline.
The framework addresses a gap that prior work left open: many existing models prioritize predictive accuracy but produce outputs that clinicians cannot interpret or trust. By combining MPA-based tuning with SHAP explainability and calibration analysis, this work offers a system that is both accurate and transparent enough for real clinical decision support.
7.2. Limitations
Several limitations bound the scope of these findings. First, the framework was trained and tested on a single publicly available Kaggle dataset; despite its size (~100,000 records), it captures a specific population snapshot and has not been externally validated against independent clinical cohorts. Second, the dataset was reduced to 20,000 records for computational efficiency, meaning performance at full scale is unconfirmed. Third, MPA was run with a population size of 10 and only 15 iterations, constrained to keep computation tractable. Fourth, the task is binary (diabetic vs. non-diabetic) and does not distinguish between Type 1, Type 2, prediabetes, or gestational diabetes. Fifth, the model relies entirely on structured tabular data and does not incorporate imaging, continuous glucose monitoring, genomic features, or wearable sensor data. Finally, SMOTE-generated samples may introduce artificial patterns that inflate minority-class performance estimates.
7.3. Future Work
Several directions could extend this framework. External validation on independent datasets from different hospitals or countries is the most immediate need. Expanding the classification task to cover prediabetes and diabetes subtypes, combined with longitudinal patient records, would shift the framework toward progressive risk monitoring. The MPA search could be scaled up and compared against other metaheuristics such as PSO and GWO. Integrating heterogeneous data sources, including continuous glucose data, retinal imaging, or genetic markers, would bring the input closer to real clinical workflows. Federated learning offers a path to training on distributed hospital data without centralizing sensitive records. Richer explainability tools including counterfactual explanations, LIME comparisons, and uncertainty quantification would further strengthen interpretability and trustworthiness.
Author Contributions
Conceptualization, A.N. and M.B.A.; methodology, A.N. and M.B.A.; software, A.N.; validation, A.N., M.B.A. and R.S.; formal analysis, A.A.; investigation, S.C. and S.K.; resources, M.A. and A.A.; data curation, A.N.; writing—original draft preparation, A.N. and M.B.A.; writing—review and editing, A.A., M.A. and M.M.A.; visualization, A.N.; supervision, A.A. and M.M.A.; project administration, M.M.A.; funding acquisition, A.A. All authors have read and agreed to the published version of the manuscript.
Funding
This research was funded by the Deanship of Scientific Research, Vice Presidency for Graduate Studies and Scientific Research, King Faisal University, Saudi Arabia, grant number KFU253893XX.
Institutional Review Board Statement
Not applicable. This study used a publicly available anonymized dataset and did not involve human subjects directly.
Informed Consent Statement
Not applicable.
Data Availability Statement
The dataset used in this study is publicly available at: https://www.kaggle.com/datasets/iammustafatz/diabetes-prediction-dataset (accessed on 12 May 2026).
Acknowledgments
The authors acknowledge the support of their respective institutions.
Conflicts of Interest
The authors declare no conflicts of interest. The funders had no role in the design of the study; in the collection, analyses, or interpretation of data; in the writing of the manuscript; or in the decision to publish the results.
References
- Mushtaq, Z.; Ramzan, M.F.; Ali, S.; Baseer, S.; Samad, A.; Husnain, M. Voting Classification-Based Diabetes Mellitus Prediction Using Hypertuned Machine-Learning Techniques. Mob. Inf. Syst. 2022, 2022, 1–16. [Google Scholar] [CrossRef]
- Qin, Y.; et al. Machine Learning Models for Data-Driven Prediction of Diabetes by Lifestyle Type. Int. J. Environ. Res. Public Health 2022, 19, 15027. [Google Scholar] [CrossRef]
- Mohanty, P.K.; Francis, S.A.J.; Barik, R.K.; Roy, D.S.; Saikia, M.J. Leveraging Shapley Additive Explanations for Feature Selection in Ensemble Models for Diabetes Prediction. Bioengineering 2024, 11, 1215. [Google Scholar] [CrossRef]
- El-Sofany, H.; El-Seoud, S.A.; Karam, O.H.; Abd El-Latif, Y.M.; Taj-Eddin, I.A.T.F. A Proposed Technique Using Machine Learning for the Prediction of Diabetes Disease through a Mobile App. Int. J. Intell. Syst. 2024, 2024, 1–13. [Google Scholar] [CrossRef]
- Sun, Q.; Cheng, X.; Han, K.; Sun, Y.; Ren, H.; Li, P. Machine learning-based assessment of diabetes risk. Appl. Intell. 2025, 55, 106. [Google Scholar] [CrossRef]
- Bhat, S.S.; Selvam, V.; Ansari, G.A.; Ansari, M.D.; Rahman, M.H. Prevalence and Early Prediction of Diabetes Using Machine Learning in North Kashmir. Comput. Intell. Neurosci. 2022, 2022, 1–12. [Google Scholar] [CrossRef]
- Sghaireen, M.G.; et al. Machine Learning Approach for Metabolic Syndrome Diagnosis Using Explainable Data-Augmentation-Based Classification. Diagnostics 2022, 12, 3117. [Google Scholar] [CrossRef]
- Dutta, A.; et al. Early Prediction of Diabetes Using an Ensemble of Machine Learning Models. Int. J. Environ. Res. Public Health 2022, 19, 12378. [Google Scholar] [CrossRef]
- Oliullah, K.; Rasel, M.H.; Islam, M.M.; Islam, M.R.; Wadud, M.A.H.; Whaiduzzaman, M. A stacked ensemble machine learning approach for the prediction of diabetes. J. Diabetes Metab. Disord. 2023, 23, 603–617. [Google Scholar] [CrossRef]
- Sunny, M.N.M.; Sakil, M.B.H.; Atayeva, J.; Munmun, Z.S.; Mollick, M.S.; Faruq, M.O. Predictive Healthcare: An IoT-Based ANFIS Framework for Diabetes Diagnosis. Engineering 2024, 16, 325–336. [Google Scholar] [CrossRef]
- Bhuyan, H.K.; Chakraborty, C. Explainable Machine Learning for Data Extraction Across Computational Social System. IEEE Trans. Comput. Soc. Syst. 2024, 11, 3131–3145. [Google Scholar] [CrossRef]
- Afolabi, S.; Ajadi, N.; Jimoh, A.; Adenekan, I. Predicting diabetes using supervised machine learning algorithms on E-health records. Inform. Health 2025, 2, 9–16. [Google Scholar] [CrossRef]
- Kakoly, I.J.; Hoque, M.R.; Hasan, N. Data-Driven Diabetes Risk Factor Prediction Using Machine Learning Algorithms with Feature Selection Technique. Sustainability 2023, 15, 4930. [Google Scholar] [CrossRef]
- Laila, U.E.; Mahboob, K.; Khan, A.W.; Khan, F.; Taekeun, W. An Ensemble Approach to Predict Early-Stage Diabetes Risk Using Machine Learning: An Empirical Study. Sensors 2022, 22, 5247. [Google Scholar] [CrossRef]
- Maimaitijiang, E.; Aihaiti, M.; Mamatjan, Y. An Explainable AI Framework for Online Diabetes Risk Prediction with a Personalized Chatbot Assistant. Electronics 2025, 14, 3738. [Google Scholar] [CrossRef]
- Ganie, S.M.; Malik, M.B. A Lifestyle-Based Fuzzy-Enhanced ANN Model for Early Prediction of Type 2 Diabetes. Diagnostics 2025, 15, 3139. [Google Scholar] [CrossRef] [PubMed]
- Netayawijit, P.; Chansanam, W.; Sorn-In, K. Interpretable Machine Learning Framework for Diabetes Prediction: Integrating SMOTE Balancing with SHAP Explainability for Clinical Decision Support. Healthcare 2025, 13, 2588. [Google Scholar] [CrossRef]
- Hoyos, W.; Hoyos, K.; Ruiz, R.; Aguilar, J. An explainable analysis of diabetes mellitus using statistical and artificial intelligence techniques. BMC Med. Inform. Decis. Mak. 2024, 24, 383. [Google Scholar] [CrossRef]
- Jasim, A.A.; Hazim, L.R.; Mohammedqasim, H.; Mohammedqasem, R.; Ata, O.; Salman, O.H. e-Diagnostic system for diabetes disease prediction on an IoMT environment-based hyper AdaBoost machine learning model. J. Supercomput. 2024, 80, 15664–15689. [Google Scholar] [CrossRef]
- Ashisha, G.R.; Mary, X.A.; Kanaga, E.G.M.; Andrew, J.; Eunice, R.J. Random Oversampling-Based Diabetes Classification via Machine Learning Algorithms. Int. J. Comput. Intell. Syst. 2024, 17, 270. [Google Scholar] [CrossRef]
- Dharmarathne, G.; Jayasinghe, T.N.; Bogahawaththa, M.; Meddage, D.P.P.; Rathnayake, U. A novel machine learning approach for diagnosing diabetes with a self-explainable interface. Healthc. Anal. 2024, 5, 100301. [Google Scholar] [CrossRef]
- Rastogi, R.; Bansal, M.; Kumar, N.; Singla, S.; Singla, P.; Jaswal, R.A. Effective Diabetes Prediction using an IoT-based Integrated Ensemble Machine Learning Framework. Eng. Technol. Appl. Sci. Res. 2025, 15, 20064–20070. [Google Scholar] [CrossRef]
- Tasin, I.; Nabil, T.U.; Islam, S.; Khan, R. Diabetes prediction using machine learning and explainable AI techniques. Healthc. Technol. Lett. 2023, 10, 1–10. [Google Scholar] [CrossRef]
- Pang, K. A comparative study of explainable machine learning models with Shapley values for diabetes prediction. Healthc. Anal. 2025, 7, 100390. [Google Scholar] [CrossRef]
- Curia, F. Explainable and transparency machine learning approach to predict diabetes develop. Health Technol. 2023, 13, 769–780. [Google Scholar] [CrossRef]
- Iftikhar, K.; Javaid, N.; Ahmed, I.; Alrajeh, N. A Novel Explainable Deep Learning Framework for Accurate Diabetes Mellitus Prediction. Appl. Sci. 2025, 15, 9162. [Google Scholar] [CrossRef]
- Hasan, R.; Dattana, V.; Mahmood, S.; Hussain, S. Towards Transparent Diabetes Prediction: Combining AutoML and Explainable AI for Improved Clinical Insights. Information 2024, 16, 7. [Google Scholar] [CrossRef]
- Vivek Khanna, V.; et al. Explainable artificial intelligence-driven gestational diabetes mellitus prediction using clinical and laboratory markers. Cogent Eng. 2024, 11, 2330266. [Google Scholar] [CrossRef]
- Massari, H.E.; Sabouri, Z.; Mhammedi, S.; Gherabi, N. Diabetes Prediction Using Machine Learning Algorithms and Ontology. J. ICT Stand. 2022, 10. [Google Scholar] [CrossRef]
- Febrian, M.E.; Ferdinan, F.X.; Sendani, G.P.; Suryanigrum, K.M.; Yunanda, R. Diabetes prediction using supervised machine learning. Procedia Comput. Sci. 2023, 216, 21–30. [Google Scholar] [CrossRef]
- Mustafa, M. Diabetes prediction dataset. Kaggle. 2020. Available online: https://www.kaggle.com/datasets/iammustafatz/diabetes-prediction-dataset (accessed on 12 May 2026).
- Kibria, H.B.; Nahiduzzaman, M.; Goni, M.O.F.; Ahsan, M.; Haider, J. An Ensemble Approach for the Prediction of Diabetes Mellitus Using a Soft Voting Classifier with an Explainable AI. Sensors 2022, 22, 7268. [Google Scholar] [CrossRef]
- Rafie, Z.; Talab, M.S.; Koor, B.E.Z.; Garavand, A.; Salehnasab, C.; Ghaderzadeh, M. Leveraging XGBoost and explainable AI for accurate prediction of type 2 diabetes. BMC Public Health 2025, 25, 3688. [Google Scholar] [CrossRef]
- Chike, O.E.; Oduniyi, O.S.; Nwaiwu, J.I. An interpretable machine learning approach to predicting depression and diabetes. Healthc. Anal. 2026, 9, 100454. [Google Scholar] [CrossRef]
Figure 1.
Block schematic of the integrated comparative and XAI framework.
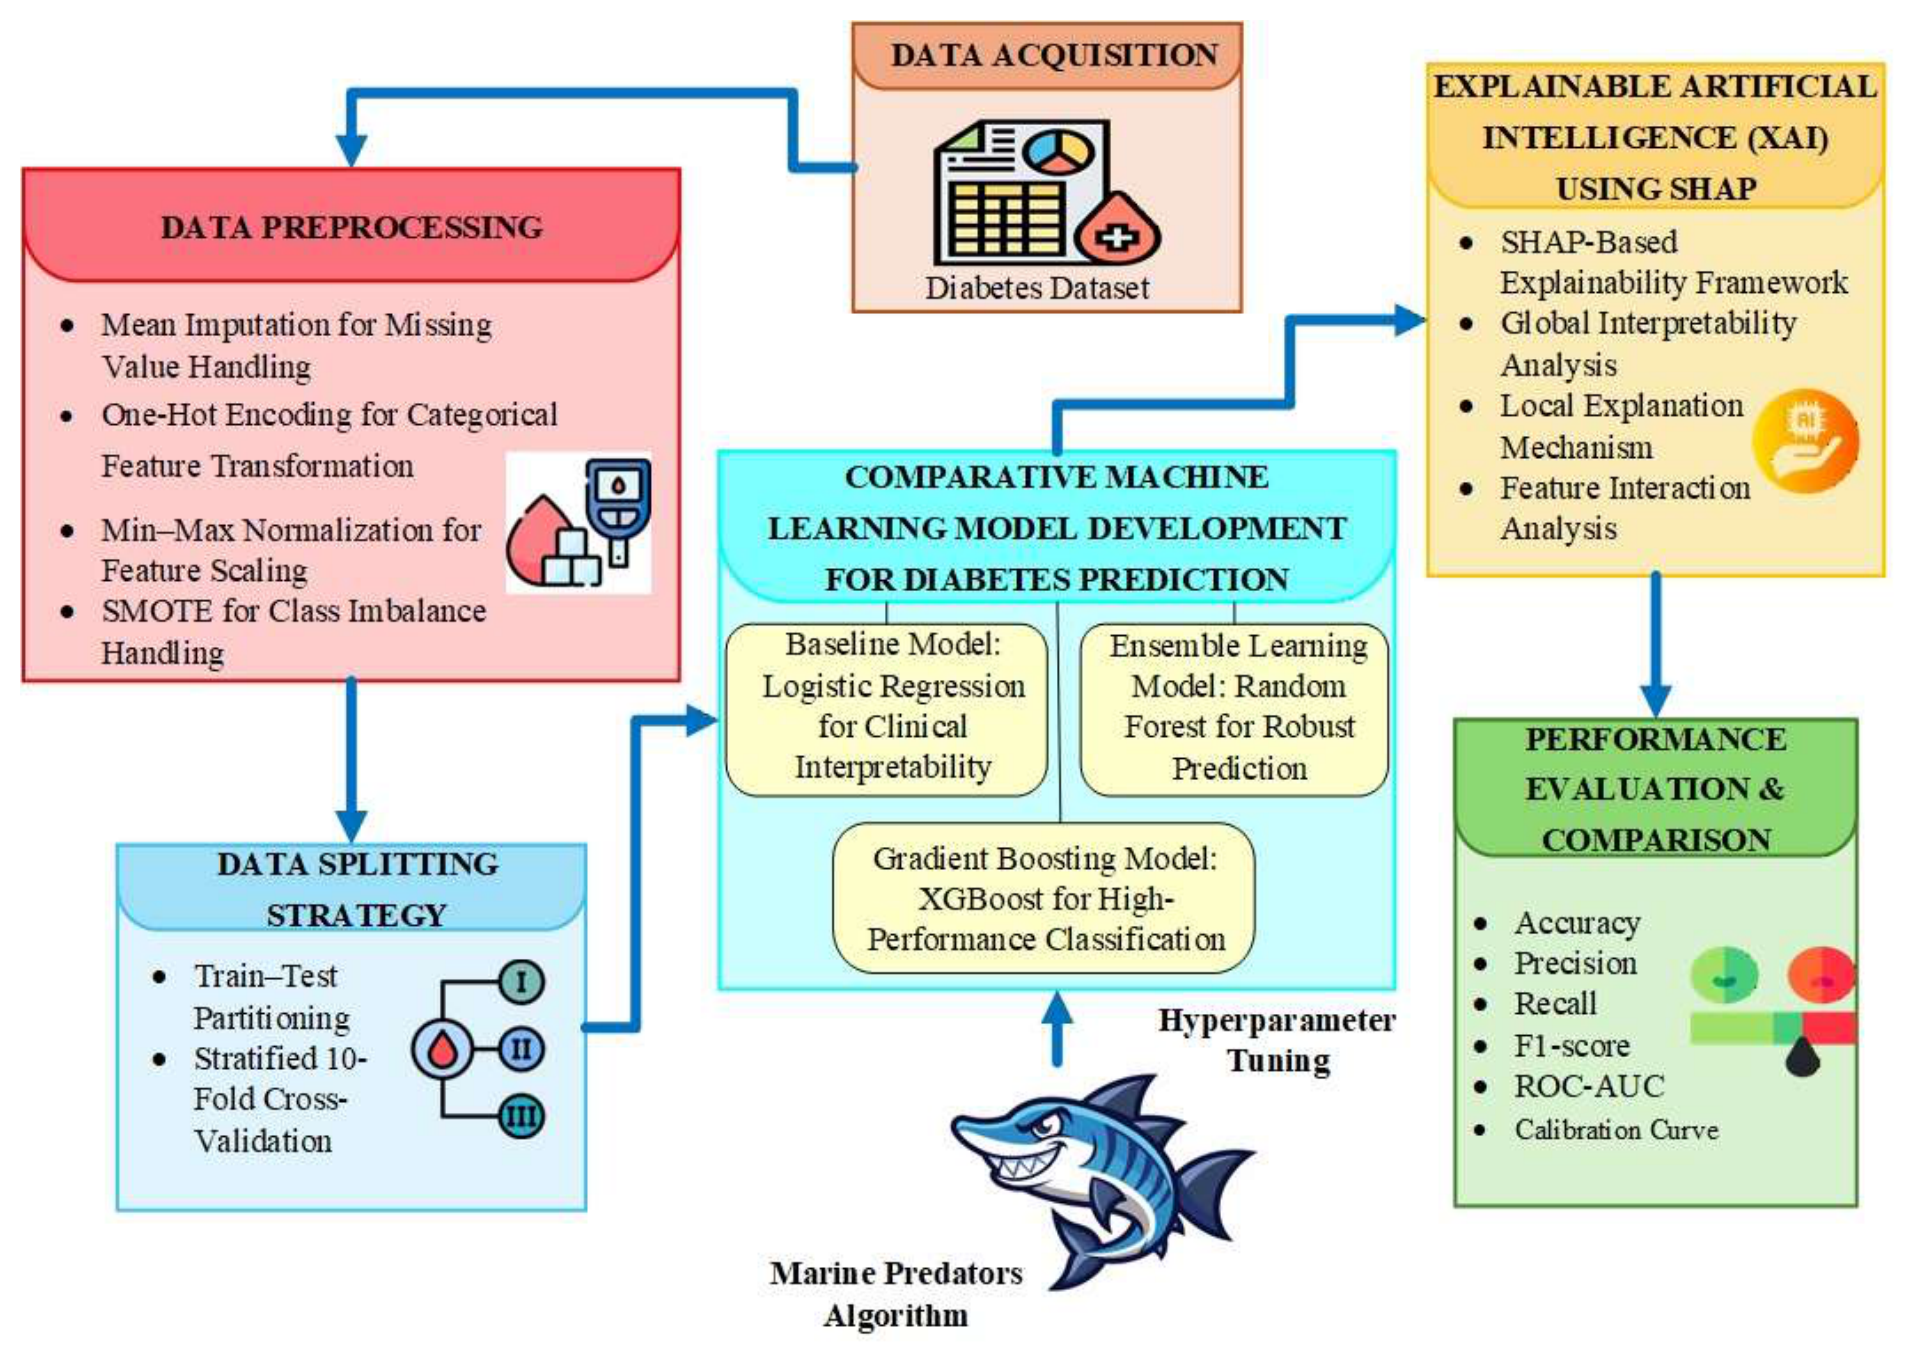
Figure 2.
Architecture of LR for diabetes prediction.
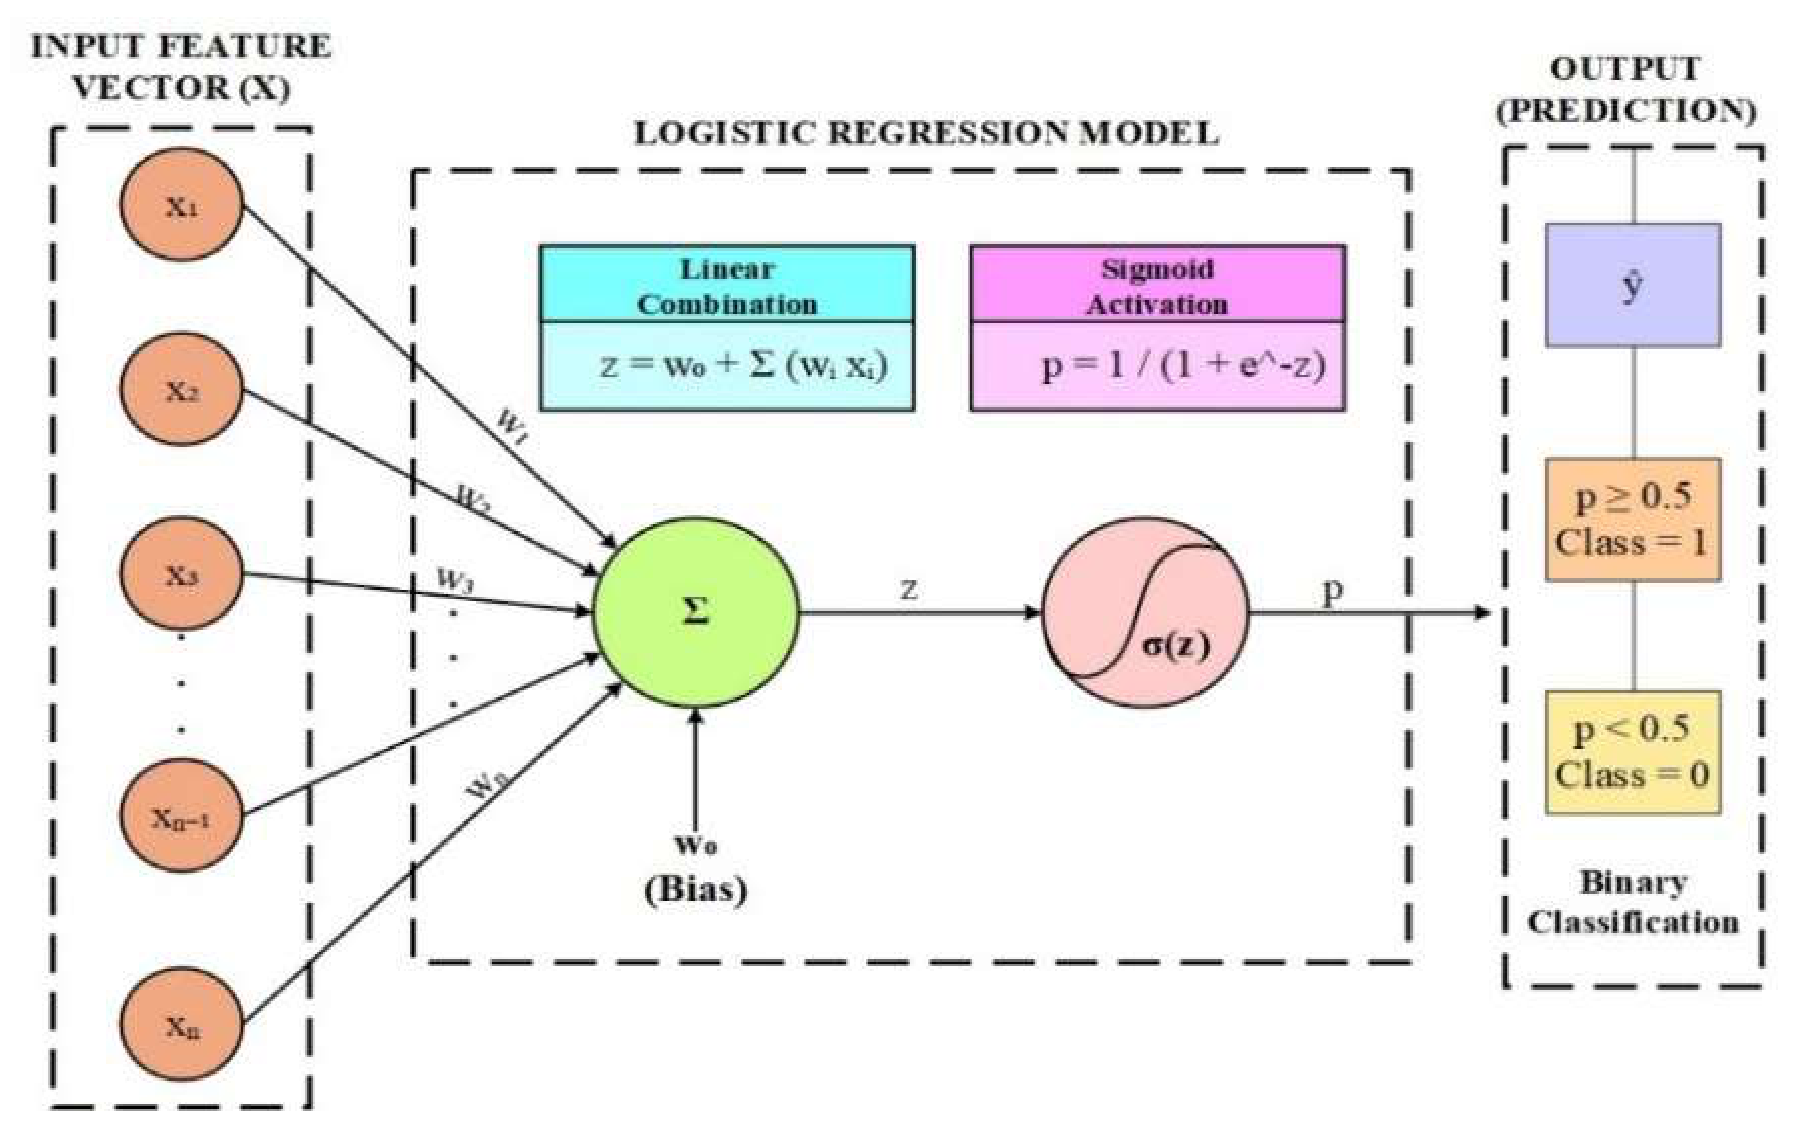
Figure 3.
RF-based ensemble framework for robust classification.
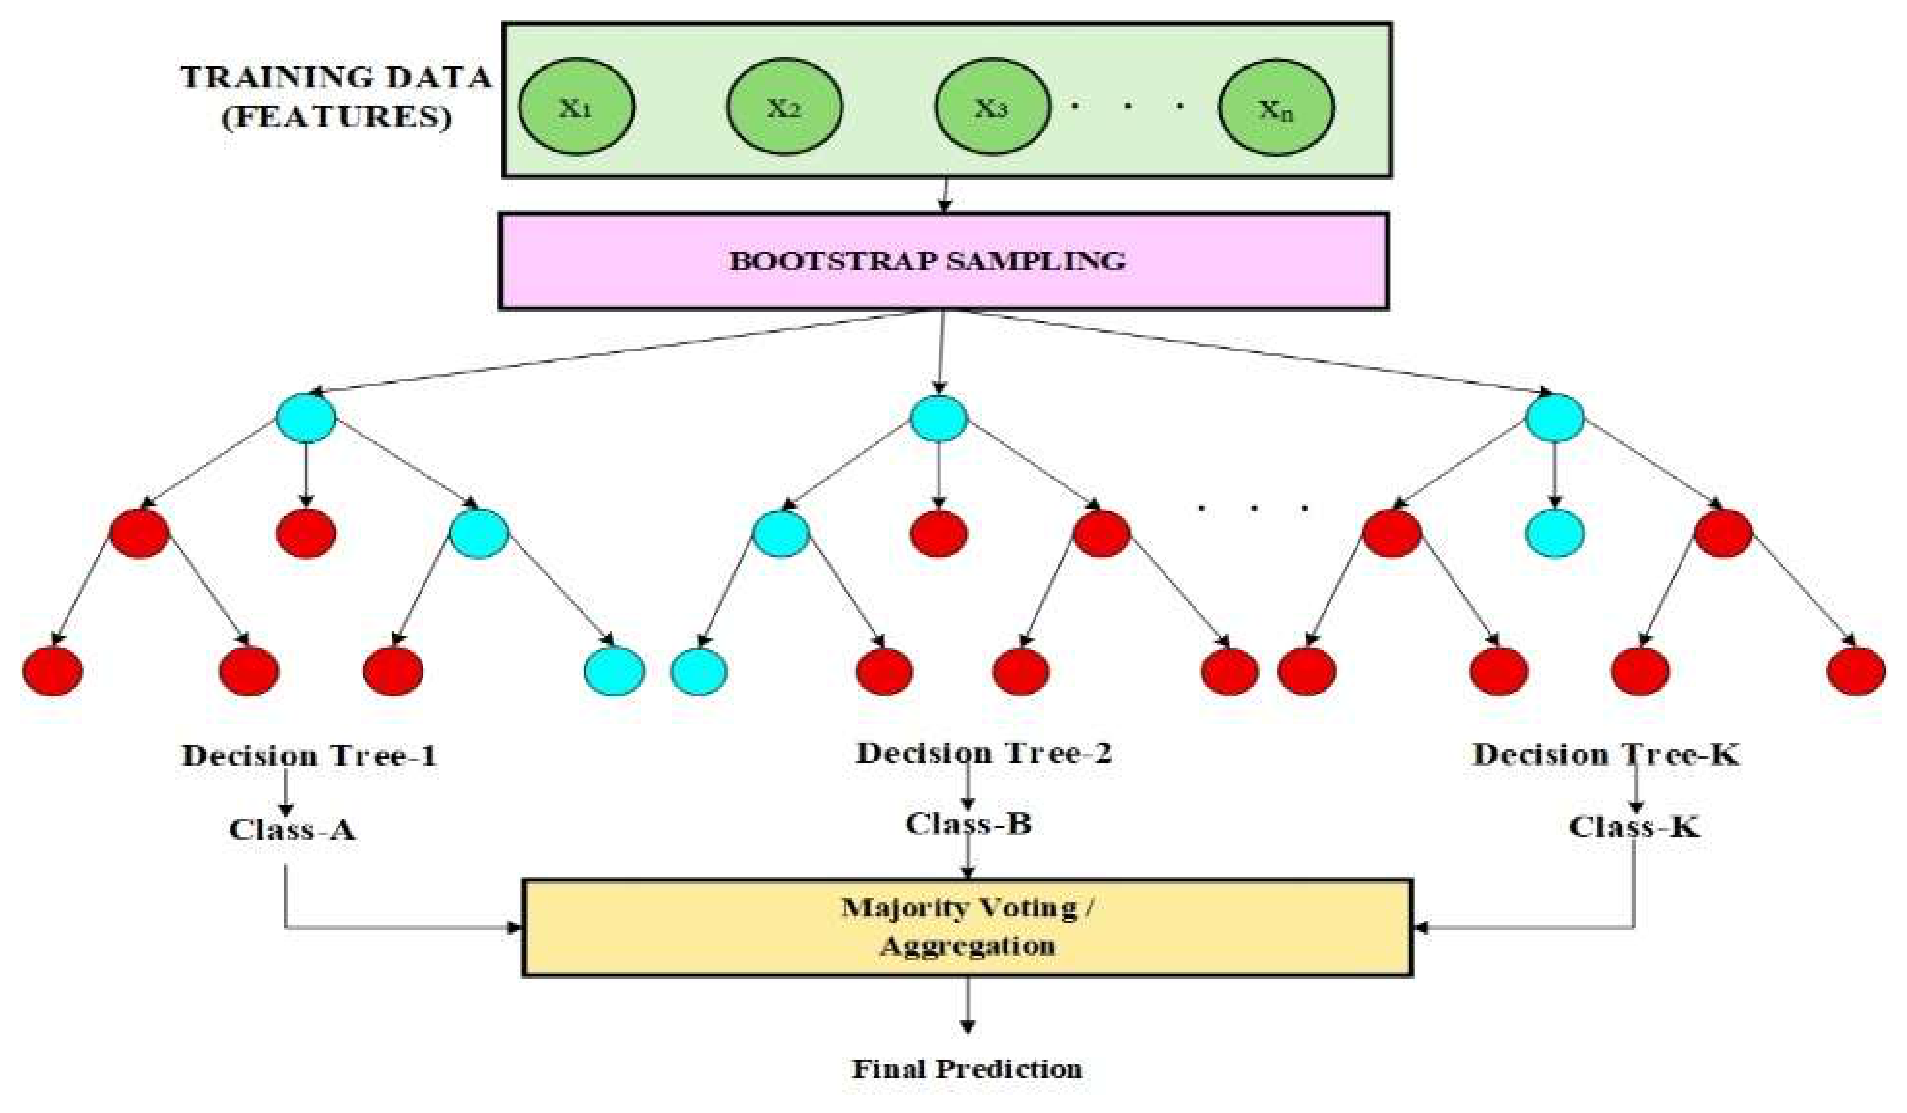
Figure 4.
XGBoost architecture diagram for high-performance predictive modeling.
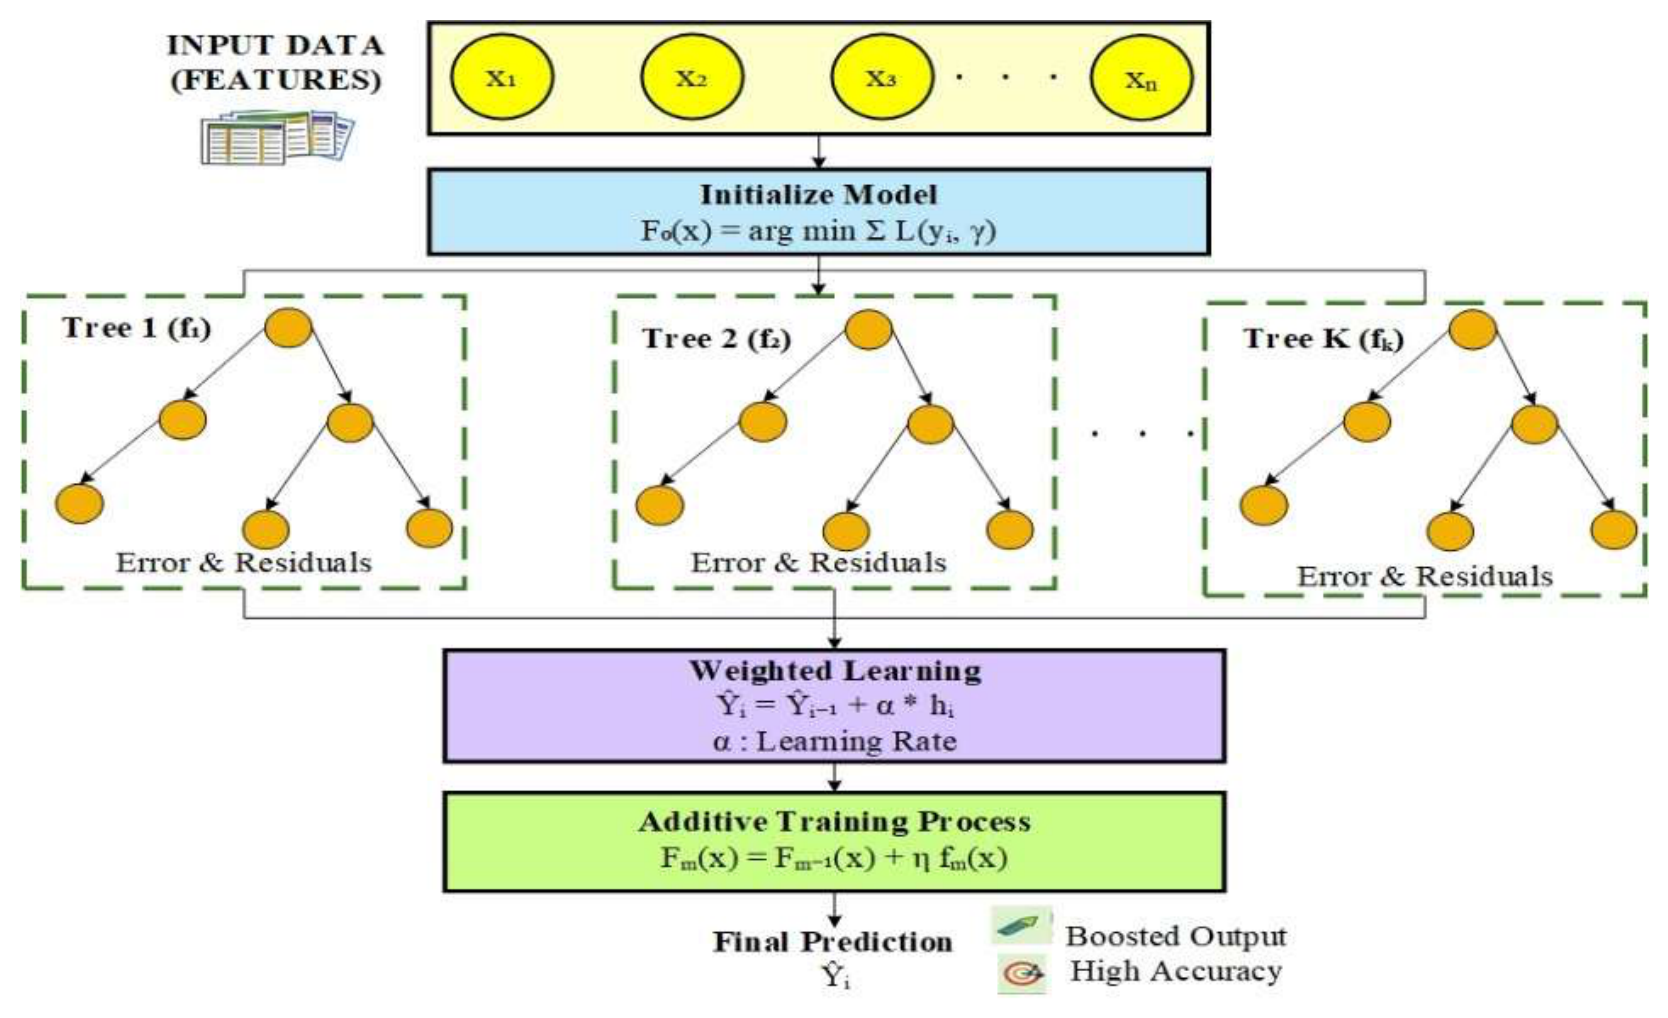
Figure 5.
Feature distribution analysis: (a) age distribution comparison between classes; (b) BMI distribution comparison between classes; (c) HbA1c level distribution comparison between classes; (d) blood glucose level distribution comparison between classes.
Figure 5.
Feature distribution analysis: (a) age distribution comparison between classes; (b) BMI distribution comparison between classes; (c) HbA1c level distribution comparison between classes; (d) blood glucose level distribution comparison between classes.
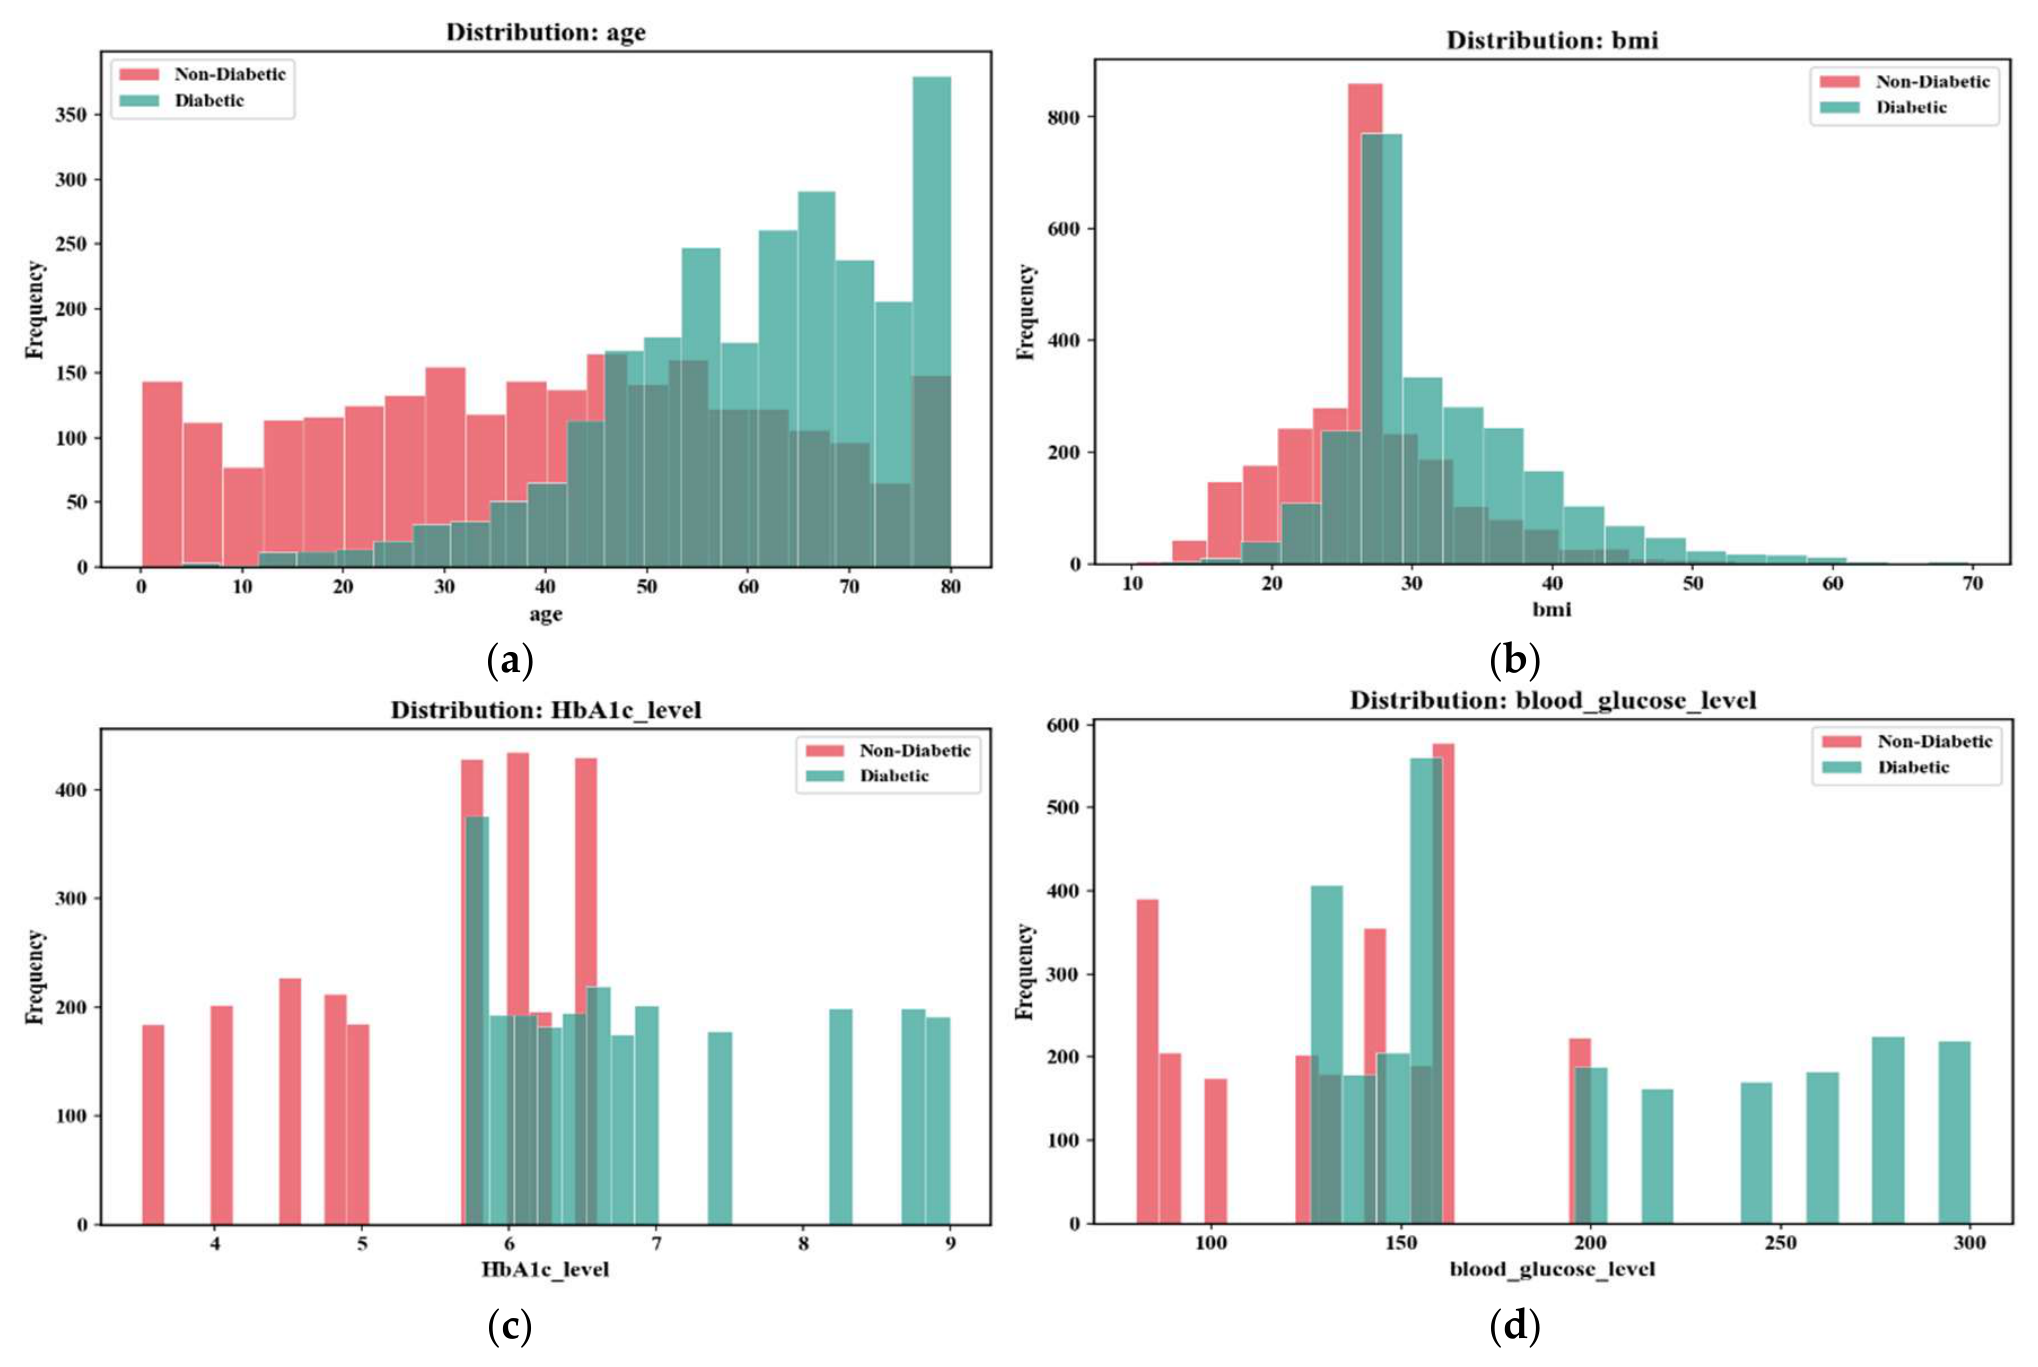
Figure 6.
Correlation heatmap of clinical features.
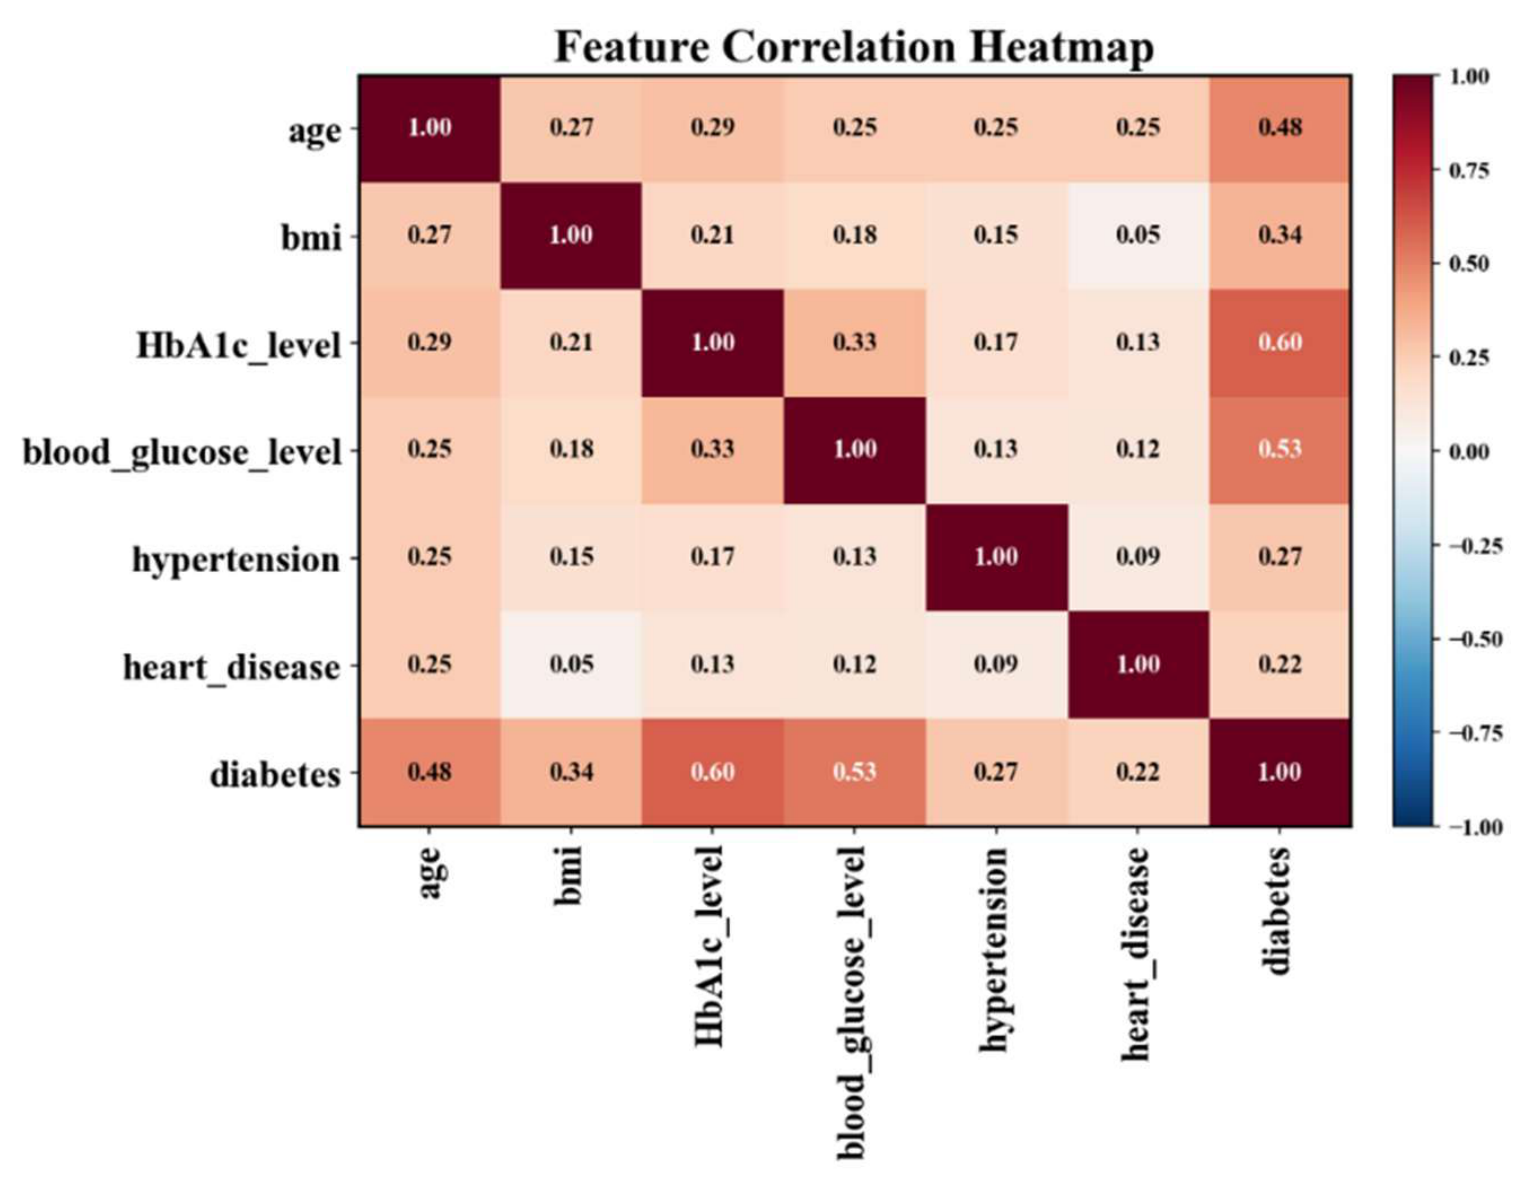
Figure 7.
ROC-AUC performance of models via 10-fold cross-validation.
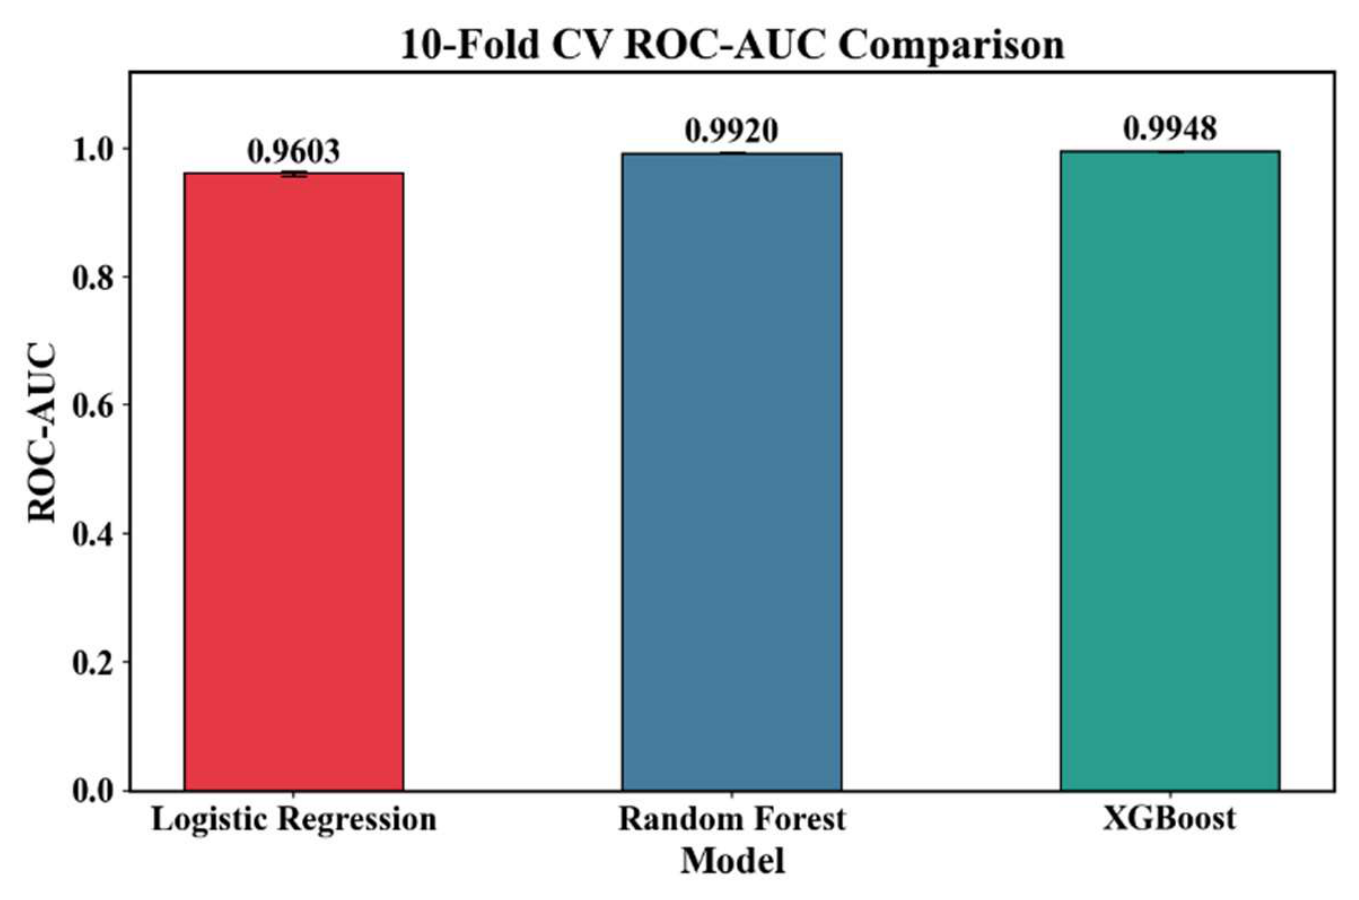
Figure 8.
Comparative performance metrics of diabetes prediction models.
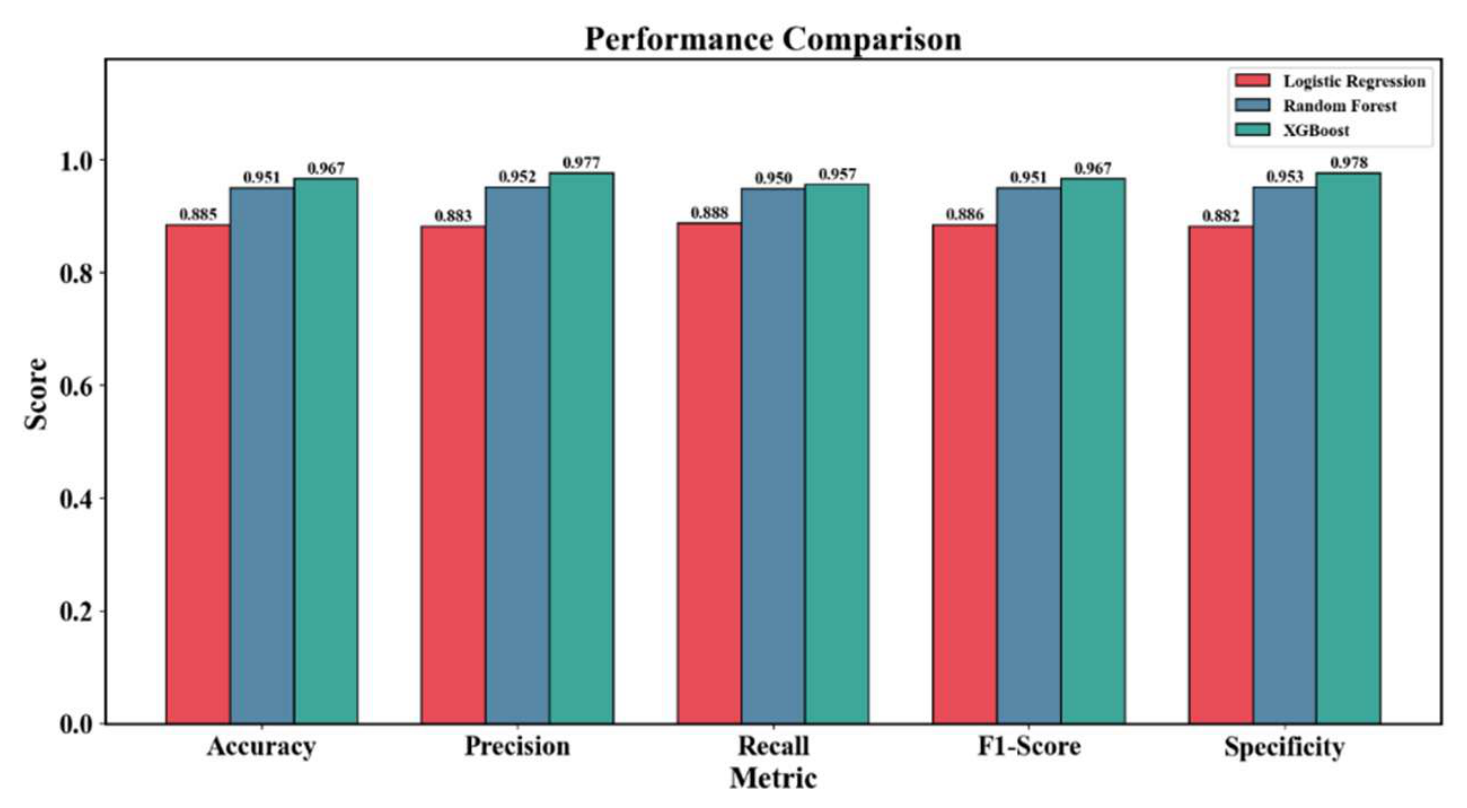
Figure 9.
Learning curves: (a) LR; (b) RF; (c) XGBoost.
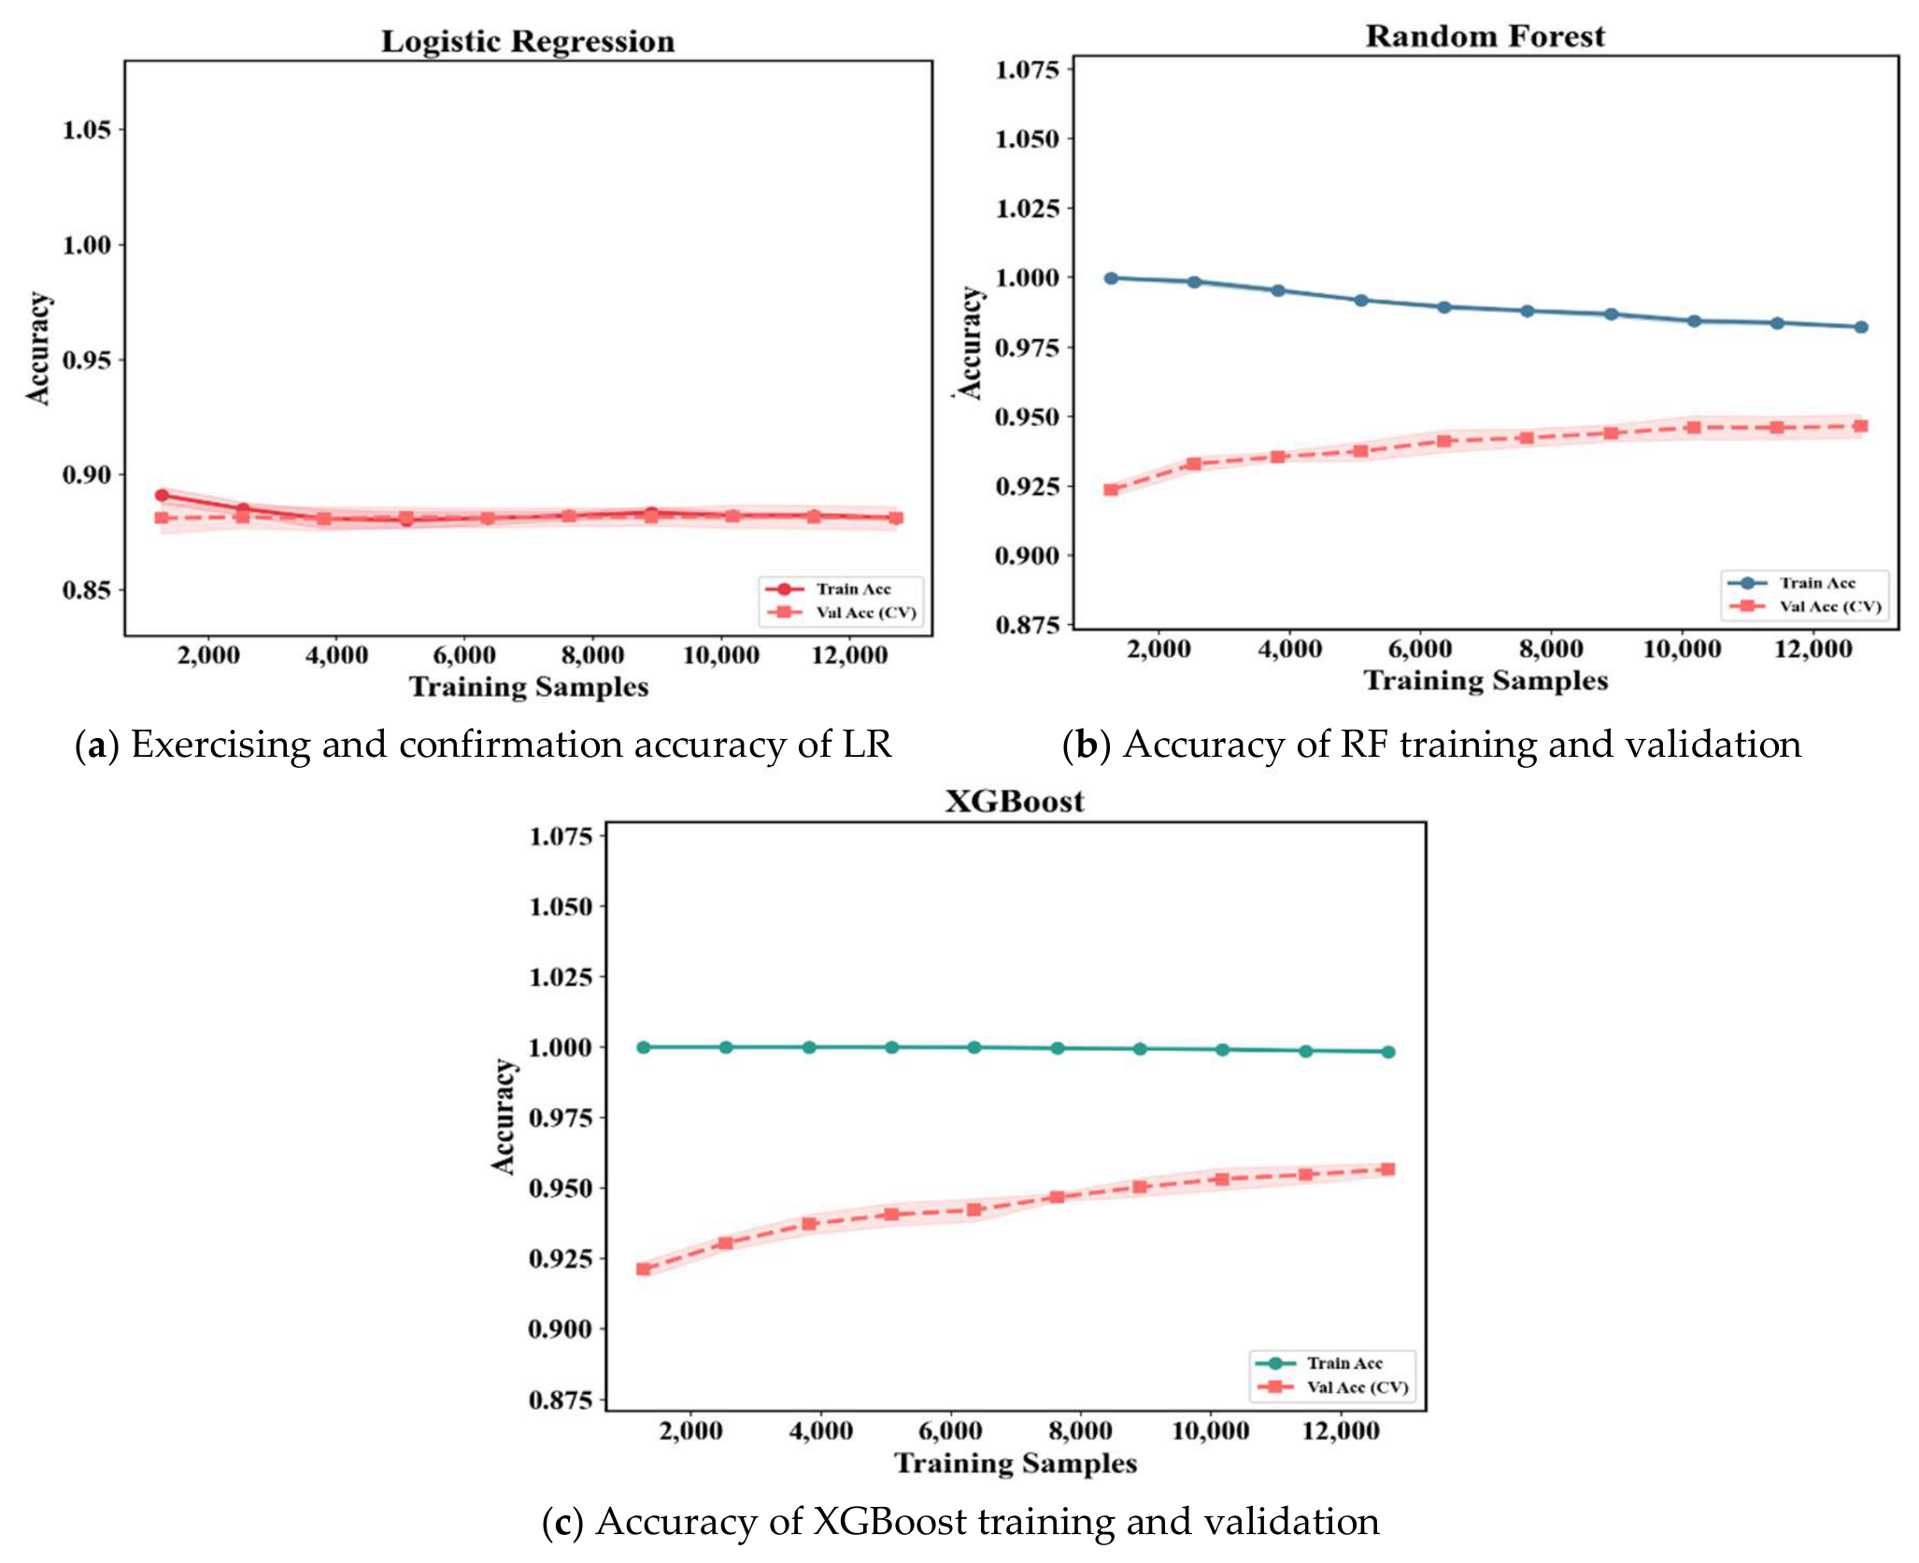
Figure 10.
Calibration curves for predicted probabilities.
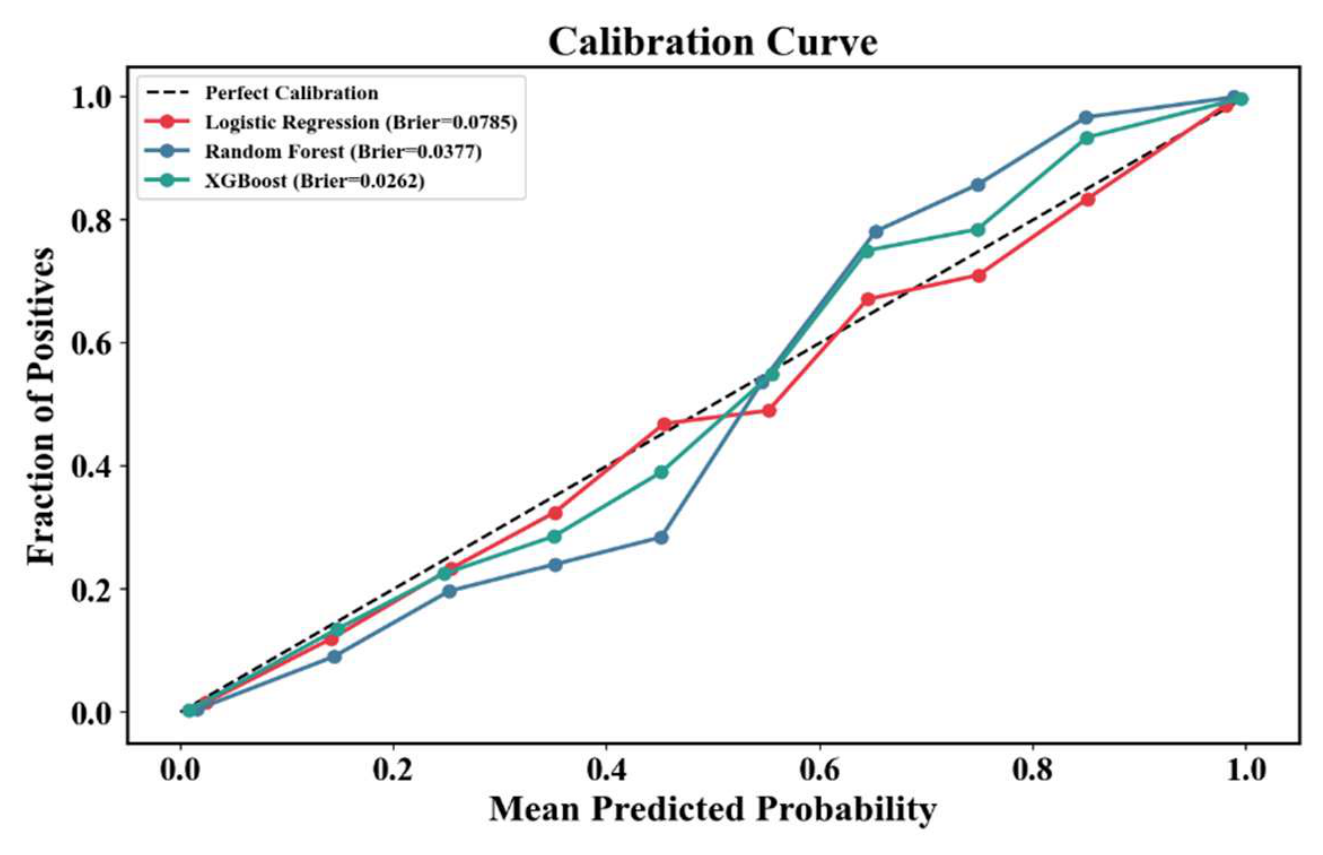
Figure 11.
Comparison of classic performance analysis: (a) ROC curves; (b) Precision-Recall curves.
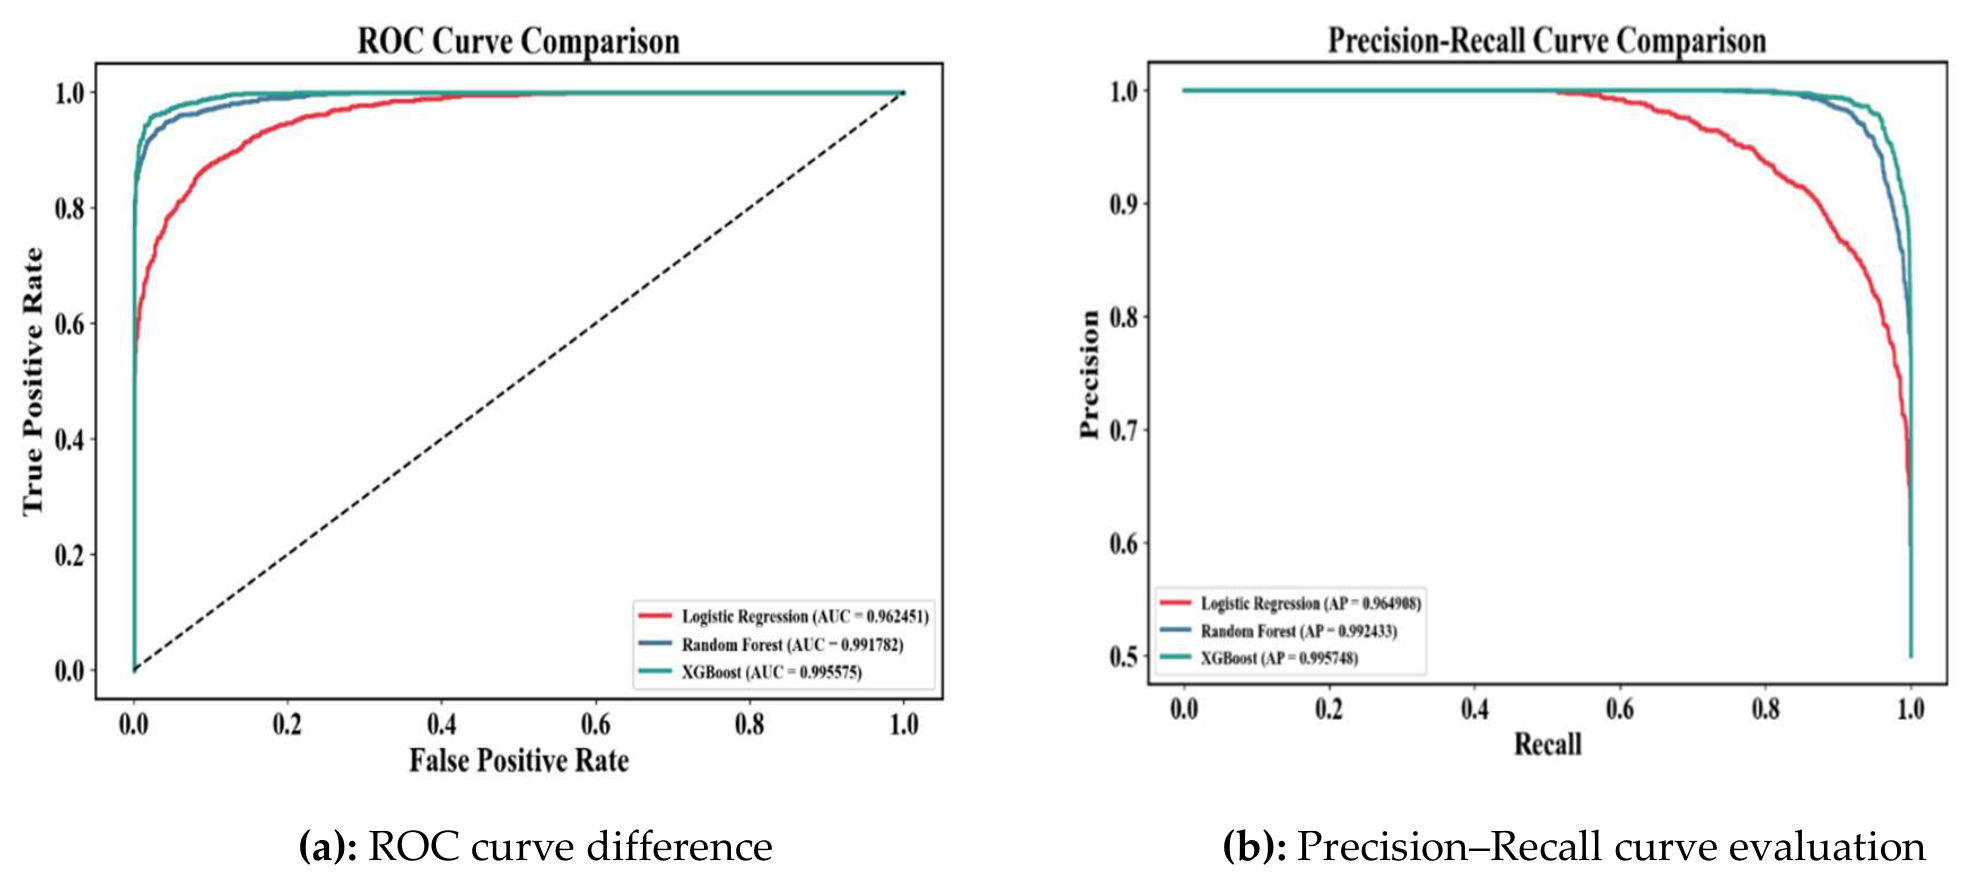
Figure 12.
Comparison of model confusion matrices: (a) LR; (b) RF; (c) XGBoost.
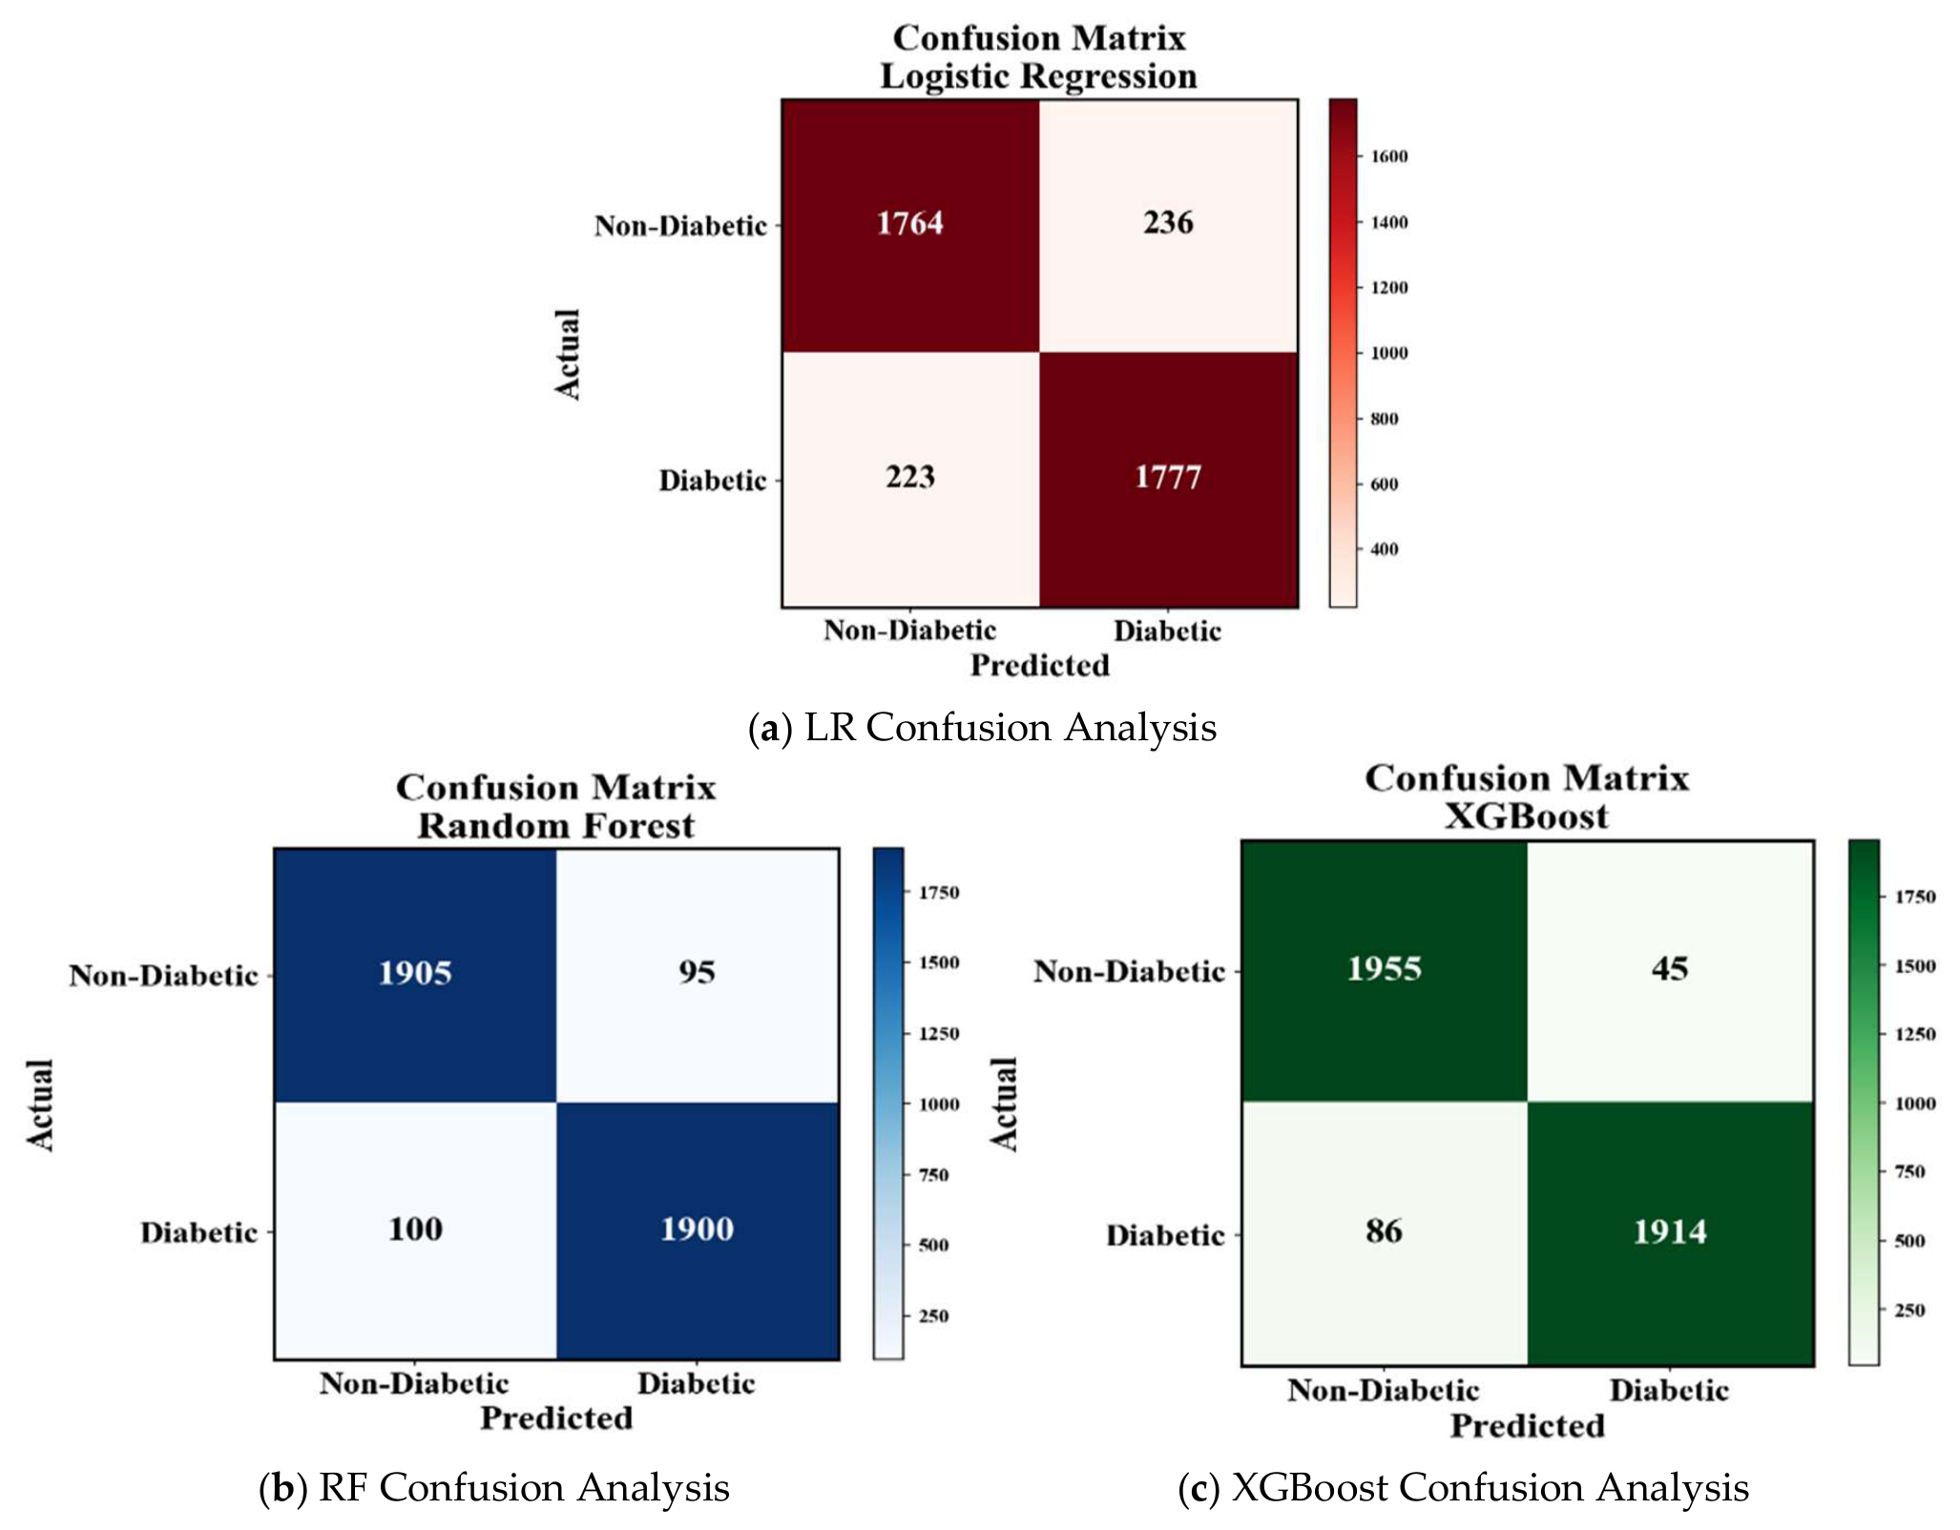
Figure 13.
Comparison of SHAP feature importance: (a) RF; (b) XGBoost.
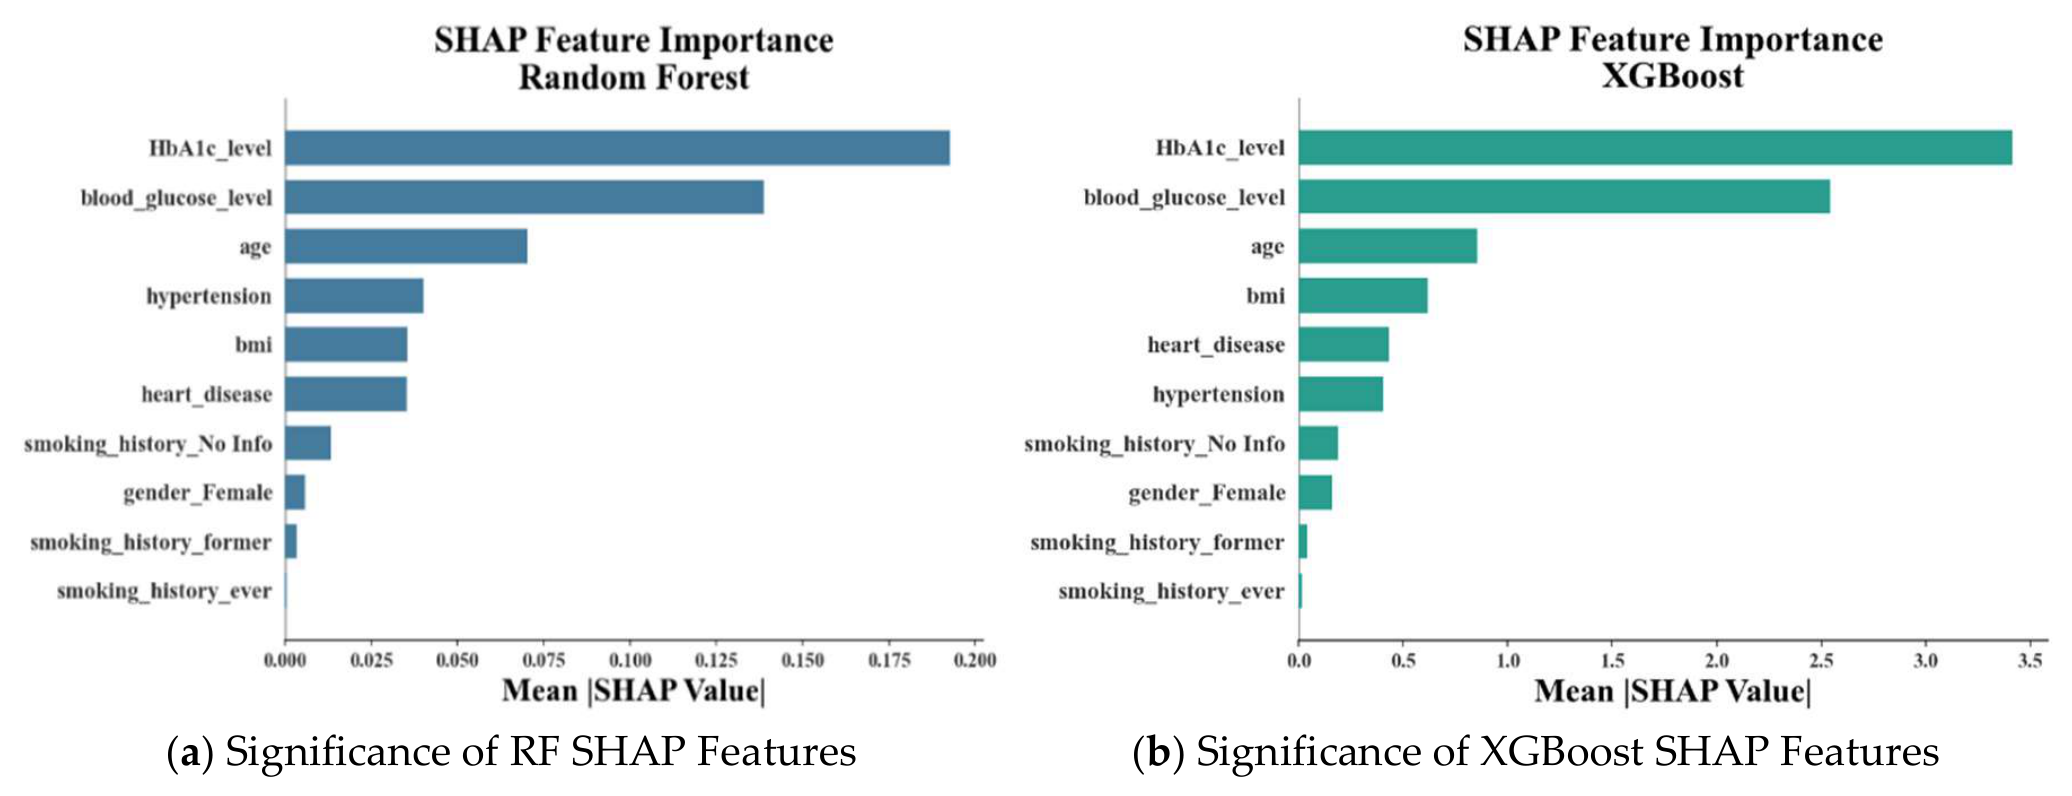
Figure 14.
Comparison of SHAP beeswarm plots: (a) RF; (b) XGBoost.
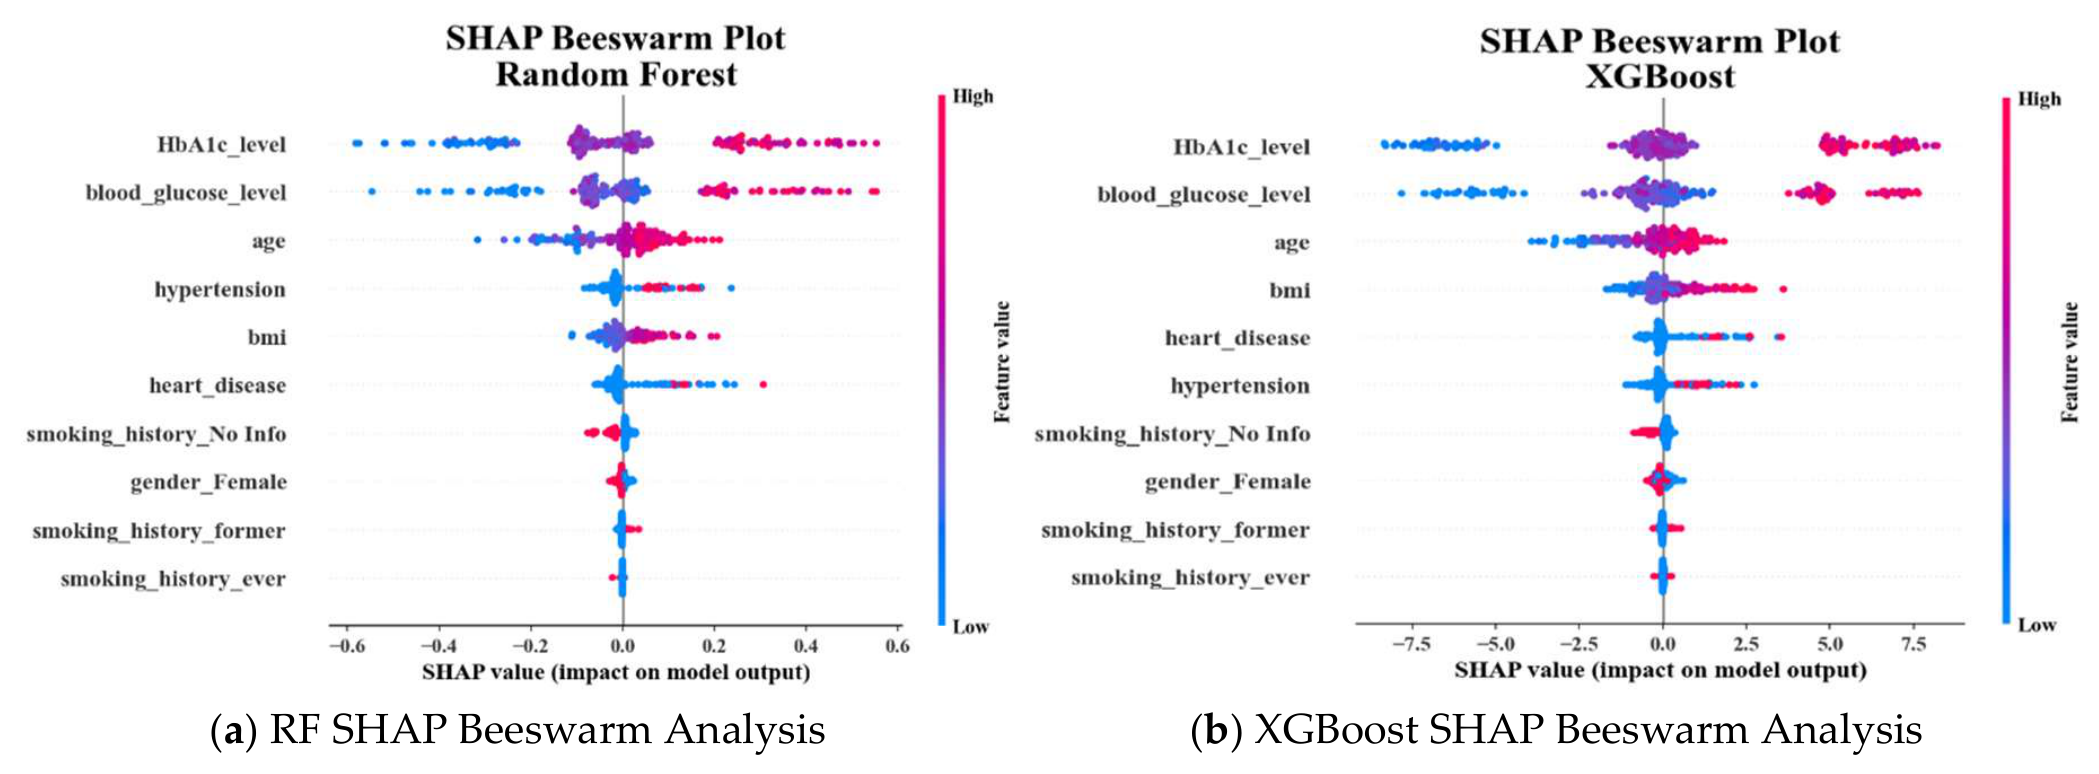
Figure 15.
SHAP analysis showing feature effects in XGBoost: (a) dependence plot for HbA1c; (b) waterfall plot of feature contributions.
Figure 15.
SHAP analysis showing feature effects in XGBoost: (a) dependence plot for HbA1c; (b) waterfall plot of feature contributions.
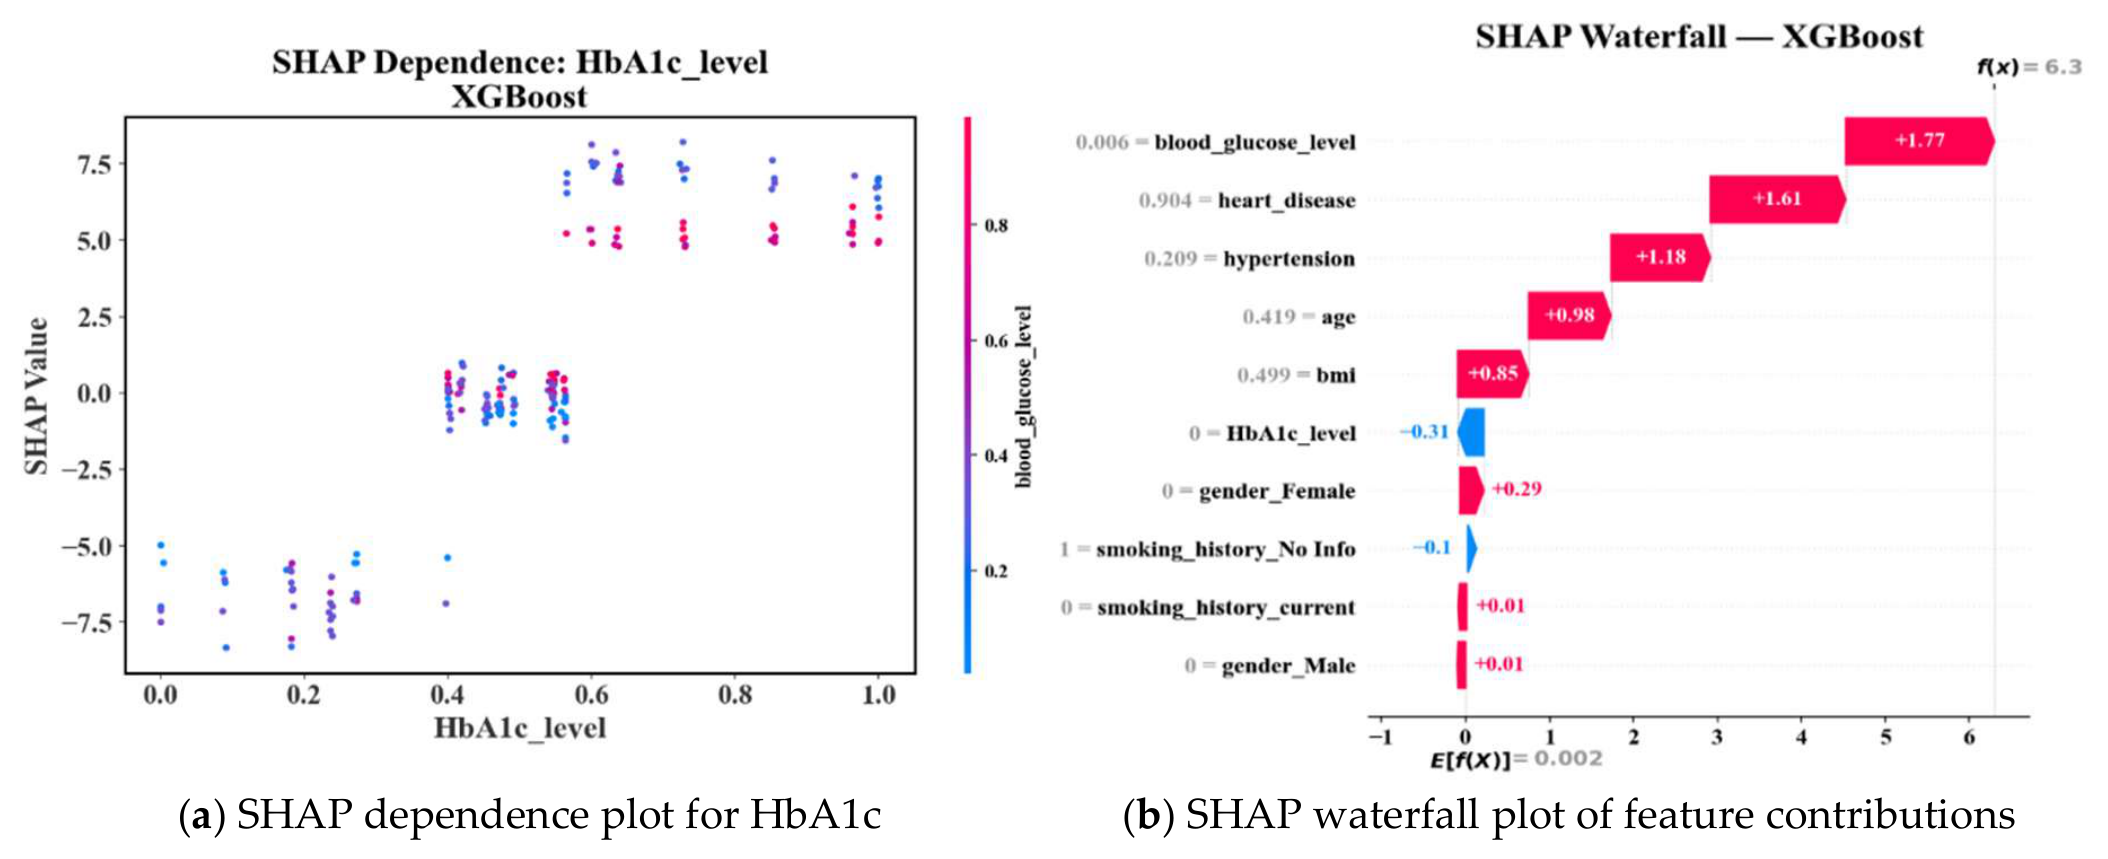

Table 1.
Dataset distribution and train-test split (after SMOTE balancing).
| Class 1 (Diabetic) | Class 0 (Non-diabetic) | Total Records | Dataset Phase |
|---|---|---|---|
| 8,500 | 91,500 | 100,000 | Original Dataset |
| 10,000 | 10,000 | 20,000 | After SMOTE Balancing |
| 8,000 | 8,000 | 16,000 | Training Set (80%) |
| 2,000 | 2,000 | 4,000 | Testing Set (20%) |
SMOTE applied only to training data to prevent leakage.
Table 2.
Hardware and software requirements.
| Specification | Component | Category |
|---|---|---|
| Intel Core i5-12400 12th Gen @ 2.50 GHz | Processor | Hardware |
| 16 GB | RAM | |
| 64-bit OS, x64-based processor | Architecture | |
| Python 3.x | Language | Software |
| 2.2.6 | NumPy | |
| 2.3.2 | Pandas | |
| 1.7.2 | Scikit-learn | |
| 3.0.5 | XGBoost | |
| 0.50.0 | SHAP | |
| 0.14.0 | Imbalanced-learn | |
| 1.16.1 | SciPy | |
| 3.10.6 | Matplotlib |
Table 3.
Model hyperparameter configuration and data splitting.
| Configuration | Component | Category |
|---|---|---|
| 2000 | max_iter | LR |
| lbfgs | solver | |
| 1 | Regularization (C) | |
| 300 | n_estimators | RF |
| 15 | max_depth | |
| balanced | class_weight | |
| 0.05 | learning_rate | XGBoost |
| 500 | n_estimators | |
| 8 | max_depth | |
| 80% / 20% | Train/Test Ratio | Data Splitting |
| Stratified 10-Fold | Cross-Validation | |
| 10 | Population Size | MPA Optimization |
| 15 | Epochs | |
| 42 | Random Seed | Reproducibility |
Table 4.
Ablation study analysis.
| Recall | Precision | ROC-AUC | F1-Score | Accuracy | Model |
|---|---|---|---|---|---|
| 0.9585 | 0.9701 | 0.9954 | 0.9643 | 0.9645 | Without SMOTE |
| 0.9445 | 0.9338 | 0.9885 | 0.9391 | 0.9388 | Without MPA |
| 0.957 | 0.977 | 0.9956 | 0.9671 | 0.9672 | Proposed Model |
Table 5.
Wilcoxon signed-rank test results.
| p-value | Test Statistic | Comparison |
|---|---|---|
| p < 0.001 | W = 12.45 | LR vs. RF |
| p < 0.001 | W = 10.87 | LR vs. XGBoost |
| p = 0.002 | W = 6.34 | RF vs. XGBoost |
Disclaimer/Publisher’s Note: The statements, opinions and data contained in all publications are solely those of the individual author(s) and contributor(s) and not of MDPI and/or the editor(s). MDPI and/or the editor(s) disclaim responsibility for any injury to people or property resulting from any ideas, methods, instructions or products referred to in the content. |
© 2026 by the authors. Licensee MDPI, Basel, Switzerland. This article is an open access article distributed under the terms and conditions of the Creative Commons Attribution (CC BY) license (http://creativecommons.org/licenses/by/4.0/).
Copyright: This open access article is published under a Creative Commons CC BY 4.0 license, which permit the free download, distribution, and reuse, provided that the author and preprint are cited in any reuse.