
Submitted:
09 June 2026
Posted:
10 June 2026
You are already at the latest version
Abstract
A study was conducted to characterize the performance of a HydroFloat® coarse particle flotation (CPF) cell using rougher tailings samples from an industrial copper mining operation. The work involved measuring internal hydrodynamic variables under a wide range of operating conditions. The effect of different operational and hydrodynamic conditions on the metallurgical performance of the HydroFloat® cell was also evaluated. Gas dispersion measurements, such as bubble size distribution, superficial gas velocity (J$_g$), superficial area flux (Sb), and residence time distribution (RTD), were recorded, enabling a detailed analysis of the cell's operation. Results show that copper recovery is strongly influenced by the superficial gas velocity (J$_g$) and the superficial liquid velocity (J$_l$). It was observed that the bubble diameter (d$_{32}$) remained relatively constant at 0.5 mm across all operating conditions, which is well below typical bubble sizes for conventional flotation cells. This suggests that contrary to what may be expected, in this kind of machine, small bubbles are able to float coarse particles. Bubble image inspection suggests that the HydroFloat{\textregistered} cell creates conditions conducive to bubble-particle aggregates, which would explain how small bubbles can float coarse particles. This study contributes to the understanding of CPF and establishes a framework for optimization in copper concentrators.
Keywords:
coarse particle flotation
; hydrodynamics
; residence time distribution
1. Introduction
The depletion of high-grade copper deposits has forced the mining industry to process lower-grade and more complex ores. Harder ores have increased energy consumption in comminution circuits, which account for up to 50% of a concentrator’s operating cost. Coarse particle flotation (CPF) has emerged as a disruptive technology to reduce overgrinding, reject gangue early, and recover valuable minerals at particle sizes above 150 m —beyond the effective range for conventional mechanical flotation cells. Fluidized-bed flotation devices such as the Eriez HydroFloat® have demonstrated successful recovery of particles up to 600 m, enabling significant improvements in throughput, energy efficiency, and potentially better water recovery from the process. Industrial studies [1,2] have demonstrated that, by integrating HydroFloat® cells into the processing circuit, it is possible to reduce overall energy consumption by approximately 20–30% while maintaining — or even improving — overall copper recovery.
Regarding water recovery, the production of a coarser tailings stream enables an increase in thickener water recovery efficiency of approximately 10–25%, thereby reducing freshwater demand and allowing higher levels of process water recirculation [3].
As observed across all flotation technologies, the performance of HydroFloat® cells is critically dependent on internal hydrodynamics, including air dispersion, bubble-particle interactions, and the mixing regime. Few studies have explored CPF hydrodynamics and surface chemistry, therefore it remains a lack of standardized methodologies to define optimal operating conditions. Similar challenges and the need for robust protocols have also been emphasized in recent fluidized bed hydrodynamic studies [4,5].
The present work aims to fill this gap by conducting a characterization study on HydroFloat® performance using rougher tailings samples from an industrial copper mining operation. The objectives of this study were to characterize key hydrodynamic variables using a laboratory HydroFloat® flotation cell under different operating conditions; identify optimal operating conditions and provide insight into the mechanisms of coarse particle flotation in this kind of equipment.
2. Materials and Methods
2.1. Sample Characterization
Approximately 10 m of slurry, corresponding to rougher tailings with 30% solids percentage from an industrial copper mining operation were homogenized and used as feed for coarse particle flotation testing. The sample was characterized in terms of chemical composition, particle size distribution, copper distribution by size, and mineralogy. Results are presented in Table 1. As can be observed, the average copper grade of the tailings sample was 0.1% Cu, with copper primarily present as 53% chalcocite and 39% chalcopyrite. Additionally, 44% of the total copper mass was found in the +106 m coarse fraction.
Given that the P observed in the particle size distribution of the rougher tailings sample was approximately 145 m, a cut size of 106 m was selected to separate the fine and coarse fractions in the feed to the HydroFloat® cell. Using 106 m as the cut size, it was observed that, for this sample, approximately 44% of the copper is contained within only about 25% of the total tailings mass.
The HydroFloat® coarse particle flotation technology based its operation on a fluidized bed produced with the very same coarse particles being fed to the flotation cell. The fluidized bed is formed with the aid of a water flow. Air is injected into the water line, and both phases pass through the bubble generator as they enter the cell. To have proper performance, the fine fraction of the feed to the HydroFloat® is removed through a classification stage performed before the flotation tests. This is done to ensure low viscosity within the fluidized bed and to minimize hydraulic entraintment. Knowing that the presence of fine particles in the feed of the flotation cell may have an impact, such variable was considered as part of this study.
Regarding the liberation of copper sulfide particles in the rougher tailings sample, it was found that in the +106 m size fraction, the particles are approximately evenly distributed among the following categories: fully locked particles, and particles with liberation degrees in the ranges of 1–5%, 5–10%, and 20–50%. This observation aligns with recent mineralogical characterizations for coarse flotation feed streams reported by [5]. Figure 1 presents the copper sulfide particles liberation by size fraction.
This observation is also consistent with the findings reported by [6], whose work demonstrated that coarse particles exhibit lower surface exposure of the valuable mineral phases, thereby reducing the probability of particle–bubble attachment during the flotation process.
The sample was subjected to a rigorous homogenization process in an agitated tank and subsequently divided into equal portions to ensure identical feed conditions for each flotation test.
2.2. Coarse Particle Flotation Cell and Bubble Viewer
All tests were carried out in a HydroFloat® cell (15 cm diameter, 37 cm height) equipped with a bubble viewer system for in-situ measurement of hydrodynamic variables. The flotation cell and bubble viewer configuration were similar to those used in previous hydrodynamic explorations of fluidized flotation systems [5,7]. Figure 2 shows the flotation cell used in the experimental campaign and the Bubble Viewer system installed for measuring the aerohydrodynamic behavior of the HydroFloat® flotation cell.
The bubble viewer consists of a sampling tube through which bubbles ascend into a viewing chamber filled with process water. The water inside the bubble viewer has the same chemical conditions that are present in the cell, pH and frother concentration, to prevent any alteration in bubble size upon entering the viewer. The bubbles are then captured by an automated camera system. The images obtained are subsequently analyzed using image analysis software to yield bubble size distribution and statistical diameters, such as d. Superficial gas velocity (J) was estimated from the gas flow rate and cross-sectional area of the cell, which allowed, together with d, for calculation of bubble surface area flux (Sb).
2.3. Residence Time Distribution Measurement
Radioactive tracer tests were conducted to measure the residence time distribution (RTD) and assess the internal mixing regime of the CPF cell. The RTD was measured under a single operating condition, which served as the baseline for evaluating the effect of other operating conditions. RTD for the tailings and concentrate streams were determined using tracer samples of tailings and concentrate, which were activated in a nuclear reactor and subsequently injected as a pulse into the feed stream of the HydroFloat® cell. The temporal evolution of the detected radiation was recorded using radiation detection equipment. This methodology is consistent with tracer-based RTD analyses applied in fluidized-bed flotation systems by [7]. Figure 3 shows photographs of the RTD measurement campaign carried out during the experimental test program.
2.4. Operating Conditions Used in the Testing Campaign
Different operating conditions were analyzed. Metallurgical recoveries and concentrate enrichment ratio were also obtained to establish the relationship between hydrodynamics and metallurgical performance. The selection of operating conditions followed a systematic framework similar to recent studies on HydroFloat® hydrodynamics and performance evaluation [4,5]. Table 2 shows the operating conditions tested in the experimental campaign. The bed depth corresponds to the distance measured from the top of the cell (concentrate discharge lip) to the top interface of the fluidized bed within the cell.
3. Results
Table 3 provides a summary of the results obtained during the experimental campaign.
3.1. Copper and Mass Recoveries Obtained
The results of copper recoveries are shown on Figure 4. These results are plotted against the mass recoveries obtained in each test. Figure 5 shows the grade enrichment ratio (ER) of the concentrates obtained in each test, plotted against the corresponding mass recoveries.
From Figure 4, it can be observed that certain operating conditions result in improved metallurgical recoveries. However, for high mass recoveries, specifically, above 25%, copper recovery no longer increases. This suggests that at the operating conditions that make the mass recovery increases above 25%, there is an increasing effect of non-selective flotation taking place that report gangue to the concentrate. The results observed in Figure 4 can be divided in three ranges: a range in which the equipment exhibits selectivity (the initial portion of the graph, where the slope is greater than 1, in this case, for mass recoveries below 20%), followed by an intermediate range in which selectivity is diminished (when the slope approaches 1, at mass recoveries between 20 and 25%), and a final range where recovery of the valuable mineral appears to be limited, with the response predominantly governed by gangue (the flat region of the graph towards the end, for mass recoveries above 25%).
Figure 5 shows that increases in metallurgical and mass recoveries are accompanied by a reduction in concentrate quality (enrichment ratio, ER), as indicated by the slope shown in the figure. This trade-off between recovery and grade is consistent with hydrodynamic and kinetic evaluations of CPF devices in the literature [4].
3.2. Effect of Air Injection
Higher air flow rates increased copper recovery and enabled the recovery of coarser particles. Figure 6 shows the effect of gas flow rate on global recovery and recovery by size.
Figure 6 (right) shows the copper recovery curves by particle size, indicating that higher air flow rates tend to improve the recovery of the coarser size fractions. This behavior is consistent with the fundamental role of gas dispersion reported in small-scale HydroFloat® hydrodynamic experiments [8].
3.3. Effect of Water Injection Rate
Copper recovery also improved with water injection rate. Figure 7 (left) shows the correlation between water injection and copper recovery. Figure 7 (right) shows the copper recovery curves by particle size, indicating that higher water injection rates tend to enhance the recovery of the coarser size fractions. However, it was also found that excessive water injection reduced selectivity by entraining fine gangue particles.
3.4. Bubble Size
An interesting finding was that the bubble diameter remained nearly constant at approximately 0.5 mm (d), regardless of the operating conditions. Figure 8 shows the bubble size distributions for all tests conducted, showing that in all cases, bubbles generated in the HydroFloat® cell are much smaller than those produced in conventional flotation machines (ca. 1.0 mm). This finding is counterintuitive as it is expected that coarse particles require large bubbles to be collected.
The use of the bubble viewer during the experimental campaign made it possible to visually observe the bubbles and collected particles captured by the sampling tube. It was consistently observed, in the different sets of images, that bubbles can form chain-like bubble particle aggregates, which appear to collaborate in increasing the buoyancy of coarse particles within the fluidized bed. These observations are consistent with reports of bubble–particle aggregate formation in fluidized-bed flotation columns [7].
Although the purpose of this work is to present the behavior of the cell under different operating conditions, and not to analyze the underlying mechanisms in coarse particle flotation, it is worth emphasizing this finding as it suggests a possible advantage of fluidized-bed in the bubble-particle collection. Figure 9 presents images of loaded bubbles and chain-like bubble particles aggregates as they appeared in the bubble viewer.
The chain-like bubble particles aggregates presented in Figure 9 were observed in all the experiments and suggest a possible mechanism of multi bubble-particle collection and upward transport of coarse particles via aggregation within the fluidized bed of the flotation cell. These observations provide evidence of a possible distinctive operating mechanism governing this type of technology.
3.5. Effect of Bubble Surface Are Flux (Sb)
Figure 10 shows the correlation between copper recoveries and superficial area flux (Sb). This graph includes only those tests in which the fluidized bed level was maintained at 3 cm below the cell concentrate lip, the fines content (-106 m) constant at 10%, and both the type and dosage of reagents kept constant. In other words, Figure 10 presents the effect of Sb on copper metallurgical recoveries, under different Jg and Jl levels.
Figure 10 shows that at Sb values above 17 s, copper recovery does not increase further, suggesting that higher values of Sb do not contribute to a better metallurgical performance. Beyond this point, further increases in Sb result primarily in the entrainment of gangue into the concentrate.
3.6. Effect of Fines Particles Content on Feed
As previously explained, the HydroFloat® coarse particle flotation technology requires classification or separation of fine and coarse particles upstream of the flotation cell to ensure a low viscosity within the fluidized bed. Different fine contents (% -106 m) were tested during the experimental campaign. To generate the particle size distribution curves used in the laboratory, various classification efficiencies in hydrocyclones were simulated using process simulation software. Figure 11 shows the particle size distribution of the total rougher tailings sample used in the experimental campaign. It also shows the size distribution of the fine fraction (-106 m) after tailings classification, as well as the feed size distributions to the HydroFloat® cell corresponding to 10% fines content (base case), 15%, 20%, and 25% fines.
Figure 12 shows the effect of fines content in the metallurgical performance of the Hydrofloat® flotation cell (HF). As it can be observed, the presence of fines (<106 m) has a negative impact on CPF performance. Copper recovery decreases significantly when the fines exceed 10% of the feed by weight. The presence of fine particles may adversely affect the mobility of bubble–particle aggregates within the fluidized bed, likely due to increased slurry viscosity and hindered settling effects associated with a higher fines fraction. This may result in a higher apparent bed viscosity, reduced permeability, and increased interparticle interactions, thereby limiting aggregate transport and overall flotation performance. This confirms the importance of efficient classification upstream of the Hydrofloat® cells.
3.7. Effect of Collector & Diesel Dosages, Bed Level and Conditioning Time
From Table 3, test results revealed that the lowest collector dosages yielded the highest copper recoveries, which is likely due to overdosing of collector caused by the presence of residual reagents in the process water, which may lead to adverse effects. These results are consistent with surface chemistry studies on attachment probability and reagent optimization in coarse particle flotation [9]. Diesel addition enhanced the Hydrofloat® performance. It is believed that this is explained by diesel contributing to emulsify the fluidized bed and promote bubble–particle attachment. As observed in most industrial-scale coarse particle flotation (CPF) operations, the use of diesel is a common practice in coarse particle recovery.
Results obtained from the experimental campaign show that bed levels lead to higher copper and mass recoveries. Additionally, the enrichment ratios indicate that operating at a lower bed level does not necessarily result in lower concentrate grades.
Regarding conditioning time, it was found that proper reagent conditioning is critical to achieving good metallurgical recoveries. Laboratory tests applied a standard conditioning time of 10 minutes. When this time was reduced, a noticeable negative impact was observed on the effectiveness of coarse particle attachment to bubbles within the fluidized bed. This is likely due to the fact that coarse particles exhibit a lower degree of liberation and a reduced exposed surface area of the target mineralogical species. Therefore, longer conditioning times may increase the probability of hydrophobization of the exposed mineral surfaces.
3.8. Residence Time Distribution (RTD)
Radioactive tracer tests indicated that the mean residence time for the baseline case is 7 minutes for gangue particles and 5 minutes for concentrate particles. Table 4 presents a summary of the results obtained from the RTD measurements. The results are consistent with the operation principle of the HydroFloat® cell as particles that form the fluidized bed will tend to stay longer inside the cell as those reaching the concentrate.
The interpretation of the RTD curves suggests that HydroFloat® cells operate under an intermediate mixing regime, ensuring sufficient particle–bubble interaction without the excessive back-mixing. Figure 13 and Figure 14 show the RTD curves obtained from the measurements conducted in this study.
This is consistent with the observations reported by Zhao et al. [10], who proposed that the fluidized bed provides a quasi-laminar and low-turbulence environment that promotes the formation and stability of particle–bubble aggregates.
The residence time distribution (RTD) curves presented in Figure 13 and Figure 14 indicate that the HydroFloat® cell does not conform to either ideal plug flow or perfectly mixed reactor behavior. Instead, the observed responses are characteristic of an intermediate hydrodynamic regime, combining axial dispersion with a moderate degree of back-mixing. The presence of delayed peaks together with extended tails towards longer residence times suggests the coexistence of multiple transport pathways within the fluidized bed, in other words, the presence of internal recirculation within the bed. For the gangue tracer (Figure 13), the RTD is dominated by the signal measured in the tailings stream, exhibiting a well-defined peak at approximately 250–300 seconds followed by a gradual decay with a pronounced long tail. In contrast, the concentrate stream shows an early-time response of significantly lower magnitude. This behavior confirms that most gangue particles follow the expected pathway towards tailings, while a minor fraction is rapidly recovered to the concentrate, likely due to hydraulic entrainment or non-selective transport mechanisms. The broad and asymmetric nature of the tailings distribution further indicates that gangue particles experience substantial residence times within the system, rather than undergoing short-circuiting.
For the concentrate tracer (Figure 14), a similar trend is observed, with the dominant response appearing in the tailings stream, while the concentrate signal is characterized by an earlier and less intense response. A fraction of valuable particles follows a rapid flotation pathway and reports to the concentrate at short residence times, whereas a significant proportion is either not captured or only weakly attached and ultimately reports to tailings after prolonged residence times.
The combined interpretation of both RTD curves reveals that both gangue and valuable particles are distributed across both product streams, albeit with different temporal signatures and relative intensities. The presence of gangue in the concentrate stream reflects incomplete selectivity, likely driven by entrainment and non-selective transport, while the presence of valuable particles in the tailings stream indicates incomplete recovery. These losses may be attributed to insufficient bubble–particle attachment, limited mineral liberation, detachment phenomena, or hydrodynamic constraints within the fluidized bed that restrict aggregate mobility and transport.
From an operational and scale-up perspective, these findings might have important implications. First, the degree of axial dispersion and back-mixing should be carefully controlled, as excessive mixing may reduce selectivity by promoting gangue entrainment, while insufficient mixing may limit particle–bubble contact. Second, the presence of long residence time tails suggests the existence of poorly mixed or low-mobility regions within the bed, which could be mitigated through improved fluidization uniformity and air distribution.
4. Discussion
The hydrodynamic and metallurgical results obtained in this study confirm that the HydroFloat® cell performance is highly dependent on the water addition, and air rate injection. The identification of a superficial area flux (Sb ≈ 17 s) above which metallurgical performance does not further improve might provide a practical guideline for industrial operation. Given that the bubble size remained essentially constant under the different operating conditions tested, the bubble surface area flux (Sb) was primarily governed by the injected air flow rate, or superficial gas velocity (J). An optimal or practical maximum Sb might ensure high copper recovery without excessive gangue entrainment, a finding consistent with previous observations in fluidized-bed flotation systems [5,7].
The residence time distribution (RTD) results highlight that residence time within the laboratory scale Hydrofloat® cell is 7 minutes. This finding is useful information for projects design when estimating Hydrofloat® units. The residence time distribution (RTD) curves indicate that the HydroFloat® cell does not conform to either ideal plug flow or perfectly mixed reactor behavior. The presence of delayed peaks together with extended tails towards longer residence times suggests the coexistence of multiple transport pathways within the fluidized bed, in other words, the presence of internal recirculation and/or stagnant zones within the bed.
Finally, results obtained suggest that reagent dosage and fines content underscores the importance of integrating hydrodynamic and surface chemistry considerations in the optimization of coarse particle flotation. Lower collector dosages were favorable due to residual reagents present in process water, while insufficient frother addition negatively impacted recovery. Similar trends regarding reagent–hydrodynamic interactions and their effect on attachment probability have been reported in surface chemistry studies [9].
5. Conclusions
- HydroFloat® performance is strongly influenced by the gas and water flows added to the teeter bed.
- A potential optimal bubble surface area flux (Sb ≈ 17 s) was identified, beyond which additional air only increases the mass pull and entrainment of gangue.
- Bubble diameter remained nearly constant (ca. 0.5 mm) across all tests, suggesting that in this kind of machine, small bubbles can collect coarse particles.
- The observation of chain-like bubble particles aggregates suggests a possible mechanism to be considered when modelling the phenomena taking place within the fluidized bed.
- Residence time distribution (RTD) measurements indicated a mean residence time of 7 minutes with limited back-mixing.
- HydroFloat® performance was negatively affected by excessive fines and collector overdosing, while adequate frother addition is essential to maintain recovery.
- Results suggest that the integration of hydrodynamic and surface chemistry perspectives is key for optimizing HydroFloat® performance.
Author Contributions
Conceptualization, C.S. and W.K.; methodology, C.S., W.K. and F.V.; experimental campaign execution, F.S and W.K.; validation, C.S., W.K.; formal analysis, C.S and W.K.; writing—original draft preparation, C.S.; writing—review and editing, C.S. and W.K. All authors have read and agreed to the published version of the manuscript.
Funding
This research received no external funding.
Acknowledgments
The authors acknowledge the support Eriez for providing the facilities, and technical expertise. Special thanks are extended to the laboratory team for their assistance in conducting the experimental campaign.
Conflicts of Interest
The authors declare no conflicts of interest.
Abbreviations
The following abbreviations are used in this manuscript:
| CPF | Coarse Particle Flotation |
| RTD | Residence Time Distribution |
| ER | Enrichment Ratio |
References
- Kohmuench, J.N.; Mankosa, M.J.; Thanasekaran, H.; Hobert, A. Improving coarse particle flotation using the HydroFloat® (raising the trunk of the elephant curve). Miner. Eng. 2018, 121, 137–145. [Google Scholar] [CrossRef]
- Verster, I.; Awatey, B.; Forbes, L.; Morrison, A.; Mankosa, M.; Runge, K. Small-scale fluidised bed flotation device for ore amenability testing. Miner. Eng. 2014, 216, 108848. [Google Scholar] [CrossRef]
- Sun, W.; Jin, Y.; Peng, J.; Wu, Q.; Xu, J.; Huang, M.; Du, W.; Han, H.; Luo, Y.; Fuchao Fan, F.; Bie, Z. Development and industrial validation of a novel fluidized flotation column for coarse copper tailings recovery. Miner. Eng. 2025, 234, 109695. [Google Scholar] [CrossRef]
- Crompton, L.J.; Islam, M.T.; Gibbs, E.; Galvin, K.P. A new method for assessing coarse particle flotation performance Part 2: Assessment of reproducibility using data from a mechanical cell. Miner. Eng. 2025, 224, 109210. [Google Scholar] [CrossRef]
- Ozsoy, Y.; Honaker, R.Q.; Mankosa, M.; Hobert, A.; Bhambhani, T.; Lycans, S.J. Revolutionizing coarse particle flotation Part I – A comprehensive exploration method for the HydroFloat technology. Miner. Eng. 2025, 231, 109453. [Google Scholar] [CrossRef]
- Ding, S.; Yin, Q.; Shi, W.; He, Q.; Liu, J.; Gui, X.; Xing, Y. Analysis of difficult flotation mechanisms for coarse low-rank coal: Comparing fluidized-bed and mechanical flotation technologies. Powder Technol. 2024, 448, 120336. [Google Scholar] [CrossRef]
- Liu, J.; Meng, W.; Zhang, Y.; Xing, Y.; Gui, X. Insight into bubble hydrodynamic characteristics in the freeboard region of fluidized bed flotation columns. Chem. Eng. Sci. 2025, 316, 121926. [Google Scholar] [CrossRef]
- Meng, W.; Liu, J.; Zhang, Y.; Xing, Y.; Gui, X. Impact of the fluidized bed flotation hydrodynamics on coarse particle recovery. Miner. Eng. 2025, 223, 109187. [Google Scholar]
- Zhang, Y.; Liu, J.; Yin, Q.; Meng, W.; Ding, S.; Xing, Y. Surface chemical mechanisms and bubble–particle attachment probability in coarse particle flotation. Miner. Eng. 2025, 222, 109162. [Google Scholar]
- Zhao, L.; Tang, D.; Liu, Q. Fundamental understandings of the limits in coarse particle flotation: A review. Miner. Eng. 2025, 232, 109487. [Google Scholar] [CrossRef]
Figure 1.
Liberation by size fraction of copper sulfide particles.
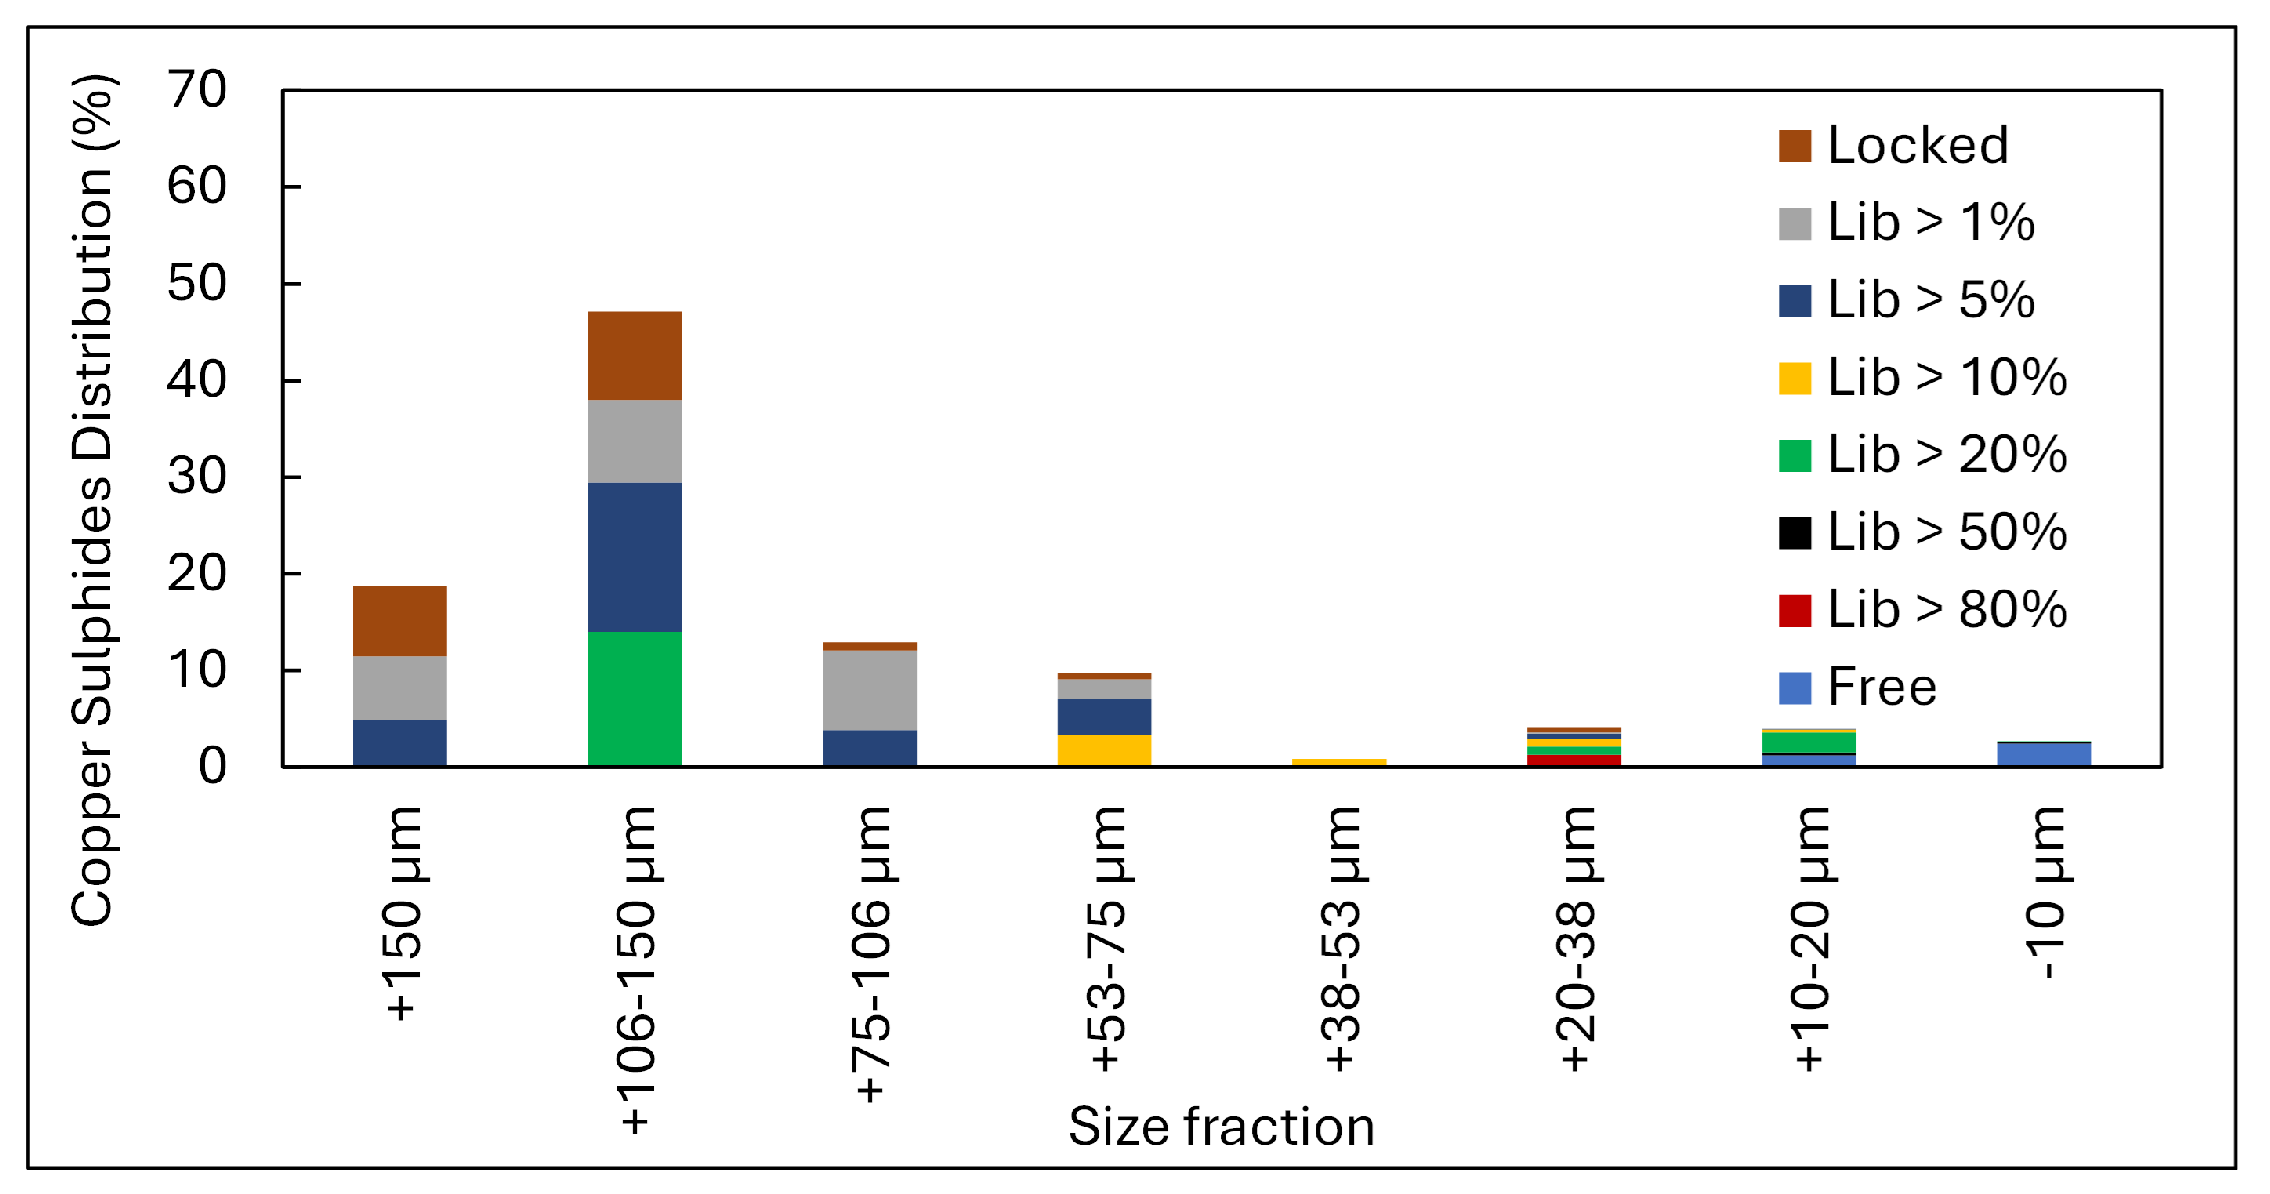
Figure 2.
Hydrofloat® cell and bubble viewer used in the testing campaign.
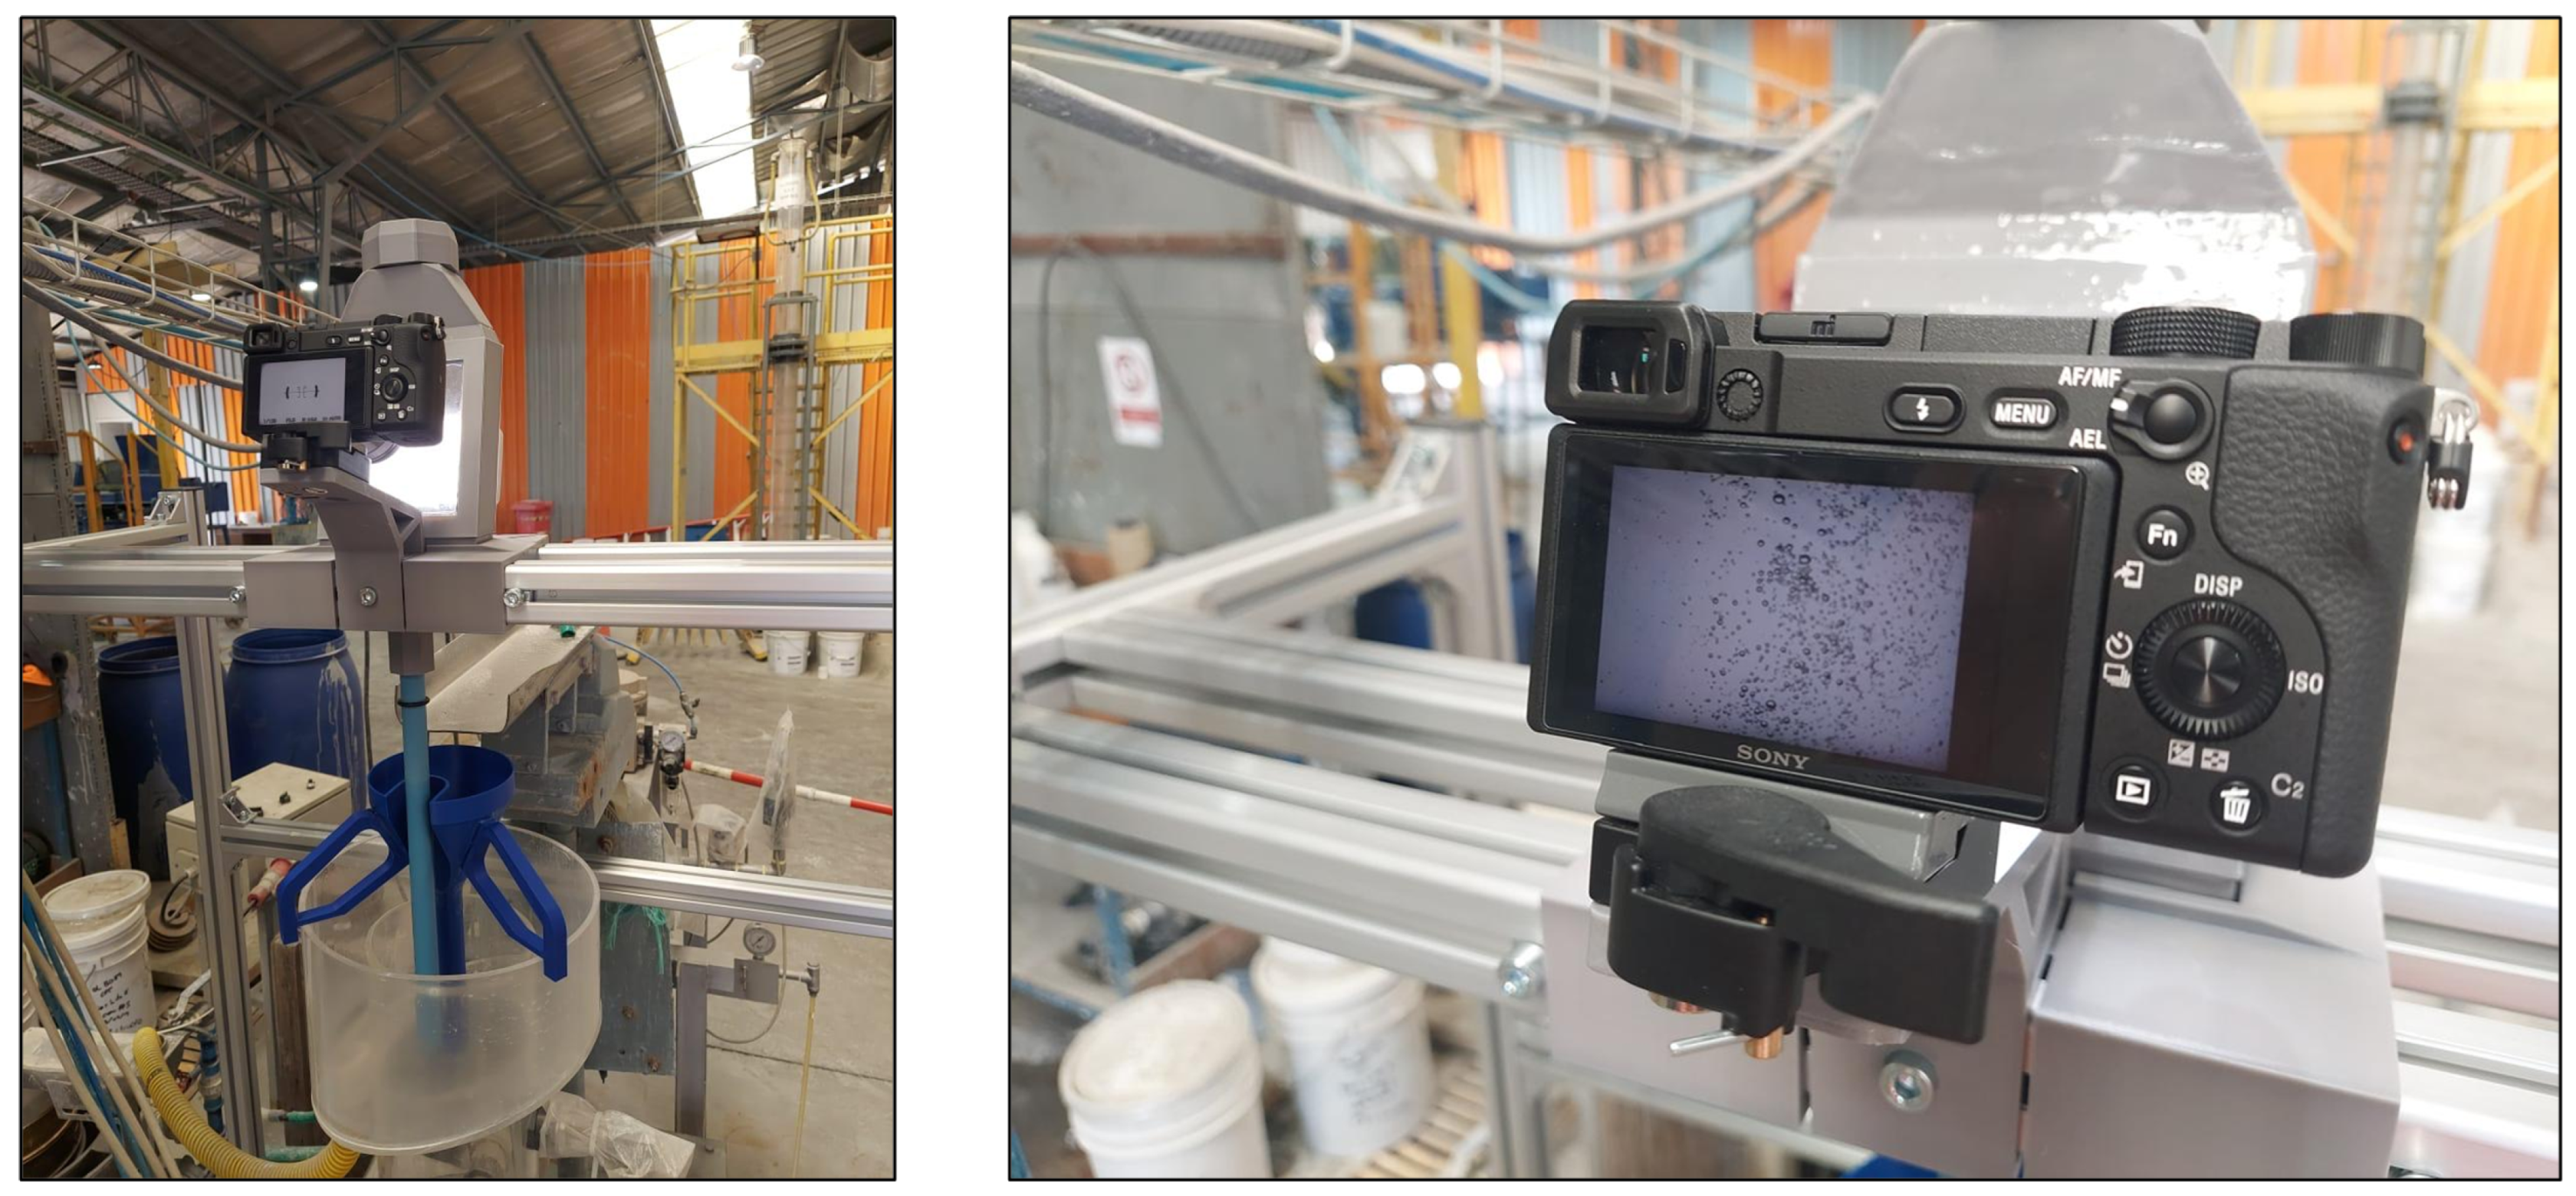
Figure 3.
RTD measurement performed in the experimental campaign.
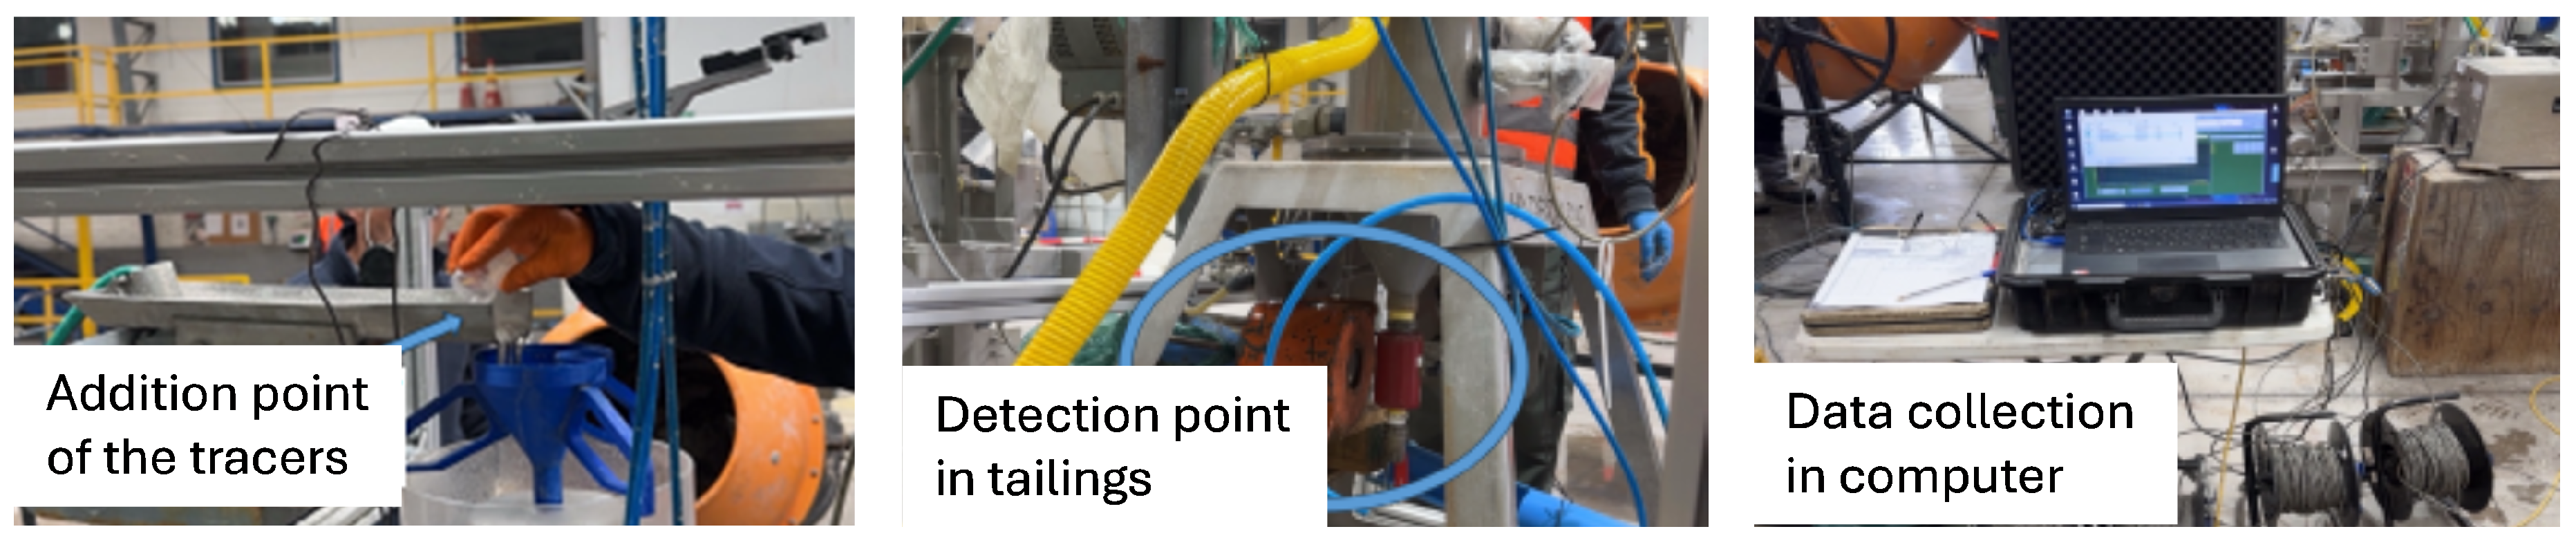
Figure 4.
Copper recoveries versus mass recoveries.
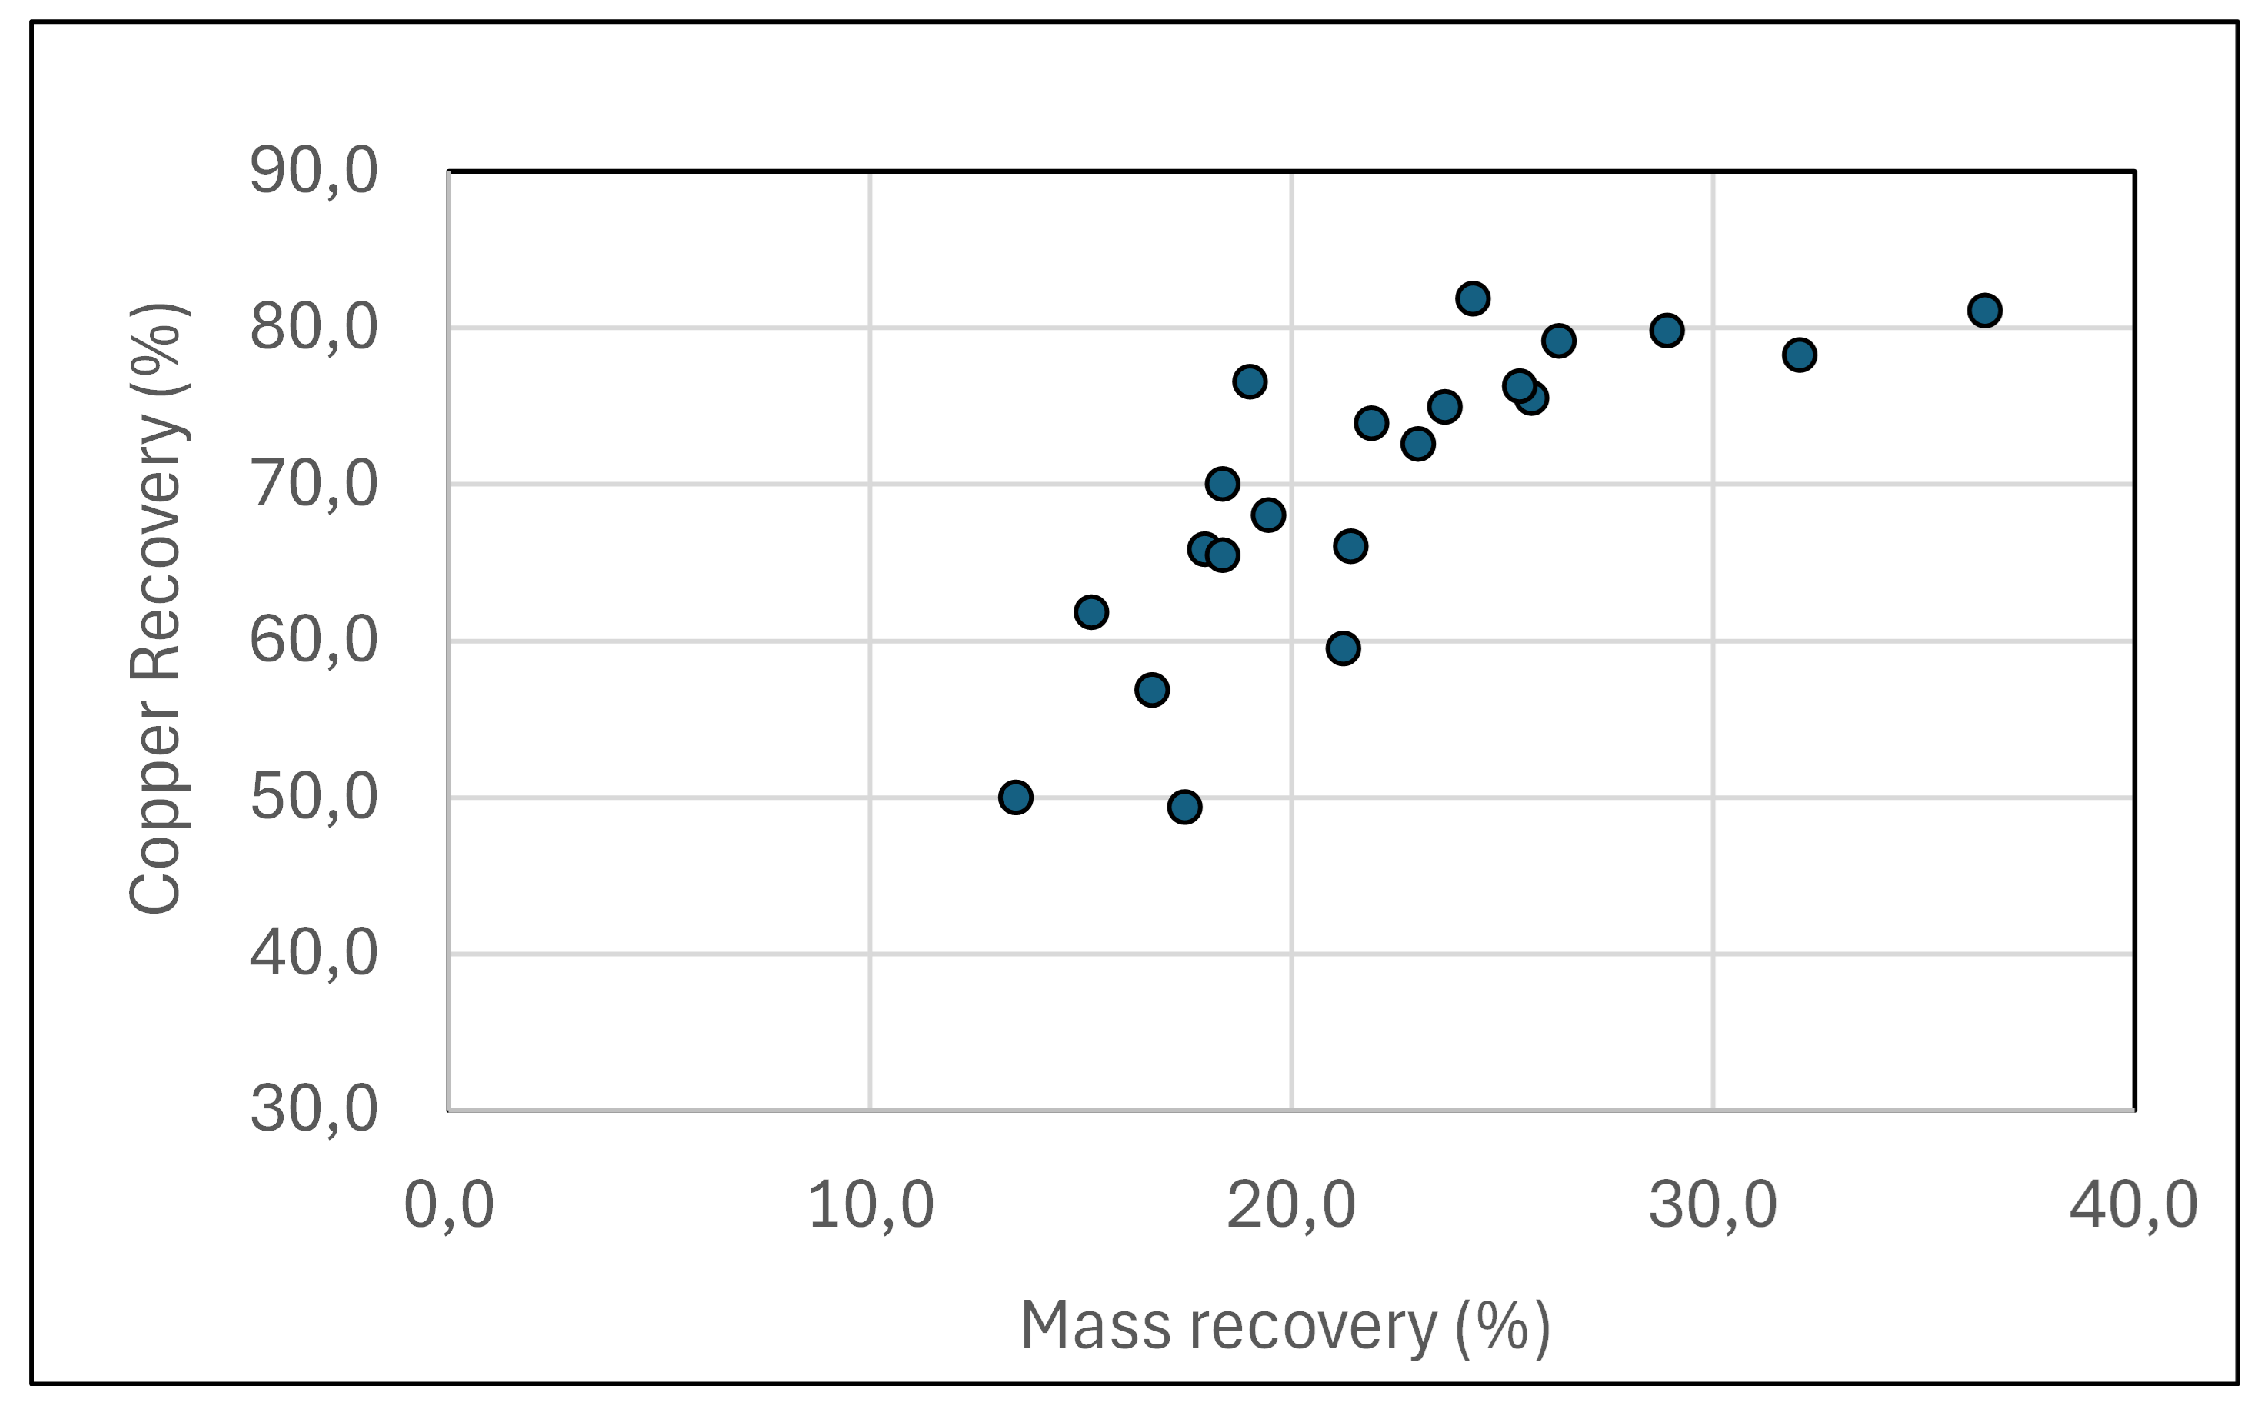
Figure 5.
Enrichment ratio (ER) versus mass recovery.
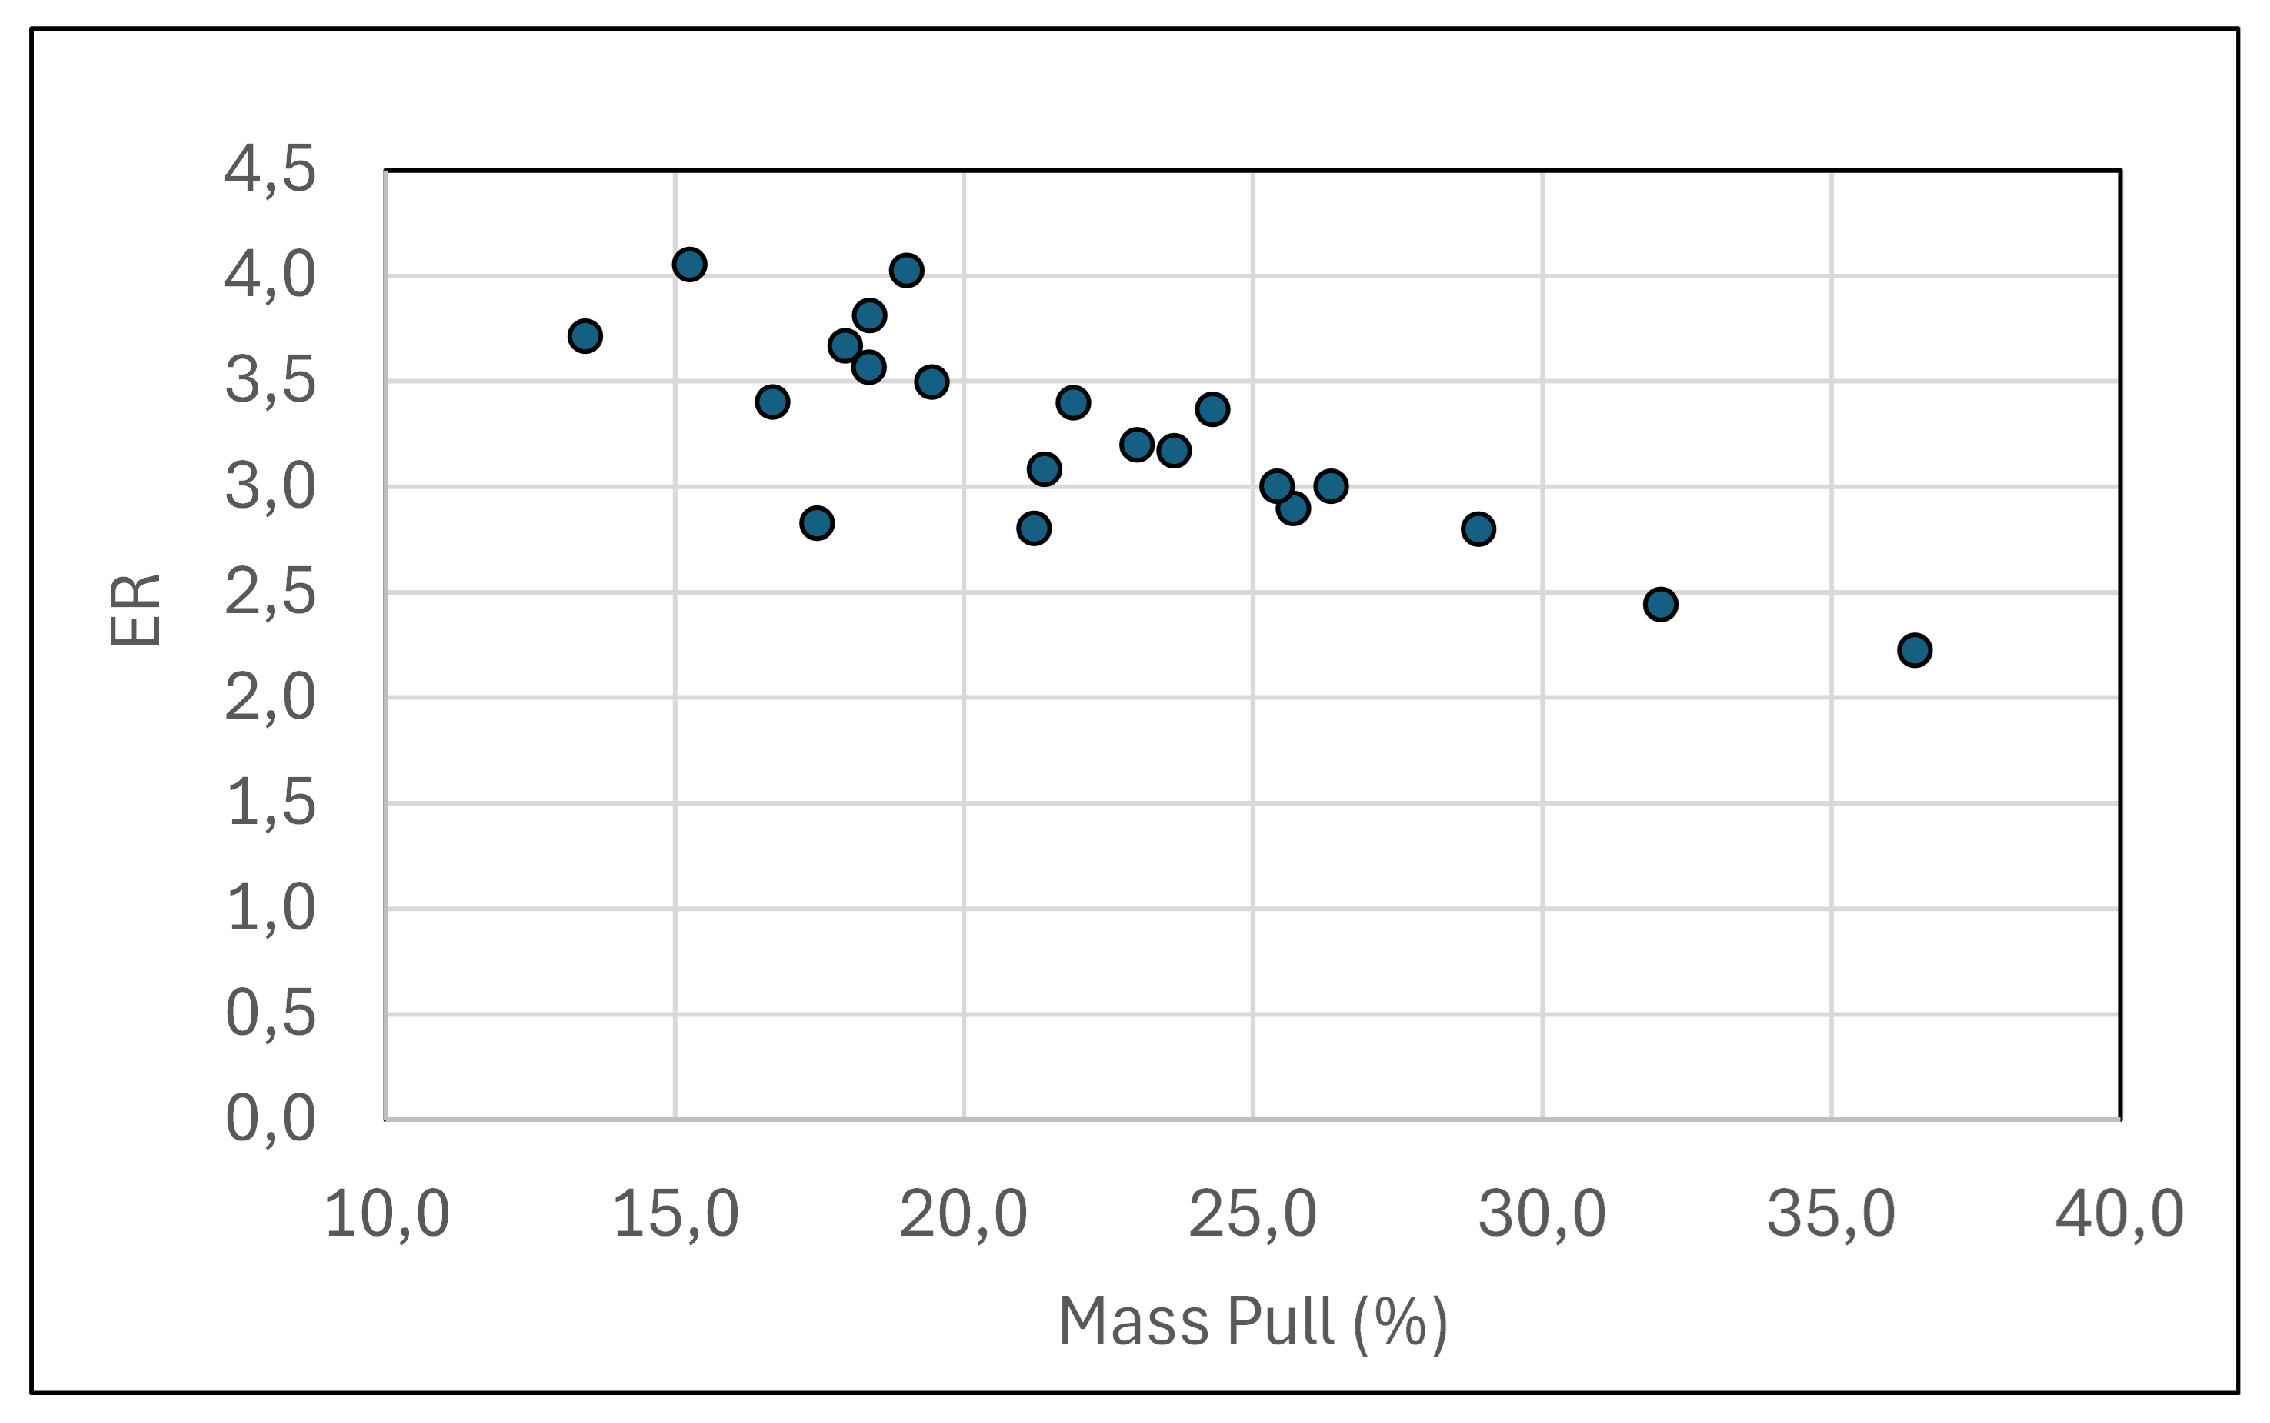
Figure 6.
Effect of J on copper recoveries. Global copper recovery vs J (left) and recovery by particle size at different J (right).
Figure 6.
Effect of J on copper recoveries. Global copper recovery vs J (left) and recovery by particle size at different J (right).
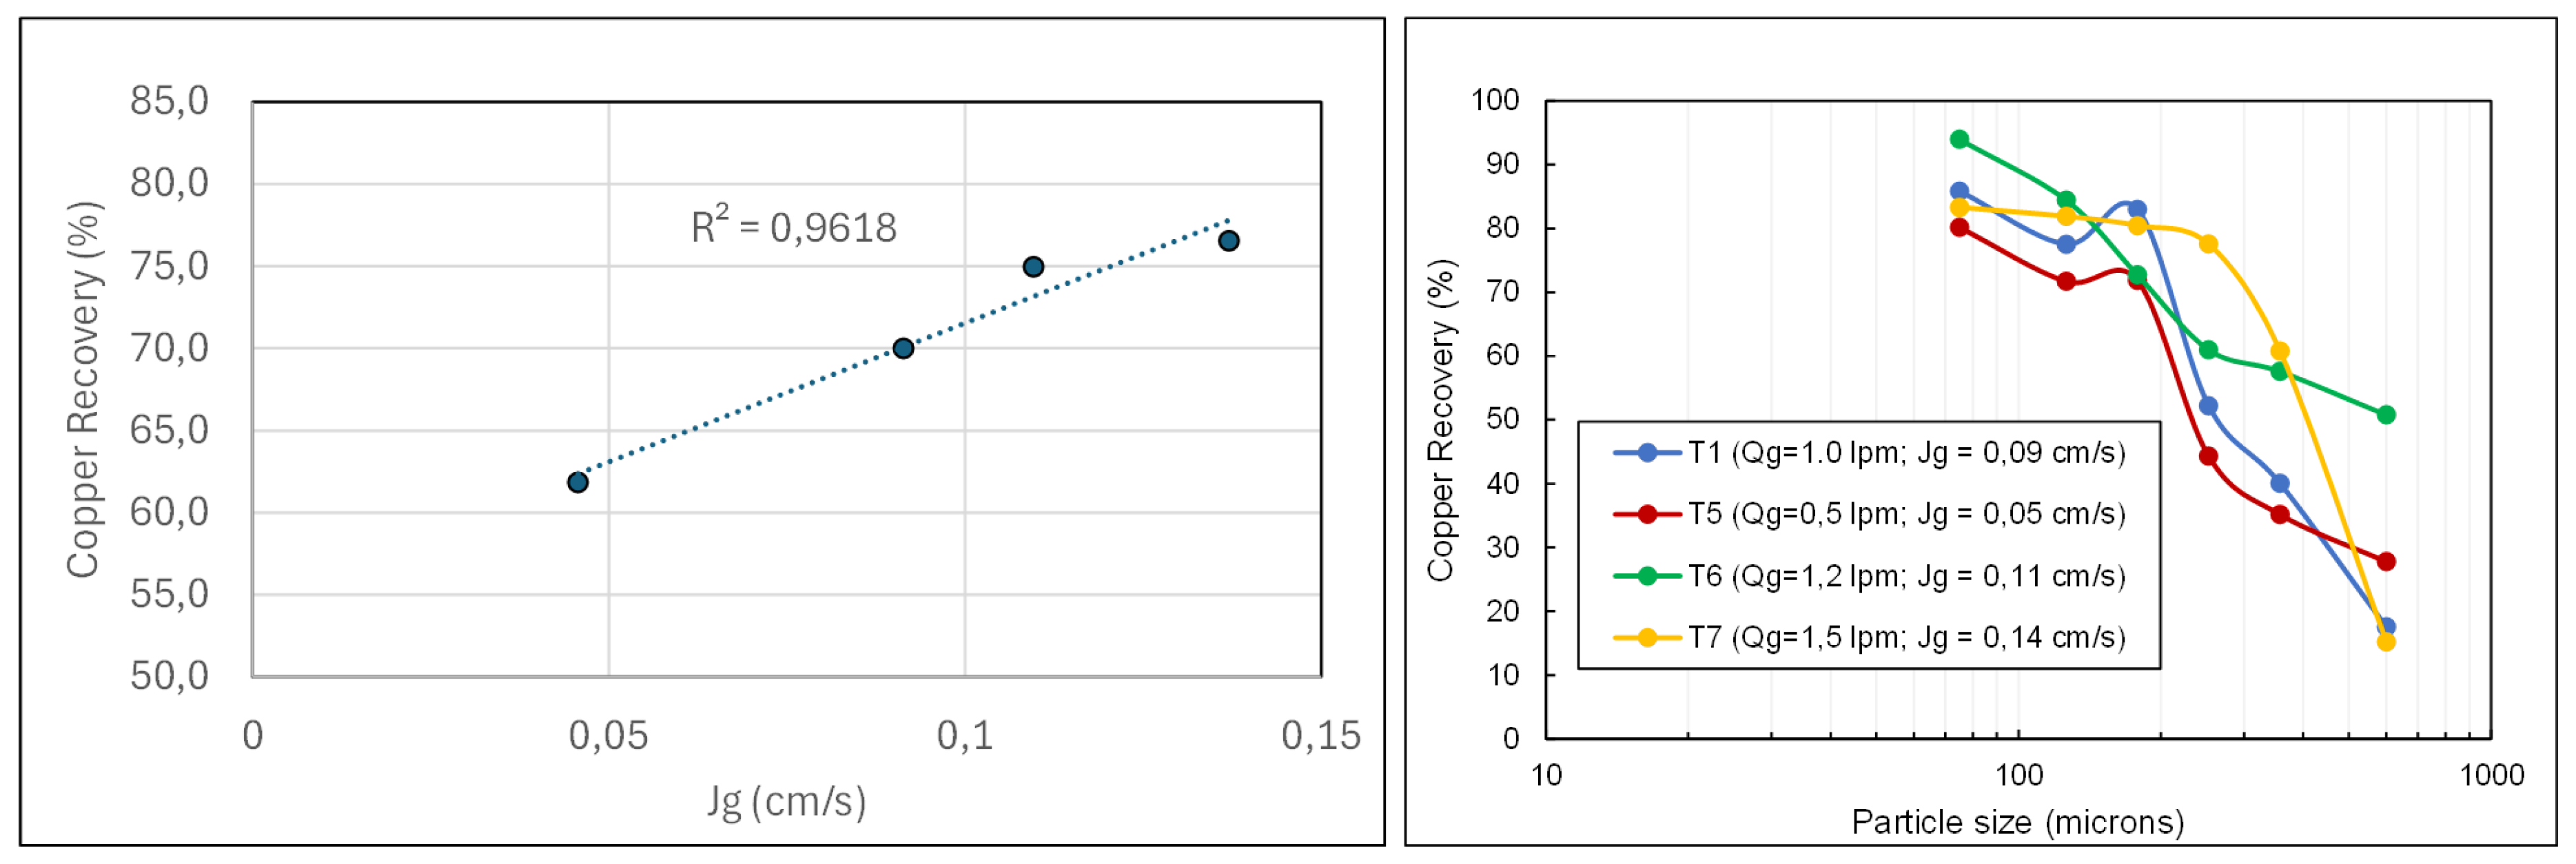
Figure 7.
Effect of J on copper recoveries. Global copper recovery vs J (left) and recovery by particle size at different J (right).
Figure 7.
Effect of J on copper recoveries. Global copper recovery vs J (left) and recovery by particle size at different J (right).
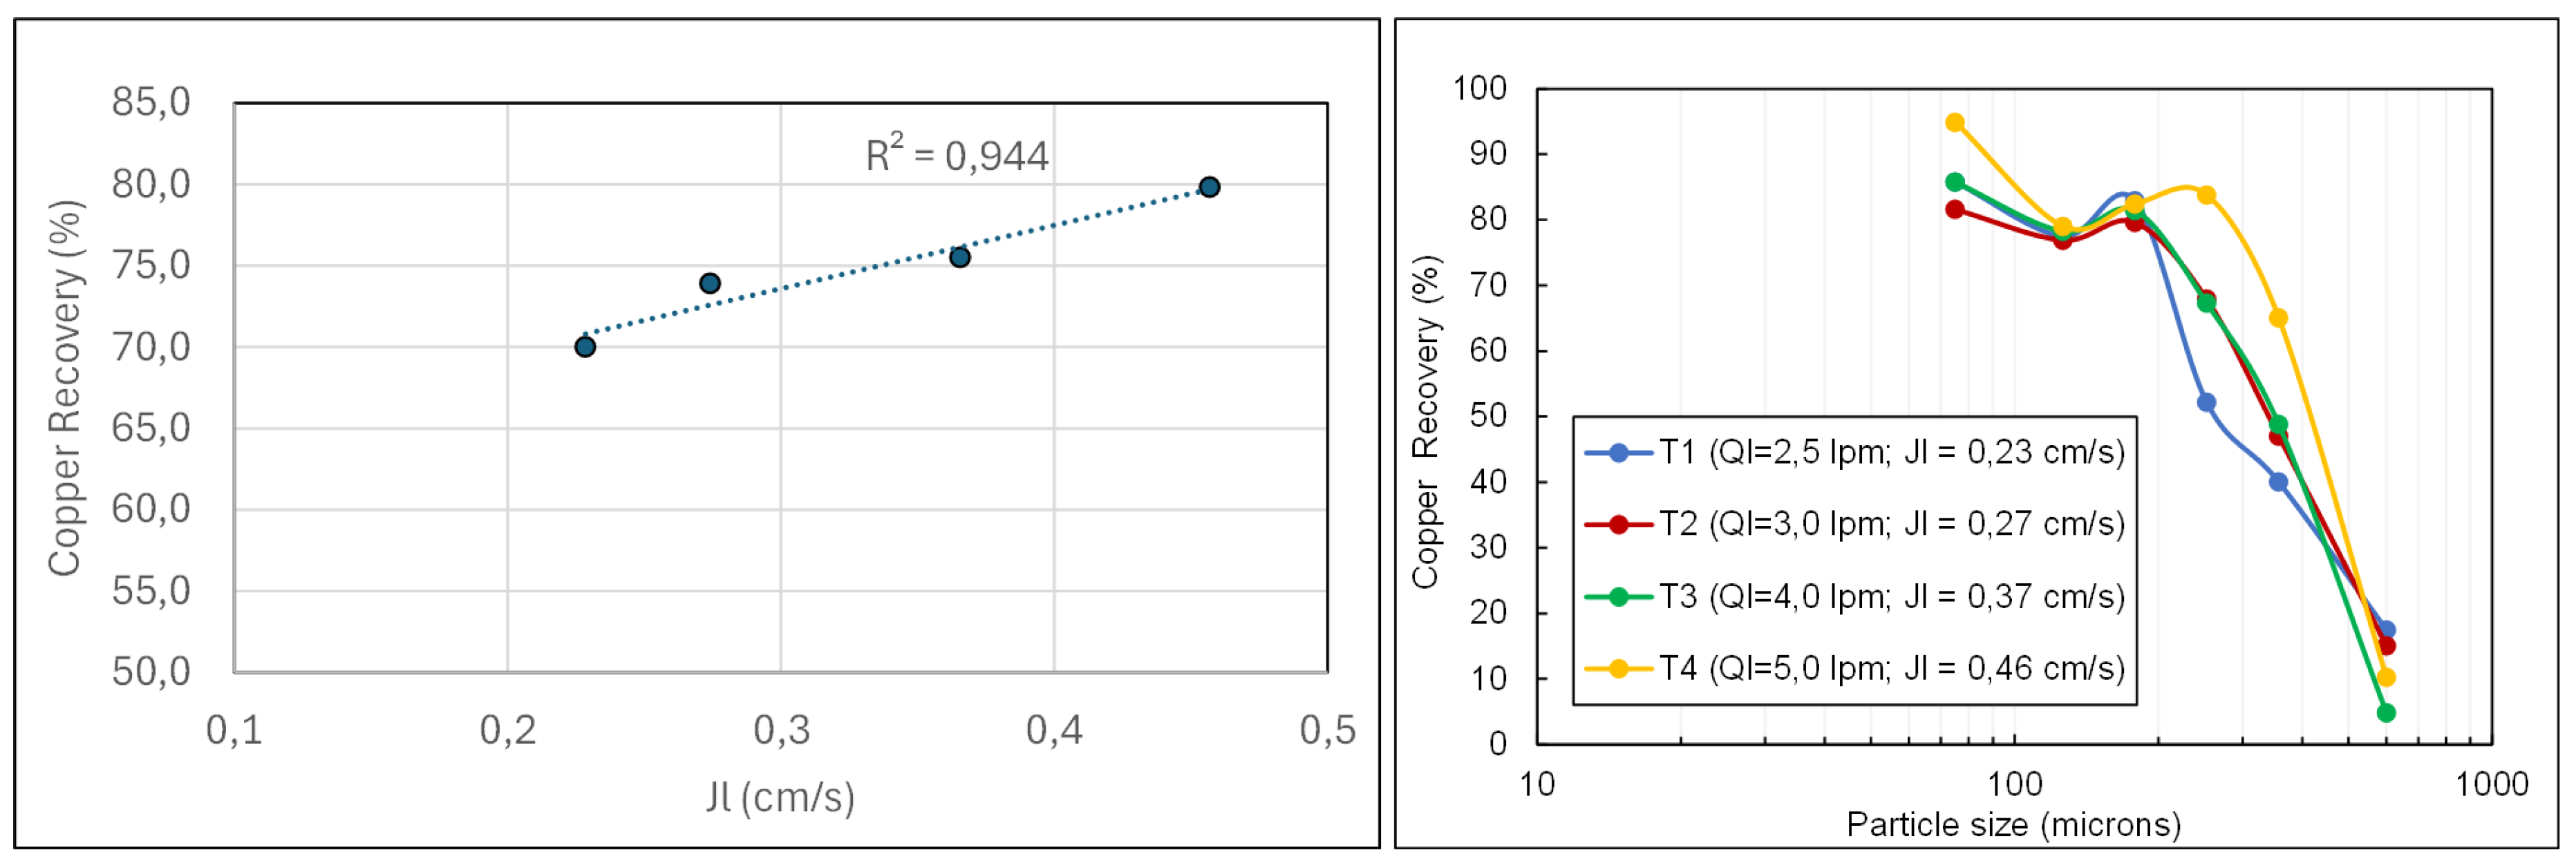
Figure 8.
Bubble size distribution measured from the testing campaign.
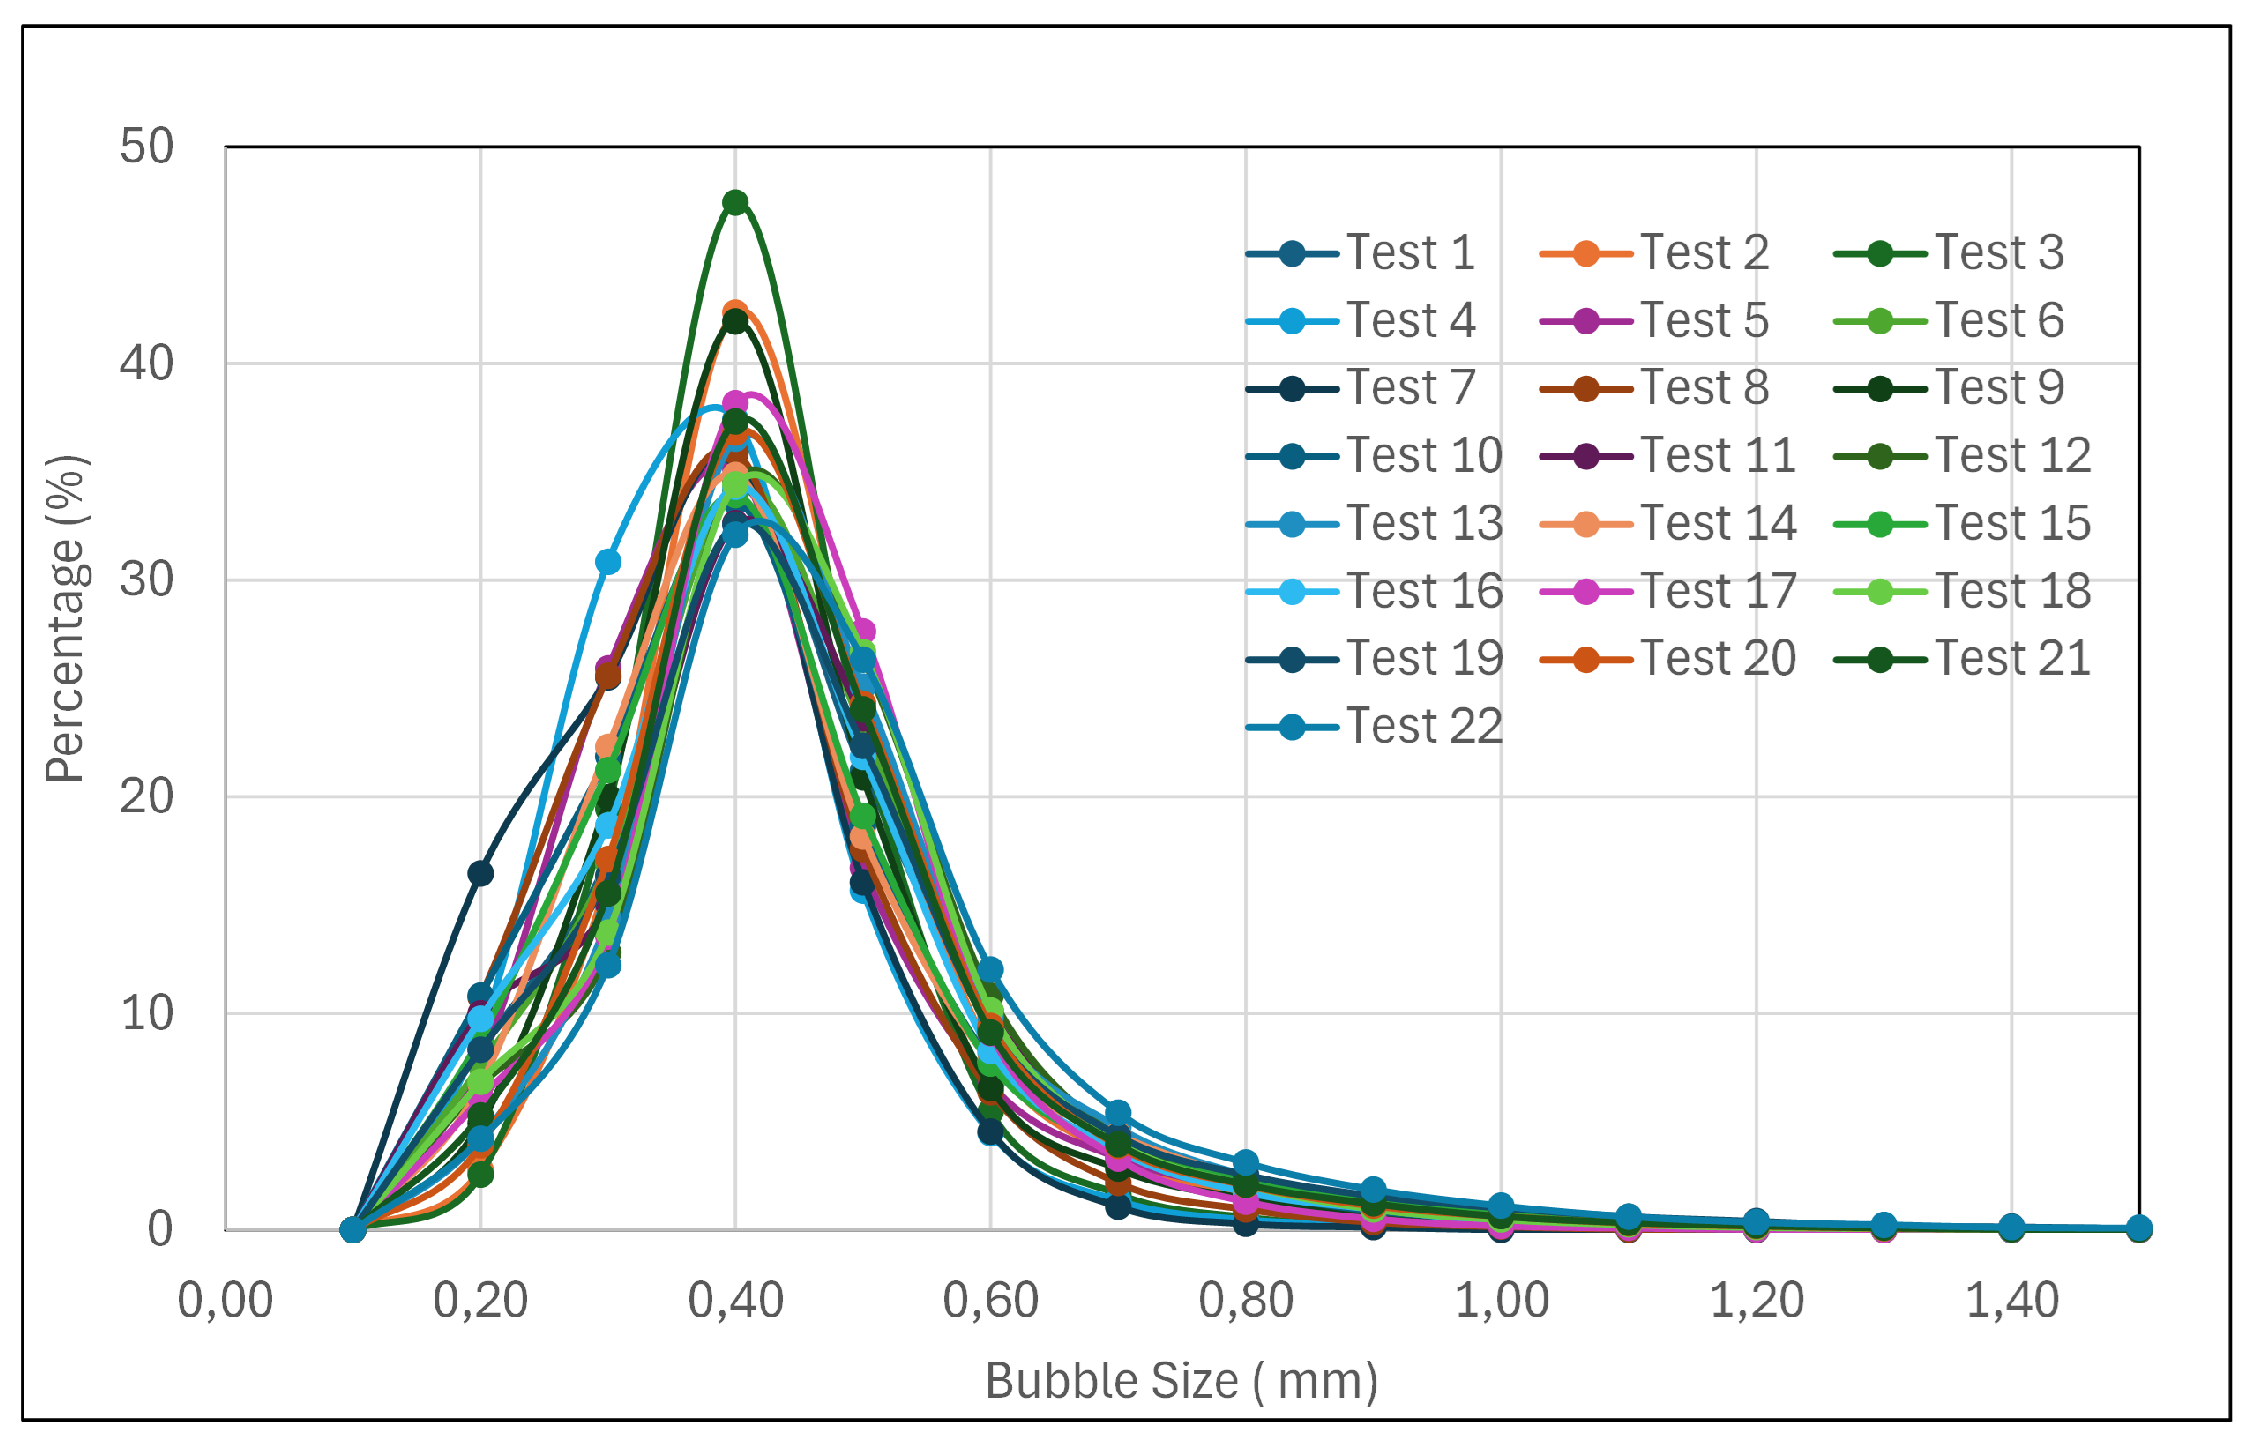
Figure 9.
Chain-like bubble particles aggregates as observed in the bubble viewer.
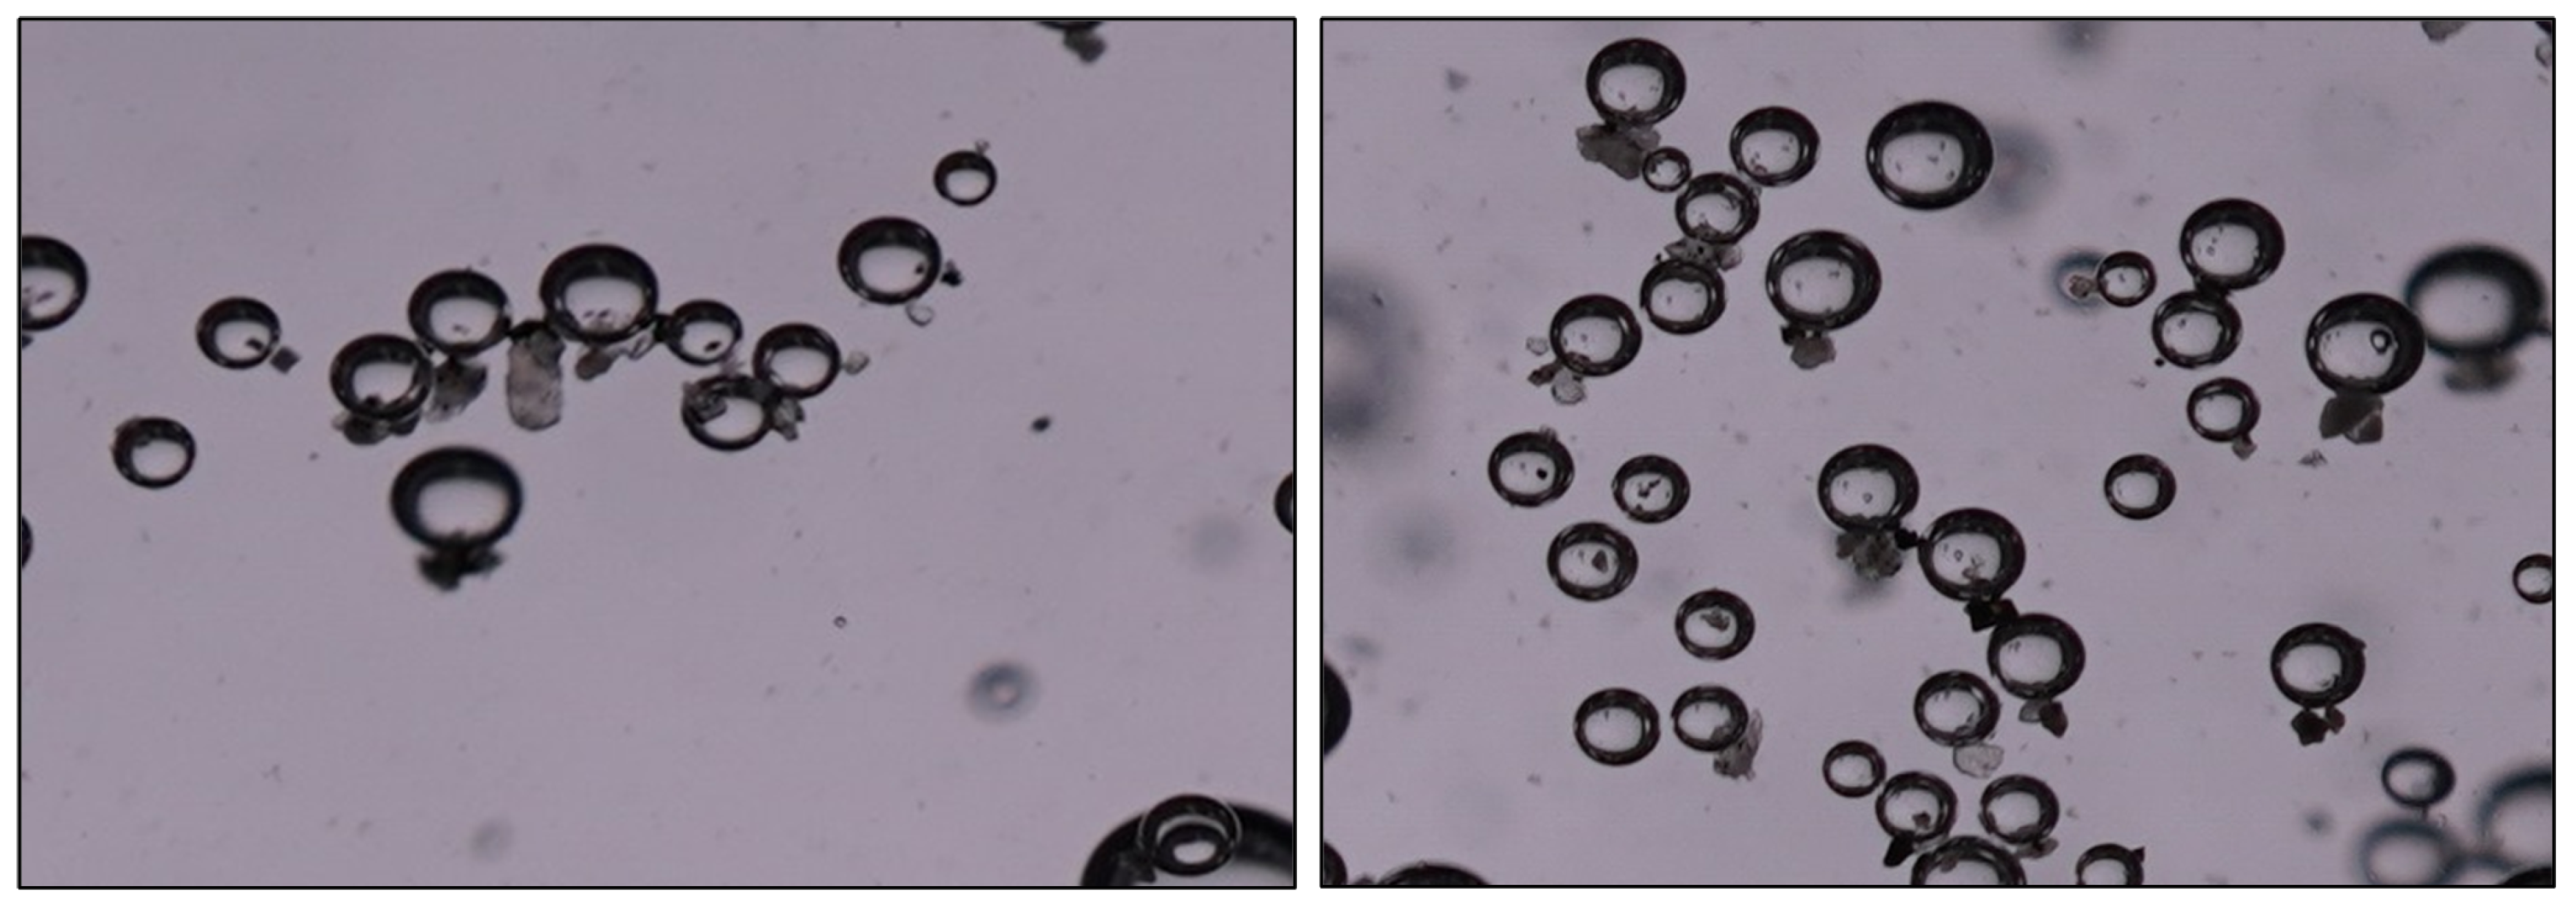
Figure 10.
Copper recovery versus bubble surface area flux Sb.
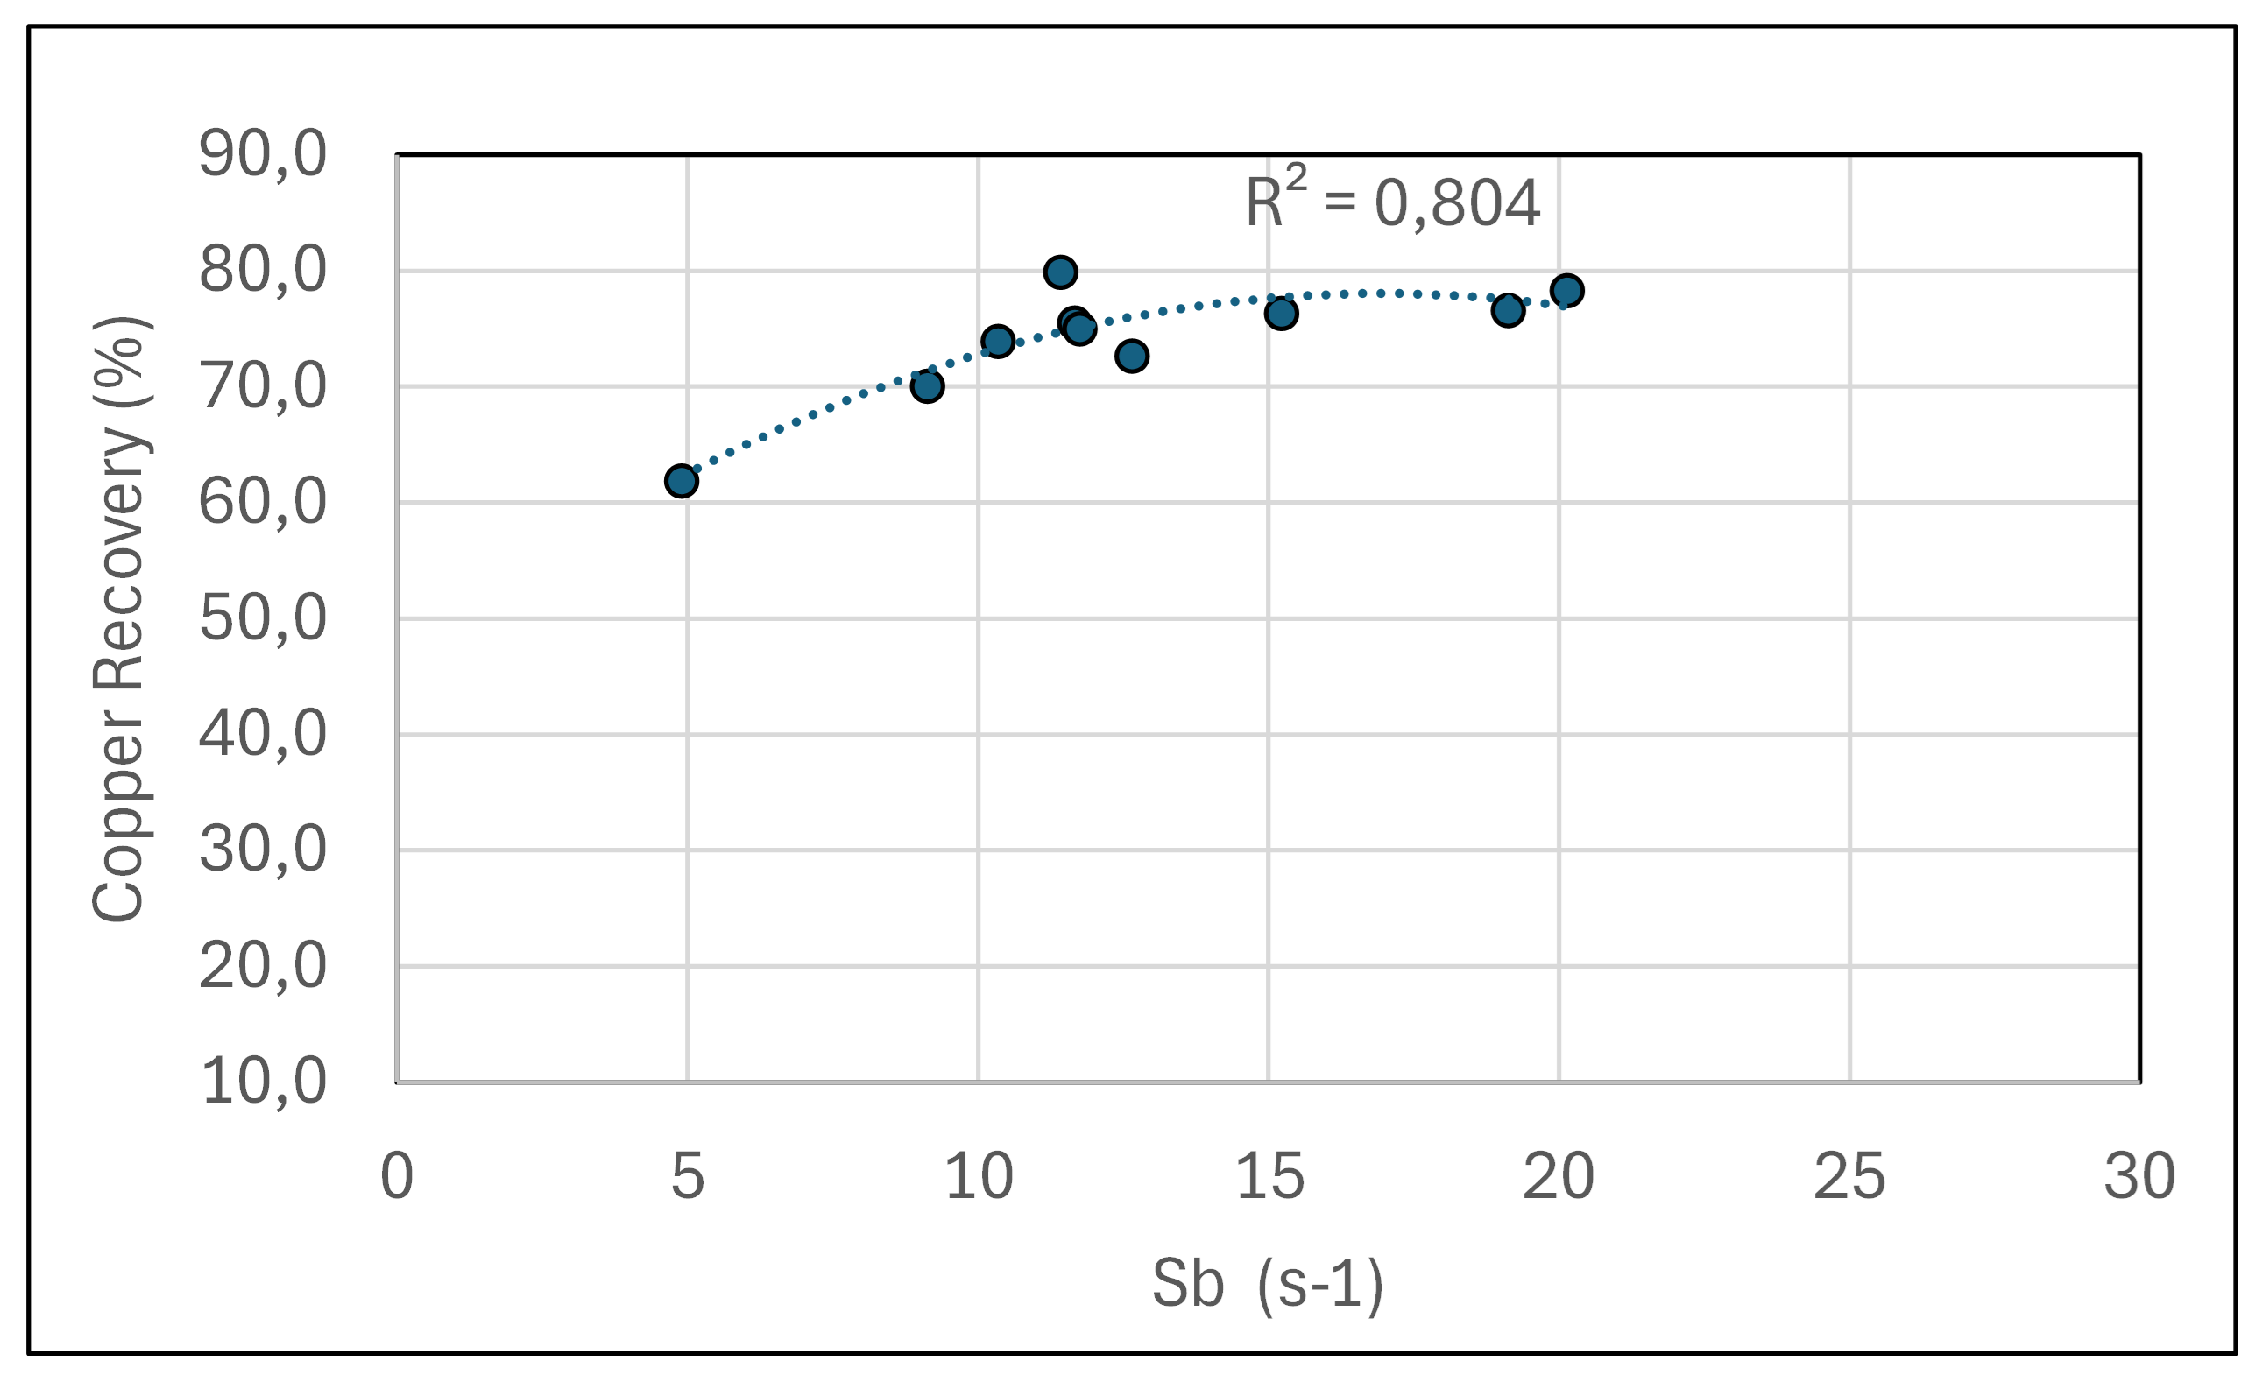
Figure 11.
Particle size distributions of sample received and Hydrofloat® feeds.
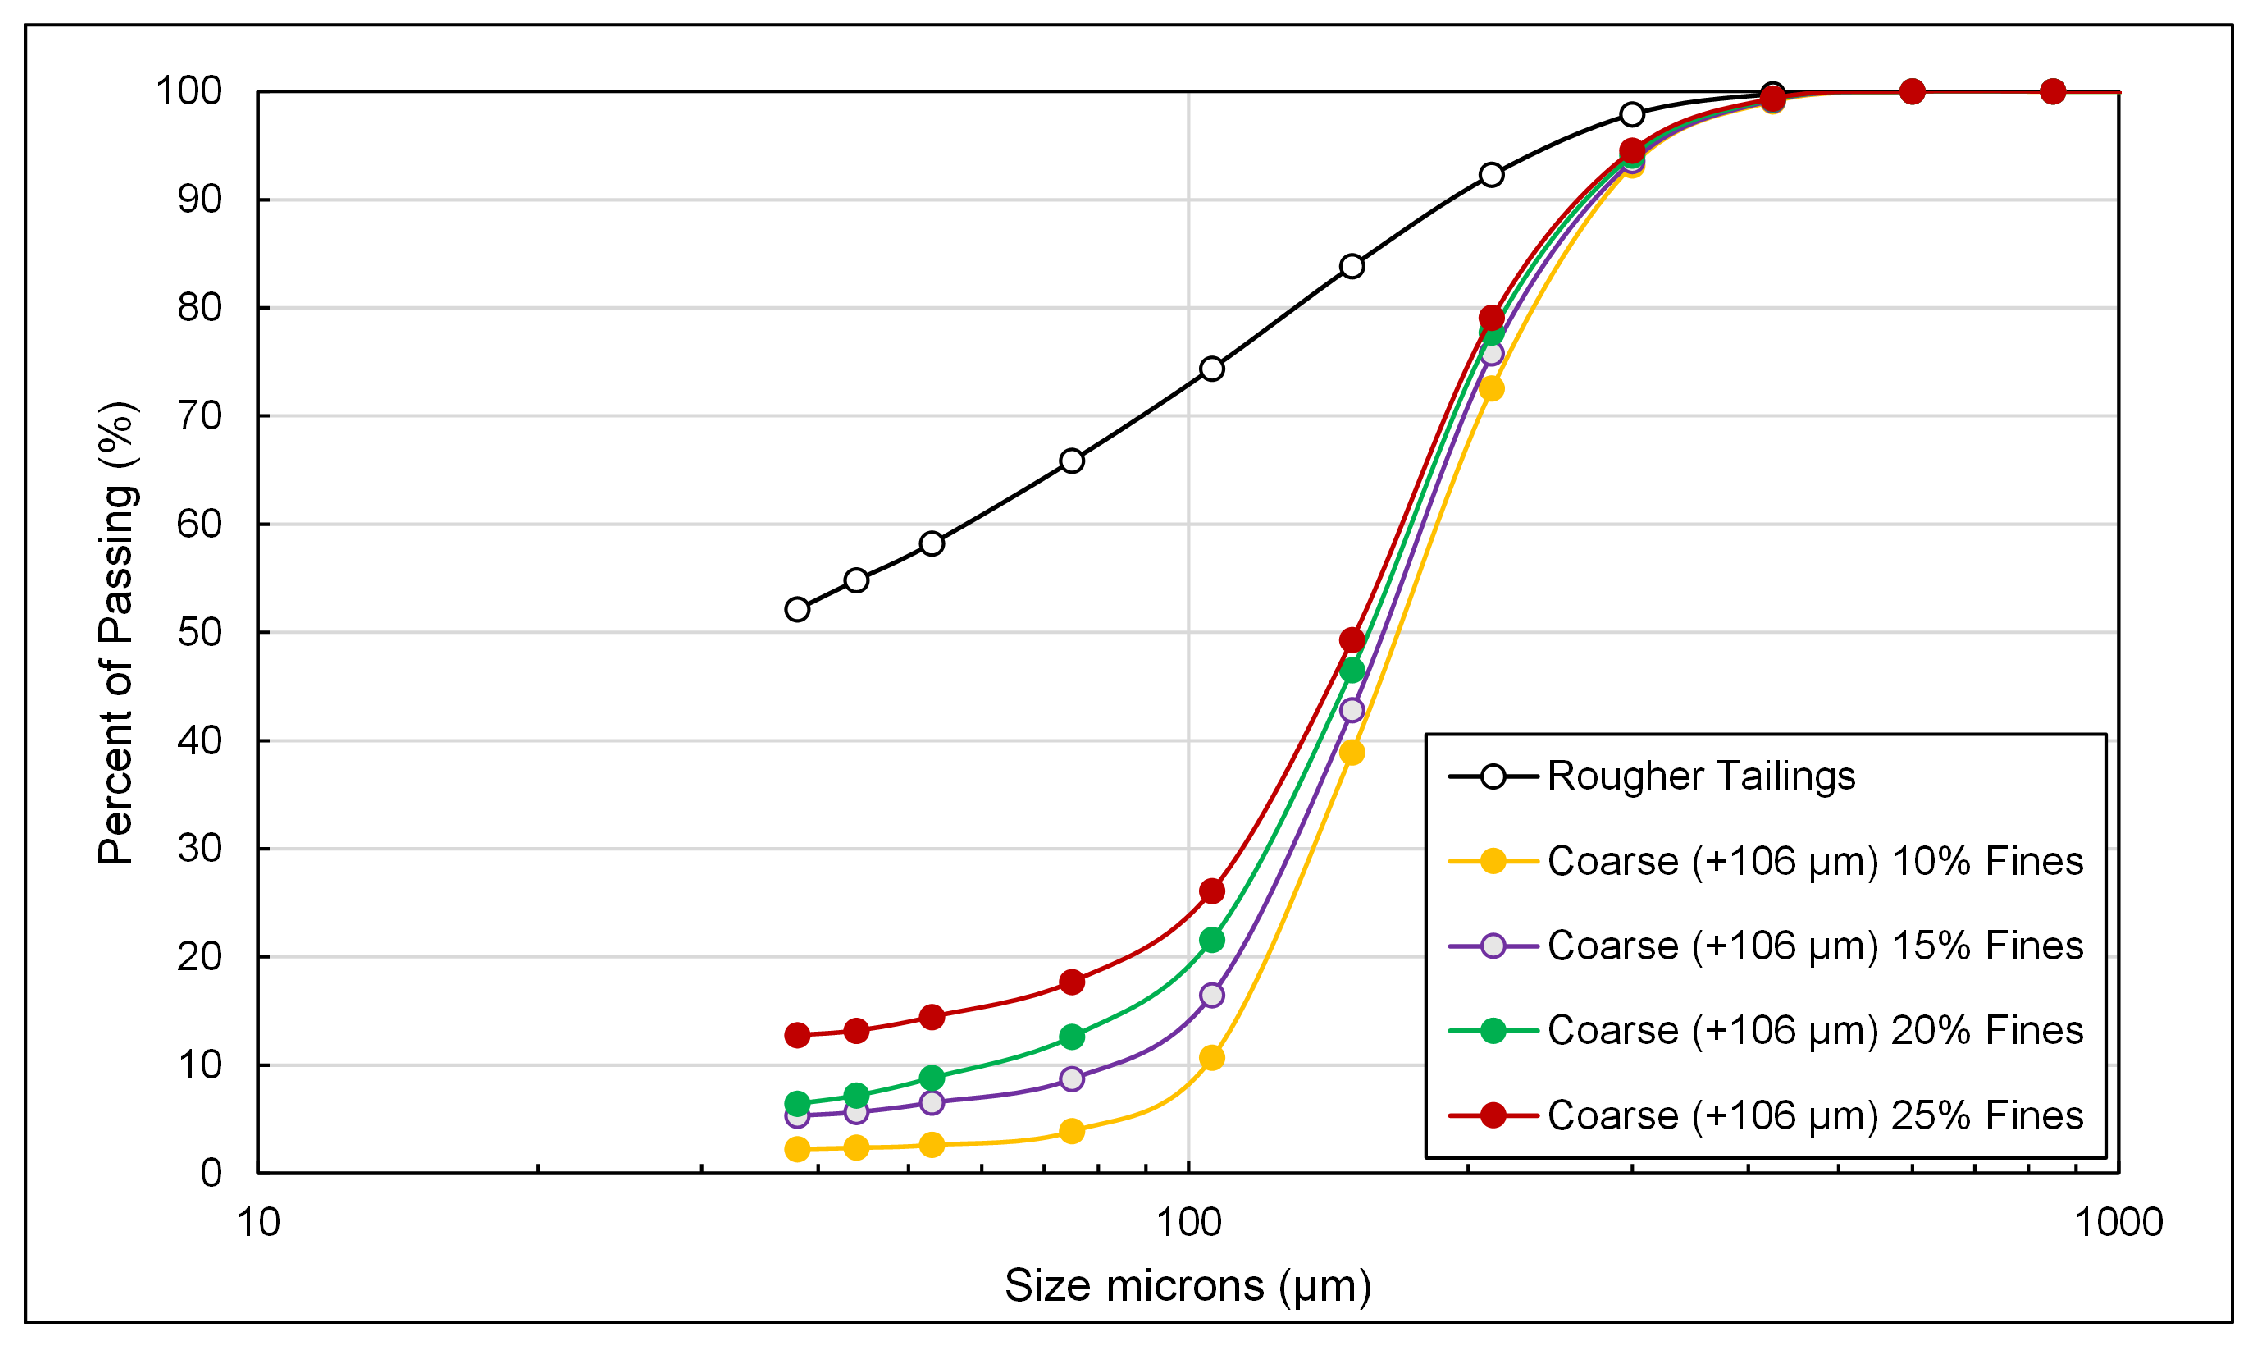
Figure 12.
Effect of fines content on copper recoveries.
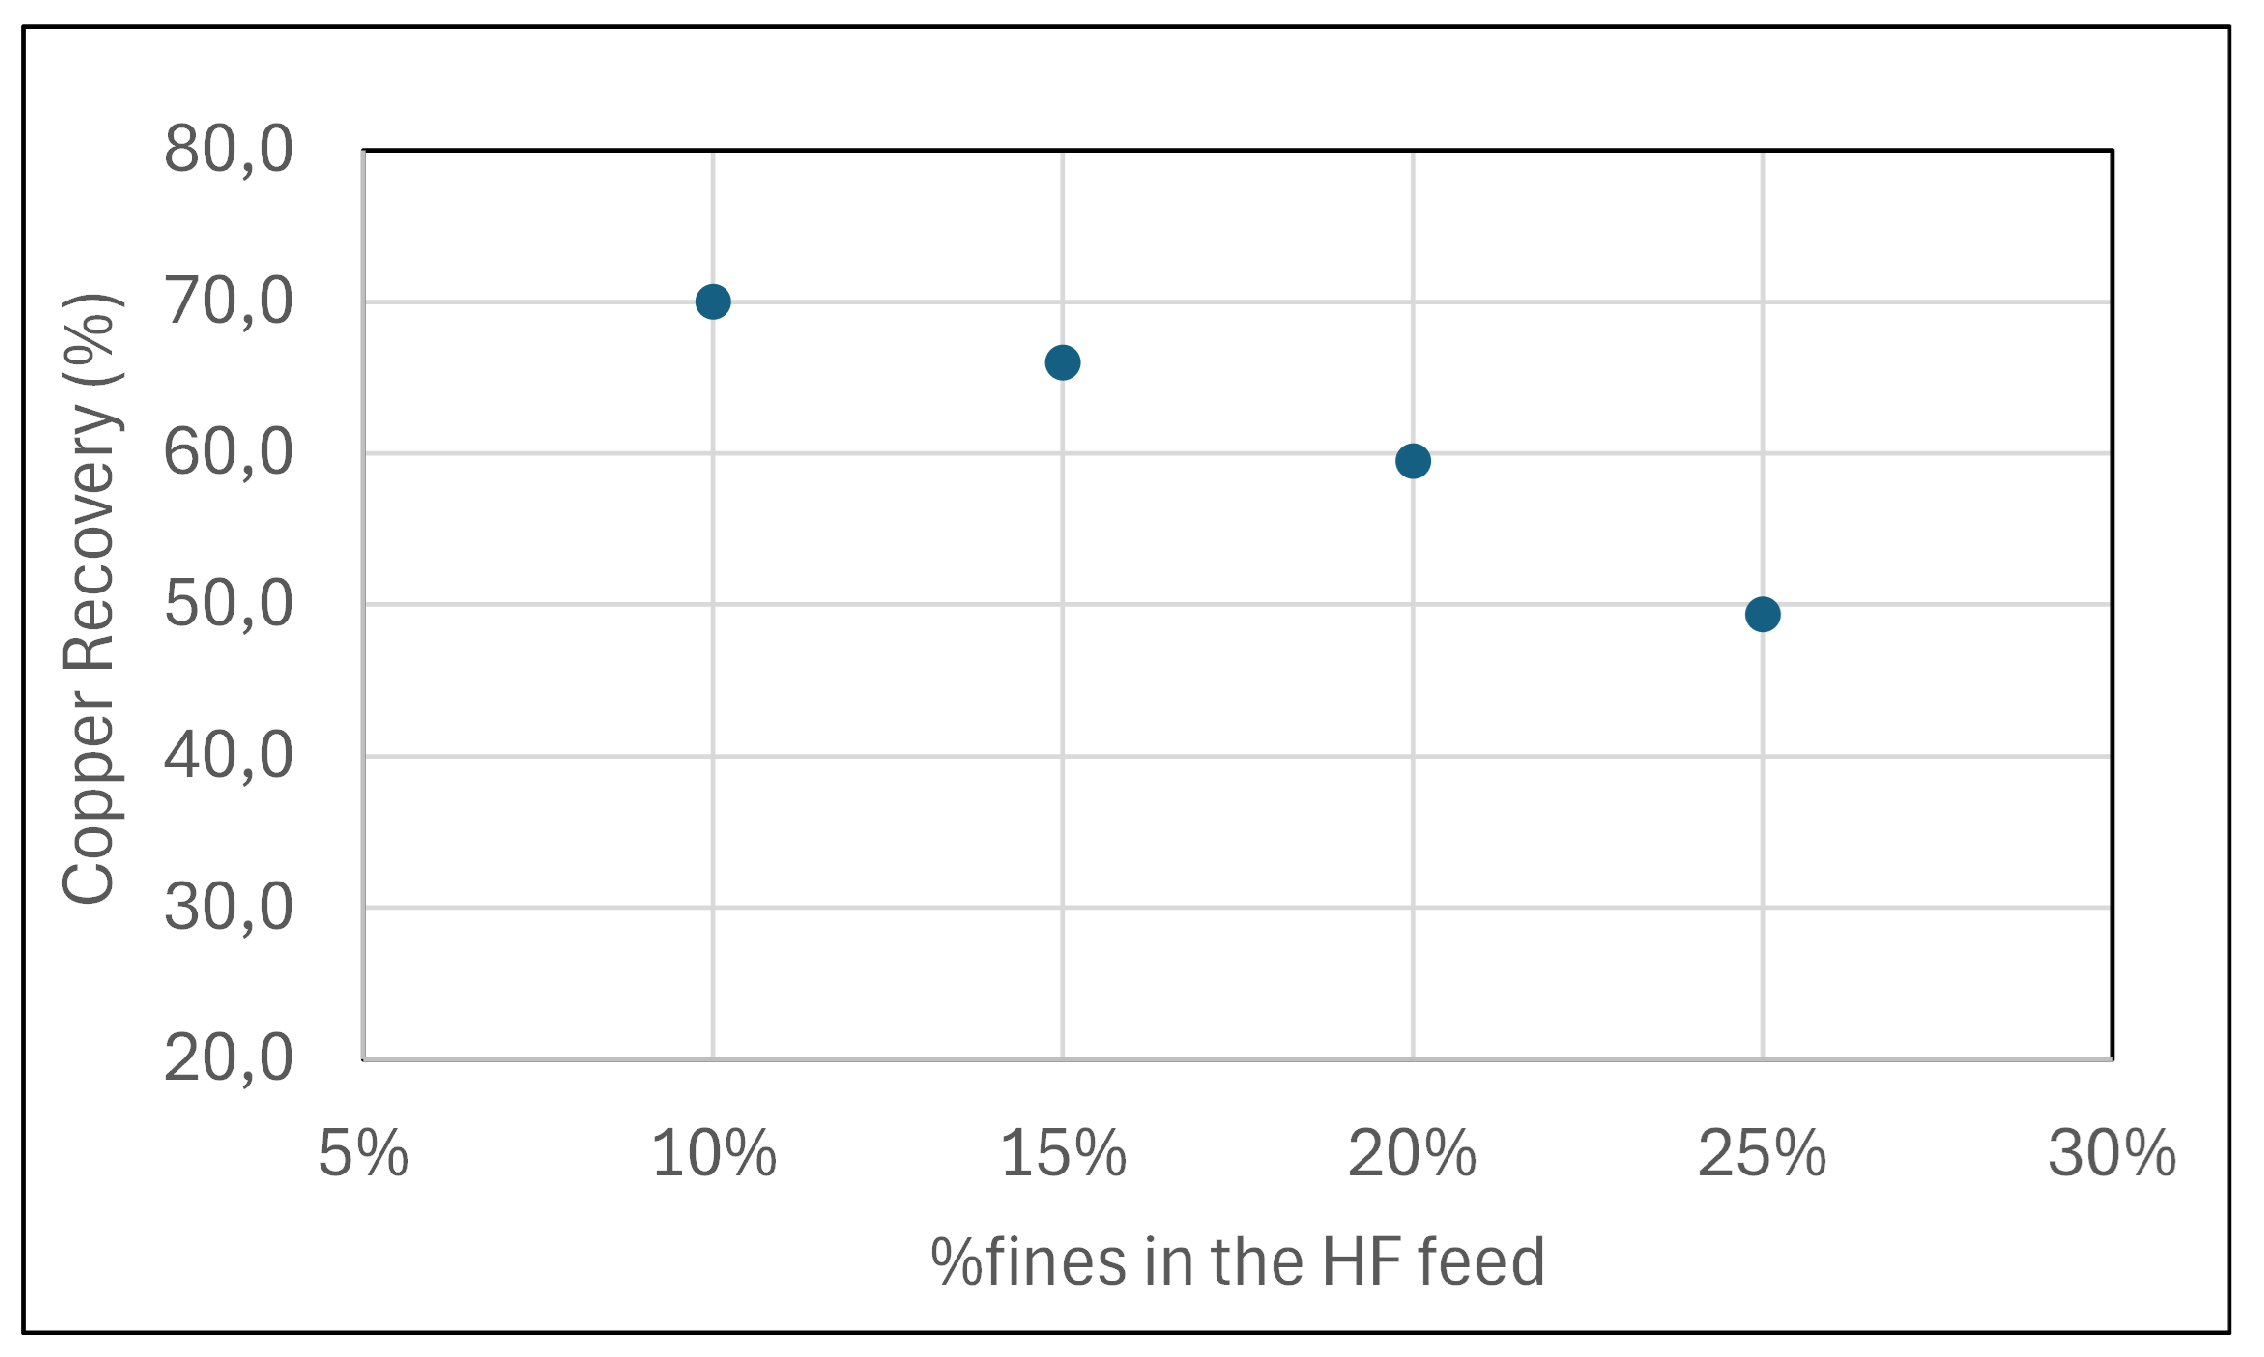
Figure 13.
RTD using radioactive gangue particles.
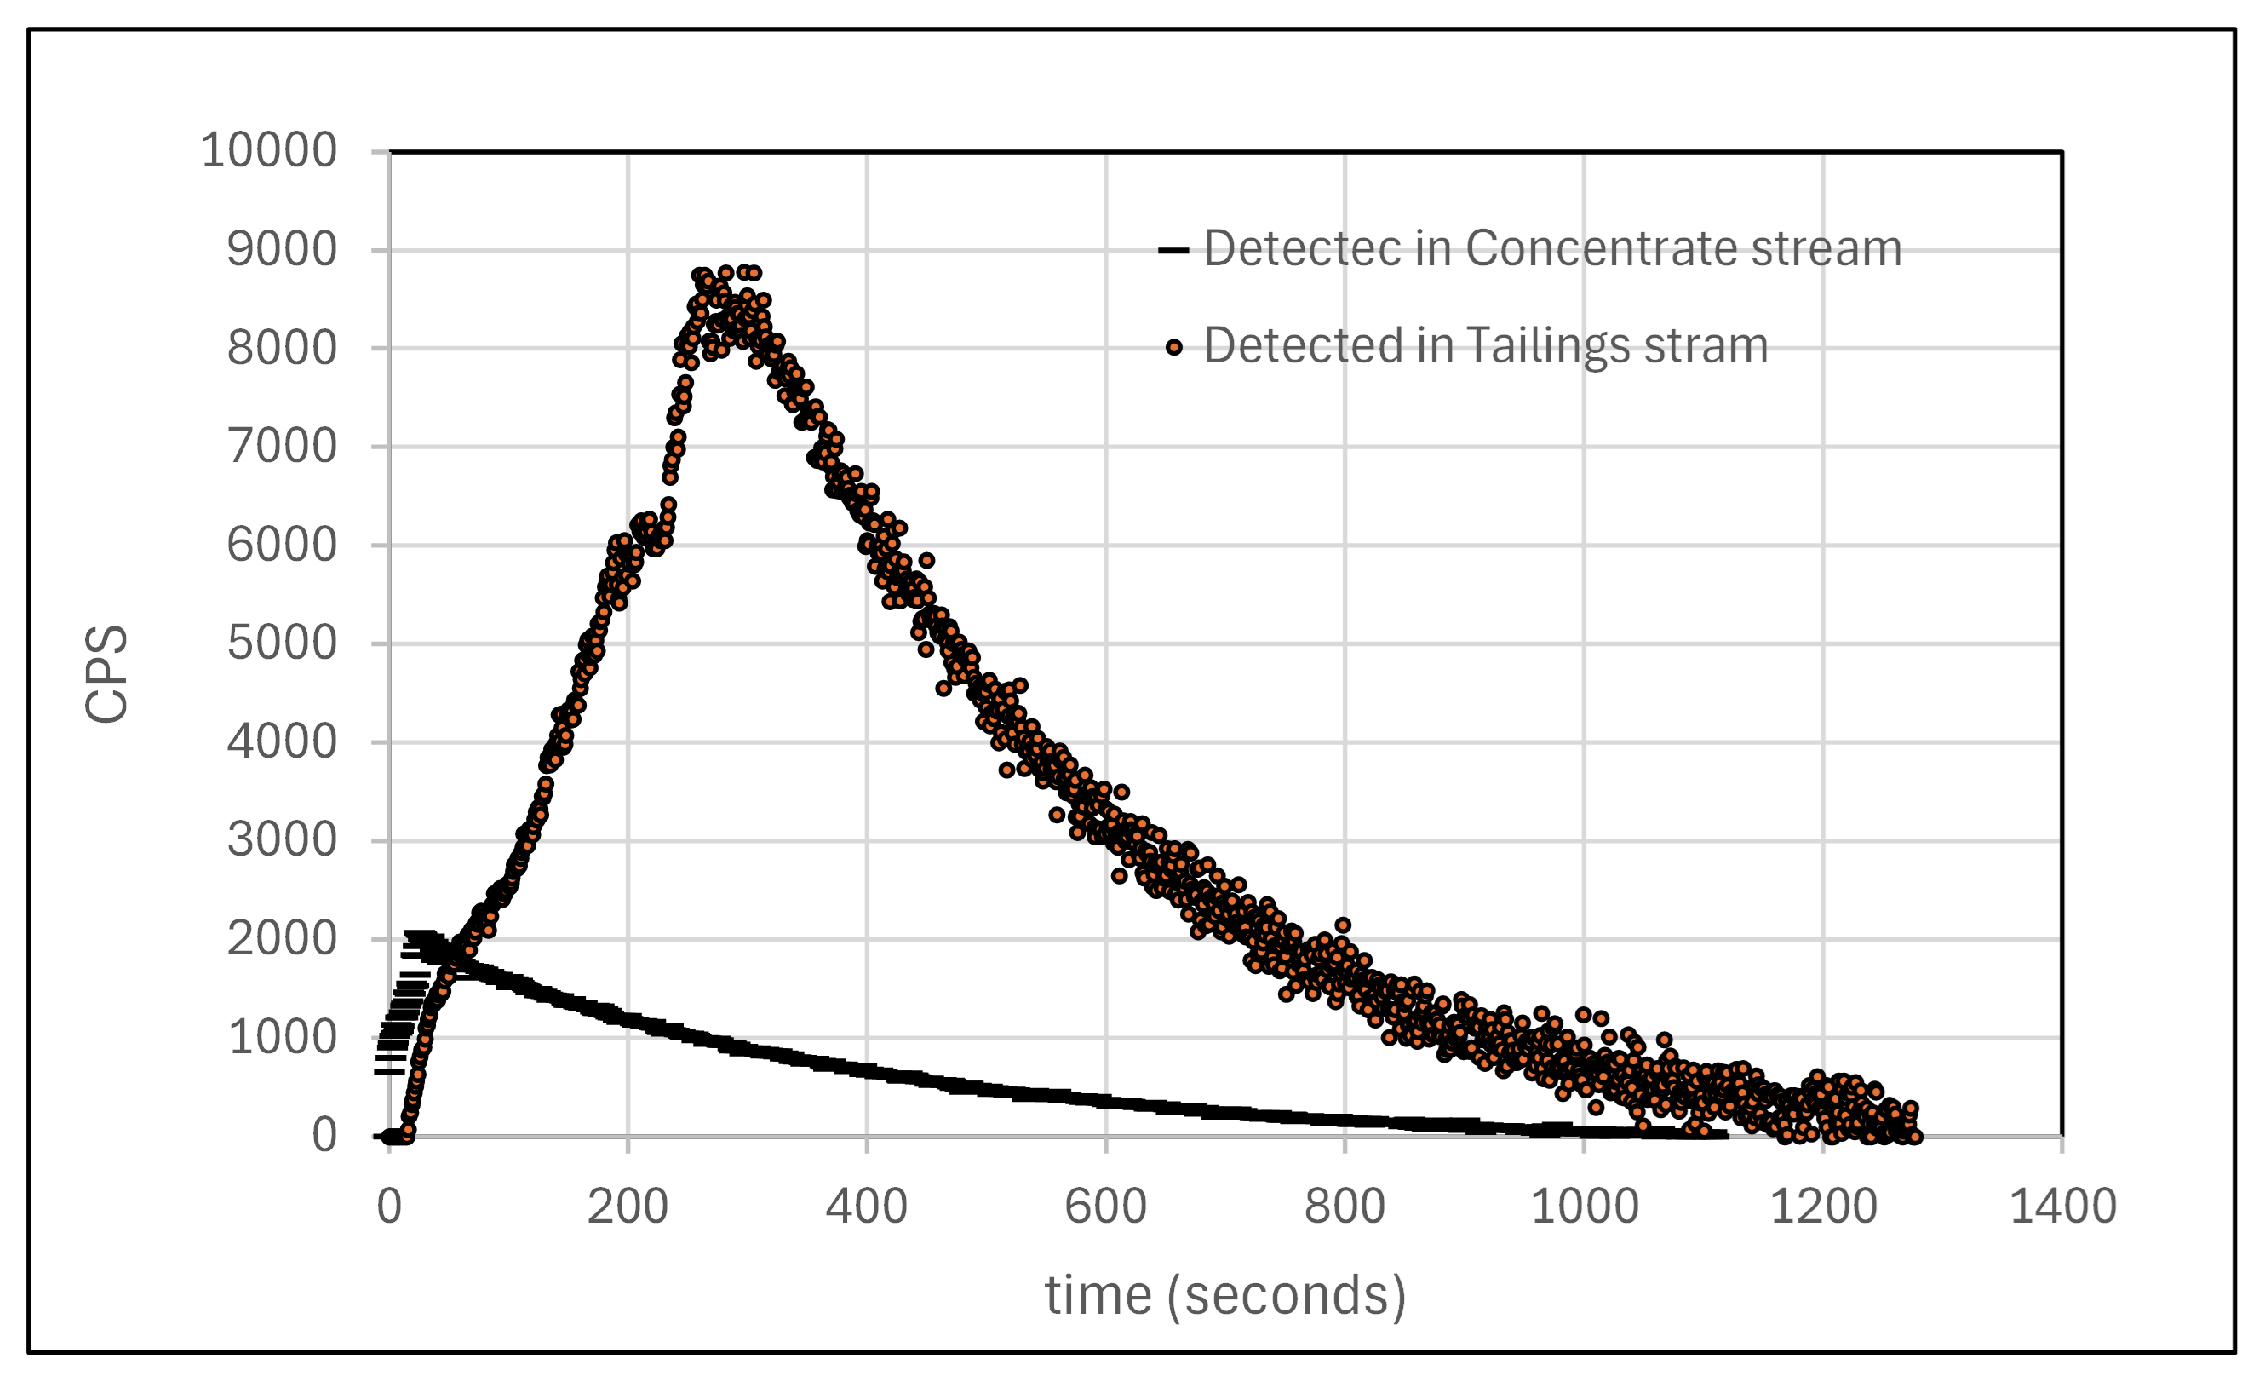
Figure 14.
RTD using radioactive concentrate particles.
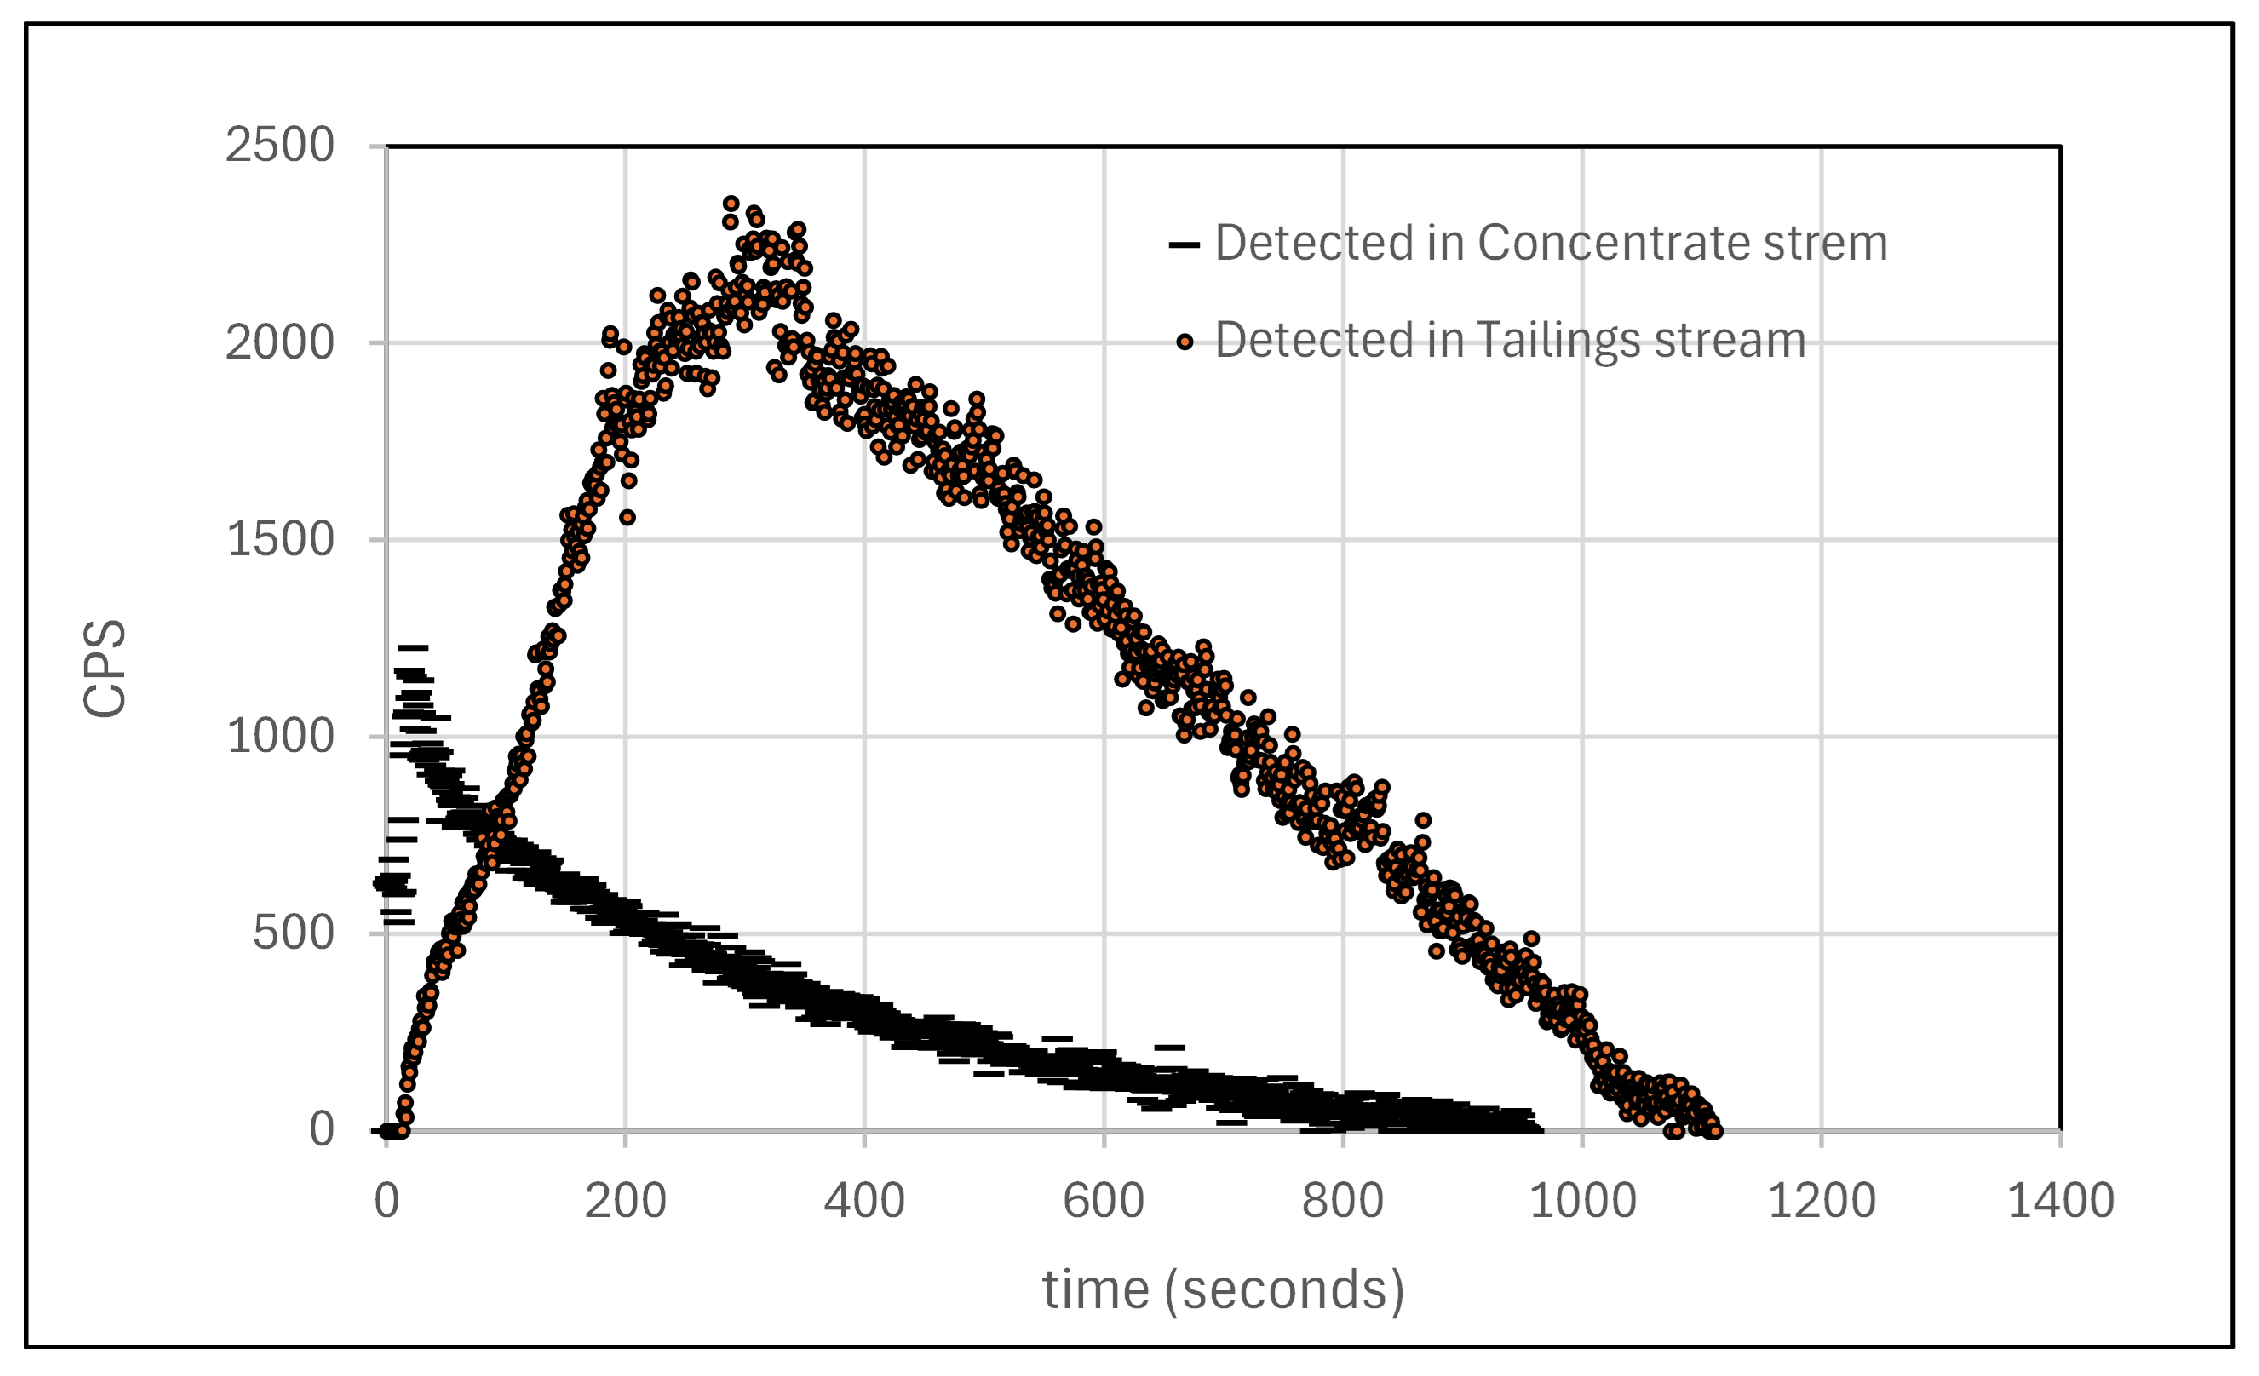

Table 1.
Mineralogy, particle size and copper distribution by size fraction of tailings sample.
Table 2.
Operating conditions tested in the experimental campaign.
Table 3.
Summary of the results obtained from the testing campaign and main operating conditions used in each test.
Table 3.
Summary of the results obtained from the testing campaign and main operating conditions used in each test.
Table 4.
Mean residence time distribution (MRT) obtained from RTD measurements.
| Measurement | Tracer | MRT Conc. (min) | MRT Tails (min) |
|---|---|---|---|
| 1 | Tails Particles | 4.7 | 7.1 |
| 2 | Conc. Particles | 4.3 | 7.5 |
| Duplicate | Tails Particles | 5.1 | 7.2 |
Disclaimer/Publisher’s Note: The statements, opinions and data contained in all publications are solely those of the individual author(s) and contributor(s) and not of MDPI and/or the editor(s). MDPI and/or the editor(s) disclaim responsibility for any injury to people or property resulting from any ideas, methods, instructions or products referred to in the content. |
© 2026 by the authors. Licensee MDPI, Basel, Switzerland. This article is an open access article distributed under the terms and conditions of the Creative Commons Attribution (CC BY) license.
Copyright: This open access article is published under a Creative Commons CC BY 4.0 license, which permit the free download, distribution, and reuse, provided that the author and preprint are cited in any reuse.