Submitted:
08 June 2026
Posted:
09 June 2026
You are already at the latest version
Abstract
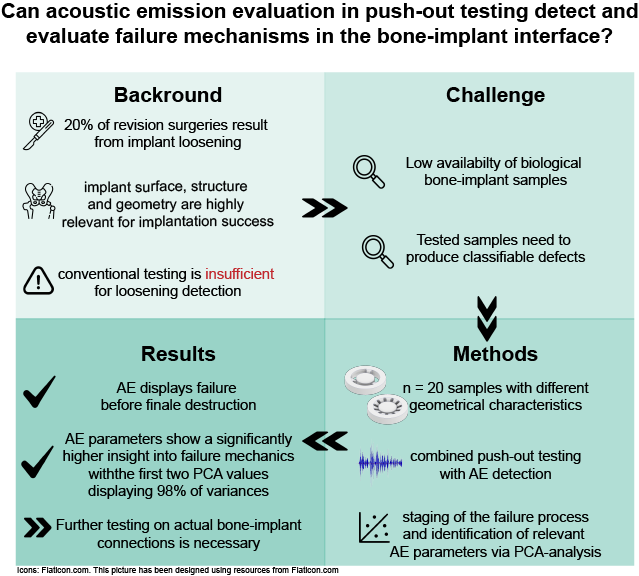
Conventional push-out tests detect bone–implant failure only at the point of macroscopic instability, leaving earlier damage stages unresolved. Here we present a proof-of-concept for a push-out test stand combined with acoustic emission (AE) monitoring, aimed at cap-turing crack initiation before macroscopic load drop. To provide a controlled failure pro-cess, samples were fabricated from SLA resin with defined breaking points, serving as mechanical surrogates rather than biological models. Four sample types with varying strut number and thickness were tested while recording AE, and post-processing was applied to remove friction and noise signals. A four-stage fracture model, plastic, pre-fracture, fracture, and post-fracture, was defined, with the pre-fracture stage showing AE activity prior to any macroscopic load response. Increasing strut thickness and contact area raised maximum load resistance and AE activity, and Principal Component Analysis confirmed a progressive, intensity-driven separation of stages. The results demonstrate that AE mon-itoring resolves a pre-fracture regime inaccessible to conventional load measurement, es-tablishing a methodological basis for future application to bone-implant samples.
Keywords:
implant testing
; bone-implant interface
; acoustic emission
; push-out
; fracture stages
1. Introduction
The bone-implant interface (BII) represents biological processes that occur at the location where an implant engages with bone, leading to the implant being enveloped by newly formed bone as part of osseointegration. Osseointegration is the process where a firm and motionless fixation has been achieved together with a direct functional contact to the bone [1,2,3]. Besides surgical technique and patient condition, implant design is the most relevant factor with a strong impact on the bone-remodelling process [4]. Specifically, osseointegration is influenced by the implantation process and the adequate fixation of the implant inside the host tissue during surgery (primary stability) [5]. However, bone-remodelling and the biological long-term integration into the tissue (secondary stability) are the dominant components of overall total stability, therefore frequently equalled to osseointegration [4].
Haas and Pommer (2015) have shown the dependence of stability on time of healing, where secondary stability contributes strongly to the overall long-term stability after initial healing and leads to adequate osseointegration. Multiple complex biological processes after initial implantation trigger the process of osseointegration, with mostly not yet fully understood immune-driven reactions [6]. Thus, initialisation of biological remodelling is a key part of the implant design and testing process. Together with biofunctionality and biocompatibility, osseointegration provides the basis for implant development and design [7]. During implant design, multiple parameters can be adapted for improved osseointegration. For example, surface properties and thus higher surface roughness promotes osseointegration success through increased surface area [8,9]. Additionally, specific implant materials like titanium or hydroxyapatite can improve the osseointegration rate by chemical reactions at the implant interface [2]. In contrast, reduced osseointegration can lead to aseptic loosening, where inadequate fixation and mechanical and biological loss of stability are the impacting factors. In that case, loosening increases over time [10,11].
Improvement of osseointegration can be achieved by adaption of implant properties, like material, surface or structure [12,13]. Variation of these requires thorough testing to provide evidence for increased stability and patient safety. In terms of osseointegration, Branemark and Skalak (1998) have presented a method for pull-out testing of implants, where load versus displacement can be analysed to determine the degree of stability and thus the quality of osseointegration [14]. Barckman et al. (2013) reversed this approach by utilizing push-out tests on in vivo implants to assess osseointegration success following the healing period. They dissected the distal part of dog femurs after a period of four weeks and performed an axial push-out of the implant with analogues measurement of load and displacement. This testing process resulted in displacement at different loading conditions, with ultimate shear strength marking the point of implant failure and complete loosening [15].
Comparison of actual loosening of the implant within the bone structure with the simulated testing conditions by push-out testing suggests poor reproduction of loosening and lack of significance for conventional push-out testing [4]. Realistic implant loosening covers loss of stability over a prolonged timespan, with continuous loading, leading to initial microscopic cracks in BII. Microcrack accumulation results in formation of macroscopic cracks with visible influence on stability. Yet, first microscopic cracks already influence stability and need to be evaluated to identify influence of implant properties on loosening mechanics [16].
Adaption of conventional push-out testing is a possibility to develop an advanced testing process for realistic determination of implant stability, as load data alone cannot lead to a conclusion on beginning loosening. Goodwin et al. (2017) have already utilised acoustic emission (AE) sensors for monitoring failure of vertebra and long bone. In their setup, four-point-loading was performed on bone samples with mounted AE-sensors on top. They found differences in the respective bone-types, with AE-evaluation opening up a novel approach to fracture analysis [17].
An approach on combining AE measurement with loading and therefore push-out testing was conducted by Holweg et al. (2004) [18]. By adding AE measurement utilities to a tensile testing machine, they proposed a combined test stand for force- and AE measurement. This way, the additional AE information is enabled for a cross-correlation with load data and therefore advanced implant characterisation for the behaviour of the BII in context of osseointegration. Conventional testing methods do not display an accurate representation of the implant loosening mechanics and only detect failure at a final timepoint. Visible loosening only indicates, where the last stable bonding of the bone-implant connection is destroyed, which reduces significance of conventional push-out testing of implants for precise interface evaluation. Different studies have already displayed the advantages of AE monitoring during mechanical testing [17,19].
Here we investigate whether AE evaluation of a push-out testing process indicates early signs of defects, i.e., microcracks, and consequently allows for a more detailed and substantial testing of materials under loading. By specifically developing an adaptive sample structure for combined testing, we aim at delivering a proof-of-concept for the detection of macroscopic and microscopic cracks inside this surrogate model, as a methodological step toward a possible future application to bone-implant models. Therefore, a system design study has been performed with an adapted test stand for the proof-of-concept study.
2. System Design
The test stand is realized with adjustments to the specimen fixture of Holweg et al. (2004) (Figure 1) [18]. A tensile testing machine (Quasar 2.5, Galdabini, Cardano al Campo, IT) is used as basis, combined with a 1 kN load cell (TSTM 1 kN, x-sensors, Diessenhofen, CH) and LabTest Software (also Galdabini). For AE data acquisition, a wideband AE-sensor (WSα, Mistras, Princeton Junction NJ, USA) with an operating frequency of 100-1000 kHz in combination with an USB-AE-node (1283 AE-node, Mistras, Princeton Junction NJ, USA) for amplification and data processing is used. For data acquisition and analysis, AEWin Software (also Mistras) is used. For production of sample structures, SLA 3D-printing is used with a Formlabs printer (Form3BL, Formlabs, Somerville MA, USA).
The AE-sensor has is mounted on a levelled surface (Rz ≤ 1.6 µm) on top of a test plunger, as suggested by Holweg et al. (2004) [18]. The test plunger is custom manufactured for this application with levelled surfaces at each point of AE transmission (tip and sensor surface), comprising of stainless steel (1.4404). A couplant is applied between sensor and test plunger surface (High Vacuum Grease, DOW CORNING, Midland MI, USA). The plunger geometry is designed with a small tip, only slightly larger than the sample diameter, to minimize its influence on AE signal transmission. A custom specimen fixture was developed to accommodate cylindrical samples in a defined push-out process. The fixture permits alignment in x- and y-direction and is, by design, not restricted to planar slices as in Holweg et al. (2004) [18]. Therefore, a frame with 8 screws is the primary fixation of samples, which can be aligned to the test plunger. Samples are inserted in the frame and fixed using the screws. A 3D-printed sample holder, comprising the test sample material, is used for further testing. Push-out is performed from above in z-Direction.
The fixture accommodates sample diameters from 7–70 mm and lengths from 12–42 mm. This geometric range is intended to later accommodate samples with uneven surfaces; the present study, however, is restricted to the standardized surrogate geometry described below.
The software configuration, as presented in Table 1, is kept constant throughout all test runs. Peak Definition Time (PDT), Hit Definition Time (HDT) and Hit Lockout Time (HLT) setup defines the characterization of incoming signals. Each can be described as a timer, defining the interpretation of the signal. PDT starts after a signal is detected and defines the allowable time for detection of a peak. HDT defines the maximum time for a crossing of a threshold and restarts after each crossing. HLT defines the time after HDT has ended, where no signal can be detected and avoids detection of AE wave reflections.
All parameters are used for correct identifications of a hit, which is the event leading to a signal which then is registered as a threshold crossing. A hit is defined by the AE or a AE-wave crossing the defined threshold, which is then displayed as a point in the amplitude-time-diagram [20]. A pencil-lead-break (PLB; 0.5 mm line width; 2H hardness) is performed on the sample surface, according to ASTM E976-10 (HSU-Nielsen Test). The PLB leads to an initial AE-wave, which is used for adjustment of settings, as performed for parameter setup.
3. Materials and Methods
Sample development focused on the magnitude of fracture and the differentiation of micro- and macrocrack occurrence. Main difference of micro- and macroscopic crack initiation is the visibility of cracks without application of any magnification, with microcracks in bone being usually below 1 mm in length [19]. The model therefore should produce visible cracks on a reproducible scale for testing inside presented test stand. To reduce occurrence and accumulation of cracks before total failure of material (meaning potential microcracks) and produce the aimed at visible fracture, a brittle material (elongation at break 5%) with a fracture-promoting geometry was designed, as displayed in Figure 2 (a) [21]. The sample consists of a supporting outer ring with an outer diameter of 5.5 mm and an inner diameter of 3.9 mm. The outer ring is connected to a central cylindrical core with a diameter of 2.5 mm, featuring a convex top and bottom surface to ensure ideal contact with the test plunger. The connection between the outer ring and the central core is realized by radially oriented struts, whose number and thickness are varied to investigate their influence on the mechanical response of the structure.
SLA-3D-printing was used. Samples were printed using Formlabs ClearV4 material with identical alignment on the print bed. After printing, all samples have been cleaned and UV-hardened for 30 minutes. Additionally, the geometry has been adapted to achieve defined breaking points on each strut.
A finite element analysis was used to analyze the mechanical behavior of the structure under physiological loading conditions, as presented in Figure 2 (b) and (c). The 3D geometry of the model was based on a CAD design created in Inventor (Autodesk, San Francisco CA, USA), which accurately represents the structural features of the experimental setup. The material properties were defined according to Formlabs ClearV4 Resin, as provided in the material data sheet and assigned within Inventor’s simulation environment. The model was meshed using tetrahedral elements with an average element size of 0.1 mm. Boundary conditions were applied to replicate experimental constraints: the supporting outer ring was fully fixed (zero displacement in all directions), while a z-directional compressive force was applied uniformly over a defined contact area from above. The simulation was performed as a static, linear-elastic analysis. The results were analyzed in terms of von Mises stress distribution and total deformation. These outputs presented the mechanical integrity and potential failure regions of the structure under simulated loading conditions.
For identification of contact area influence, a two-factor approach was developed based on simplified DoE standards for experimental analysis (Table 2). Stability and contact area of struts was varied by (A) number of struts and (B) thickness of struts. This led to a matrix of combinations; each being tested in a push-out process. For each parameter, maximum and minimum value have been identified depending on printability. As a result, 20 samples have been tested. Due to a mechanical failure during push-out testing, one sample was omitted.
LabTest Software has been used to implement a testing scheme for push-out. Three phases can be subdivided, with (1) being the initial contact of test plunger and sample surface, (2) being a stationary hold of the plunger on the sample surface and (3) being the final push-out process. A defined abortion criterion has been included (maximum load of 300 N). For initial contact, the test plunger was moved with a speed of 0.1 mm/min in z-direction until the plunger was in contact with sample surface and a pre-load of 0.5 N has been achieved (1). After that, contact was held without increase of load (2). At this point a PLB was performed. Finally, the process was continued with a 5 mm/min push-out of the sample until the abortion criterion of 300 N was achieved (3).
Correlation analysis has been performed using a custom evaluation script in R (RStudio, Posit PBC, Boston MA, USA). A Principal Component Analysis (PCA) was carried out to determine the relevance of AE-parameters and verify staging [22]. PCA identifies the directions (principal components) in which the data shows the greatest variance. These directions are orthogonal and ordered by the amount of variance they capture.
This 5-dimensional data structure displays a high complexity for data analysis. Therefore, PCA can be applied to simplify the dimension. For that, all hits are centered using a min-max normalization, as the differences in the gathered AE parameters and their range of values would dominate the analysis.
These vectors can be summarized in a matrix for each analysed strut variation.
By calculating the covariance matrix and carrying out an eigenvalue decomposition (EVD), eigenvalues and eigenvectors can be identified. In contrast, a singular value decomposition (SVD) can be used to simplify the computational calculation, which has been employed in this study. The eigenvalues and eigenvectors lead to calculation of the singular value matrix D. The right singular vectors are obtained as the orthonormal eigenvectors of , corresponding to its eigenvalues.
With this, the PC-values can be calculated.
The proportion of variance explained by each principal component is given by the squared singular value divided by the sum of all squared singular values.
With these values a Biplot can be created, visualizing the observations in form of PC values. Additionally, right singular vectors V in the PCA biplot represent the original variables projected onto the first two principal components. Their direction shows how each variable contributes to the new coordinate system, and their length reflects how well the variable is represented in this 2D projection. Technically, the coordinates of each arrow correspond to the variable’s loadings, i.e., the entries of the eigenvectors associated with the PC values. The term loadings refer to the coordinates of the variable vectors (arrows) in the biplot, while scores refer to the coordinates of the observations (data points) in the principal component space.
4. Results
4.1. FEM Analysis
FEM analysis was conducted for validation according to presented conditions, focusing on the simulation of failure at different push-out loads. Figure 2 displays simulation results for two distinct scenarios: (b) Minimum load range of 10 N as starting point of initial failure and (c) 500 N maximum load as the maximum upper limit for the defined testing process. FEM-simulated crack initiation on the designed struts could be verified by observation during push-out. Simulation results present a reproducible failure at estimated breaking points. No differences result from higher load, with breakage points remaining on the 3 struts as intended.
4.2. Post-Processing
Main part of post-processing is the identification of noise and unwanted AE-sources in the resulting data set. As all AE-occurrences are registered, friction from the test plunger or friction on the material surface due to small particles can potentially be identified and included in results as well. These particles result from separating support structures from the actual sample geometry during production of samples.
This leads to the necessity of defined criteria to eliminate non-target AE from the results and gain a clear recording from solely push-out signals and damage of material connections. To achieve this, a top-down process was utilized, to generate filter criteria from a data set for push-out of the strut-structures. Overall data acquisition presents various acoustic emission hits during push-out. The noticeable increase of AE after failure of material at load drop-off, hints at occurrence of friction-induced hits.
Just after maximum load, no bonding is left meaning no AE resulting from push-out should be detected. Furthermore, in case of a remaining bonding, for example when struts break one after another, a load smaller than the previous maximum force cannot lead to new AE. This can be explained by the Kaiser-effect, which states that all acoustic emissions for a fracture are emitted at initial loading. The emission does not reproduce for another timepoint at the same load, for example in repetitive cyclic loading [23].
Several characteristics have been analysed for detection of AE activity: amplitude, risetime, duration, energy (non-dimensional) and counts. Comparison of hits before drop-off and after indicated lower share of risetime concerning total time (duration + risetime). The acoustic signal had a low risetime and upon visible analysis in the AEWin software, a continuous form without visible peaks. Threshold crossings were therefore also low. Energy of friction-induced hits was frequently in the range of 0-1.
Table 3 displays selected hits during push-out of a strut-structure. Total failure and breakage of the final bonds resulted in a loud hit at maximum detection level of 100 dB. However, amplitude cannot be used for unambiguous identification of noise as differentiation of hits with lower amplitude was not possible. Duration and Energy provided more distinct criteria for differentiation. This way, a clear classification for cracks and friction/noise could be defined. Classification of hits included a visual check in the AEWin software. The characteristic form of a friction- or noise-induced hit could clearly be differentiated in visual inspection. The course of the load curve is comparable to conventional push-out testing results.
Figure 3 displays push-out of structures with (a) 3 struts and structures with (b) 11 struts. The colour corresponds to strut thickness. Post-processing parameters defined from previous analysis as presented, were applied (counts > 0, amplitude > 0, energy > 1, percentual share of risetime < 10% and PLB has been removed). Regarding the 3-strut-structures, the load reached maximum values of roughly 50-75 N with low noticeable differences for comparison of 0.4 mm to 0.8 mm strut thickness.
For 11 struts, the overall load resistance increased to 150-200 N for 0.4 mm struts to roughly 200-300 N for 0.8 mm struts. The correlation of the maximum load resistance to contact area is evident, meaning higher contact area resulted in higher maximum load. With regards to hit occurrence, there was no visible difference for contact area increase. Neither increase of strut thickness, nor increase of strut number resulted in a sharp increase of overall amplitude or energy level judging from basic load-AE-plotting. More struts resulted in more AE hits, potentially resulting from higher friction after damage of struts. For every series, the characteristic course for push-out could be observed: increase of load until maximum value and then drop-off to values around zero with at least one hit at the timepoint of maximum load. For some series, accumulation of multiple hits before the point of maximum load could be observed, leading to the assumption that material had not failed instantly, but rather progressively due to potential air pockets or material inhomogeneity.
However, the overall course did display a typical push-out, with additional information on AE activity. All hits at point of total failure where considerable during testing and could be allocated to timepoint of maximum load. Macroscopic cracks could be visibly initialised, leading to a proof-of-concept: amplitude-load plotting does indicate the occurrence of hits at given loading condition and even hints at failure type by accumulation of hits and therefore breakage just before maximum load, leading to absolute failure. Proof-of-concept had to be further evaluated regarding type of crack, to enable identification of microcracks and differentiation from macrocracks.
4.3. Proof-of-Concept
To gain a simplified insight into macrocrack initiation, qualitative (parameter based) analysis was limited to energy, amplitude, counts risetime and duration [23].
Figure 4 displays an exemplified course of push-out for sample 6. The structure had 3 struts and a 0.4 mm strut thickness. Analysis is limited to 3-strut structures, as it displayed a lower overall stability and less AE hits in post-fracture stage, which simplified the evaluation of results and reduced noise elimination effort. For Formlabs ClearV4 material, an elongation at break of 5% is specified. With this, fracture stages can be defined via the course of the load curve.
By calculating the elongation for the identified breakage points, the maximum displacement (= elongation) could be calculated to 0.024 mm for a strut thickness of 0.4 mm, and 0.048 mm for a strut thickness of 0.8 mm [24]. This value defines the threshold for the transition of stage (I) to stage (II), as displayed in Figure 4. This stage can be defined as a plastic stage (I), where few to no cracks occur.
The second stage is defined by the point of fracture, meaning the hit with maximum load before drop-off. These fractures are assumed to be of microscopic type and go on to form macroscopic fracture. During this process, AE of micro- and macrocracks are emitted. This stage can be described as pre-fracture stage (II).
The first macroscopic crack results in loss of stability, as it is a major incident concerning material homogeneity. Therefore, the hit at load drop-off can be defined as the starting point of macroscopic crack propagation and therefore stage (III), the fracture stage, followed by the post-fracture stage (IV), where predominantly macroscopic cracks occur. In post-fracture the number of macroscopic cracks increases until absolute failure at the end of stage (IV), where load drops to zero. Definition of stages follows findings in Xu et al. (2021) [25], where a differentiation between post- and pre-fracture has been developed. An initial stage has been added for PLB, where a manual breakage is simulated via the pencil lead.
With AE analysis we aim at additional information on the process of material destruction and BII evaluation. Therefore, AE results need not only to match the information of push-out testing and the defined stages, but also to deliver additional information on the progression of defects.
A PCA analysis was performed to verify the staging derived from the load course (Figure 5). The principal component values (PC) were calculated according to the previously described procedure. The results showed a high proportion of explained variance, with PC1 accounting for 94% of the total variance and PC2 accounting for 3.8%. Together, these two components explain 97.8% of the total variance, capturing the vast majority of the information in the dataset and are therefore sufficient for further analysis. Consequently, the original five-dimensional problem can be effectively reduced to two principal components, simplifying the analysis while preserving nearly all relevant information.
Since PC1, represented on the x-axis, explains 94% of the total variance, the separation of the data occurs primarily along this component. The PLB scores cluster on the negative side of PC1 in a compact formation, indicating low variability and a distinctly different condition compared to the other stages. Stage II is located mainly on the positive side of PC1 and shows a wide dispersion along PC2. Its partial overlap with stage III suggests strong similarities and indicates a transitional phase without clear separation. Stage III is positioned between Stages II and IV and overlaps substantially with stage II, supporting its interpretation as an intermediate state. In contrast, stage IV is shifted markedly toward higher positive PC1 values and extends upward along PC2, while exhibiting greater variability. This suggests that post-fracture stage IV represents the most advanced stage, clearly differentiated from the preceding stages.
The loading vectors indicate that duration, amplitude, and energy contribute strongly to PC1, as they point prominently in the positive PC1 direction. Thus, the transition from PLB to stage IV corresponds to increasing signal intensity and duration. The nearly parallel orientation of these vectors indicates a strong positive correlation among these parameters. Risetime contributes primarily to PC2 and shows comparatively independent behaviour. However, since PC2 accounts for only 3.8% of the total variance, its overall influence is minor. The counts vector is located close to the origin, indicating a weaker contribution to the explained variance. Overall, the progression of damage appears to be mainly associated with increases in amplitude, energy, and duration, with only a minor influence of risetime. These parameters therefore provide a suitable basis for staging and for further evaluation of defect characteristics, such as fracture intensity.
5. Discussion
In this work we developed and evaluated a push-out test stand with integrated acoustic emission monitoring, using a controlled surrogate to characterize the acoustic signature of progressive structural failure. The longer-term motivation is a method for bone-implant interface evaluation; establishing that link, however, is beyond the scope of the present surrogate study. To assess the capability of the test stand we also successfully developed a sample structure to initiate both microscopic and macroscopic defects. Additionally, we tested all samples in the test stand and aimed at differentiation of crack types and fracture stages in 3D-printed samples. This work highlights the advantages of acoustic emission testing in this specific use-case with a significant increase in informative value of conventional push-out testing, by addition of acoustic emissions testing.
Qualitative parameter-based analysis informed the most relevant advantages of combined testing of load and acoustic emission compared to conventional load testing. The first iteration of filtering provided refinement of data to an analysable version, with eliminated noise and friction signals. The correct identification of noise could be verified by visual analysis in the acoustic emission software, as all continuous signals (e.g., friction) were correctly excluded. However, it is not clear whether all hits analysed are completely free from noise and friction emission, as the identification of hits in included data, rather than in excluded data, is much more challenging. Quantitative signal-based analysis could be a further step to verify total absence of hits resulting from noise and friction, by pinpointing specific frequency-related characteristics [26].
Test sample design proved to be appropriate for the test setup, with struts as defined breaking points. The FEM simulation and in-experiment observations verified the sample design. The initial hypothesis, also shown in FEM simulation, stated that more struts and therefore higher contact area translate to higher load resistance with more acoustic emission activity through the increase of potential fracture locations. Garcia-Vilana et al. (2021) have shown, that acoustic emission activity and number of hits is proportional to defects in materials and verified their hypothesis with stress-strain evaluation in bone samples [27].
In a first analysis, we observed load resistance, meaning maximum load before fracture, to increase with thickness of struts for both sample types. Furthermore, the difference in each identical structure itself (for example 11 struts 0.4 mm vs. 0.8 mm) was more significant, meaning the leap in maximum load for 11 struts was higher than in 3 struts. This indicates that the difference in load resistance is more dominant with significantly higher contact area, also indicating that high contact area samples can be directly differentiated from lower contact area samples by their AE during push-out.
Whether an analogous contact-area dependence holds for osseointegrated implants cannot be inferred from the present surrogate data; for real bone, Walsh et al. (2020) report a contact-area dependence of fixation strength, which motivates, but does not validate the surrogate analogy used here [28]. Looking at the resulting data, an increase in friction-induced hits with increasing contact-area is visible, meaning that elimination of these hits from inspected datasets through filtering needs to be carried out thoroughly, emphasizing the importance of post-processing in AE analysis.
With regards to the final optimization of this testing process and post-processing strategy, a quantitative signal-based analysis can lead to improved filtering, as already suggested by Behrens et al. (2019), where centroid frequency was introduced to identify damage stages [26]. This quantitative approach can be a subsequent step for further data evaluation and noise filtering.
For our qualitative analysis, focus on simple 3-strut samples has proven to be beneficial for an initial evaluation, as number of noise and friction-induced hits can be reduced compared to 11-strut samples. Differentiation of multiple stages in defect progression is a well-defined phenomenon in mechanical material testing. Zhao et al. (2020) have defined five stages for progressive failure in rock compression similar to the presented stages in this work [29]. Differentiation of stages differs however, resulting from the region of interest in acoustic emission analysis of BII as the final point of fracture marks the end of analysis opposed to conventional testing, where a post-fracture stage is evaluated.
He et al. (2023) have already defined some observations of crack initiation in bone samples, where first attempts at classification of cracks has been done [30]. However, these prevent defined staging, as simple bone fracture is hard to classify. The findings correlate with our study, as fracture and AE rise have also been identified in tested samples. Yet, by identification of plastic state and the hypothesis, that no AE occur during plastic deformation, we were able to improve classification to a 4-stage process for push-out testing.
The main aim of our setup is the detection of hits during the pre-fracture stage (II), which comprises microcracks. Accumulation of cracks will lead ultimately to absolute failure of the material. However, failure, being a macroscopic defect, is already detectable through the load course in conventional testing. Therefore, analysis of fracture stage (III) is of less interest, as it is already detectable through conventional push-out testing [14,15]. Our samples produced consistent AE hits during loading prior to the macroscopic load drop (pre-fracture stage II). We interpret these as candidate signatures of early microstructural failure; this interpretation remains to be confirmed by independent methods such as microscopy, micro-CT or digital image correlation, and is not established by the acoustic data alone. Importantly, such pre-drop activity is not accessible to conventional push-out or pull-out testing [14,15], which is the central methodological observation of this proof-of-concept [14,15]. Therefore, test runs present proof-of-concept for this testing process and emphasize the gain in informative value. However, attenuation and reflection of AE must be taken into consideration for further testing, as complex test plunger structure, multi-material transitions and sample structure influence the detected signals. As Qi (1999) has shown, attenuation plays a major role for energy and amplitude of AE, although amplitude is less influenced than energy [31]. By application of the mentioned couplant, we already reduce the effect of attenuation. Yet reflection through interface transition and complex geometries need to be further studied. Additionally, application of couplant on the interface of plunger and specimen should be carried out in future testing.
Simplification of the multi-dimensional AE results was performed using PCA, reducing the original five-parameter space to two principal components while retaining 97.8% of the total variance. Although this dimensionality reduction facilitates visualization and interpretation, it should be noted that PCA is a linear transformation method and therefore captures only linear relationships between variables. Potential nonlinear interactions between AE parameters are not explicitly represented.
The results indicate that stage separation is predominantly governed by amplitude, energy, and duration, as reflected by their strong contribution to PC1. This suggests that the staging procedure is largely intensity-driven, which is consistent with progressive crack growth and increasing fracture activity. However, the dominance of PC1 (94% variance) also implies that the system’s behavior is essentially one-dimensional under the investigated conditions. Consequently, the observed stage differentiation may reflect gradual signal amplification rather than fundamentally different damage mechanisms. Furthermore, the overlap between stages II and III indicates that the transition between intermediate damage states is not sharply defined. This suggests that the current parameter set may not fully capture subtle mechanistic differences at these stages.
Overall, while PCA provides a robust and transparent framework for dimensionality reduction and staging verification, further investigations incorporating additional features, nonlinear analysis techniques, and/or independent validation methods would strengthen the interpretation of damage progression and improve stage discrimination.
Additional experiments on realistic samples are necessary to establish a solid database for acoustic emission testing in context of bone-implant-connections.
This testing process opens the opportunity to evaluate samples already during loading and identify non-visible microscopic defects before final failure without the need of verification through imaging. However, this benefit presupposes excessive analysis of sample geometry and material. Translation to bone-implant testing is therefore not trivial. Especially the multi-material analysis of bone and implant is challenging due to the inhomogeneous bone structure, attenuation and different material characteristics [19].
6. Conclusions
This study introduced and demonstrated the feasibility of an advanced push-out test stand combined with acoustic emission (AE) monitoring to characterize micro- and macrocrack initiation in strut-structured, additive manufactured samples. Through systematic post-processing, unwanted noise and friction signals were successfully reduced, allowing AE hits to be linked directly to distinct stages of failure. A four-stage fracture progression was defined, with particular emphasis on the pre-fracture stage, in which AE activity was observed prior to any macroscopic load response — activity we attribute, pending independent validation, to early microstructural failure. The results confirmed that increasing strut thickness and contact area enhances load resistance and AE activity, thereby correlating structural parameters with fracture behavior. The PCA results suggest that AE data analysis achieves results equivalent to conventional load analysis while offering considerable additional analytical potential that remains largely unexplored in this study. Moreover, the information obtained from AE analysis is substantially richer than that derived from simple load evaluation, as the fracture stages could be clearly identified in both testing approaches.
While qualitative parameter-based filtering proved effective for initial evaluation, future integration of quantitative, frequency-based signal analysis and machine-learning approaches is expected to improve reliability and enable automated classification of crack types. Overall, the presented methodology constitutes a proof-of-concept for combining load testing with AE analysis in BII research. By capturing acoustic activity that precedes catastrophic failure, this approach offers added value compared to conventional load testing and provides a methodological basis for subsequent studies on biological and bone-implant sample, which are required before any statement on clinical relevance can be made.
Author Contributions
Conceptualization, methodology, investigation, writing—original draft preparation, visualization K.Pour Rahimi; Conceptualization M.Schultz, supervision F.Müller, P. Müller-Reichmann and R. Lachmayer, writing—review and editing, supervision U. Urban, P.P. Pott and U.F.Froriep.
Funding
This research did not receive any specific grant from funding agencies in the public, commercial, or non-for-profit sectors.
Data Availability Statement
Data will be made available upon request.
Declaration of generative AI and AI-assisted technologies in the manuscript preparation progress
During the preparation of this work, the authors used an AI-based tool (FhGenie, Fraunhofer) to assist with language refinement. The AI did not generate original scientific content or conclusions. All resulting texts were carefully reviewed and revised by the authors, who take full responsibility for the content of the published article.
Conflicts of Interest
Authors declare no conflict of interest.
Abbreviations
The following abbreviations are used in this manuscript:
| AE | Acoustic Emission |
| AMP | Amplitude |
| BII | Bone-implant Interface |
| CAD | Computer-Aided Design |
| COUN | Counts |
| DoE | Design of Experiments |
| DUR | Duration |
| ENER | Energy |
| EVD | Eigenvalue Decomposition |
| FEM | Finite Element Method |
| HDT | Hit Definition Time |
| HLT | Hit Lockout Time |
| PCA | Principal Component Analysis |
| PDT | Peak Definition Time |
| PLB | Pencil-Lead-Break |
| RISE | Risetime |
| SLA | Stereolithography |
| SVD | Singular Value Decomposition |
| Singular Value Matrix | |
| Initial Length | |
| Elongation | |
| Centered Matrix of AE-Observations | |
| Principal Component Value | |
| Right Singular Vector | |
| Entry of AE Vector | |
| Centered Entry of AE Vector | |
| Eigenvalue | |
| Eigenvector | |
| Elongation at Break |
References
- Albrektsson, T.; Johansson, C. Osteoinduction, osteoconduction and osseointegration. European spine journal: official publication of the European Spine Society, the European Spinal Deformity Society, and the European Section of the Cervical Spine Research Society 2001, 10 Suppl 2, S96–101. [Google Scholar] [CrossRef]
- Brånemark, R.; Brånemark, P. I.; Rydevik, B.; Myers, R. R. Osseointegration in skeletal reconstruction and rehabilitation: a review. J. Rehabil. Res. Dev. 2001, vol. 38(no. 2), 175–181. [Google Scholar]
- Puleo, D. A.; Nanci, A. Understanding and controlling the bone-implant interface. Biomaterials 1999, vol. 20, 23-24, pp. 2311–2321. [Google Scholar] [CrossRef]
- Gao, X.; Fraulob, M.; Haïat, G. Biomechanical behaviours of the bone-implant interface: a review. J. R. Soc. Interface 2019, vol. 16(no. 156), 20190259. [Google Scholar] [CrossRef]
- Lee, J. W. Y.; Bance, M. L. Physiology of Osseointegration. Otolaryngol. Clin. N. Am. 2019, vol. 52(no. 2), 231–242. [Google Scholar] [CrossRef] [PubMed]
- Amengual-Peñafiel, L.; Córdova, L. A.; Constanza Jara-Sepúlveda, M.; Brañes-Aroca, M.; Marchesani-Carrasco, F.; Cartes-Velásquez, R. Osteoimmunology drives dental implant osseointegration: A new paradigm for implant dentistry. Jpn. Dent. Sci. Rev. 2021, vol. 57, 12–19. [Google Scholar] [CrossRef] [PubMed]
- Park, J. B.; Lakes, R. S. “Introduction to Biomaterials,” in Biomaterials: An Introduction; Park, J. B., Lakes, R. S., Eds.; Springer US: Boston, MA, s.l., 1992; pp. 1–6. [Google Scholar]
- Robert Haas and Bernhard Pommer, Die Extraktionswunde: Anatomische und physiologische Grundlagen der Sofortimplantation. 2015. Available online: https://www.researchgate.net/publication/294871404_Die_Extraktionswunde_Anatomische_und_physiologische_Grundlagen_der_Sofortimplantation.
- Shalabi, M. M.; Gortemaker, A.; Van’t Hof, M. A.; Jansen, J. A.; Creugers, N. H. J. Implant surface roughness and bone healing: a systematic review. J. Dent. Res. 2006, vol. 85(no. 6), 496–500. [Google Scholar] [CrossRef]
- Anil, U.; Singh, V.; Schwarzkopf, R. Diagnosis and Detection of Subtle Aseptic Loosening in Total Hip Arthroplasty. J. Arthroplast. 2022, vol. 37(no. 8), 1494–1500. [Google Scholar] [CrossRef]
- Buser, D.; Schenk, R. K.; Steinemann, S.; Fiorellini, J. P.; Fox, C. H.; Stich, H. Influence of surface characteristics on bone integration of titanium implants. A histomorphometric study in miniature pigs. J. Biomed. Mater. Res. 1991, vol. 25(no. 7), 889–902. [Google Scholar] [CrossRef] [PubMed]
- Deng, J.; van Duyn, C.; Cohen, D. J.; Schwartz, Z.; Boyan, B. D. Strategies for Improving Impaired Osseointegration in Compromised Animal Models. J. Dent. Res. 2024, vol. 103(no. 5), 467–476. [Google Scholar] [CrossRef]
- Schwarz, M. L. R.; Kowarsch, M.; Rose, S.; Becker, K.; Lenz, T.; Jani, L. Effect of surface roughness, porosity, and a resorbable calcium phosphate coating on osseointegration of titanium in a minipig model. J. Biomed. Mater. Res. Part A 2009, vol. 89(no. 3), 667–678. [Google Scholar] [CrossRef] [PubMed]
- Brånemark, R.; Skalak, R. An in-vivo method for biomechanical characterization of bone-anchored implants. Med. Eng. Phys. 1998, vol. 20(no. 3), 216–219. [Google Scholar] [CrossRef]
- Barckman, J.; Baas, J.; Sørensen, M.; Bechtold, J. E.; Soballe, K. Periosteal augmentation of allograft bone and its effect on implant fixation - an experimental study on 12 dogs. Open Orthop. J. 2013, vol. 7, 18–24. [Google Scholar] [CrossRef]
- Watanabe, Y.; Takai, S.; Arai, Y.; Yoshino, N.; Hirasawa, Y. Prediction of mechanical properties of healing fractures using acoustic emission. J. Orthop. Res. Off. Publ. Orthop. Res. Soc. 2001, vol. 19(no. 4), 548–553. [Google Scholar] [CrossRef]
- Goodwin, B. D.; Pintar, F. A.; Yoganandan, N. Acoustic Emission Signatures During Failure of Vertebra and Long Bone. Ann. Biomed. Eng. 2017, vol. 45(no. 6), 1520–1533. [Google Scholar] [CrossRef]
- Holweg, K.; Brandt, J.; Bierögel, C.; Grellmann, W.; Altenbach, H. Schädigungscharakterisierung der Implantat-Knochen-Grenzfläche. In in Grenzflächen bei Implantaten - mechanische und biologisch-chemische; 2004; pp. 9–17. [Google Scholar]
- García-Vilana, S.; Sánchez-Molina, D.; Abdi, H. Acoustic Emission in Bone Biomechanics: A Comprehensive Review of Mechanical Properties and Predictive Damage Modeling. Sensors vol. 25(no. 3), 598, 2025. [CrossRef]
- Unthnorsson, R. “Hit Detection and Determination in AE Bursts,” in Acoustic Emission: Research and Applications; Erscheinungsort nicht ermittelbar; Sikorski, W., Ed.; IntechOpen, 2013. [Google Scholar]
- Astakhov, V. P. “Mechanical Properties of Engineering Materials: Relevance in Design and Manufacturing,” in Materials Forming, Machining and Tribology, Introduction to mechanical engineering; Davim, J. P., Ed.; Springer: Cham, 2018; pp. 3–41. [Google Scholar]
- Greenacre, M.; Groenen, P. J. F.; Hastie, T.; D’Enza, A. I.; Markos, A.; Tuzhilina, E. “Principal component analysis,” (in En;en). Nat. Rev. Methods Prim. 2022, vol. 2(no. 1), 100. [Google Scholar] [CrossRef]
- Lavrov, A. The Kaiser effect in rocks: principles and stress estimation techniques. Int. J. Rock. Mech. Min. Sci. 2003, vol. 40(no. 2), 151–171. [Google Scholar] [CrossRef]
- Bargel, H.-J.; Schulze, G. Werkstoffkunde, 12th ed; Springer Vieweg: Berlin, Heidelberg, 2018. [Google Scholar]
- Xu, J.; Ashraf, S.; khan, S.; Chen, X.; Akbar, A.; Farooq, F. Micro-cracking pattern recognition of hybrid CNTs/GNPs cement pastes under three-point bending loading using acoustic emission technique. J. Build. Eng. 2021, vol. 42, 102816. [Google Scholar] [CrossRef]
- Behrens, B. A.; Hübner, S.; Wölki, K. Acoustic emissions during tensile test of DC06 and HCT600X. Mater. Werkst. 2019, vol. 50(no. 7), 796–809. [Google Scholar] [CrossRef]
- García-Vilana, S.; Sánchez-Molina, D.; Llumà, J.; Fernández-Osete, I.; Veláquez-Ameijide, J.; Martínez-González, E. A predictive model for fracture in human ribs based on in vitro acoustic emission data. Med. Phys. 2021, vol. 48(no. 9), 5540–5548. [Google Scholar] [CrossRef] [PubMed]
- Walsh, W. R.; et al. , Bone ongrowth and mechanical fixation of implants in cortical and cancellous bone. J. Orthop. Surg. Res. 2020, vol. 15(no. 1), 177. [Google Scholar] [CrossRef] [PubMed]
- Zhao, K.; Yang, D.; Gong, C.; Zhuo, Y.; Wang, X.; Zhong, W. Evaluation of internal microcrack evolution in red sandstone based on time–frequency domain characteristics of acoustic emission signals. Constr. Build. Mater. 2020, vol. 260, 120435. [Google Scholar] [CrossRef]
- He, W.; Yan, D.; Liu, M.; Gao, X.; Zhang, Y.; Xu, D. Acoustic Emission Characteristics of Different Porcine Bones Under Loading. Int. J. Acoust. Vib. 2023, vol. 28(no. 1), 44–49. [Google Scholar] [CrossRef]
- Qi, G. Attenuation of acoustic emission body waves in acrylic bone cement and synthetic bone using wavelet time-scale analysis; 1999. [Google Scholar]
Figure 1.
Test stand constitution with an enlarged display of the specimen grip.

Figure 2.
Overview of the designed strut-structure (a) with FEM-analysis of a simplified z-directional push-out for 10 N (b) versus 500 N. (c) Von Mises stress in MPa.
Figure 2.
Overview of the designed strut-structure (a) with FEM-analysis of a simplified z-directional push-out for 10 N (b) versus 500 N. (c) Von Mises stress in MPa.

Figure 3.
Comparison of AE data for 3 struts (a) and 11 struts (b) with load data and displacement rate. PLB has been removed.
Figure 3.
Comparison of AE data for 3 struts (a) and 11 struts (b) with load data and displacement rate. PLB has been removed.

Figure 4.
Exemplary course for a 3-strut and 0.4 mm structure (sample no. 6) with visualized fracture stages (Pencil-Lead-Break PLB, plastic stage I, pre-fracture stage II, fracture stage III, post-fracture stage IV).
Figure 4.
Exemplary course for a 3-strut and 0.4 mm structure (sample no. 6) with visualized fracture stages (Pencil-Lead-Break PLB, plastic stage I, pre-fracture stage II, fracture stage III, post-fracture stage IV).

Figure 5.
Biplot of PC1 (94%) and PC2 (3.8%) illustrating stage clustering and variable loadings for 3 strut structures.
Figure 5.
Biplot of PC1 (94%) and PC2 (3.8%) illustrating stage clustering and variable loadings for 3 strut structures.


Table 1.
Parameters for AE Data Acquisition.
| Parameter | Description | Value |
| PDT | Peak Definition Time | 200 µs |
| HDT | Hit Definition Time | 800 µs |
| HLT | Hit Lockout Time | 1000 µs |
| Filter | Accepted Range | 100-600 kHz |
| Sample Rate | - | 5 MSPS |
| Pre-Trigger | - | 20.000 µs |
| Length | - | 7k (1k = 256 µs) |
| Waveform | - | ON |
Table 2.
Parameter Combinations for Strut Testing.
| Parameter A (Struts) | Parameter B (Thickness in mm) | Number of Samples |
| 11 | 0.4 | 5 |
| 11 | 0.8 | 5 |
| 3 | 0.4 | 5 |
| 3 | 0.8 | 5 |
Table 3.
Classification of different AE-occurrences.
| Amplitude AMP [db] |
Counts COUN[-] |
Duration DUR [µs] |
Energy ENER[-] |
Risetime RISE [µs] |
Classification |
| 44 | 77 | 1100 | 3 | 26 | PLB |
| 100 | 7407 | 41930 | 16609 | 20 | Fracture |
| 77 | 411 | 3545 | 167 | 31 | Crack |
| 31 | 2 | 45 | 0 | 36 | Friction/Noise |
| 30 | 29 | 500 | 1 | 1 | Friction/Noise |
Disclaimer/Publisher’s Note: The statements, opinions and data contained in all publications are solely those of the individual author(s) and contributor(s) and not of MDPI and/or the editor(s). MDPI and/or the editor(s) disclaim responsibility for any injury to people or property resulting from any ideas, methods, instructions or products referred to in the content. |
© 2026 by the authors. Licensee MDPI, Basel, Switzerland. This article is an open access article distributed under the terms and conditions of the Creative Commons Attribution (CC BY) license (http://creativecommons.org/licenses/by/4.0/).
Copyright: This open access article is published under a Creative Commons CC BY 4.0 license, which permit the free download, distribution, and reuse, provided that the author and preprint are cited in any reuse.


