
Submitted:
06 June 2026
Posted:
09 June 2026
You are already at the latest version
Abstract
Globally, it is estimated that the number of light duty vehicles will increase, with the potential to reach 2 billion by 2040, and that petrol, including biofuel additives such as ethanol, will continue to be used in substantial quantities for road transport applications until at least 2050. The main focus of vehicle manufacturers today is to ensure their future product ranges are compatible with forthcoming legislation through the development of zero tailpipe emission electric vehicles. One unforeseen consequence of this may be a reduction of research and development funding for internal combustion technology and a consequent slow-down in the recent progress in the reduction of internal combustion engine vehicle tailpipe emissions. The research presented in this paper provides a conceptual framework to systematize the interrelationships between specific tailpipe emissions reduction strategies and their effects on tailpipe greenhouse gas emissions. The application of a systems thinking approach seeks to leverage the benefits of previous investments and knowledge in the included reduction strategies through the identification of system weaknesses and intervention points, thus exploiting relationships in place of developing alternative technological solutions. This integrated approach is important as it has the potential to result in accelerated environmental gains, through the greater reduction of harmful gaseous tailpipe emissions, than would be possible from each strategy in isolation. A detailed causal diagram was constructed following the identification of the main emission reduction strategies, providing an ordered visual representation of the system and exposing the causality chains and relationships in the context of the greenhouse gas emissions reference mode. The analysis of this causal diagram revealed that each of the four main sub-model variables have several critical relationships: turbocharging and engine downsizing (7 apiece); bioethanol (6) and lightweighting (5). Further, that these can be exploited through a combination of changes in technology, behaviour, regulation and resource. The adoption of systems thinking methodology in this context is considered to be unique.
Keywords:
systems thinking
; system dynamics
; causal loop diagrams
; life cycle assessment
; greenhouse gas emissions
; bioethanol
; lightweighting
; turbocharging
; downsizing
1. Introduction
Since its conception, the internal combustion engine (ICE) has been subject to continuous research and development in an attempt to improve reliability, optimise performance and fuel economy, and latterly, to reduce gaseous tailpipe emissions and particulates. Throughout the early to mid-2000’s climate mitigating initiatives were directed towards the reduction of greenhouse gas (GHG) emissions, specifically carbon dioxide (CO2), and manufacturers were encouraged to develop small capacity high speed diesel engines to power the light duty vehicle (LDV) fleets. With the shift in consumer attitudes following the ‘dieselgate’ [1] scandal and the resulting move away from diesel powered LDVs, in part driven by government policies aimed at reducing nitrogen oxides (NOx), attention has turned to the longer term solution of phasing-out ICE powered LDVs.
In response to the requirement to reduce gaseous tailpipe emissions of the LDV fleet, there has been a move to zero tailpipe emission battery electric vehicles (BEV). However, whilst this transition to BEV and the removal of GHG vehicle tailpipe emissions represents a clear strategic vision, the issues of cost and infrastructure have limited this transition predominately to the markets of the Global North and China. Hence, large parts of the global vehicle market, those outside of the Global North and China, will remain aligned to the combustion engine vehicle for the foreseeable future. Further, the expected increase in the number of LDVs, to a figure of approximately 1.7 to 2 billion cars globally in 2040 [2,3], will be primarily realised in those markets outside of the Global North i.e. the developing countries of the Global South.
The requirement is that in those markets that are unable to transition to BEV and who remain wedded to ICE, that all available options to reduce gaseous tailpipe emissions are pursued. However, the consequence of a change in focus of the industry to meeting the high development costs associated with the transition to BEV, together with the longer term reduction in market for ICE in the Global North, has led to a question over investment in further development of cleaner ICE technologies. This requires that alternative approaches are considered to reduce tailpipe GHG emissions under the conditions of lower investment.
Optimising the environmental performance of the ICE through identifying and exploiting the critical relationships between existing emissions reduction strategies is one approach. Previous research into individual vehicle tailpipe gaseous emissions reduction strategies has revealed that the impact of individual actions can be leveraged when deployed in combination e.g. deploying vehicle lightweighting with a concurrent change to bioethanol [4,5,6,7,8]. Therefore, research in this paper looked to apply the approach of systems thinking to the challenge of reducing ICE emissions. With systems thinking and by employing qualitative systems mapping using causal loop diagrams (CLDs) it is possible to portray the dynamics, inter-relationships and feedback characteristics present within complex systems. Through identifying and exploiting the critical relationships between existing emissions reduction strategies, further improvements in the environmental performance of ICE vehicles could be realised. Specifically in this case the interconnections and interdependencies between engine downsizing, vehicle lightweighting, engine turbocharging and bioethanol fuels, previous investments in intellectual property (IP) and manufacturing could be exploited for the benefit of further emission reduction.
Section 2 provides a short introduction to systems thinking, a description of system dynamics (SD) methodology and CLDs. Section 3 describes the methodology; section 4 presents the complex systems model and the associated sub-system diagrams accompanied by results and interpretations of their meaning and their effect on the GHG emissions reference mode. Discussions are presented in section 5 followed by conclusions and suggestions for future research directions in section 6. The research focusing exclusively on SI engine powered LDVs.
2. Systems Thinking, Systems Dynamics Modelling & Causal Loop Diagrams
Systems thinking is a method that can be used to represent causal relationships between the variables that define a complex system. The definition of systems thinking varies according to the discipline [9] and has been defined and redefined numerous times since the term was first coined by Barry Richmond [10]. Currently, no uniformly accepted definition exists as demonstrated by the works of numerous researchers, [9,10,11,12], who have compared the various definitions proposed by leading experts in the field. The authors of this paper have adopted the definition put forward by Amissah, et al, [11] who state, ‘systems thinking is aimed at understanding relationships between components and their overall impact on system outcomes (i.e., intended and unintended) and how a system of interest similarly fits in the broader context of its environment’ (p.1) as the frame of reference for their work.
System dynamics modelling is a method used to analyse system related problems in which time is an important factor [13]. System dynamics uses simulation modelling tools to interpret the structure of the system [14], and one of these tools is causal loop diagrams. CLDs form the initial stage in the development of a system dynamics model [15] and are a visual diagramming technique [16] that qualitatively maps the elements/variables of the system and shows the causal relationships that are formed among them [14]. They communicate sources and implications of interactions and feedback within the system. In practice, CLDs display variables as text and the causal relationships between them are represented by arrows. The arrows indicate the direction of causality, the type of relationship (i.e., proportional or inverse), and whether there is any delay in an expected effects’ occurrence. Causal links must have either a positive (+) or negative (-) polarity and a collection of links that provides positive feedback is called a reinforcing loop. A collection of links that provides negative feedback is called a balancing loop [17]. Negative loops are self-correcting and counteract change [18]. Loop polarity may be established by counting the number of negative links, if this is an odd number then the loop is a balancing one. However, this method of determining loop polarity only works properly if the link polarities are correctly assigned. An alternative way to establish loop polarity is to trace the effect of a small change in one of the variables as it circulates around the loop [17].
CLDs do not predict what is going to happen to a system, instead they simply represent the structure of it and how it could behave in time under certain circumstances [14]. The method is a qualitative tool for modelling and relies on the researcher’s intuitions [19], however, when multiple loops interact it is often impossible to use intuition to determine what the dynamic effects will be and therefore it is necessary to develop a quantitative model using stocks and flows, applying mathematical equations to CLD models to allow for simulation [16,20]. To the best of the authors knowledge no work exploring the variables in the system of interest had previously been published and given that systems thinking and the associated dynamic modelling has predominately been applied to the solution of problems in the business and public policy domains it was unclear if this technique would be appropriate or what its true value would be. However, according to Sterman [17] ‘the usefulness of models lies in the fact that they simplify reality, creating a representation of it we can comprehend’ (p.89). CLDs are flexible and can be used to portray the feedback structure of a system from any domain. It was recognised therefore that adopting a systems thinking approach and the construction of CLDs would provide a useful visual representation of this complex system and its behaviour, and that this virtual realisation may inform experiments in the real-world, leading to the desired improvements.
3. Methodology
The research adopted the approach outlined in Rahman [21], which was a development of the framework developed by Sterman [17]. The approach is comprised of five structured stages, these being:
- i.
- Problem articulation (boundary selection).
The problem definition was identified as being the achievement of reduced tailpipe GHG emissions by leveraging existing technology and IP. Boundary selection is listed as part of problem articulation when considering textbook approaches to system dynamics modelling – the distinction between endogenous, exogenous and excluded variables. A taxonomy approach was adopted, considering primary physical systems (turbocharging; engine-downsizing; bioethanol; and lightweighting). A review of the literature was undertaken to identify and classify variables.
- ii.
- Formulation of a dynamic hypothesis.
The dynamic hypothesis is a view point of the modeller about what structures and interactions exist that can generate the expected behaviour. For each primary physical system the endogenous and exogenous variables identified from stage 1 are mapped to show the relationships – these include positive and negative relationship as well as complex and conditional.
- iii.
- Simulation model formulation.
In developing a system model, the final stage is formulation. Model formulation concerns the aggregation of the individual dynamic hypotheses from stage 2 – leading to an understanding how the actual system behaves.
- iv.
- Model testing.
Model testing is asking questions of the model to explore its functioning, and evaluation is related to confirmation of the dynamic hypotheses. The methodology was to ask questions based on observations extracted from literature and to ensure that the functioning of the model was apt based on feedback loops identified (present or absent), the classification of feedback loops (reinforcing or balancing), etc.
- v.
- Policy design and evaluation.
Whilst policy design and evaluation is the final stage of the approach proposed by Rahman, this research does not propose or evaluate, but elaborates upon the role of current policy design in the system, how that intervention could be developed and where there may be opportunity for additional intervention.
The following sections detail the application of the above methodology, with section 4.0 providing the key results and resulting system model and section 5.0 a discussion with regards the implications of the insights arising from the same.
4. Results
4.1. Problem Articulation (Boundary Selection).
A comprehensive review of literature revealed that there was the potential to achieve environmental gains by combining different mitigating strategies, such as the work by Lewis, et al, [4] who concluded that the combination of mass reduction and use of advanced engines in the same platform reduces life cycle GHG emissions. Similarly, work by Leach, et al, [2] concluded that ‘the fuel consumption and hence the GHG impact of spark ignition engines can be significantly reduced using existing technology’ (p.14). Based upon a review of the literature, the mitigating strategies of interest selected were: engine downsizing; vehicle lightweighting; engine turbocharging; and bioethanol fuels. Based upon these strategies the endogenous, exogenous and excluded variables were identified based on their prevalence and significance within the literature (Table 1).
4.2. Dynamic Hypothesis
The dynamic hypotheses were created based around the emission reduction strategies of interest, these being; turbocharging, engine downsizing, bioethanol and vehicle lightweighting. It should be noted that these strategies become ‘variables’ within the causal loop diagram presented in Figure 5, and are therefore referred to interchangeably throughout the following text and in Table 2, Table 3 and Table 4.
4.2.1. Turbocharging
The literature review revealed the key variables related to the turbocharging sub-model to be as listed, with references, in Table 1 and shown diagrammatically in Figure 1. It can be seen that there are two inputs and four main outputs. From the literature, Yang, et al [23] states that a turbocharger reclaims energy from the exhaust gas to boost the intake air thus improving the power density of the engine, which is one of the key enablers to achieve engine downsizing. The reduction of fuel consumption is today a significant factor in engine design and development [22] as it is a means of reducing harmful gaseous tailpipe emissions, and is primarily achieved through engine downsizing, increasing the engine compression ratio and the fitment of a turbocharger. However, due to the higher in-cylinder compression pressures and higher combustion temperatures, the likelihood of ‘engine knock’ is increased leading to reduced engine efficiency as a result of increased heat transfer through the cylinder walls, plus the likelihood of catastrophic mechanical damage to the piston, cylinder, valves and other engine components. One solution to mitigate this is the use of higher octane fuels [26]. Turbocharging can also make a significant contribution to enhancing engine performance [25] and in conjunction with advanced engine mapping, more efficient compression ratios and advanced automotive technologies, the problem of turbo lag can be almost entirely eliminated and engine response improved.
From Table 1, it can be seen that some variables assigned to the turbocharging sub-model were considered to be exogenous and others were excluded from the model. Whilst costs and user behaviour are important factors they were excluded as they were considered to be outside the scope of this work. From Figure 1 it can be seen that connections between variables are indicated by arrows, the direction of the arrow indicating the causal flow. On the input side the use of waste energy from the engine exhaust gas is used to drive the turbocharger and high octane fuels are used to eliminate combustion knock. Plus (+) signs have been added to the outputs to indicate that a reinforcing causal relationship exists such that if one variable increases or decreases the same behaviour would be seen in the other, e.g., the effect of turbocharging will positively improve engine performance and fuel economy.
4.2.2. Engine Downsizing
The key variables for the engine downsizing sub-model are shown in Figure 2, these being chosen as a direct result of the findings of the literature review, a full list of references are provided in Table 1. Research confirms that engine downsizing is an important strategy in the drive to reduce fuel consumption [8] and GHG emissions and is primarily achieved by a reduction in engine displacement volume and the fitment of a turbocharger, which provides high density air to the combustion chambers, thus increasing torque, power density [23] and engine efficiency [26]. Jo, et al [8] state ‘Downsizing along with turbocharging also increases efficiency by changing the engines’ operating regions to where pumping, friction and heat transfer losses are relatively low’ (p.1). The reduction in the mass of the engine also contributes to vehicle lightweighting and the enhancement of fuel economy [29]. The emissions regulations variable is also included as such regulations are the main driver for the introduction of emission reduction strategies. Cost factors were excluded from the model as firstly they were, as with the turbocharging sub-model, considered to be outside the scope of the work. Additionally, research by Ward, et al, [27] concludes that cost savings are relatively small for ICE powered vehicles. Distance travelled is a key factor in engine life, however, this was also excluded from the sub-model as the increase in environmental impact due to engine wear is unlikely to be large. Downsizing and pressure boosting tends to stress the engine beyond the limits seen in classical design [28]. The importance of coatings for engine parts and in design pairing of low viscosity motor oils with the engine characteristics to reduce engine component wear and provide improvements in fuel economy as discussed by Lee, et al, [28] were initially considered but ultimately excluded due to the relatively small fuel consumption gains arising. Connections between the variables are, as with the turbocharging sub-model, represented by arrows showing the direction of flow. Plus (+) signs have been added to the outputs to indicate the reinforcing causal relationships.
4.2.3. Bioethanol
The key variables for the bioethanol sub-model were established from the extensive literature review and are shown in Figure 3, with a full list of references provided in Table 1. Three inputs and four outputs were identified. Alimin, et al, [36] observe that ‘policies to reduce emissions and conserve energy are the primary motivators for engine modifications and fuel science’ (p.1). In the case of this paper, the fuel science being confined to bioethanol derived from feedstocks such as corn. Biofuels can have a positive effect on climate change as the feedstock removes CO2 from the atmosphere whilst the crop is growing. The type of feedstock used to produce the biofuel influences its effect on climate change due to the impact of nitrous oxide (N2O) emissions from the fertilizer used to grow the crop [34]. N2O has a global warming potential (GWP) factor of 298 compared to 1 for CO2. Puricelli, et al, [35] comment that ‘biofuels can be a promising alternative to fossil fuels, provided they are produced from advanced feedstocks. In particular, feedstocks that lead to land use change should be avoided’ (p.15). Most research concludes that the use of bioethanol can lead to reductions in tailpipe GHG emissions, for example, research by Milovanoff, et al [30] states that ‘replacing conventional gasoline with mid-level ethanol blends (15–30% ethanol by volume) can reduce fossil fuel use and GHG emissions’ (p.1). Work by Kroyan, et al, [32] showed that the use of an E22 blend (22% of ethanol by volume) reduced the CO2 emissions in their specific model by 1% despite an increase in fuel consumption of 7.76%. Ethanol has a higher research octane number (RON) and (latent) heat of vaporisation than petrol, the latter giving rise to a cooling effect in the engine, thus, enhancing knock resistance [26,31]. The potential of bioethanol to control engine knock means that it has been widely adopted in downsized, high compression, turbocharged engines. Work by Obeid, et al, studied engine brake power vs. relative air-fuel ratio and concluded that it was possible, using E20 fuel, to operate the turbocharged engine tested in their research at the full load using a lambda value of 0.98 without any engine knock. To obtain the same power from E0 (petrol only) required a lambda value of 0.91. The knock resistance properties of bioethanol being attributed to the fuels superior combustion properties.
A number of factors were excluded from the bioethanol model as listed in Table 1. Whilst all of these factors are important they were considered to be outside the scope of the present work. From Figure 3 it can be seen that renewable fuel policy drives the amount of feedstock and resultant conversion, which in turn has a reinforcing causal relationship with renewable fuel. Simply put, if policy dictates an increase in renewable fuel, then there will be an increase in feedstock and conversion leading to an increased quantity of renewable fuel. There are four outputs each of which has a reinforcing causal relationship with bioethanol.
4.2.4. Vehicle Lightweighting
The key variables for the vehicle lightweighting sub-model were derived from the literature review and comprise of two inputs and three outputs as shown in Figure 4. Vehicle lightweighting is a key strategy for improving fuel consumption and reducing GHG emissions [2,27,37,39,40]. According to Joost, as cited by Ward, et al [27] for an ICE powered vehicle a 7% increase in fuel economy is achievable for a 10% reduction in weight. Additionally, life cycle assessment (LCA) results from work by Raugei, et al, [38] suggest that reductions in environmental impact of approximately 7% are possible in most lifecycle impact categories, hence, further strengthening the case for vehicle lightweighting. Primary lightweighting is concerned with reducing weight from the body in white/chassis, whereas, secondary lightweighting is achieved through engine downsizing and the use of lighter components in the powertrain, suspension and other vehicle sub-assemblies. Engine downsizing is important as it is an effective strategy for improving fuel economy and also contributes to the total secondary mass reductions. Lewis, et al [5] conducted evaluations of life cycle energy and GHG emissions of baseline and lightweight internal combustion engine vehicles (ICEV), hybrid electric vehicles (HEV) and plug in hybrid electric vehicles (PHEV) with aluminium and aluminium/high strength steel, using a range of scenarios.
The results showed that, with the inclusion of secondary mass reductions, lightweight vehicles are 16% lighter than baseline vehicles, and that 35 – 41% of the reduction was due to secondary mass reduction. Similarly, work by Lewis, et al, [4] reveals that by combining vehicle lightweighting techniques with a high efficiency petrol engine (i.e. downsized and boosted) in the same platform, more reductions in GHG emissions and life cycle energy can be achieved. In their work they showed that a naturally aspirated ICE combined with a body in white subject to a 35% mass reduction provided a 7% reduction in life cycle impact and that a high efficiency petrol engine combined with a body in white that had no mass reduction provided a 22% reduction in life cycle impact. By contrast, a high efficiency petrol engine combined with a body in white subject to a 35% mass reduction provided a 27% reduction in life cycle impact. They attributed the decrease in life cycle impacts entirely to a reduction in fuel consumption.
Fuel consumption is powerfully influenced by vehicle weight [6] and according to Koffler, et al, cited by Del Pero, et al, [6] about one third of an ICE vehicles’ total fuel consumption directly depends on its weight. Vehicle dynamic performance has been included in the model as this is enhanced by lightweighting, especially by secondary reductions to unsprung components, which have a positive effect on the dynamics, manoeuvrability and stability [40]. As with the other sub-models, some factors were excluded as they were considered to be outside the scope of the study. These being, the extraction of raw materials, manufacturing, end of life recycling, technological change, materials selection and cost. As can be seen from Figure 4, arrows show connections and indicate the direction of flow. Plus (+) signs have been added to the outputs to show their reinforcing causal relationship with vehicle lightweighting. The full list of references relating to this sub-model are provided in Table 1.
4.3. Simulation Model Formulation
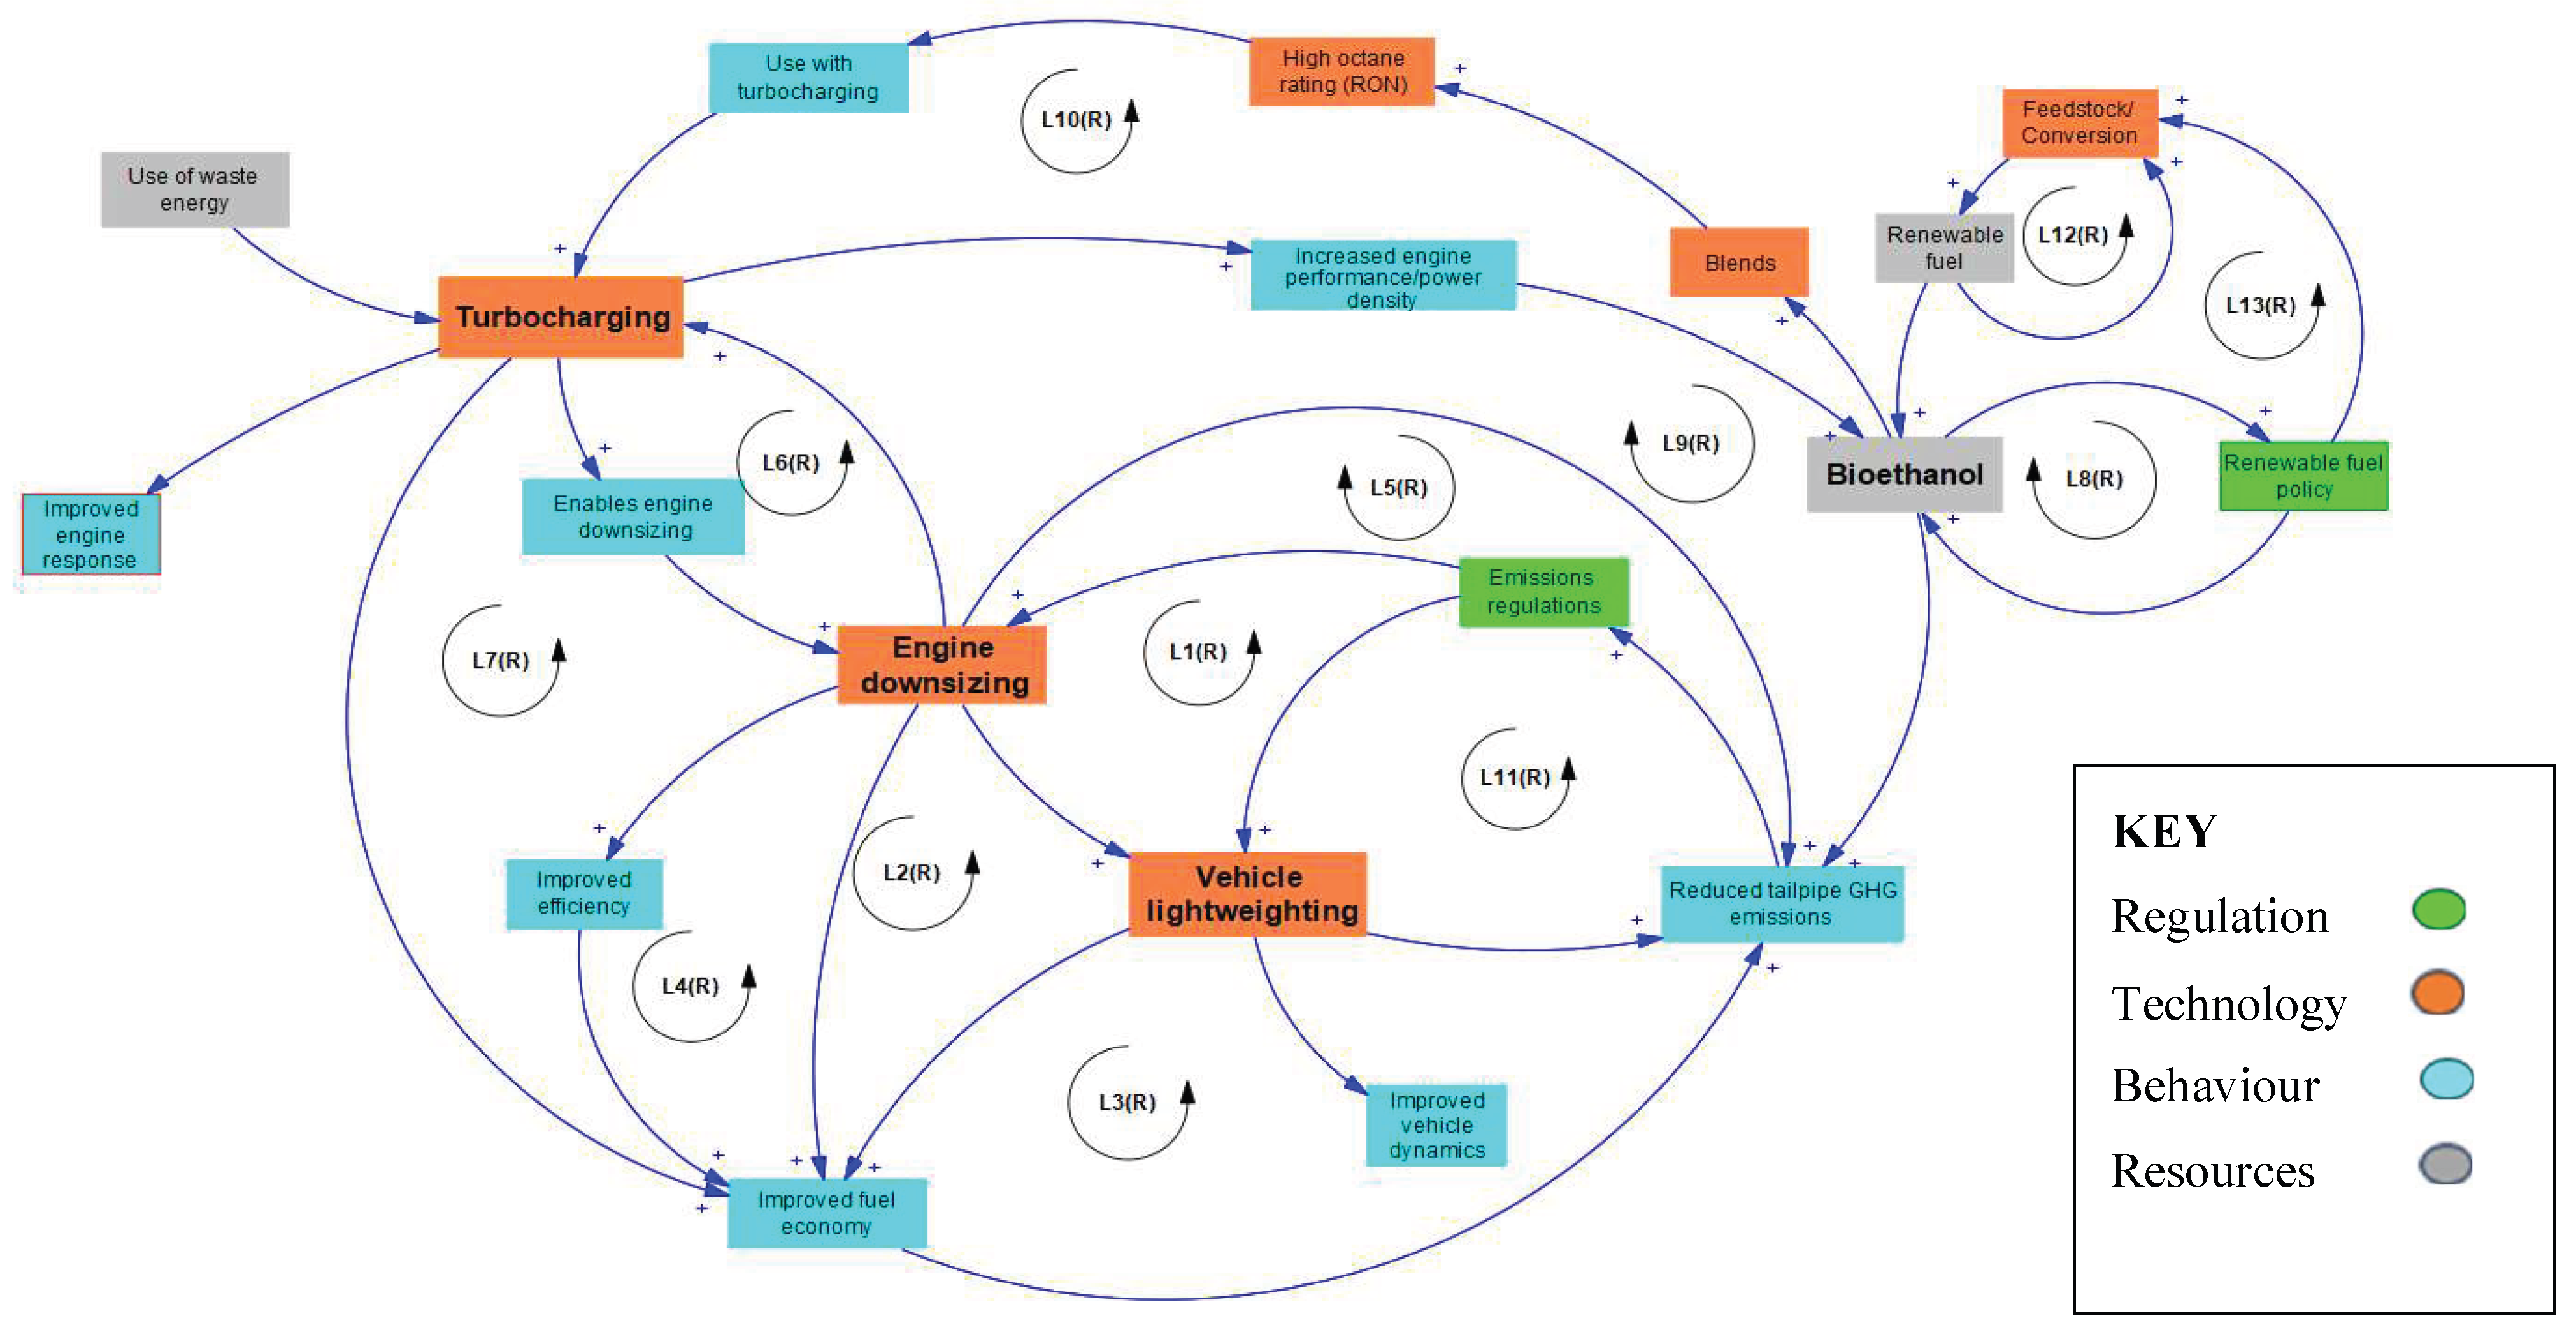
The CLD in Figure 5 illustrates the causal loops and causality chains that exist within the whole system. The loops are assigned identification letters and numbers and the reinforcing characteristics of the loops are indicated by the letter ‘R’. No ‘balancing’ loops were identified. To aid clarity the respective causality chains are presented in Table 2. Each sub-system and variable was also assigned to a category as shown in Table 4. The categories being colour coded as shown in the key inside Figure 5. The ‘blends’ variable was assigned to the technology category as creation of fuel blends is the result of the application of scientific knowledge. Blends are engineered and may become a resource due to technology, hence, in the current work they were assigned using this reasoning. Similarly, this thinking was also applied to high octane rating (RON) fuels. The ‘renewable fuel policy’ variable was assigned to the regulation category as many countries have policies that require fuel suppliers to supply a given percentage of renewable fuel to the market as in the United Kingdom, or which requires petrol to contain a minimum volume of renewable fuel as in America. In Europe, the Renewable Energy Directive [41] places a binding target on the share of renewable energy in the total EU energy consumption by 2030. Section 4.4.3 explores the distribution of the different categories within the individual causal loops within the whole system model.
Figure 5.
Complete causal diagram for the whole system.
4.4. Model Testing
The model testing phase required asking questions of the model. For the loops identified the behaviour is outlined in Table 2. We need to understand how the loops interact and whether the requirement is to drive positive feedback loops to reinforce them or whether combinations are necessary. For example, the reinforcement of L1 would be negated if the L11 was not also concurrently reinforced as a downsized engine in an existing vehicle frame would potentially increase emissions. The following sections therefore explore the functioning/driving of each loop, the dependencies and the strength of the relationship with technology, policy, resources and behaviour. The ambition is to develop a clear understanding of the system with the purpose of identifying the parts of the system where intervention would be productive.
4.4.1. the Causal Loops
As stated in section 2, when interpreting the causal loops it is important to appreciate how the system of interest fits in the broader context of its environment and how the virtual model informs the design and implementation of solutions in the real world. In reality, the virtual model informs the real world and drives physical changes, which themselves can then be fed back into the virtual model to stimulate further improvements. In the present work the descriptions of each loop, as given below, should be considered in the context the United Nations sustainable development goals (SDG), which are external to the system but are the overarching driver for the reduction of harmful tailpipe GHG emissions and which have a direct impact on the behaviour of the system through the emissions regulations and renewable fuel policy. In order to provide further context and to illustrate how the loops relate to society and the current environment, examples are included in some of the explanations thus demonstrating the potential behaviour of the particular loop.
- Causal loop L1 illustrates how, driven by the need to comply with stricter emissions regulations, engine downsizing acts with vehicle lightweighting to produce an increased reduction in tailpipe GHG emissions. The loop is considered to be reinforcing as the combination of strategies has a positive effect on reducing tailpipe GHG emissions. Similarly, if there were a reduction in the requirements of the emissions regulations or less emphasis on engine downsizing, vehicle lightweighting or a combination of any of these, there would be a negative effect on the reduction of tailpipe GHG emissions. Simply stated if the cause increases the effect increases and vice versa.
- Causal loop L2 shows the reinforcing causal relationships between engine downsizing, fuel economy, tailpipe GHG emissions and emissions regulations. Basically, engine downsizing is a technique for improving fuel economy, and, by association, reduces tailpipe GHG emissions, thus helping to meet emission regulations. Within this loop the engine downsizing and emission regulations variables are significant, if there is a change in either, there would be a commensurate change in the other variables. For example, when the Euro 7 emission standard is implemented in July 2025 for new ICE powered vehicles sold in Europe, there will be a direct impact on the other variables in this loop.
- Causal loop L3 builds on the relationships seen in loop L1, through the inclusion of improved fuel economy, as this is a further causal effect of engine downsizing and vehicle lightweighting. The loop is considered, as with loop L1, to be reinforcing. Improved fuel economy is particularly important in some global markets as, for example, this is a significant strategy to meet American Corporate Average Fuel Economy (CAFE) standards, which are designed to increase fuel economy. The latest requirement being 2% per year for model years 2027-2031 [42].
- Causal loop L4 builds on loop L2 by introducing the ’improved efficiency’ variable, where efficiency is defined as an overarching term covering engine and overall vehicle efficiency. The causal relationships in this loop are considered to be reinforcing.
- Causal loop L5 shows the reinforcing relationship between engine downsizing, reduced tailpipe GHG emissions and the emission regulations.
- Causal loop L6 illustrates the reinforcing relationship between turbocharging and engine downsizing, demonstrating the positive relationship turbocharging has on engine downsizing as a key enabler. In this loop it may be concluded that engine downsizing drives the increase or decrease of the turbocharging variable through the need to meet the UN SDGs. As demand for ICE vehicles increases, predominately in the global south, and authorities in these developing countries adopt more stringent emissions standards the demand for downsized engines will increase with a commensurate rise in demand for turbochargers. This demand extending to HEVs. Whilst forecasts vary most sources predict a rise in the demand for turbochargers, with a peak being reached in, or around, 2027.
- Causal loop L7 shows that in the context of emissions regulations, engine downsizing in combination with turbocharging can lead to improved fuel economy and therefore reduced tailpipe GHG emissions.
- Causal loop L8 illustrates the direct relationship between bioethanol and renewable fuel policy, where the causal relationship is reinforcing because the effect of policy will either result in an increase or decrease in bioethanol quantity. In this loop it can be seen that there is a quite straightforward causal relationship between the two variables, however, the quantity of bioethanol is not only dependent on changes to the renewable fuel policy but is also directly exposed to influences outside of the system. An example of this is the current conflict in Ukraine, which, as one of the main global corn producers has had a significant detrimental impact on global corn supplies.
- Causal loop L9 shows, in response to emission regulations, that engine downsizing in combination with turbocharging and the use of bioethanol can lead to increased engine performance/power density and reduced tailpipe GHG emissions.
- Causal loop L10 illustrates how the causal relationship between bioethanol, blends, bioethanol’s high octane (RON) qualities and suitability for use with turbocharging can lead to increased engine performance/power density.
- Causal loop L11 illustrates the positive causal relationship between the emissions regulations variable, vehicle lightweighting and reduced tailpipe GHG emissions. This is a reinforcing loop as a change in one variable will cause an increase, or decrease, in the other variables.
- Causal loop L12 shows the simple relationship between the feedstock/ conversion and renewable fuel. If there is an increase in feedstock and conversion there will be an increased quantity of renewable fuel and vice versa. As with causal loop L8, the relationship between the variables appears quite straightforward but they are arguably more vulnerable to outside influences than some other variables in the system. Feedstock supplies can be disrupted by conflict or global supply problems and conversion can be affected by land use issues and the competition between food production and liquid renewable fuel, leading to a significant impact on the system.
- Causal loop L13 expands on causal loop L12 by introducing the variables ‘renewable fuel policy’ and ‘bioethanol’, showing how a change in renewable fuel policy will have a reinforcing effect on the other variables in the causal loop.

Table 2.
List of loops and their causality chains in the whole system CLD.
| Loop no | Balancing/reinforcing | Causality chain |
|---|---|---|
| L1 | Reinforcing | Engine downsizing→ vehicle lightweighting→ reduced tailpipe GHG emissions→ emissions regulations→ |
| L2 | Reinforcing | Engine downsizing→ improved fuel economy→ reduced tailpipe GHG emissions→ emissions regulations→ |
| L3 | Reinforcing | Engine downsizing→ vehicle lightweighting→ improved fuel economy→ reduced tailpipe GHG emissions→ emissions regulations→ |
| L4 | Reinforcing | Engine downsizing→ improved efficiency→ improved fuel economy→ reduced tailpipe GHG emissions→ emissions regulations→ |
| L5 | Reinforcing | Engine downsizing→ reduced tailpipe GHG emissions→ emissions regulations→ |
| L6 | Reinforcing | Turbocharging→ enables engine downsizing→ engine downsizing→ |
| L7 | Reinforcing | Turbocharging→ improved fuel economy→ reduced tailpipe GHG emissions→ emissions regulations→ engine downsizing→ |
| L8 | Reinforcing | Bioethanol→ renewable fuel policy |
| L9 | Reinforcing | Bioethanol→ reduced tailpipe GHG emissions→ emissions regulations→ engine downsizing→ turbocharging→ increased engine performance/power density |
| L10 | Reinforcing | Bioethanol→ blends→ high octane rating (RON) → use with turbocharging→ turbocharging→ increased engine performance/power density→ |
| L11 | Reinforcing | Emissions regulations→ Vehicle lightweighting→ reduced tailpipe GHG emissions→ |
| L12 | Reinforcing | Feedstock/ conversion→ renewable fuel→ |
| L13 | Reinforcing | Renewable fuel policy→ feedstock/ conversion→ renewable fuel→ bioethanol→ |
4.4.2. Relative Loop Importance
The relative importance of the strategies was considered by adopting a process similar to the degree centrality method used to determine network centrality [43]. In this method the number of connections to the turbocharging, engine downsizing, bioethanol and vehicle lightweighting reduction strategies/variables were counted to reveal which of these strategies had the most connections and therefore the most importance according to this method. From Table 3 it can be seen that turbocharging and engine downsizing were equally important and were slightly more important than vehicle lightweighting. Regarding the relative importance of the individual causal loops, none was identified as being of more importance than any of the others, rather, they all play a significant role in describing the system and demonstrating the complex relationships between turbocharging, engine downsizing, bioethanol fuel and vehicle lightweighting.
Table 3.
Number of connections to each main sub-model variable.
| Turbocharging | Engine downsizing | Bioethanol | Vehicle lightweighting | |
|---|---|---|---|---|
| Number of connections | 7 | 7 | 6 | 5 |
4.4.3. Assignment of Categories
To facilitate a deeper understanding each strategy/variable was assigned to one of four categories as shown in Table 4. Using the causality chain information from Table 2 for each causal loop it can be seen that variables from the technology category are present in each loop and that variables from the regulations category feature in all loops except loop L8. In loops L1, L6 and L10 the technology category is dominant whereas in loop L2 variables from the behaviour category dominate. In loops L3, L7 and L9 the technology and behaviour categories are of equal importance, however, in loop L4 the behaviour category is dominant. In loops L5 and L11 there is no dominant category. Loop L8 shows that the resource and regulation categories are of equal importance. Loop L12 shows that the technology and resources categories are of equal importance, whereas in loop L13 the resources category dominates.
Table 4.
Assignment of sub-model and variables to categories.
| Regulation | Technology | Behaviour | Resources |
|---|---|---|---|
| Emissions regulations | Turbocharging | Improved engine response | Use of waste energy |
| Renewable fuel policy | Vehicle lightweighting | Increased engine performance/power density | High octane fuel |
| Feedstock/ conversion | Improved fuel economy | Renewable fuel | |
| Blends | Improved efficiency | Bioethanol | |
| Engine downsizing | Reduced tailpipe GHG emissions | ||
| High octane rating (RON) | Improved vehicle dynamics | ||
| Use with turbocharging | |||
| Enables engine downsizing |
4.4.4. Comparative Frequency
Comparative frequencies (occurrences) were derived for each of the categories listed in table 4, based on the number of times variables belonging to each category occurred in the thirteen loops shown in figure 5, the results of which are provided in table 5. It was noted that the technology category had the largest number of occurrences followed by the behaviour, regulations and resources categories. This order of the categories is expected as changes in technology would mostly result in a positive behavioural change, and, similarly, the impact of regulatory changes would result in a similar outcome. For example in causal loop L4 a change in the emissions regulations may trigger a change in engine downsizing activity that in turn improves efficiency and fuel economy leading to a reduction in tailpipe gaseous emissions. From the technology category the ‘engine downsizing’ variable was seen to be most significant as it appeared in eight of the loops. Similarly, the ‘emissions regulations’ variable from the regulations category and the ‘reduced tailpipe GHG emissions’ variable also featured in 8 loops. The behaviour category contained the largest number of variables although some of these were not included in any of the loops.
Table 5.
Number of occurrences in each category.
| Number of occurrences | |
|---|---|
| Technology | 19 |
| Behaviour | 17 |
| Regulation | 10 |
| Resources | 6 |
5. Discussion
In this work we applied a systems thinking approach and created a full CLD (Figure 5) to visualise the system of interest. To our knowledge this is a novel approach that has not previously been undertaken and therefore this work is a first step in the exploration of this complex system and brings a new dimension to aid understanding of the interactions between the chosen variables as well as offering a methodology that may be replicated with other similar systems. Through the full system CLD we are able to understand the important elements of the system and how tailpipe GHG emissions can be affected by them and how changes to variables will impact the system in general, thus, informing how the different relationships might be positively exploited. For example, the full system causal diagram shown in Figure 5, supported by the literature, reveals how engine downsizing and vehicle lightweighting can deliver improved fuel economy and reduced tailpipe GHG emissions in response to the requirements of the emissions regulations (loop L3). Unsurprisingly, in response to emissions regulations if turbocharging is coupled with engine downsizing and the use of bioethanol (loop L9) we see that an increase in engine performance and power density plus a reduction in tailpipe GHG emissions is also possible. It follows therefore that it could be advantageous to combine all or some of these variables to deliver further tailpipe GHG emissions reductions, thus bringing the benefits of reduced tailpipe GHG emissions, improved fuel economy and enhanced engine performance together.
The advantage of being able to see a visual representation of the system is that links that may not have been obvious can be identified, and links that were thought to exist and didn’t can be exposed. For example, in the CLD shown in Figure 5, it can be seen that bioethanol has a direct link to the reduction of tailpipe GHG emissions, which may not have been obvious. Indeed, from the CLD it is possible to see that bioethanol is linked to other variables and as an octane enhancer has the ability to control engine knock in turbocharged engines. Time delays have deliberately not been included in the CLD as it could be argued that there will always be some delay in cases of cause and effect. An example being the delay that may occur from the change in emissions regulations before the effect on the related variables is visible. In reality, manufacturers will make changes well in advance of dates that are mandated by regulations and the linked legislation, as is the case in the transition to HEVs where many manufacturers have plans to transition their vehicle ranges to HEV only, in advance of the date set for the cessation of the sale of new ICE powered vehicles.
In the previous sections of this paper the factual interpretations pertaining to the sub and whole system models and the individual causal loops have been presented. In addition, the relative importance of each of the main strategies/variables was considered and comparative frequencies were calculated. This being an alternative approach to the adoption of adjacency matrices as proposed by Beck, et al [44]. These sections provide valuable information and offer insight into the areas of the system where significant leverage points exist. According to Meadows [45] , ‘leverage points are places in a complex system where a small shift in one thing can produce big changes in everything’ (p.1), however, determining leverage points is not an intuitive process and rigorous analysis of the system is required.
The research presented in this paper established that the engine downsizing and regulations variables are of particular significance. This suggests that optimisation of downsized engines is a prime leverage point for intervention and exploitation, perhaps through the adoption of technologies such as mild hybrid battery assist systems, high efficiency turbochargers, improved turbocharger matching or Atkinson cycle operation, or a combination of some or all. It is clear that the emissions regulations are also a leverage point where significant change in the system can be asserted. However, whilst this might be an obvious point for intervention, care must be taken to ensure that the system changes are driven in the correct direction to achieve the desired effect. Meadows [45] states that positive (reinforcing) feedback loops ‘are sources of growth, explosion, erosion, and collapse in systems’ (p.11) and suggests that control must involve slowing down the positive feedbacks. An alternative approach arising from this research, is to seek gains through the use of combinations and consideration of the interrelationships between the loops. For example, if a regulation or policy change causes a change in one loop but this is not considered in neighbouring loops or elsewhere in the system the maximum benefit of the intervention may not be reaped. In the example given in section 4.4 the reinforcement of loop L1 would be negated if the loop L11 was not also concurrently reinforced as a downsized engine in an existing vehicle platform may potentially increase tailpipe GHG emissions. Similarly, it can be seen in loop L9 that in response to emissions regulations the tailpipe GHG emissions can be reduced by the use of bioethanol in conjunction with engine downsizing and turbocharging whilst providing increased engine performance/power density. However, the full benefit of any system change, in this case due to regulations, may not be realised if the changes are not applied to the other loops in the system. In this example if a change was produced in the vehicle lightweighting loop L3, then it is likely that the overall gains would be greater. So, in order to realise maximum benefit, intervention at one point is insufficient.
There are many constraints that influence the adoption of technologies and which may contribute to the reason some desirable changes are not made. Using the two preceding examples it could be that a vehicle lightweighting is not adopted because of considerations around manufacturing cost and the target retail price of the product. This illustrates that some of the causal loops in the system are working relatively well, e.g., engine downsizing, which has assisted the development of larger vehicles with smaller capacity ICEs, combined with lower fuel consumption and tailpipe emissions when compared to older vehicles of equivalent size, especially as vehicle mass has been increasing. However, it could be argued that this has created a rebound effect where many consumers are now choosing larger, heavier vehicles, especially sport utility models, and, as a result, the composition of the vehicle fleet is now made up of larger vehicles, rather than smaller ones, thus arguably driving the system the wrong way. There are also loops within the system that do not appear to be working as well as they might. Research by the Global Fuel Economy Initiative [46] identifies that specific fuel consumption can vary significantly depending on the technology applied. This implies that there is scope to gain improvements in the loops that have connections to the ‘improved fuel economy’ variable in the system.
This research has allowed us to create a comprehensive CLD, which has revealed the breadth and complexity of the system and which also allows the identification of system vulnerability. An example of this vulnerability can be seen in loop L12 and the relationship between feedstock/ conversion and renewable fuel. If there was a reduction in the feedstock/ conversion possibly as a result from an influence outside the system, a commensurate reduction in renewable fuel would result causing significant disruption to the system. As previously stated, this work represents a first step in understanding the system at the centre of this research and whilst the work does not offer particular solutions, important factors have been identified that could form the basis for further investigation.
6. Conclusions and Future Research
The purpose of this research was to identify the relationships that could be leveraged to provide reductions in tailpipe GHG emissions whilst considering the challenges of cost. To achieve this objective a system thinking approach was employed and a CLD was created to represent the whole system revealing the causality chains and relationships in the context of the GHG emissions reference mode. The relationships between turbocharging, engine downsizing, bioethanol fuel and vehicle lightweighting were exposed and the paths of causal interaction with policy were also explored. Whilst accepting that qualitative models have limitations due to the difficulty of being able to fully investigate the behaviour that emerges without numerical data, the research has successfully validated the hypothesis. The research has revealed the reinforcing behaviour of the individual causal loops and the pivotal influence of the engine downsizing and emissions regulations variables, whilst providing an ordered visual representation of the system. Moreover, the findings concur with those of Lewis, et al [4] who concluded that advanced downsized/boosted engines (with gasoline or ethanol) and lightweight materials provide complimentary benefits. The work has shown that some causal loops are functioning well and are strong whereas others are working less well and are relatively weak. The effect of this is to restrict achievement of the goal to accelerate reductions in tailpipe GHG emissions in the global fleet. In order to achieve this goal the weak loops will have to be strengthened.
This work has shown that a systems thinking approach can be successfully applied to represent this type of complex system and is a viable methodology that can be adopted by other researchers wishing to explore similar systems. Also, that CLDs are a powerful tool for mapping the feedback structures of such systems [17] and qualitive data has an important role to play in the pursuit of finding solutions to reduce vehicle gaseous tailpipe emissions.
Notwithstanding Sterman’s statement that causal diagrams can never be comprehensive or final, rather, they are always provisional, [17] one recommendation is made for the future direction of this research. There could be value in adopting the use of Participatory Systems Mapping (PSM) to garner the collective input from a variety of stakeholders in order to deepen understanding of the system and possibly identify additional causality chains of importance.
Funding
This research received no external funding.
Data Availability Statement
All data used in this work is publicly available and can be accessed from the respective links provided in the reference section below.
Conflicts of Interest
The authors declare no conflict of interest.
Abbreviations
| Acronym/Abbreviation | Definition |
| BEV | Battery Electric Vehicle |
| CO2 | Carbon Dioxide |
| CLD | Causal Loop Diagram |
| GHG | Greenhouse Gas |
| HEV | Hybrid Electric Vehicle |
| ICE | Internal Combustion Engine |
| ICEV | Internal Combustion Engine Vehicle |
| IP | Intellectual Property |
| LCA | Life Cycle Assessment |
| LDV | Light Duty Vehicle |
| NOx | Nitrogen Oxides |
| N2O | Nitrous Oxide |
| PHEV | Plug In Hybrid Vehicle |
| PSM | Participatory Systems Mapping |
| RON | Research Octane Number |
| SD | System Dynamics |
| SDG | Sustainable Development Goals |
| SI | Spark-Ignition |
References
- Boiral O, Brotherton MC, Yuriev A, Talbot D. Through the Smokescreen of the Dieselgate Disclosure: Neutralizing the Impacts of a Major Sustainability Scandal. Organ Environ. 2022 Jun 1;35[2]:175–201. [CrossRef]
- Leach F, Kalghatgi G, Stone R, Miles P. The scope for improving the efficiency and environmental impact of internal combustion engines. Vol. 1, Transportation Engineering. Elsevier Ltd; 2020.
- Energy Information Administration U. International Energy Outlook 2019 [Internet]. 2019 [cited 2023 Oct 29]. Available from: https://www.eia.gov/outlooks/ieo/pdf/ieo2019.pdf.
- Lewis AM, Keoleian G, Kelly J. The potential of lightweight materials and advanced combustion engines to reduce life cycle energy and greenhouse gas emissions. In: SAE Technical Papers. SAE International; 2014.
- Lewis AM, Kelly JC, Keoleian GA. Vehicle lightweighting vs. electrification: Life cycle energy and GHG emissions results for diverse powertrain vehicles. Appl Energy. 2014 Aug 1;126:13–20. [CrossRef]
- Del Pero F, Delogu M, Pierini M. The effect of lightweighting in automotive LCA perspective: Estimation of mass-induced fuel consumption reduction for gasoline turbocharged vehicles. J Clean Prod. 2017 Jun 15;154:566–77. [CrossRef]
- Obeid Z, Cernat A, Pana C, Negurescu N. Aspects of the bioethanol use at the turbocharged spark ignition engine. Thermal Science. 2015;19(6):1959–66. [CrossRef]
- Jo YS, Bromberg L, Heywood J. Optimal Use of Ethanol in Dual Fuel Applications: Effects of Engine Downsizing, Spark Retard, and Compression Ratio on Fuel Economy. SAE Int J Engines. 2016 Apr 5;9(2):1087–101. [CrossRef]
- Randle JM, Stroink ML. The Development and Initial Validation of the Paradigm of Systems Thinking. Syst Res Behav Sci. 2018 Nov 1;35(6):645–57. [CrossRef]
- Arnold RD, Wade JP. A definition of systems thinking: A systems approach. In: Procedia Computer Science. Elsevier; 2015. p. 669–78.
- Amissah M, Gannon T, Monat J. What is systems thinking? Expert perspectives from the WPI systems thinking colloquium of 2 October 2019. Systems. 2020;8(1):1–26. [CrossRef]
- Manuele FA. SYSTEMS/MACRO THINKING A Primer What Is Systems Thinking? Vol. 37, PROFESSIONAL SAFETY PSJ. 2019.
- Menon BG, Mahanty B. Effects of fuel efficiency improvements in personal transportation: Case of four-wheelers in India. International Journal of Energy Sector Management. 2012 Sep;6(3):397–416. [CrossRef]
- Tsaple V, Tzionas P. Qualitative System Dynamics models to assess the effect of MOOCs on the system of tertiary education. Journal of Contemporary Education, Theory & Research [Internet]. 2019;3(1):3–8. [CrossRef]
- Suryani E, Hendrawan RA, Adipraja PFE, Widodo B, Rahmawati UE, Chou SY. Dynamic scenario to mitigate carbon emissions of transportation system: A system thinking approach. In: Procedia Computer Science. Elsevier B.V.; 2021. p. 635–41.
- Aikenhead G, Farahbakhsh K, Halbe J, Adamowski J. Application of process mapping and causal loop diagramming to enhance engagement in pollution prevention in small to medium size enterprises: Case study of a dairy processing facility. J Clean Prod. 2015 Sep 1;102:275–84. [CrossRef]
- Sterman John. Business dynamics : systems thinking and modeling for a complex world. Irwin/McGraw-Hill; 2000. 982 p.
- Sterman JD. System Dynamics Modeling: TOOLS FOR LEARNING IN A COMPLEX WORLD. Vol. 43, California CMR. 2001.
- Kim S, Connerton TP, Park C. Exploring the impact of technological disruptions in the automotive retail: A futures studies and systems thinking approach based on causal layered analysis and causal loop diagram. Technol Forecast Soc Change. 2021 Nov 1;172.
- Melão N, Pidd M. A conceptual framework for understanding business processes and business process modelling. Information Systems Journal. 2000;10(2):105–29. [CrossRef]
- Rahman A, Richards R, Dargusch P, Wadley D. Pathways to reduce Indonesia’s dependence on oil and achieve longer-term decarbonization. Renew Energy. 2023 Jan 1;202:1305–23. [CrossRef]
- Brinkert N, Sumser S, Schulz A, Weber S, Fieweger K, Bauer HJ. Understanding the Twin Scroll Turbine: Flow Similarity. 2011.
- Yang M, Martinez-Botas R, Rajoo S, Yokoyama T, Ibaraki S. An investigation of volute cross-sectional shape on turbocharger turbine under pulsating conditions in internal combustion engine. Energy Convers Manag. 2015 Aug 11;105:167–77. [CrossRef]
- Meghnine MA, Hamidou MK, Hamel M. Influence of the volute cross-sectional shape on mixed inflow turbine performances. Advances in Mechanical Engineering. 2017 Jul 1;9(7). [CrossRef]
- Chen S, Ma C, Zhang H, Xu C, Lei F, Feng T, et al. Engine performance improvements through turbocharger matching and turbine design. Energy Sci Eng. 2022 Sep 1;10(9):3384–96. [CrossRef]
- Nguyen DK, Van Craeynest T, Pillu T, Coulier J, Verhelst S. Downsizing Potential of Methanol Fueled DISI Engine with Variable Valve Timing and Boost Control. In: SAE Technical Papers. SAE International; 2018.
- Ward J, Gohlke D, Nealer R. The Importance of Powertrain Downsizing in a Benefit–Cost Analysis of Vehicle Lightweighting. JOM. 2017 Jun 1;69(6):1065–70. [CrossRef]
- Lee P, Zhmud B. Low friction powertrains: Current advances in lubricants and coatings. Lubricants. 2021 Aug 1;9(8). [CrossRef]
- Namar MM, Jahanian O, Shafaghat R, Nikzadfar K. Engine Downsizing; Global Approach to Reduce Emissions: A World-Wide Review. Vol. 2, HighTech and Innovation Journal. Ital Publication; 2021. p. 384–99.
- Milovanoff A, Posen ID, Saville BA, MacLean HL. Well-to-wheel greenhouse gas implications of mid-level ethanol blend deployment in Canada’s light-duty fleet. Renewable and Sustainable Energy Reviews. 2020 Oct 1;131. [CrossRef]
- Puricelli S, Casadei S, Bellin T, Cernuschi S, Faedo D, Lonati G, et al. The effects of innovative blends of petrol with renewable fuels on the exhaust emissions of a GDI Euro 6d-TEMP car. Fuel. 2021 Jun 15;294. [CrossRef]
- Kroyan Y, Wojcieszyk M, Larmi M, Kaario O, Zenger K. Modeling the Impact of Alternative Fuel Properties on Light Vehicle Engine Performance and Greenhouse Gases Emissions. In: SAE Technical Papers. SAE International; 2019.
- Pereira LG, Cavalett O, Bonomi A, Zhang Y, Warner E, Chum HL. Comparison of biofuel life-cycle GHG emissions assessment tools: The case studies of ethanol produced from sugarcane, corn, and wheat. Vol. 110, Renewable and Sustainable Energy Reviews. Elsevier Ltd; 2019. p. 1–12.
- Messagie M, Boureima FS, Coosemans T, Macharis C, Mierlo J Van. A range-based vehicle life cycle assessment incorporating variability in the environmental assessment of different vehicle technologies and fuels. Energies (Basel). 2014;7(3):1467–82. [CrossRef]
- Puricelli S, Cardellini G, Casadei S, Faedo D, van den Oever AEM, Grosso M. A review on biofuels for light-duty vehicles in Europe. Vol. 137, Renewable and Sustainable Energy Reviews. Elsevier Ltd; 2021.
- Alimin AJ, Babalola OK. A review on the performance of non-additive blended fuel (ethanol-gasoline) in spark ignition engines. IOP Conf Ser Earth Environ Sci. 2023 Dec 1;1281(1):012002. [CrossRef]
- Luk JM, Kim HC, De Kleine RD, Wallington TJ, MacLean HL. Greenhouse gas emission benefits of vehicle lightweighting: Monte Carlo probabalistic analysis of the multi material lightweight vehicle glider. Transp Res D Transp Environ. 2018 Jul 1;62:1–10. [CrossRef]
- Raugei M, Morrey D, Hutchinson A, Winfield P. A coherent life cycle assessment of a range of lightweighting strategies for compact vehicles. J Clean Prod. 2015 Dec 1;108:1168–76. [CrossRef]
- Monteiro H, Alonso R, Gonçalves M, Iten M, Caetano NS. Life cycle energy of vehicles on lightweighting and alternative powertrain strategies—A review. Energy Reports. 2022 Jun 1;8:241–7. [CrossRef]
- Kastanos VS, Andreev PY, Gorodnov DA, Chabunin IS. On the impact of unsprung weight of mobile vehicles. In: IOP Conference Series: Materials Science and Engineering. Institute of Physics Publishing; 2020.
- Directive - EU - 2023/2413 - EN - Renewable Energy Directive - EUR-Lex [Internet]. [cited 2024 Jul 20]. Available from: https://eur-lex.europa.eu/eli/dir/2023/2413/oj.
- Nhtsa. Corporate Average Fuel Economy Standards for Passenger Cars and Light Trucks for Model Years 2027 and Beyond and Fuel Efficiency Standards for Heavy-Duty Pickup [Internet]. Available from: https://www.federalregister.gov.
- Vignery K, Laurier W. A methodology and theoretical taxonomy for centrality measures: What are the best centrality indicators for student networks? PLoS One. 2020 Dec 1;15(12 December).
- Beck M, Schoenenberger L, Schenker-Wicki A. UZH Business Working Paper Series How managers can deal with complex issues: a semi-quantitative analysis method of causal loop diagrams based on matrices [Internet]. 2012. Available from: http://ssrn.com/abstract=2573718Electroniccopyavailableat:http://ssrn.com/abstract=1951875http://www.business.uzh.ch/forschung/wps.htmlElectroniccopyavailableat:https://ssrn.com/abstract=2573718.
- Meadows D. Leverage Points Places to Intervene in a System [Internet]. [cited 2024 Aug 30]. Available from: https://www.donellameadows.org/wp-content/userfiles/Leverage_Points.pdf.
- Cazzola P, Paoli L, Teter J. gfei-trends-in-the-global-vehicle-fleet-2023-spreads.
Figure 1.
Causal diagram sub-model for Turbocharging.
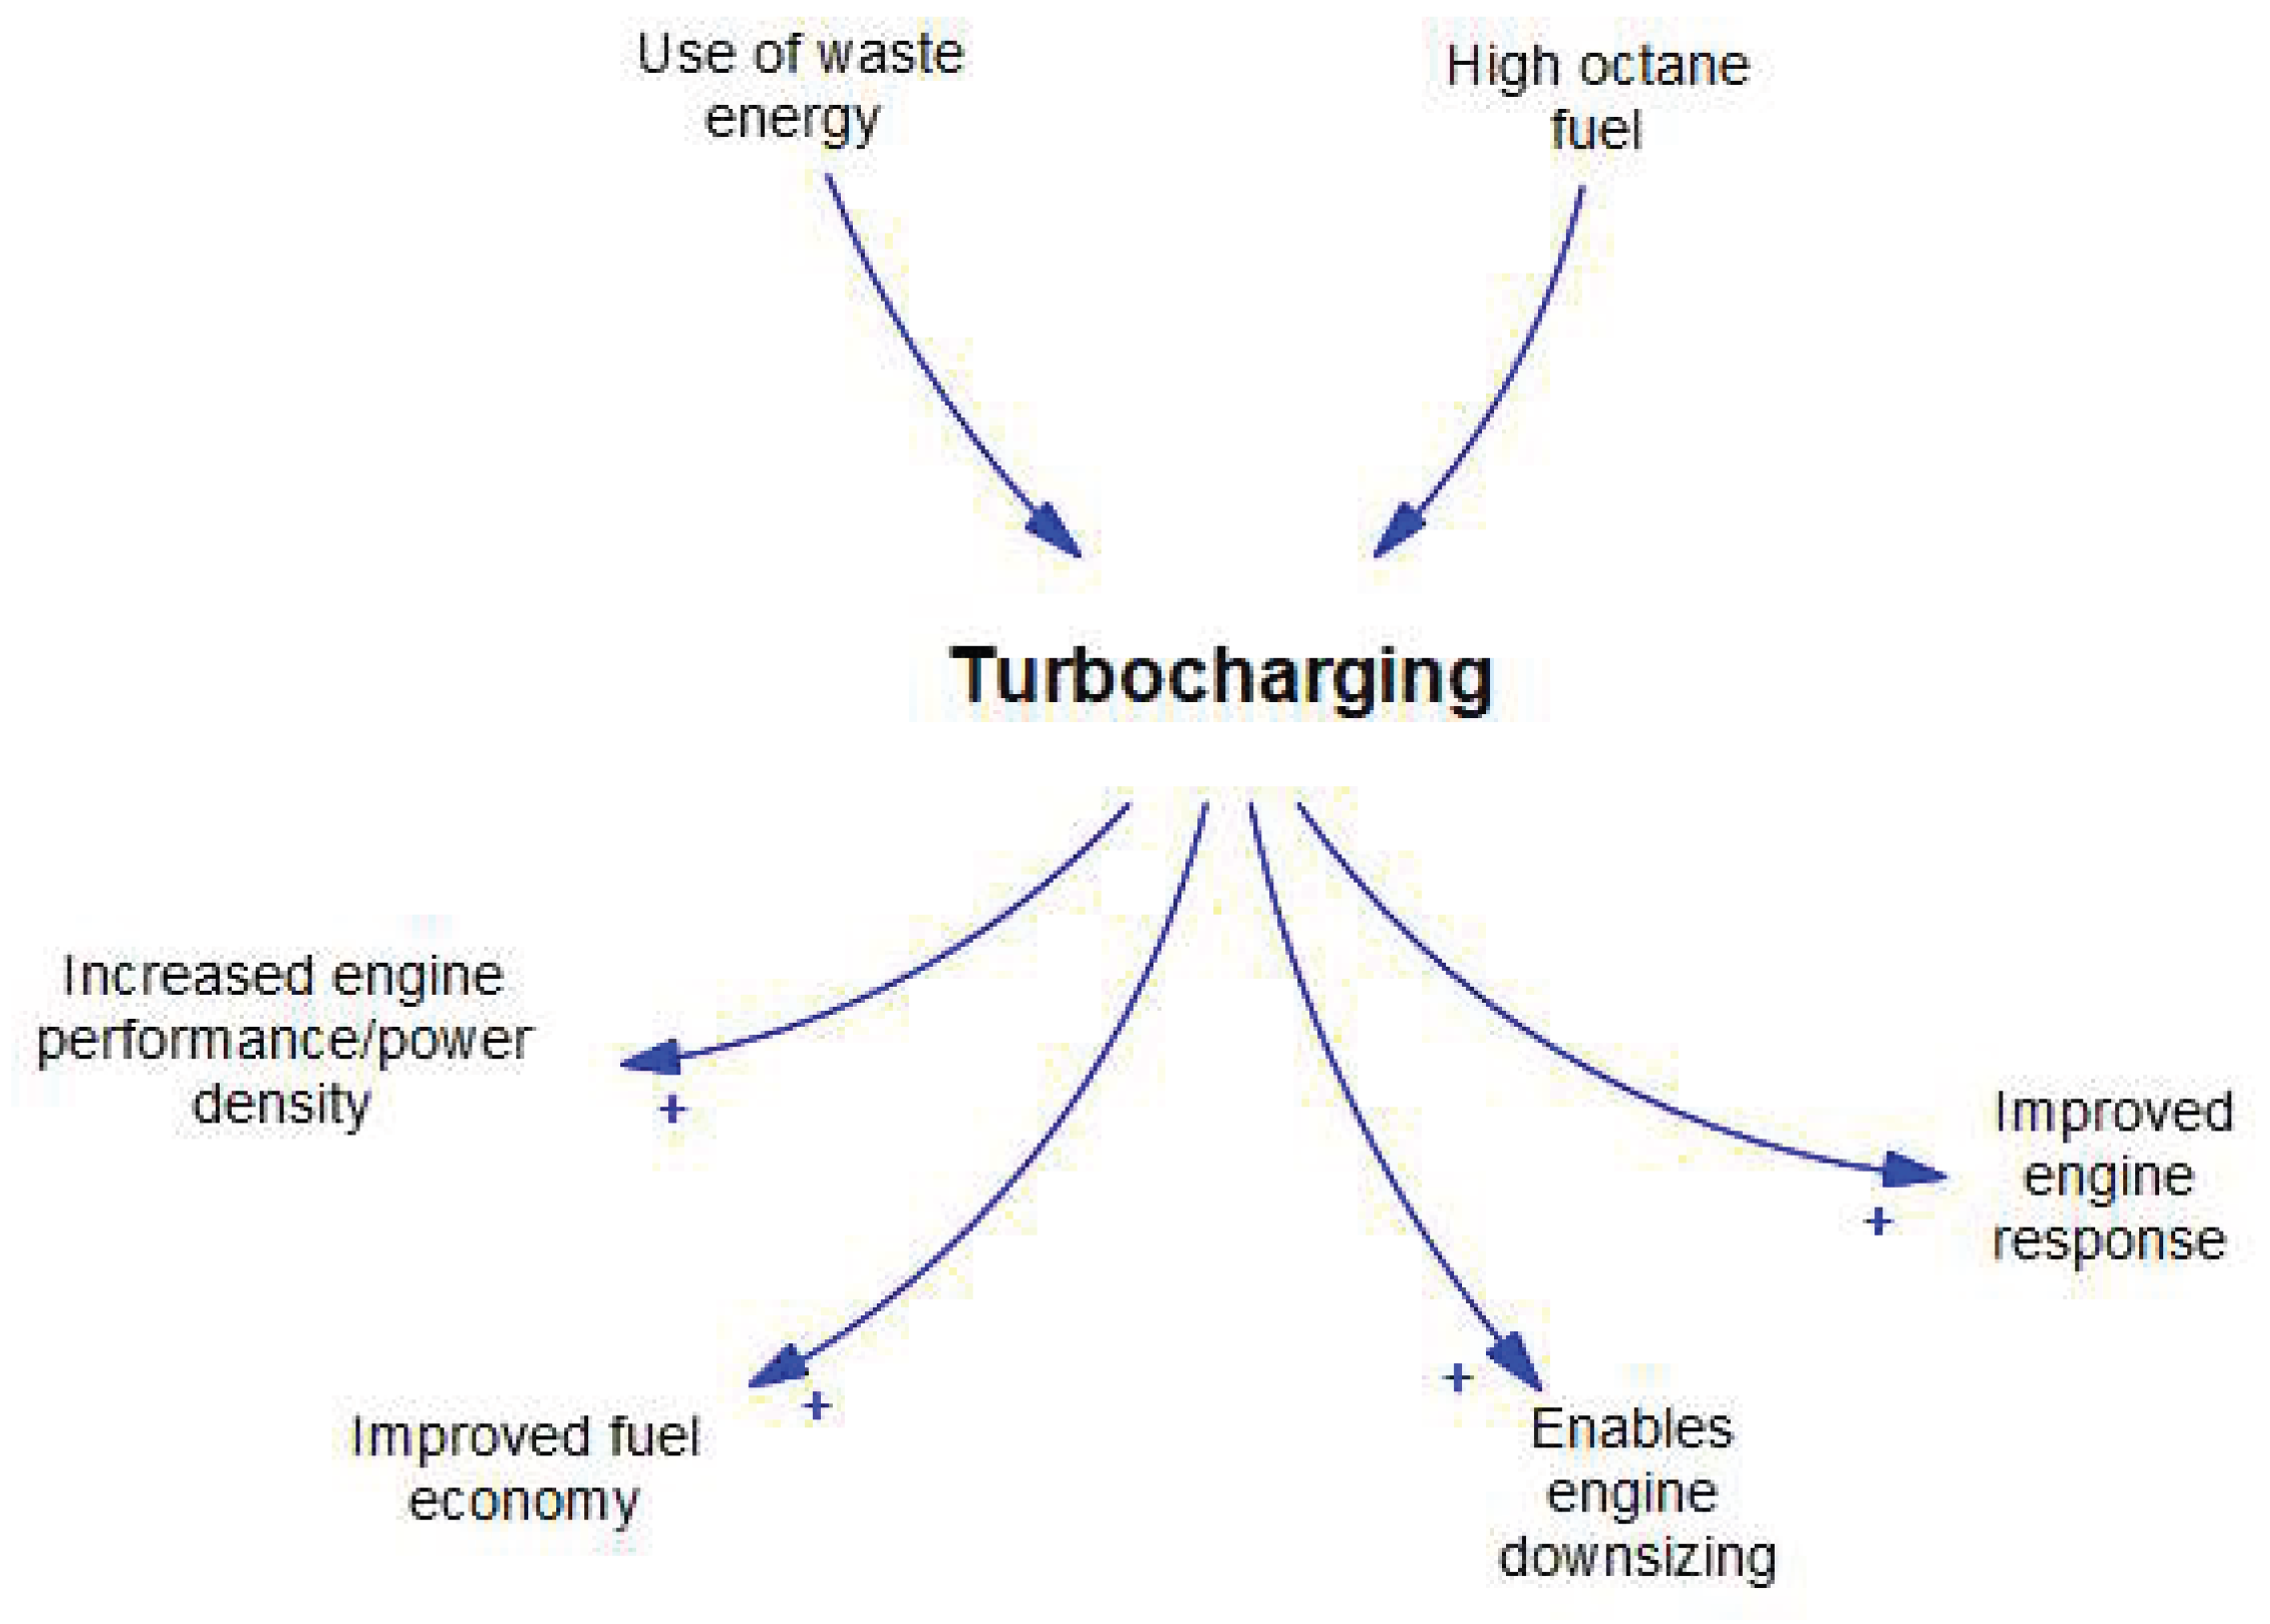
Figure 2.
Causal diagram sub-model for Engine Downsizing.
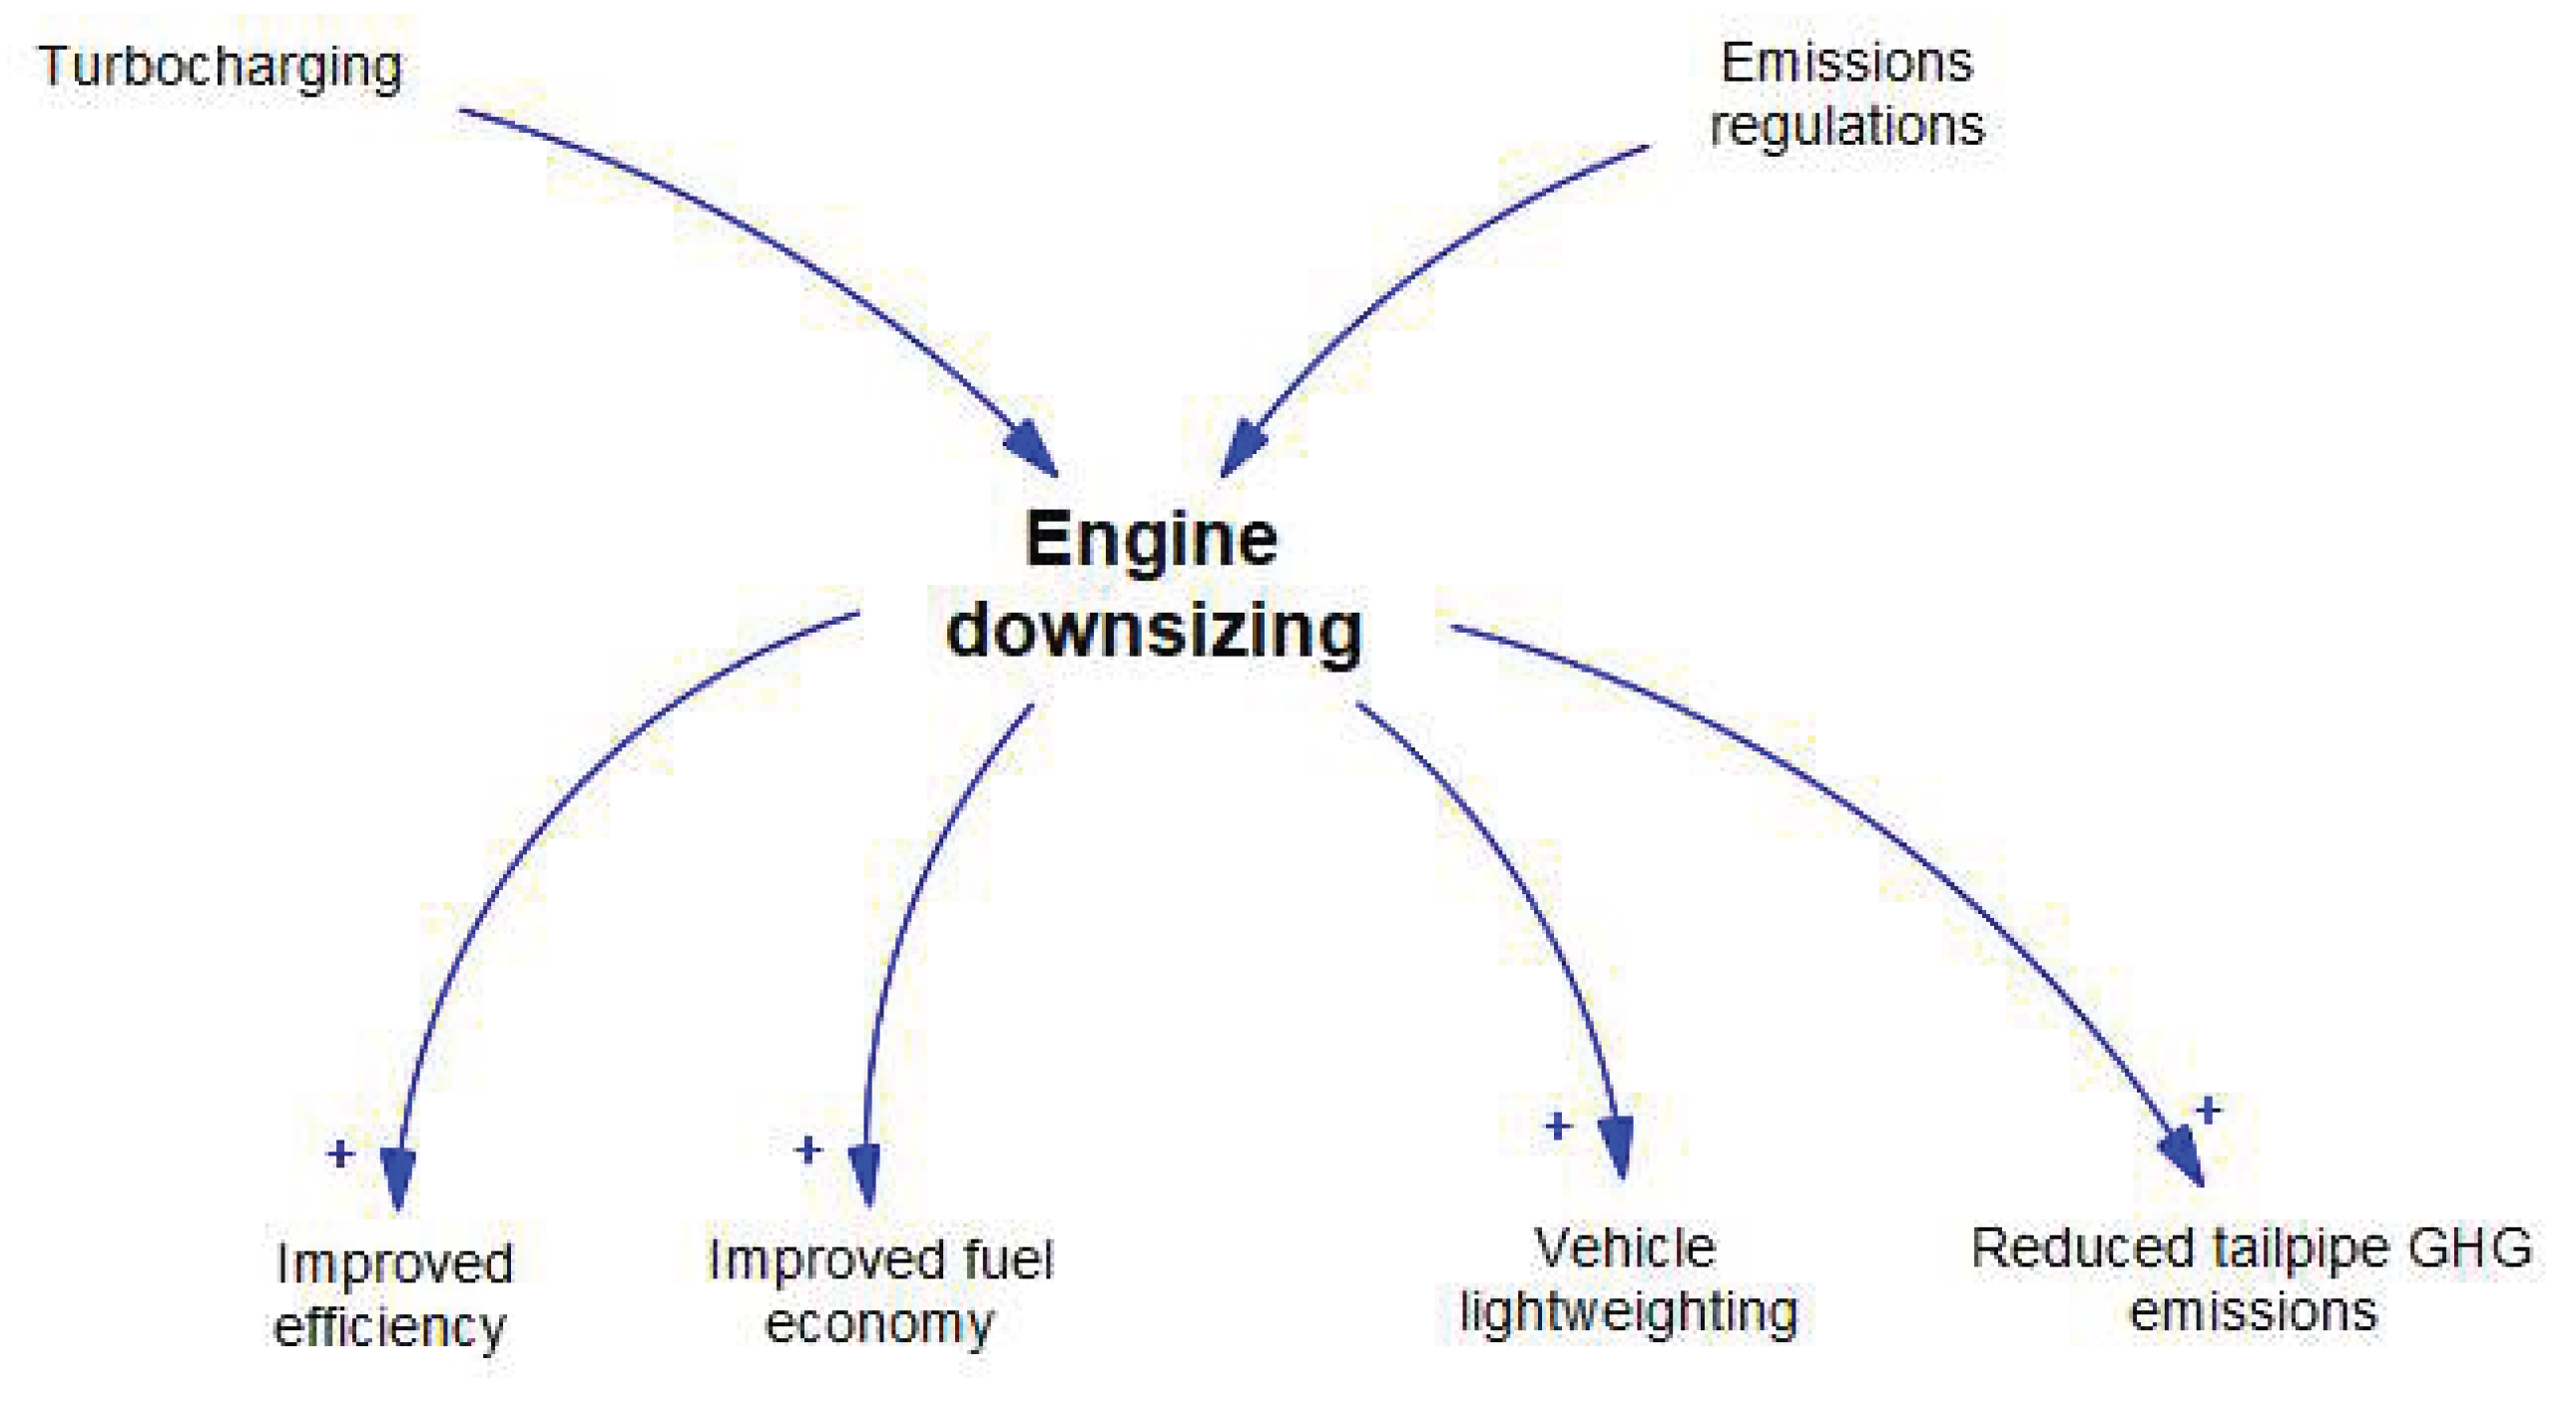
Figure 3.
Causal diagram sub-model for Bioethanol.
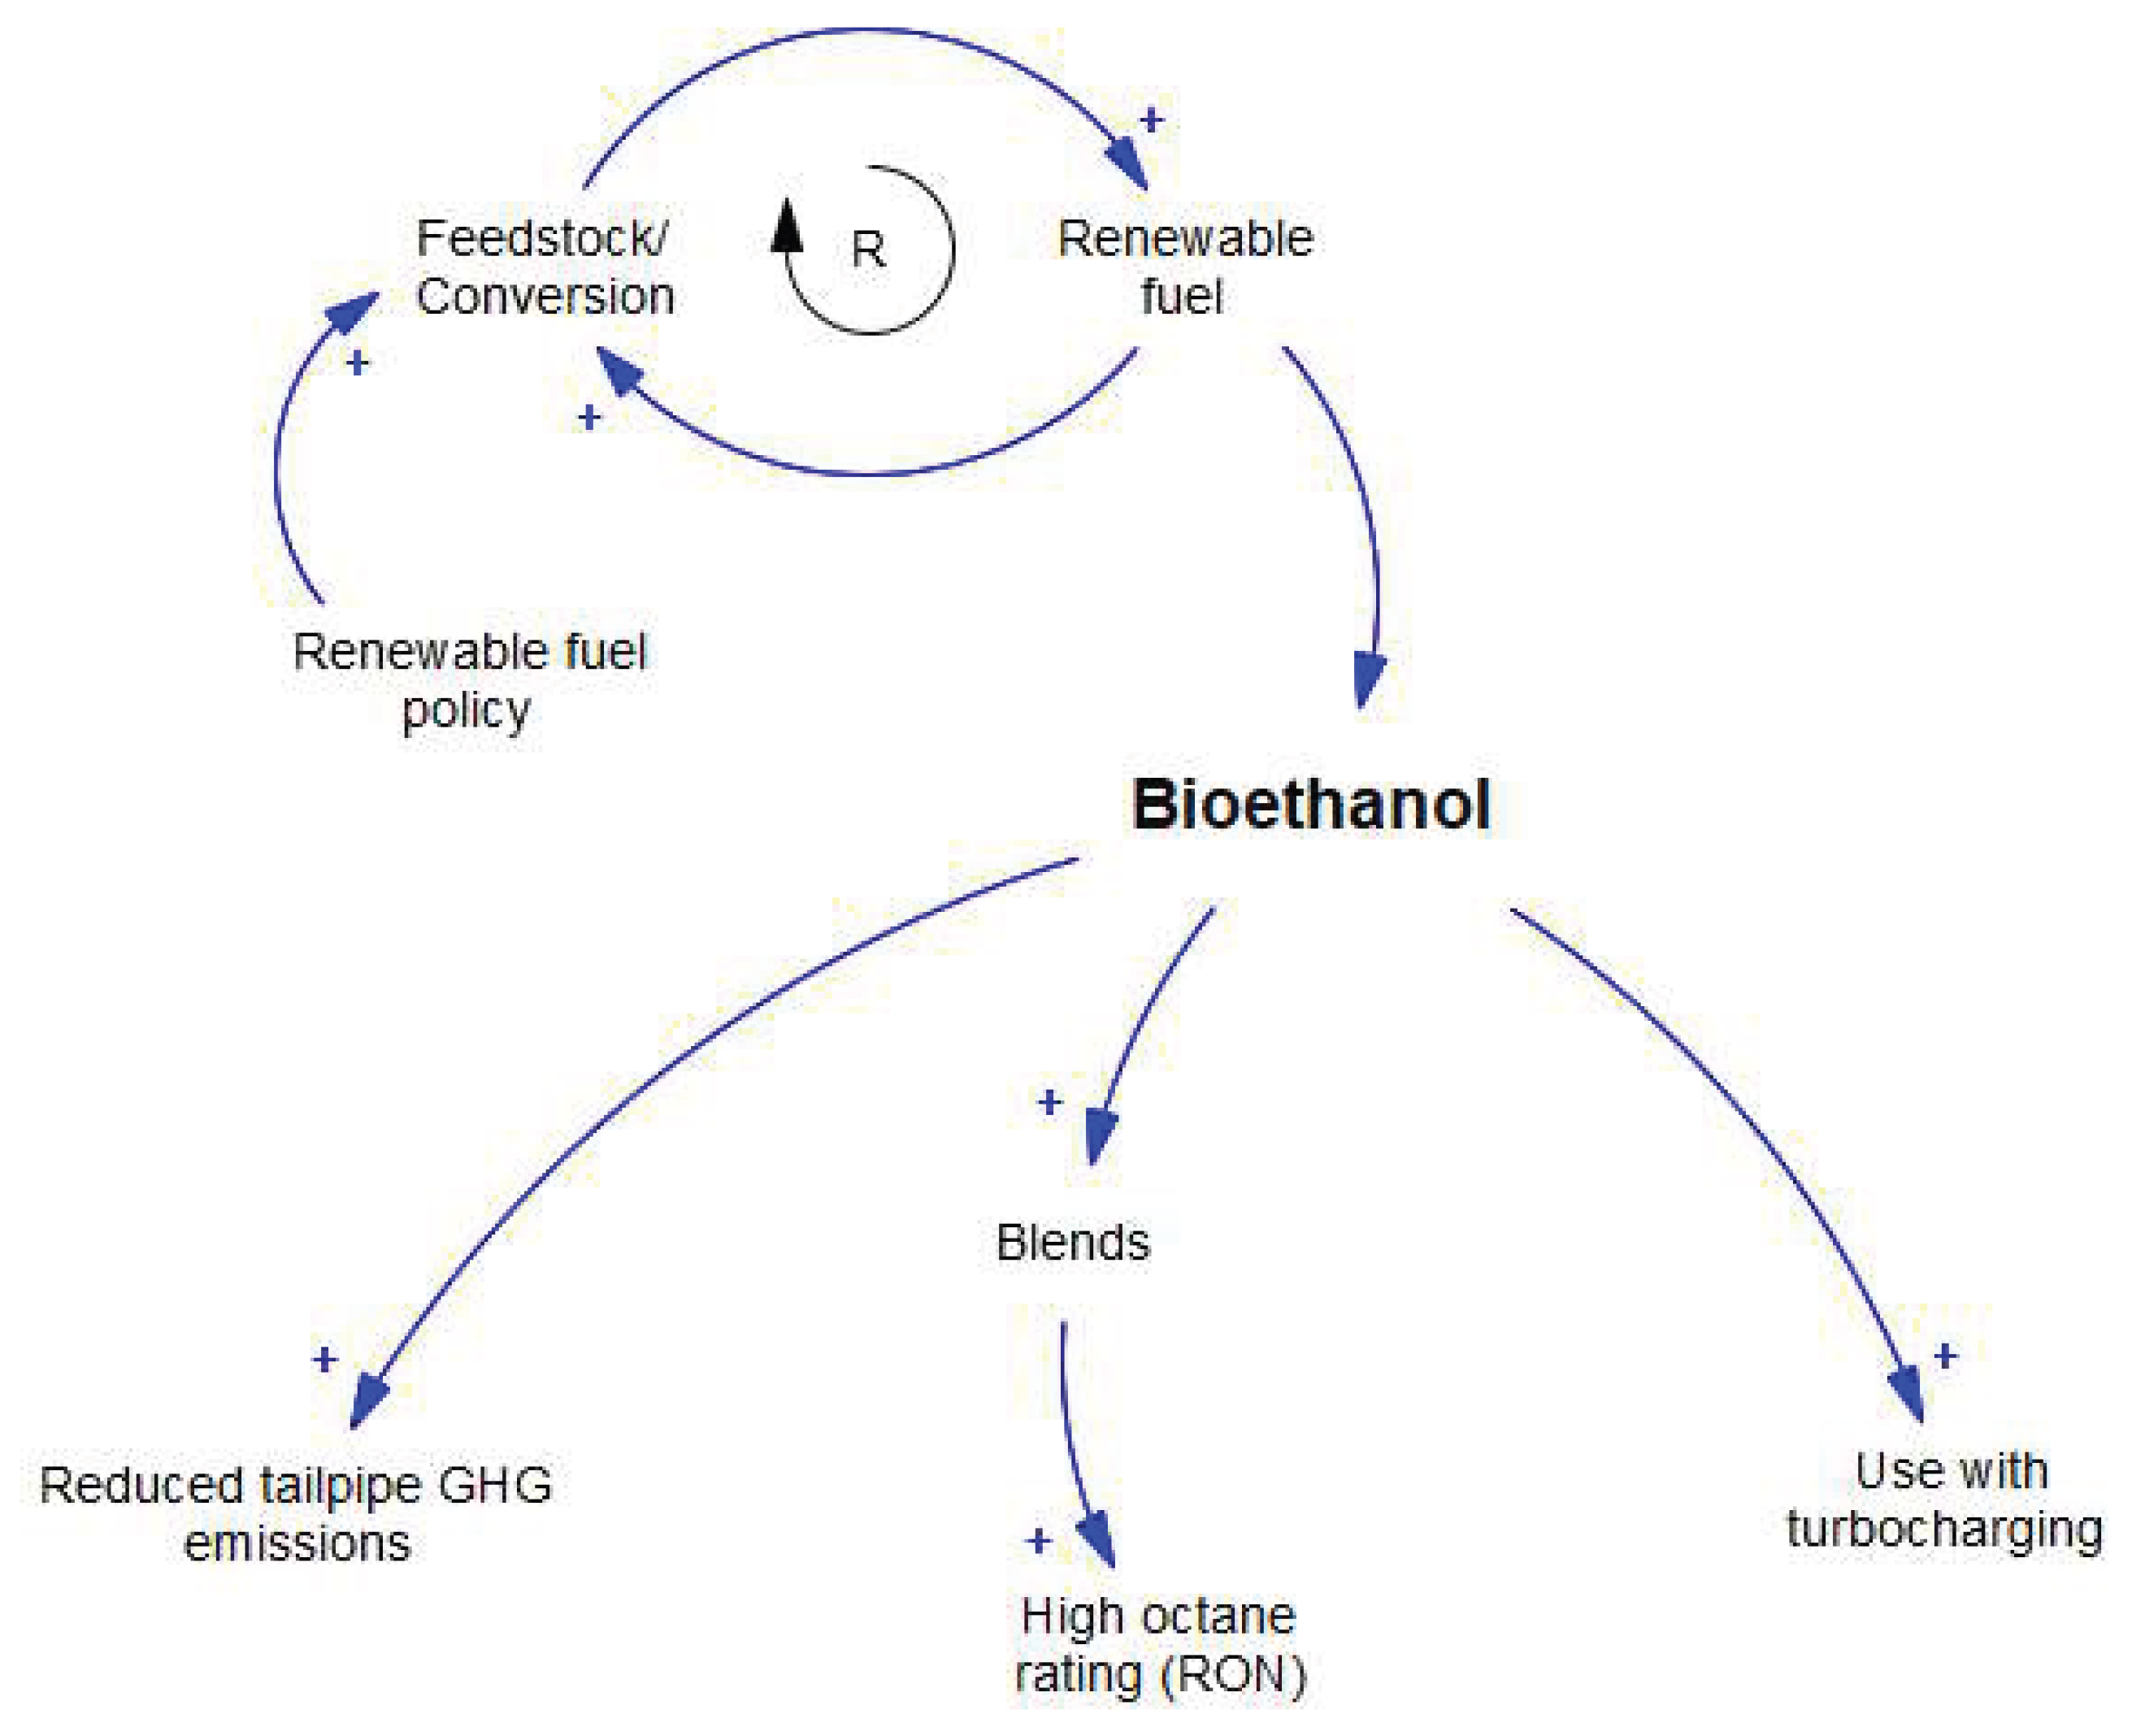
Figure 4.
Causal diagram sub-model for Vehicle lightweighting.
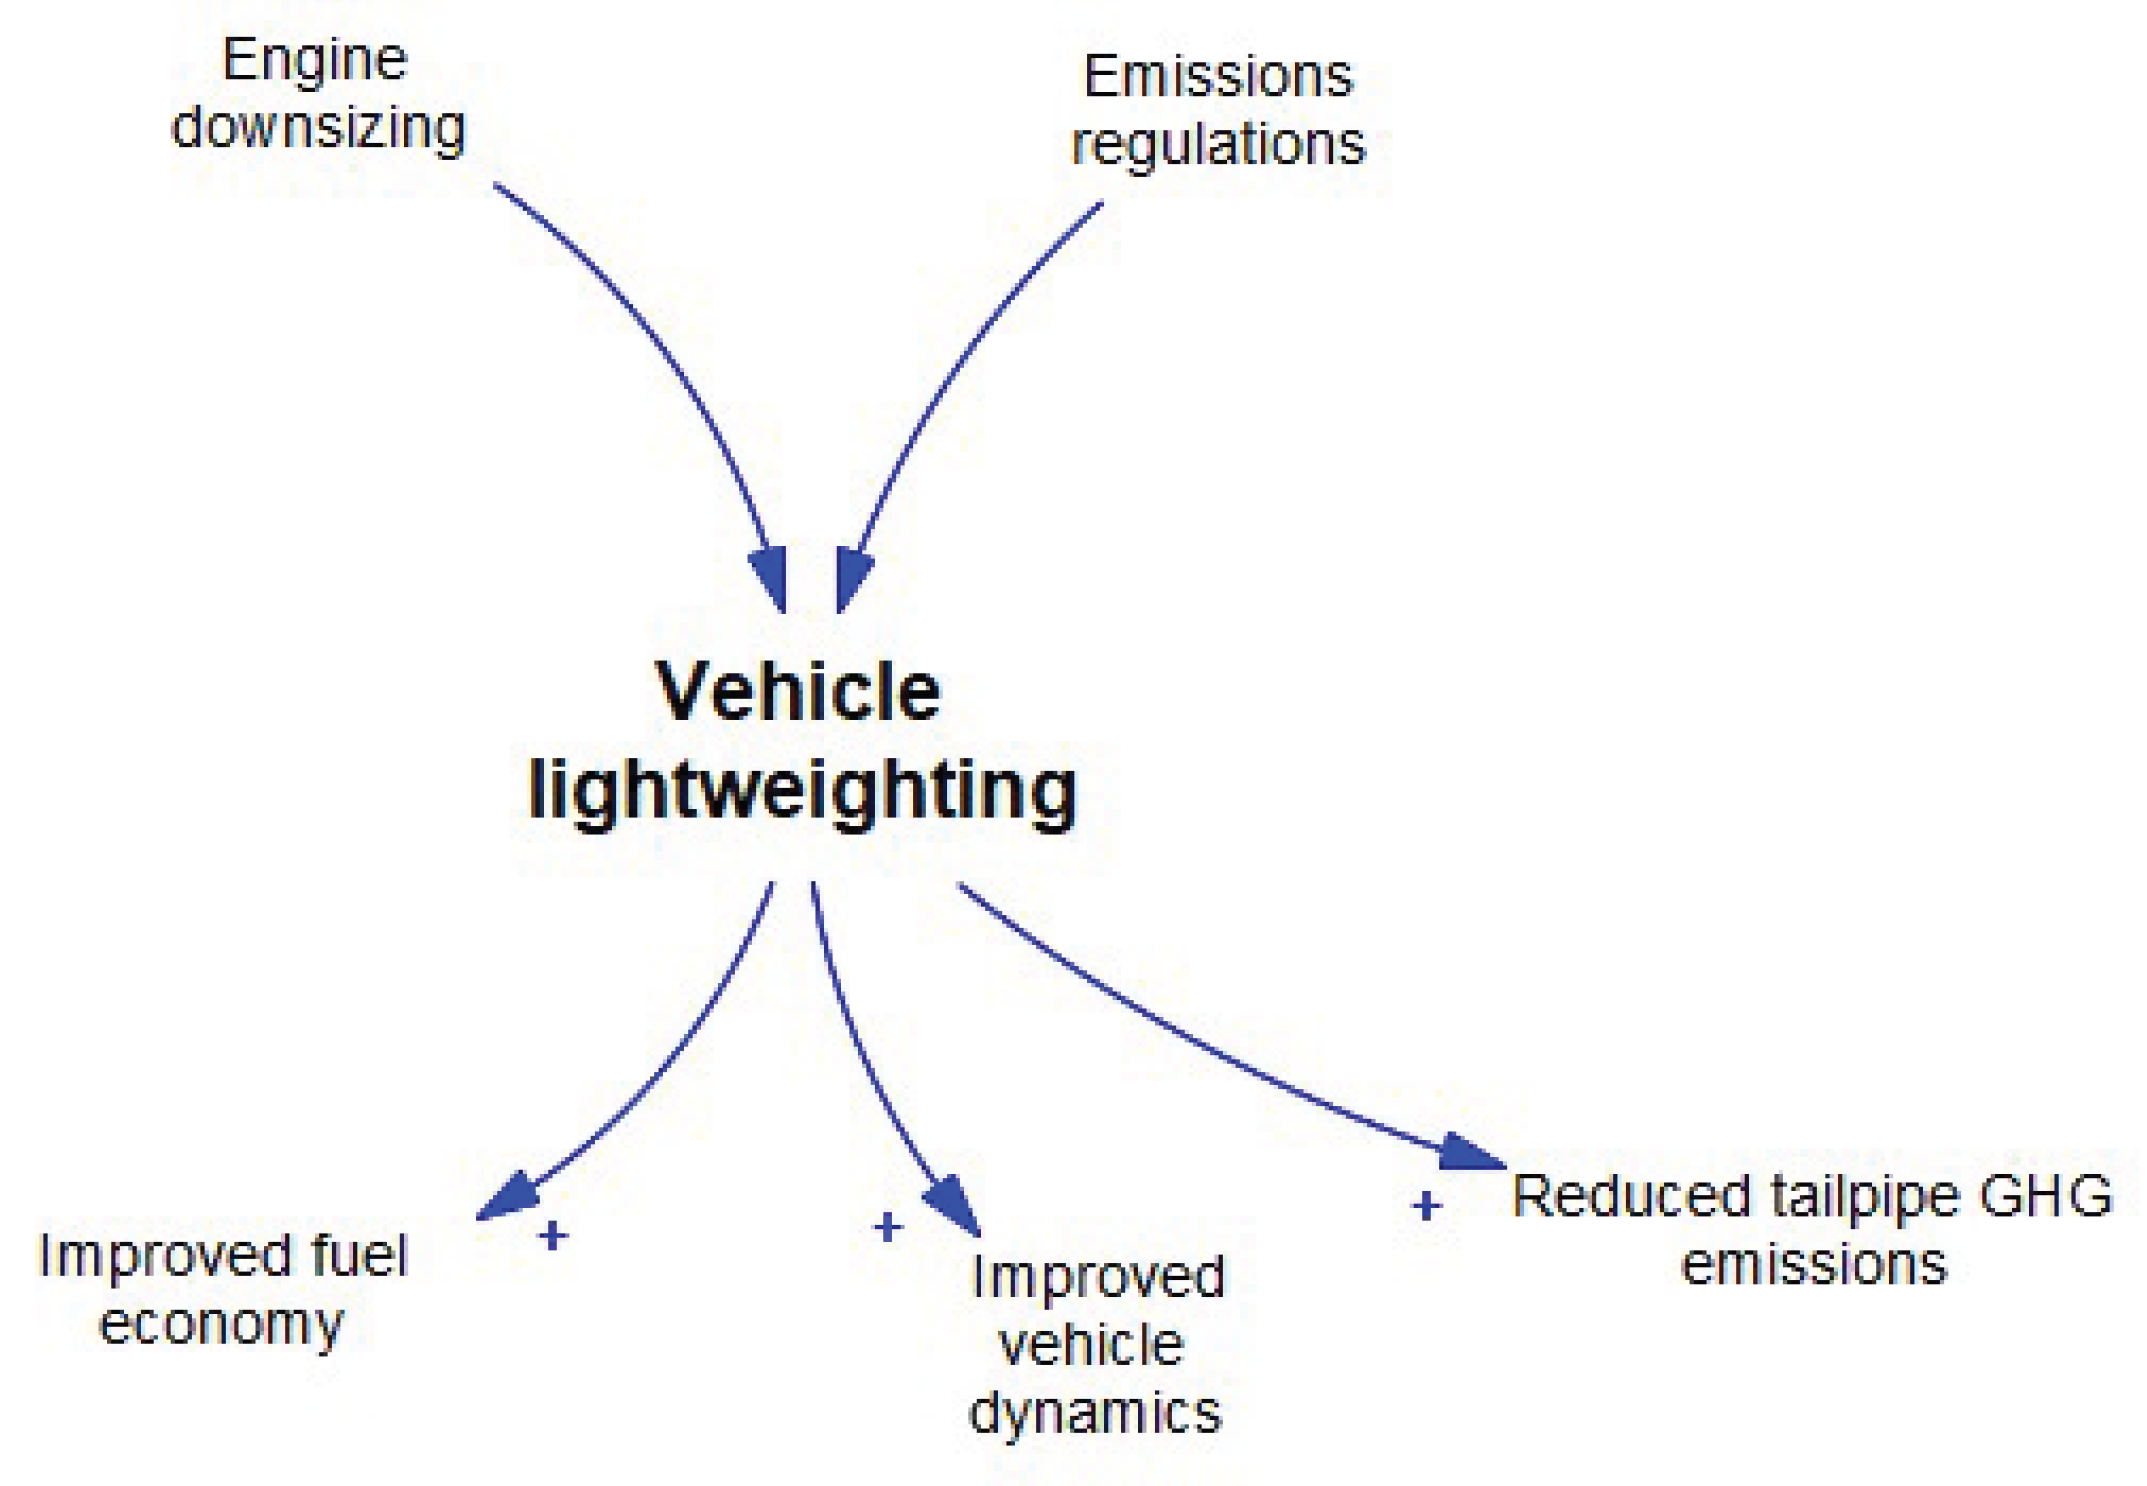
Table 1.
Model Boundary Chart.
| Sub-model | Endogenous | Exogenous | Excluded | Validating References |
|---|---|---|---|---|
| Turbocharging | Increased engine performance/power density Improved engine response Improved fuel economy Use of waste energy |
High octane fuel Enables engine downsizing |
Costs User behaviour |
[8,22,23,24,25,26] |
| Engine downsizing | Turbocharging Improved efficiency Reduced tailpipe GHG emissions Improved fuel economy |
Emissions regulations Vehicle lightweighting |
Distance travelled Costs |
[8,23,26,27,28,29] |
| Bioethanol | Renewable fuel Reduced tailpipe GHG emissions Blends High octane rating (RON) Use with turbocharging |
Feedstock/ Conversion Renewable fuel policy |
Indirect land-use change. Chemical additives Energy output-to-input ratio of corn ethanol production Consumer demand |
[7,26,30,31,32,33,34,35,36] |
| Vehicle lightweighting | Improved fuel economy Improved vehicle dynamics Reduced tailpipe GHG emissions |
Engine downsizing Emissions regulations |
Extraction of raw materials Manufacturing End-of-life recycling Technological change Materials selection Costs |
[2,4,5,6,27,37,38,39,40] |
Disclaimer/Publisher’s Note: The statements, opinions and data contained in all publications are solely those of the individual author(s) and contributor(s) and not of MDPI and/or the editor(s). MDPI and/or the editor(s) disclaim responsibility for any injury to people or property resulting from any ideas, methods, instructions or products referred to in the content. |
© 2026 by the authors. Licensee MDPI, Basel, Switzerland. This article is an open access article distributed under the terms and conditions of the Creative Commons Attribution (CC BY) license (http://creativecommons.org/licenses/by/4.0/).
Copyright: This open access article is published under a Creative Commons CC BY 4.0 license, which permit the free download, distribution, and reuse, provided that the author and preprint are cited in any reuse.


