

Submitted:
04 June 2026
Posted:
09 June 2026
You are already at the latest version
Abstract
Solonetz and Solonetzic rangelands are widespread in arid regions of Central Kazakhstan, where pasture degradation is often difficult to assess because surface vegetation patterns do not always reflect subsurface soil constraints. This study aimed to evaluate degradation mechanisms in Solonetz pasture ecosystems of the Ulytau region by integrating field soil-profile descriptions, laboratory analyses, vegetation observations, forage productivity data and Sentinel-2A-derived MSAVI. Ten monitoring soil profiles were examined for particle-size distribution, soluble salts, ionic composition, exchangeable cations, available N, P and K, vegetation cover and forage yield. USDA textural classification, salt-distribution analysis, Pearson correlation, PCA, RDA and MSAVI-based mapping were used to link soil-profile properties with vegetation and spectral response. The results showed strong profile heterogeneity, with clay enrichment, subsurface salt accumulation, alkalinity and Na- or Mg-related exchange-complex imbalance forming several degradation pathways. Surface horizons were often weakly saline, whereas deeper layers contained stronger chemical and physical limitations. MSAVI values were low across the monitoring sites and reflected vegetation–soil surface conditions rather than salinity or sodicity directly. Combining soil-profile diagnostics with Sentinel-2A MSAVI improved the interpretation of degradation patterns and provides a practical framework for monitoring spatially heterogeneous Solonetz rangelands in arid pasture systems.
Keywords:
arid rangelands
; soil salinity
; sodicity
; pasture degradation
; Sentinel-2A
; MSAVI
; vegetation cover
; Central Kazakhstan
1. Introduction
Dryland rangelands are shaped by a close interaction between climate variability, soil-profile constraints, vegetation cover and surface energy balance. In these environments, land degradation rarely develops through a single driver. It is more often produced by the combined effects of limited water availability, soil structural deterioration, reduced plant cover and increasing exposure of the soil surface [1,2]. Salt-affected soils are among the most persistent forms of dryland degradation because they influence both the physical functioning of soils and the physiological performance of plants. Global assessments indicate that salt-affected soils occupy extensive areas in arid and semi-arid regions, where low leaching intensity, saline parent materials, shallow groundwater and restricted drainage favour the accumulation of soluble salts and exchangeable sodium in the soil profile [3,4,5,6]. The Global Map of Salt-Affected Soils estimates that more than 424 million ha of topsoil and 833 million ha of subsoil are affected by salinity, sodicity or alkalinity, showing that the problem is often not restricted to the surface layer but extends into the root zone [5].
Sodicity is especially important because its effects are not limited to osmotic stress or ion toxicity. In sodic and saline-sodic soils, high exchangeable sodium promotes clay swelling and dispersion, reduces aggregate stability, decreases hydraulic conductivity and contributes to the formation of dense subsurface horizons [7,8,9]. These changes reduce infiltration, restrict aeration and limit root penetration, thereby weakening plant access to water and nutrients. High pH, carbonate and bicarbonate alkalinity may further reduce nutrient availability and intensify plant stress [10,11]. As a result, vegetation on sodic soils often remains sparse and low-yielding even when seasonal precipitation is relatively favourable, because plant growth is constrained by the soil profile itself rather than by climate alone [12,13,14].
Solonetz and Solonetzic soils represent a characteristic expression of this degradation pathway. These soils are commonly defined by a natric or solonetzic subsurface horizon, pronounced textural differentiation and accumulation of exchangeable sodium or other dispersive cations [15]. They occur widely in steppe, dry steppe and semi-desert landscapes, particularly where flat or weakly drained terrain limits salt removal from the soil profile [16,17]. In Eurasian drylands, including Kazakhstan, Solonetz soils form spatially heterogeneous complexes with chestnut, light chestnut and other arid-zone soils, creating patchy landscapes with strong contrasts in soil structure, vegetation cover and pasture productivity [18,19,20].
Remote sensing has become an important tool for mapping salt-affected and degraded lands, particularly in regions where conventional soil surveys are limited by large territory, poor accessibility and high spatial heterogeneity. Optical satellite data can detect salt crusts, bare soil surfaces and vegetation stress, while vegetation indices provide indirect information on plant cover and photosynthetic activity [21,22]. However, the spectral response of salt-affected soils is often ambiguous. Soil reflectance is controlled not only by salt content but also by soil moisture, texture, organic matter, surface roughness, gypsum and carbonate accumulations, vegetation residues and mixed pixels [23,24]. Therefore, satellite-based diagnosis of salinity or sodicity should be calibrated with field and laboratory data rather than interpreted only from surface reflectance [25,26].
A combined spectral–thermal approach may improve the diagnosis of degradation in Solonetz rangelands. NDVI is widely used to characterize vegetation greenness and photosynthetic activity [27,28], whereas land surface temperature reflects the thermal response of the soil–vegetation surface to vegetation cover, soil moisture, evaporation and surface exposure [29]. In degraded rangelands, sparse vegetation reduces shading and transpiration, exposing the soil surface to stronger heating. The relationship between NDVI and land surface temperature has therefore been widely used in studies of drought, vegetation stress and land degradation, although its strength depends on season, land-cover type and climatic conditions [30,31,32]. Surface albedo adds further information on reflectance changes associated with bare soil, salt crusts and vegetation cover, making the joint interpretation of NDVI, albedo and LST potentially useful for detecting degradation feedbacks.
The Landsat archive provides a suitable basis for this type of analysis because it offers long-term, moderate-resolution observations in visible, near-infrared, shortwave infrared and thermal bands [33]. Landsat 8/9 data, when processed through cloud-based platforms such as Google Earth Engine, allow multi-year comparison of vegetation condition, surface reflectance and thermal behaviour across heterogeneous landscapes [34]. This is particularly relevant for Solonetz rangelands, where degradation may appear not as a single-year anomaly but as a persistent spectral–thermal pattern controlled by stable soil-profile properties.
Despite the growing use of remote sensing for mapping salt-affected soils, an important gap remains. Many studies classify salinity or land degradation using spectral indices, vegetation indices or machine-learning models, but fewer directly connect satellite-derived indicators with profile-scale soil constraints such as clay illuviation, pH, soluble salts, exchangeable sodium, exchangeable magnesium and cation exchange capacity. This gap is critical for Solonetz landscapes because the main degradation driver may occur below the surface, while satellite sensors observe only the upper soil–vegetation interface. A field-calibrated framework is therefore needed to determine whether low NDVI, altered albedo and elevated LST are merely surface symptoms or integrated expressions of deeper soil-profile degradation.
The objective of this study was to assess how field-measured soil-profile properties are linked with vegetation condition, forage productivity and satellite-derived surface responses in Solonetz and Solonetzic rangelands of the Ulytau region, Central Kazakhstan. We integrated soil morphological descriptions, laboratory analyses, vegetation and forage measurements, Sentinel-2A-derived MSAVI, and Landsat-based NDVI, surface albedo and LST time-series data from ten monitoring sites. The study addressed three main questions: (i) whether subsurface sodicity, salinity, alkalinity and clay accumulation correspond to reduced vegetation cover and forage productivity; (ii) whether vegetation–soil surface conditions at the monitoring sites are reflected in Sentinel-2A MSAVI response; and (iii) whether long-term NDVI–albedo–LST dynamics provide additional spectral–thermal evidence of persistent low vegetation signal, soil-surface exposure and thermal stress in degraded Solonetz rangelands. By combining soil-profile diagnostics with vegetation observations and satellite indicators, the study aimed to develop a field-calibrated framework for interpreting and mapping spatially heterogeneous Solonetz degradation patterns.
2. Materials and Methods
2.1. Study Area and Field Design
The study was conducted in the Ulytau region of Central Kazakhstan, an arid rangeland area where Solonetz and Solonetzic soils occur as spatially heterogeneous soil complexes. The region is characterized by a strongly continental climate, low and irregular precipitation, high summer temperatures and extensive pasture use. These environmental conditions favour the persistence of salt-affected and structurally degraded soils, particularly in flat, weakly drained or slightly dissected landscapes.
Field investigations were carried out in 2024–2025 at ten monitoring sites representing different Solonetz and Solonetzic rangeland conditions (Figure 1; Table 1). The monitoring sites were selected after preliminary interpretation of soil and geobotanical maps, archival soil survey materials and satellite imagery. Site selection was aimed at capturing variation in soil-profile morphology, salinity and sodicity status, vegetation cover, pasture productivity and surface degradation patterns. Each monitoring site included one full soil profile and an associated vegetation survey plot.
The monitoring network included sites P-11–P-20 located across the Ulytau region. These sites represented shallow Solonetz, medium Solonetz, crusted Solonetz and Solonetzic light chestnut soils under different pasture associations. For each site, soil type, landscape position, surface condition, dominant vegetation type, vegetation cover and forage productivity were recorded. This field network provided the basis for linking profile-scale soil properties with vegetation condition and satellite-derived spectral–thermal indicators.
2.2. Soil-Profile Description and Sampling
At each monitoring site, a full soil profile was opened and described in the field. Genetic horizons were identified according to morphological features, including colour, structure, moisture condition, compaction, carbonate reaction, root abundance, texture and horizon boundaries. Particular attention was paid to diagnostic features of Solonetz formation, such as dense prismatic, columnar or blocky subsurface horizons, clay accumulation, carbonate or gypsum features, salt accumulation, surface crusting and restrictions to root penetration.
Soil samples were collected by genetic horizon. For each horizon, material was taken from three profile walls and combined into one composite sample of approximately 500 g. This sampling scheme was used to reduce small-scale variability within the profile while preserving vertical differences among horizons. The samples were air-dried, gently crushed and passed through a 1-mm or 2-mm sieve depending on the subsequent laboratory analysis.
For statistical analysis, soil-profile data were summarized using ecologically meaningful indicators. Topsoil values were used for humus and available macronutrients, while maximum profile values were used for pH, total soluble salts, exchangeable sodium percentage, exchangeable magnesium saturation, cation exchange capacity and physical clay content. This approach was used because Solonetz degradation is often expressed most strongly in subsurface horizons rather than in the uppermost soil layer.
2.3. Laboratory Soil Analyses
Laboratory analyses were carried out using standard soil analytical methods. The following parameters were determined: particle-size distribution, humus content, available nitrogen, available phosphorus, available potassium, pH, total soluble salts, ionic composition of the water extract, exchangeable cations and cation exchange capacity.
Particle-size distribution was used to assess textural differentiation within the soil profile, with particular attention to physical clay accumulation in Solonetzic horizons. Soil reaction was measured as pH in aqueous suspension. Total soluble salts and ionic composition were determined from water extracts, including HCO₃⁻, CO₃²⁻, Cl⁻, SO₄²⁻, Ca²⁺, Mg²⁺, Na⁺ and K⁺. Exchangeable Ca²⁺, Mg²⁺, Na⁺ and K⁺ were determined to evaluate the composition of the soil exchange complex.
Cation exchange capacity was calculated as the sum of exchangeable base cations:
where Caexch, Mgexch, Naexch and Kexch are exchangeable calcium, magnesium, sodium and potassium, respectively.
CEC = Caexch + Mgexch + Naexch + Kexch
Exchangeable sodium percentage was calculated as:
where Naexch is exchangeable sodium and CEC is the cation exchange capacity.
Exchangeable magnesium saturation was calculated as:
where Mgexch is exchangeable magnesium. Magnesium saturation was included because several profiles showed evidence of magnesium-dominated Solonetzic conditions, which may also contribute to structural instability and plant growth limitations.
Total soluble salts were used as an indicator of salinity intensity, while pH, ESP and magnesium saturation were used as indicators of alkalinity and sodicity-related soil constraints. Available nitrogen, phosphorus and potassium were used to assess macronutrient status across the monitored profiles.
2.3.1. Particle-Size Distribution and USDA Textural Classification
Particle-size distribution was analysed for each sampled soil horizon to characterize vertical textural differentiation within the Solonetz and Solonetzic profiles. Particular attention was given to the accumulation of fine fractions in subsurface horizons, because clay enrichment is one of the main morphological and physical indicators of Solonetzic profile development.
For graphical interpretation, the sand, silt and clay fractions were plotted on the USDA textural triangle. The USDA diagram was used as a comparative visualization tool to illustrate textural variation among horizons and profiles. Because the laboratory dataset included physical clay values based on the locally used particle-size threshold, the USDA classification was interpreted cautiously and used mainly to compare relative differences among samples rather than to assign definitive international textural classes. This approach allowed the particle-size data to be linked with profile differentiation, salt accumulation and vegetation response in subsequent analyses.
2.4. Vegetation and Forage Assessment
Vegetation surveys were conducted at each monitoring site within plots associated with the corresponding soil profile. The recorded parameters included pasture type, dominant plant association, species composition, botanical composition, projective vegetation cover and pasture yield.
Species composition was assessed using 1 m² frames divided into 10 × 10 cm cells. Three replicate frames were used at each monitoring site. Botanical composition was expressed as the percentage contribution of dominant plant groups or species. Vegetation cover was estimated as the proportion of the ground surface covered by living vegetation.
Pasture yield was determined from 1 m² plots in five replicates. Above-ground plant biomass was harvested at natural moisture, weighed and converted to centners per hectare (c ha⁻¹). Plant samples were then analysed for forage-quality indicators, including crude protein, crude fat, crude fibre, nitrogen-free extract, ash content, feed units and metabolizable energy.
Vegetation and forage indicators were used to evaluate whether soil-profile degradation was reflected in plant community structure, vegetation cover, forage productivity and feed quality. For the integrated analysis, vegetation cover and forage yield were treated as the main field-based biological response variables.
2.5. Satellite Data and Preprocessing
Remote sensing analysis was based on two groups of satellite data. Landsat 8/9 OLI/TIRS Collection 2 Level 2 imagery was used to analyse long-term spectral–thermal dynamics of the studied Solonetz rangelands during the summer growing seasons from 2013 to 2025. Sentinel-2A multispectral imagery was used to calculate MSAVI and to assess site-level vegetation–soil surface conditions at the monitoring sites.
Landsat imagery was selected because it provides long-term observations at moderate spatial resolution and includes visible, near-infrared, shortwave infrared and thermal bands suitable for vegetation, surface reflectance and land surface temperature analysis. Satellite image processing was carried out in Google Earth Engine. Cloud-contaminated pixels, cloud shadows and low-quality observations were removed using the quality assessment bands available in the Landsat Collection 2 Level 2 products. Only cloud-free or near cloud-free summer observations were used for extracting spectral–thermal indicators. The summer period was selected to reduce seasonal variability and to capture the period when vegetation stress and surface heating are most clearly expressed in arid rangelands.
For the Landsat-based analysis, normalized difference vegetation index (NDVI), surface albedo and land surface temperature (LST) were calculated for the summer period of each year. NDVI was used as an indicator of vegetation greenness, surface albedo as a complementary indicator of soil-surface reflectance, and LST as an indicator of thermal response of the vegetation–soil surface. Mean annual summer values were used to describe long-term spectral–thermal dynamics from 2013 to 2025. Pixel-level values extracted from the mapped Solonetz polygons were additionally used to analyse the relationships between NDVI, albedo and LST.
For the site-level analysis, polygons corresponding to field-observed soil–vegetation units were delineated using field coordinates, site descriptions and high-resolution imagery. These polygons represented the monitoring sites and adjacent homogeneous areas. Within each polygon, spectral values were extracted and summarized for comparison with field soil and vegetation observations. The Landsat-based NDVI–albedo–LST analysis was used as a long-term spectral–thermal context, whereas Sentinel-2A-derived MSAVI was used for detailed interpretation of vegetation–soil surface response and mapping of Solonetz degradation patterns.
2.5.1. Sentinel-2A MSAVI Calculation
Sentinel-2A multispectral imagery was used to calculate the modified soil-adjusted vegetation index (MSAVI) for the monitoring sites and for subsequent mapping of vegetation–soil surface degradation patterns. Sentinel-2A data were selected because of their relatively high spatial resolution and suitability for detecting vegetation cover variation in heterogeneous rangeland landscapes.
Cloud-contaminated pixels and cloud shadows were removed before index calculation. The red and near-infrared bands were used to calculate MSAVI, which is less sensitive to soil-background effects than conventional greenness indices under sparse vegetation conditions. MSAVI was calculated as:
where (NIR) is near-infrared reflectance and (Red) is red-band reflectance.
For each monitoring site, MSAVI values were extracted from polygons corresponding to field-observed soil–vegetation units. The extracted MSAVI values were used to compare spectral response with vegetation cover, forage productivity and soil-profile indicators. MSAVI was interpreted as a vegetation–soil surface condition proxy rather than as a direct indicator of salinity, sodicity or soil texture.
2.5.2. Landsat 8/9 NDVI, Surface Albedo and LST Calculation
Landsat 8/9 OLI/TIRS Collection 2 Level 2 imagery was used to evaluate long-term spectral–thermal dynamics of the studied Solonetz rangelands from 2013 to 2025. The analysis was restricted to the summer growing season to reduce seasonal variability and to capture the period when vegetation stress, soil-surface exposure and surface heating are most clearly expressed in arid rangelands.
The normalized difference vegetation index (NDVI) was calculated from near-infrared and red reflectance:
where NIR is near-infrared reflectance and RED is red reflectance.
Surface albedo was calculated from Landsat surface reflectance bands as a broadband reflectance indicator. It was used as a complementary variable describing surface brightness and soil-surface exposure. Albedo was interpreted cautiously because it may be influenced by soil moisture, salt crusts, bare soil, vegetation cover and surface roughness.
Land surface temperature (LST) was derived from the thermal band information available in Landsat Collection 2 Level 2 products. The scaled surface temperature band was converted to degrees Celsius using the Landsat scale factor and offset:
where (ST) is the scaled Landsat surface temperature band.
For each year, mean summer NDVI, surface albedo and LST values were extracted for the mapped Solonetz rangeland polygons. These values were used to analyse interannual spectral–thermal dynamics over the 2013–2025 period. Pixel-level values were also used to examine NDVI–LST and Albedo–LST relationships. The Landsat-based NDVI–albedo–LST analysis was used as a long-term spectral–thermal context, whereas Sentinel-2A-derived MSAVI was used for site-level interpretation and mapping of Solonetz degradation patterns.
2.6. Construction of the Integrated Analytical Dataset
An integrated site-level dataset was constructed by combining field, laboratory and satellite-derived variables. Each monitoring site represented one observation unit. The dataset included soil-profile indicators, vegetation and forage indicators, and remote-sensing variables.
Soil-profile variables included maximum profile values of pH, total soluble salts, exchangeable sodium percentage, exchangeable magnesium saturation, cation exchange capacity and physical clay content. Topsoil values were used for humus content and available macronutrients. Vegetation variables included projective vegetation cover, dominant pasture association and forage yield. Remote-sensing variables included Sentinel-2A-derived MSAVI for the monitoring sites and Landsat-based NDVI, surface albedo and LST for the long-term spectral–thermal analysis.
For correlation and multivariate analyses, a reduced analytical matrix was used to avoid overloading the statistical model with too many variables relative to the number of monitoring sites. This matrix included one row per monitoring site and the following key variables: (pH_{max}), (Salts_{max}), (ESP_{max}), (Mg_{sat.max}), (CEC_{max}), (Clay_{max}), (Humus_{top}), vegetation cover, forage yield and MSAVI. Landsat-based NDVI, albedo and LST were analysed separately as long-term spectral–thermal indicators for the 2013–2025 period.
This structure allowed soil-profile constraints to be compared with vegetation condition and Sentinel-2A MSAVI response, while Landsat-based indicators provided additional long-term context for surface reflectance and thermal behaviour.
2.7. Soil–Vegetation–Spectral Dataset Construction
A site-level integrated dataset was constructed by combining field, laboratory and satellite-derived variables. Each monitoring site represented one observation unit. The dataset included soil morphology, soil chemistry, soil physical properties, vegetation indicators, forage-quality parameters and remote-sensing variables (Table 2).
For statistical analysis, a reduced analytical matrix was used to avoid overloading the model with too many variables relative to the number of monitoring sites. This matrix included the most ecologically relevant indicators: maximum profile pH, maximum total soluble salts, maximum exchangeable sodium percentage, maximum magnesium saturation, maximum cation exchange capacity, maximum physical clay content, topsoil humus, vegetation cover, forage yield and Sentinel-2A-derived MSAVI. Landsat-based NDVI, surface albedo and LST were analysed separately as long-term spectral–thermal indicators for the 2013–2025 period.
2.8. MSAVI-Based Mapping of Solonetz Degradation Patterns
The MSAVI layer derived from Sentinel-2A imagery was used as the primary spatial basis for mapping vegetation–soil surface degradation patterns. Mapping was performed after the site-level MSAVI values had been linked with field observations of soil-profile properties, vegetation cover, pasture type and forage productivity.
Field monitoring sites P-11–P-20 were used to calibrate the interpretation of MSAVI patterns. Areas with low MSAVI values were interpreted as zones of reduced vegetation signal and greater soil-surface exposure, particularly where field data confirmed Solonetzic constraints such as compact subsurface horizons, clay enrichment, elevated pH, soluble salt accumulation, high exchangeable sodium percentage or high magnesium saturation. Areas with relatively higher MSAVI values were interpreted as patches with stronger vegetation signal or locally denser pasture cover.
The final degradation map was produced by combining MSAVI-based spatial delineation with field-confirmed Solonetz and Solonetzic soil observations. The mapped classes were interpreted as vegetation–soil surface degradation patterns rather than as direct salinity or sodicity classes. This field-calibrated approach allowed spatial identification of degraded Solonetz rangelands while keeping the interpretation linked to measured soil-profile and vegetation conditions.
2.9. Statistical Analysis
Statistical analysis was conducted using the integrated site-level soil–vegetation–spectral dataset. Each monitoring site represented one observation unit. Soil-profile variables were summarized using ecologically meaningful indicators, including topsoil humus content, maximum pH, maximum total soluble salt content, maximum exchangeable sodium percentage, maximum exchangeable magnesium saturation, maximum cation exchange capacity and maximum physical clay content. Vegetation variables included projective vegetation cover and forage yield. Sentinel-2A-derived MSAVI was used as the site-level spectral response variable.
Prior to multivariate analysis, continuous variables were standardized to zero mean and unit variance because they had different units and scales. Pearson correlation coefficients were calculated to examine pairwise relationships among soil-profile properties, vegetation indicators and MSAVI. Because the dataset included ten monitoring sites, correlation coefficients were interpreted mainly as exploratory indicators of relationship strength and direction rather than as a basis for strong statistical inference.
Principal component analysis (PCA) was used to identify the main multivariate gradients among the monitoring sites. PCA was performed on standardized soil-profile, vegetation and MSAVI variables representing salinity, sodicity, alkalinity, texture, vegetation cover, forage productivity and spectral response. The first two principal components were used to visualize the separation of monitoring sites according to different degradation patterns.
Redundancy analysis (RDA) was applied to evaluate how selected soil-profile constraints were related to vegetation and spectral response variables. The response matrix included vegetation cover, forage yield and MSAVI. The explanatory matrix included maximum exchangeable sodium percentage, maximum total soluble salt content, maximum physical clay content and maximum pH. RDA was interpreted as an exploratory ordination because of the limited number of monitoring sites. Landsat-based NDVI, surface albedo and LST were analysed separately as long-term spectral–thermal indicators and were not included in the PCA or RDA models.
3. Results
3.1. Soil Texture, Salinity and Profile Differentiation in Solonetz Rangelands
The studied rangelands showed clear soil-profile differentiation in texture, alkalinity, soluble salt accumulation and exchangeable cation composition. Across the ten monitoring sites, Solonetz and Solonetzic soils were characterized by compact subsurface horizons, clay enrichment, carbonate or gypsum features, variable salinity and contrasting dominance of exchangeable Na or Mg in the soil exchange complex. These profile properties indicate that degradation in the Ulytau rangelands is controlled not only by surface vegetation condition, but also by persistent subsurface constraints.
Morphological descriptions indicated that most profiles contained dense subsurface horizons with prismatic, columnar, blocky or structureless features. Root abundance generally decreased below the upper humus horizon, especially where compact solonetzic, carbonate-enriched or gypsum-bearing horizons occurred. In several profiles, carbonate effervescence began in the middle or lower part of the profile, while gypsum accumulations were observed in deeper horizons. These features point to limited vertical leaching and the persistence of salt-affected parent materials or subsurface accumulation zones.
3.1.1. Particle-Size Distribution and USDA Textural Classes
Particle-size distribution varied widely across the sampled Solonetz and Solonetzic profiles, reflecting the heterogeneous lithological and pedogenic conditions of the Ulytau rangelands. The upper horizons were generally lighter in texture, whereas many subsurface horizons contained a higher proportion of fine particles. This vertical contrast is consistent with the field morphology of the profiles, where compact, dense or weakly structured subsurface horizons were frequently recorded beneath relatively loose surface layers.
The USDA textural triangle placed most samples within the sandy loam, loam, silt loam and clay loam fields, with fewer samples falling into the clay, silty clay or sandy clay domains (Figure 2). This distribution indicates that the studied soils do not form a single textural group. Instead, they represent a broad textural continuum from relatively coarse-textured surface horizons to finer-textured solonetzic and subsolonetzic layers. Such variability is important for interpreting degradation because the same landscape unit may contain both permeable upper horizons and dense, fine-textured subsoil layers that restrict water movement and root penetration.
Several profiles had a clear increase in fine material with depth. In P-11, physical clay increased from 19.1% in the upper horizon to 44.4% in the 50–60 cm layer. In P-12, the solonetzic horizon contained 61.6% physical clay, compared with 39.7% in the surface horizon. P-13 also had a heavier subsurface layer, with physical clay rising from 30.6% in the upper horizon to 45.1% in the solonetzic horizon. These patterns point to textural differentiation as one of the main profile-scale features of the studied Solonetz soils.
The strongest clay enrichment occurred in the more strongly differentiated profiles. P-19 contained 67.1% physical clay in the surface horizon, 71.6% in the 15–25 cm layer and 80.8% in the 80–90 cm layer. Such high fine-particle contents indicate a heavy-textured profile with limited permeability and a high potential for compaction. In these profiles, texture alone can create a persistent physical constraint, even before the effects of salinity, alkalinity or exchangeable sodium are considered (Figure 2).
Thus, particle-size distribution indicates that soil physical degradation in the studied Solonetz rangelands is closely linked with profile heterogeneity. Lighter surface layers may temporarily support vegetation after rainfall, but finer and denser subsurface horizons can limit infiltration, drainage and root growth. This textural contrast provides the physical background for the salinity, sodicity and vegetation patterns discussed in the following sections.
3.1.2. Vertical Distribution of Soluble Salts
The vertical distribution of total soluble salts varied strongly among the monitored Solonetz and Solonetzic profiles. In most profiles, the surface horizons contained relatively low salt concentrations, whereas higher values occurred in the middle or lower parts of the profile. This pattern indicates that salinity was mainly expressed as a subsurface constraint rather than as a uniformly distributed surface feature.
Total soluble salts in the 0–10 cm layer were generally low, ranging from 0.037% in P-17 to 0.204% in P-20. Several profiles remained weakly saline in the upper 20 cm, including P-13 and P-14, where salt contents were below 0.06% in the upper and near-surface horizons. In contrast, P-11, P-12 and P-16 already had higher values in the upper part of the profile, suggesting stronger salt influence closer to the root zone.
A clear increase in salt content with depth was observed in several profiles. The strongest accumulation occurred in P-19, where total soluble salts increased from 0.096% in the surface horizon to 2.014% at 80–90 cm. High subsoil salinity was also recorded in P-12, with salt content rising from 0.127% at 0–10 cm to 1.749% at 80–90 cm, and in P-16, where values increased from 0.139% in the surface horizon to 1.744% at 80–90 cm. P-18 also showed strong salt accumulation, reaching 1.607% at 20–30 cm and remaining above 1.0% in deeper horizons.
Not all profiles followed the same pattern. P-13 remained nearly non-saline throughout the profile, with total soluble salts below 0.06% in all sampled horizons. P-14 and P-15 had low salt contents in the upper part of the profile but showed a gradual increase in deeper horizons, reaching 0.911% and 0.878%, respectively. This contrast suggests that the studied rangelands include both weakly saline Solonetzic profiles and profiles with pronounced subsoil salt accumulation.
The salt distribution confirms that salinity in the Ulytau Solonetz rangelands is strongly depth-dependent and spatially heterogeneous. The low salt content of many surface horizons may mask substantial subsoil salinity, which can still restrict root growth, water uptake and vegetation recovery. Together with texture and exchangeable cation composition, subsurface salt accumulation forms one of the main profile-scale controls of degradation in the studied rangelands (Figure 3).
3.1.3. Salinity–Sodicity Degradation Pathways
The ionic composition of water extracts revealed contrasting salinity patterns among the monitored Solonetz and Solonetzic profiles. The anion composition was mainly controlled by bicarbonates, chlorides and sulfates, whereas carbonate alkalinity was generally limited to fewer profiles and horizons. This indicates that salt accumulation in the studied rangelands is not uniform in chemical composition, but reflects several salinity pathways that differ among soil profiles and with depth.
Bicarbonate concentrations varied from 0.08 to 1.80 mg-eq, with the highest value recorded in P-11 at 50–60 cm. Carbonate ions were absent or very low in most horizons, but P-11 had a clear carbonate signal, reaching 1.04 mg-eq at 50–60 cm. This profile therefore represents a stronger alkalinity-related pathway, where bicarbonate and carbonate ions contribute to high pH and adverse root-zone conditions.
Chloride accumulation was most pronounced in P-12, P-18 and P-19. The maximum chloride concentration reached 19.03 mg-eq in P-12 at 30–40 cm. P-18 also had high chloride contents in the middle part of the profile, while P-19 showed strong chloride accumulation in deeper horizons. This pattern indicates that chloride salinity is mainly expressed below the surface layer and can form a hidden subsoil constraint even when the upper horizon appears only weakly saline.
Sulfate concentrations showed a similarly heterogeneous but deeper-oriented pattern. The highest sulfate content was recorded in P-19, reaching 19.83 mg-eq at 80–90 cm. Elevated sulfate values also occurred in P-12, P-14, P-16, P-18 and P-20, although the depth and intensity of accumulation differed among profiles. These results indicate that sulfate salinity is one of the dominant chemical features in the deeper horizons of several Solonetz profiles (Figure 4a).
The cation composition further separated the profiles into sodium-, calcium–magnesium- and mixed salt-accumulation types. Calcium concentrations reached 13.56 mg-eq in P-12 at 80–90 cm, while magnesium reached 4.22 mg-eq in P-12 at 60–70 cm. Sodium showed the strongest contrast among profiles and horizons, with the highest value of 20.88 mg-eq recorded in P-19 at 80–90 cm. Potassium remained low across almost all samples, with a maximum of 0.38 mg-eq in P-11 at 10–20 cm (Figure 4b).
The combination of anion and cation patterns suggests three main chemical degradation pathways. The first pathway is alkalinity-dominated, represented by profiles with elevated bicarbonate and carbonate concentrations, particularly P-11. The second pathway is chloride–sodium salinity, most clearly expressed in P-12, P-18 and P-19. The third pathway is sulfate-rich salinity, where sulfate accumulation is associated with Ca, Mg or Na depending on the profile and depth. These pathways overlap with the textural and total-salt patterns described above, confirming that Solonetz degradation in the Ulytau rangelands is chemically heterogeneous rather than controlled by a single salt type.
The results indicate that degradation in the Ulytau Solonetz rangelands is controlled by a combination of salinity and sodicity processes rather than by simple salt accumulation alone. The subsurface concentration of chloride- and sulfate-rich salts, together with sodium enrichment in several profiles, is likely to limit root activity, water uptake and plant recovery even where the surface layer appears only weakly saline. This chemical heterogeneity provides an important basis for understanding subsequent differences in vegetation cover, pasture productivity and spectral response across the monitoring sites (Figure 4).
3.2. Macronutrient Status and Vertical Distribution of Available N, P and K
The heatmap analysis revealed substantial spatial heterogeneity in macronutrient status across the monitored Solonetz rangelands. Topsoil concentrations of available nitrogen, phosphorus and potassium varied markedly among the sites, indicating that nutrient supply differed considerably even within the same general landscape setting. Available nitrogen in the topsoil ranged from low to moderate values, available phosphorus showed strong site-to-site contrast, and available potassium was generally high but also highly variable.
The topsoil heatmap showed that available nitrogen ranged from 14.0 to 50.4 mg kg−1, with the highest values recorded at sites 19 and 14, and the lowest at site 18. Available phosphorus in the upper layer ranged from 8 to 70 mg kg−1, indicating pronounced differences in phosphorus supply among the monitored soils. The highest phosphorus values were observed at sites 15, 14 and 20, whereas site 19 showed the lowest topsoil phosphorus content. Available potassium showed the broadest variation, ranging from 240 to 1000 mg kg−1. Particularly high potassium content was recorded at site 13, while comparatively lower values occurred at sites 17 and 18.
Vertical heatmaps showed that nitrogen, phosphorus and potassium did not follow the same depth pat-tern. Available phosphorus generally decreased sharply with depth, suggesting that its main accumulation was concentrated in the uppermost horizon. This pattern was consistent across most profiles and indicates strong stratification of phosphorus availability. In contrast, nitrogen showed more variable vertical behaviour. In several profiles, nitrogen decreased from the upper to the lower sampled layer, whereas in others it in-creased in the subsurface, reflecting heterogeneity in humus distribution, root-zone processes or local redistri-bution of fine material. Potassium also showed strong inter-profile variability. Although topsoil values were often high, some profiles retained substantial potassium contents in deeper horizons, while others showed a marked decline with depth.
These patterns indicate that macronutrient status in the studied Solonetz rangelands is not controlled by a single uniform process. Instead, nutrient availability reflects the interaction of humus distribution, profile differentiation, salinity–sodicity status and horizon development. The pronounced heterogeneity shown by the heatmaps supports the interpretation that soil-profile properties vary strongly over short distances and con-tribute to contrasting vegetation and productivity responses across the pasture landscape (Figure 5).
3.3. Vegetation Cover, Pasture Composition and Forage Productivity
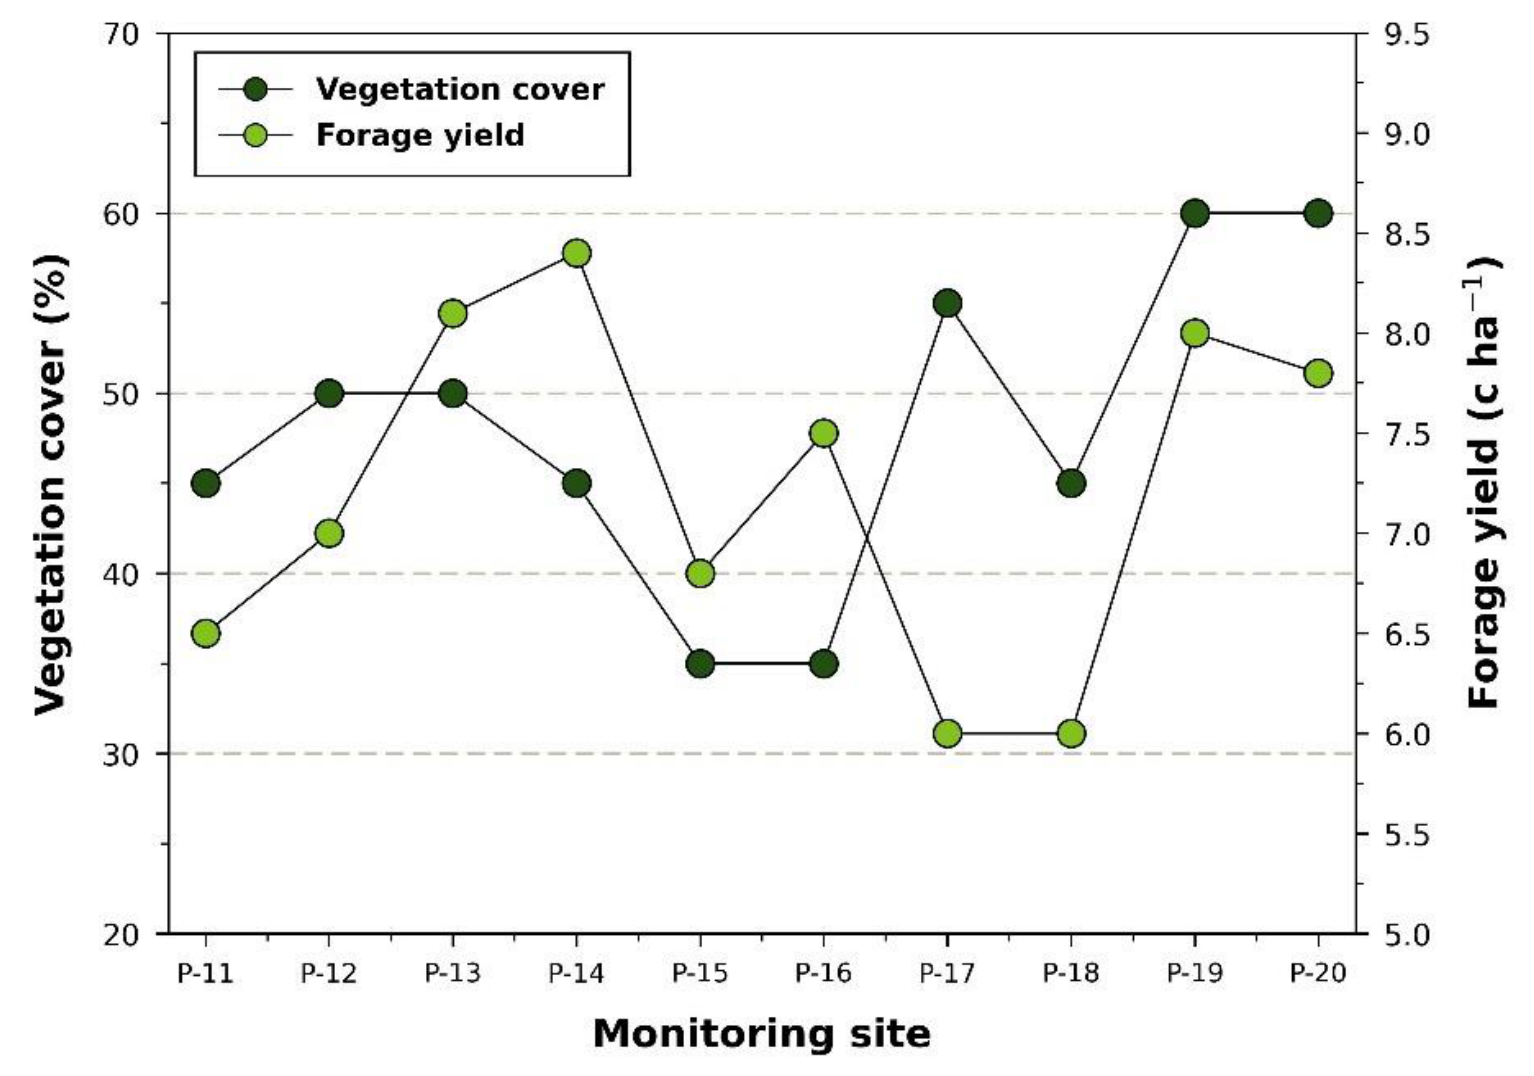
Vegetation cover across the monitored Solonetz and Solonetzic rangelands was generally sparse to moderately sparse. Vegetation cover ranged from 35% to 60%, indicating that none of the studied sites represented dense or highly productive pasture vegetation. The lowest cover values occurred in P-15 and P-16, where vegetation covered only 35% of the surface. Higher cover values, reaching 55–60%, were recorded in P-17, P-19 and P-20. Forage yield varied from 6.0 to 8.4 c ha⁻¹, with the lowest values recorded in P-17 and P-18 and the highest value in P-14 (Figure 7).
Pasture communities were dominated by xerophytic and halophytic species typical of arid Solonetz landscapes. Wormwood-dominated communities were widespread, often occurring together with Kochia, Anabasis, Leymus, Achnatherum, Stipa, Climacoptera and ephemeral species. The botanical composition differed among sites, but the general pattern was consistent: plant communities were relatively simple, drought-adapted and tolerant of poor soil physical and chemical conditions. This composition reflects the combined influence of aridity, grazing pressure and soil constraints (Figure 6).
Forage yield was low across most monitoring sites. Excluding the unverified value reported for P-20, pasture biomass ranged from 6.0 to 8.4 c ha⁻¹. The lowest yields were recorded in the crusted Solonetz profiles P-17 and P-18, where yield was approximately 6.0 c ha⁻¹. P-11 also had low productivity, with 6.5 c ha⁻¹, despite a relatively higher humus content in the surface horizon (Figure 7). This indicates that topsoil fertility alone did not control pasture productivity. Subsurface salinity, alkalinity, dense horizons and exchangeable sodium or magnesium saturation also limited vegetation performance.
Relatively higher yields occurred in P-13, P-14 and P-19, where forage productivity reached about 8.0–8.4 c ha⁻¹. These sites differed in soil conditions, suggesting that vegetation response was not controlled by a single degradation indicator. For example, some profiles with high salinity or clay accumulation still supported moderate vegetation cover, while other sites with lower salt contents had reduced cover because of alkalinity, magnesium saturation or compact subsurface horizons. This pattern supports the interpretation that vegetation productivity in Solonetz rangelands is shaped by combined profile-scale constraints rather than by salinity or sodicity alone.
Forage-quality indicators also varied among the sites. Crude protein content generally remained within a moderate range, mostly around 13.6–17.3% in air-dry plant material. Crude fibre was relatively stable, commonly close to 30–33%, while ash content varied more strongly among sites. Feed unit values were generally low to moderate, ranging around 0.50–0.60 per kg of forage, and metabolizable energy was mostly within the range of about 7.1–8.6 MJ. These values suggest that degradation was expressed more clearly through limited biomass production and sparse cover than through a complete loss of forage nutritional value.
The vegetation data therefore provide a biological link between soil-profile degradation and surface spectral response. Sparse cover and low forage productivity increase the proportion of exposed soil surface, which is directly relevant for interpreting Sentinel-2A MSAVI patterns. At the same time, the absence of a simple one-to-one relationship between soil salinity, vegetation cover and yield shows that field-calibrated interpretation is necessary. In these rangelands, vegetation condition reflects the combined effects of texture, salinity, alkalinity, exchangeable cation composition and local pasture structure.
Figure 7.
Relationship between vegetation cover and forage yield across the monitored Solonetz and Solonetzic rangeland sites.
Figure 7.
Relationship between vegetation cover and forage yield across the monitored Solonetz and Solonetzic rangeland sites.
3.4. Spectral Response of Solonetz Rangelands to Vegetation–Soil Surface Conditions
3.4.1. Sentinel-2A MSAVI Response to Vegetation-Soil Surface Conditions
Sentinel-2A-derived MSAVI values varied among the monitored Solonetz and Solonetzic rangeland sites, reflecting differences in vegetation cover, exposed soil surface and local spectral conditions. Across the ten monitoring sites, MSAVI ranged from 0.0888 to 0.2148, with a mean value of 0.1248. These generally low values are consistent with the sparse vegetation cover observed in the field and with the high proportion of exposed soil surface typical of arid Solonetz rangelands.
The highest MSAVI value was recorded at P-11, while the lowest value occurred at P-20. Intermediate values were observed across the remaining sites, indicating that the spectral response was not controlled by a single soil property. Instead, MSAVI appeared to reflect the combined surface expression of vegetation density, soil exposure, pasture patchiness and soil background reflectance. This is important for the studied landscape, where Solonetz degradation is expressed as a mosaic of vegetated patches, bare soil, crusted surfaces and salt-affected microsites.
The comparison between field vegetation observations and MSAVI suggests that the index is useful as a site-level indicator of vegetation–soil surface condition, but it should not be interpreted as a direct measure of salinity or sodicity. Low MSAVI values indicate reduced vegetation signal and stronger soil-background influence, whereas higher values may reflect localized vegetation patches, recent moisture conditions or differences in surface roughness and reflectance. For this reason, MSAVI was treated as a field-calibrated spectral proxy rather than as an independent diagnostic indicator of Solonetz degradation.
The field photographs and vegetation data help explain the MSAVI response. Sites with sparse vegetation, patchy cover and visible bare soil contributed to lower spectral greenness, while sites with more continuous vegetation cover produced relatively stronger MSAVI responses. However, the relationship was not strictly linear because the spectral signal integrates several surface properties within a Sentinel-2A pixel. In Solonetz landscapes, these properties include plant cover, standing dry biomass, exposed mineral soil, salt-affected surfaces and microrelief.
The use of MSAVI is appropriate for this study because NDVI can be strongly influenced by soil background under sparse arid vegetation. By reducing the influence of exposed soil reflectance, MSAVI provides a more suitable index for distinguishing vegetation–soil surface conditions in degraded rangelands. Nevertheless, the current MSAVI values should be interpreted conservatively because they represent site-level spectral values rather than full polygon-based statistics. A stronger field–satellite calibration would require mean, median, standard deviation and pixel count values for each monitoring contour.
Thus, Sentinel-2A MSAVI captured the low vegetation signal and surface heterogeneity of the studied Solonetz rangelands. The spectral response supports the field-based interpretation that degradation is expressed not only through soil-profile constraints, but also through sparse vegetation cover and increased exposure of the soil surface. This provides the basis for the MSAVI-based mapping of Solonetz degradation patterns in the following section (Figure 8).
3.4.2. Long-Term NDVI–Albedo–LST Dynamics of Solonetz Degradation
The Landsat-8 NDVI–Albedo–LST time series provided a long-term spectral–thermal context for interpreting the surface expression of Solonetz degradation. While Sentinel-2A MSAVI was used to characterize site-level vegetation–soil surface response, the Landsat-based indicators described interannual summer variability in vegetation greenness, surface reflectance and thermal stress from 2013 to 2025.
During the summer periods of 2013–2025, NDVI values remained consistently low, ranging from 0.1969 to 0.3085. The highest NDVI values occurred in 2015–2016, while the lowest value was recorded in 2014. Even in the most favourable years, NDVI did not exceed 0.31, indicating that vegetation productivity was structurally limited rather than controlled only by short-term climatic variability. This pattern agrees with the field observations, where pasture cover was generally sparse to moderately sparse and exposed soil surface was common.
Surface albedo showed a narrower range than NDVI, varying from 0.1663 to 0.2195. The relatively limited interannual variation suggests that the reflective properties of the surface were more stable than vegetation greenness. Higher albedo values may reflect greater exposure of bare or salt-affected surfaces, whereas lower values may correspond to wetter conditions or partial vegetation cover. However, albedo was treated as a complementary surface indicator rather than as a direct measure of salinity.
LST showed the strongest interannual variability, ranging from 38.0 to 51.0 °C. The highest LST occurred in 2014, when NDVI was also at its minimum. Additional thermal peaks were observed in 2017, 2019, 2022, 2023 and 2025. These high surface temperatures are consistent with sparse vegetation, reduced shading and a larger proportion of exposed soil surface. In Solonetz rangelands, such thermal behaviour is important because surface heating can intensify evaporation and contribute to the persistence of salt accumulation near or within the root zone.
The relationship between NDVI and LST was negative at the interannual scale, indicating that years with stronger vegetation greenness tended to have lower surface temperatures. In contrast, the relationship between albedo and LST was weak. This suggests that vegetation cover had a stronger cooling effect than albedo variation alone. The combined spectral–thermal response therefore supports the field-based interpretation that degradation is expressed through reduced vegetation signal, exposed soil surfaces and high thermal stress.
The integration of NDVI, albedo and LST should not be interpreted as a direct diagnosis of salinity or sodicity. Instead, these indicators describe the surface consequences of degradation. Low vegetation greenness, variable albedo and elevated LST together characterize the spectral–thermal signature of degraded Solonetz rangelands. This long-term evidence strengthens the interpretation of MSAVI-based results by showing that the monitored landscape has remained within a low-productivity and high-thermal-stress state over more than a decade (Figure 9).
3.5. Relationships Between Soil-Profile Constraints, Vegetation Indicators and MSAVI
The relationships between soil-profile constraints, vegetation indicators and Sentinel-2A-derived MSAVI were analysed using Pearson correlation, PCA and RDA. The analysis included ten monitoring sites; therefore, the results were interpreted as exploratory evidence of soil–vegetation–spectral linkages rather than as a predictive statistical model.
Pearson correlation analysis revealed several moderate to strong relationships among soil-profile properties, vegetation indicators and MSAVI (Figure 10). Maximum physical clay content was positively correlated with maximum soluble salt content (r = 0.72), indicating that profiles with heavier subsurface texture tended to accumulate more soluble salts. Exchangeable sodium percentage was strongly associated with cation exchange capacity (r = 0.78), while its relationship with magnesium saturation was negative (r = -0.68). These correlations indicate that sodicity-related constraints differed among profiles depending on the balance between Na-dominated and Mg-influenced exchange complexes.
The relationship between MSAVI and soil-profile variables was more complex. MSAVI was positively correlated with topsoil humus content (r = 0.73), suggesting that sites with relatively higher organic matter in the surface layer tended to produce a stronger spectral vegetation signal. At the same time, MSAVI had negative relationships with maximum soluble salts (r = -0.47), maximum clay content (r = -0.33) and forage yield (r = -0.52), although these relationships were not statistically significant at p < 0.05. This pattern confirms that MSAVI should not be treated as a direct proxy for forage productivity or salinity. Instead, it reflects the integrated surface condition of vegetation cover, exposed soil, dry biomass and soil-background reflectance.
Vegetation cover and forage yield were only weakly correlated with each other (r = 0.19), which suggests that visual cover and biomass production did not respond identically to soil constraints. Some sites supported relatively higher vegetation cover but had lower forage yield, while other sites had moderate cover with better productivity. This mismatch is typical of degraded arid rangelands, where plant density, species composition, standing dry material and soil-surface exposure can vary independently.
To evaluate the multivariate structure of these relationships, PCA was applied to the soil-profile, vegetation and spectral variables (Figure 11a). The first two principal components accounted for 65.5% of the total variance, with PC1 explaining 35.6% and PC2 explaining 29.9%. PC1 mainly separated profiles with stronger salt accumulation, high CEC and ESP from profiles with higher Mg saturation, forage yield and pH-related variation. PC2 was strongly influenced by MSAVI and topsoil humus, separating P-11 from the remaining sites because of its relatively high MSAVI and humus content.
The PCA ordination also separated several soil degradation pathways. Sites such as P-18 and P-19 were positioned in the direction of higher salt accumulation and stronger exchange-complex constraints. P-12 and P-17 were associated more closely with ESP and CEC. In contrast, P-13, P-14, P-15, P-16 and P-20 occupied the opposite part of the ordination space, indicating different combinations of lower sodicity, Mg influence, forage yield or pH-related conditions. This separation supports the interpretation that Solonetz degradation in the study area is not expressed through a single linear gradient.
RDA was then used to examine how selected soil-profile constraints were related to vegetation cover, forage yield and MSAVI (Figure 11b). The explanatory variables included maximum ESP, maximum soluble salt content, maximum physical clay content and maximum pH. Together, these variables accounted for 58% of the variation in the response matrix. RDA1 explained 70.4% of the constrained variation, while RDA2 explained 26.1%.
The RDA ordination separated the response variables along different soil-constraint directions. MSAVI was positioned away from forage yield and vegetation cover, confirming that the spectral signal did not simply reproduce field biomass or cover patterns. Forage yield was placed in the opposite direction from several stronger profile constraints, whereas vegetation cover was more closely aligned with clay and salinity-related gradients. These relationships indicate that surface vegetation condition and spectral response are linked with soil-profile properties, but the linkage is mediated by patchy vegetation structure and heterogeneous soil-surface conditions.
The correlation and ordination analyses confirm that degradation in the Ulytau Solonetz rangelands is controlled by interacting profile-scale constraints rather than by one dominant factor. Texture, salinity, sodicity, alkalinity and exchangeable cation composition jointly shape vegetation condition and MSAVI response. The statistical results support the field interpretation that the studied rangelands form a heterogeneous degradation mosaic, where soil-profile properties, vegetation cover and spectral response need to be analysed together.
3.6. MSAVI-Based Mapping of Solonetz Degradation Patterns
The MSAVI-based map revealed a spatially heterogeneous pattern of Solonetz rangeland degradation across the study area. Low MSAVI values were not distributed as a continuous zone, but formed a mosaic of patches corresponding to sparse vegetation cover, exposed soil surfaces and field-confirmed Solonetzic soil conditions. This spatial pattern is consistent with the field observations, where vegetation cover, surface crusting, salinity and soil-profile differentiation varied strongly among monitoring sites.
The lowest MSAVI zones were interpreted as areas with reduced vegetation signal and stronger soil-background influence. These areas were mainly associated with sparse or patchy pasture cover, exposed mineral soil, crusted surfaces and salt-affected microsites. In contrast, areas with relatively higher MSAVI values corresponded to patches with stronger vegetation signal or locally denser green biomass. The map therefore reflects the surface expression of degradation rather than a direct map of salinity, sodicity or soil texture.
The field monitoring sites provided the basis for interpreting the mapped MSAVI classes. Sites with low MSAVI values were linked with field evidence of vegetation decline, exposed soil surface and profile-scale constraints such as salinity, clay accumulation, alkalinity or exchangeable cation imbalance. However, the relationship between MSAVI and soil degradation was not one-to-one. Some sites with strong subsurface constraints retained moderate vegetation cover, while other sites with lower visible salinity showed weak spectral response because of patchy vegetation or high soil-surface exposure. This confirms that MSAVI-based mapping should be interpreted together with field soil and vegetation data.
The resulting map identified degraded Solonetz rangelands as spatially fragmented units rather than as a uniform degradation belt. This is important for management because restoration or grazing regulation cannot be planned only at the level of broad soil units. Instead, the mapped pattern points to localized degradation hotspots where low vegetation signal coincides with Solonetzic profile constraints. Such areas may require priority monitoring, grazing-pressure control or site-specific reclamation measures.
The MSAVI-based classification was treated as a field-calibrated regional assessment. Nevertheless, under sparse arid vegetation, MSAVI provides a useful basis for mapping vegetation–soil surface conditions because it reduces soil-background effects more effectively than NDVI. In this study, it served as the main spatial indicator for detecting surface degradation patterns associated with Solonetz rangelands.
The mapping results show that Sentinel-2A MSAVI can support regional diagnosis of degraded Solonetz rangelands when combined with field soil-profile observations. The integration of MSAVI mapping with soil texture, salinity, sodicity and vegetation data provides a more reliable interpretation of degradation than satellite data alone. This combined approach links subsurface soil constraints with surface spectral patterns and strengthens the spatial assessment of Solonetz degradation in the Ulytau region (Figure 12).
3.7. Summary of Degradation Mechanisms Across the Studied Rangelands
4. Discussion
4.1. Soil-Profile Controls of Solonetz Degradation in Arid Rangelands
The results indicate that degradation in the studied Solonetz rangelands is primarily controlled by soil-profile properties rather than by surface vegetation condition alone. Although sparse vegetation, exposed soil and patchy pasture cover were visible at the surface, the main constraints were linked with subsurface clay enrichment, soluble salt accumulation, alkaline reaction and exchangeable cation imbalance. This combination is typical of salt-affected and sodic soils, where plant performance is influenced not only by salinity in the soil solution, but also by structural degradation, limited infiltration and poor root-zone conditions [9,35,36].
The particle-size distribution and USDA textural triangle indicated that the monitored profiles were not texturally uniform. Several profiles had lighter surface horizons over denser, finer-textured subsurface layers. Such vertical differentiation is important in arid rangelands because plant growth depends strongly on short pulses of available soil moisture after rainfall. Dense solonetzic horizons can restrict infiltration, slow drainage and limit root penetration, even where the surface layer appears relatively favourable [37,38,39].
The positive relationship between maximum physical clay content and soluble salt accumulation suggests that texture and salinity acted together in several profiles. Clay-enriched horizons may slow leaching and favour salt retention within or below the active root zone. At the same time, salinity can intensify plant water stress, while sodicity can alter structure through clay swelling and dispersion. These processes are often discussed separately, but in Solonetz landscapes they usually operate as a combined profile constraint [9,13,40].
Exchangeable cation composition also separated the profiles into different degradation pathways. Some profiles were clearly Na-dominated, with high ESP and CEC, whereas others had low ESP but high Mg saturation. This distinction is important because Solonetz degradation is often simplified as a sodium problem, while Mg-rich exchange complexes may also contribute to poor structure and low aggregate stability, particularly in clay-rich horizons. The coexistence of Na-dominated, Mg-influenced and mixed salinity–alkalinity–textural pathways explains why vegetation cover and forage yield did not respond to one soil indicator in a simple linear way.
These patterns suggest that Solonetz degradation in the Ulytau region should be interpreted as a mosaic of profile-controlled degradation pathways. The main mechanism is not salinity or sodicity alone, but the interaction between textural differentiation, salt redistribution, alkalinity and exchangeable cation imbalance. This interpretation is important for mapping and management because surface indicators, including vegetation cover and MSAVI, can only be interpreted reliably when linked to field-confirmed soil-profile conditions.
4.2. Salinity–Sodicity Pathways and Vegetation Response
The ionic composition of water extracts showed that salinity in the studied rangelands differed not only in intensity, but also in chemical type and depth distribution. This matters because chloride-, sulfate- and bicarbonate-dominated salinity can affect plants through different pathways. Chloride and sulfate accumulation mainly increase osmotic stress and reduce water uptake, whereas bicarbonate–carbonate alkalinity is more closely associated with high pH, nutrient imbalance and adverse root-zone chemistry [4,7,11,41].
Several profiles had low salt content in the surface horizon but much stronger salt accumulation in subsurface layers. This vertical pattern is typical for arid and semi-arid soils where limited leaching, high evaporation and redistribution of salts maintain saline or sodic horizons below the surface. Ecologically, such subsurface salinity may be more important than surface salinity because plant roots encounter chemical stress as they extend downward after rainfall events [9,36,39].
The vegetation response was therefore shaped by both surface and subsurface constraints. Low surface salinity did not necessarily indicate favourable conditions for plant growth, because deeper saline or sodic horizons could still restrict rooting depth and water uptake. This explains why some profiles with apparently weak surface salinity had limited productivity, whereas other profiles with strong subsurface constraints still supported moderate vegetation cover in patches. Such spatial decoupling is common in drylands, where vegetation responds to local soil moisture, crusting, grazing pressure and root-zone limitations [1,42,43].
The dominance of xerophytic and halophytic species also supports the interpretation that plant communities are filtered by soil chemical and physical constraints. Wormwood-, Kochia-, Anabasis- and Climacoptera-associated communities indicate adaptation to aridity, salinity and poor soil physical conditions. These communities may stabilize the surface to some extent, but they also reflect a shift toward stress-tolerant vegetation rather than high-productivity pasture assemblages [44,45,46].
The weak relationship between vegetation cover and forage yield is also meaningful. Cover and biomass are not interchangeable indicators in degraded rangelands. A site may have moderate visual cover because of low-growing halophytes or dry standing material, but still produce limited forage biomass. Conversely, relatively productive patches may occur within otherwise sparse vegetation. This explains why soil-profile interpretation is necessary for understanding vegetation performance in Solonetz rangelands.
4.3. Nutrient Status and Pasture Productivity Under Profile-Scale Constraints
The N, P and K heatmaps added another layer to the interpretation of pasture productivity. Available macronutrients were spatially heterogeneous across monitoring sites and varied with depth. This pattern is expected in degraded rangelands because nutrient availability is influenced by organic matter distribution, root inputs, erosion, grazing-mediated biomass redistribution, soil texture and salinity. In the studied soils, nutrient status was not uniformly poor, but it was unevenly distributed and superimposed on stronger physical and chemical profile constraints.
Topsoil humus was positively associated with MSAVI, suggesting that better surface organic matter conditions may contribute to stronger vegetation signal. However, humus alone did not explain forage yield. This is consistent with the profile-scale nature of Solonetz constraints: even where surface organic matter is relatively higher, deeper clay-rich, saline or sodic horizons can restrict rooting and reduce water availability. Under such conditions, topsoil fertility may support local vegetation patches but cannot fully overcome subsurface limitations [9,35,47].
Available phosphorus was highly variable among sites. In alkaline and calcareous soils, phosphorus availability may be restricted by precipitation and sorption processes, even when total phosphorus is not necessarily low. Salinity and sodicity can further disturb nutrient uptake by altering root function and ion balance. Therefore, NPK patterns should be interpreted together with pH, soluble salts and exchangeable cation composition rather than as independent fertility indicators.
Potassium was generally less limiting than nitrogen or phosphorus, but high K availability does not automatically imply higher pasture productivity under Solonetz conditions. In salt-affected soils, plant performance is often controlled by osmotic stress, ion imbalance, poor aeration, low hydraulic conductivity and restricted rooting rather than by a single nutrient. This helps explain why productivity remained low even where one or more macronutrients were not critically depleted [11,14].
From a management perspective, these results suggest that fertilizer-based improvement alone would be insufficient. Where dense solonetzic horizons, salinity or sodicity limit rooting and moisture access, nutrient amendments may have low efficiency unless soil physical and chemical constraints are also addressed. Sustainable improvement would require site-specific measures that consider grazing pressure, surface cover maintenance, salt accumulation, soil structure and the depth of restrictive horizons.
4.4. MSAVI as a Field-Calibrated Spectral Proxy in Sparse Solonetz Rangelands
MSAVI was suitable for the studied rangelands because vegetation cover was sparse and soil background strongly affected the spectral signal. In low-cover environments, conventional greenness indices may respond not only to vegetation, but also to exposed soil reflectance, surface brightness, salts, crusting and moisture. Soil-adjusted indices were developed to reduce this problem, and MSAVI is especially useful where vegetation is sparse and the soil contribution is large [48,49,50,51].
The low MSAVI values recorded across the monitoring sites are consistent with field observations of sparse cover and exposed soil. However, MSAVI did not follow vegetation cover or forage yield in a strictly linear way. This is expected because a Sentinel-2A pixel integrates green vegetation, dry biomass, bare soil, crusted surfaces, salt-affected patches and microtopographic variation. MSAVI should therefore be interpreted as an integrated vegetation–soil surface signal, not as a direct measure of biomass, salinity or sodicity.
The positive relationship between MSAVI and topsoil humus suggests that sites with better surface conditions may produce stronger spectral vegetation response. At the same time, the negative relationships between MSAVI and salts or clay point to the indirect influence of subsurface degradation. These relationships were moderate and exploratory, but ecologically meaningful: MSAVI appears to capture the surface expression of profile degradation, even though it cannot identify the subsurface mechanism by itself.
This distinction is central for remote-sensing interpretation in Solonetz landscapes. Satellite indices can detect visible expressions of degradation, such as reduced greenness, exposed soil and vegetation patchiness. They cannot, on their own, determine whether the underlying cause is salinity, sodicity, alkalinity, clay accumulation or grazing pressure. For this reason, remote-sensing assessment of salt-affected drylands needs field calibration with soil profiles and vegetation observations [21,22,52,53].
The site-level MSAVI dataset is a limitation, but it provides a useful first link between field observations and Sentinel-2A response. For stronger calibration, future studies should extract polygon-level MSAVI statistics for each monitoring contour, including mean, median, standard deviation and pixel count. Such statistics would better represent within-site heterogeneity and reduce the risk of interpreting a single pixel or point value as representative of a whole degradation unit.
4.5. Implications for Mapping, Monitoring and Rangeland Management
The combined field and remote-sensing results indicate that Solonetz degradation in the Ulytau region should be managed as a spatially heterogeneous mosaic. The MSAVI map, field photographs and soil-profile data all point to patchiness rather than uniform degradation. Broad soil units or administrative pasture boundaries are therefore insufficient for identifying where degradation is most severe. Management decisions need to account for local variation in surface cover, subsurface salinity, sodicity and texture.
The most vulnerable areas are likely those where low vegetation signal coincides with restrictive soil-profile properties. Such areas may have sparse cover, exposed mineral soil, crusted surfaces and salt-affected subsurface horizons. Reduced vegetation cover increases soil exposure, while poor structure and salinity restrict vegetation recovery. Once this feedback develops, grazing pressure, drought and surface sealing can reinforce degradation [1,42,43,54].
The results also suggest that reclamation or pasture improvement should not be uniform across the landscape. Na-dominated profiles, Mg-influenced profiles and chloride- or sulfate-rich saline profiles may require different management approaches. High-sodicity sites may need measures aimed at improving structure and reducing dispersion, whereas saline subsurface layers may require strategies that maintain vegetation cover, reduce evaporation-driven salt accumulation and improve water redistribution. Field-scale monitoring of salinity would also benefit from complementary soil electrical conductivity surveys, because electrical conductivity measurements can improve interpretation of spatial salinity variation and support targeted management decisions [58].
In practical rangeland settings, intensive engineering reclamation may be unrealistic. Monitoring, grazing regulation and targeted restoration of vegetation cover may therefore be more feasible than uniform reclamation. Sentinel-2A MSAVI can support such targeting by identifying areas of weak vegetation signal, while field soil data can explain the degradation mechanism behind the spectral pattern. Remote sensing provides spatial coverage; field profiles provide process understanding.
The approach is relevant beyond the Ulytau region. Many arid and semi-arid rangelands in Central Asia contain salt-affected soils, heterogeneous grazing pressure and strong vegetation–soil feedbacks. Degradation assessment in such landscapes should combine field morphology, soil chemistry, vegetation data and satellite indices. The present study contributes to this need by linking Solonetz profile constraints with Sentinel-2A spectral response at the local-to-regional scale [25,55,56,57,59,60,61]. Because vegetation indices may respond differently under sparse-cover conditions, future applications should compare MSAVI with fractional vegetation cover relationships and other vegetation-index formulations [62,63]. Multi-temporal satellite approaches could also help separate persistent degradation patterns from short-term seasonal variation in vegetation activity and surface salinity expression [64,65].
5. Conclusions
Degradation of Solonetz and Solonetzic rangelands in the Ulytau region is shaped by interacting soil-profile constraints rather than by a single visible surface feature. The monitored profiles differed markedly in texture, soluble salt accumulation, alkalinity and exchangeable cation composition. In several cases, the surface horizons were only weakly saline, whereas deeper layers contained higher salt concentrations, heavier texture and stronger sodicity-related limitations. This confirms the need to assess these rangelands through the whole soil profile, not only through topsoil or vegetation observations.
The combination of field surveys, laboratory analyses and Sentinel-2A MSAVI helped link subsurface soil conditions with their surface expression. Low MSAVI values reflected reduced vegetation signal and stronger soil-background influence, but they did not directly indicate salinity, sodicity or forage productivity. MSAVI was therefore most useful as a field-calibrated spectral proxy for vegetation–soil surface condition, especially when interpreted together with soil-profile data, pasture observations and productivity measurements.
The studied rangelands formed a clear degradation mosaic. Na-dominated, Mg-influenced and mixed salinity–alkalinity–textural pathways occurred within the same landscape. This explains why vegetation cover, forage yield and spectral response did not follow one simple gradient. Similar surface conditions may result from different subsurface mechanisms, while similar soil constraints may lead to different vegetation responses depending on local cover, plant composition and soil-surface exposure.
From a management perspective, uniform reclamation or pasture improvement strategies are unlikely to be effective. Priority should be given to areas where sparse vegetation cover, low MSAVI response and restrictive Solonetzic profile properties coincide. These areas require targeted monitoring, grazing-pressure regulation and site-specific restoration measures aimed at maintaining vegetation cover, reducing exposed soil surface and preventing further salt- and sodicity-related degradation.
Combining soil-profile diagnostics with Sentinel-2A MSAVI mapping provides a practical framework for assessing degraded Solonetz rangelands in arid regions. This approach connects subsurface soil constraints with vegetation and spectral patterns, offering a stronger basis for monitoring, mapping and managing pasture degradation in Central Kazakhstan.
Author Contributions
Conceptualization, K.E., R.R. and K.K.; methodology, K.K., K.P. and R.R.; software, K.K. and I.B.; validation, R.R., B.N., K.P. and G.S.; formal analysis, K.K. and K.P.; investigation, K.E., S. K., A.N., A.A., N.A. and K.K.; resources, R.R., B.N. and G.S.; data curation, K.K., I.B. and I.A.; writing—original draft preparation, K.E. and K.K.; writing—review and editing, R.R., B.N., K.P., G.S. and K.K.; visualization, K.K. and I.B.; supervision, S.K., B.N., K.P..; project administration, S.K, B.N. and K.E.; funding acquisition, S.K. and B.N. All authors have read and agreed to the published version of the manuscript.
Funding
This study was funded by the Ministry of Agriculture of the Republic of Kazakhstan within the framework of the STPBR22883585 “Development of effective technologies for increasing the productive potential and rational use of pastures”, for the event: “Creation of database of solonetz lands on pastures using GIS technologies by geographic or climatic zones of Kazakhstan.
Data Availability Statement
The original contributions presented in this study are included in the article. Further inquiries can be directed to the corresponding author.
Conflicts of Interest
The authors declare no conflicts of interest.
Abbreviations
| CEC | Cation exchange capacity |
| ESP | Exchangeable sodium percentage |
| LST | Land surface temperature |
| MSAVI | Modified soil-adjusted vegetation index |
| NDVI | Normalized difference vegetation index |
| NIR | Near-infrared reflectance |
| PCA | Principal component analysis |
| RDA | Redundancy analysis |
| USDA | United States Department of Agriculture |
References
- Reynolds, J.F.; Stafford Smith, D.M.; Lambin, E.F.; Turner, B.L.; Mortimore, M.; Batterbury, S.P.J.; et al. Global desertification: Building a science for dryland development. Science 2007, 316, 847–851. [CrossRef]
- D’Odorico, P.; Bhattachan, A.; Davis, K.F.; Ravi, S.; Runyan, C.W. Global desertification: Drivers and feedbacks. Adv. Water Resour. 2013, 51, 326–344. [CrossRef]
- Abrol, I.P.; Yadav, J.S.P.; Massoud, F.I. Salt-Affected Soils and Their Management; FAO Soils Bulletin 39; Food and Agriculture Organization of the United Nations: Rome, Italy, 1988.
- Szabolcs, I. Salt-Affected Soils; CRC Press: Boca Raton, FL, USA, 1989.
- FAO. Global Map of Salt-Affected Soils, Version 1.0; Food and Agriculture Organization of the United Nations: Rome, Italy, 2021.
- Ramazanova, R.; Kozybayeva, F.; Beiseyeva, G.; Saparov, G.; Kulymbet, K.; Tanirbergenov, S. Spatial assessment of agro-landscape soil pollution by phosphorite plant emissions in semi-arid conditions. J. Ecol. Eng. 2026, 27, 235–248. [CrossRef]
- Richards, L.A. Diagnosis and Improvement of Saline and Alkali Soils; USDA Agriculture Handbook 60; United States Department of Agriculture: Washington, DC, USA, 1954.
- Sumner, M.E.; Naidu, R., Eds. Sodic Soils: Distribution, Properties, Management, and Environmental Consequences; Oxford University Press: New York, NY, USA, 1998.
- Rengasamy, P. Soil processes affecting crop production in salt-affected soils. Funct. Plant Biol. 2010, 37, 613–620. [CrossRef]
- Qadir, M.; Oster, J.D. Crop and irrigation management strategies for saline-sodic soils and waters aimed at environmentally sustainable agriculture. Sci. Total Environ. 2004, 323, 1–19. [CrossRef]
- Munns, R.; Tester, M. Mechanisms of salinity tolerance. Annu. Rev. Plant Biol. 2008, 59, 651–681. [CrossRef]
- Qadir, M.; Ghafoor, A.; Murtaza, G. Amelioration strategies for saline soils: A review. Land Degrad. Dev. 2000, 11, 501–521. [CrossRef]
- Qadir, M.; Oster, J.D.; Schubert, S.; Noble, A.D.; Sahrawat, K.L. Phytoremediation of sodic and saline-sodic soils. Adv. Agron. 2007, 96, 197–247. [CrossRef]
- Shrivastava, P.; Kumar, R. Soil salinity: A serious environmental issue and plant growth-promoting bacteria as one of the tools for its alleviation. Saudi J. Biol. Sci. 2015, 22, 123–131. [CrossRef]
- IUSS Working Group WRB. World Reference Base for Soil Resources. International Soil Classification System for Naming Soils and Creating Legends for Soil Maps, 4th ed.; International Union of Soil Sciences: Vienna, Austria, 2022.
- FAO. Lecture Notes on the Major Soils of the World; World Soil Resources Reports 94; Food and Agriculture Organization of the United Nations: Rome, Italy, 2001.
- Miller, J.J.; Brierley, J.A. Solonetzic soils of Canada: Genesis, distribution, and classification. Can. J. Soil Sci. 2011, 91, 889–902. [CrossRef]
- Vorob’eva, L.A.; Pankova, E.I. Saline-alkali soils of Russia. Eurasian Soil Sci. 2008, 41, 457–470. [CrossRef]
- Saparov, A. Soil resources of the Republic of Kazakhstan: Current status, problems and solutions. In Novel Measurement and Assessment Tools for Monitoring and Management of Land and Water Resources in Agricultural Landscapes of Central Asia; Mueller, L., Saparov, A., Lischeid, G., Eds.; Springer: Cham, Switzerland, 2014; pp. 61–73.
- Issanova, G.T.; Abuduwaili, J.; Mamutov, Z.U.; Kaldybaev, A.A.; Saparov, G.A.; Bazarbaeva, T.A. Saline soils and identification of salt accumulation provinces in Kazakhstan. Arid Ecosyst. 2017, 7, 243–250. [CrossRef]
- Metternicht, G.I.; Zinck, J.A. Remote sensing of soil salinity: Potentials and constraints. Remote Sens. Environ. 2003, 85, 1–20. [CrossRef]
- Allbed, A.; Kumar, L. Soil salinity mapping and monitoring in arid and semi-arid regions using remote sensing technology: A review. Adv. Remote Sens. 2013, 2, 373–385. [CrossRef]
- Farifteh, J.; van der Meer, F.; Atzberger, C.; Carranza, E.J.M. Quantitative analysis of salt-affected soil reflectance spectra: A comparison of two adaptive methods. Remote Sens. Environ. 2007, 110, 59–78. [CrossRef]
- Mulder, V.L.; de Bruin, S.; Schaepman, M.E.; Mayr, T.R. The use of remote sensing in soil and terrain mapping: A review. Geoderma 2011, 162, 1–19. [CrossRef]
- Scudiero, E.; Skaggs, T.H.; Corwin, D.L. Regional-scale soil salinity assessment using Landsat ETM+ canopy reflectance. Remote Sens. Environ. 2015, 169, 335–343. [CrossRef]
- Ivushkin, K.; Bartholomeus, H.; Bregt, A.K.; Pulatov, A.; Kempen, B.; de Sousa, L. Global mapping of soil salinity change. Remote Sens. Environ. 2019, 231, 111260. [CrossRef]
- Rouse, J.W.; Haas, R.H.; Schell, J.A.; Deering, D.W. Monitoring vegetation systems in the Great Plains with ERTS. In Proceedings of the Third Earth Resources Technology Satellite-1 Symposium; NASA SP-351; NASA: Washington, DC, USA, 1974; pp. 309–317.
- Tucker, C.J. Red and photographic infrared linear combinations for monitoring vegetation. Remote Sens. Environ. 1979, 8, 127–150. [CrossRef]
- Li, Z.-L.; Tang, B.-H.; Wu, H.; Ren, H.; Yan, G.; Wan, Z.; Trigo, I.F.; Sobrino, J.A. Satellite-derived land surface temperature: Current status and perspectives. Remote Sens. Environ. 2013, 131, 14–37. [CrossRef]
- Sun, D.; Kafatos, M. Note on the NDVI–LST relationship and the use of temperature-related drought indices over North America. Geophys. Res. Lett. 2007, 34, L24406. [CrossRef]
- Karnieli, A.; Agam, N.; Pinker, R.T.; Anderson, M.; Imhoff, M.L.; Gutman, G.G.; Panov, N.; Goldberg, A. Use of NDVI and land surface temperature for drought assessment: Merits and limitations. J. Clim. 2010, 23, 618–633. [CrossRef]
- Bento, V.A.; Gouveia, C.M.; DaCamara, C.C.; Trigo, I.F. The roles of NDVI and land surface temperature when using the Vegetation Health Index over dry regions. Glob. Planet. Chang. 2020, 190, 103198. [CrossRef]
- Roy, D.P.; Wulder, M.A.; Loveland, T.R.; Woodcock, C.E.; Allen, R.G.; Anderson, M.C.; et al. Landsat-8: Science and product vision for terrestrial global change research. Remote Sens. Environ. 2014, 145, 154–172. [CrossRef]
- Gorelick, N.; Hancher, M.; Dixon, M.; Ilyushchenko, S.; Thau, D.; Moore, R. Google Earth Engine: Planetary-scale geospatial analysis for everyone. Remote Sens. Environ. 2017, 202, 18–27. [CrossRef]
- Qadir, M.; Schubert, S. Degradation processes and nutrient constraints in sodic soils. Land Degrad. Dev. 2002, 13, 275–294. [CrossRef]
- Daliakopoulos, I.N.; Tsanis, I.K.; Koutroulis, A.; Kourgialas, N.N.; Varouchakis, A.E.; Karatzas, G.P.; Ritsema, C.J. The threat of soil salinity: A European scale review. Sci. Total Environ. 2016, 573, 727–739. [CrossRef]
- Shainberg, I.; Letey, J. Response of soils to sodic and saline conditions. Hilgardia 1984, 52, 1–57. [CrossRef]
- Sumner, M.E. Sodic soils: New perspectives. Aust. J. Soil Res. 1993, 31, 683–750. [CrossRef]
- Rengasamy, P. World salinization with emphasis on Australia. J. Exp. Bot. 2006, 57, 1017–1023. [CrossRef]
- Corwin, D.L.; Lesch, S.M. Apparent soil electrical conductivity measurements in agriculture. Comput. Electron. Agric. 2005, 46, 11–43. [CrossRef]
- Flowers, T.J.; Colmer, T.D. Salinity tolerance in halophytes. New Phytol. 2008, 179, 945–963. [CrossRef]
- Schlesinger, W.H.; Reynolds, J.F.; Cunningham, G.L.; Huenneke, L.F.; Jarrell, W.M.; Virginia, R.A.; Whitford, W.G. Biological feedbacks in global desertification. Science 1990, 247, 1043–1048. [CrossRef]
- Rietkerk, M.; Dekker, S.C.; de Ruiter, P.C.; van de Koppel, J. Self-organized patchiness and catastrophic shifts in ecosystems. Science 2004, 305, 1926–1929. [CrossRef]
- Briske, D.D.; Fuhlendorf, S.D.; Smeins, F.E. State-and-transition models, thresholds, and rangeland health: A synthesis of ecological concepts and perspectives. Rangel. Ecol. Manag. 2005, 58, 1–10. [CrossRef]
- Bestelmeyer, B.T.; Herrick, J.E.; Brown, J.R.; Trujillo, D.A.; Havstad, K.M. Land management in the American Southwest: A state-and-transition approach to ecosystem complexity. Environ. Manag. 2004, 34, 38–51. [CrossRef]
- Maestre, F.T.; Eldridge, D.J.; Soliveres, S.; Kéfi, S.; Delgado-Baquerizo, M.; Bowker, M.A.; García-Palacios, P.; Gaitán, J.; Gallardo, A.; Lázaro, R.; et al. Structure and functioning of dryland ecosystems in a changing world. Annu. Rev. Ecol. Evol. Syst. 2016, 47, 215–237. [CrossRef]
- Lal, R. Restoring soil quality to mitigate soil degradation. Sustainability 2015, 7, 5875–5895. [CrossRef]
- Huete, A.R. A soil-adjusted vegetation index (SAVI). Remote Sens. Environ. 1988, 25, 295–309. [CrossRef]
- Qi, J.; Chehbouni, A.; Huete, A.R.; Kerr, Y.H.; Sorooshian, S. A modified soil adjusted vegetation index. Remote Sens. Environ. 1994, 48, 119–126. [CrossRef]
- Rondeaux, G.; Steven, M.; Baret, F. Optimization of soil-adjusted vegetation indices. Remote Sens. Environ. 1996, 55, 95–107. [CrossRef]
- Bannari, A.; Morin, D.; Bonn, F.; Huete, A.R. A review of vegetation indices. Remote Sens. Rev. 1995, 13, 95–120. [CrossRef]
- Farifteh, J.; van der Meer, F.; van der Meijde, M.; Atzberger, C. Spectral characteristics of salt-affected soils: A laboratory experiment. Geoderma 2008, 145, 196–206. [CrossRef]
- Corwin, D.L.; Scudiero, E. Review of soil salinity assessment for agriculture across multiple scales using proximal and/or remote sensors. Adv. Agron. 2019, 158, 1–130. [CrossRef]
- Kéfi, S.; Rietkerk, M.; Alados, C.L.; Pueyo, Y.; Papanastasis, V.P.; ElAich, A.; de Ruiter, P.C. Spatial vegetation patterns and imminent desertification in Mediterranean arid ecosystems. Nature 2007, 449, 213–217. [CrossRef]
- Lioubimtseva, E.; Henebry, G.M. Climate and environmental change in arid Central Asia: Impacts, vulnerability, and adaptations. J. Arid Environ. 2009, 73, 963–977. [CrossRef]
- De Beurs, K.M.; Henebry, G.M. Land surface phenology, climatic variation, and institutional change: Analyzing agricultural land cover change in Kazakhstan. Remote Sens. Environ. 2004, 89, 497–509. [CrossRef]
- Pettorelli, N.; Vik, J.O.; Mysterud, A.; Gaillard, J.-M.; Tucker, C.J.; Stenseth, N.C. Using the satellite-derived NDVI to assess ecological responses to environmental change. Trends Ecol. Evol. 2005, 20, 503–510. [CrossRef]
- Corwin, D.L.; Lesch, S.M. Application of soil electrical conductivity to precision agriculture: Theory, principles, and guidelines. Agron. J. 2003, 95, 455–471. [CrossRef]
- Dormann, C.F.; Elith, J.; Bacher, S.; Buchmann, C.; Carl, G.; Carré, G.; García Marquéz, J.R.; Gruber, B.; Lafourcade, B.; Münkemüller, T.; et al. Collinearity: A review of methods to deal with it and a simulation study evaluating their performance. Ecography 2013, 36, 27–46. [CrossRef]
- Legendre, P.; Gallagher, E.D. Ecologically meaningful transformations for ordination of species data. Oecologia 2001, 129, 271–280. [CrossRef]
- ter Braak, C.J.F. Canonical correspondence analysis: A new eigenvector technique for multivariate direct gradient analysis. Ecology 1986, 67, 1167–1179. [CrossRef]
- Purevdorj, T.; Tateishi, R.; Ishiyama, T.; Honda, Y. Relationships between percent vegetation cover and vegetation indices. Int. J. Remote Sens. 1998, 19, 3519–3535. [CrossRef]
- Xue, J.; Su, B. Significant remote sensing vegetation indices: A review of developments and applications. J. Sens. 2017, 2017, 1353691. [CrossRef]
- Scudiero, E.; Skaggs, T.H.; Corwin, D.L. Simplifying field-scale assessment of spatiotemporal changes of soil salinity. Sci. Total Environ. 2017, 587–588, 273–281. [CrossRef]
- Zhang, T.; Qi, J.; Gao, Y.; Ouyang, Z.; Zeng, S.; Zhao, B. Detecting soil salinity with MODIS time series VI data. Ecol. Indic. 2015, 52, 480–489. [CrossRef]
Figure 1.
Survey points in the Ulytau region.
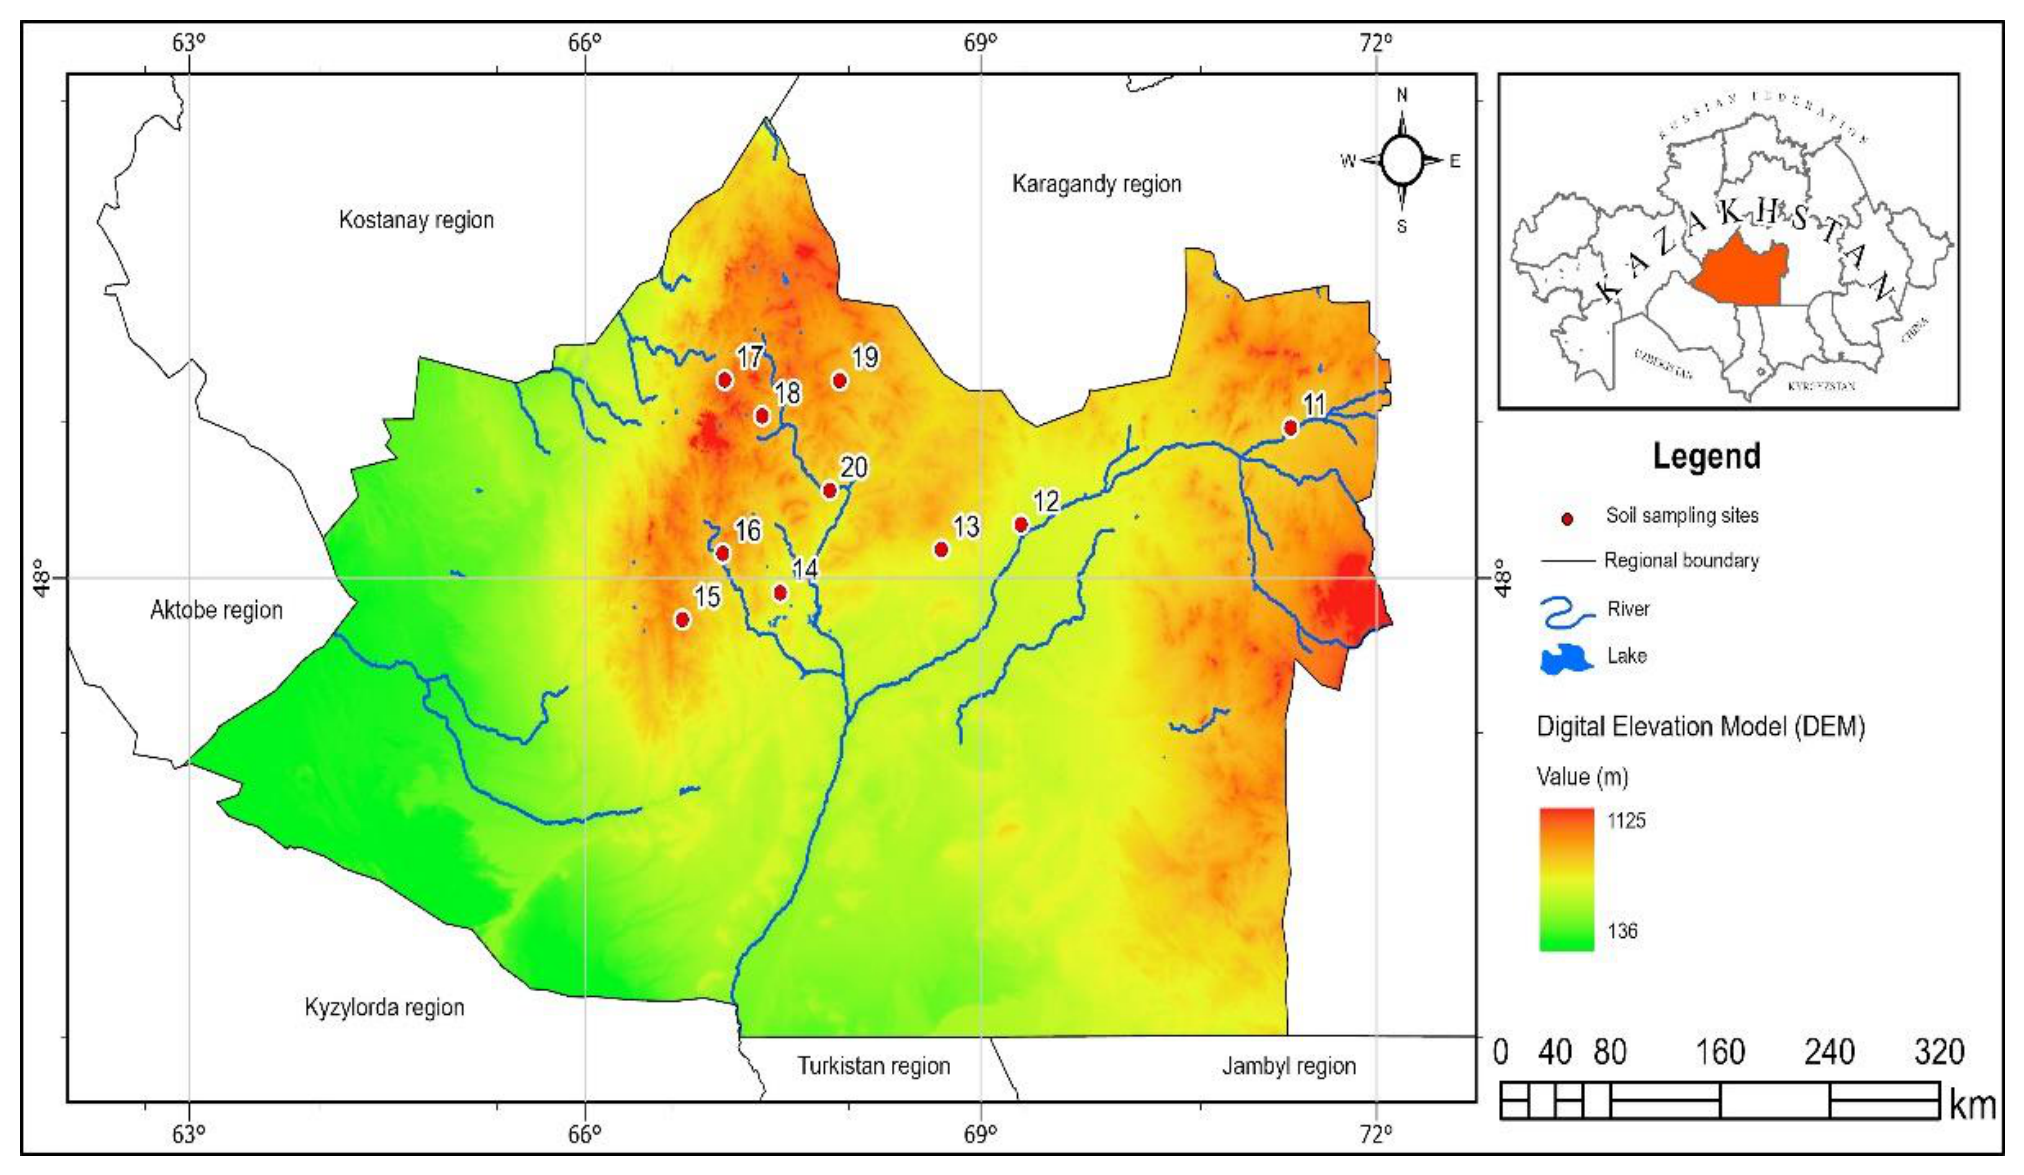
Figure 2.
USDA textural triangle of Solonetz and Solonetzic soil samples from the Ulytau region, Central Kazakhstan.
Figure 2.
USDA textural triangle of Solonetz and Solonetzic soil samples from the Ulytau region, Central Kazakhstan.
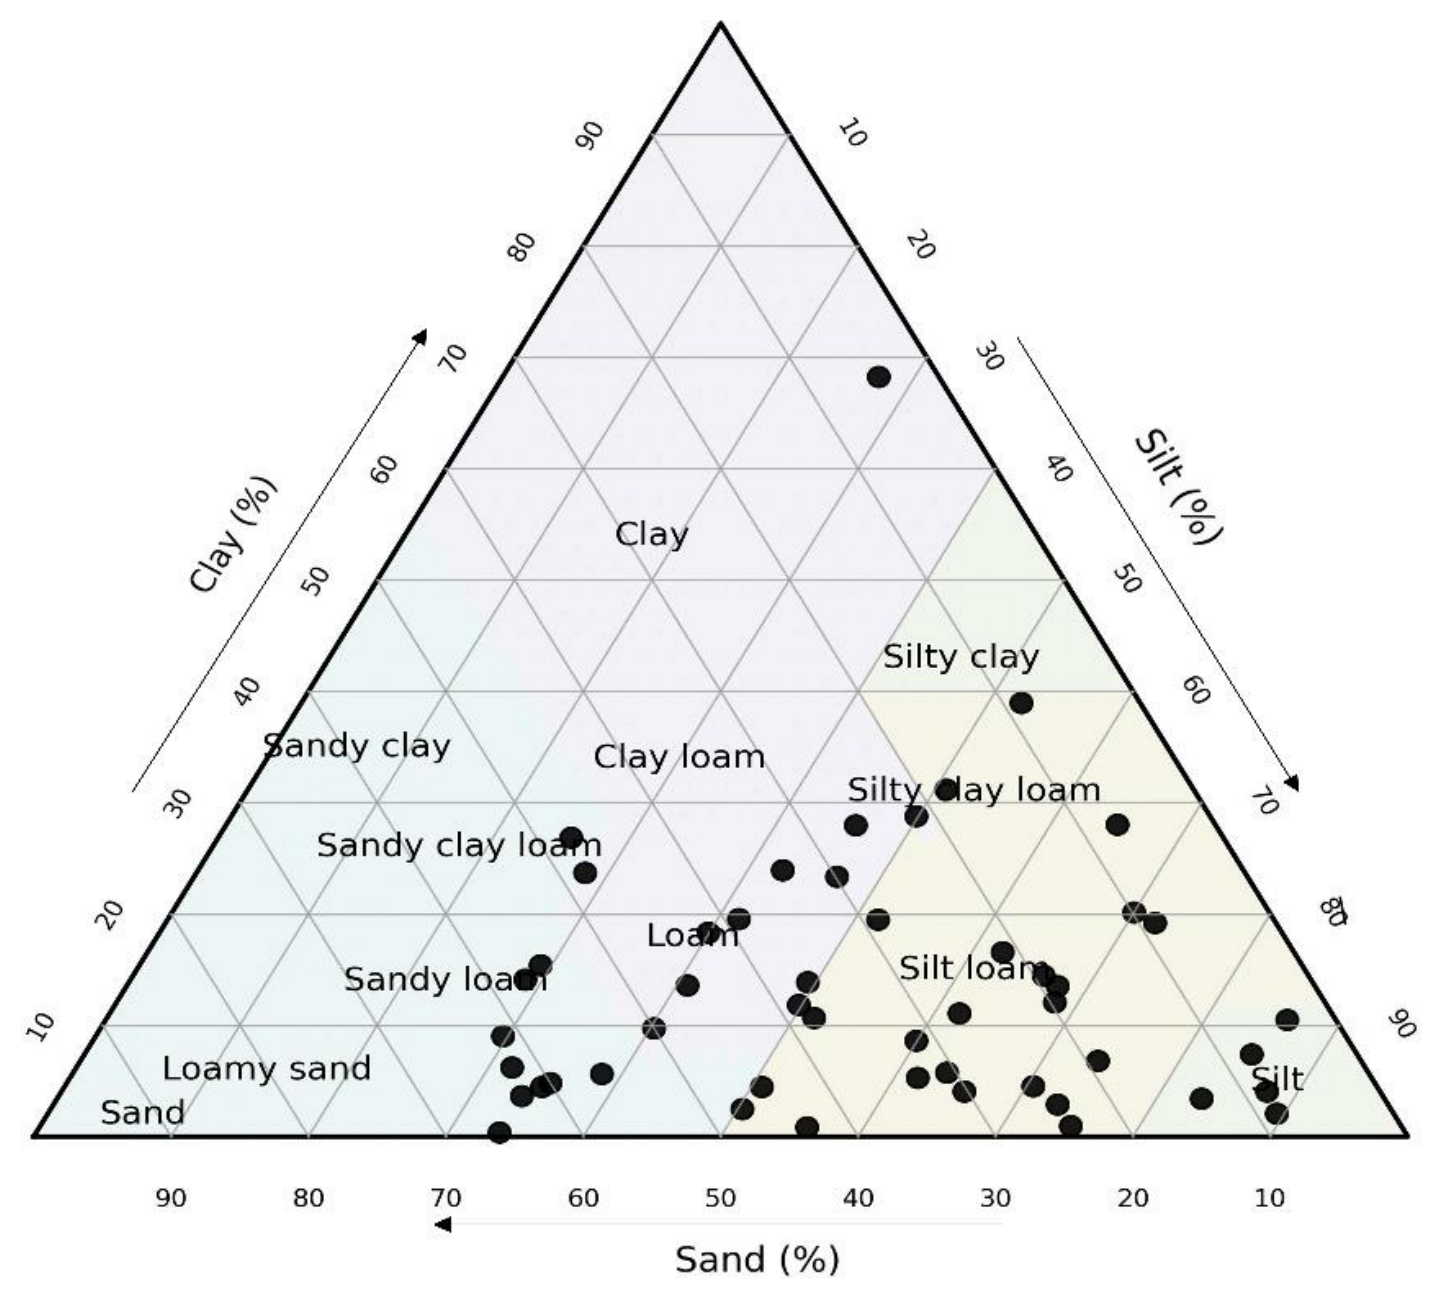
Figure 3.
Vertical distribution of total soluble salts in Solonetz and Solonetzic soil profiles. Boxplots show the distribution of total soluble salts (%) within standard depth intervals.
Figure 3.
Vertical distribution of total soluble salts in Solonetz and Solonetzic soil profiles. Boxplots show the distribution of total soluble salts (%) within standard depth intervals.
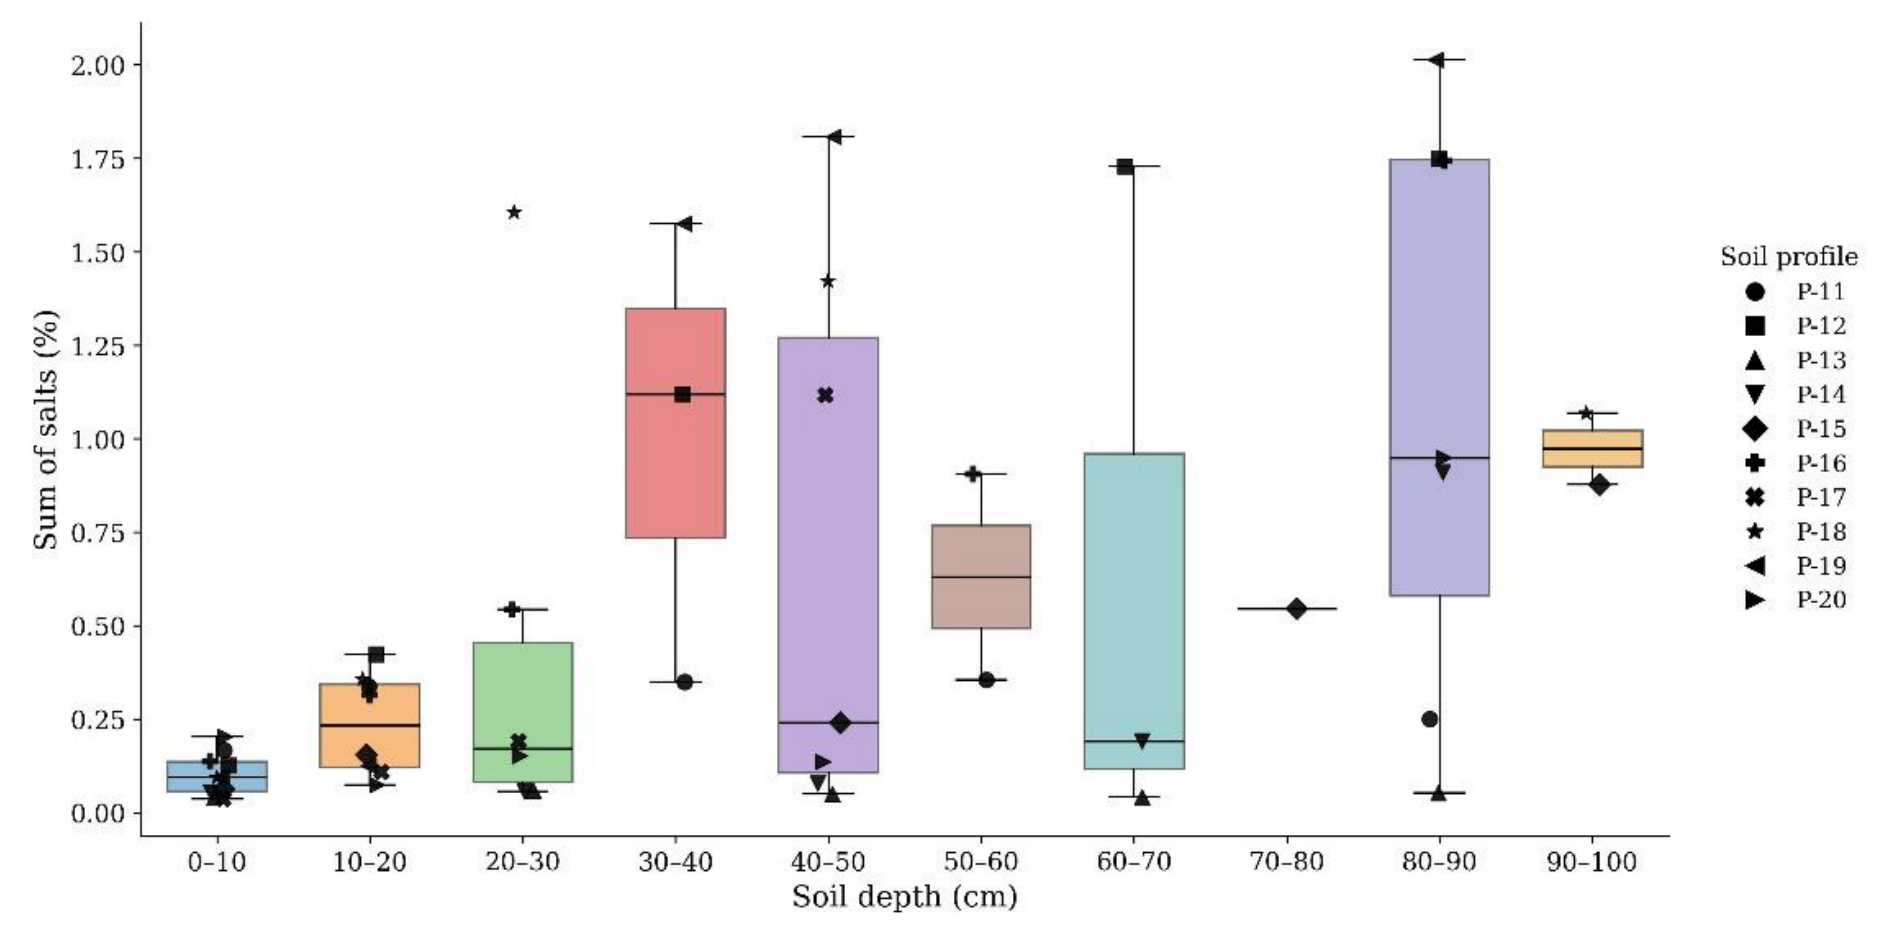
Figure 4.
Ionic composition of water extracts in Solonetz and Solonetzic soil profiles of the Ulytau region, Central Kazakhstan. (a) Anion composition: HCO₃⁻, CO₃²⁻, Cl⁻ and SO₄²⁻. (b) Cation composition: Ca²⁺, Mg²⁺, Na⁺ and K⁺.
Figure 4.
Ionic composition of water extracts in Solonetz and Solonetzic soil profiles of the Ulytau region, Central Kazakhstan. (a) Anion composition: HCO₃⁻, CO₃²⁻, Cl⁻ and SO₄²⁻. (b) Cation composition: Ca²⁺, Mg²⁺, Na⁺ and K⁺.
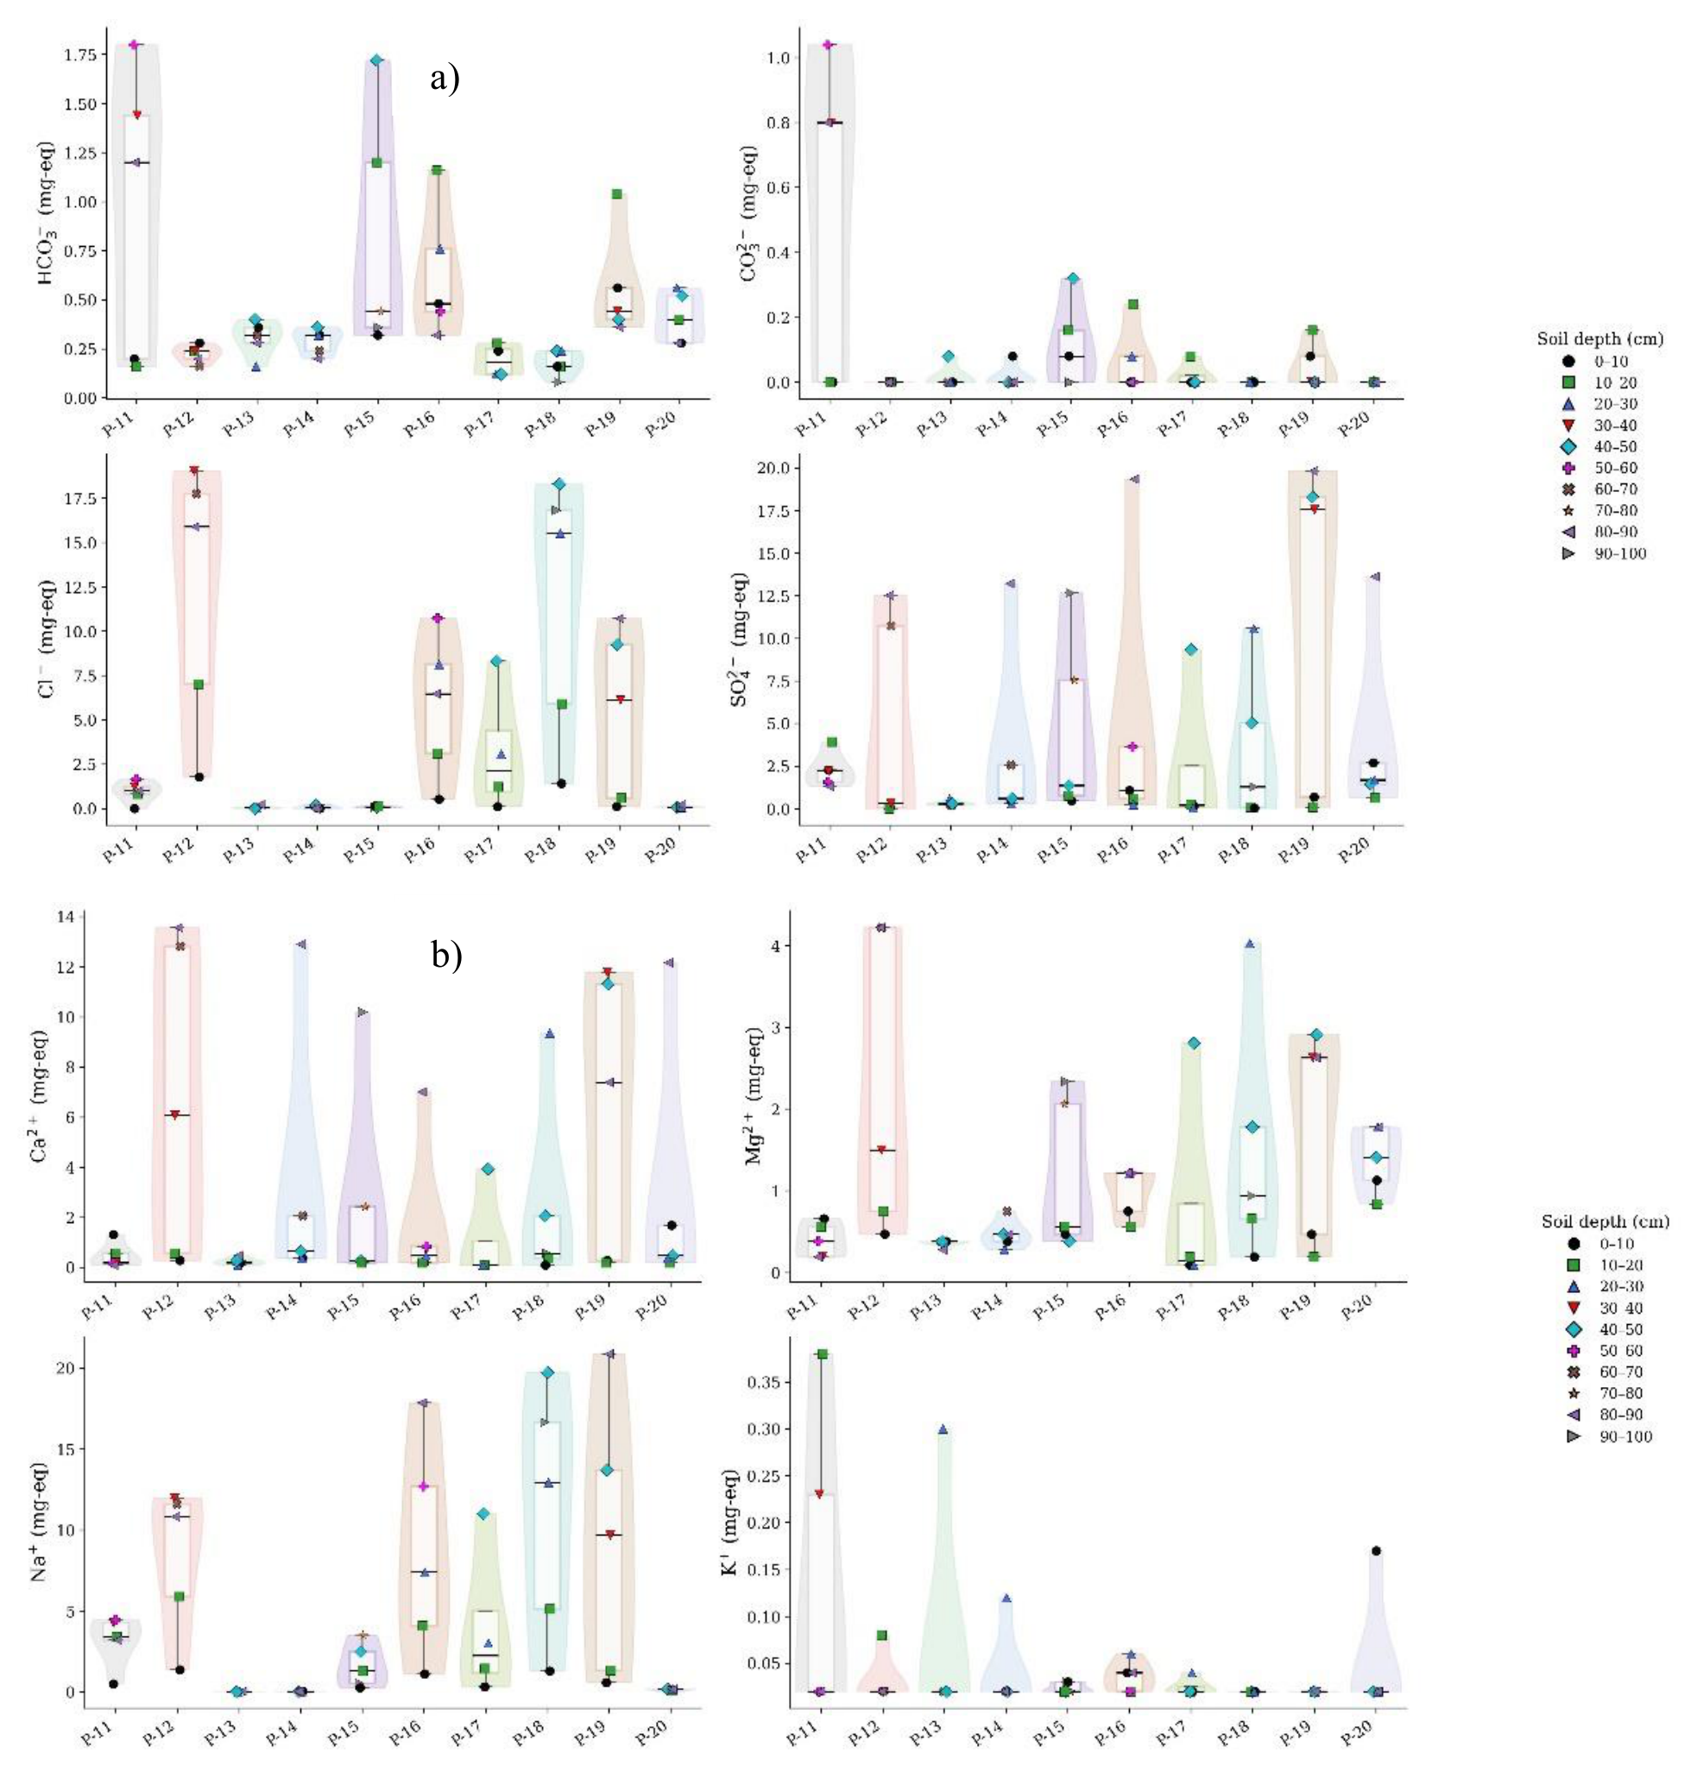
Figure 5.
Heatmap of available macronutrients in Solonetz and Solonetzic soil profiles of the Ulytau region. The upper panel shows topsoil concentrations of available nitrogen (N), phosphorus (P₂O₅) and potassium (K₂O) across the monitoring sites. The lower panels show the vertical distribution of available N, P₂O₅ and K₂O in the upper, middle and lower sampled layers. Values are expressed in mg kg⁻¹. Soil samples P-11–P-20 corre-spond to the ten monitoring sites.
Figure 5.
Heatmap of available macronutrients in Solonetz and Solonetzic soil profiles of the Ulytau region. The upper panel shows topsoil concentrations of available nitrogen (N), phosphorus (P₂O₅) and potassium (K₂O) across the monitoring sites. The lower panels show the vertical distribution of available N, P₂O₅ and K₂O in the upper, middle and lower sampled layers. Values are expressed in mg kg⁻¹. Soil samples P-11–P-20 corre-spond to the ten monitoring sites.
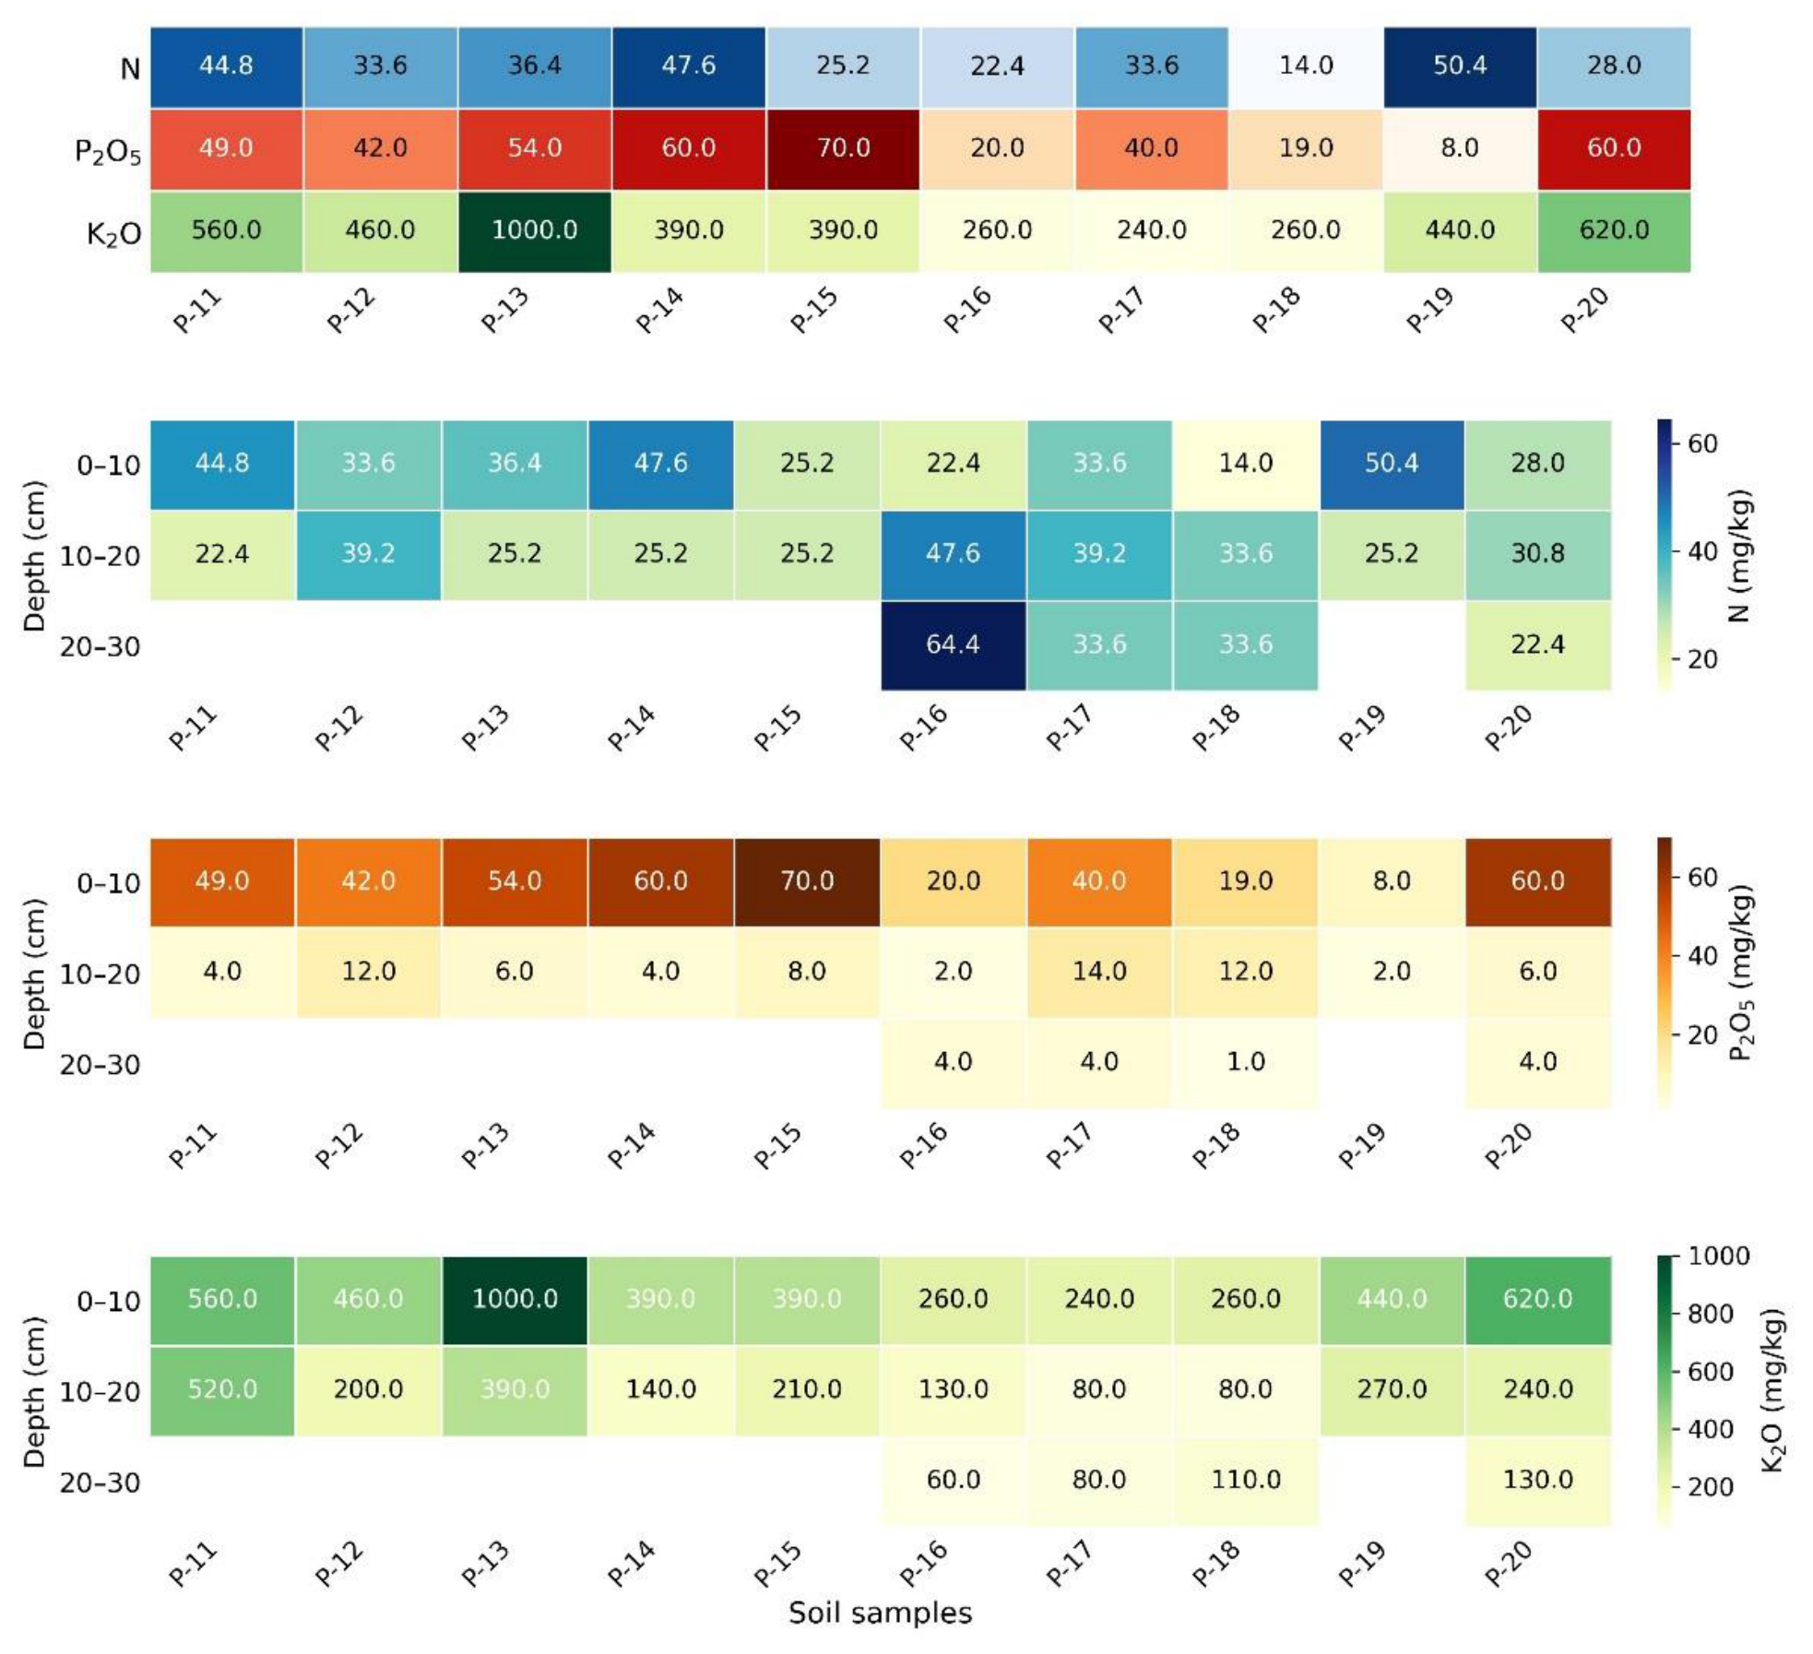
Figure 6.
Field appearance of vegetation cover and surface degradation patterns across the monitored Solonetz and Solonetzic rangeland sites of the Ulytau region, Central Kazakhstan. Panels a–j correspond to monitoring sites P-11–P-20, respectively.
Figure 6.
Field appearance of vegetation cover and surface degradation patterns across the monitored Solonetz and Solonetzic rangeland sites of the Ulytau region, Central Kazakhstan. Panels a–j correspond to monitoring sites P-11–P-20, respectively.
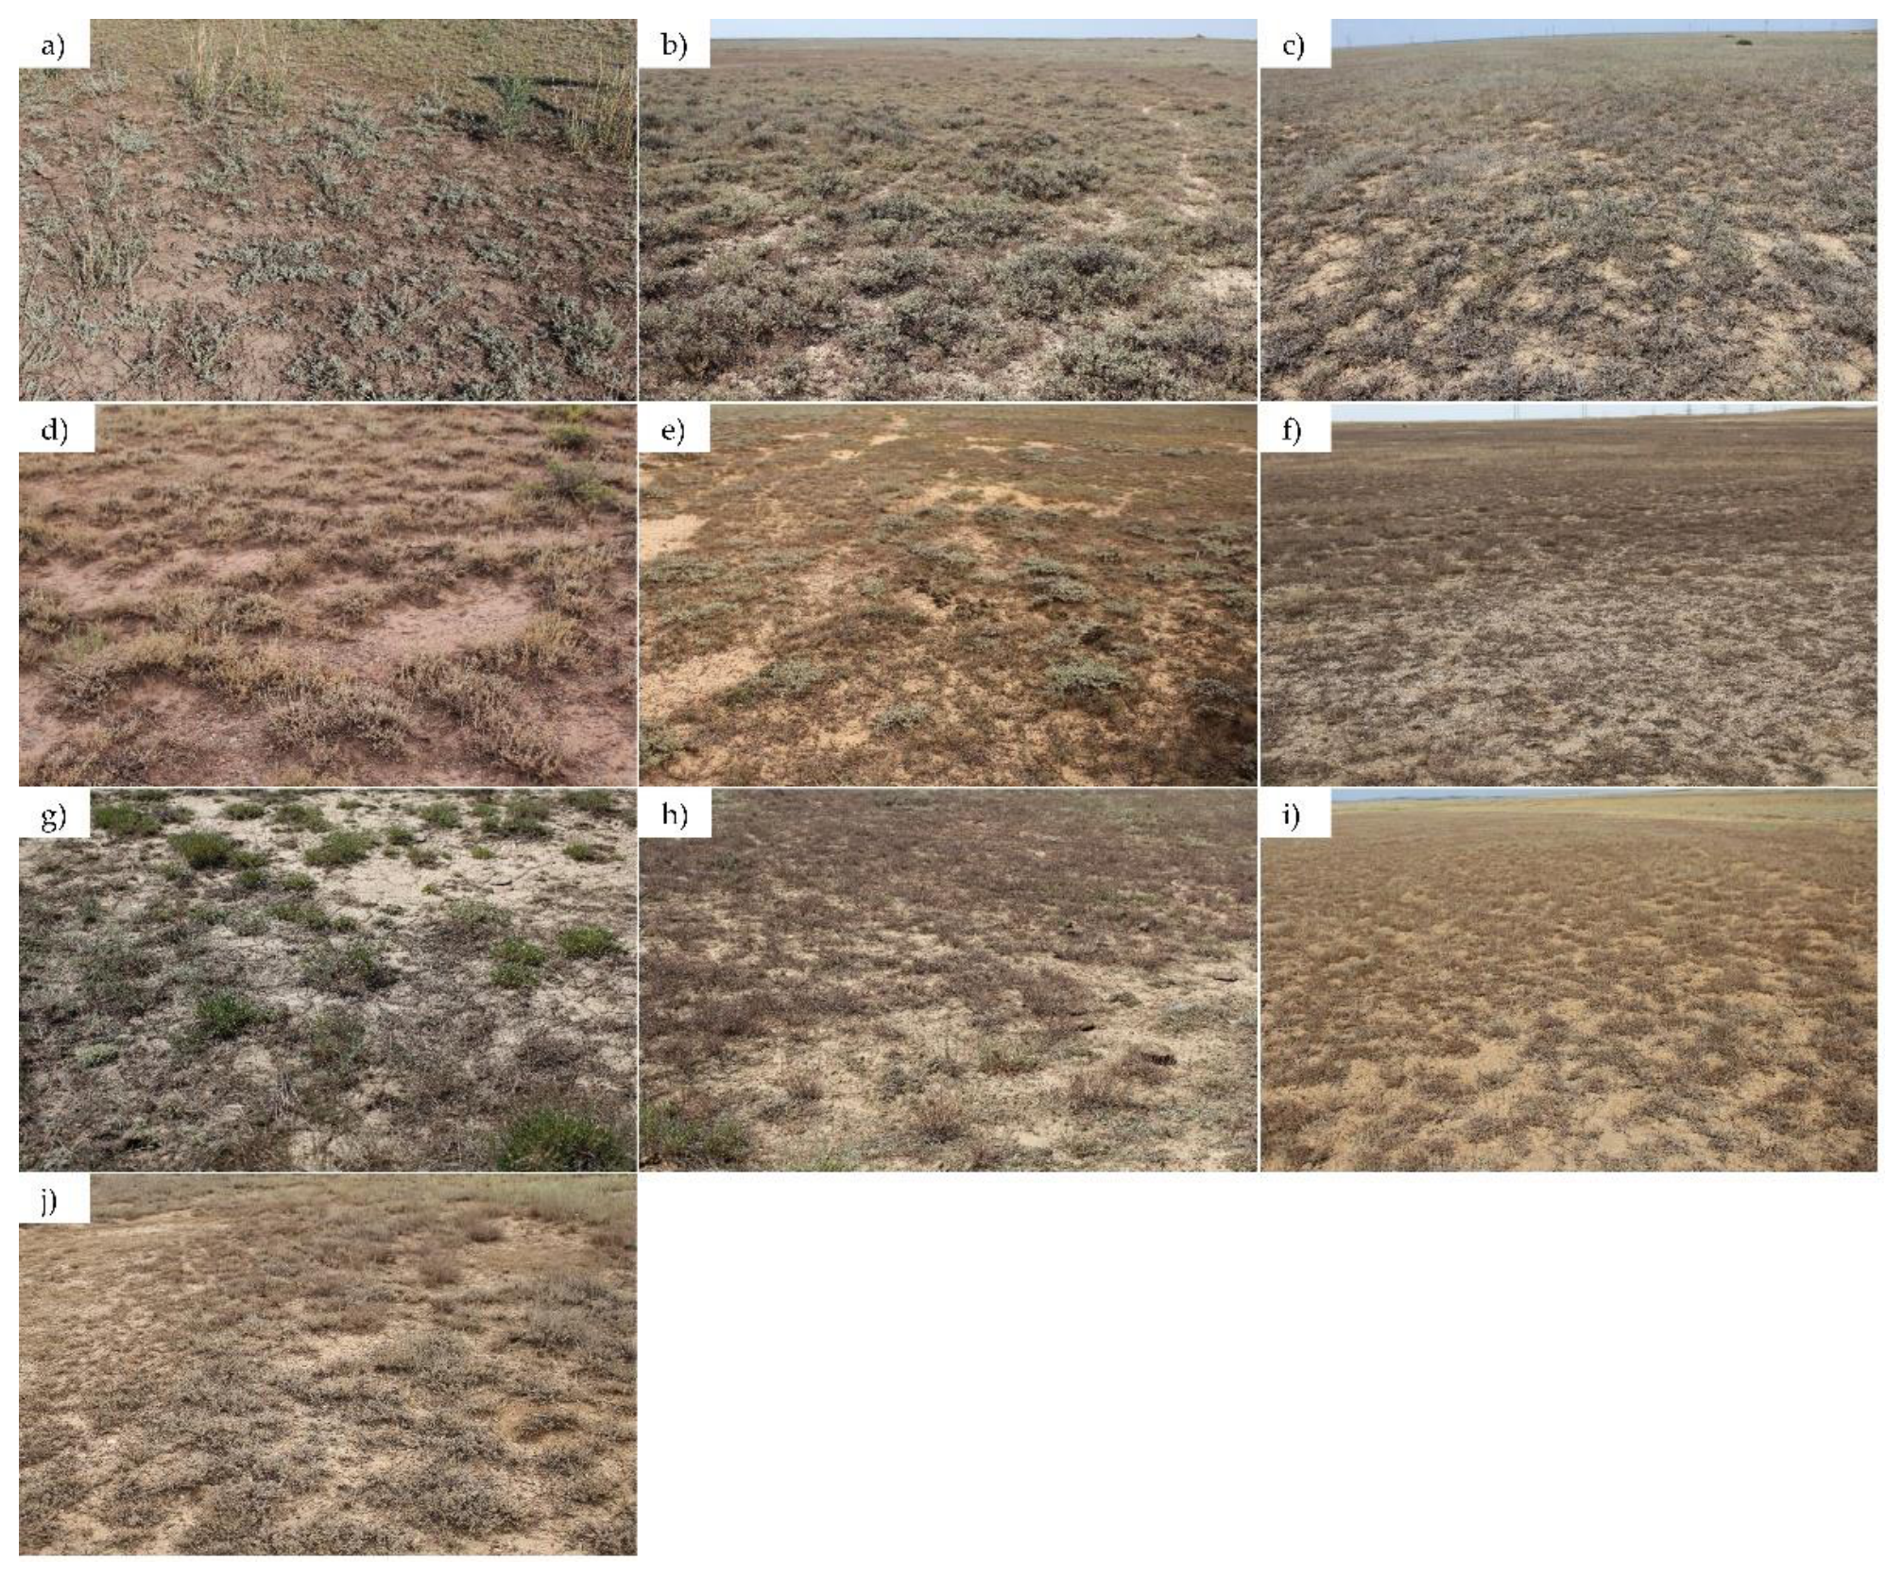
Figure 8.
Sentinel-2A-derived MSAVI values across the monitored Solonetz and Solonetzic rangeland sites. Points represent monitoring sites P-11–P-20, and the dashed line shows the mean MSAVI value. Lower values indicate weaker vegetation signal and stronger soil-background influence.
Figure 8.
Sentinel-2A-derived MSAVI values across the monitored Solonetz and Solonetzic rangeland sites. Points represent monitoring sites P-11–P-20, and the dashed line shows the mean MSAVI value. Lower values indicate weaker vegetation signal and stronger soil-background influence.
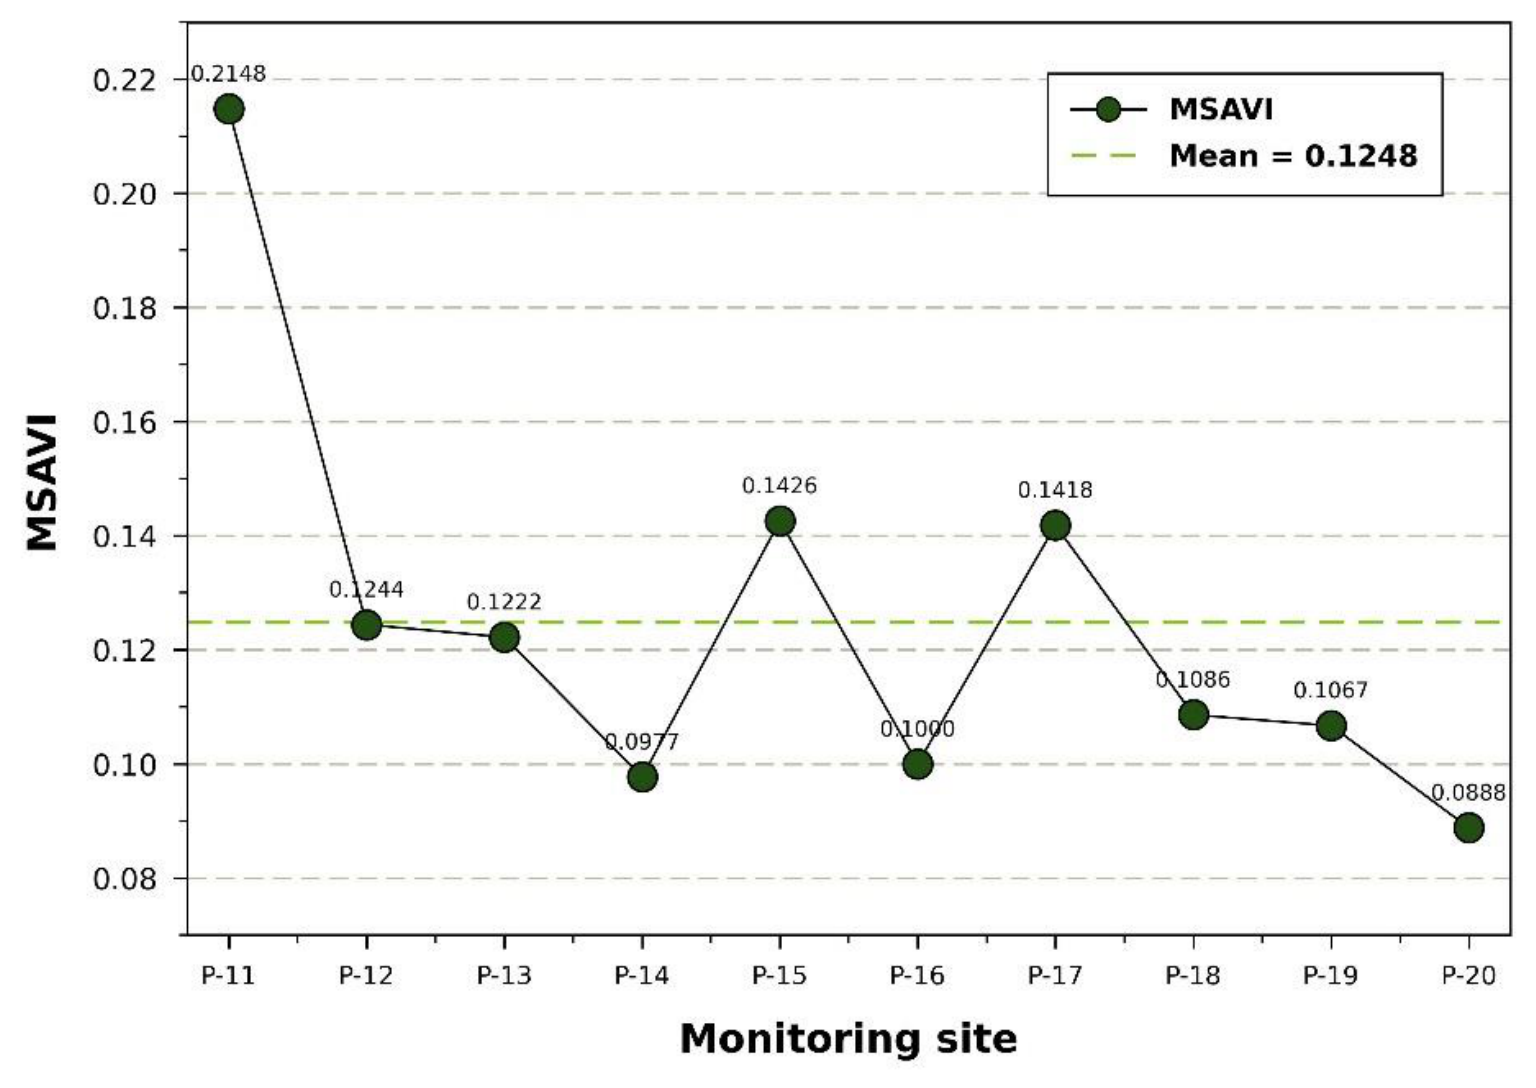
Figure 9.
Long-term spectral–thermal dynamics of Solonetz rangelands in the Ulytau region during summer periods from 2013 to 2025. (a) Interannual variation in NDVI and surface albedo; (b) Interannual variation in land surface temperature (LST); (c) Relationship between NDVI and LST; (d) Relationship between surface albedo and LST.
Figure 9.
Long-term spectral–thermal dynamics of Solonetz rangelands in the Ulytau region during summer periods from 2013 to 2025. (a) Interannual variation in NDVI and surface albedo; (b) Interannual variation in land surface temperature (LST); (c) Relationship between NDVI and LST; (d) Relationship between surface albedo and LST.
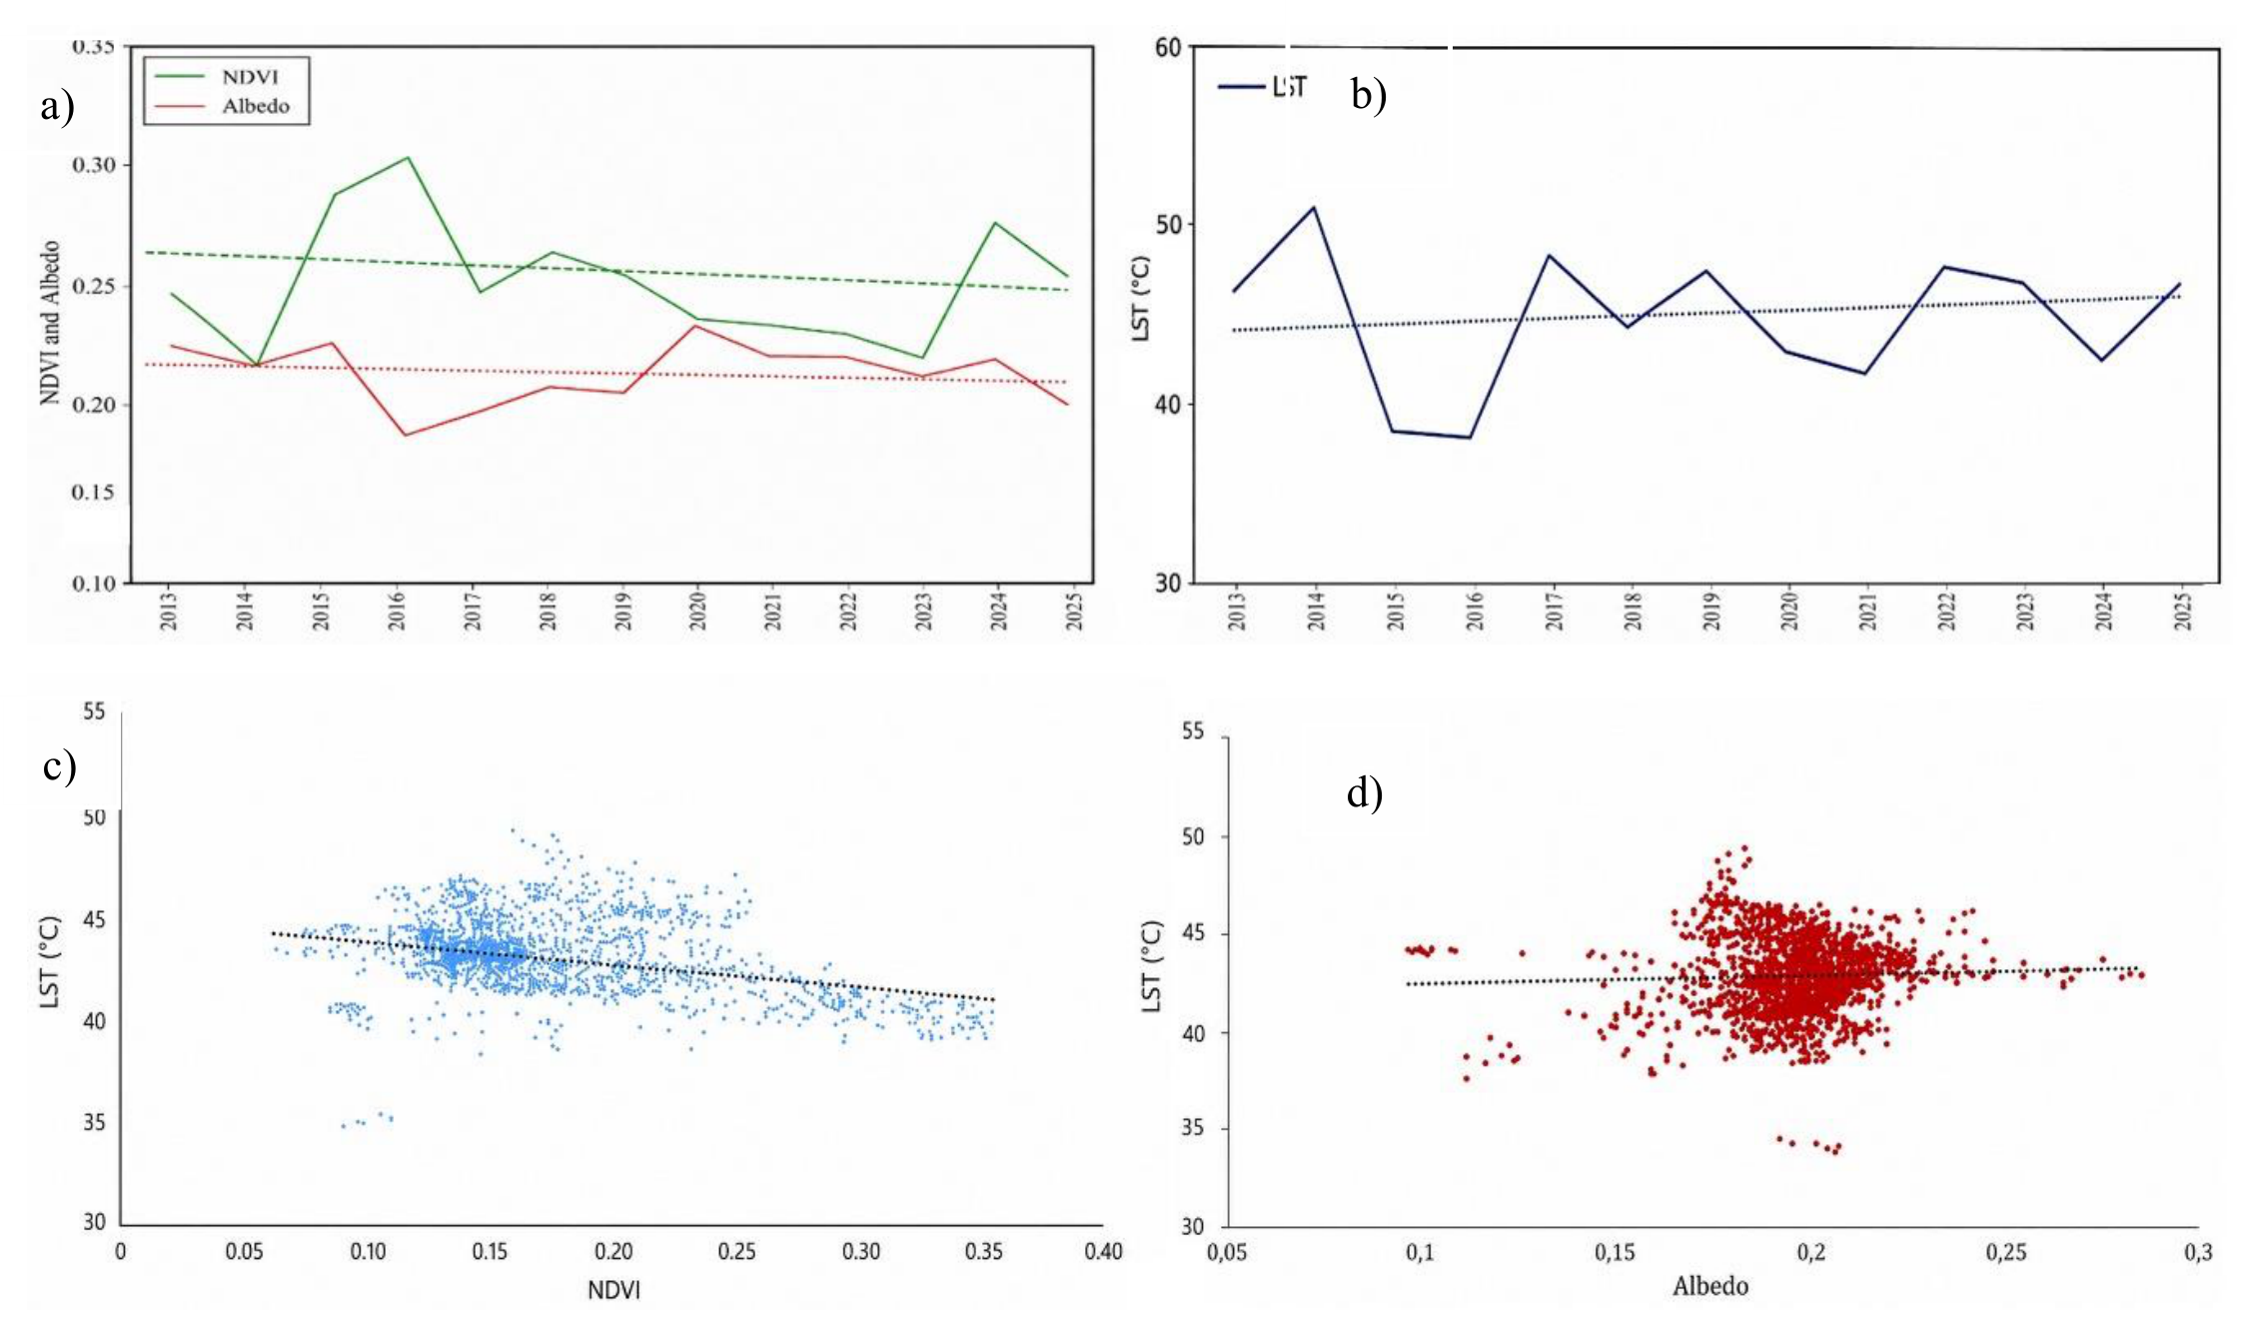
Figure 10.
Pearson correlation matrix of soil-profile constraints, vegetation indicators and MSAVI.
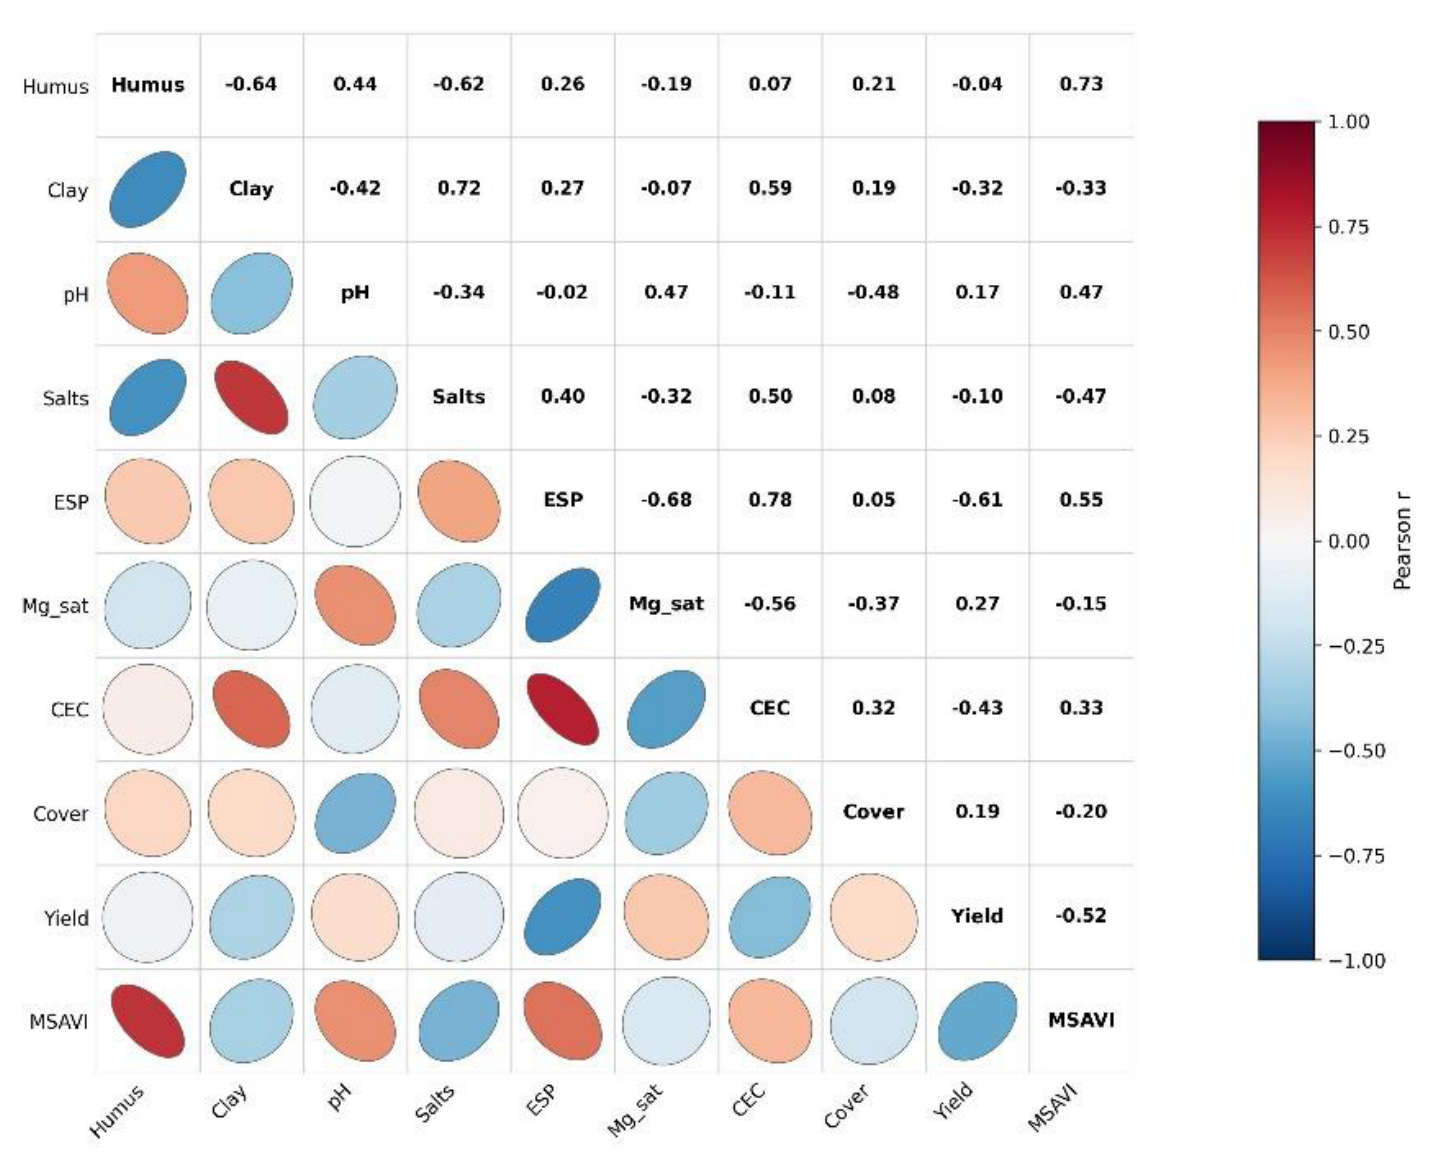
Figure 11.
Multivariate relationships among soil-profile constraints, vegetation indicators and MSAVI. a) PCA biplot of soil-profile, vegetation and spectral variables., b) RDA biplot showing the relationship between selected soil-profile constraints and response variables, including vegetation cover, forage yield and MSAVI.
Figure 11.
Multivariate relationships among soil-profile constraints, vegetation indicators and MSAVI. a) PCA biplot of soil-profile, vegetation and spectral variables., b) RDA biplot showing the relationship between selected soil-profile constraints and response variables, including vegetation cover, forage yield and MSAVI.
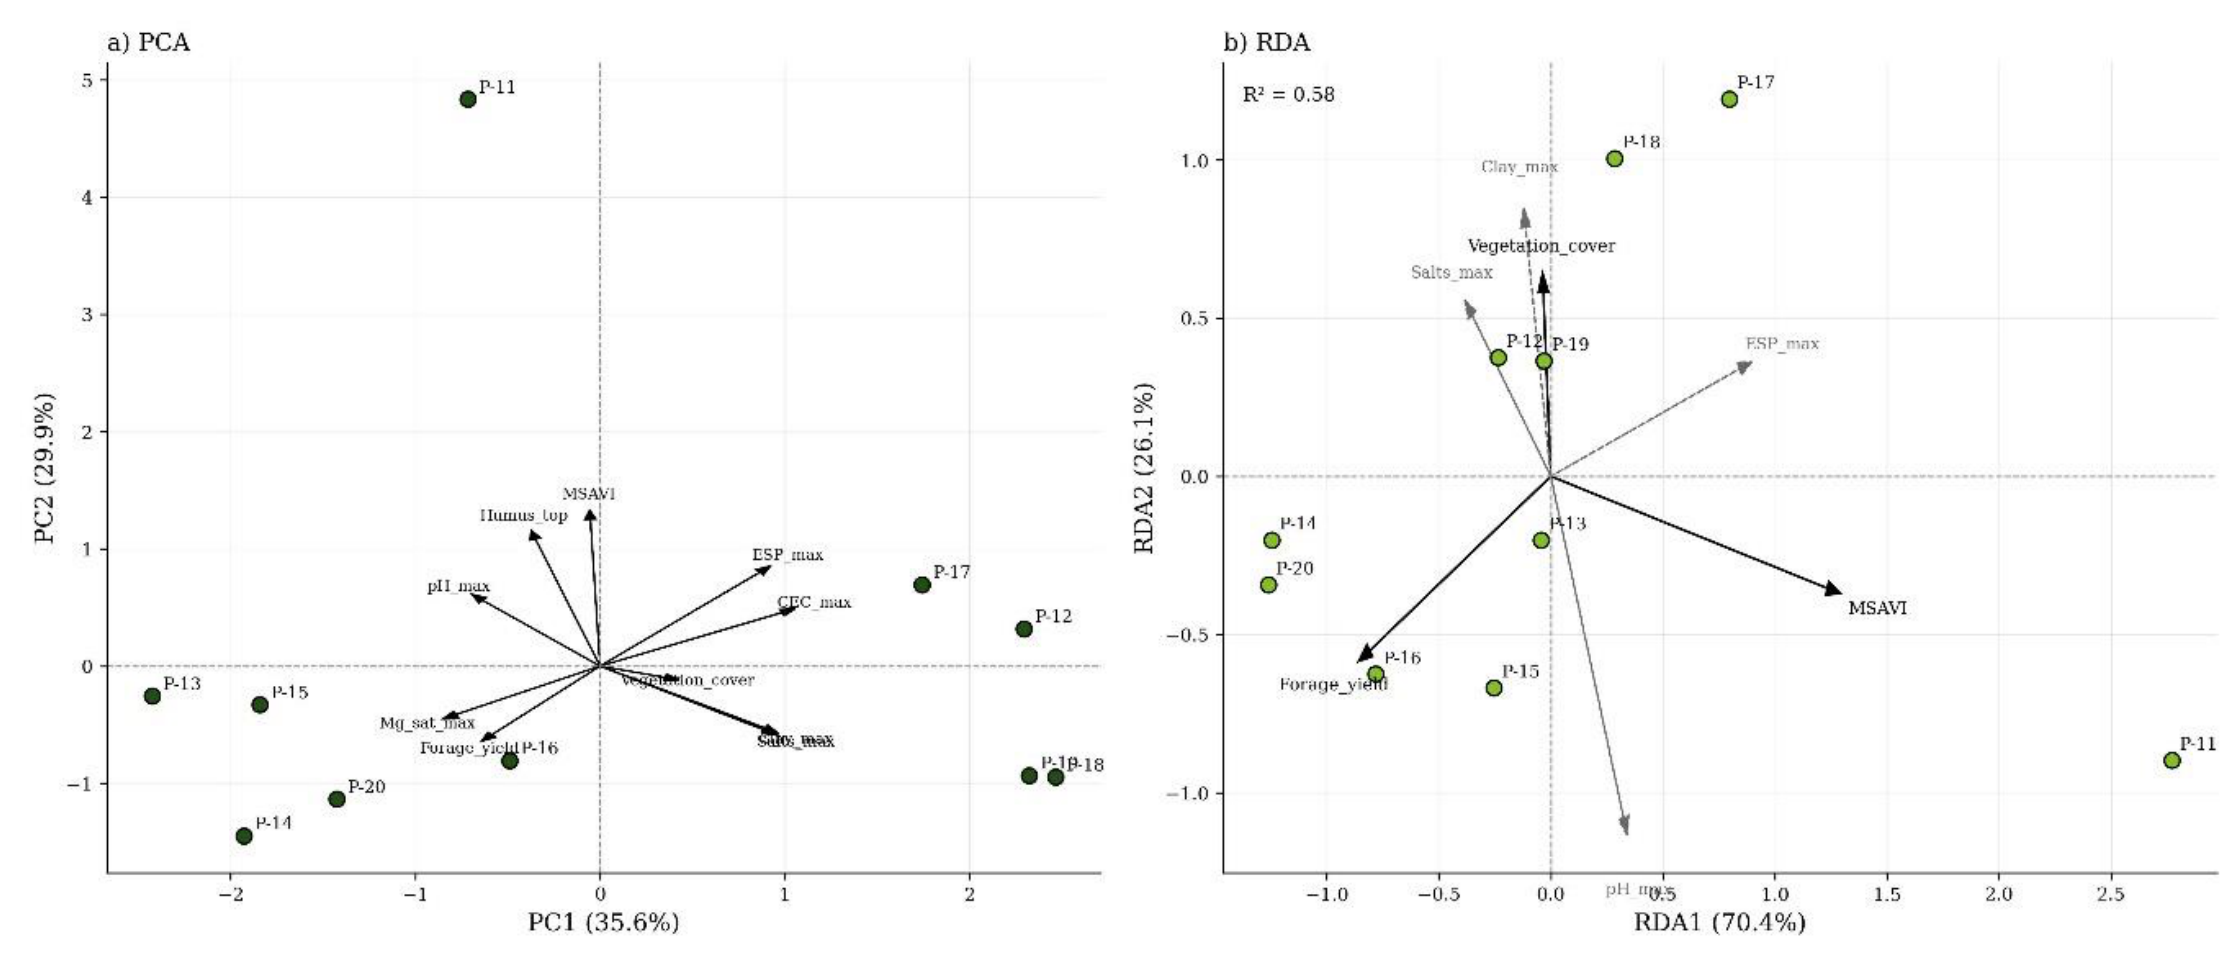
Figure 12.
MSAVI-based map of Solonetz degradation patterns in the Ulytau region, Central Kazakhstan.
Figure 12.
MSAVI-based map of Solonetz degradation patterns in the Ulytau region, Central Kazakhstan.
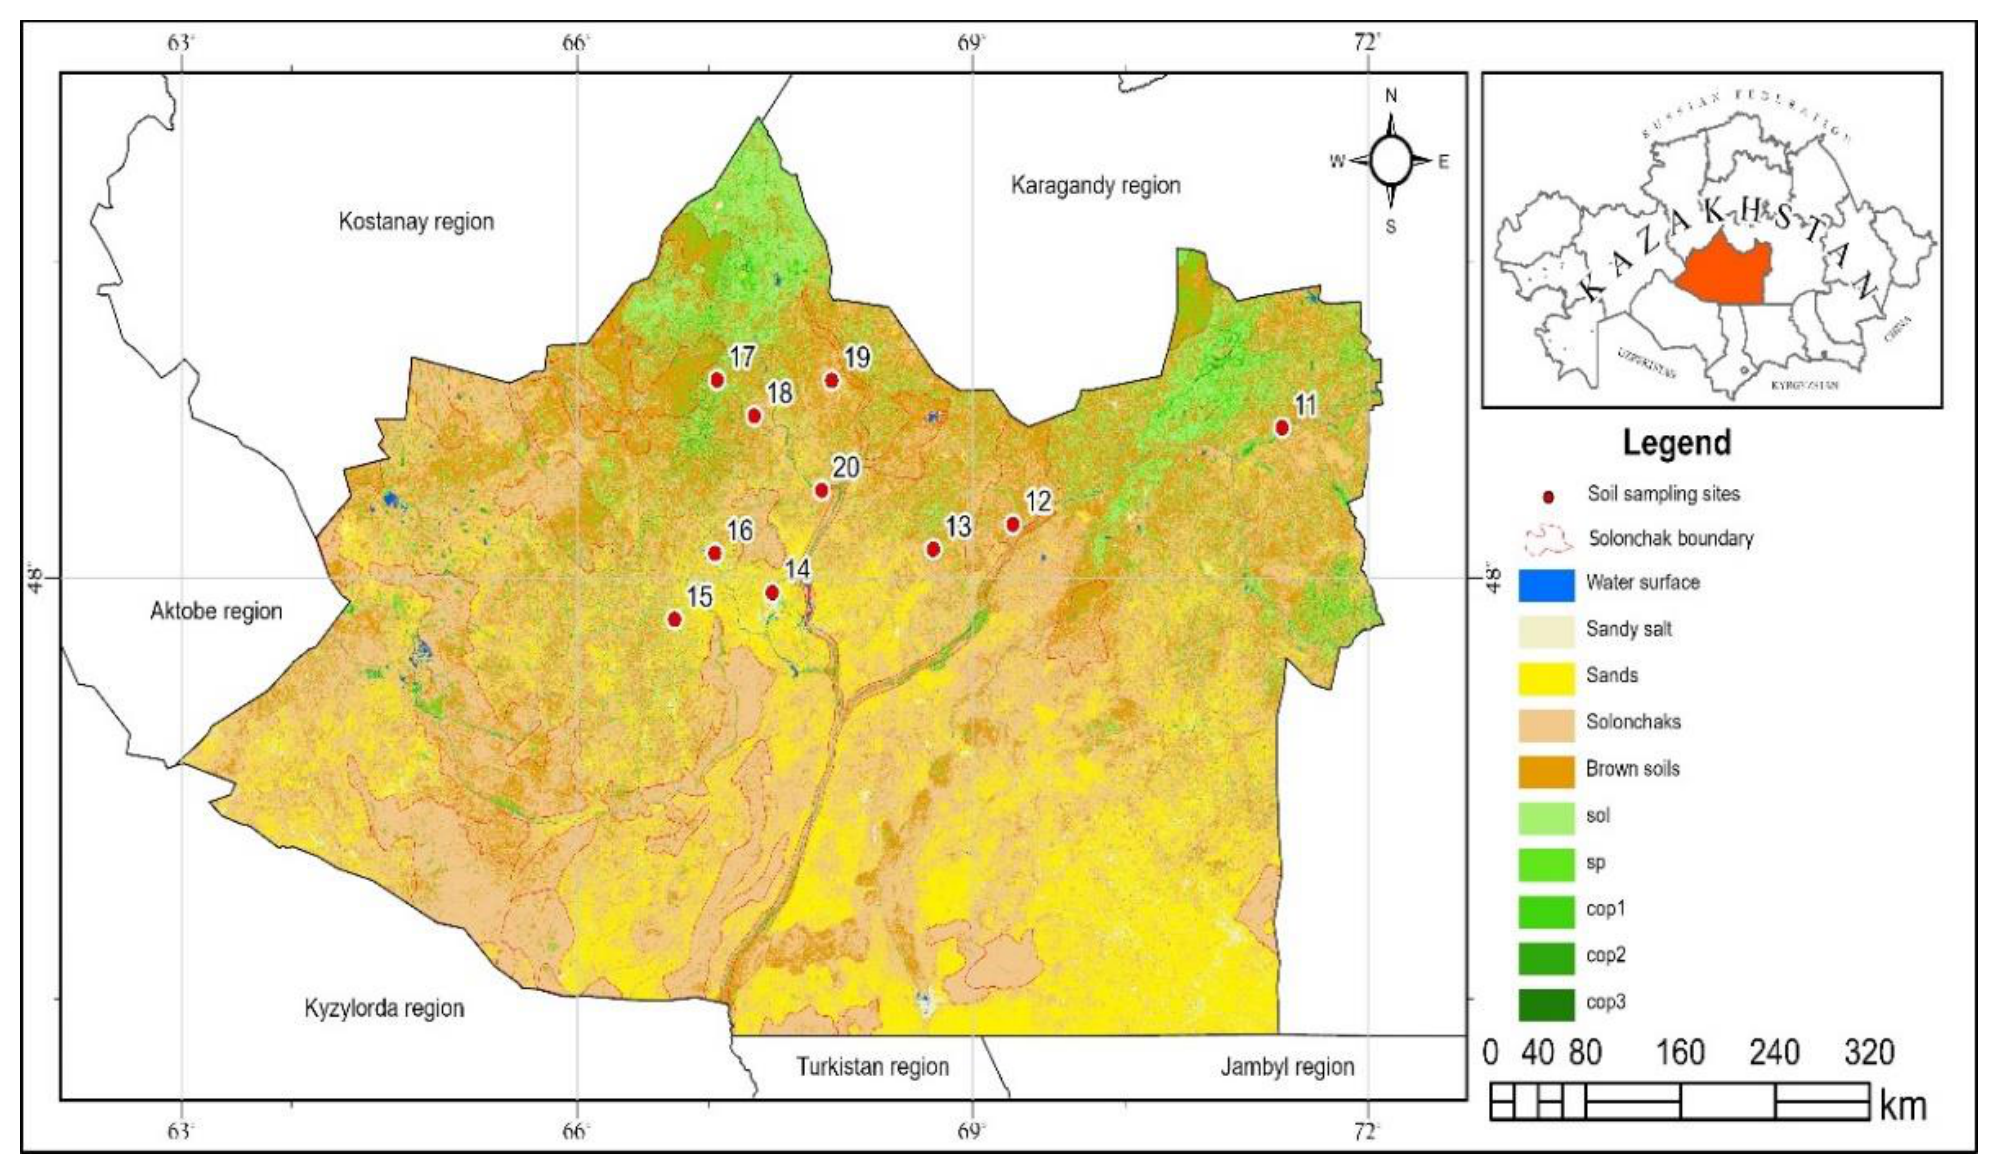

Table 1.
Field monitoring sites, soil type, landscape setting and vegetation characteristics in the Ulytau region.
Table 1.
Field monitoring sites, soil type, landscape setting and vegetation characteristics in the Ulytau region.
| Site | Soil type | Landscape position | Dominant pasture type | Vegetation cover, % |
|---|---|---|---|---|
| P11 | Shallow Solonetz | Plain | Wormwood–Leymus with Achnatherum | 45 |
| P12 | Shallow Solonetz | Plain | Kochia–wormwood–ephemeral | 50 |
| P13 | Medium Solonetz | Plain | Wormwood pasture | 50 |
| P14 | Solonetzic light chestnut soil | Hilly terrain | Wormwood–ephemeral with Anabasis | 45 |
| P15 | Shallow Solonetz | Plain | Wormwood–Anabasis | 35 |
| P16 | Shallow Solonetz, stony surface | Hilly terrain | Kochia–wormwood–Anabasis | 35 |
| P17 | Crusted Solonetz | Saucer-shaped plain | Kochia–Anabasis–wormwood | 55 |
| P18 | Crusted Solonetz | Interhill valley | Wormwood–Anabasis–Kochia | 45 |
| P19 | Shallow Solonetz | Plain | Grey wormwood pasture | 60 |
| P20 | Shallow Solonetz | Undulating plain | Wormwood pasture | 60 |
Table 2.
Variables included in the integrated soil–vegetation–spectral dataset.
| Variable group | Indicators |
|---|---|
| Soil morphology | soil type, profile depth, diagnostic horizon depth, carbonate and gypsum features, surface condition |
| Soil chemistry | pH, total soluble salts, HCO₃⁻, CO₃²⁻, Cl⁻, SO₄²⁻, exchangeable Ca²⁺, Mg²⁺, Na⁺ and K⁺, CEC, ESP, Mg |
| Soil physical properties | particle-size distribution, physical clay content, textural differentiation within the profile |
| Vegetation | vegetation cover, dominant pasture association, species composition, botanical composition, pasture yield |
| Forage quality | crude protein, crude fat, crude fibre, ash content, feed units, metabolizable energy |
| Remote sensing | Sentinel-2A MSAVI; Landsat-based NDVI, surface albedo and LST; multi-year summer means for 2013–2025 |
Disclaimer/Publisher’s Note: The statements, opinions and data contained in all publications are solely those of the individual author(s) and contributor(s) and not of MDPI and/or the editor(s). MDPI and/or the editor(s) disclaim responsibility for any injury to people or property resulting from any ideas, methods, instructions or products referred to in the content. |
© 2026 by the authors. Licensee MDPI, Basel, Switzerland. This article is an open access article distributed under the terms and conditions of the Creative Commons Attribution (CC BY) license (http://creativecommons.org/licenses/by/4.0/).
Copyright: This open access article is published under a Creative Commons CC BY 4.0 license, which permit the free download, distribution, and reuse, provided that the author and preprint are cited in any reuse.


