
Submitted:
05 June 2026
Posted:
09 June 2026
You are already at the latest version
Abstract
Increasing atmospheric CO2 concentration can enhance plant photosynthesis and promote plant growth, thereby affecting the N cycle. To investigate the effects of long-term elevated atmospheric CO2 concentration (eCO2) and N deposition on N absorption and distribution in Calamagrostis angustifolia wetlands in the Sanjiang Plain, this study was conducted in open-top chambers (OTC-1) with 15 years of continuous elevated CO₂ concentration and simulated nitrogen deposition treatment.The focus was on exploring the impacts of climate change on N absorption, distribution, and N use efficiency (NUE) in Calamagrostis angustifolia. The results showed that under long-term CO2 fumigation, N concentration in various plant organs and the whole plant significantly decreased, with greater decreases observed in leaves at the heading stage, stems during the growth stage, and roots at the mature stage. Under eCO2 concentration and N fertilization treatments, NUE in Calamagrostis angustifolia stems gradually decreased with plant growth and development; NUE in leaves initially increased and then decreased; and the variation pattern of NUE in roots was not obvious. Total N accumulation remained unchanged, but a large amount of N was allocated to leaves, promoting N flow to the upper parts of the plant and enhancing the ability of leaves to acquire N. Moreover, high-N treatments alleviated the negative impact of long-term CO2 fumigation on biomass, especially during the growth stage, where leaf biomass increased by 87.0% and aboveground biomass increased by 35.2%. However, high-N treatments did not improve NUE in various Calamagrostis angustifolia organs. In addition, long-term CO2 fumigation led to a significant decrease in N content in leaves and roots, and the interaction between elevated CO2 concentration and N significantly affected the ability of roots to absorb exogenous N. Therefore, this study indicates that long-term CO2 concentration fumigation affects plant N absorption and utilization through N availability, providing theoretical support for selecting varieties with higher NUE in agricultural production.
Keywords:
long-term eCO₂
; N deposition
; N use efficiency
; N absorption and distribution
The climate is changing at a rate that humans can perceptibly notice. Since the Industrial Revolution, CO2 concentrations have risen from 280 ppm to 427 ppm in 2024 (https://climate.nasa.gov/), an increase of 51% compared to pre-industrial levels. This growth is not only due to the burning of fossil fuels but is also closely related to forest fires and the weakening of carbon sink functions. It is expected that by 2050, atmospheric CO2 concentrations will continue to rise to around 550 ppm, and by 2100, they are expected to reach 730 ppm [1]. Elevated atmospheric CO2 concentrations can affect the growth and development of plant organs such as stems, leaves, and roots by influencing various physiological activities of plants. Nutrient cycling, utilization, and decomposition may all be affected to varying degrees [2,3,4]. N makes up 1–3% of the entire plant and is an indispensable and crucial mineral nutrient for plant growth and development. It is an important limiting factor for plant growth and yield formation and plays a key role under elevated CO2 conditions, potentially being critical in the plant response to increased CO2 concentrations [5]. Dakora and Drake (2000) indicates that elevated CO2 concentrations can stimulate N fixation in both C3 and C4 plants [6], increasing N availability, and can also enhance N use efficiency by boosting photosynthesis rates [7]. However, Arnold and Bloom (2020) suggest that increased CO2 concentrations can inhibit nitrate assimilation in C3 plants, slowing their growth [8]. Other research indicates that elevated CO2 concentrations may lead to a decrease in N content in plant tissues [9]. Currently, both domestic and international research on the effects of elevated CO2 on plants mainly employs methods such as controlled environment experiments (CE), open-top chambers (OTC), and free-air CO2 enrichment (FACE) experiments [10].
The Sanjiang Plain is currently the area in China with the most complete and best-preserved types of wetlands, rich in biodiversity, and is an ecologically significant wetland system with both representative and international importance [11].Calamagrostis angustifolia is a dominant and community-forming plant in the typical meadows and marshy meadows of the Sanjiang Plain, and is a dominant, sub-dominant, or important accompanying species in marsh vegetation [12,13,14]. This study was conducted as a 15-year field in situ experiment using open-top chambers (OTC) that simulated elevated CO2 concentration and N deposition. Using isotope tracing methods, the study investigated N content, allocation, N use efficiency, and biomass of various organs of Calamagrostis angustifolia under the interactive [12–14effects of elevated CO2 and N deposition, revealing patterns of N uptake and utilization at different periods under global change conditions, providing a scientific basis for efficient nutrient use and N cycling.
1. Materials and Methods
1.1. Test Site
This experiment was conducted at the Sanjiang Plain Wetland Ecological Station of the Heilongjiang Academy of Sciences’ Institute of Nature and Ecology--located within the Honghe National Nature Reserve. Honghe National Nature Reserve is situated in the northeastern part of the Sanjiang Plain in Heilongjiang Province, Northeast China, between 47°42′-47°52′ N latitude and 133°34′38″-133°46′29″ E longitude, covering a total area of 21,835,173 hm². The study area has a temperate monsoon climate, with an annual average temperature of 1.9 °C, the coldest month averaging -23.4 °C, the hottest month averaging 22.4 °C, the extreme minimum temperature being -39.1 °C, and the extreme maximum temperature reaching 40 °C. The annual average precipitation is 585 mm, 50%–70% of which falls between July and September. The long-term average evaporation is 1,166 mm. The effective accumulated temperature above 10 °C ranges from 2,165 °C to 2,624 °C. Annual sunshine hours total 2,356. The main soil types are meadow soil, gray-brown soil, and marsh soil. The vegetation belongs to the Changbai flora, with zonal vegetation consisting of temperate mixed coniferous and broadleaf forests. Due to a combination of climatic, geographic, and hydrological factors, large areas of non-zonal wetlands and meadows have formed, with the dominant species primarily being hydrophilic, marsh, and mesophytic plants from the Poaceae and Cyperaceae families; island-like forests only appear in localized areas. The main vegetation types are meadows and marshes, with dominant plants including C. angustifolia、Glyceria spiculosa、Carex lasiocarpa、Carex pseudo-curaica and so on.
1.2. Experimental Design
This experimental station installed OTC-1 type open-top chambers (OTCs) in 2009, and has since maintained long-term field experiments to investigate the impacts of simulated nitrogen deposition and elevated atmospheric CO₂ concentration on wetland ecosystem processes. The field sampling and experiments for this study were carried out in 2024. This study used a split-plot experimental design, with elevated CO2 concentration as the main treatment. Two CO2 treatments were set up, each replicated three times, making a total of six chambers, Chambers 1–3:410 ppm (background) and Chambers 4–6:700 ppm. N deposition was the sub-treatment, using dual-labeled ammonium nitrate (15NH415NO3). In each chamber, three levels of N were applied for isotope tracing experiments: 0 g N m-2·yr-1 (CK), 4 g N m-2·yr-1 (LN), and 8 g N m-2·yr-1 (HN).
1.3. Data Analysis
Data were statistically processed using Excel 2010, and charting and statistical analyses were performed with SigmaPlot 10.0 and SPSS 20.0.
2. Results and Analysis
2.1. Biomass of Three Organs and Above-Ground
Long-term exposure to high CO₂ concentrations significantly reduced the biomass of the C. angustifolia species. Stem biomass decreased by 38.8% during the vegetative stage and by 37.2% at maturity (P < 0.05); leaf biomass was reduced by 56.7% at maturity (P > 0.01); root biomass declined by 34.7% during the vegetative stage and by 28.8% at maturity (P < 0.05). Thus, eCO₂ had a markedly negative effect on the species’ biomass, especially on leaf biomass. Conversely, N addition markedly increased the biomass of C. angustifolia species. Under high-N treatment, stem biomass at the heading stage increased by 44.7% (P < 0.01); leaf biomass during the vegetative stage increased by 89.4% (P < 0.01); and root biomass at maturity increased by 28.9% (P < 0.01).When eCO₂ and high-N interacted, the high-N supply alleviated the negative biomass effects caused by prolonged CO₂ fumigation, particularly during the vegetative stage. Leaf biomass increased by 87.0% and above-ground biomass by 35.2% under the interaction, whereas the interaction had little effect on root biomass (Table 1).
2.2. N Concentration in Three Organs and Above-Ground
Across the different growth stages, the overall trends in N concentration among the treatments were similar, and N addition significantly increased the N concentrations in stem, leaf, and root (Figure 1.). N concentrations in stem, leaf, and root increased by 19.5%, 13.8%, and 41.0% at heading stage (P < 0.01). N concentrations in stem, leaf, and root increased by 9.1%, 12.6%, and 40.4% at vegetative stage (P < 0.01). N concentrations in stem, leaf, and root increased by 15.4%, 17.7%, and 12.5% at maturity stage (P < 0.01).
Under long-term CO2 fumigation and low-N treatment, at the heading stage, N concentrations in stems, leaves, and roots decreased by 4.4%, 33.9%, and 14.3%; during the vegetative stage, N concentrations in stems, leaves, and roots decreased by 2.2%, 17.9%, and 11.2%; at maturity, N concentrations in leaves and roots decreased by 19.1% and 13.7%. Under long-term CO2 fumigation and high-N treatment, at the heading stage, N concentrations in stems, leaves, and roots decreased by 6.1%, 32.2%, and 34.5%; during the vegetative stage, N concentrations in stems, leaves, and roots decreased by 2.1%, 18.6%, and 15.2%; at maturity, N concentrations in leaves and roots decreased by 21.9% and 11.9%. In summary, throughout the entire growing season, except for stems at maturity, eCO2 concentrations significantly reduced N concentrations in all plant organs (P< 0.05) regardless of N application level, with particularly notable decreases in leaves at the heading stage, stems during the vegetative stage, and roots at maturity.
2.3. 15N Uptake in Three Organs and Above-Ground (mg·g-1)
During the vegetative stage, under low-N treatment, eCO₂ significantly increased the exogenous ¹⁵N uptake by the stem of C. angustifolia species by 27.3% (P < 0.05), while ¹⁵N uptake by leaf and root decreased by 5.9% and 22.6% (P < 0.05). Under high-N treatment, eCO₂ raised stem ¹⁵N uptake by 13.0% (P < 0.05), whereas leaf and root ¹⁵N uptake declined by 19.9% and 44.3% at heading stage (P < 0.05); eCO₂ increased stem ¹⁵N uptake by 25.1% (P < 0.05), while leaf ¹⁵N uptake decreased by 5.7% (P < 0.05) and root ¹⁵N uptake decreased by 40.9% at vegetative stage (P < 0.05); eCO₂ boosted stem ¹⁵N uptake by 46.5% (P < 0.05), with leaf and root ¹⁵N uptake decreasing by 10.6% (P < 0.05) and 42.9% at maturity stage (P < 0.05). Thus, long-term CO₂ fumigation led to a marked reduction in N content of leaf and root tissues. The interaction between eCO₂ and N significantly affected the root’s ability to absorb exogenous N, while having little effect on the stem and leaf’s exogenous N uptake (Figure 2.).
2.4. N Use Efficiency (NUE) for Three Organs and Above-Ground
N use efficiency (NUE) refers to the ability of an organism or system to convert absorbed N into useful output. Generally, plant NUE varies among different organs as they develop. Under eCO₂ and N addition treatments, the NUE of C. angustifolia species’ stem gradually decreased with growth; the leaf NUE showed an initial increase followed by a decline; the root NUE exhibited no clear pattern (Figure 3).Under eCO₂ and low-N treatment, stem and leaf NUE increased by 12.8% and 10.5% at heading stage (P < 0.05); stem and leaf NUE increased by 10.8% and 13.1% at vegetative stage (P < 0.05); stem and leaf NUE increased by 7.5% and 11.5% at maturity stage (P < 0.05). Under eCO₂ and high-N treatment, stem and leaf NUE increased by 7.4% and 6.4% at heading stage (P < 0.05); stem and leaf NUE increased by 6.0% and 8.8% at vegetative stage (P < 0.05); stem and leaf NUE increased by 4.4% and 6.2% at maturity stage (P < 0.05).Throughout the growing season, eCO₂ combined with N addition did not enhance root NUE. Consequently, the interaction of eCO₂ and N addition increased stem NUE but reduced leaf and root NUE during the season. Moreover, high-N treatment exerted a significant negative effect on root NUE, and the NUE of all organs under high-N was lower than under low-N; thus, excess N did not improve the N use efficiency of C. angustifolia species’ organs.
2.5. N Allocation Among the Three Organs
Under eCO₂ concentrations and N deposition, the proportion of N allocated to C. angustifolia leaf was the highest across the three growth stages (P < 0.01) (Figure 4). In the high-N treatment, as the plant developed, the N allocated to leaves increased gradually, rising from 79.2% at heading to 84.1% at maturity; N allocated to stems decreased from 16.3% to 10.3% at maturity; and N allocated to roots increased from 4.5% to 5.7% at maturity. Under eCO₂, during the vegetative stage the highest N allocation was to leaves (57.3%); at heading and maturity, the N allocated to stems and roots was similar, being 13.7% vs. 14.2% and 32.8% vs. 32.6%. When eCO₂ and N addition interacted, leaf N allocation showed an initial increase followed by a slight decline: it rose from 75.2% at heading to 82.1% and then fell to 80.4% at maturity. However, across the three growth stages, N allocation to stems and roots showed no significant changes. These results indicate that eCO₂ and N deposition promote the upward movement of N within the plant, enhancing the leaf’s capacity to acquire N.
3. Discussion
N Concentration
In this study, the N concentration in each organ decreased as the plants developed under all treatments. Among all organs, the leaves consistently exhibited the highest N concentration, which enhanced the photosynthetic capacity per unit leaf area and thereby supported plant growth; this is also corroborated by the N allocation results (Figure 4.). Moreover, long-term eCO₂ significantly suppressed N concentrations in all organs. The reduction of plant nitrogen under eCO₂ has been widely reported [15,16,17]. The mechanisms underlying this phenomenon have been well elucidated: for example, limited soil-available nitrogen, constrained root uptake and transport, increased N loss, reduced root NUE, and an imbalance in carbon-to-nitrogen translocation within the plant [18,19,20,21]. Considering that total N accumulation and root N allocation remained unchanged, and that there was a trend of increasing soil-available N [22], it is likely that the carbon gain in plants exposed to rising CO₂ exceeded N uptake [23]. Additionally, different organs responded to eCO₂ to varying extents, with leaf N concentration declining more sharply than that of other organs. Distinct metabolic pathways operate in different plant organs, and these pathways shift under eCO₂, consistent with Du’s (2019) perspective [24]. While N addition alone markedly increased N concentration in all plant organs, the interaction of long-term eCO₂ and N deposition actually led to a decline in organ N concentrations; however, high-N treatment mitigated the negative effects associated with prolonged CO₂ enrichment. This conclusion aligns with the findings of Perkowski E.A. et al. (2023), who reported similar responses in soybeans under N addition combined with eCO₂[25].
NUE
NUE is a long-term indicator of plant N uptake effectiveness. In this study, regardless of treatment, leaf NUE was higher than that of other organs at all three growth stages. Long-term eCO₂ concentrations increased stem NUE, suggesting that under high CO₂ and natural conditions, plants accumulate the same amount of N but produce more dry matter under eCO₂. Similar positive responses of NUE to high CO₂ have been reported in other plant species [26]. This result may be due to the decline in biomass or N concentration caused by prolonged CO₂ exposure [27]. Consequently, we also observed that leaf NUE is more readily altered than that of other organs when plants are directly exposed to high-CO₂ environments. Moreover, NUE is influenced by the N environment, and N has a significant effect on the NUE of each organ. Plants without N addition exhibited relatively high NUE across all three growth stages. Regardless of CO₂ level, Yang et al. (2007) found that NUE significantly decreased as N levels increased, and Wei et al. (2018), using tomato as the experimental material, observed the same phenomenon. The difference lies in that, under low-N conditions, the increase in NUE is driven by an intensified nitrogen-to-carbon shortage, whereas the decrease in NUE for N-added plants in this study is mainly attributed to enhanced N uptake rather than increased carbon uptake.
N Uptake and Allocation
As plants grow and develop, N accumulation in leaves increases rapidly under all treatments, while N accumulation in stems and roots remains relatively stable. Correspondingly, the proportion of N allocated to leaves rises sharply, whereas the proportion allocated to stems and roots continuously declines, consistent with recent reports [29,30,31]. Regarding eCO₂, the total N content of plants remains unchanged, a finding also reported by Kim (2003) and Seneweera (2011)[32,33]. However, Wang et al. (2020) and Yang et al. (2007) showed that eCO₂ significantly enhances N uptake [34,35]. Therefore, the effect of eCO₂ on N uptake depends on the level of soil N supply, and several studies have indicated that the response of N uptake to eCO₂ is closely linked to soil N availability [35]. Although total N is unaffected, N concentrations in leaves and roots at maturity decrease by 10.6% and 42.69%, compared with ambient conditions. Moreover, with rising CO₂, N allocation to leaves and roots is suppressed, while allocation to stems increases. Under long-term CO₂ enrichment, N fertilization further boosts plant N uptake and markedly raises the proportion of nitrogen allocated to leaves, possibly because eCO₂ triggers greater N demand, causing N to be redistributed from roots to rapidly growing leaves. In addition, prolonged CO₂ exposure enables plants to fix more carbon; to maintain a balance between C and N, more N must be transported from roots to leaves [36,37]. As mentioned earlier, N is crucial for photosynthesis [38,39]. Generally, roots are the first organ to acquire nutrients such as nitrogen from the soil, such as biomass, length, depth, etc. ,significantly influence crop N uptake rates and NUE [40].
Regardless of whether the CO₂ concentration is elevated or ambient, N addition significantly increased N accumulation in all organs of C. angustifolia as well as in the whole plant, and most of N was allocated to the leaves during the growth period. This finding is consistent with the results reported in reference [35].Cheng et al. (2011)[41] reported that excessive N application reduces the plant N harvest index because the surplus N is primarily deposited in leaves and straw. Therefore, in agricultural production, appropriate N fertilization is essential; over-application leads to waste, lowers NUE, and adversely affects economic returns [33,42].
Conclusions
In summary, long-term CO₂ enrichment and N deposition have varying impacts on N uptake and utilization in the different organs of C. angustifolia. In most cases, N addition increases both the biomass and N concentration of all plant organs. However, prolonged CO₂ exposure reduces the biomass and N concentration of the organs, while high-N availability mitigates these negative effects. Moreover, excessive N lowers NUE. Therefore, in agricultural production it is necessary to select varieties with higher NUE and to develop optimal fertilization strategies for future environments with eCO₂ concentrations.
Funding
Natural Science Fund Project of Heilongjiang Province(PL2024C033)and Research-Institute Scientific Research Funding Project of Heilongjiang Province(CZKYF2021-2-A005).
References
- IPCC 2021. Summary for policymakers. In: Masson-Delmotte V, Zhai P, Pirani A, eds. Climate Change 2021: The Physical Science Basis. Contribution of Working Group I to the Sixth Assessment Report of the Intergovernmental Panel on Climate Change. Cambridge University Press.
- Coviella, C. E., & Trumble, J. T. Effects of elevated atmospheric carbon dioxide on insect-plant interactions. Conservation Biology,1999, 13(4):700-712. [CrossRef]
- Viswanath. An analysis of social network-based Sybil defenses,SIGCOMM 2010(conference paper).
- Alistair Rogers, Elizabeth A. Ainsworth ,and Andrew D.B. Leakey.Will elevated carbon dioxide concentration amplify the benefits of N fixation in legumes? Plant Physiology,2009, 151(3):1009-1016. [CrossRef]
- Kim HY, Lieffering M, Kobayashi K, Okada M, Miura S. Seasonal changes in the effects of elevated CO2 on rice at three levels of N supply: a free air CO2 enrichment (FACE) experiment. Glob Chang Biol ,2003,9:826–837. [CrossRef]
- Dakora, F.D. and Drake, B.G. Elevated CO2 stimulates associative N2 fixation in a C3 plant of the Chesapeake Bay wetland. Plant, Cell and Environment ,2000,23: 943-953. [CrossRef]
- Craig D. Idso, Sherwood B. Idso et al. Climate Change Reconsidered II:Biological Impacts.2014.
- Arnold J. Bloom, P. Kasemsap, J. S. Rubio-Asensio et al. Rising atmospheric CO₂ concentration inhibits nitrate assimilation in shoots but enhances it in roots of C₃ plants. Physiologia Plantarum,2020, 168 : 963-972. [CrossRef]
- Pang Jing, Zhu Jian-guo, Xie Zu-bin. Effect of elevated atmospheric CO2 on nitrogen uptake by plant. Ecology and Enviroment,2005,14(3):429-433.
- Zong Yuzheng. Respones of C and N Allocation of Maize Seedlings Under Elevated CO2.Beijing:University of Chinese Academy of Sciences, 2013.
- Ni Hongwei. Research on Plant Diversity in the Wetlands of the Sanjiang Plain. Postdoctoral Fellowship Exit Report, Northeast Normal University,2001.
- Ni Hongwei, Zang Shuying, Gao Yike. Study on seasonal Dynamics of aboveground biomass and growth rate of Deyeuxia angustifolia population in marsh meadow on sanjiang plain. Bulletin of botanical research,1996,16(4) : 489-495.
- Ni Hongwei. Study on the biomass of aboveground organs and layer structure of Deyeuxia angustifolia in typical meadow on sanjiang plain. Bulletin of botanical research,1996,16(3): 356-362.
- Ni Hongwei, Zhang Xing, Jia Li, Gao Yuhui ,Wu Haiyi. The aboveground biomass dynamics of Deyeuxia angustifolia population in typical meadow on sanjiang plain, Bulletin of botanical research,1998,18(3): 328-335.
- Bruce A.Hungate,Dale W.Johnson,Paul Dijkstra et al. N Cycling during Seven Years of Atmospheric CO₂ Enrichment in a scrub oak woodland. Ecology,2006, 87(1): 26–40. [CrossRef]
- Dileepa M. Jayawardena,Scott A. Heckathorn,ennifer K. Boldt. A meta-analysis of the combined effects of elevated carbon dioxide and chronic warming on plant %N, protein content and N-uptake rate. AoB Plants ,2021,13(4) :plab031. [CrossRef]
- Johan Uddling , Zhaozhong Feng, Tobias Rütting et al. Increased carbon dioxide levels in air restrict plants’ ability to absorb nutrients. Global Change Biology,2015,21(8):3152-3168.
- Feng ZZ, Rütting T, Pleijel H et al. Constraints to N acquisition of terrestrial plants under elevated CO2. Glob Chang Biol,2015, 21:3152–3168. [CrossRef]
- Guo J, Zhang MQ, Wang XW et al. A possible mechanism of mineral responses to elevated atmospheric CO2 in rice grains. J Integr Agric,2015,14:50–57. [CrossRef]
- Leakey AD, Ainsworth EA, Bernacchi CJ et al. Elevated CO2 effects on plant carbon, N, and water relations: six important lessons from FACE. J Exp Bot,2009,60:2859–2876. [CrossRef]
- Pang J, Zhu JG, Xie ZB et al. A new explanation of the N concentration decrease in tissues of rice (Oryza sativa L.) exposed to elevated atmospheric pCO2. Environ Exp Bot,2006, 57:98–105. [CrossRef]
- Wu QC, Zhang CZ, Liang XQ et al. Elevated CO2 improved soil N mineralization capacity of rice paddy. Sci Total Environ,2020,710:136438. [CrossRef]
- Guo J, Zhang MQ, Wang XW et al. Elevated CO2 facilitates C and N accumulation in a rice paddy ecosystem. J Environ Sci-China,2015, 29:27–33. [CrossRef]
- Du CJ, Wang XD, Zhang MY et al. Effects of elevated CO2 on plant C-N-P stoichiometry in terrestrial ecosystems: a meta-analysis. Sci Total Environ,2019, 650:697–708. [CrossRef]
- Evan A. Perkowski、Ezinwanne Ezekannagha、Nicholas G. Smith. N demand, supply, and acquisition strategy control plant responses to elevated CO2 at different scales. bioRxiv. 2023 Dec 13. [CrossRef]
- Wei ZH, Du TS, Li XN et al. Interactive effects of CO2 concentration elevation and N fertilization on water and N use efficiency of tomato grown under reduced irrigation regimes. Agr Water Manage,2018, 202:174–182. [CrossRef]
- Reddy AR, Rasineni GK, Raghavendra AS. The impact of global elevated CO2 concentration on photosynthesis and plant productivity. Curr Sci,2010,99:46–57.
- Yang LX, Huang JY, Yang HJ et al. Seasonal changes in the effects of free-air CO2 enrichment (FACE) on N (N) uptake and utilization of rice at three levels of N fertilization. Field Crop Res,2007, 100:189–199. [CrossRef]
- Liu X., Wang Y., Zhang J. ECO₂ and N addition jointly affect N allocation in a temperate grassland. Global Change Biology,2021, 27: 2159-2172.
- Wang L., Zhao M., Li H. N partitioning in wheat under progressive N limitation and eCO₂. Plant Physiology,2024, 186: 1120-1135.
- Biemond H. N nutrition effects on development, growth and N accumulation of vegetables (Ph.D. thesis, Wageningen University),2020.
- Kim HY, Lieffering M, Kobayashi Ket al. Seasonal changes in the effects of elevated CO2 on rice at three levels of N supply: a free air CO2 enrichment (FACE) experiment. Glob Chang Biol,2003, 9:826–837. [CrossRef]
- Seneweera S .Effects of elevated CO2 on plant growth and nutrient partitioning of rice (Oryza sativa L.) at rapid tillering and physiological maturity. J Plant Interact,2011,6:35–42. [CrossRef]
- Wang B, Guo C, Wan YF et al. Air warming and CO2 enrichment increase N use efficiency and decrease N surplus in a Chinese double rice cropping system. Sci Total Environ,2020, 706:136063. [CrossRef]
- Yang LX, Huang JY, Yang HJ et al. Seasonal changes in the effects of free-air CO2 enrichment (FACE) on N (N) uptake and utilization of rice at three levels of N fertilization. Field Crop Res,2007, 100:189–199. [CrossRef]
- Du CJ, Wang XD, Zhang MY et al. Effects of elevated CO2 on plant C-N-P stoichiometry in terrestrial ecosystems: a meta-analysis. Sci Total Environ,2019, 650:697–708. [CrossRef]
- Guo J, Zhang MQ, Wang XW et al. Elevated CO2 facilitates C and N accumulation in a rice paddy ecosystem. J Environ Sci-China,2015, 29:27–33. [CrossRef]
- Kattge J, Knorr W, Raddatz T et al. Quantifying photosynthetic capacity and its relationship to leaf N content for global-scale terrestrial biosphere models. Glob Chang Biol,2009, 15:976–991. [CrossRef]
- Wang J, Wen XF, Zhang XY et al. Co-regulation of photosynthetic capacity by N, phosphorus and magnesium in a subtropical Karst forest in China. Sci Rep,2018, 8:7406. [CrossRef]
- Kim HY, Lieffering M, Miura S et al. Growth and N uptake of CO2-enriched rice under field conditions. New Phytol,2001,150:223–229. [CrossRef]
- Cheng JF, Jiang HY, Liu YB et al. Methods on identification and screening of rice genotypes with high-N efficiency. Rice Sci,2011, 18:127–135. [CrossRef]
- Yang LX, Wang YL, Dong GC et al. The impact of free-air CO2 enrichment (FACE) and N supply on grain quality of rice. Field Crop Res,2007,102:128–140. [CrossRef]
Figure 1.
N concentration of three organs and above-ground of C. angustifolia under eCO₂ and N deposition conditions at three stages.
Figure 1.
N concentration of three organs and above-ground of C. angustifolia under eCO₂ and N deposition conditions at three stages.
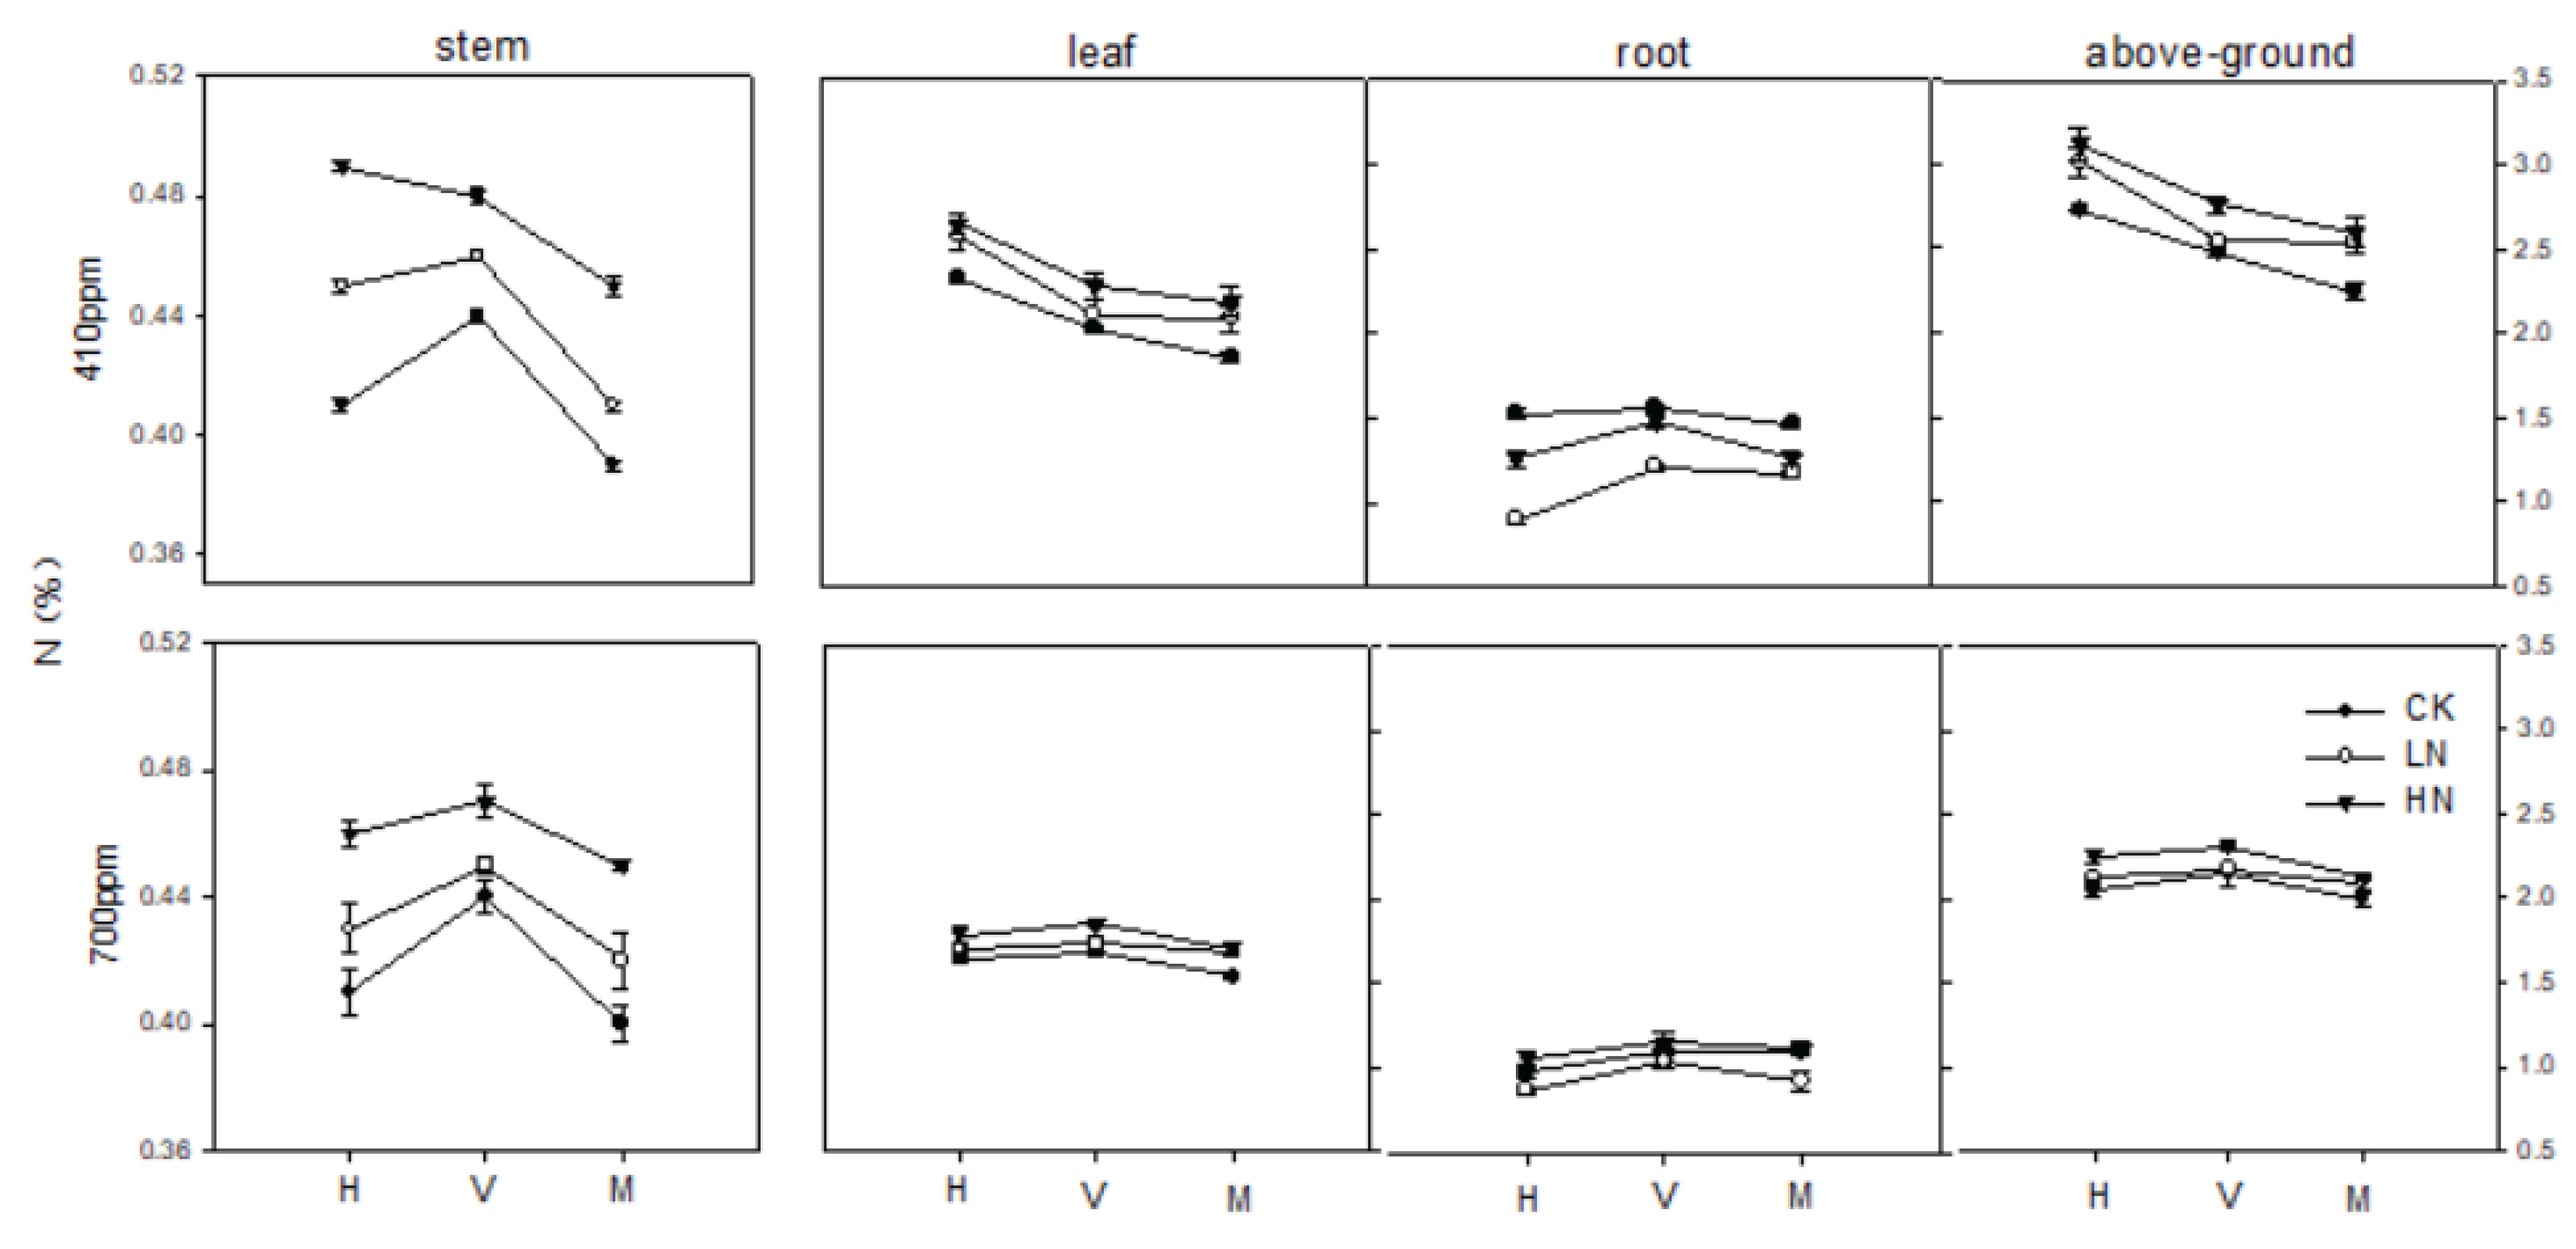
Figure 2.
The 15N uptake of three organs and above-ground of C. angustifolia under eCO₂ and N deposition conditions at three stages.
Figure 2.
The 15N uptake of three organs and above-ground of C. angustifolia under eCO₂ and N deposition conditions at three stages.
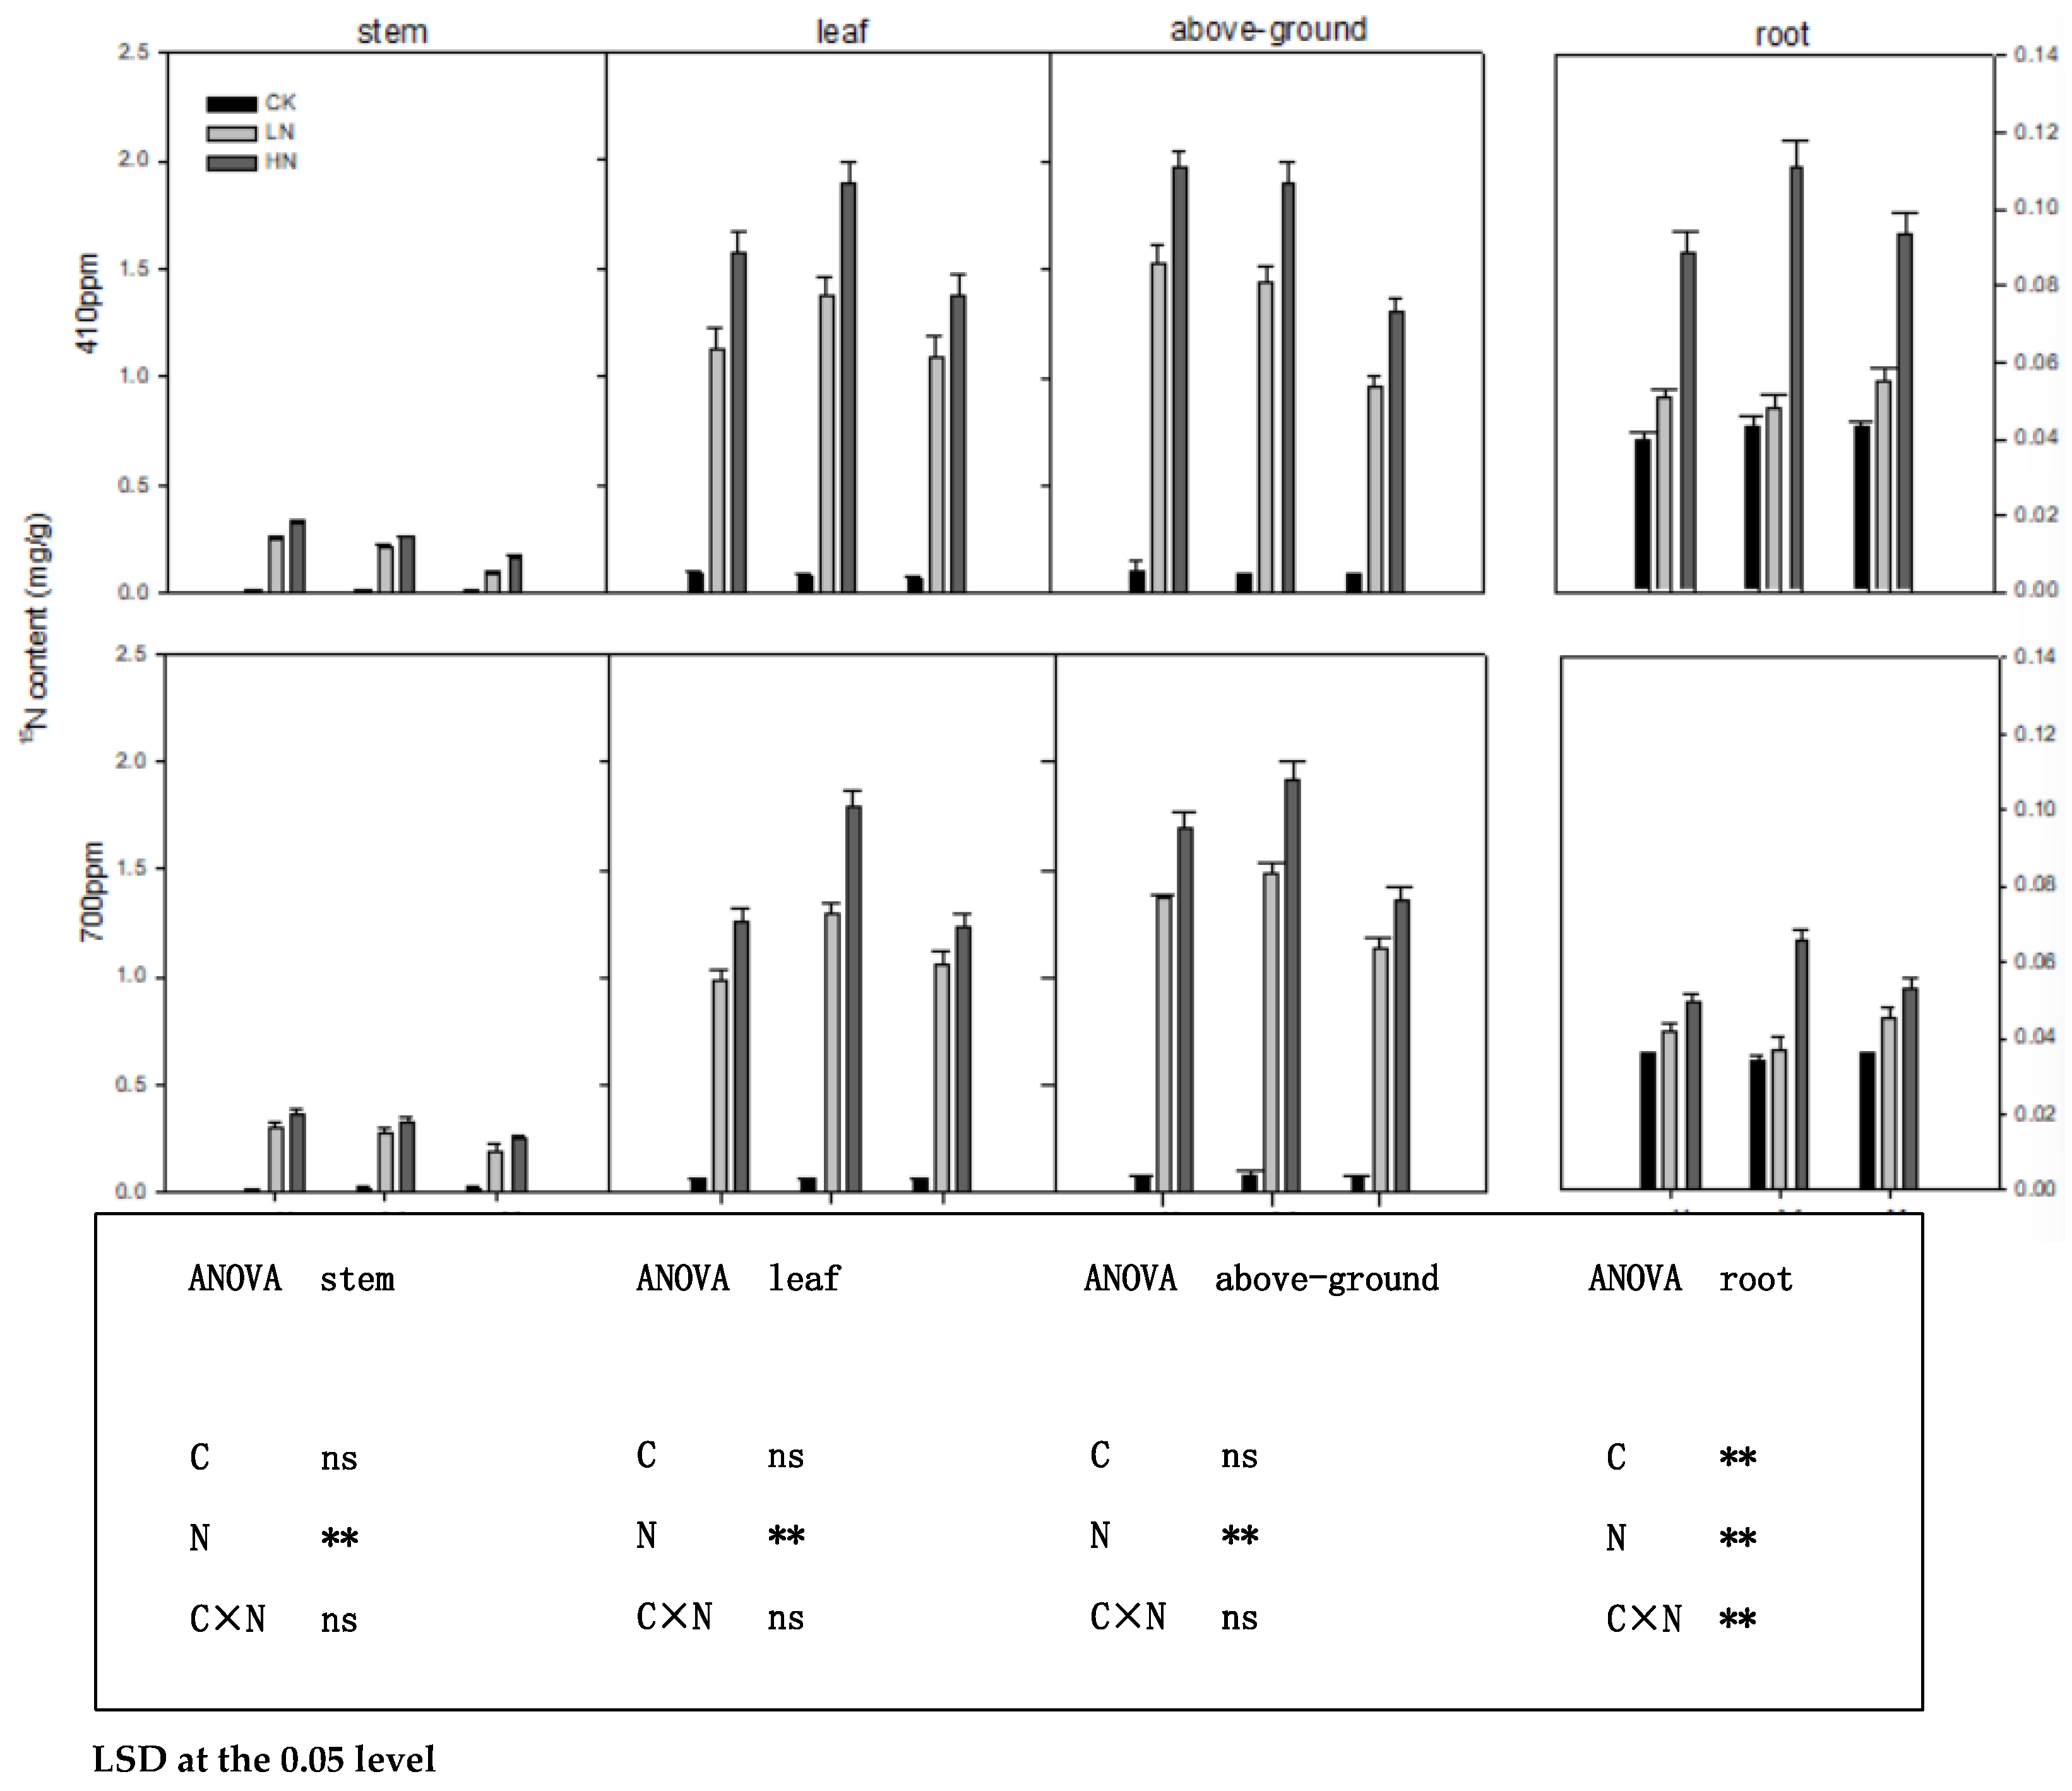
Figure 3.
The NUE of three organs and above-ground of C. angustifolia under eCO₂ and N deposition conditions at three stages.
Figure 3.
The NUE of three organs and above-ground of C. angustifolia under eCO₂ and N deposition conditions at three stages.
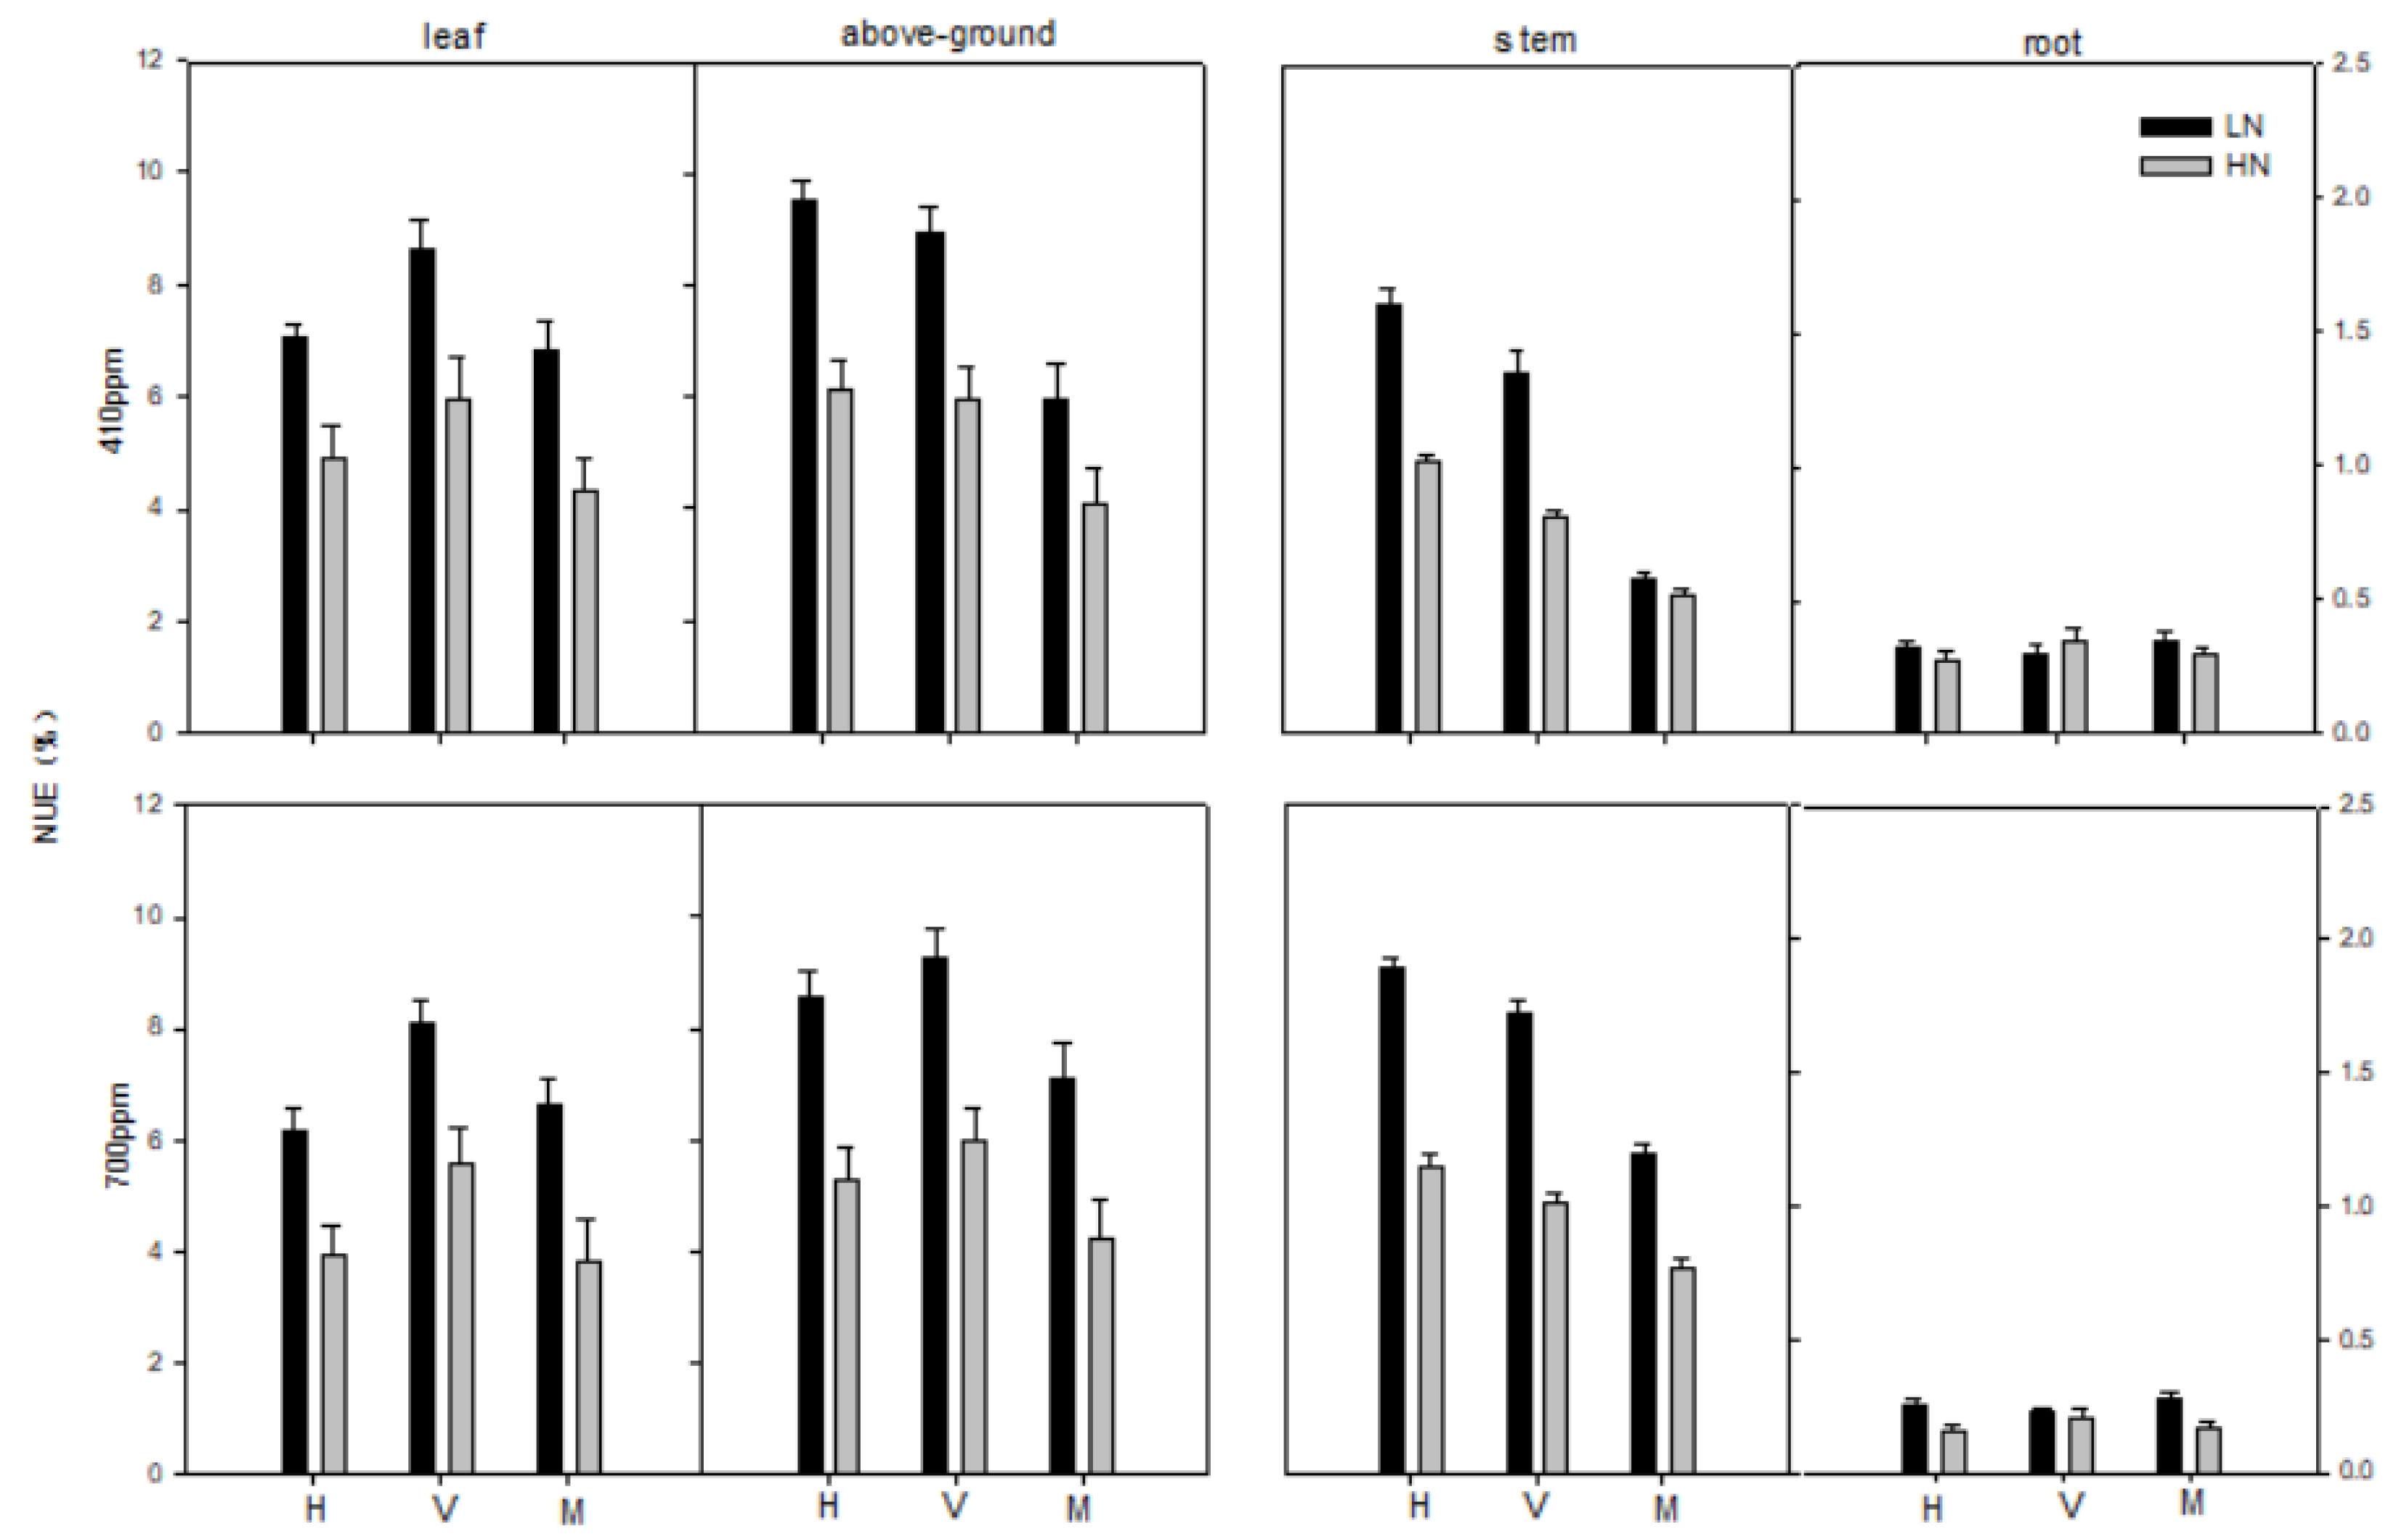
Figure 4.
The N allocation of C. angustifolia under eCO₂ and N deposition conditions at three stages.
Figure 4.
The N allocation of C. angustifolia under eCO₂ and N deposition conditions at three stages.
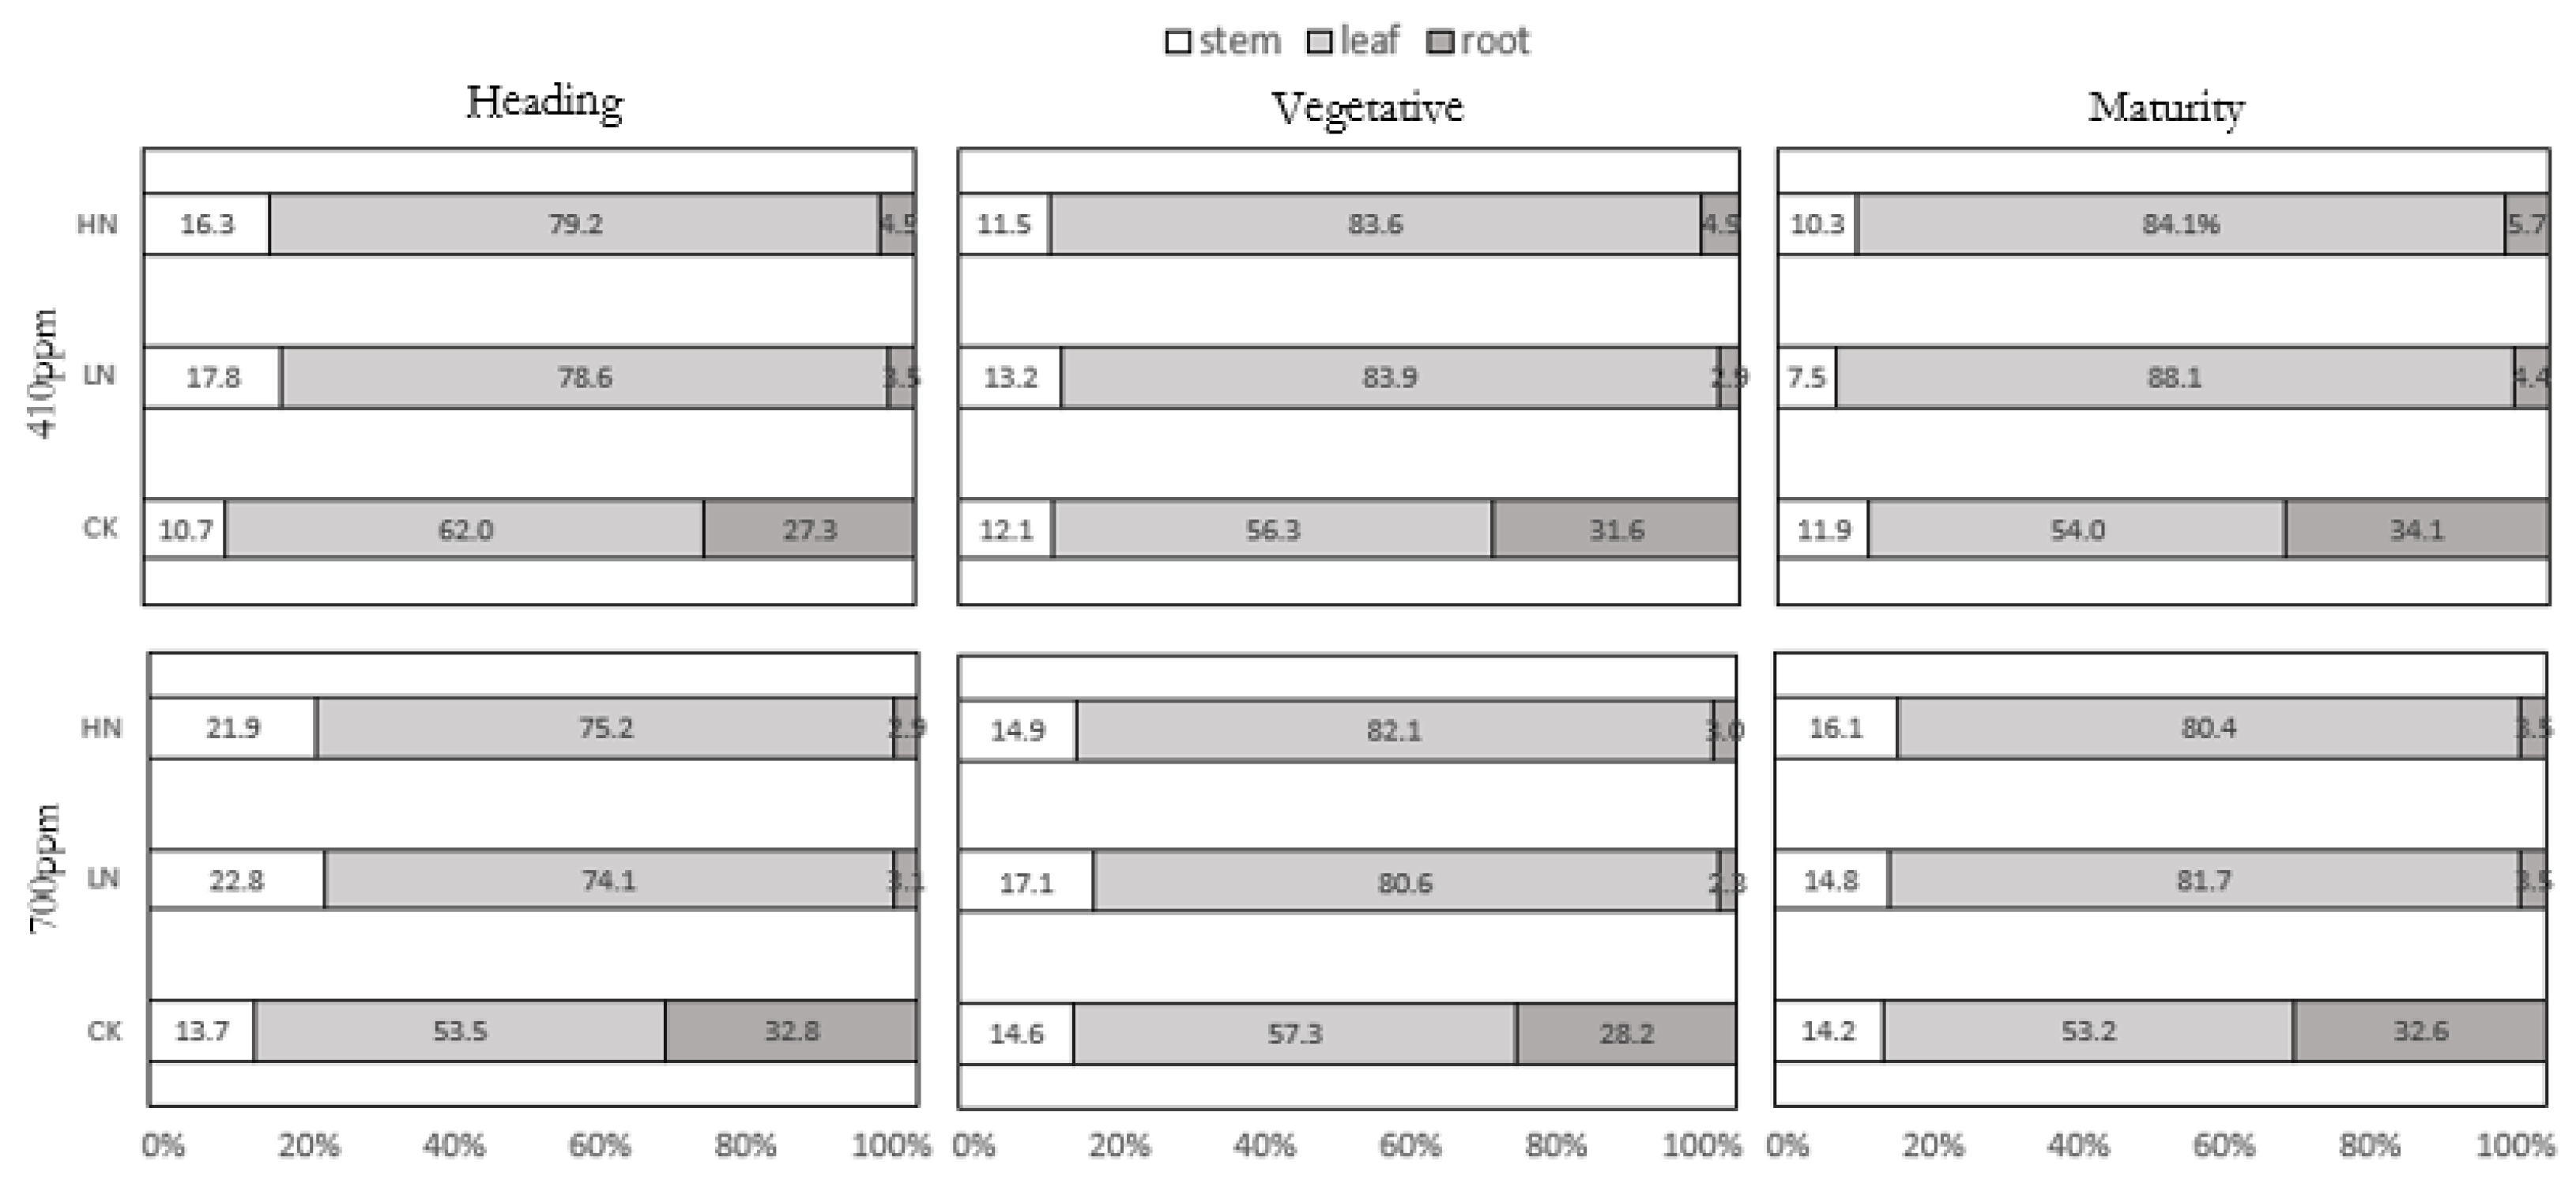

Table 1.
Biomass of three organs and above-ground of C. angustifolia under eCO₂ and N deposition conditions at three stages.
Table 1.
Biomass of three organs and above-ground of C. angustifolia under eCO₂ and N deposition conditions at three stages.
| Growth stage | CO2 (ppm) |
N | Biomass(g/0.01m2) | |||
| Stem | Leaf | Root | Above-ground | |||
| heading(H) | 410 | CK | 2.18±1.36 | 1.25±1.23 | 15.40±1.19 | 3.43±1.32 |
| LN | 2.61±1.34 | 1.74±0.85 | 14.00±2.38 | 4.35±1.38 | ||
| HN | 3.16±1.36 | 1.92±0.31 | 12.00±3.97 | 5.08±1.97 | ||
| 700 | CK | 1.68±0.39 | 1.12±0.34 | 13.59±2.73 | 2.80±1.73 | |
| LN | 1.96±0.58 | 1.31±0.15 | 11.23±3.29 | 4.27±1.29 | ||
| HN | 2.18±1.39 | 1.72±0.25 | 10.87±2.37 | 3.90±1.37 | ||
| vegetative(V) | 410 | CK | 3.84±1.36 | 2.38±1.39 | 29.50±4.85 | 6.22±2.29 |
| LN | 4.21±1.37 | 4.25±1.53 | 18.50±3.75 | 8.46±1.75 | ||
| HN | 4.38±1.18 | 4.51±1.23 | 27.70±5.43 | 8.89±1.43 | ||
| 700 | CK | 2.35±1.74 | 2.35±0.22 | 19.26±4.97 | 3.67±1.97 | |
| LN | 3.28±1.73 | 3.56±1.29 | 12.38±2.29 | 6.84±1.29 | ||
| HN | 3.96±1.41 | 4.45±1.69 | 17.56±3.27 | 8.41±2.27 | ||
| maturity(M) | 410 | CK | 8.34±3.59 | 4.60±2.68 | 23.70±10.99 | 12.94±2.97 |
| LN | 5.72±2.84 | 2.63±1.85 | 21.08±14.93 | 8.35±2.12 | ||
| HN | 8.02±3.67 | 3.41±1.16 | 30.56±19.92 | 11.43±3.23 | ||
| 700 | CK | 5.24±2.54 | 1.99±0.82 | 16.88±5.53 | 7.23±1.97 | |
| LN | 4.63±3.39 | 2.50±1.60 | 14.33±3.87 | 7.13±1.64 | ||
| HN | 7.16±4.27 | 4.36±2.52 | 19.16±9.70 | 11.52±3.93 | ||
Disclaimer/Publisher’s Note: The statements, opinions and data contained in all publications are solely those of the individual author(s) and contributor(s) and not of MDPI and/or the editor(s). MDPI and/or the editor(s) disclaim responsibility for any injury to people or property resulting from any ideas, methods, instructions or products referred to in the content. |
© 2026 by the authors. Licensee MDPI, Basel, Switzerland. This article is an open access article distributed under the terms and conditions of the Creative Commons Attribution (CC BY) license.
Copyright: This open access article is published under a Creative Commons CC BY 4.0 license, which permit the free download, distribution, and reuse, provided that the author and preprint are cited in any reuse.


