
Submitted:
04 June 2026
Posted:
05 June 2026
You are already at the latest version
Abstract
In this study, a multi-hazard risk analysis at the neighborhood scale was conducted for the historic Ferhatpaşa Mosque located in Çatalca, Istanbul. Within the scope of the research, eight different parameters were evaluated: slope, elevation, aspect, precipitation, distance to fault lines, hydrological structure, land use, and soil capability. As a result of the modeling process, which was based on Geographic Information Systems (GIS)-based Weighted Overlay analysis and shaped through interdisciplinary expert opinions, 71.99% of the study area was classified as medium risk, 28% as low risk, and 0.02% as high risk. The mosque, as a cultural heritage asset, was found to be located within the medium-risk zone. These concrete findings provide technical guidance that can directly inform the cultural heritage conservation and strategic risk mitigation planning efforts of both local and central authorities.
Keywords:
cultural heritage
; disaster risk
; disaster resilient planning
; risk management
; GIS
1. Introduction
1.1. Cultural Heritage Management and the Multi-Hazard Approach
The Cultural heritage is increasingly exposed to complex and interconnected risks arising from natural, technological, environmental, and human-induced hazards. In this context, the identification of threats that may lead to the deterioration, damage, or loss of heritage assets requires a clear understanding of the fundamental concepts of disaster risk management, including hazard, vulnerability, risk analysis, and risk assessment [1]. These concepts are particularly important for heritage studies, as cultural assets are not only physical structures but also carriers of collective memory, identity, and historical continuity.
A hazard refers to a phenomenon or process with the potential to cause damage to a cultural asset or disrupt its functioning. Such hazards may include natural events, such as earthquakes, floods, and storms, as well as human-induced events, including armed conflict, uncontrolled urbanization, or inappropriate interventions [2]. According to UNISDR [3], hazards may generate loss of life, injury, property damage, social and economic disruption, environmental degradation, and the loss of services and livelihoods. Vulnerability, on the other hand, refers to the degree to which a community, system, or asset is susceptible to the damaging effects of a hazard [2,3]. In the case of cultural heritage, vulnerability is shaped not only by the physical condition of the structure, but also by its environmental setting, maintenance history, surrounding land use, governance capacity, and exposure to multiple hazards.
Risk is commonly defined as the combination of hazard and vulnerability [2]. It refers to the probability of a hazardous event occurring and producing adverse consequences for a specific asset or system. Nirupama [1] expresses the standard risk relationship as follows:
R(risk) = H(hazard) × V(vulnerability)
However, risk should not be reduced to probability alone. As Pedersoli, Antomarchi, and Michalski [4] argue, risk assessment must consider both the likelihood of an event and the magnitude of its potential impacts. When hazard and vulnerability are analyzed together, it becomes possible to anticipate potential damage and develop more effective prevention, preparedness, and conservation strategies.
Disasters are generally defined as natural, technological, or human-induced events that disrupt the normal functioning of society, exceed existing coping capacities, and cause physical, economic, social, and environmental losses [5]. While AFAD [5] classifies disasters broadly as natural and human-induced, Gökçe and Tetik [6] distinguish between sudden-onset disasters, such as earthquakes, storms, floods, avalanches, rockfalls, and landslides, and slow-onset disasters, such as drought, erosion, environmental pollution, sea-level rise, and deforestation. For cultural heritage, this distinction is crucial, since historic buildings and sites may be affected not only by sudden destructive events but also by cumulative environmental pressures that gradually weaken their structural and material integrity.
Disaster risk is not produced by hazards alone. As Varol and Gültekin [7] emphasize, disasters of similar magnitude may result in different levels of damage depending on the vulnerability, preparedness, and coping capacity of societies. This perspective is also underlined by the United Nations Office for Disaster Risk Reduction (UNDRR), which frames disaster risk as socially produced rather than merely natural. According to the UNDRR 2024 report, poverty, inequality, unhealthy urban development, and failures in environmental governance are among the main drivers of increasing disaster risk [8]. In historic urban areas, these drivers are reflected in the deterioration of heritage structures, the degradation of surrounding landscapes, inadequate infrastructure, and the lack of risk-sensitive planning.
The UNDRR 2025 report further stresses that the expected outcome of the Sendai Framework—reducing losses in economic, physical, social, cultural, and environmental assets—has not yet been fully achieved [9]. This positions cultural heritage not as a secondary concern, but as an integral component of disaster risk reduction and sustainable development. From this perspective, the protection of heritage assets requires moving beyond object-based conservation toward spatially integrated, risk-informed, and sustainability-oriented management frameworks.
Cultural heritage structures are rarely exposed to a single type of hazard. Instead, they are often affected by cascading and compounding hazards. For example, seismic shaking may be followed by soil liquefaction, slope instability, hydrological changes, increased surface runoff, or rainfall infiltration into foundation systems. These interactions may intensify structural vulnerability and accelerate the deterioration of historic buildings. Therefore, multi-hazard risk assessment provides a more realistic basis for identifying priority areas, guiding conservation interventions, and supporting disaster risk reduction policies.
Within this framework, this study contributes to the literature in three ways. First, it shifts cultural heritage risk assessment from a single-hazard perspective to a multi-hazard and spatially integrated framework. Second, it bridges GIS-based environmental risk modeling with sustainable heritage management. Third, it offers a replicable neighborhood-scale decision-support model that can inform local governments, conservation authorities, and disaster risk reduction agencies.
1.2. Study Area: Çatalca and Ferhatpaşa Mosque
Istanbul is the most populous and one of the most densely built metropolitan areas in Türkiye. Due to its location within the seismically active Marmara region, the city has long been the subject of studies addressing the potentially destructive consequences of a major earthquake. Ertürk [10] developed a possible Mw 7.6 earthquake scenario for Istanbul by mapping seismicity data, rupture probabilities, and the spatial distribution of risk across the city. The study discusses in detail the high seismic potential of the Marmara region and the possible scale of destruction that such an earthquake may generate in Istanbul [10]. Similarly, the Istanbul Metropolitan Municipality Directorate of Earthquake and Ground Investigation prepared the “Istanbul Province Probable Earthquake Loss Estimation Update Project” based on a Mw 7.5 scenario earthquake [11]. This project estimates expected building damage, infrastructure losses, casualties, injuries, and temporary shelter needs under 15 different earthquake scenarios.
Within this broader seismic risk context, Çatalca and, more specifically, Ferhatpaşa Neighborhood were selected as the case study area for three main reasons. First, Çatalca has a large surface area and a relatively low-rise settlement pattern, which makes it significant for post-earthquake temporary shelter planning for Istanbul’s dense population. Second, according to the Istanbul Metropolitan Municipality, Department of Earthquake Risk Management and Urban Improvement [11], Çatalca ranks among the districts with a notably high estimated number of buildings expected to experience different levels of damage in a possible earthquake scenario. Third, Ferhatpaşa Neighborhood contains 39 registered cultural heritage assets, making it a critical area for examining the relationship between disaster risk, cultural heritage protection, and sustainable urban resilience.
In this context, Ferhatpaşa Mosque, one of the most important cultural heritage assets in Ferhatpaşa Neighborhood, was selected as the focal heritage site of this study for disaster risk assessment (Figure 1a). Built in the sixteenth century by Mimar Sinan, Ferhatpaşa Mosque has preserved the architectural characteristics of the classical Ottoman period to the present day [12]. Located in the western part of the district, the mosque is situated on sloping terrain. Since it stands at a higher elevation than the street level to the east, its ablution courtyard is enclosed by retaining walls on three sides. In the event of seismic shaking, the combined effects of local slope conditions, soil characteristics, and excessive rainfall may trigger mass movements, settlement, or slope instability, thereby directly threatening the structural safety of the building. A fountain is located on the façade facing the street, while a domed sıbyan school is situated in the northeastern corner of the mosque courtyard (Figure 1b).
The square-planned prayer hall of the mosque is covered by a dome with a diameter of 9.20 meters (Figure 2). On the exterior, the dome is surrounded by a low octagonal drum and is carried by pendentives that transfer the load to the main walls. Ferhatpaşa Mosque was registered as a cultural heritage asset by the decision of the High Council of Immovable Antiquities and Monuments dated 8 January 1983 and numbered 14541. Its registered status was later confirmed by the decision of the High Council for the Conservation of Cultural and Natural Assets dated 14 November 1985 and numbered 1566.
2. Materials and Methods
2.1. Determination of GIS-Based Multi-Hazard Criteria and Rationale for Selection
Assessing the vulnerability of a region to disasters requires the collection, analysis, updating, and spatial mapping of detailed information on both the study area and relevant natural hazards. Disaster risk reduction depends on the capacity to transform such information into preventive and risk-informed planning measures. Since natural hazards are spatial phenomena and their impacts vary according to topography, land use, soil characteristics, hydrology, and built environment conditions, Geographic Information Systems (GIS) provide an effective tool for conducting multi-parameter risk analyses.
In this study, a GIS-based disaster risk assessment was conducted at the neighborhood scale for a historical heritage asset. The Weighted Overlay method was used as the main analytical procedure. Factor maps obtained from different sources and at different spatial scales constituted the basis of the analysis. Through these maps, eight parameters were collected, processed, and evaluated: slope, aspect, elevation, precipitation, distance to hydrological structures, distance to fault lines, soil capability, and land use.
This article builds upon a graduate research project entitled “Geographic Information Systems (GIS)-Based Disaster Risk Analysis for the Protection of Cultural Heritage: The Case of Ferhatpaşa Mosque, a Work of Mimar Sinan, in Çatalca, Istanbul,” prepared at Istanbul Gelişim University. In the first stage of the research, relevant literature on disaster risk assessment, cultural heritage vulnerability, and GIS-based spatial analysis was reviewed. Based on this review, the criteria to be included in the disaster risk model were identified. The rationale for selecting these criteria is presented in Table 1.
The datasets used in the GIS analyses are detailed in Table 2. In the second stage of the study, all spatial data were digitized in ArcGIS 10.5 within the boundaries of the study area. The eight parameters—slope, aspect, elevation, precipitation, distance to hydrological structures, distance to fault lines, soil capability, and land use—were converted into spatial data layers. These layers were standardized in terms of coordinate reference system, spatial resolution, and analysis boundary before being used in the weighted overlay model.
The Digital Elevation Model (DEM) of the study area was downloaded from the ALOS PALSAR EarthData platform with a spatial resolution of 12.5 meters. Using this DEM, slope, aspect, elevation, and hydrological structure maps were generated through GIS-based tools. The hydrological map produced from the DEM was compared with the hydrological data provided by ISKI. Since the DEM-based analysis offered a more detailed representation of local hydrological patterns, it was used as the primary basis for hydrological distance analysis. Distance maps for hydrological structures and fault lines were produced by creating buffer zones within the GIS environment. Land use and soil capability data were mapped by selecting the relevant attribute data within the neighborhood boundary. For precipitation, measurement data obtained from the relevant institution were used to calculate average annual precipitation. This calculation was carried out in the GIS environment using the Schreiber formula in combination with DEM data. Subsequently, precipitation distribution was analyzed using the IDW (Inverse Distance Weighted) interpolation method.
2.2. Expert Opinions and Criteria Weighting Process
In the disaster risk analysis, the selected parameters were reclassified into three risk levels based on the literature: 1 = low risk, 2 = medium risk, and 3 = high risk. The classification intervals and effect values were determined by referring to AFAD’s local ground investigation guidelines and the literature on seismic risk mitigation for cultural heritage, including ISMEP [20], while considering the structural tolerance limits of historic buildings.
To reduce subjectivity in assigning the relative importance of the eight parameters, the study employed an expert-based evaluation process similar to the Delphi technique. Five senior experts from different disciplines—architecture, urban and regional planning, civil engineering, geomatics engineering, and geodesy and photogrammetry engineering—were consulted. The experts were asked to assess the direct and indirect effects of each criterion on the structural integrity of a historic building according to its location. The ranking data obtained from the experts were normalized and used as input for the Weighted Overlay analysis. Based on the resulting scores, the relative influence of each parameter was ranked, percentage distributions were calculated, and weight values were assigned to each criterion.
2.3. Weighted Overlay Modeling
In the third stage of the study, the reclassified spatial layers and their corresponding weight values were integrated into the Weighted Overlay model. The layers were overlaid to identify and map areas with different levels of disaster risk potential. The resulting disaster risk map was then spatially compared with field observations conducted in the study area. This comparison provided a field-based plausibility check for the model and supported the interpretation of the final risk map (Figure 3).
The Weighted Overlay method was selected because it enables the integration of multiple spatial criteria with different weights into a single composite risk surface. In this approach, input layers are scored, normalized, weighted, and overlaid in order to evaluate the combined spatial distribution of risk. All layers were standardized within the same coordinate system, cell size, and study area boundary before the analysis was performed.
The risk score was calculated using the following formula:
Risk Score = Σ (Parameter Effect Value × Parameter Weight)
This formulation allowed the model to combine both the classified risk level of each parameter and its relative importance in relation to the vulnerability of the heritage asset.

Table 3.
Data used in the methodology and the institutions from which they were obtained.
| Data | Source Institution |
|---|---|
| Boundaries of Çatalca District and Ferhatpaşa Neighborhood | Istanbul / Çatalca Cadastral Directorate |
| Digital Elevation Model (DEM) of Çatalca District | ALOS PALSAR EarthData Platform |
| Soil capability and land use | Ministry of Agriculture and Forestry, Soil, Fertilizer and Water Resources Central Research Institute |
| Fault lines | General Directorate of Mineral Research and Exploration |
| Hydrological structure | Istanbul Metropolitan Municipality, ISKI General Directorate |
| Precipitation data | Ministry of Environment, Urbanization and Climate Change, Turkish State Meteorological Service |
| Location of Ferhatpaşa Mosque and information on cultural heritage assets in Ferhatpaşa Neighborhood | Istanbul Metropolitan Municipality, Directorate of Cultural Heritage Conservation |
| Registration decisions and historical photographs of Ferhatpaşa Mosque | General Directorate of Foundations, 1st and 2nd Regional Directorates of Foundations |
3. Results
A review of the scientific literature shows that the Weighted Overlay method has been widely used in the analysis of flood/inundation risk, earthquakes, avalanches, landslides, fires, and seismic hazards. While most flood/inundation and avalanche risk studies focus on the watershed scale, studies addressing landslides, earthquakes, and general disaster risk tend to concentrate on the provincial or district scale. The factors used in these studies were reviewed, and the parameters employed in the present research were determined accordingly.
According to the reports published by the Directorate of Earthquake and Ground Investigation (DEZİM) [11], estimated numbers of damaged buildings were provided for Çatalca District under a deterministic Mw = 7.5 scenario earthquake. For Ferhatpaşa Neighborhood, located in the southern part of the district, the projections indicate that 8 buildings are expected to suffer severe damage, 40 buildings moderate damage, 225 buildings slight damage, and 550 buildings very slight damage. When Ferhatpaşa Neighborhood is compared with other neighborhoods, it ranks among the most vulnerable areas in terms of estimated building damage and exhibits a considerable degree of fragility in its building stock. The same reports also identify Ferhatpaşa Neighborhood as the area with the highest vulnerability in terms of potential population loss.
3.1. Disaster Risk Factors Affecting Ferhatpaşa Mosque
The parameters generating disaster risk were examined under two main categories. A total of eight parameters related to the natural and built environment were evaluated within the spatial analysis process.
These consisted of natural-environment parameters—including topographic characteristics (slope, elevation, and aspect), meteorological factors (precipitation), and geological/hydrological factors (soil capability, distance to fault lines, and distance to hydrological structures)—and one built-environment parameter, namely land use.
In this study, the disaster risk affecting the historic Ferhatpaşa Mosque was comprehensively assessed through the analysis of slope, elevation, aspect, precipitation, distance to fault lines, hydrological structure, land use, and soil capability. These parameters were classified as follows:
- Slope (%): 0–5, 5–10, 10–15, 15–20, 20–25, and above 25
- Aspect: east–west; south (south, southeast, southwest); north (north, northeast, northwest)
- Elevation (m): 0–50, 50–100, 100–150, 150–200, and above 200
- Precipitation (mm/year): 897.8–930; 930–960; 960–990; 990–1120; 1120–1127
- Distance to fault lines (m): 25,000–27,000; 27,000–29,000; 29,000–31,000
- Distance to hydrological structures (m): 10, 50, 90, 130, 170
- Soil capability (soil types): alluvial soils, brown forest soils, non-calcareous brown forest soils, non-calcareous brown soils, vertisols, settlement areas
- Land use: dry farming (rainfed), pasture, settlement areas
3.1.1. Slope Factor
Slope, which is considered one of the most significant topographic factors in the context of erosion risk [23], refers to the inclination of the land surface relative to the horizontal plane and is expressed in either degrees (0–90°) or percentage (%). Erosion may occur depending on slope conditions. The transport of soil material from one place to another is directly related to slope, and there is a linear relationship between slope and erosion risk [22]. According to Sarı [24], irrespective of vegetation cover and soil properties, surface runoff and the associated erosion begin from the point where the slope starts. The most intense erosion occurs on slopes with high gradient [25].
Slope is also an important factor in the formation of floods and constitutes one of the geomorphological characteristics of a watershed. When all other conditions are assumed to be constant, steeply sloping areas retain less soil moisture; consequently, the infiltration of rainwater into the soil decreases, while surface runoff increases [26]. Slope is also a critical topographic parameter in relation to avalanche formation. In addition, slope strongly influences the direction and rate of fire spread [27]. Under otherwise equal conditions, fires spread more rapidly on sloping terrain than on flat surfaces. As slope increases, fire risk also rises [28]. Therefore, slope increases the risk of erosion, flooding, avalanches, and forest fires, while slope-induced structural instability may also adversely affect the integrity of buildings during disaster events. These risk potentials make slope a parameter that directly affects the vulnerability of the structure.
According to the slope map produced from the Digital Elevation Model (DEM) of the study area, slope values range between 0% and 41%. The slope factor was classified into six categories: 0–5%, 5–10%, 10–15%, 15–20%, 20–25%, and above 25% (Figure 4). Areas with higher slope values are located in the western part of the neighborhood. Approximately 88.59% of the neighborhood falls within the 0–10% slope range, while 9.17% lies within the 10–20% range. As slope increases, the amount of water transported by surface runoff also increases; accordingly, the risks of erosion, flooding, avalanches, and forest fires are considered to rise.
3.1.2. Elevation Factor
Climatological factors such as temperature, pressure, wind, precipitation type, and snow cover thickness vary depending on elevation [29]. As elevation increases, precipitation also tends to increase; this may lead to greater water accumulation within the basin and, under favorable conditions, may result in surface runoff and flooding [15]. In mountainous areas, high elevation combined with steep slopes increases susceptibility to avalanche events, particularly in regions where snowfall persists for long periods [30]. In addition, erosion risk increases in areas where high elevation is accompanied by steep slopes [31]. In this context, when evaluated together with slope, elevation directly affects structural vulnerability.
According to the elevation map of the study area, elevation values range between 37 and 321 meters. Approximately 63.27% of the area lies within the 37–75 m range, 26.8% within the 75–150 m range, and 9.93% within the 150–321 m range. High-elevation areas are considered zones where disaster risks such as avalanches, erosion, floods, and inundation increase (Figure 5).
Therefore, the elevation profile of the study area, particularly when considered together with slope conditions, constitutes an important parameter for assessing the environmental exposure and structural vulnerability of Ferhatpaşa Mosque.
3.1.3. Aspect Factor
Aspect is an important parameter affecting flood risk. On north-facing slopes, the soil generally becomes more saturated with water, which leads to the rapid flow of surface water. In contrast, south-facing slopes have a higher infiltration capacity than north-facing slopes. Therefore, north-facing slopes have a greater influence in terms of flood risk.
On south-facing slopes, evapotranspiration rates are higher, resulting in greater water loss from the soil and an increased likelihood of drought. Conversely, on north-facing slopes, higher soil moisture and greater saturation may reduce infiltration capacity, making these areas more vulnerable to floods and inundation [19]. Aspect is also significant in terms of avalanche risk; north-facing slopes are associated with higher values in relation to avalanche formation [32]. The fact that slopes with different orientations have different disaster risk potentials directly affects the vulnerability of buildings.
According to the aspect map generated using the Digital Elevation Model (DEM) of the study area, 34.86% of the area faces north, northeast, and northwest, while 27.25% faces south, southeast, and southwest. North-facing slopes are therefore considered high-risk areas in terms of flood and inundation risk (Figure 6).
3.1.4. Precipitation Factor
Flood events generally occur after prolonged, excessive, and intense rainfall, particularly in areas with steep slopes and impermeable soil structures [18]. Heavy precipitation is one of the primary causes of flood disasters. Areas with limited water absorption capacity and inadequate drainage systems are particularly vulnerable to extreme rainfall.
According to the annual precipitation analysis map of the study area, since there is no meteorological station directly measuring precipitation within the neighborhood, the analysis was first conducted at the district scale. Annual precipitation in the district ranges between 897.8 mm and 1,127 mm. At the district scale, annual precipitation was classified into the following intervals: 897.8–930 mm, 930–960 mm, 960–990 mm, 990–1,120 mm, and 1,120–1,127 mm.
For a more detailed analysis, the neighborhood boundary was then delineated and the annual precipitation data were reclassified at the neighborhood scale. Within the boundaries of Ferhatpaşa Neighborhood, annual precipitation was observed to range between 897.8 mm and 1,027 mm. The annual precipitation classes determined for the neighborhood are as follows: 897.8–925 mm, 925–950 mm, 950–975 mm, 975–1,000 mm, and 1,000–1,027 mm.
The results show that 64.47% of the area falls within the 897.8–925 mm range, 23.39% within the 925–975 mm range, and 12.14% within the 975–1,027 mm range. Increasing precipitation is considered a factor that intensifies the risks of flooding, inundation, and erosion (Figure 7).
In this context, precipitation becomes a critical parameter for assessing the exposure of Ferhatpaşa Mosque, particularly when combined with slope, soil permeability, and hydrological proximity.
3.1.5. Distance to Fault Lines Factor
Distance to fault lines is one of the most influential criteria in determining the potential damage risk during earthquakes. The proximity of a region to active fault lines significantly increases the risk of damage, particularly when soil quality and structural resistance are low [13]. Due to its proximity to the North Anatolian Fault Line, Istanbul is exposed to a high level of seismic risk, and potential economic losses are estimated to exceed USD 50 billion [20]. Areas intersected by fault lines have also been found to present higher risks of landslides and avalanches [30]. Therefore, distance to fault lines is a factor that directly affects the potential damage to which a structure may be exposed due to sudden ground shaking and seismic shock waves at the surface level.
According to the fault-line distance analysis map of the study area, the distance to active fault lines was classified into the following intervals: 0–5,000 m, 5,000–10,000 m, 10,000–15,000 m, 15,000–25,000 m, 25,000–50,000 m, 50,000–75,000 m, 75,000–100,000 m, 100,000–125,000 m, 125,000–150,000 m, and 150,000–172,300 m.
However, in the neighborhood-scale analysis, this classification was further refined using narrower intervals. According to the fault-line distance analysis map of Ferhatpaşa Neighborhood, the study area is located within the 25,000–31,000 m distance range from the fault line. Accordingly, fault-line distance was evaluated under three classes for the neighborhood-scale analysis:
- 25,000–27,000 m
- 27,000–29,000 m
- 29,000–31,000 m
As proximity to the fault line increases, seismic hazard increases, and this may also intensify secondary hazards such as slope instability and mass movements (Figure 8).
3.1.6. Distance to Hydrological Features Factor
FImproper interventions in streambeds, unplanned land-use decisions, and construction activities that narrow existing waterways are among the main causes of flood risk [33]. While river valleys are generally exposed to high levels of flood risk, areas located at higher elevations and characterized by lower levels of construction are considered to have lower risk levels [15]. The distance to water sources, such as rivers and streams, as well as construction within streambeds, may generate potential flood-related damage and increase the vulnerability of buildings to such hazards.
According to the hydrological analysis map of the study area, the area contains streams, tributaries, watercourses, and dry streambeds. Based on the data obtained from the Istanbul Water and Sewerage Administration (ISKI), there are no watercourses in the region that can be classified as rivers or streams of significant size. The watercourses in Çatalca District are relatively short, and the hydrological network mainly consists of small-scale streams.
The main water resources located within the boundaries of Ferhatpaşa Neighborhood are Karasu Stream, Tahtaköprü Stream, Lomborlos/Vezirhane Stream, İcadiye/Ortasofa Stream, the Büyükçekmece Lake Water-Surface Protection Area, and the Hamzalı Dam Protection Area. The naming and classification of these water resources were based on ISKI data.
The first analysis of the study area was conducted using Geographic Information Systems (GIS) tools based on the Digital Elevation Model (DEM). A second analysis was then carried out using the hydrological map generated from the data obtained from ISKI. ISKI defines the 10-meter buffer zone surrounding stream lines as a “risky protection area.” When the ISKI data and the DEM-based analysis were compared, the DEM-based analysis was found to provide a more detailed representation of local hydrological conditions. Therefore, distances to hydrological features were calculated based on the DEM-derived analysis.
According to the hydrological distance analysis for Ferhatpaşa Neighborhood, the area was classified into five distance classes:
- 10 m
- 50 m
- 90 m
- 130 m
- 170 m
The buffer zone generated in this analysis covers approximately half of the neighborhood area. Although there is no large water body, such as a river, within the neighborhood boundaries, the existing local water resources are significant in terms of flood risk. Areas located close to existing streambeds are considered to have higher flood and inundation risk depending on their distance from these hydrological features (Figure 9).
3.1.7. Land Use Factor
Inappropriate land use, the destruction of natural vegetation, new construction on valley floors, and the conversion of agricultural lands into urban areas may transform natural processes such as landslides, erosion, and flooding into disasters [16]. As the proportion of urbanized areas, including settlement areas, asphalt surfaces, and concrete-covered surfaces, increases, the surface permeability of the soil decreases [34]. Reduced surface permeability directly affects flood and flood-related hazards.
Areas with high concentrations of population and infrastructure, such as industrial zones and urban settlements, have a high risk potential in terms of loss of life and property during disasters. In contrast, forests, pasturelands, agricultural lands, and meadows may not necessarily involve direct risks of loss of life or structural damage; however, they should still be considered in terms of potential economic losses that may occur during droughts, fires, and floods [35].
In non-rotational dry farming areas, where precipitation is limited, the success of agricultural production depends more heavily on soil management. Excessive tillage increases the risk of erosion and water loss [36]. In fallow practices, land is left uncultivated every two years to allow the soil to regain its productive capacity. Pasturelands, which are generally broader than meadows and often consist of rugged, sloping areas unsuitable for cultivation, provide grazing areas for livestock during the growing season; however, they may lose their nutritional value during hot and dry summer periods [37].
If continuously cultivated agricultural lands and non-rotational dry farming areas are not properly managed, the natural balance may be disrupted, increasing the risks of drought and erosion. Similarly, overgrazing and fire risk may increase erosion potential in pasturelands. However, when used in accordance with natural cycles, these areas may also contribute to ecological resilience. Therefore, inappropriate land-use practices and the potential risks associated with them are among the factors that directly affect the vulnerability of buildings.
According to the land-use analysis map of the study area, three different land-use types were identified:
- non-rotational dry farming areas
- pasturelands
- settlement areas
The analysis revealed that 37.61% of the area is used for dry farming, while 60.99% consists of pastureland. Settlement areas were classified as high-risk zones in terms of disaster risk (Figure 10).
3.1.8. Soil Capability Factor
Brown forest soils are generally young soils that develop on calcareous parent material, under broad-leaved forest cover, and in rugged and mountainous areas. Non-calcareous brown forest soils, on the other hand, are mostly formed on non-calcareous and acidic parent material in semi-humid and semi-arid climatic regions, particularly on valley slopes and undulating terrain where forest and shrub vegetation gradually transition into pastureland [38].
These soils support the development of dense and humid forests, especially on north-facing slopes. Due to intense leaching, rainwater normally infiltrates rapidly into the lower soil layers. However, since these soils develop under forest cover and may contain a hard horizon in their lower layers, they can indirectly contribute to surface runoff. Therefore, they may increase the risk of flooding and inundation.
Non-calcareous brown soils may develop on both acidic parent material and limestone. These soils are considered among the soil types with the highest erosion risk [39]. Vertisols are dark-colored soils rich in clay. They shrink during dry periods and expand during wet periods. Their workable period is short, and their permeability is low. The cracks that form when they dry may damage the fine roots of plants and negatively affect crop development. Drainage in these soils is highly limited, and their natural vegetation generally consists of short grasses and sparse understory plant communities. Particularly in sloping areas, vertisols are continuously exposed to erosion risk.
Alluvial soils are mostly found in riverbeds and, in some cases, in depression areas, where they are formed by the accumulation of gravel, sand, and silt. These soils generally occur where slope begins to decrease and are formed by the deposition of materials such as clay, sand, and gravel transported by rivers. Alluvial soils with a high groundwater level are highly fertile for agriculture; however, they also present a considerable risk of flooding and inundation.
The soil type on which a building is located directly affects its potential vulnerability during a disaster. According to the soil capability analysis map of the study area, six different soil types were identified:
- alluvial soils
- brown forest soils
- non-calcareous brown forest soils
- non-calcareous brown soils
- vertisols
- settlement areas
The analysis results indicate that 56.44% of the area consists of alluvial soils, non-calcareous brown soils, and settlement areas. Compared with the other soil types, these three categories present a higher level of risk in terms of erosion, flooding, and inundation (Figure 11).
3.1.9. Reclassification and Assessment of Risk Classes
The parameters generated from the datasets obtained from relevant institutions for spatial analysis in the study area were reclassified in terms of disaster risk. This reclassification was carried out under three main risk categories: low risk, medium risk, and high risk.
The low-risk class represents areas with the lowest level of disaster risk and was assigned an effect value of 1, corresponding to the lowest value within the 1–3 scale.
The medium-risk class represents areas with a moderate level of disaster risk and was assigned an effect value of 2.
The high-risk class includes areas with the highest level of disaster risk and was assigned an effect value of 3.
This reclassification method enables a more detailed examination of disaster risks and makes it possible to identify high-risk areas before intervention, thereby supporting the development of appropriate preventive measures. Analyses produced using data obtained from relevant institutions contribute to more effective preparedness against disasters (Table 4).
3.2. Determination of Weight Values for the Factors
Within the scope of the Weighted Overlay method, after the reclassification stage, it is necessary to determine the relative weight of each parameter. In this study, the weight values of eight factors—slope, elevation, aspect, soil capability, land use, distance to fault lines, distance to hydrological features, and precipitation amount—were calculated based on expert opinions for the purpose of disaster risk analysis.
The experts evaluated the priority level of these eight parameters in terms of disaster risk, considering the location of a historic building within its surrounding terrain. Each parameter was ranked and scored on a scale from 1 to 8, with the highest score assigned to the factor considered to have the highest priority (Figure 12).
The scores obtained from five experts were combined and ranked from highest to lowest according to their priority levels. The results showed that distance to fault lines and precipitation had the highest priority, each receiving 31 points. Aspect ranked eighth with 4 points. The total scores assigned to the other parameters were as follows: distance to hydrological features and soil capability received 25 points each, slope received 24 points, land use received 23 points, and elevation received 14 points (Figure 13).
The location of the historic building within its terrain was evaluated according to the total score values of the eight parameters considered in the disaster risk assessment, and percentage distributions were calculated based on expert opinions (Table 5). The reclassified parameters were normalized using their assigned weight values and overlaid through the Weighted Overlay method to produce the final disaster risk analysis.
According to the expert-based weighting process, distance to fault lines and precipitation amount received the highest weight values, each accounting for 17.22% of the total. These were followed by distance to hydrological features and soil capability, each with 13.89%. Slope accounted for 13.33%, land use for 12.78%, and elevation for 7.78%, while aspect had the lowest weight value at 3.89%.
According to the disaster risk analysis conducted with reference to the location of Ferhatpaşa Mosque, a work of Mimar Sinan, 71.99% of the study area was classified as medium risk, 28% as low risk, and 0.02% as high risk (Figure 14). Ferhatpaşa Mosque is located within the medium-risk zone and is approximately 310 m from the nearest low-risk area. The proportion of high-risk areas is very limited, and the nearest high-risk zone is located approximately 320 m south of the mosque.
The mosque is approximately 250 m from the nearest water source, which is a dry streambed, and approximately 800 m from the nearest water source classified as a stream within the hydrographic system. In the area where Ferhatpaşa Mosque is located, elevation values range approximately between 120 and 160 m, the aspect is northeast-facing, and slope values range between 5% and 15%. In addition, the mosque is situated within a settlement area; the soil type in its immediate surroundings was identified as calcareous brown soil, while the land-use type was identified as pastureland. The mosque is located approximately 29,600 m from active fault lines, and the annual precipitation at its location is approximately 1,005 mm.
The analysis results indicate that Ferhatpaşa Mosque is located within the medium-risk zone, which accounts for 71.99% of the study area. Although the mosque is positioned at a relatively safe seismic distance due to its 29,600 m distance from active fault lines, the combined effects of its local slope of 5–15%, northeast-facing aspect, and surrounding calcareous brown soil create a cumulative multi-hazard vulnerability. In other words, while the seismic hazard level is low to medium, environmental and ground-related factors increase the overall risk level.
4. Discussion
Ferhatpaşa Mosque’s main walls, which are 1.20 m thick, together with its 9.20 m diameter dome and pendentive transition elements, indicate a certain level of inherent structural robustness derived from its historical construction system. However, the GIS-based analysis shows that the mosque is located on terrain with a local slope of 5–15%. In addition, since the mosque is positioned at a higher elevation than the street level to the east, its ablution courtyard is enclosed by retaining walls on three sides. These conditions may generate a risk of local ground instability during seismic shaking.
Previous studies on historic buildings constructed on sloping terrain indicate that seismic shock waves may create additional earth pressure, or dynamic soil pressure, on retaining walls. In the event of retaining wall failure, the main structure may also be affected at foundation level. Therefore, although the mosque’s massive wall system and domed structural configuration point to a certain degree of historical construction resilience, the slope conditions and the necessity of retaining walls increase the overall risk level of the site to a medium-risk category. Since this study does not provide a detailed building-scale structural performance analysis, the seismic safety level of the mosque should be further examined through engineering-based assessments.
According to the analysis results, Ferhatpaşa Mosque is located approximately 29,600 m from active fault lines, which may be considered a relatively safe distance in seismic terms. Nevertheless, its classification within the medium-risk zone demonstrates that the risk level is not determined by seismic hazard alone, but by the cumulative effects of soil and meteorological parameters. The annual precipitation value of approximately 1,005 mm in the area and the soil characteristics around the mosque help explain this condition.
The surrounding brown soil is sensitive to erosion and leaching processes. When combined with high precipitation, this may cause the slope soil to become water-saturated, creating a hydro-seismic interaction. Water-saturated ground may contribute to the amplification of seismic waves during a possible Istanbul earthquake scenario of Mw 7.5 and may increase hydrostatic pressure behind the retaining walls, potentially leading to sudden failures. This finding indicates that earthquake risk should not be assessed only in relation to proximity to fault lines, but through an integrated multi-hazard approach that considers soil, topography, hydrology, and climatic conditions together.
According to DEZİM [11], under a possible Mw 7.5 Istanbul earthquake scenario, 8 buildings in Ferhatpaşa Neighborhood are expected to suffer severe damage, while 40 buildings are expected to experience moderate damage. The neighborhood is also identified as one of the vulnerable areas in terms of potential population loss and building stock fragility. This urban vulnerability directly affects the post-disaster management of the historic Ferhatpaşa Mosque. Possible building collapses and infrastructure damage in the surrounding settlement areas may obstruct access to the historic structure after a disaster, particularly for fire brigades and emergency response teams.
On the other hand, Çatalca District has the potential to serve as a post-earthquake temporary shelter area for Istanbul due to its low-rise settlement pattern and extensive pasturelands. The fact that the immediate surroundings of the mosque are characterized by pastureland and a relatively low-rise urban fabric suggests that the area around the mosque may also function as a gathering space during a disaster. However, for the historic building to safely assume such a public and logistical role, its current medium-risk level should first be reduced, and the retaining walls surrounding the courtyard should be seismically assessed and strengthened where necessary.
5. Conclusions
This Disaster risk analysis is a critical step in ensuring the protection and long-term sustainability of cultural heritage. Disasters may threaten both the structural and cultural integrity of historic buildings; therefore, risk analysis plays an important role in identifying potential damage before it occurs. It also supports the development of post-disaster response strategies and increases the effectiveness of conservation measures.
The Index for Risk Management (INFORM), which aims to measure and rank the risks of humanitarian crises and disasters across 191 countries, defines risk groups according to index scores. According to the 2018 report, Türkiye’s INFORM risk index score was calculated as 5.0, ranking the country 45th among 191 countries. Although disaster response and crisis management processes are carried out at national and urban scales, disaster culture and risk awareness have not yet been sufficiently embedded in Türkiye, indicating that some stages of risk management remain incomplete.
In this study, disaster risk parameters related to the location of Ferhatpaşa Mosque in Ferhatpaşa Neighborhood, Çatalca District, Istanbul, were examined. Using Geographic Information Systems (GIS) tools and the Weighted Overlay method, the study aimed to identify areas with potential disaster risk and to evaluate the risk level of the site where the mosque is located.
According to the disaster risk analysis, the study area was classified as follows:
- 71.99% as medium risk;
- 28% as low risk;
- 0.02% as high risk.
This classification was based on eight parameters: slope, elevation, aspect, precipitation, distance to fault lines, hydrological features, land use, and soil capability. The risk analysis of the study area was conducted through a GIS-based model, in which these eight parameters were defined as spatial variables.
While many disaster risk analysis studies in the literature, such as those by Özşahin (2013) and Partigöç and Dinçer (2024a), generally focus on macro-scale analyses at the provincial or district level, this study differs by placing a registered cultural heritage asset at the center of a neighborhood-scale, micro-level analysis. Unlike conventional seismic risk maps, which mainly focus on ground-shaking intensity, the Weighted Overlay method applied in this study enabled the normalization and integration of eight different parameters, including slope, hydrology, precipitation, and land use, into a composite risk score.
The fact that distance to fault lines and precipitation received the highest weight values, based on the evaluations of experts from five different disciplines—architecture, civil engineering, urban planning, geomatics engineering, and geodesy—supports the relevance of a multi-hazard approach. This finding indicates that the disaster risk affecting cultural heritage cannot be explained through seismic proximity alone, but should instead be assessed through the combined effects of environmental, topographical, hydrological, and climatic parameters.
The findings of this study are expected to contribute to central and local governments, non-governmental organizations, the private sector, academic research, and international institutions working on cultural heritage protection. By proposing a GIS-based, neighborhood-scale, and heritage-oriented decision-support model, the study aims to address a gap in the integration of cultural heritage conservation with disaster risk reduction and sustainable urban resilience planning.
6. Patents
This section is not mandatory but may be added if there are patents resulting from the work reported in this manuscript.
Author Contributions
Conceptualization, İ.C. and H.Ö.; methodology, İ.C. and H.Ö.; literature review, H.Ö.; fieldwork, H.Ö.; data collection and compilation, H.Ö.; data processing and analysis, H.Ö.; visualization, H.Ö. and İ.C.; interpretation of findings, İ.C. and H.Ö.; writing—original draft preparation, İ.C. and H.Ö.; writing—review and editing, İ.C. and H.Ö.; supervision, İ.C. All authors have read and agreed to the published version of the manuscript.
Informed Consent Statement
Informed consent was obtained from all experts who participated in the expert-based weighting process. No personal or identifiable information was collected or reported in this study.
Data Availability Statement
The data presented in this study are available from the corresponding author upon reasonable request. Some datasets were obtained from public institutions and are subject to third-party restrictions.
Acknowledgments
The authors would like to thank the Istanbul Gelişim University Institute of Graduate Studies, the Head of the Department of Artworks and Construction Affairs, and the Directorate of Artworks and Construction Affairs for their support in providing the necessary documents for the realization of this study.:
Abbreviations
The following abbreviations are used in this manuscript:
| MDPI | Multidisciplinary Digital Publishing Institute |
| DOAJ | Directory of open access journals |
| TLA | Three letter acronym |
References
- Nirupama, N. Disaster risk management. In Encyclopaedia of Natural Hazards; Bobrowsky, P. T., Ed.; 2013; Volume V. pp. 164–170. [Google Scholar] [CrossRef]
- UNESCO; ICCROM; ICOMOS; IUCN. Managing Disaster Risks for World Heritage. 2010. Available online: https://icorp.icomos.org/wp-content/uploads/2017/10/Managing-Disaster-Risks-for-World-Heritage.pdf (accessed on 10 October 2024).
- UNISDR. Terminology on Disaster Risk Reduction. 2009. Available online: https://www.undp.org/sites/g/files/zskgke326/files/migration/ge/GE_isdr_terminology_2009_eng.pdf (accessed on 17 October 2024).
- Pedersoli, J. L., Jr.; Antomarchi, C.; Michalski, S. A Guide to Risk Management of Cultural Heritage; ICCROM and Government of Canada, Canadian Conservation Institute, 2016; Available online: https://www.iccrom.org/ (accessed on 17 October 2024).
- AFAD, Afet (Disaster) (n.t) Açıklamalı Afet Yönetimi Terimleri Sözlüğü (An Annotated Glossary of Disaster Management Terms). Available online: https://www.afad.gov.tr/aciklamali-afet-yonetimi-terimleri-sozlugu (accessed on 17 October 2024).
- Gökçe, O.; Tetik, Ç. Teoride ve pratikte afet sonrası ı̇yileştirme çalışmaları. (Post-disaster recovery efforts in theory and practice. ). T.C. Prime Ministry Disaster and Emergency Management Presidency: Ankara, 2012. Available online: https://www.afad.gov.tr/kurumlar/afad.gov.tr/3479/xfiles/afet_sonrasi_iyilestirme_calismalari-1.pdf (accessed on 19 October 2024).
- Varol, N.; Gültekin, T. Afet Antropolojisi. (Anthropology of Disaster). Electron. J. Soc. Sci. 2016, 15(59). [Google Scholar] [CrossRef]
- UNDRR. GAR Special Report 2024 Forensic Insights For Future Resilience: Learning From the Past Disasters. 2024. Available online: https://www.undrr.org/gar/gar2024-special-report (accessed on 24 November 2025).
- UNDRR. Resilience Pays: Investing and Financing For Our Future. 2025. Available online: https://www.undrr.org/gar/gar2025 (accessed on 24 November 2025).
- Ertürk, A. T. Seismicity Potential Risk of Istanbul and Possible Scenario of a 7.6 Magnitude Earthquake. MSc Thesis, Technological University Dublin, 2024. (accessed on 24 November 2025). [Google Scholar]
- IBB Deprem ve Zemin İnceleme Müdürlüğü (Istanbul Metropolitan Municipality Directorate of Earthquake and Geotechnical Investigations). Project to Update Estimates of Potential Earthquake Losses in Istanbul Province (Mw 7.5 scenario earthquake). 2019. Available online: https://depremzemin.ibb.istanbul/tr/istanbul-ili-olasi-deprem-kayip-tahminlerinin-guncellenmesi-projesi (accessed on 24 November 2025).
- Necipoğlu, G. Sinan Çağı: Osmanlı İmparatorluğu’nda mimarî kültür (Age of Sinan Architectural culture in the Ottoman Empire); Istanbul Bilgi University Publications: Istanbul, 2017. [Google Scholar]
- Bahadır, M.; Ocak, F.; Şen, H. Determination of the development of settlements above earthquake susceptibility classes in Atakum district (Samsun/Türkiye). Int. J. Eng. Geosci. 2024, 9(3), 390–405. [Google Scholar] [CrossRef]
- Esmael, S. S. Seismic risk assessment using geographical information system (GIS) with analytic hierarchy process (AHP). MSc Thesis, Anadolu University, Institute of Natural Sciences, Department of Remote Sensing and Geographic Information Systems, 2018. Available online: https://tez.yok.gov.tr/ (accessed on 24 October 2025).
- Ocak, F.; Bahadır, M. Örnek taşkın risk modeli oluşturulması ve Ünye şehrindeki derelere ait taşkın risk analizleri. (Creation of a sample flood risk model and flood risk analysis of streams in Ünye city). J. Acad. Soc. Sci. Stud. 2020, 80, 499–524. [Google Scholar] [CrossRef]
- Ocak, F. Ünye şehir sellerinin zarar görebilirlik yöntemi ile incelenmesi. (Investigation of Ünye city floods by vulnerability method). MSc Thesis, Ondokuz Mayis University, Institute Of Social Sciences, Department Of Geography, 2018. Available online: https://tez.yok.gov.tr/ (accessed on 24 October 2025).
- T.C. Ministry of Agriculture and Rural Affairs; Research Planning and Coordination Board; Edirne Agricultural Provincial Directorate. Support Project for the Preparation of Provincial Agriculture and Rural Development Master Plans - Edirne Agriculture Master Plan. (Updated by Tuncay Sarı). 2005. Available online: https://www.tarimorman.gov.tr/sgb/belgeler/master/edirne.pdf (accessed on 24 October 2025).
- Taş, E. Coğrafi Bilgi Sistemleri Teknikleri kullanılarak taşkın risk potansiyelinin değerlendirilmesi: Afyonkarahisar Çay Deresi Havzası. (Assessment of flood risk potential using Geographic Information Systems Techniques: Afyonkarahisar Çay Stream Basin). Clim. Change Environ. 2018, 3(1), 68–74. Available online: https://dergipark.org.tr/ (accessed on 24 October 2025).
- Özdemir, H. Havran Çayı Havzası’nın (Balıkesir) CBS ve uzaktan algılama yöntemleriyle taşkın ve heyelan risk analizi. (Flood and landslide risk analysis of Havran Stream Basin (Balıkesir) using GIS and remote sensing methods). doctoral dissertation, Istanbul University, Institute Of Social Sciences, Department Of Geography, 2007. Available online: https://nek.istanbul.edu.tr/ekos/TEZ/42817.pdf (accessed on 24 October 2025).
- İSMEP Guidebooks. Protection of Cultural Heritage. Istanbul. (ISMEP Guidebooks published within the scope of “Istanbul Seismic Risk Mitigation and Emergency Preparedness Project” (ISMEP) conducted by Istanbul Governorship, Istanbul Project and Coordination Unit (IPKB), prepared by Beyaz Gemi Social Project Agency). 2014. Available online: https://www.ipkb.gov.tr/e-kutuphane/kulturel-mirasin-korunmasi_65/ (accessed on 24 October 2025).
- Multilayer Weighted Run Method Weighted Overlay_RU. 20 November 2018. Available online: https://wiki.netcad.com.tr/pages/viewpage.action?pageId=216255486 (accessed on 17 October 2024).
- Mutlu, Y.E.; Soykan, A.; Fıçıcı, M. Erosion risk analysis in Kille River Basin (Balıkesir). J. Geomorphol. Res. 2021, 6, 98–111. Available online: https://www.researchgate.net/ (accessed on 17 October 2024).
- Susam, T.; Oğuz, İ. CBS ile Tokat ili arazi varlığının eğim ve bakı özelliklerinin tespiti ve tarımsal açıdan irdelenmesi. (Determination of slope and aspect characteristics of land in Tokat province with GIS and agricultural analysis). Gaziosmanpasa Univ. J. Fac. Agric. 2006, 23(1), 67–74. Available online: https://earsiv.gop.edu.tr/ (accessed on 10 September 2024).
- Sarı, M. Toprak erozyonuna farklı bir yaklaşım. (A different approach to soil erosion.). In TEMA Fight Against Erosion (Tema Training Seminar Notes); Sevinç, E. G., Ed.; TEMA Foundation Publications: Istanbul, 2003; Volume V.3, pp. 48–62. Available online: https://cdn-tema.mncdn.com/Uploads/Cms/erozyonlamucadele.pdf (accessed on 17 October 2024).
- Özşahin, E.; Atasoy, A. Aşağı Asi Nehri Havzası’nın Coğrafi Bilgi Sistemleri (CBS) ve Uzaktan Algılama (UA) teknikleriyle erozyon analizi. (Erosion analysis of the Lower Asi River Basin using Geographic Information Systems (GIS) and Remote Sensing (RS) techniques) Hatay; Hakan Publications; TBMM Library, 2014. [Google Scholar]
- Özcan, O. Sakarya Nehri Alt Havzası’nın taşkın riski analizinin uzaktan algılama ve CBS ile belirlenmesi. (Determination of flood risk analysis of Sakarya River Sub-Basin by remote sensing and GIS). MSc Thesis, Istanbul Teknik University, Institute of Informatics, 2008. Available online: https://polen.itu.edu.tr/ (accessed on 1 June 2026).
- Gündüzoğlu, G.; Güner, S.; Beşel, U.; Karahan, E. Determination of forest fire risk areas in Izmir using AHP and GIS methods. Paper presented at the International Fire Symposium and Exhibition, Izmir, October, 2024; Available online: https://www.yanginsempozyumu.org/ (accessed on 24 October 2025).
- Zeng, T.; Hudson, J.; Kay, S.; Laginestra, E. A Fuzzy GIS Approach to Fire Risk Assesment: A Case Study of Sydney Olympic Park, Australia. Spatial Sciences Conferences. 2003. Available online: https://www.researchgate.net/ (accessed on 17 October 2024).
- İrcan, M.R.; Duman, N. Bitlis Çayı Havzası’nda Çığ Oluşumuna Duyarlı Alanların Coğrafi Bilgi Sistemleri ile Tespit Edilmesi. (Identification of Areas Susceptible to Avalanche Formation in Bitlis Stream Basin with Geographic Information Systems). J. Geomorphol. Res. 2024, V.12, 37–53. [Google Scholar] [CrossRef]
- Birincioğlu, E. S. Disaster risk analysis of Bitlis province using geographic information systems and analytical hierarchy method. MSc Bitlis Eren University, 2021. Available online: http://bevis.beu.edu.tr/ (accessed on 17 October 2024).
- Duman, N.; İrcan, M. R. Coğrafi Bilgi Sistemleri ve Uzaktan Algılama tabanında Çankırı Merkez ilçesinin erozyon risk analizi. (Erosion risk analysis of Çankırı Central district based on Geographic Information Systems and Remote Sensing). J. Geogr. Sci. 2022, 20(1), 220–245. Available online: https://www.researchgate.net/ (accessed on 17 October 2024).
- Avşin, N.; Çakı, D. T. Çatak-Bahçesaray (Van) Karayolu üzerindeki çığa duyarlı alanların belirlenmesi. (Determination of avalanche susceptible areas on Çatak-Bahçesaray (Van) highway). J. Geomorphol. Res. 2021, V.7, 30–47. (accessed on 17 October 2024). [Google Scholar] [CrossRef]
- Demir, V.; Ülke Keskin, A. Yeterince akım ölçümü olmayan nehirlerde taşkın debisinin hesaplanması ve taşkın modellemesi (Samsun, Mert Irmağı örneği). (Flood flow calculation and flood modeling in rivers with insufficient flow measurements (Samsun, Mert River example)). Geomatic 2022, 7(2), 149–162. (accessed on 24 October 2025). [Google Scholar] [CrossRef]
- Pancar, Z. B.; Gökce, D. Hidro – Meteorolojik karakterli afet riski bulunan alanlardaki mevcut mekânsal planlama kararları: Serik (Antalya) örneği. (Current spatial planning decisions in disaster risk areas with hydro-meteorological character: The case of Serik (Antalya)). J. Mehmet Akif Ersoy Univ. Inst. Sci. Technol. 2022, 13(2), 229–245. (accessed on 24 October 2025). [Google Scholar] [CrossRef]
- Partigöç, N. S.; Dinçer, C. Coğrafi bilgi sistemleri (CBS) tabanlı afet risk analizi: Denizli ili örneği. (Geographic information systems (GIS) based disaster risk analysis: The case of Denizli province). Geomatic 2024, 9(1), 27–44. (accessed on 24 October 2025). [Google Scholar] [CrossRef]
- Gözübüyük, Z.; Öztürk, İ.; Demir, O.; Çelik, A. Erzurum kuru tarım koşullarında farklı toprak işleme – ekim sistemlerinin toprak nem değişimine etkisi. (The effect of different tillage - cropping systems on soil moisture exchange under dry farming conditions in Erzurum). J. Agric. Mach. Sci. 2012, 8(4), 365–374. Available online: https://dergipark.org.tr/ (accessed on 24 October 2025).
- Bayar, R. Agricultural areas, pasture areas, protected areas. Ankara University Open Course Materials. n.t. Available online: https://acikders.ankara.edu.tr/pluginfile.php/37003/mod_resource/content/0/Ders%207.pdf#:~:text=Ekimin%20yap%C4%B1lmad%C4%B1%C4%9F%C4%B1%20y%C4%B1l%20toprak%20dinlendirilmi%C5%9F,nadass%C4%B1z%20kuru%20tar%C4%B1m%20alan%C4%B1%E2%80%9D%20 (accessed on 17 October 2024).
- Özyavuz, M. Bitki örtüsünün ekolojik şartlarının Coğrafi Bilgi Sistemleri ve Uzaktan Algılama teknikleri ile analizi, Ganos (Işıklar) Dağı. (Analysis of ecological conditions of vegetation cover with Geographic Information Systems and Remote Sensing techniques, Ganos (Işıklar) Mountain) Tekirdağ. J. Tekirdag Fac. Agric. 2011, 8(2), 37–47. Available online: https://bhi.nku.edu.tr/ (accessed on 17 October 2024).
- Uludağ, M.; Fıçıcı, M. Saray ilçesinde (Tekirdağ) toprak erozyonunun RUSLE yöntemiyle değerlendirilmesi. (Evaluation of soil erosion in Saray district (Tekirdag) by RUSLE method). Turk. J. Geogr. 2018, (70), 29–36. (accessed on 17 October 2024). [Google Scholar] [CrossRef]
Figure 1.
(a) Ferhatpaşa Mosque plan and axonometric perspective [12]; (b) Primary school (by authors, 01.11.2024).
Figure 1.
(a) Ferhatpaşa Mosque plan and axonometric perspective [12]; (b) Primary school (by authors, 01.11.2024).
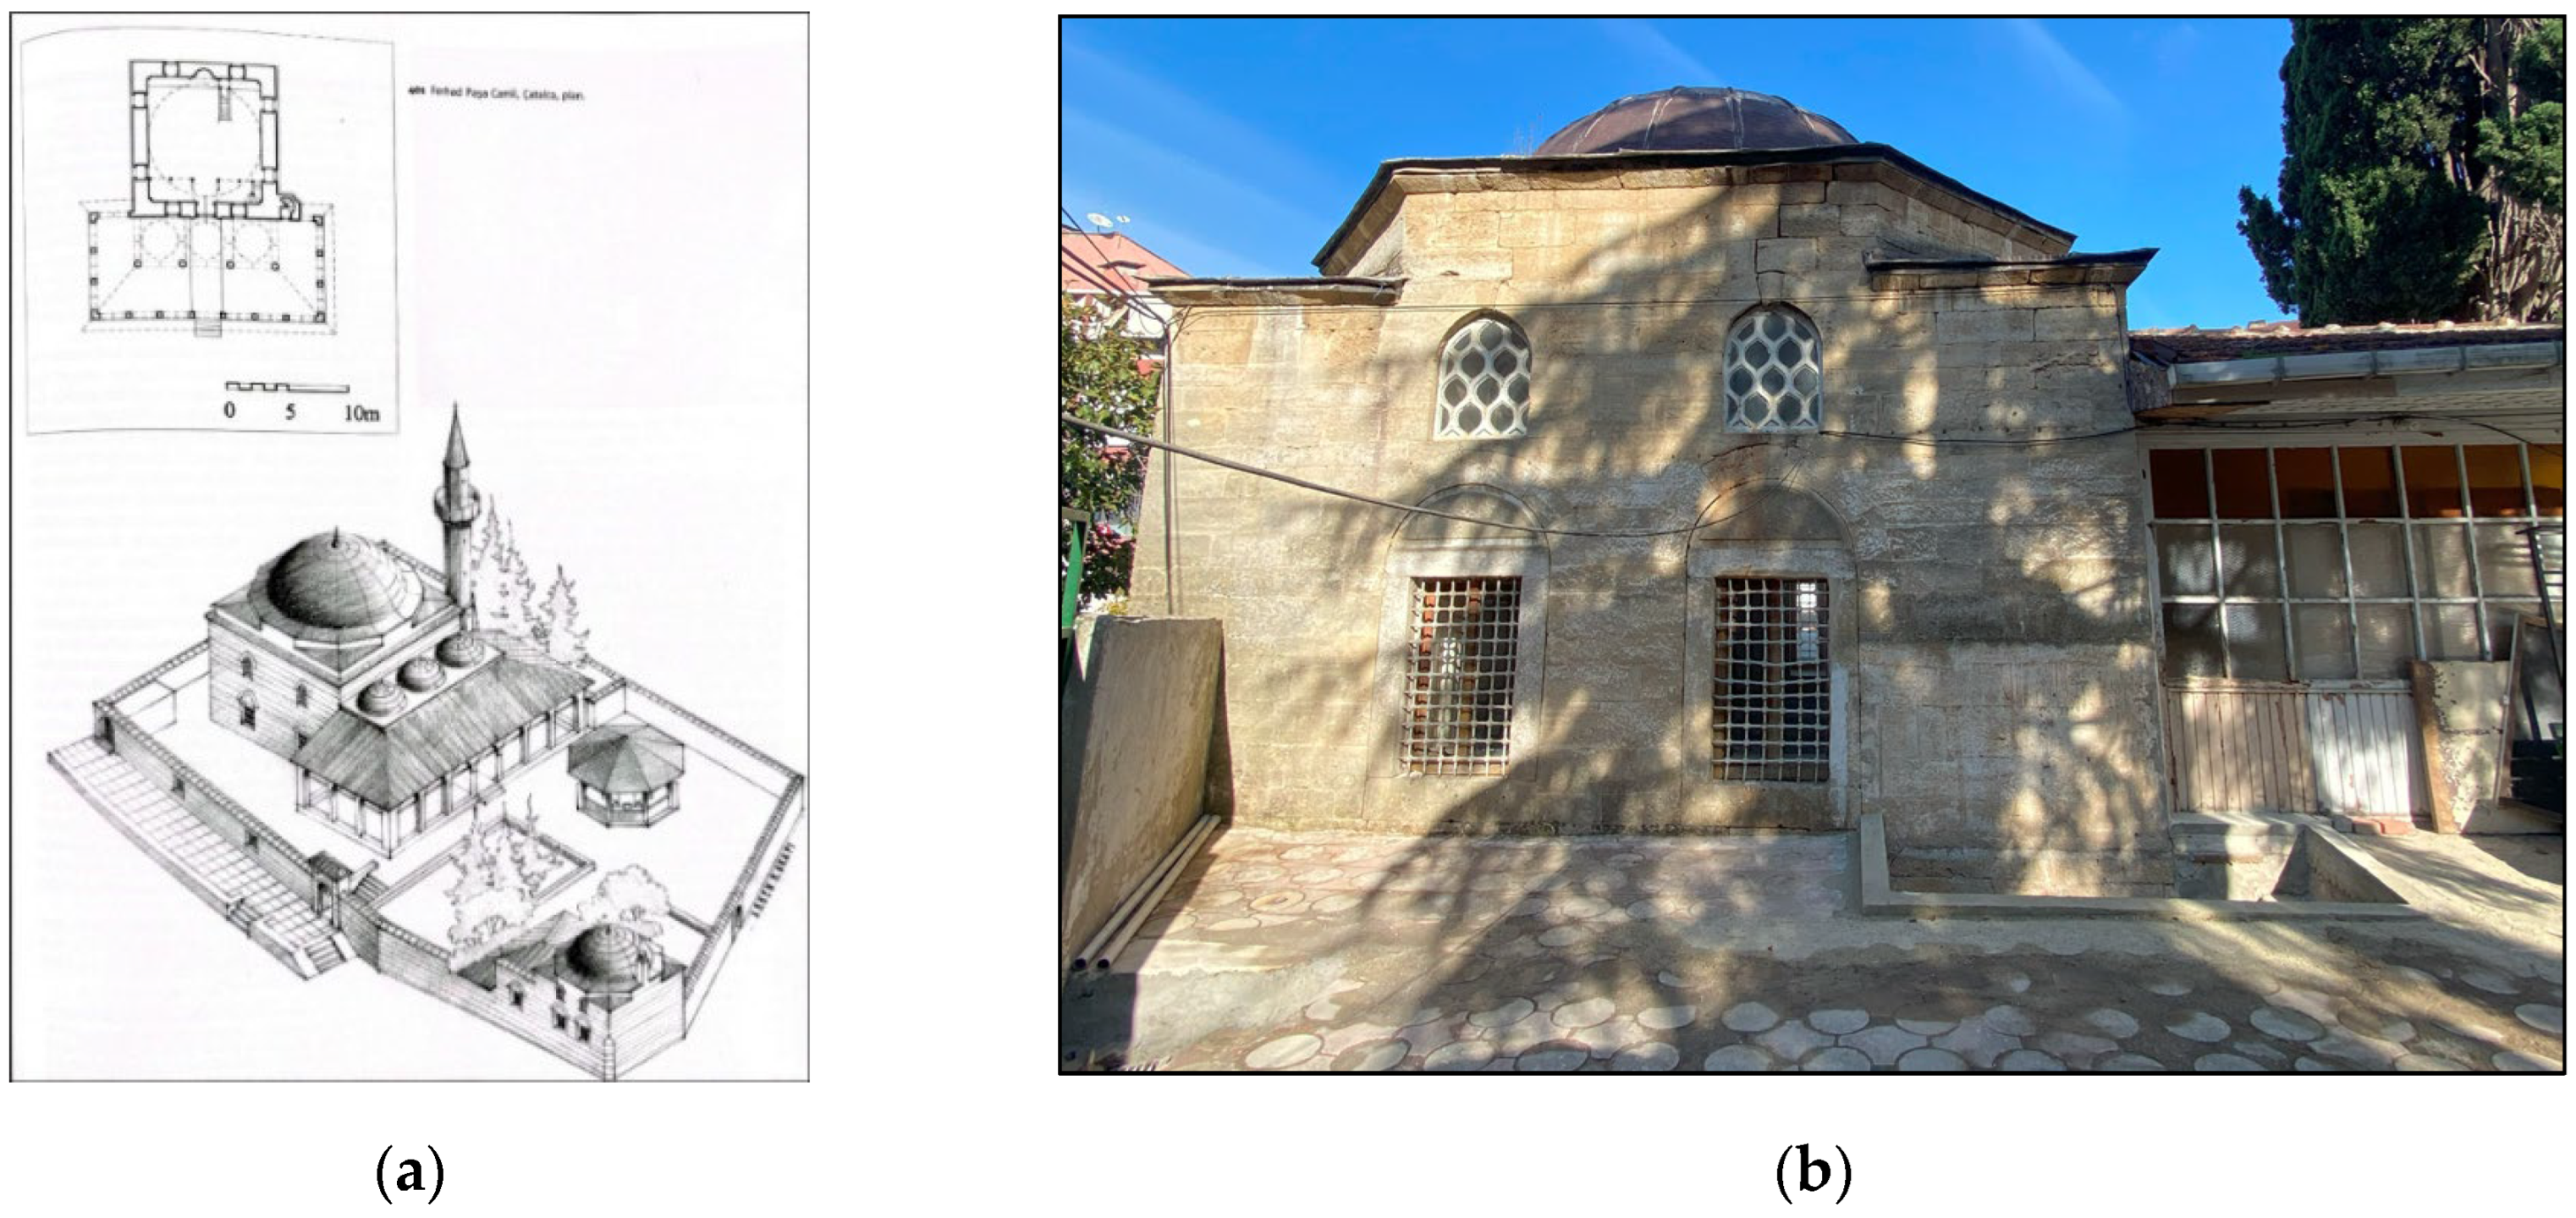
Figure 2.
Interior details (by authors, 01.11.2024) (a) Prayer Hall; (b) Narthex.
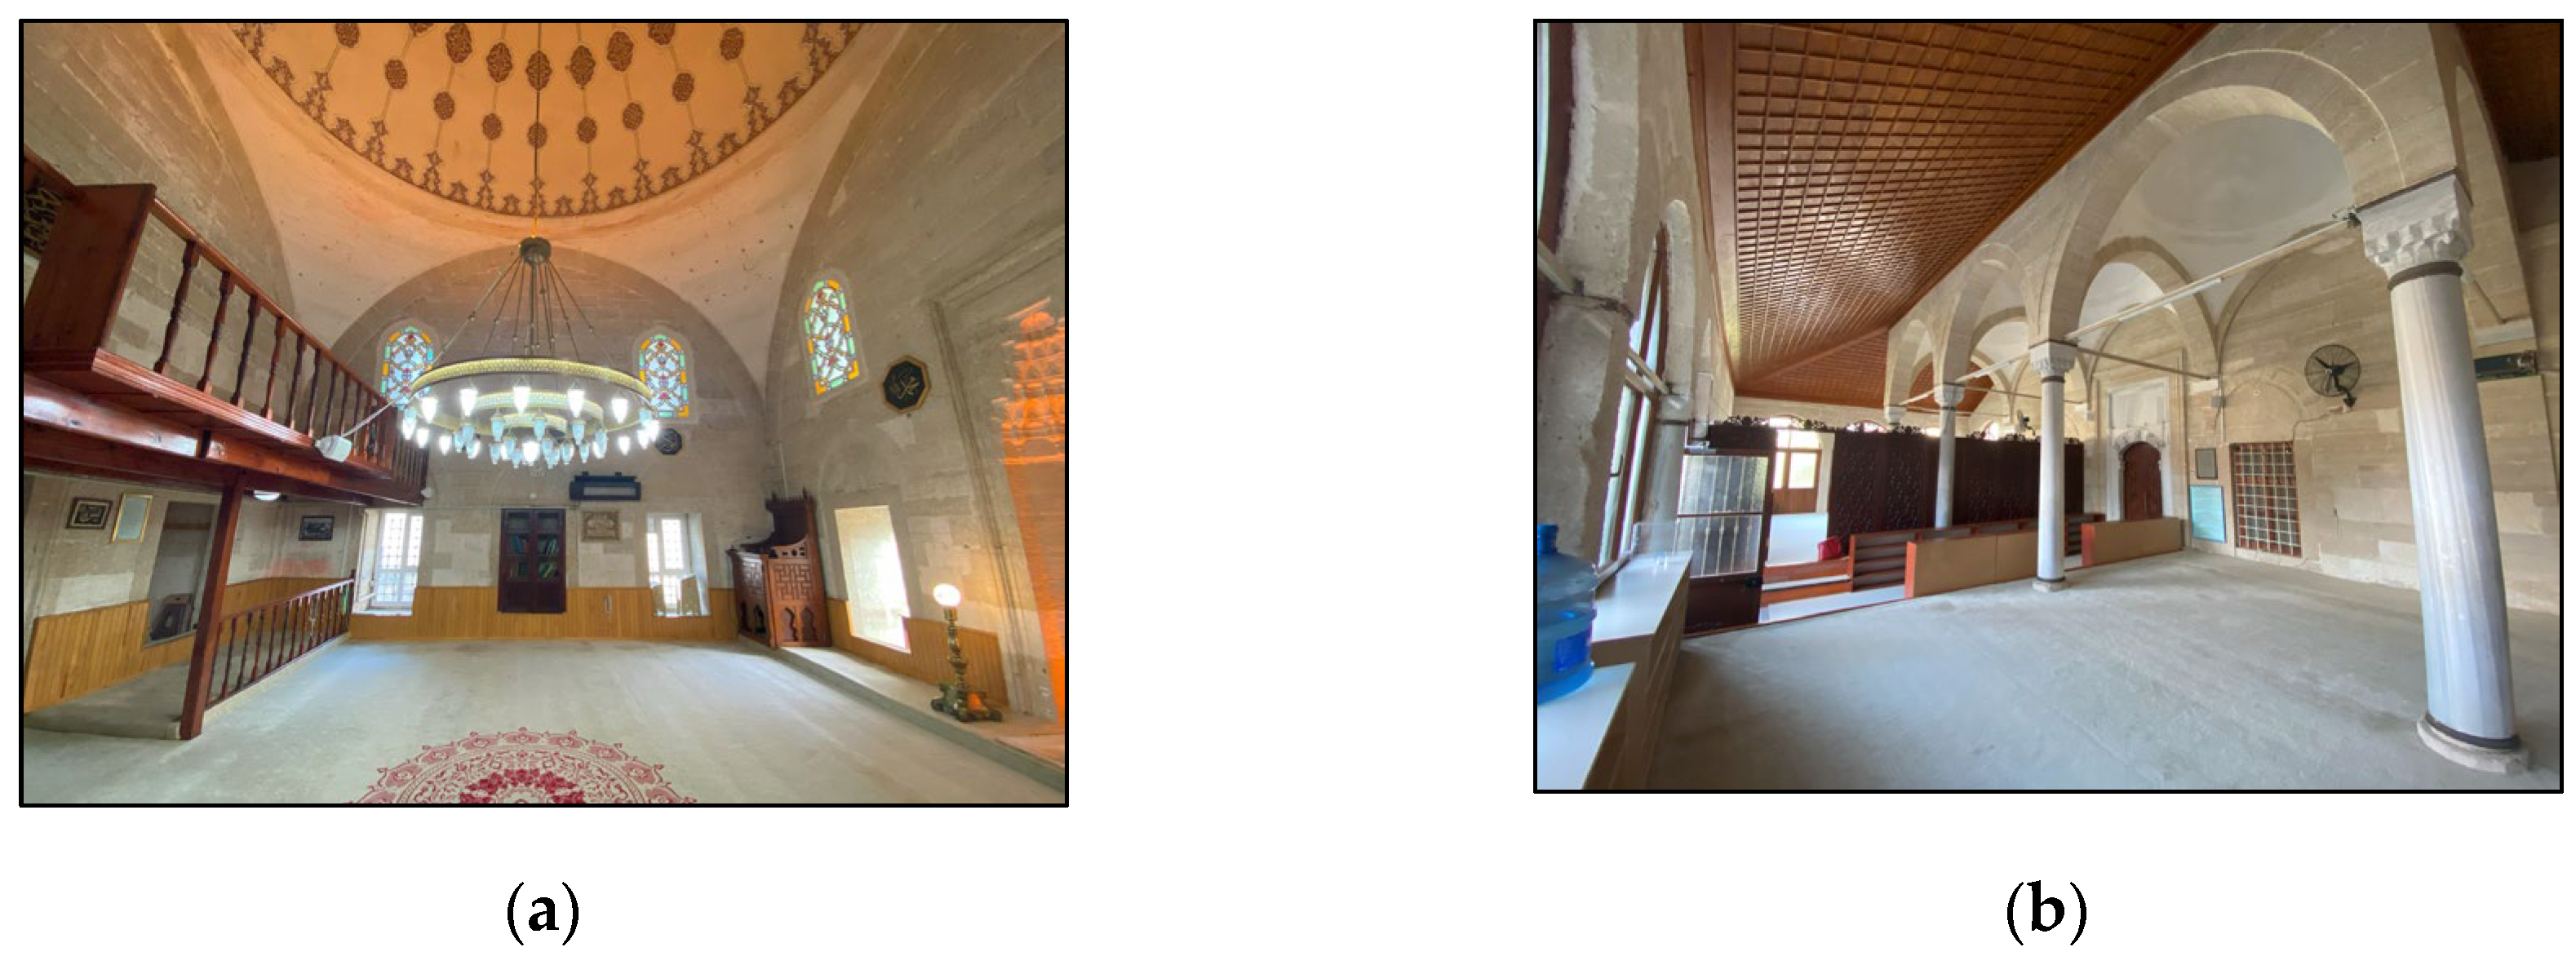
Figure 3.
Methodological workflow of the GIS-based multi-hazard risk assessment model (by authors).
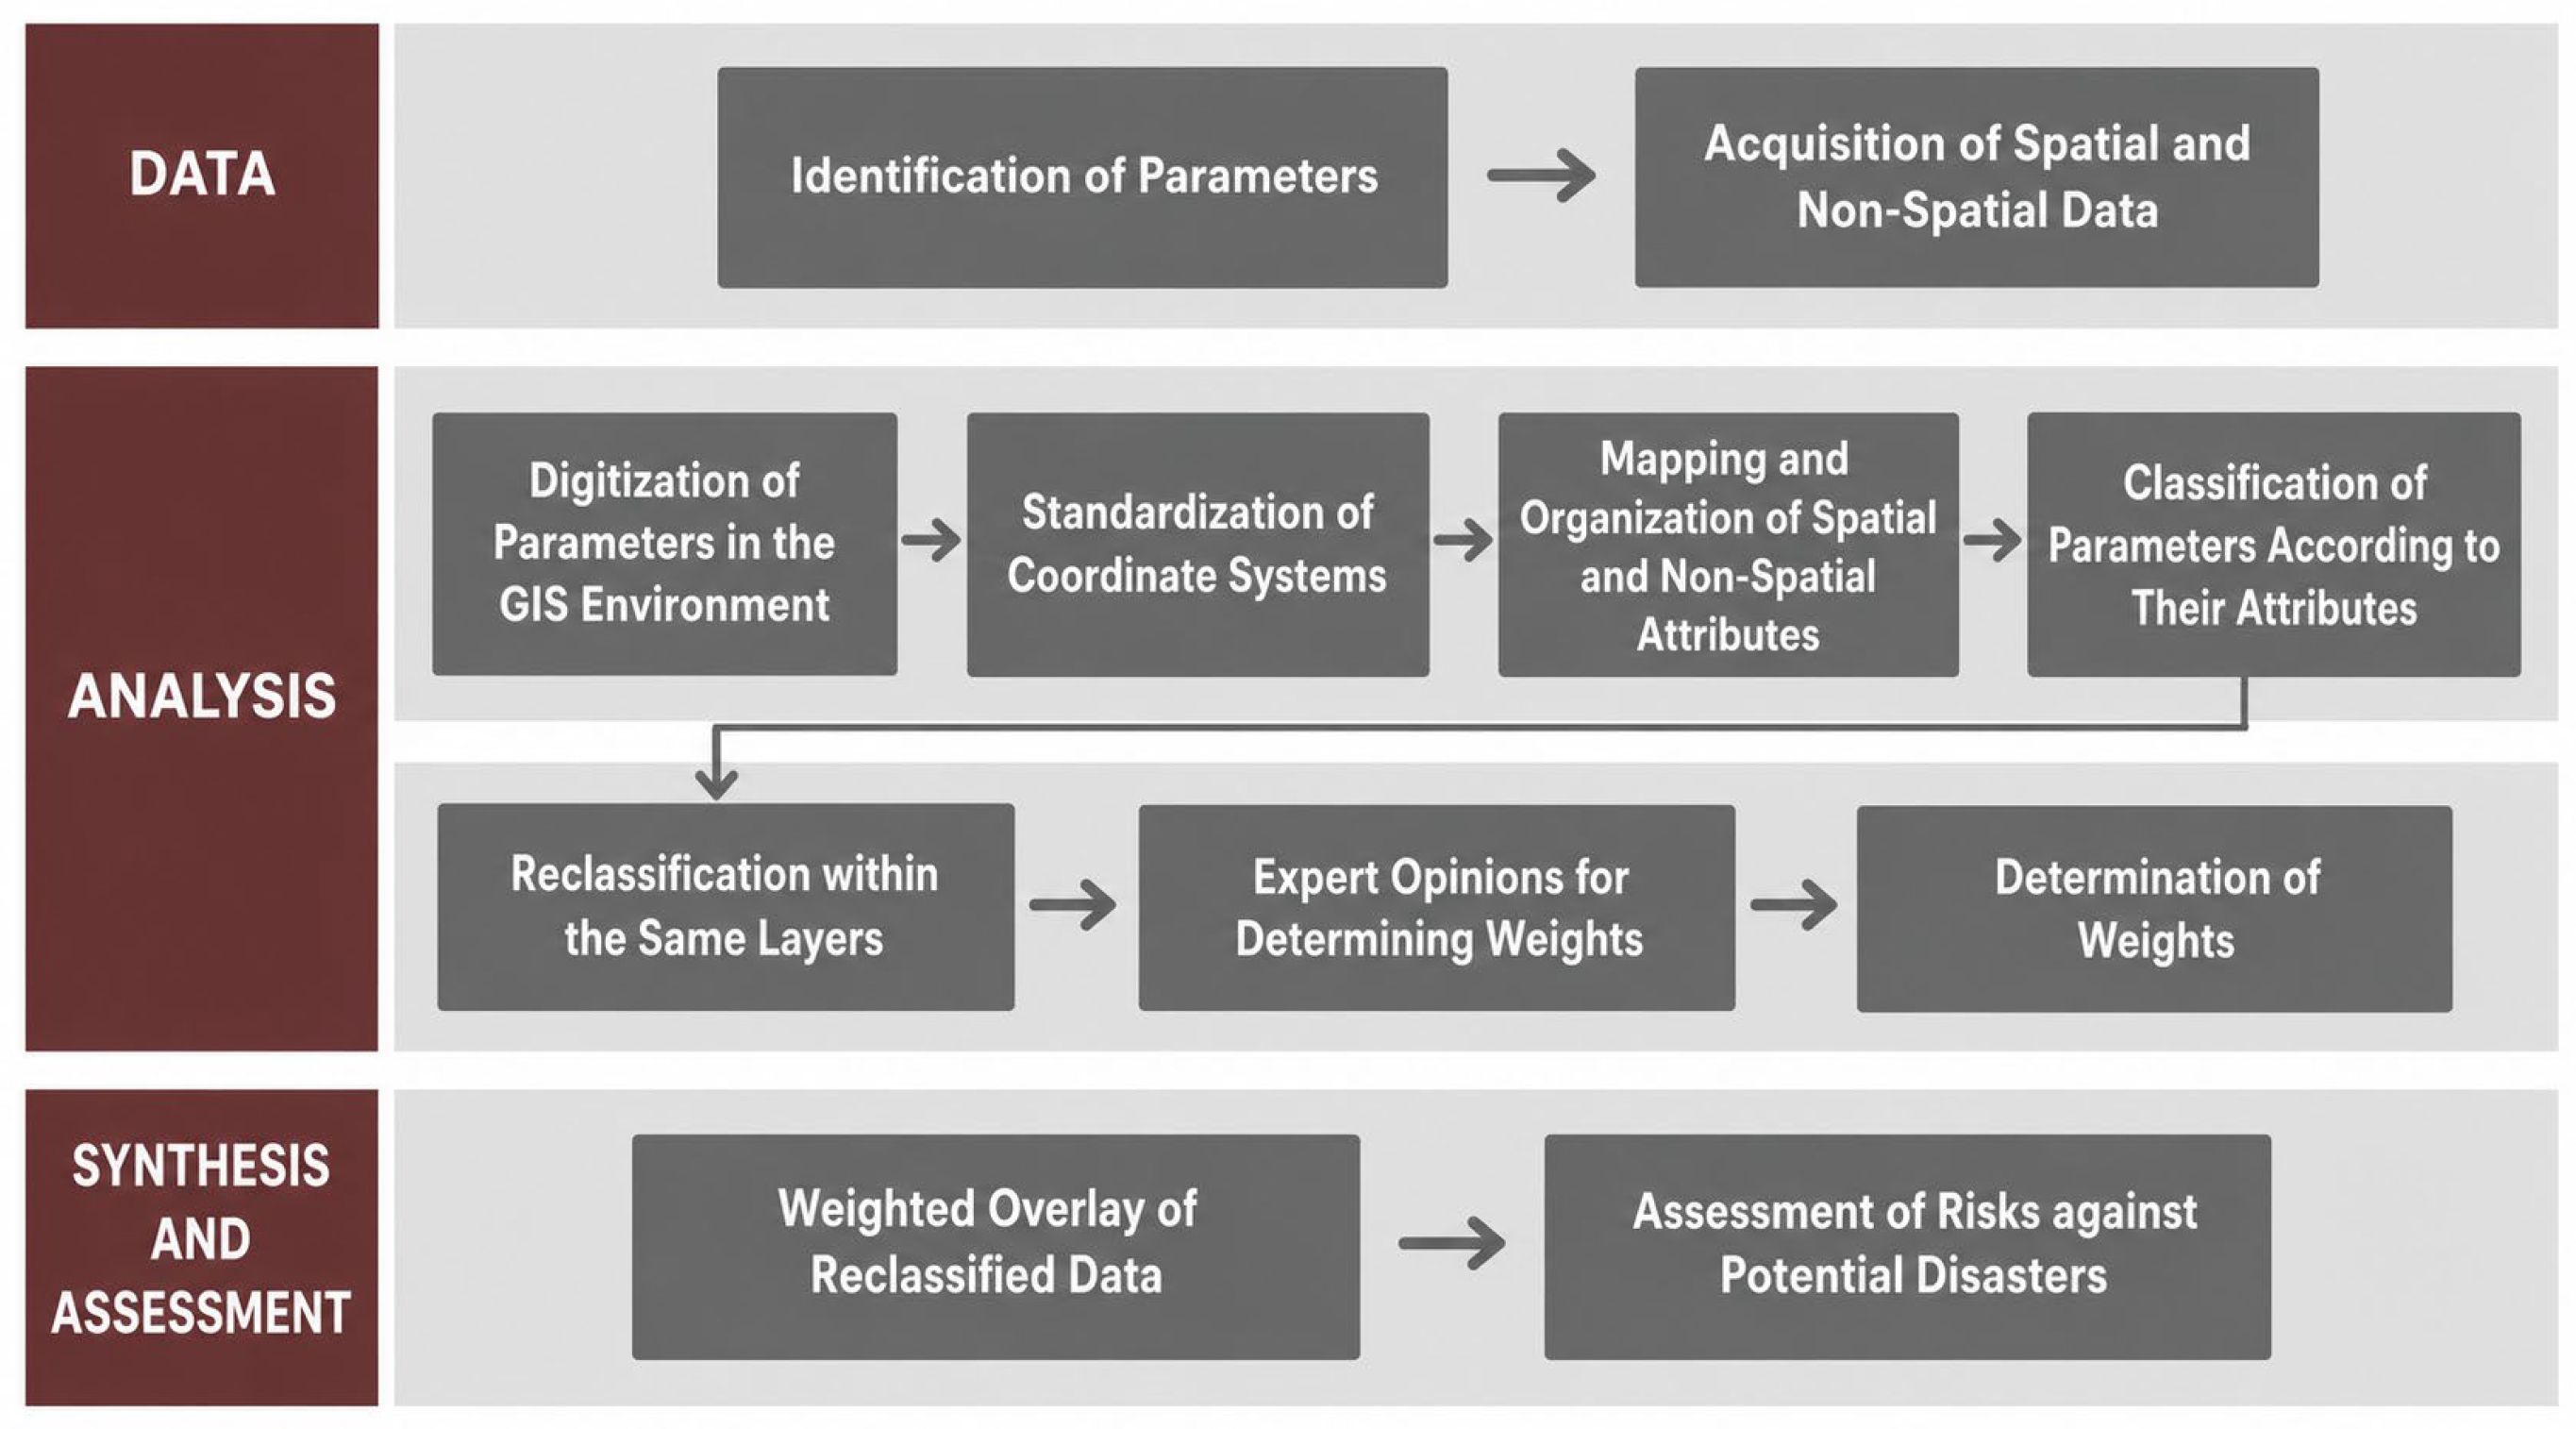
Figure 4.
The slope map of Ferhatpasa Neighbourhood (by authors).
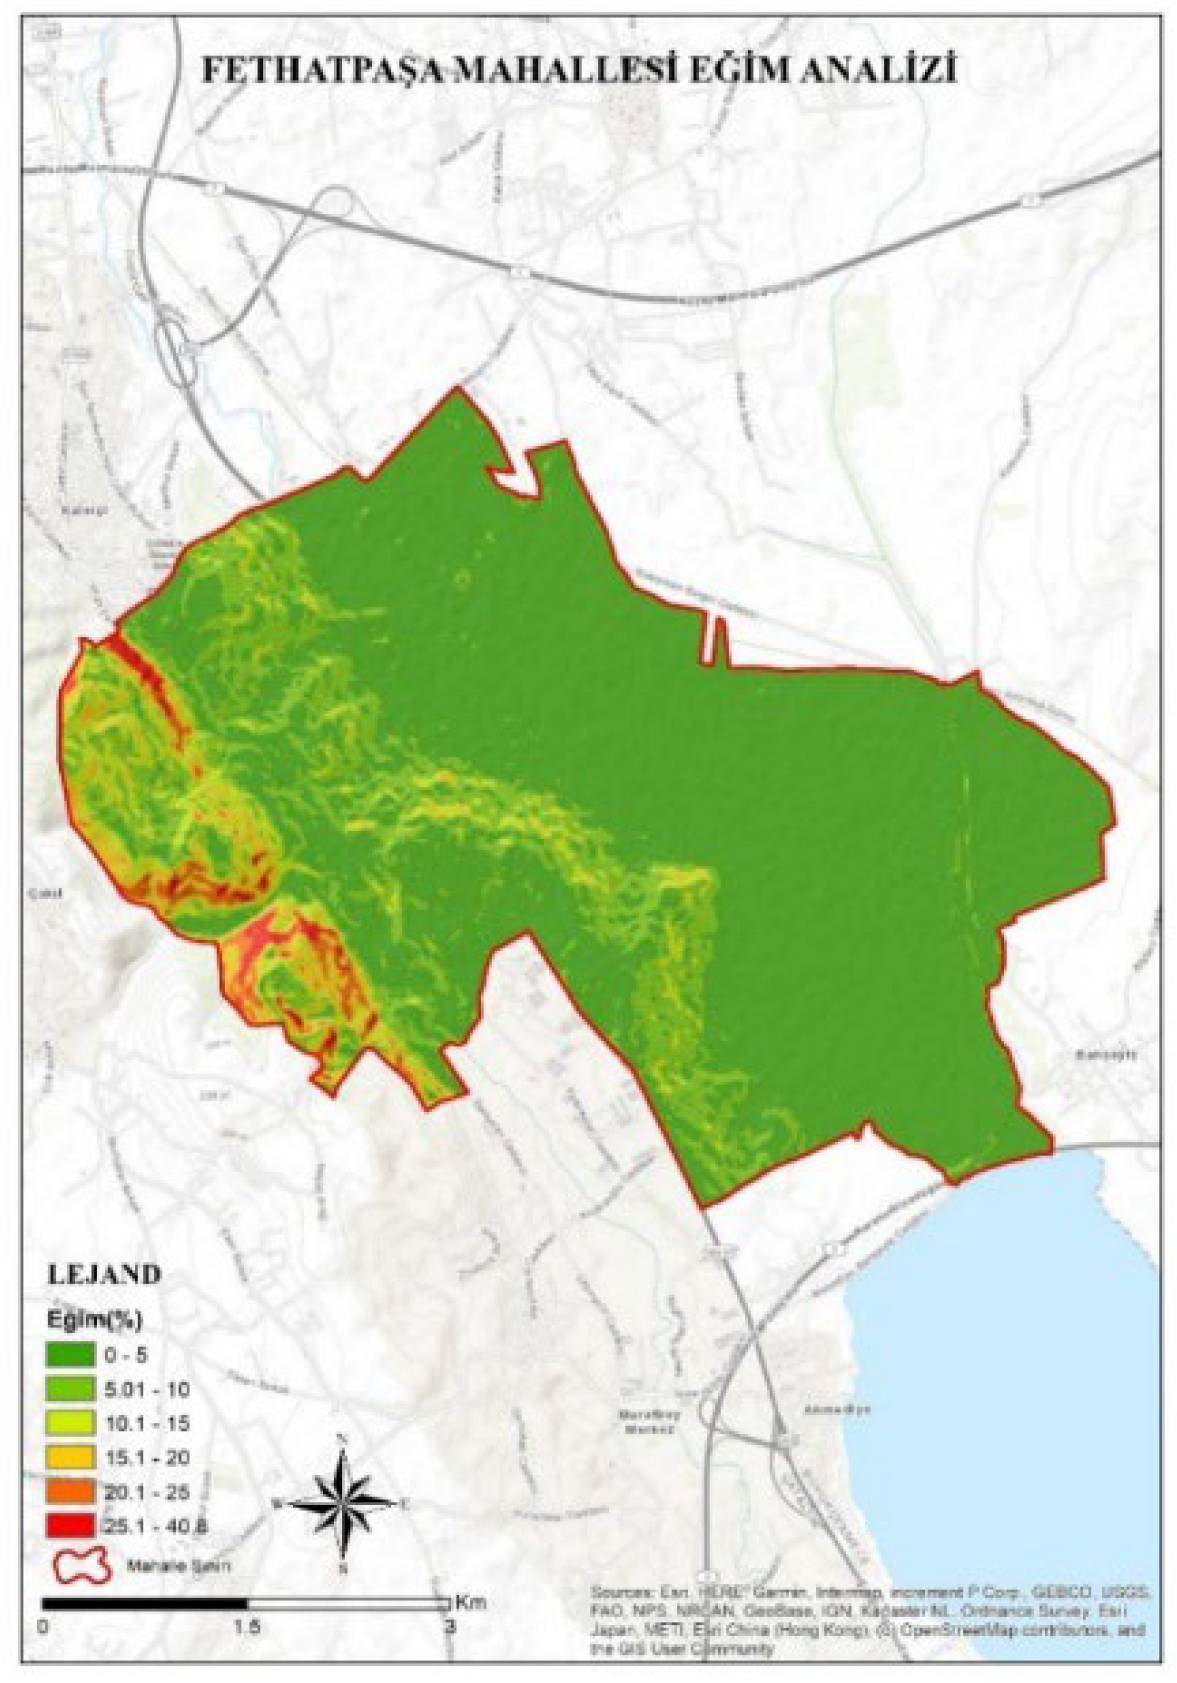
Figure 5.
Elevation Analysis of Ferhatpaşa Neighborhood (by authors).
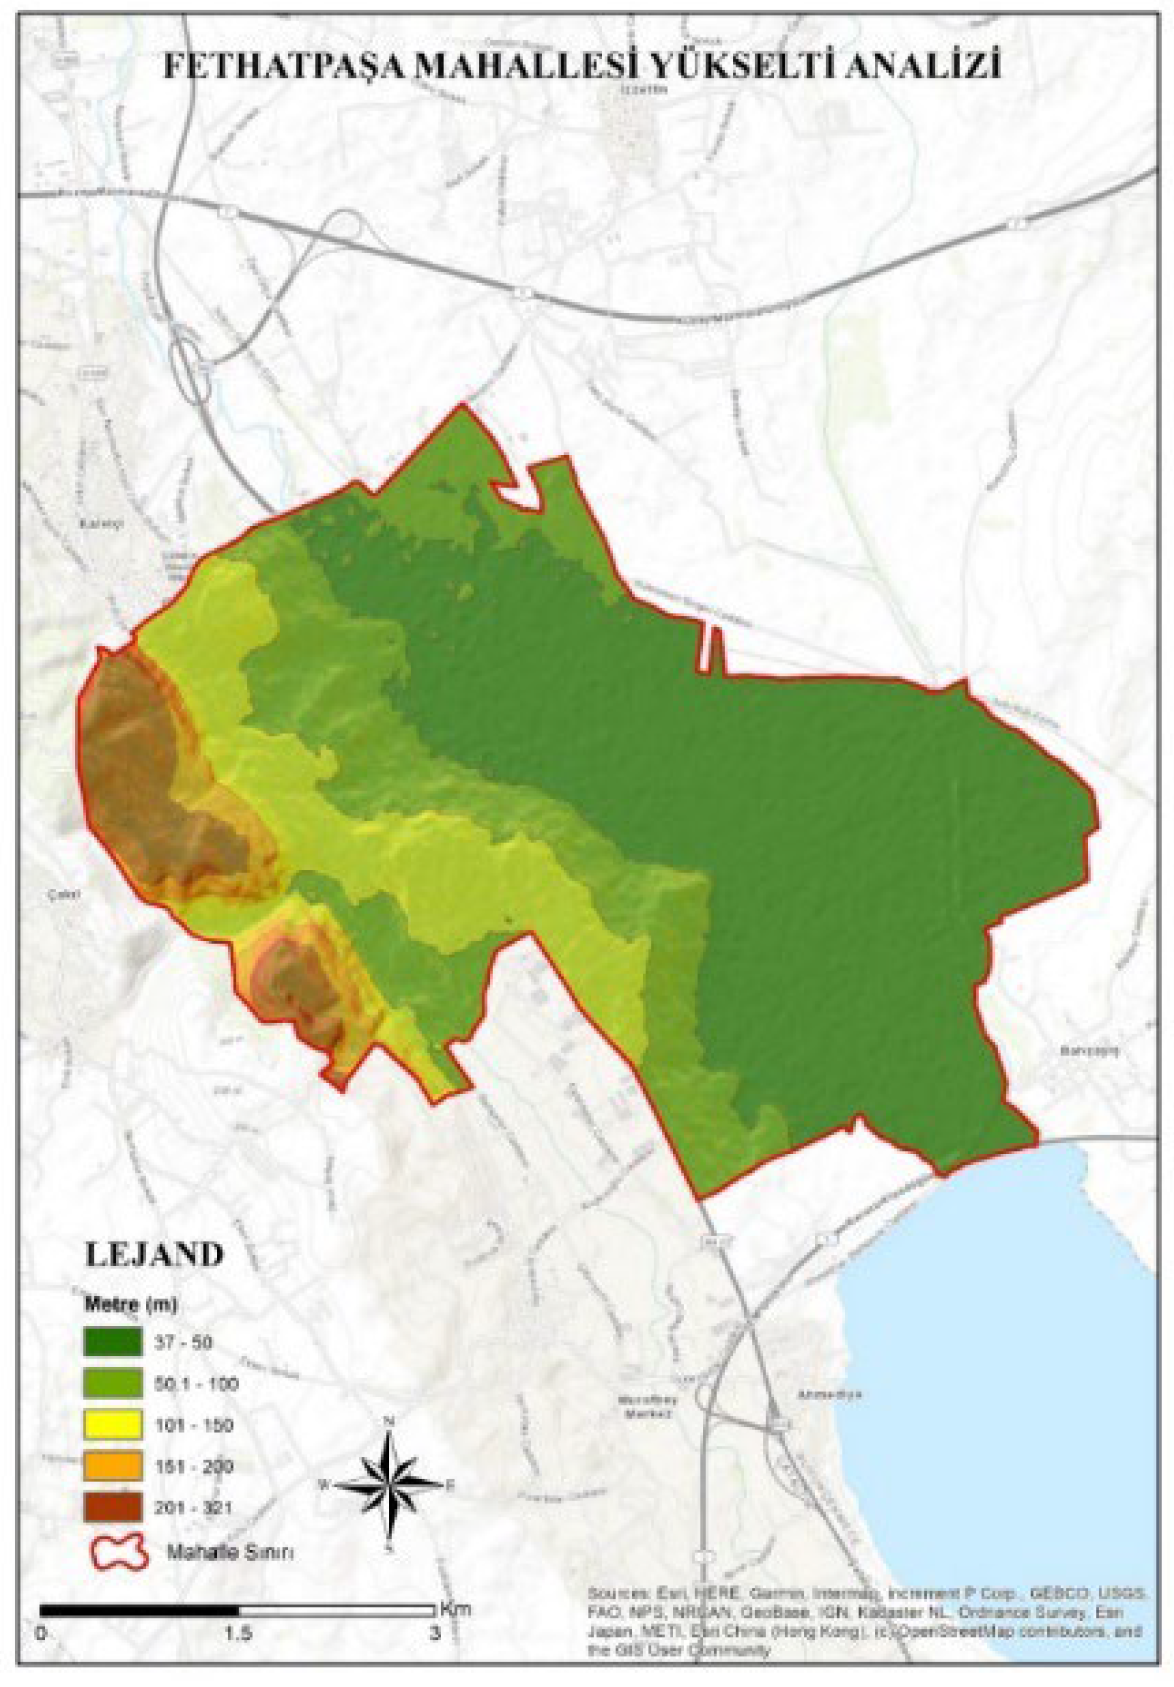
Figure 6.
The aspect map of Ferhatpasa Neighbourhood (by authors).
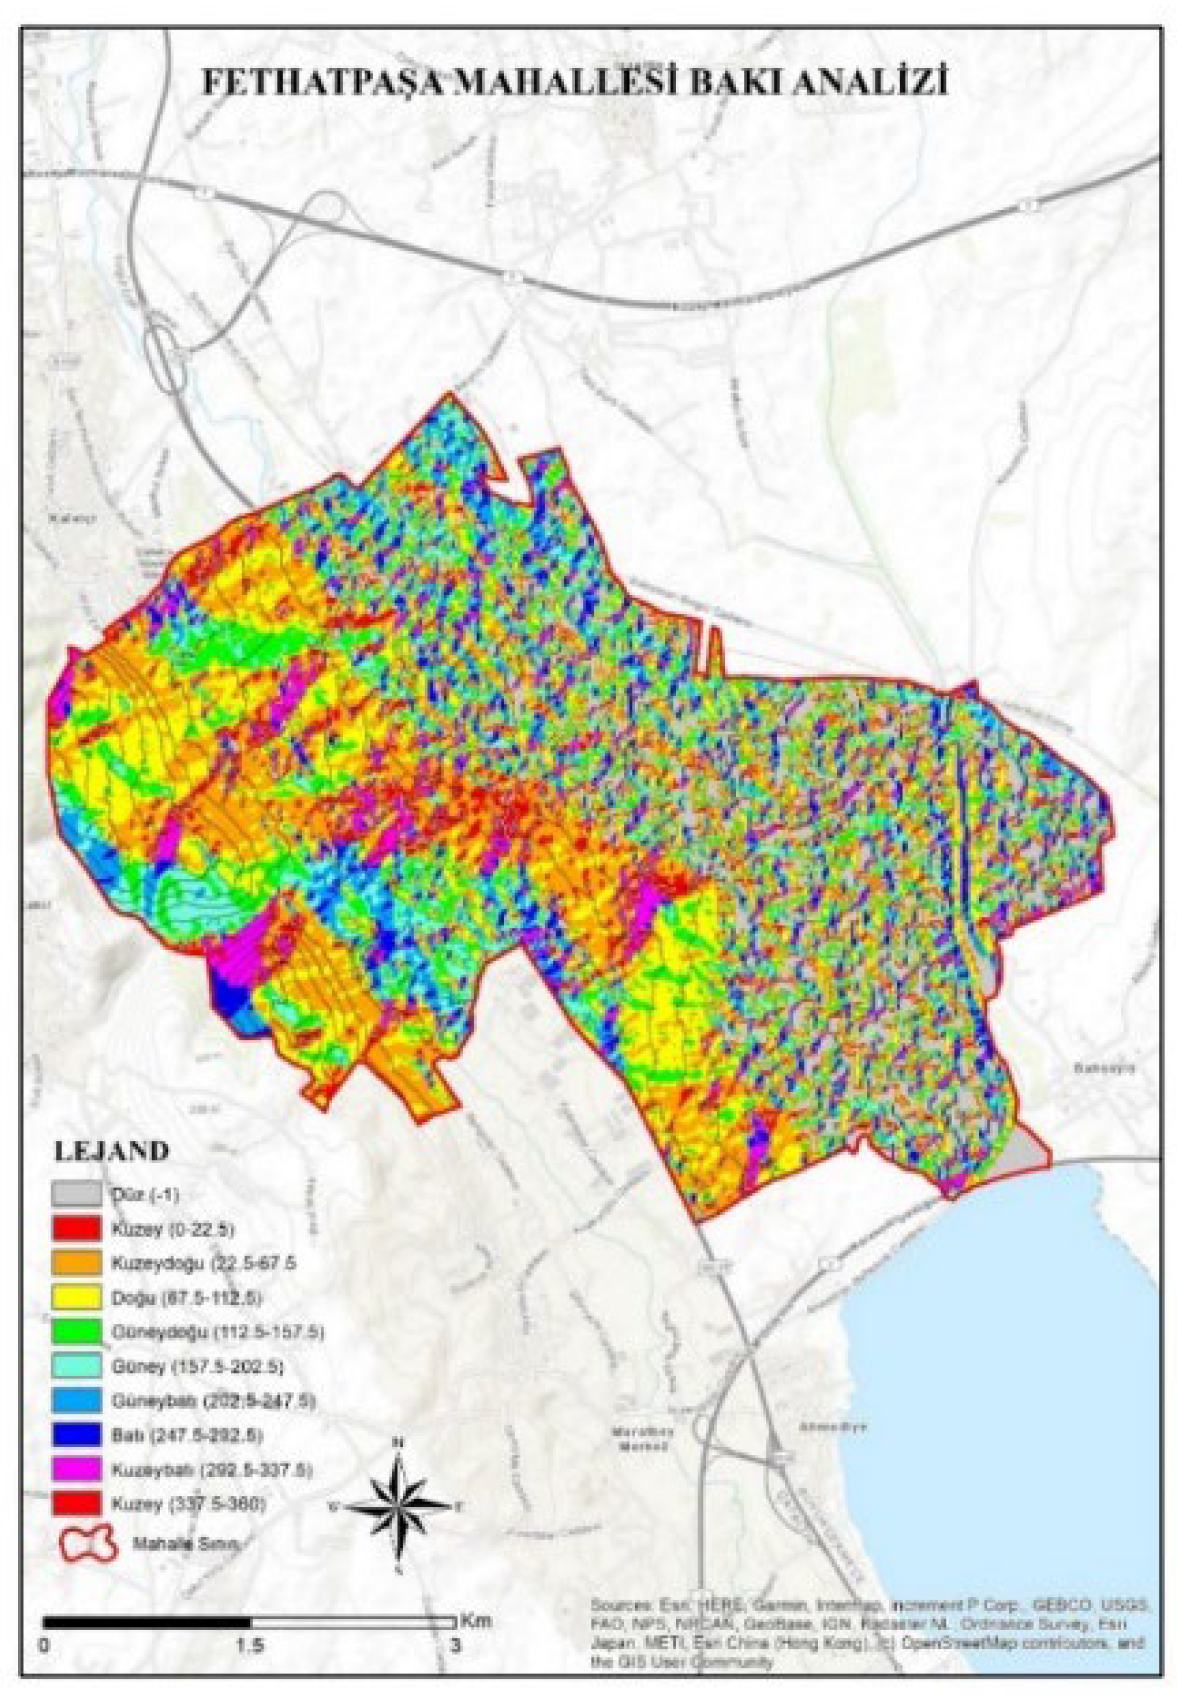
Figure 7.
Yearly Precipitation Amount Analyses of Catalca District / Ferhatpasa Neighbourhood (by authors).
Figure 7.
Yearly Precipitation Amount Analyses of Catalca District / Ferhatpasa Neighbourhood (by authors).
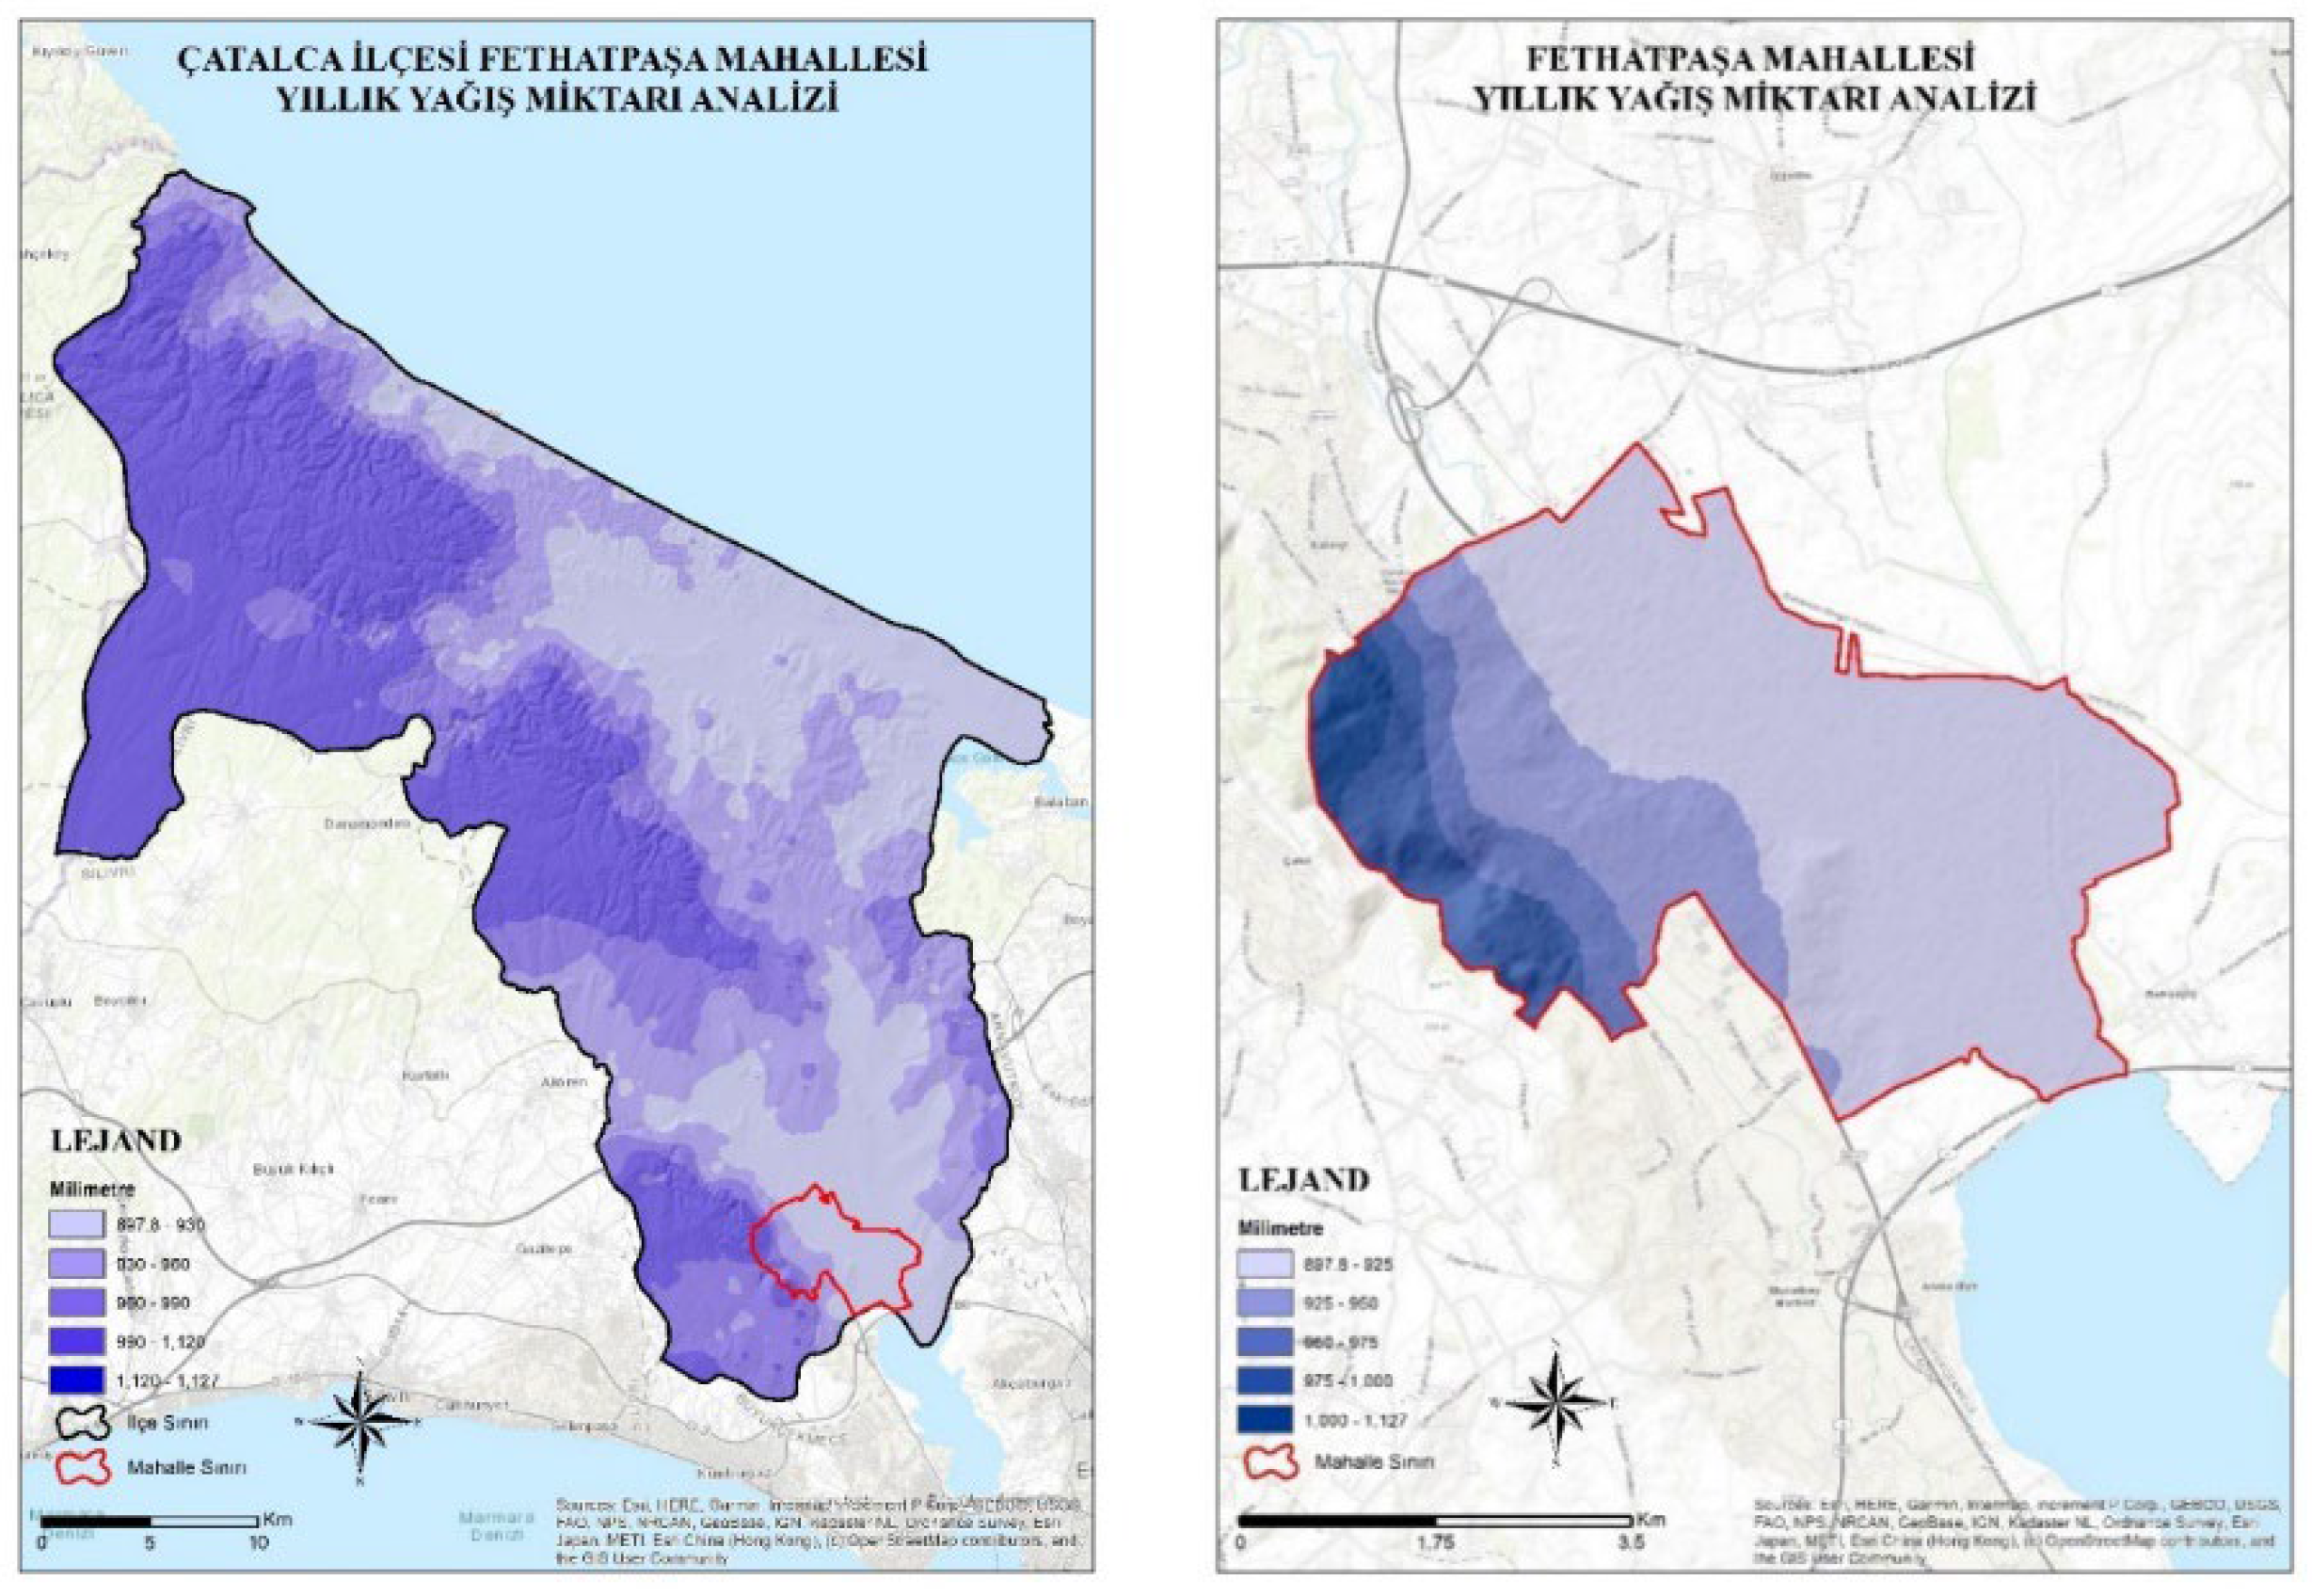
Figure 8.
Active fault lines and distance analysis to fault lines of Ferhatpasa Neighborbood (by authors).
Figure 8.
Active fault lines and distance analysis to fault lines of Ferhatpasa Neighborbood (by authors).
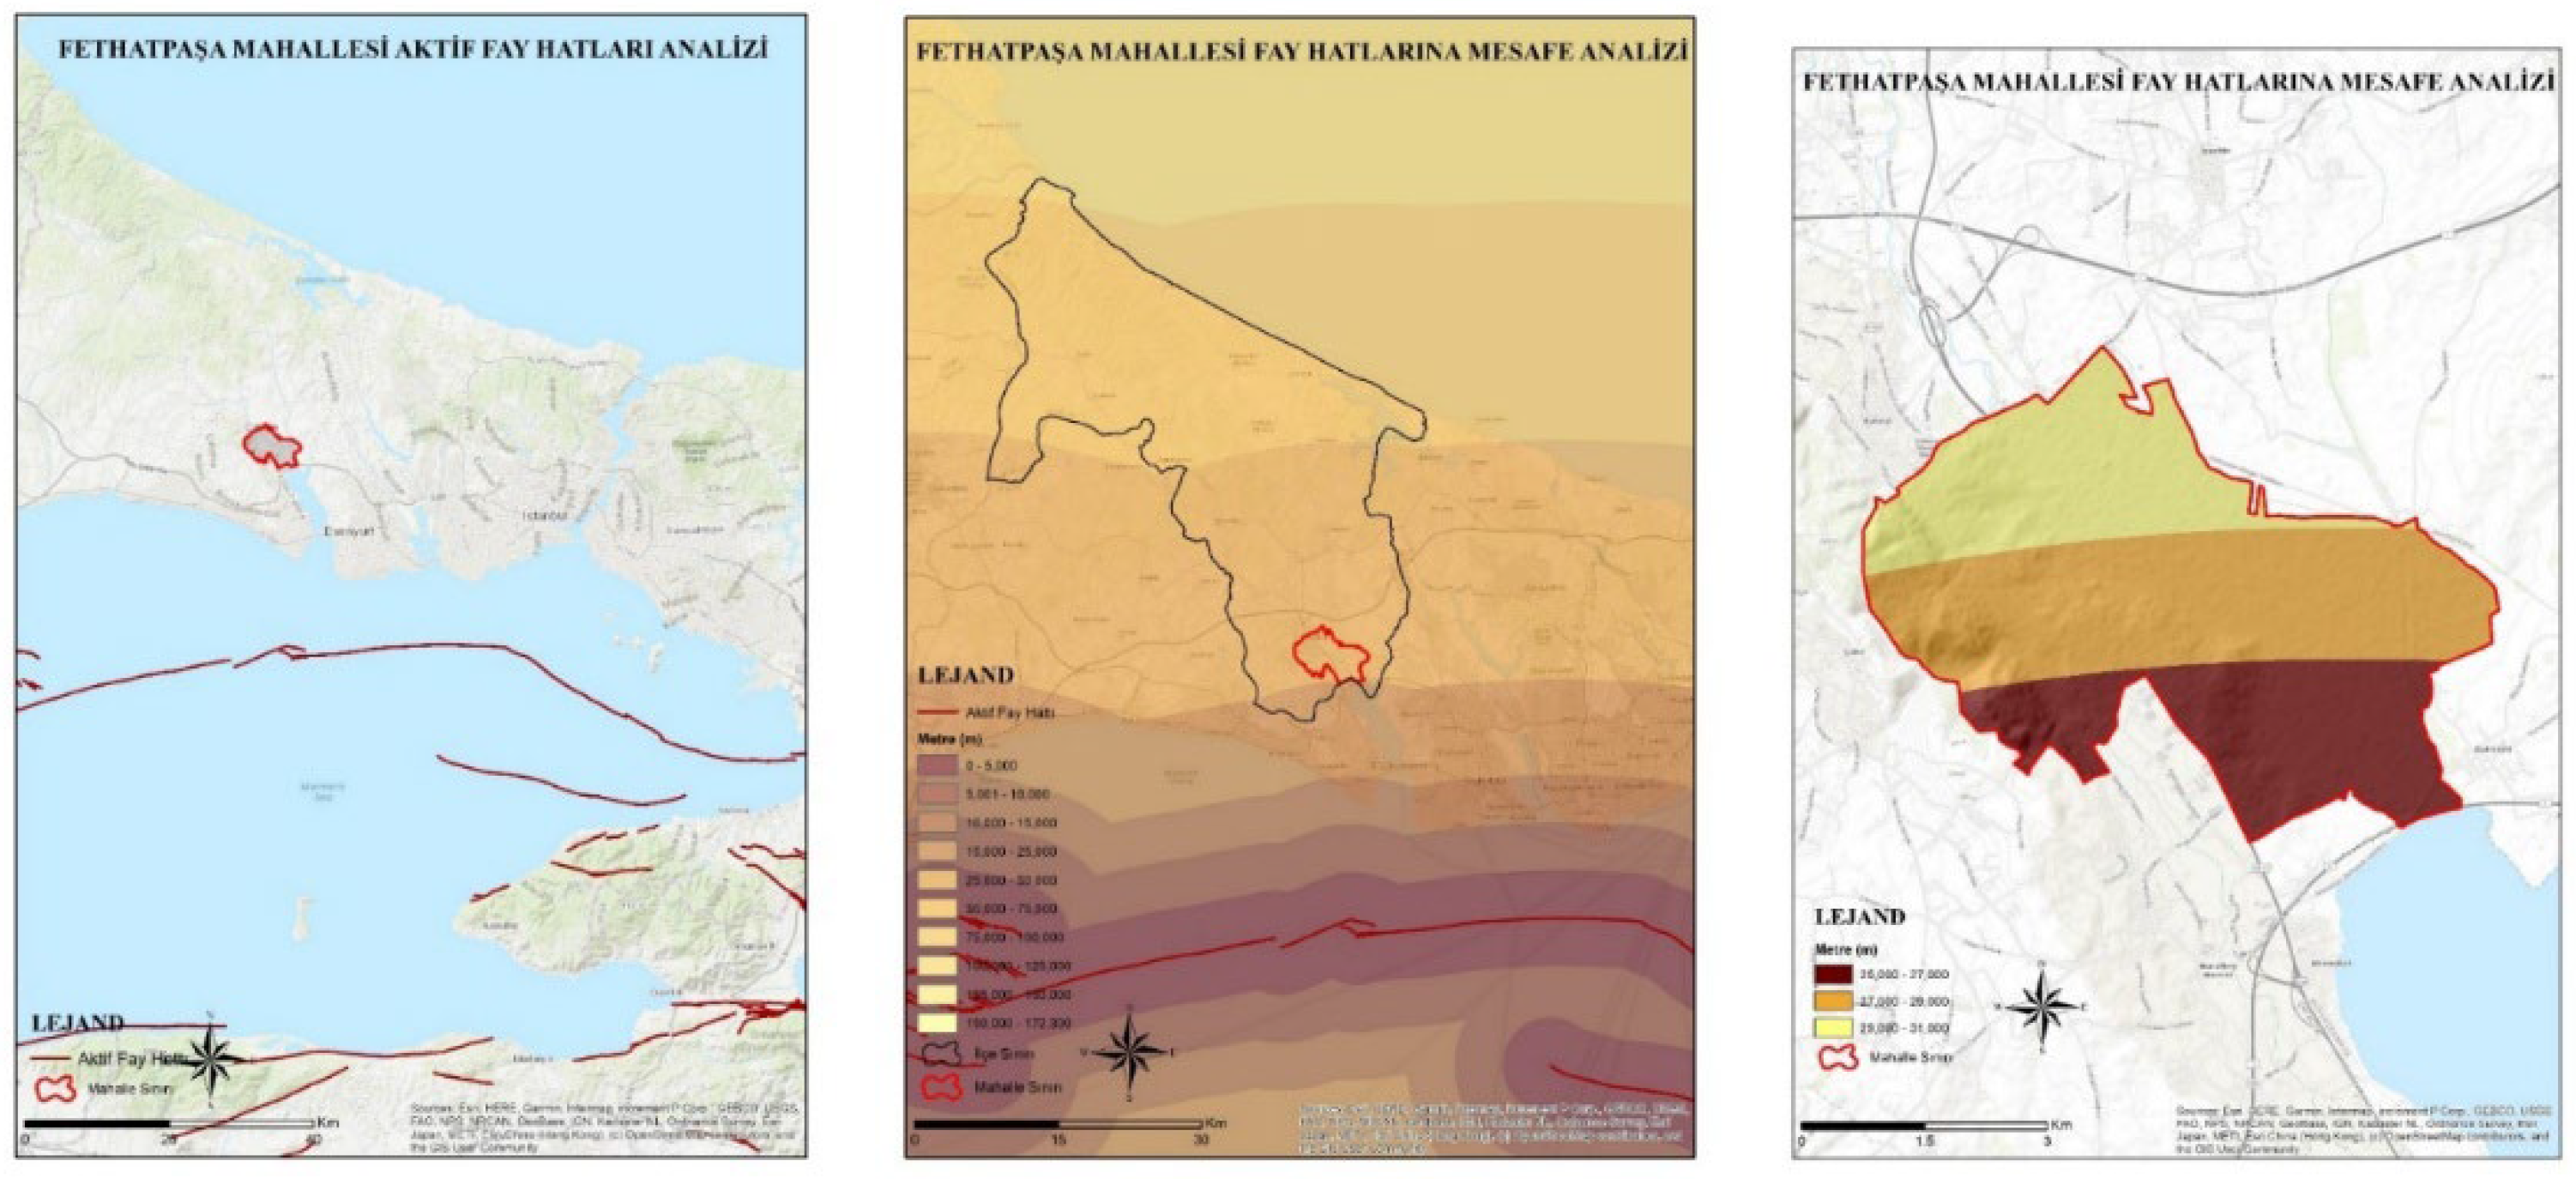
Figure 9.
(a). Hydrology analysis with DEM data for Ferhatpaşa Neighborhood (b) Hydrology analysis with ISKI data (c). Distance analysis to hydrological structures in Ferhatpaşa Neighborhood (by authors).
Figure 9.
(a). Hydrology analysis with DEM data for Ferhatpaşa Neighborhood (b) Hydrology analysis with ISKI data (c). Distance analysis to hydrological structures in Ferhatpaşa Neighborhood (by authors).
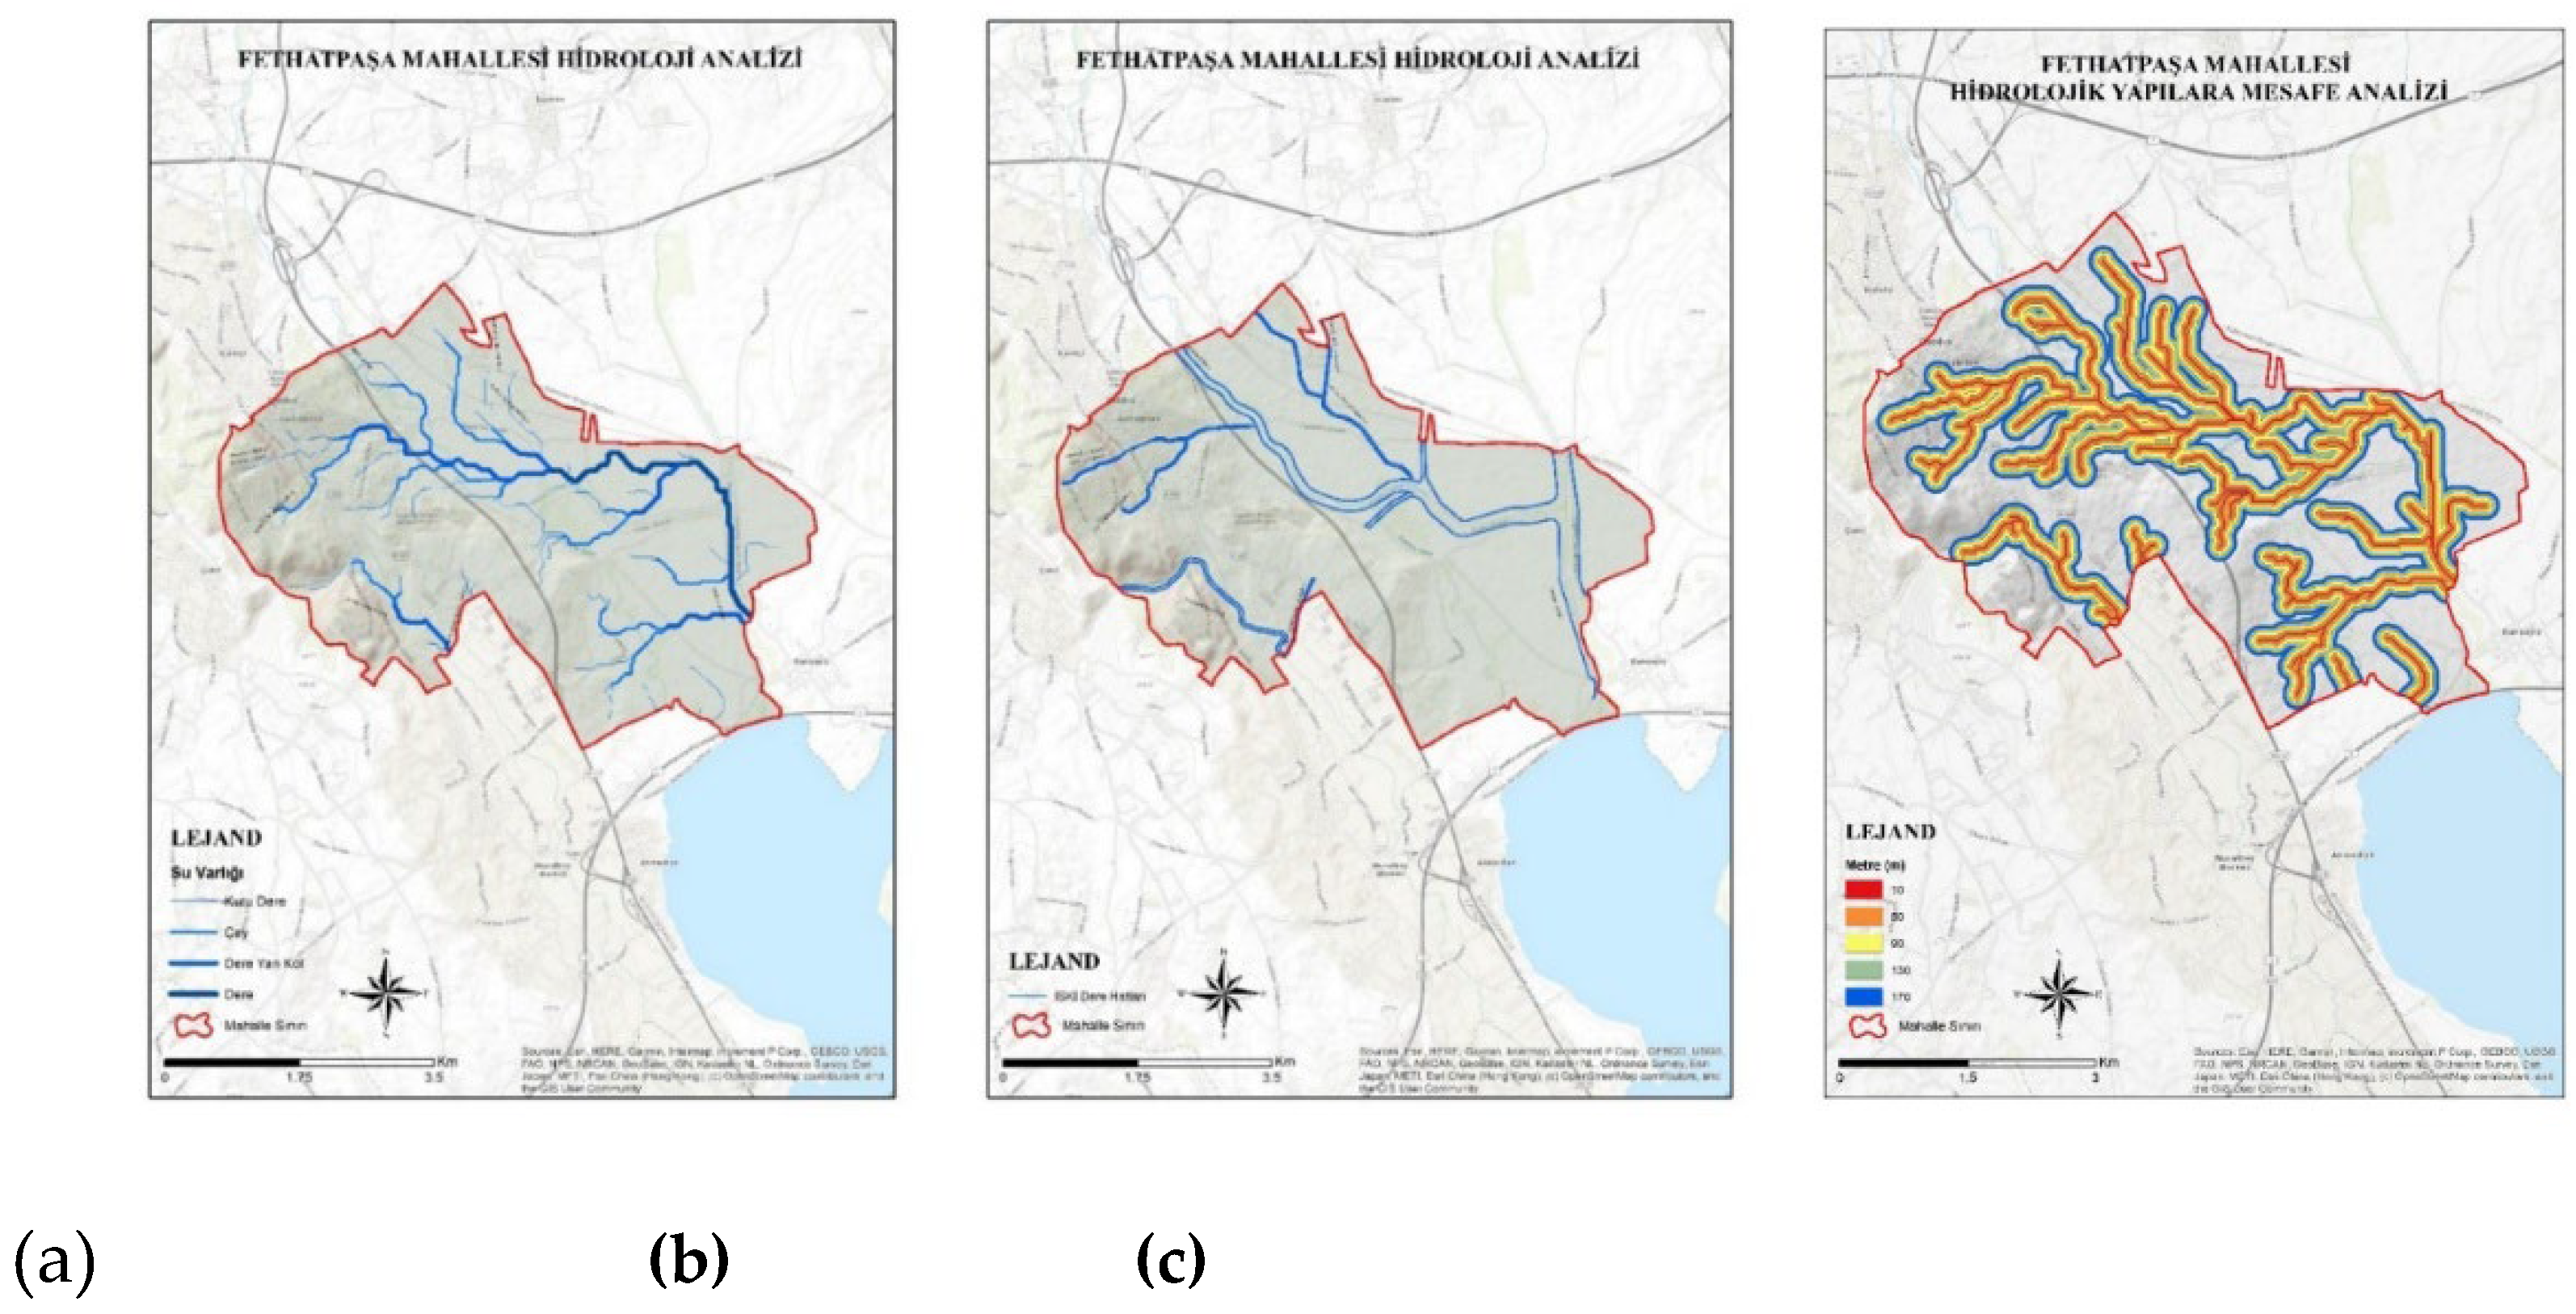
Figure 10.
Land use map of Ferhatpasa Neighborhood (by authors).
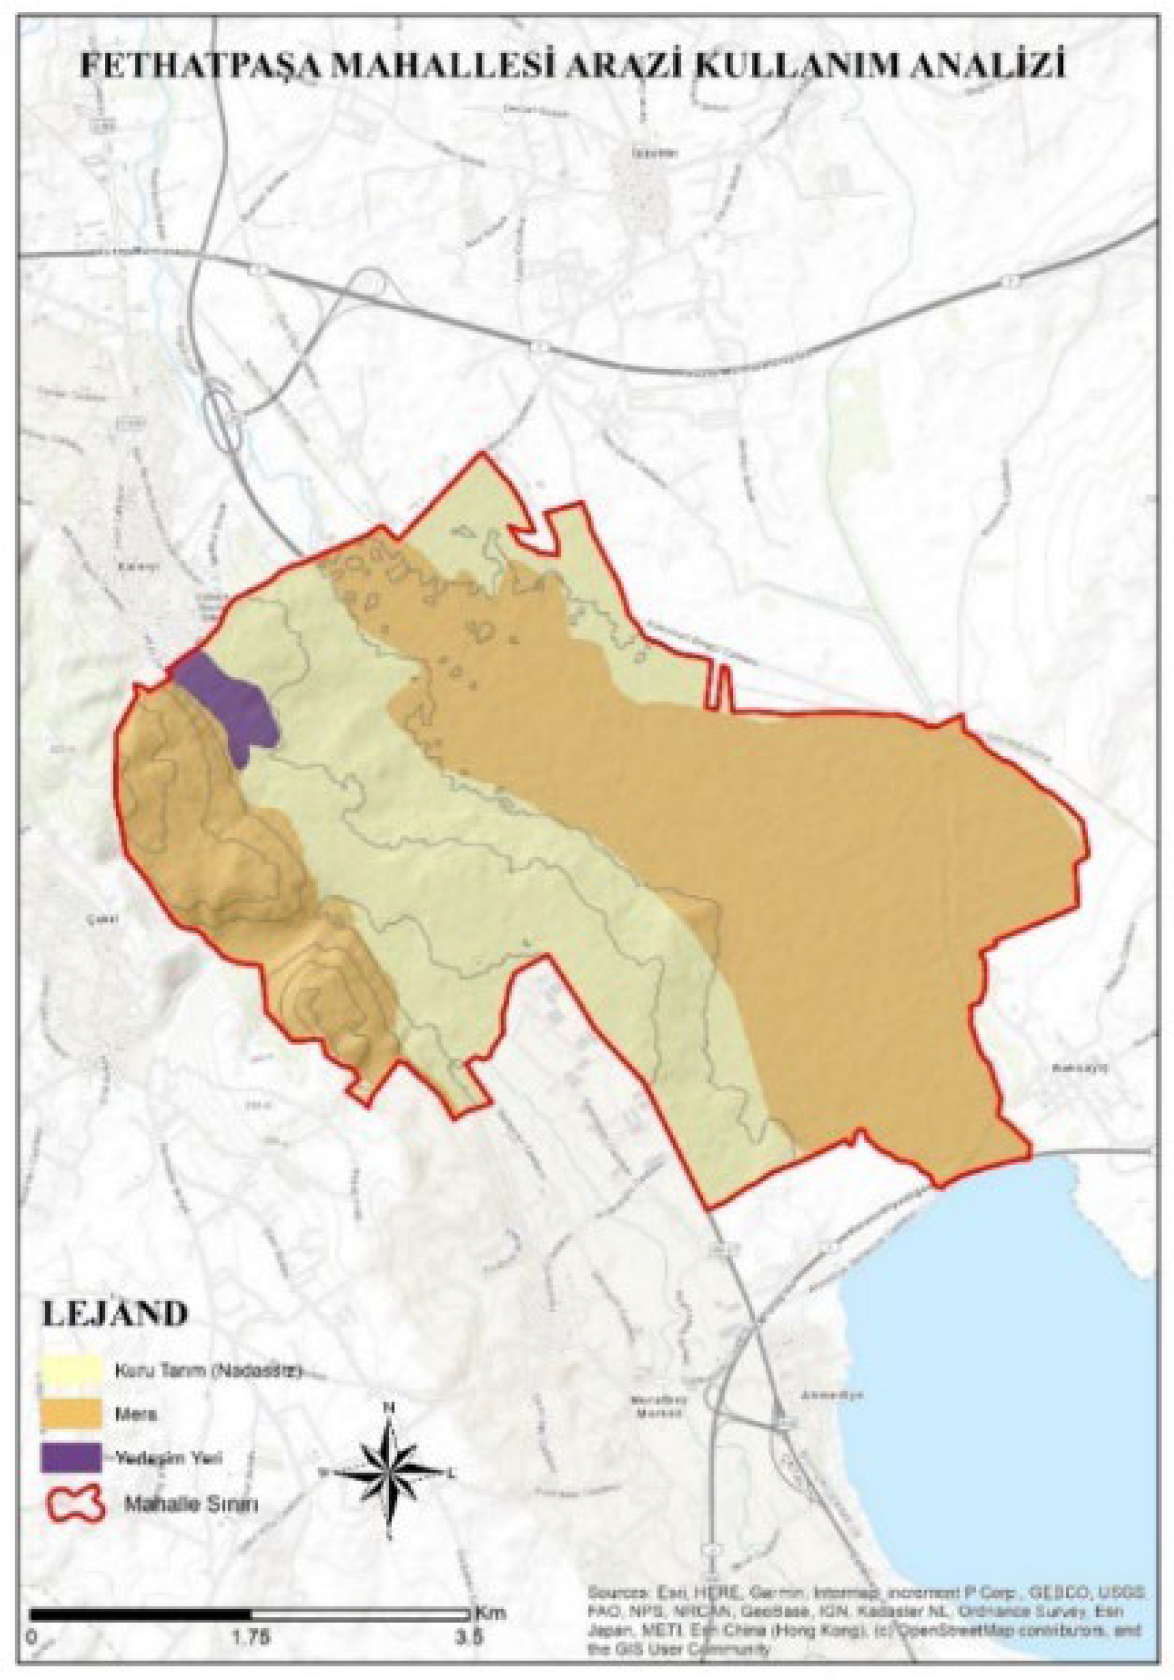
Figure 11.
Soil capability analysis of Ferhatpasa Neighborhood (by authors).
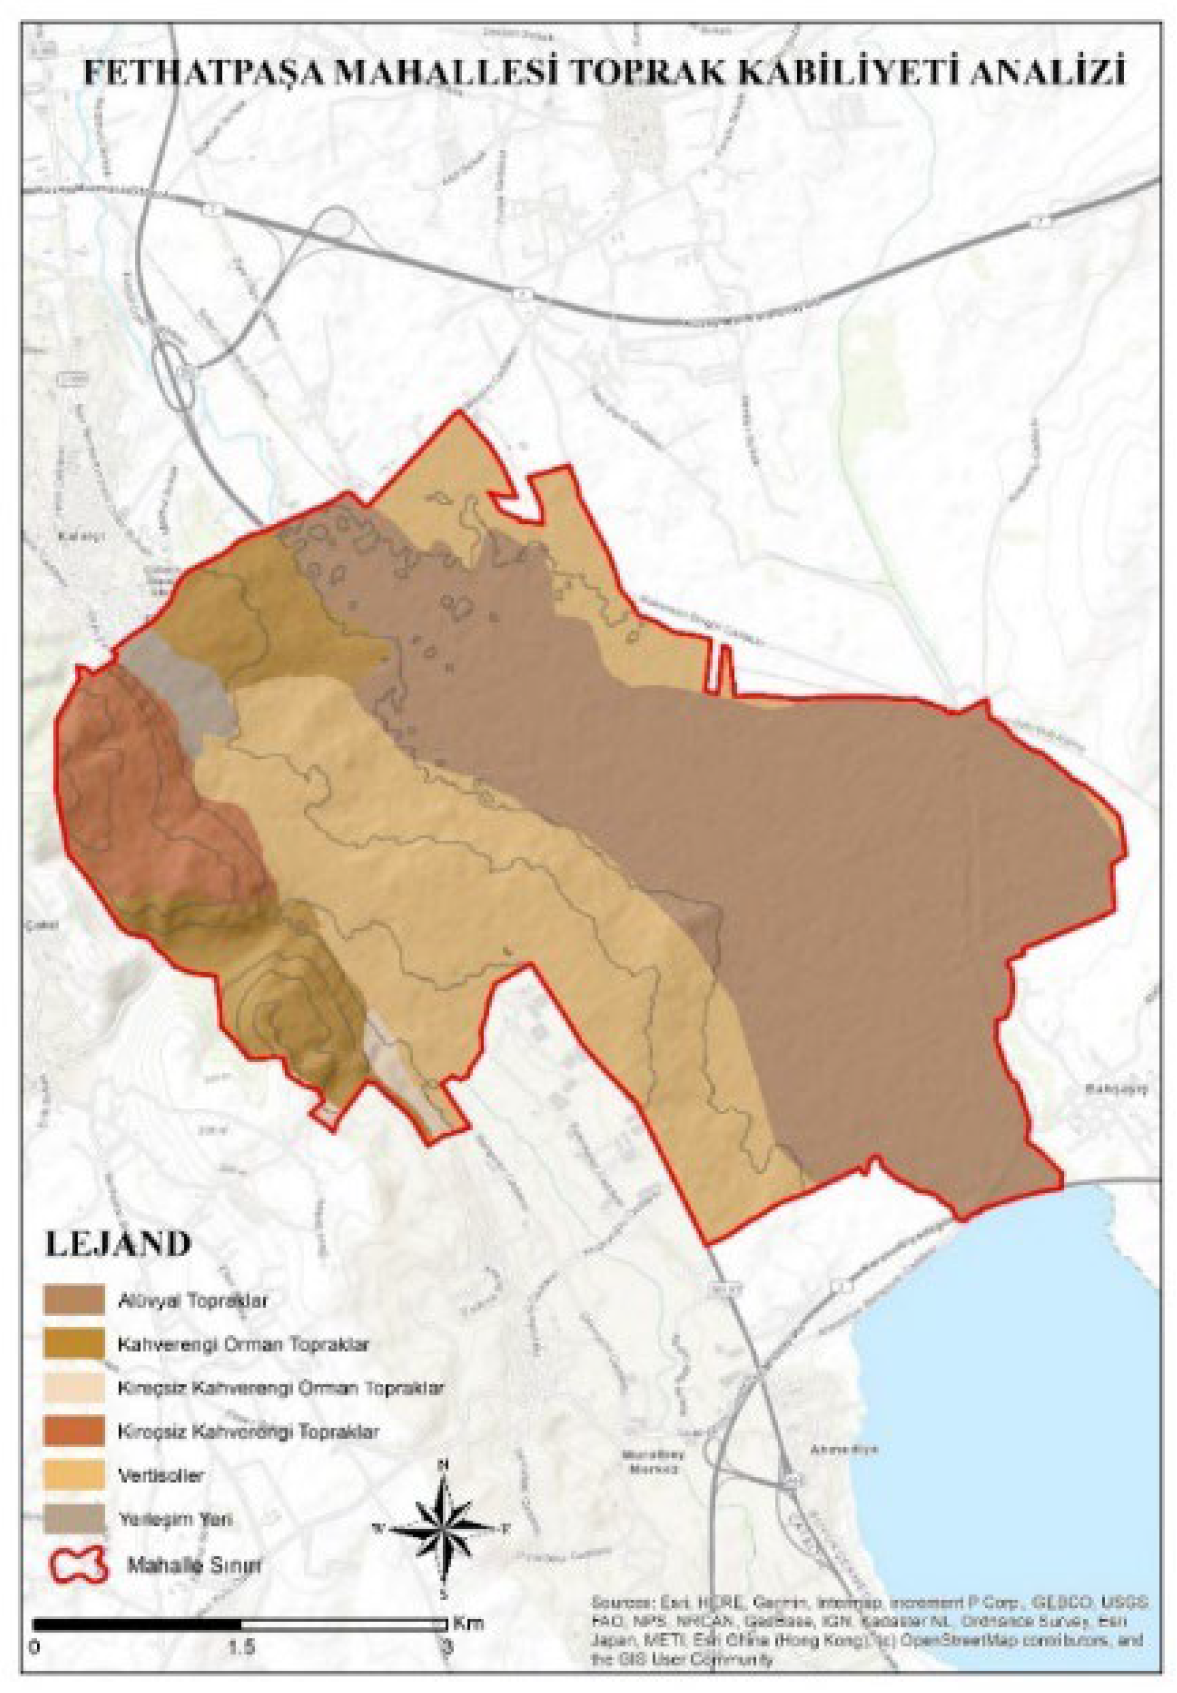
Figure 12.
Expert opinions on the prioritization of parameters (by authors).
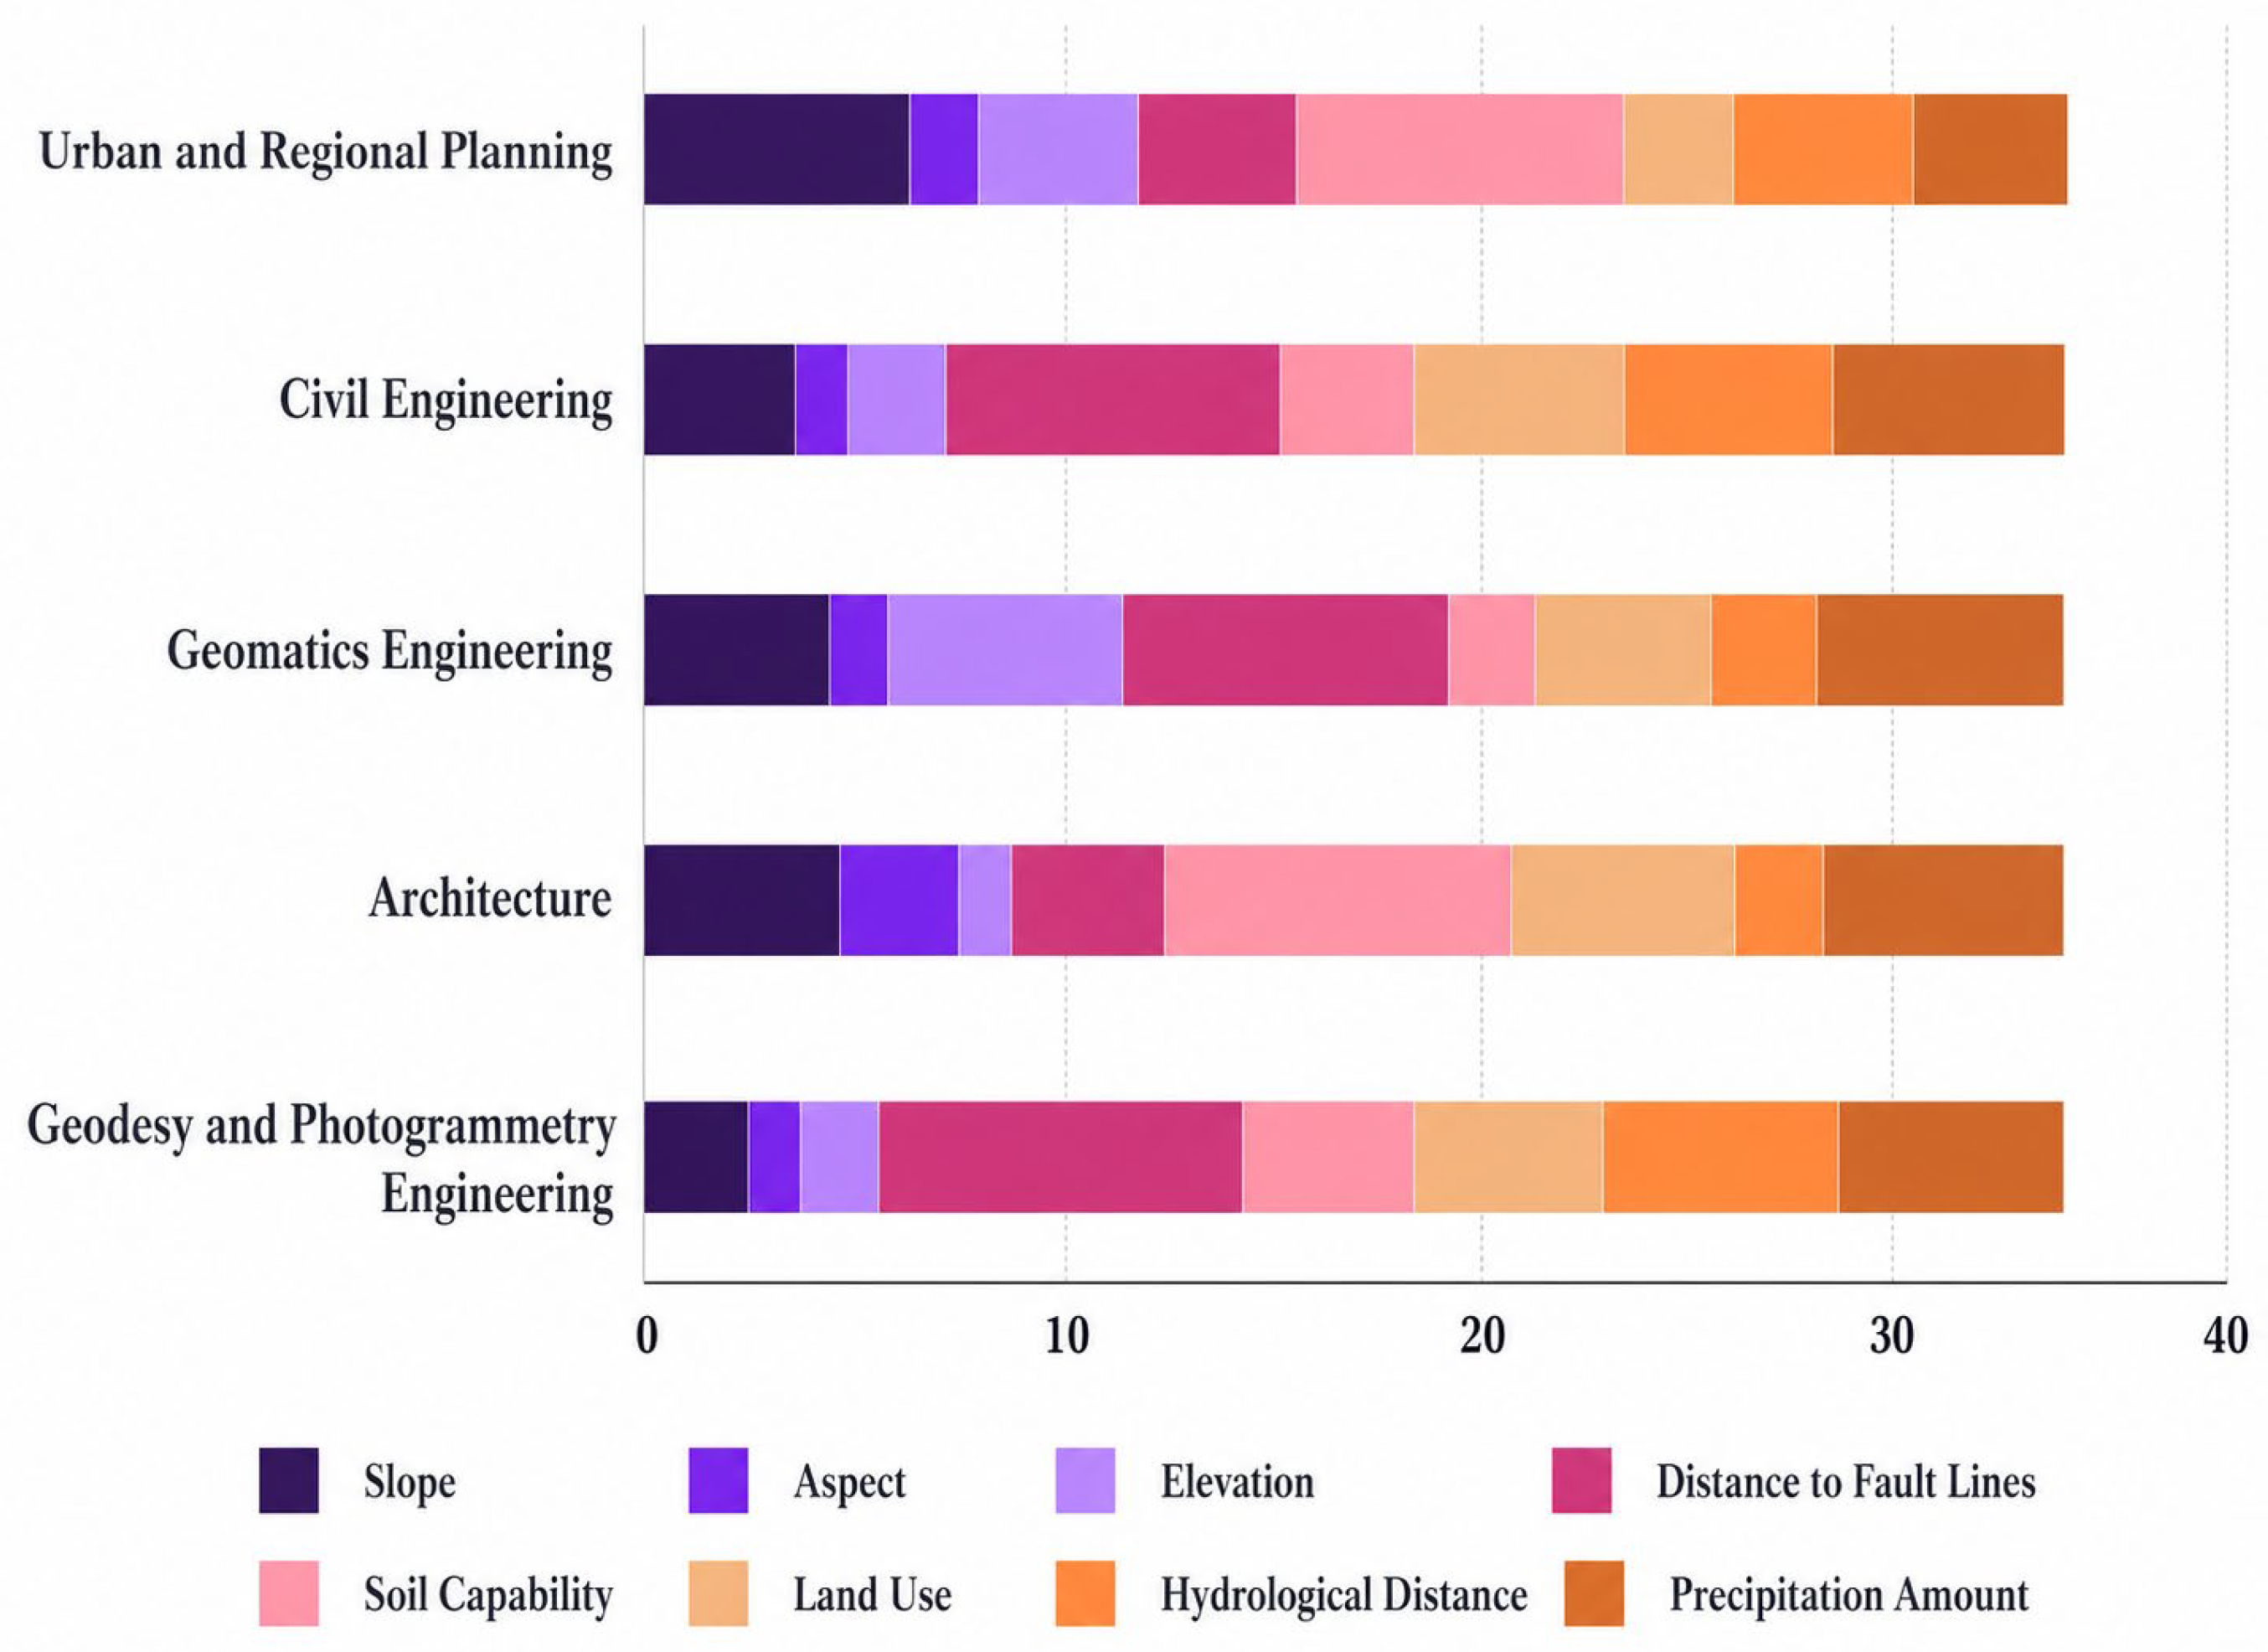
Figure 13.
Total score values in parameters after expert opinions (by authors).
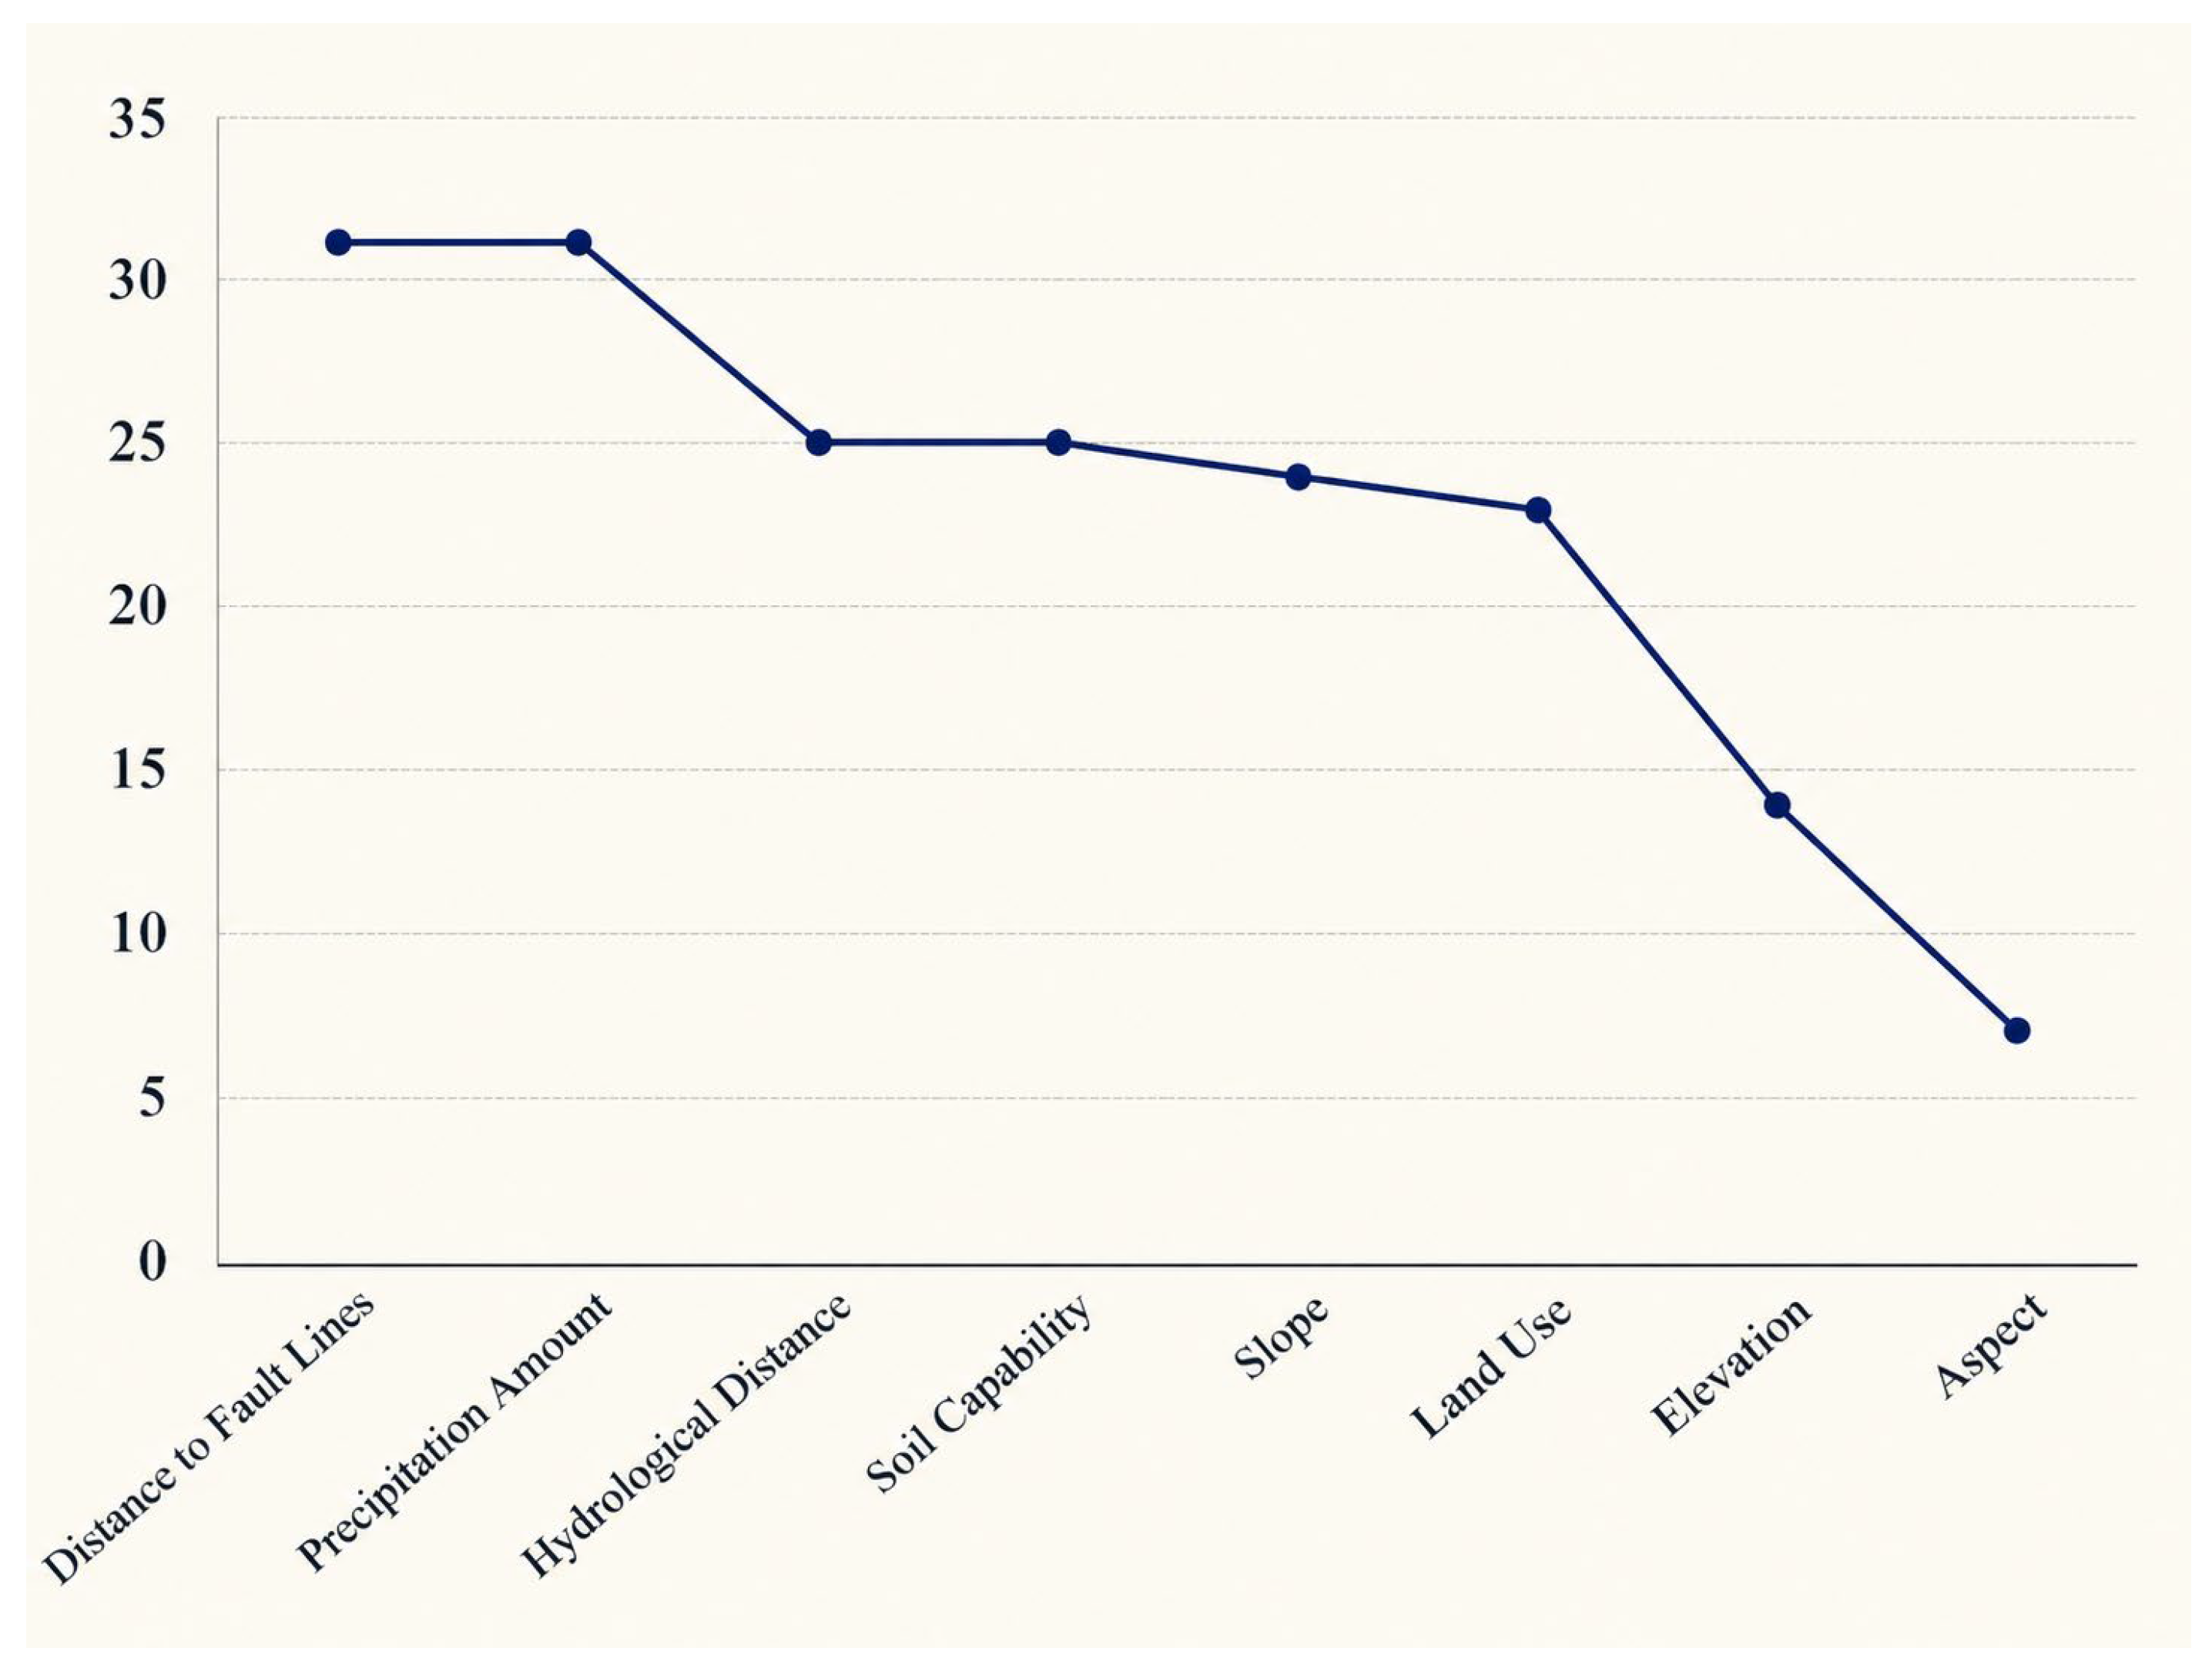
Figure 14.
Disaster risk analysis of Ferhatpasa Neighborhood (by authors).
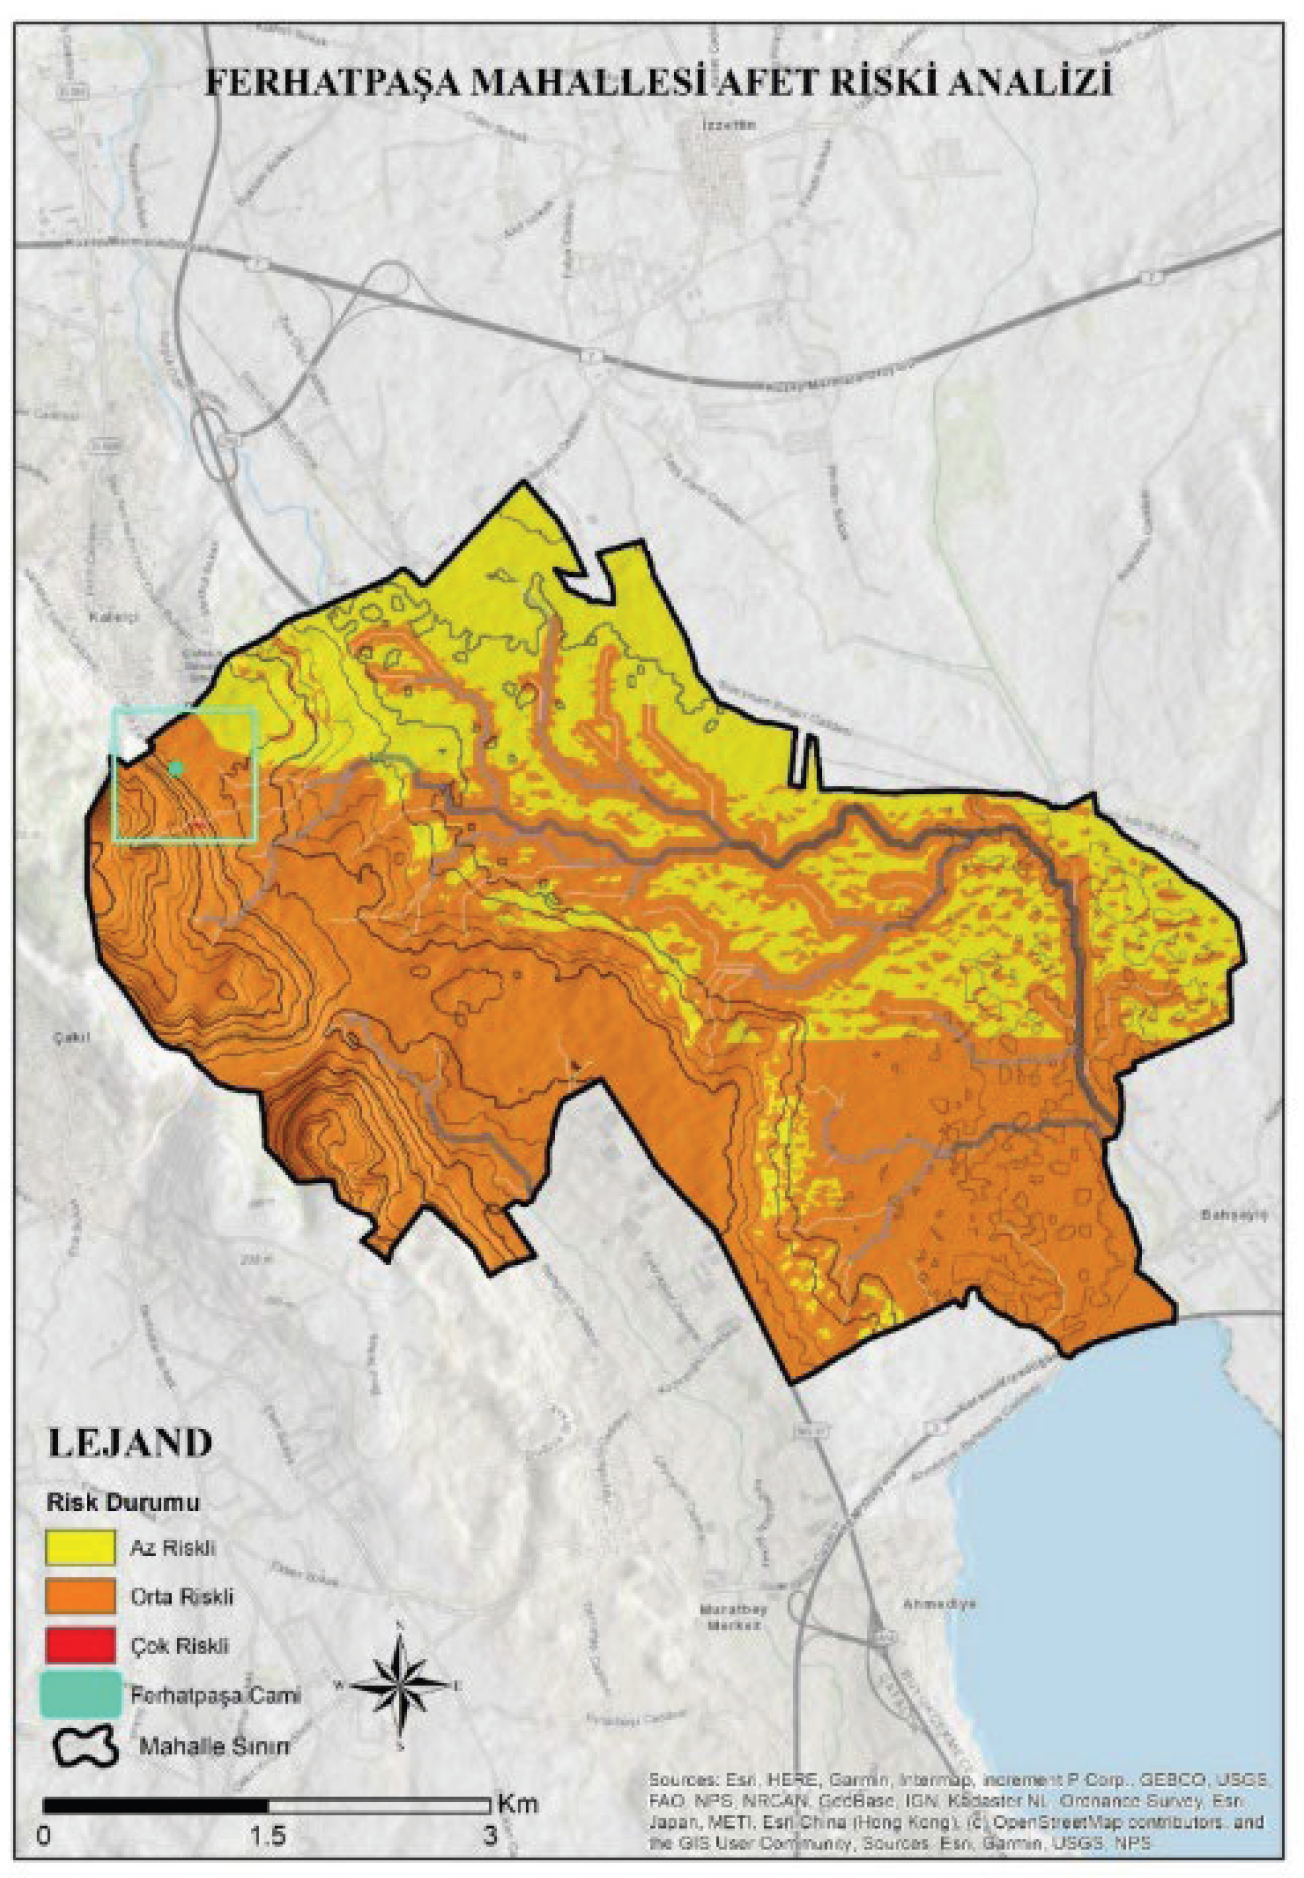
Table 1.
Rationale for selecting the criteria.
| Selected Criterion | Relationship with Historic Buildings, Earthquakes, and Disaster Risk | Literature Reference |
|---|---|---|
| Distance to Fault Lines | Directly determines the seismic shock waves and acceleration values to which the structure may be exposed. | [13]; [14] |
| Slope and Elevation | Determine slope instability during earthquakes, including landslides, as well as the effect of topographic amplification of seismic waves. | [15] |
| Soil Capability / Soil Type | Alluvial or clayey soils, including vertisols, may amplify seismic waves and increase the risk of settlement or liquefaction during earthquakes. | [16]; [17] |
| Precipitation and Hydrological Structure | Increase the water saturation level of the soil and may intensify liquefaction, slope instability, and retaining wall failure under seismic triggering through hydro-seismic interaction. | [18]; [19] |
Table 2.
Structure and type of data layers.
| Data Layer | Data Structure | Data Type |
|---|---|---|
| Slope | Raster. | Pixel |
| Elevation | Raster. | Pixel |
| Aspect | Raster. | Pixel |
| Precipitation | Raster. | Pixel |
| Land Use | Vector | Polygon |
| Soil Capability | Vector | Polygon |
| Fault Lines | Vector | Polyline |
| Hydrological Structure | Vector | Polyline |
Table 4.
Classification information on parameters.
| Parameter | Values | Disaster Risk Classification | Effect Value |
|---|---|---|---|
| Slope (%) | 0–10 | Low risk | 1 |
| 0–10 | Medium risk | 2 | |
| 20 and above | High risk | 3 | |
| Elevation (m) | 0–75 | Low risk | 1 |
| 75-150 | Medium risk | 2 | |
| 150–321 | High risk | 3 | |
| Aspect | East–West | Low risk | 1 |
| South, Southeast, Southwest | Medium risk | 2 | |
| North, Northeast, Northwest | High risk | 3 | |
| Soil Capability | Vertisols | Low risk | 1 |
| Brown forest soils | Low risk | 1 | |
| Non-calcareous brown forest soils | Medium risk | 2 | |
| Non-calcareous brown soils | High risk | 3 | |
| Alluvial soils | High risk | 3 | |
| Settlement areas | High risk | 3 | |
| Land Use | Pastureland | Low risk | 1 |
| Dry farming / rainfed agriculture | Medium risk | 2 | |
| Settlement areas | High risk | 3 | |
| Distance to Fault Lines (m) | 29,000–31,000 | Low risk | 1 |
| 27,000–29,000 | Medium risk | 2 | |
| 25,000–27,000 | High risk | 3 | |
| Distance to Hydrological Features (m) | 170 | Low risk | 1 |
| 130 | Low risk | 1 | |
| 90 | Medium risk | 2 | |
| 50 | High risk | 3 | |
| 10 | High risk | 3 | |
| Precipitation Amount (mm) | 897.8–925 | Low risk | 1 |
| 925–975 | Medium risk | 2 | |
| 975–1,027 | High risk | 3 |
Table 5.
Weight Values of Parameters.
| Parameter | Weight Value (%) |
|---|---|
| Distance to Fault Lines (m) | 17,22 |
| Precipitation Amount (mm) | 17,22 |
| Distance to Hydrological Features (m) | 13,89 |
| Soil Capability | 13,89 |
| Slope | 13,33 |
| Land Use | 12,78 |
| Elevation (m) | 7,78 |
| Aspect | 3,89 |
Disclaimer/Publisher’s Note: The statements, opinions and data contained in all publications are solely those of the individual author(s) and contributor(s) and not of MDPI and/or the editor(s). MDPI and/or the editor(s) disclaim responsibility for any injury to people or property resulting from any ideas, methods, instructions or products referred to in the content. |
© 2026 by the authors. Licensee MDPI, Basel, Switzerland. This article is an open access article distributed under the terms and conditions of the Creative Commons Attribution (CC BY) license (http://creativecommons.org/licenses/by/4.0/).
Copyright: This open access article is published under a Creative Commons CC BY 4.0 license, which permit the free download, distribution, and reuse, provided that the author and preprint are cited in any reuse.


