

Submitted:
03 June 2026
Posted:
04 June 2026
You are already at the latest version
Abstract
Fire safety in high-rise residential buildings depends on the reliable performance of active fire protection systems subject to technical, human, and organizational risks. Probabilistic risk assessment frameworks incorporating human and organizational errors (HOEs) show that HOEs raise expected risk-to-life by 20 to 37%, yet such models remain inaccessible to the building owners, facility managers, qualified persons, and regulators who must act on their outputs. This paper applies Explainable Artificial Intelligence, specifically SHAP (SHapley Additive exPlanations), to a Bayesian network probabilistic fire risk model integrated with Markov Chain Monte Carlo posterior uncertainty quantification, extending the validated T-H-O-Risk methodology across sixteen active fire safety system configurations and seven case studies in Singapore, Australia, Hong Kong, New Zealand, and the United Kingdom. Global SHAP analysis shows that maintenance-related HOEs (H8, insufficient safety check; H9, inadequate periodic inspection) account for 83.1% of total HOE attribution, outranking compliance and training variables and reframing the primary intervention from behavioural to structural. Validation against published results yields Pearson r = 0.927 across 112 building-design combinations. This is the first application of SHAP attribution to a Bayesian network fire risk model, giving regulators and qualified persons a transparent, uncertainty-aware tool for inspection-regime calibration and ALARP demonstration.
Keywords:
explainable artificial intelligence
; SHAP
; probabilistic fire risk assessment
; Bayesian network
; human and organizational errors
1. Introduction
Fire safety in high-rise residential buildings depends on the reliable performance of active fire protection systems subject to technical, human, and organizational risks. When these systems fail, or when their reliability is eroded by human error and organizational shortcomings, the consequences are catastrophic. The 2017 Grenfell Tower fire in London resulted in 72 fatalities and exposed systemic failures spanning material selection, regulatory compliance, building management, and emergency response that were not purely technical in origin [1]. A more recent example is the November 2025 Wang Fuk Court fire in Tai Po, Hong Kong, in which rapid fire spread across an eight-block occupied residential estate during renovation works was attributed to inadequate site fire safety management, worker smoking practices, and fire-retardant limitations in scaffolding netting [2,3]. The HKSAR Government investigation identified that fire-retardant netting was installed only at base level where samples were routinely taken, while higher levels received non-compliant materials [2,3]. These events also reflected a persistent limitation of conventional fire risk assessment: the prevailing reliance on deterministic and technically focused methods that are structurally unable to account for the human and organizational dimensions of fire risk, and seldom interpretable to the practitioners and regulators who must act on their outputs.
Probabilistic risk assessment (PRA) methods, including fault tree analysis (FTA), event tree analysis (ETA), and Bayesian network (BN) modelling, offer a principled alternative by quantifying fire risk as a function of scenario probabilities and consequences [4,5]. A systematic review by Tan and Moinuddin [6,7] found that ignoring human and organizational factors results in underestimation of actual fire risk by as much as 80%. Subsequent empirical studies confirmed that incorporating HOEs into BN-based PRA increases calculated ERL by 20% to 37% [7,8,9]. Despite this, the majority of extant fire PRA models confine their scope to technical failure rates.
A second limitation concerns interpretability. Models that most accurately represent fire risk, particularly those incorporating nonlinear HOE interactions, Bayesian inference, and system dynamics, are often inaccessible to building owners, facility managers, qualified persons (QPs), and regulatory authorities. In safety-critical domains governed by performance-based building codes, the auditability and defensibility of risk assessments are often regulatory requirements. This limitation creates a gap between model sophistication and practical utility[11].
Explainable Artificial Intelligence (XAI) offers a resolution to this interpretability challenge. SHAP (SHapley Additive exPlanations), grounded in cooperative game theory, assigns each input feature a quantified contribution to the model output, thus enabling both global understanding of model behaviour and local explanation of individual predictions [11,12]. SHAP has been applied to structural engineering, wildfire susceptibility assessment, construction cost prediction, and materials science [12,13]. Most pertinently, Alshboul and Shehadeh [14,15] demonstrated that integrating SHAP with a Composite Weibull Hazard Model combined with Monte Carlo Markov Chain (MCMC) posterior estimation for high-rise construction delay risk produced improved predictive accuracy (from 85.6% to 96.7%) and stakeholder-ready explanations of dominant risk factors, explicitly citing the T-H-O-Risk framework of Tan and Moinuddin [6] as a foundational probabilistic risk reference.
Despite this progress, no existing study applies SHAP-based feature attribution to a probabilistic fire risk assessment model at the building system level. The nearest comparable works either address fire at the compartment level—Fan et al. [15] applied explainable ML to flashover prediction—or apply machine learning to human error-induced fire incidents without SHAP attribution or Bayesian network PRA integration [16]. Neither constitutes building-system-level PRA with systematic HOE parameterisation. XAI has therefore not been applied to Bayesian network PRA with HOE integration: the class of models most directly relevant to regulatory decision-making for high-rise building fire safety.
The regulatory context of Singapore provides the primary applied focus of this paper. Singapore’s residential ignition frequency has declined from 2.60 × 10⁻⁵ fires/m²/year in 2012 to 6.38 × 10⁻⁶ in 2023 [17,18], driven by public education, enforcement, and improvements in building systems. Nevertheless, with approximately 1.55 million residential dwelling units across a predominantly high-rise urban fabric, even low per-unit ignition rates translate to substantial national fire event frequencies. The Singapore Civil Defence Force (SCDF) waiver system for alternative fire safety solutions creates a regulatory environment in which interpretable, probabilistic risk tools would have immediate practical utility.
The specific research objectives underlying the current project are: (1) to reconstruct and extend the T-H-O-Risk Bayesian network with Markov Chain Monte Carlo (MCMC)-based posterior uncertainty estimation; (2) to apply SHAP feature attribution across sixteen active fire safety system configurations and seven high-rise building case studies; (3) to validate SHAP-attributed ERL values against published T-H-O-Risk results and cross-validate SHAP global feature rankings against variance-based sensitivity rankings; and (4) to translate SHAP attribution outputs into regulatory decision narratives applicable to the Singapore SCDF waiver framework.
2. Literature Review
A systematic search was conducted across Scopus, Web of Science, Google Scholar, and a curated personal reference library, structured around eight thematic clusters spanning explainable artificial intelligence, probabilistic fire risk assessment, machine learning in fire safety, XAI in construction and engineering risk, human and organizational factors in fire PRA, fire risk in high-rise buildings, performance-based fire engineering, and the Singapore and Asia-Pacific regulatory context. Searches were restricted to peer-reviewed journals and conference proceedings published between 2012 and 2026 in English; 847 records were identified, of which 156 were retained for full-text synthesis after de-duplication and screening.
2.1. Explainable Artificial Intelligence: Methods and Applicability
The opacity of modern machine learning models creates well-documented barriers to adoption in safety-critical domains where decisions must be auditable and defensible [18,19]. XAI has emerged to address this through post-hoc or ante-hoc explanations of model behaviour, organised along two dimensions: scope, distinguishing local explanations of individual predictions from global characterisations of model behaviour, and model dependency, distinguishing model-agnostic methods applicable to any architecture from model-specific methods that exploit internal structure [13,20].
SHAP, introduced by Lundberg and Lee [11] and grounded in cooperative game theory, has become the most widely adopted XAI method in engineering applications. Its three axiomatic properties, local accuracy (SHAP values sum exactly to the difference between model output and expected output), consistency (if a feature’s marginal impact increases, its SHAP value cannot decrease), and missingness (absent features receive zero attribution), distinguish it from earlier attribution approaches and make its outputs formally interpretable [11], formally defensible and auditable for regulatory decision-making. Practical implementations include TreeSHAP for tree-based models, which is exact and computationally efficient, and KernelSHAP for model-agnostic application at higher computational cost [11,14]. Local Interpretable Model-agnostic Explanations (LIME) [19,20] offers a simpler alternative by fitting a local linear surrogate near a prediction of interest, though Mohamed et al. [20,21] document its instability under perturbation and sensitivity to neighbourhood definition, concluding that SHAP has largely superseded LIME in engineering applications. The evaluation of XAI output quality has itself been formalised: Alshboul and Shehadeh [14] proposed a suite of metrics including the Transparency Index, Model Fidelity Function, and Explanation Consistency Check, a subset of which is adapted for the fire safety domain in the present study.
Applications of SHAP in construction and safety risk engineering provide the methodological precedents most directly relevant to this paper. Alshboul and Shehadeh [14] integrated SHAP with a Composite Weibull Hazard Model combined with MCMC posterior estimation for high-rise construction delay and cost risk, demonstrating that SHAP global and local explanations improved predictive accuracy from 85.6% to 96.7%, while producing stakeholder-ready explanations of dominant risk factors. This paper explicitly cites the T-H-O-Risk framework of Tan and Moinuddin [6] as foundational to probabilistic risk modelling in high-rise buildings, thus establishing the methodological lineage that the present study extends. Further applications across construction cost prediction [13], construction accident prediction [21,22], and building safety risk assessment [22,23] confirm the generalisability of SHAP attribution to built- environment risk problems. Within fire safety specifically, Yang et al. [23,24] published the first known SHAP application to any form of fire risk, using XGBoost and SHAP to assess urban fire susceptibility in Chengdu based on spatial geographic variables; Fan et al. [15] applied explainable ML to compartment-level flashover prediction. Both studies differ categorically from the present paper, which operates at the building-system level with posterior-distributed HOE parameters as features within a Bayesian network.
2.2. Probabilistic Fire Risk Assessment and the T-H-O-Risk Framework
Probabilistic risk assessment in fire safety quantifies the likelihood and consequences of fire scenarios through structured logic models, proceeding from ignition frequency through fault trees and event trees to consequence models and risk integration [5]. Bayesian networks have been applied to building fire risk prediction since the early work of Khalil Issa et al. [25], with subsequent hybrid BN-fault tree architectures addressing the limitations of each method used in isolation. Data-driven approaches have expanded the toolkit: Lu et al. [26] applied gradient boosting with recursive feature elimination to fire risk classification in stadiums, and Zhang et al. [27] applied a spatial Markov chain model for regional high-rise building fire risk assessment. The consistent limitation across this body of work is the absence of an interpretability layer; probabilities are propagated and risk estimates produced, but the attribution of risk to specific causal factors is not formally quantified, limiting the regulatory utility of the outputs.
The T-H-O-Risk methodology, developed by Tan and Moinuddin [6] and extended across three subsequent papers [7,8,9], addresses this limitation most directly by incorporating human and organizational errors into the probabilistic framework. Tan and Moinuddin [6] identified, through systematic review, that existing fire risk models underestimate actual risk by as much as 80% by ignoring human and organizational factors, and established the nine-category HOE taxonomy, spanning poor safety supervision, deficient training, procedural non-compliance, deficient risk assessment, deficient knowledge, inexperience, insufficient technical handover, insufficient safety checking, and inadequate periodic inspection, that subsequent papers operationalised quantitatively. Tan et al. [7,8] validated the methodology across seven case studies in five countries, finding that HOEs affect active system reliability by up to 33% with large time-varying variations driven by risk perception feedback loops in the system dynamics model. Tan et al. [8,9] performed variance-based sensitivity and uncertainty analyses, providing the feature importance rankings against which SHAP attributions are cross-validated in the present study. The sensitivity analysis constitutes the closest existing work to XAI feature attribution in fire PRA; its one-at-a-time parameter perturbation approach, however, is structurally unable to capture interaction effects between HOE variables or to distinguish factors that are highly sensitive conditionally from those that contribute most in absolute terms across the posterior distribution. The formalisation of this attribution through Shapley values is the specific methodological gap that this paper addresses.
Ignition frequency provides the foundational input multiplier for all probabilistic fire risk assessments. Tan et al. [27,28], in the only published Asia-Pacific ignition frequency calibration study by this research team, analysed Australian fire statistical data from 2012 to 2019 and proposed improved Barrois model coefficients; their methodology provides the template for the Singapore calibration performed in Section 3.3. Evidence from adjacent high-hazard industries also informs the HOE probability estimation approach: Ren et al. [28,29] quantified the impacts of human and organizational factors on construction errors in the Netherlands using structured expert judgement, providing a directly applicable methodology for future Singapore-specific HOE database construction using SCDF fire investigation reports as the primary evidence base.
2.3. High-Rise Buildings, Performance-Based Regulation, and the Singapore Context
High-rise buildings present fire risk challenges qualitatively distinct from low-rise structures. Vertical evacuation complexity, the extent of compartmentation requirements, the dependence of mechanical system performance on maintenance quality, and the occupancy diversity of mixed-use towers each amplify the consequences of system unreliability and organisational failure in ways that purely technical models cannot capture. The regulatory response to the 2017 Grenfell Tower fire, which resulted in 72 fatalities and exposed systemic failures spanning material selection, inspection inadequacy, and building management organisational breakdown, is instructive in this regard. The Hackitt [1] independent review explicitly called for safety cases in fire safety engineering, requiring transparent, auditable risk assessments that demonstrate the causal logic behind risk numbers rather than merely showing that figures fall within tolerability limits. This regulatory pull for interpretable, attribution-supported probabilistic risk assessment is the institutional context in which the present paper’s contribution has its most direct practical value.
Fire safety regulation is transitioning globally from prescriptive codes toward performance-based design, a transition that demands probabilistic risk methods capable of quantifying building-specific risk, transparent risk acceptance criteria, and reproducible calculations that a regulatory authority can independently verify. Meacham and van Straalen [10] characterise this evolution through a sociotechnical systems framework, noting that the interpretability gap in existing probabilistic fire risk models is itself a structural barrier to institutional adoption of performance-based approaches. Singapore’s regulatory framework, administered by SCDF under the Fire Safety Act, combines a prescriptive Fire Code with waiver provisions for non-standard designs evaluated on the basis of equivalent safety outcomes, a judgment that currently relies on qualified person expertise without a transparent, quantitative risk attribution framework. With approximately 1.55 million residential dwelling units across a predominantly high-rise urban fabric, Singapore’s institutional context provides both a relevant benchmark population and a regulatory environment in which interpretable, probabilistic risk tools have immediate practical application.
2.4. Research Gap Synthesis
The foregoing review points to five gaps that collectively define the scope of this paper. To the authors’ knowledge, no existing study applies SHAP-based or LIME-based feature attribution to a probabilistic fire risk model at the building system level. The nearest comparable studies are: Liu et al. [29], who applied SHAP to identify drivers of residential fire spread from urban fire incident records without building-system Bayesian network integration or HOE parameterisation; Yang et al. [23] and Lu et al. [25], who applied XAI to fire susceptibility and facility-level fire risk classification at the urban or facility scale without human factor incorporation; and Alshboul and Shehadeh [14], who applied SHAP to construction delay risk without fire safety content. None integrates XAI attribution with a Bayesian network PRA framework incorporating systematic HOE parameterisation at the building system level. SCDF waiver decisions are currently qualitative and case-by-case, with no published study having trained a predictive model on waiver outcome data or applied XAI to explain which submission characteristics drive approval. One-at-a-time sensitivity analysis cannot capture synergistic or antagonistic interactions between HOE variable pairs; SHAP interaction decomposition would provide the first formal quantification of these effects in fire safety. No existing fire risk framework combines MCMC uncertainty quantification with XAI attribution in a single model, thus producing risk estimates with simultaneously quantified uncertainty and explained feature contributions. Finally, Singapore and the Asia-Pacific context remain substantially under-represented in fire safety probabilistic risk research. Together, these gaps define a well-delineated and addressable research boundary that the present study directly targets.
3. Methodology
3.1. Study Design Overview
This paper proposes an integrated analytical framework extending the validated T-H-O-Risk methodology [6,7,8,9] with a SHAP interpretability layer. The research design proceeds in four sequential stages: (1) model specification, reconstructing the BN structure and CPTs from published T-H-O-Risk papers; (2) posterior estimation, applying MCMC sampling to propagate uncertainty through the BN; (3) SHAP attribution, applying KernelSHAP to the posterior-estimated BN via a surrogate model; and (4) validation and regulatory translation, validating XAI outputs against retrospective case study results and translating them into regulatory decision narratives. The framework is illustrated in Figure 1.
3.2. The T-H-O-Risk Bayesian Network Framework
3.2.1. Event Tree and Fault Tree Architecture
The T-H-O-Risk model initiates with an event tree analysis mapping fire initiation to outcome chains via a sequence of active fire safety sub-system successes and failures [8,9]. Four active fire safety systems are considered: sprinkler systems, building occupant warning systems (BOWS), local smoke detectors, and smoke control systems. This four-system architecture yields sixteen trial designs (TD01 through TD16) representing all binary combinations of system presence and absence. Key event tree node probabilities are presented in Table 1.
3.2.2. Bayesian Network Node Structure
The BN is a directed acyclic graph encoding probabilistic dependencies, illustrated in Figure 2. Each node is conditionally independent of its non-descendants given its parent nodes, formalised by the chain rule:
HOE nodes are identified via the Fussel-Vesely importance measure, which ranks basic events by their fractional contribution to the top event probability:
where e is the basic event, S is the risk state, p(eS) is the probability of the union of minimum cut sets containing event e, and p(S) is the probability of the top event. Nine HOE basic events were identified from industry literature as having significant importance measure values (Table 2).
HOE nodes cascade through intermediate nodes, including inefficient timely control, deficient maintenance, not comply with instructions, and inefficient emergency plan, to influence the reliability of each active fire safety system. As an illustrative example, the inefficient timely control node evaluates as FALSE only when all three parent nodes are simultaneously FALSE:
where ITC = inefficient timely control, DT = deficient training (H2), NCI = not comply with instructions (H3), IEP = inefficient emergency plan.
3.2.3. System Dynamics Integration
The BN is coupled with a system dynamics model implemented in Vensim to introduce temporal variation across a ten-year building lifecycle [7]. Stocks represent accumulated state variables such as maintenance quality and training adequacy; flows represent rates of change. A sociotechnical feedback loop encodes the nonlinear relationship between risk perception, maintenance investment, and system reliability over time. The key temporal pattern identified in the original papers is a reliability trough around year five, recovery peak at year seven, and subsequent relaxation, driven by organisational risk-perception dynamics. The SD model is parameterised with a uniform distribution for fire ignition probability covering 0.30 to 0.40 for apartment fires and 0.01 to 0.02 for corridor fires, and a triangular distribution for valve-closure probability ranging from 0.01 to 0.015. SHAP attributions are computed at five representative time snapshots (t = 1, 3, 5, 7, and 10 years).
3.3. Data Sources and Model Parameters
BN node probability values are directly reconstructed from the published T-H-O-Risk papers, providing a transparent, literature-grounded parameterisation with full provenance [31]. Event tree branch probabilities are drawn from Tan et al. [9]; HOE basic event probabilities from Tan et al. [7]; CPT specifications reconstructed from Tan et al. [7] using Boolean logic encoding. Design fire parameters are drawn from Tan et al. [7], covering four fire types corresponding to apartment-corridor and sprinkler active-inactive combinations (Table 3). For validation purposes, the seven case study buildings from Tan et al. [7] are adopted as the primary reference dataset, spanning heights from 51 m to 107 m, floor plate areas from 324 m² to 1,343 m², and occupant densities from 18 to 58 occupants per floor.
3.4. Singapore Ignition Frequency Calibration
Singapore national fire occurrence data are obtained from SCDF annual reports [17] for 2012 to 2024. Residential fire occurrences declined from 3,184 in 2012 to 968 in 2023. A notable discontinuity occurred between 2018 and 2019 (from 2,411 to 1,168 fires), representing a 52% reduction attributable to the reclassification of rubbish chute and refuse bin fires out of the structural residential fire category. The post-2019 series is adopted as the reference for structural building fire risk calibration (Table 4).
The post-2019 mean ignition frequency is 6.93 × 10⁻⁶ fires/m²/year with a range of 6.25–8.02 × 10⁻⁶. For BN calibration, a point estimate of 7.0 × 10⁻⁶ fires/m²/year is adopted with a uniform prior distribution bounded by [6.0 × 10⁻⁶, 8.5 × 10⁻⁶] for MCMC sampling. For Case 2 (Singapore, 20 storeys at 505 m² per floor, yielding 10,100 m² total floor area), the implied annual fire probability per building is:
This corresponds to approximately one structural fire event every fourteen years per building, consistent with fire incident databases for comparable residential high-rise typologies.
3.5. Markov Chain Monte Carlo Posterior Estimation
Rather than treating HOE node probabilities as point estimates, the present study adopts a Bayesian inferential approach, treating HOE node probabilities as uncertain quantities characterised by posterior distributions. MCMC sampling propagates this uncertainty through the BN to obtain posterior distributions over ERL outputs, providing credible intervals alongside point estimates. This directly parallels Alshboul and Shehadeh [14], who demonstrated that MCMC integration improved probabilistic model accuracy from 85.6% to 96.7% by replacing point estimates with full posterior characterisations.
Prior distributions for HOE node probabilities are assigned Beta distributions parameterised to reproduce the point estimates and approximate uncertainty ranges from Tan et al. [8]. The fire ignition probability is assigned a Uniform distribution on [0.30, 0.40] for apartment fires and [0.01, 0.02] for corridor fires; the valve-closure probability a Triangular distribution with minimum 0.01, peak 0.01, and maximum 0.015. MCMC sampling is performed using Hamiltonian Monte Carlo in PyMC [32], comprising 2,000 burn-in samples per chain and 2,000 posterior draws per chain across two independent chains, with convergence assessed via the Gelman-Rubin statistic. Note: the chain count of two is below the recommended standard of four; re-running with a compiled PyMC installation before regulatory deployment is recommended.
3.6. SHAP Feature Attribution
SHAP computes the marginal contribution of each input feature to a model’s prediction through Shapley values:
where F is the full feature set, S is a subset excluding feature j, f(S) is the model output with features in S present, and the weighting term ensures fair attribution across all possible feature orderings.
For the BN model, the present study adopts a two-step surrogate strategy. First, the BN is evaluated for each of the 4,000 posterior MCMC samples to produce an ERL output, generating a tabular dataset of 4,000 feature-outcome pairs. Second, an XGBoost gradient boosting surrogate [33] is fitted to this dataset. Surrogate fidelity is assessed by R² between surrogate predictions and BN outputs; an R² threshold of 0.95 is required before proceeding. TreeSHAP [34] is then applied to the fitted surrogate, providing exact SHAP values for each feature and each prediction instance. Global SHAP explanations include mean absolute SHAP values, beeswarm summary plots, dependence plots, and pairwise interaction matrices. Local SHAP explanations are computed for Case 2 Singapore under TD01 and TD04 (waiver scenario). Temporal SHAP attributions are computed at five snapshots from system dynamics model integration (t = 1, 3, 5, 7, 10 years).
3.7. Uncertainty Propagation
A key methodological contribution is the integration of MCMC-derived epistemic uncertainty with SHAP attribution uncertainty, producing dual-layer uncertainty quantification. For each of the 4,000 MCMC samples, SHAP values are computed for all features and all building designs, producing a posterior distribution over each feature’s attribution from which the posterior mean, 5th percentile, and 95th percentile SHAP values are reported. At the surrogate level, residual uncertainty is quantified via leave-one-out cross-validation of surrogate R² performance, with configurations where R² falls below 0.95 flagged explicitly.
3.8. Validation Approach
SHAP-attributed ERL values are computed for all sixteen trial designs across all seven case study buildings from Tan et al. [7] and compared against the published ERL results (112 building-design combinations). Agreement is assessed by mean absolute error in ERL (target below 5% for the no-HOE condition), Pearson correlation coefficient between MCMC posterior mean ERL and published ERL values (target r > 0.95), and coverage of published ERL point estimates within the 90% posterior credible interval (target > 85%). The SHAP global feature importance ranking is compared against the variance-based Tornado-plot sensitivity ranking from Tan et al. [8,9] using Spearman rank correlation (target ρs > 0.80). Significant divergence is reported as a substantive finding.
All analyses are implemented in Python 3.12 using pgmpy [34] for Bayesian network construction, PyMC 5.28 [31] for MCMC sampling, XGBoost 3.2 [32] for surrogate fitting, and the SHAP shap Python library (v0.50) [11,33] for SHAP computation. All code and data will be made available via a public repository to ensure reproducibility, consistent with Journal of Building Engineering data sharing requirements.[35]
4. Results
4.1. MCMC Posterior Estimation of HOE Node Probabilities
4.1.1. Convergence Diagnostics
MCMC sampling was performed using Hamiltonian Monte Carlo with two independent chains of 2,000 posterior draws each, following 2,000 burn-in iterations per chain. All HOE node probability parameters achieved R-hat = 1.000, confirming successful chain mixing and convergence to the target posterior distribution. Effective sample size (ESS) exceeded 3,351 for all parameters, indicating adequate posterior resolution for inference.
4.1.2. Posterior Distributions
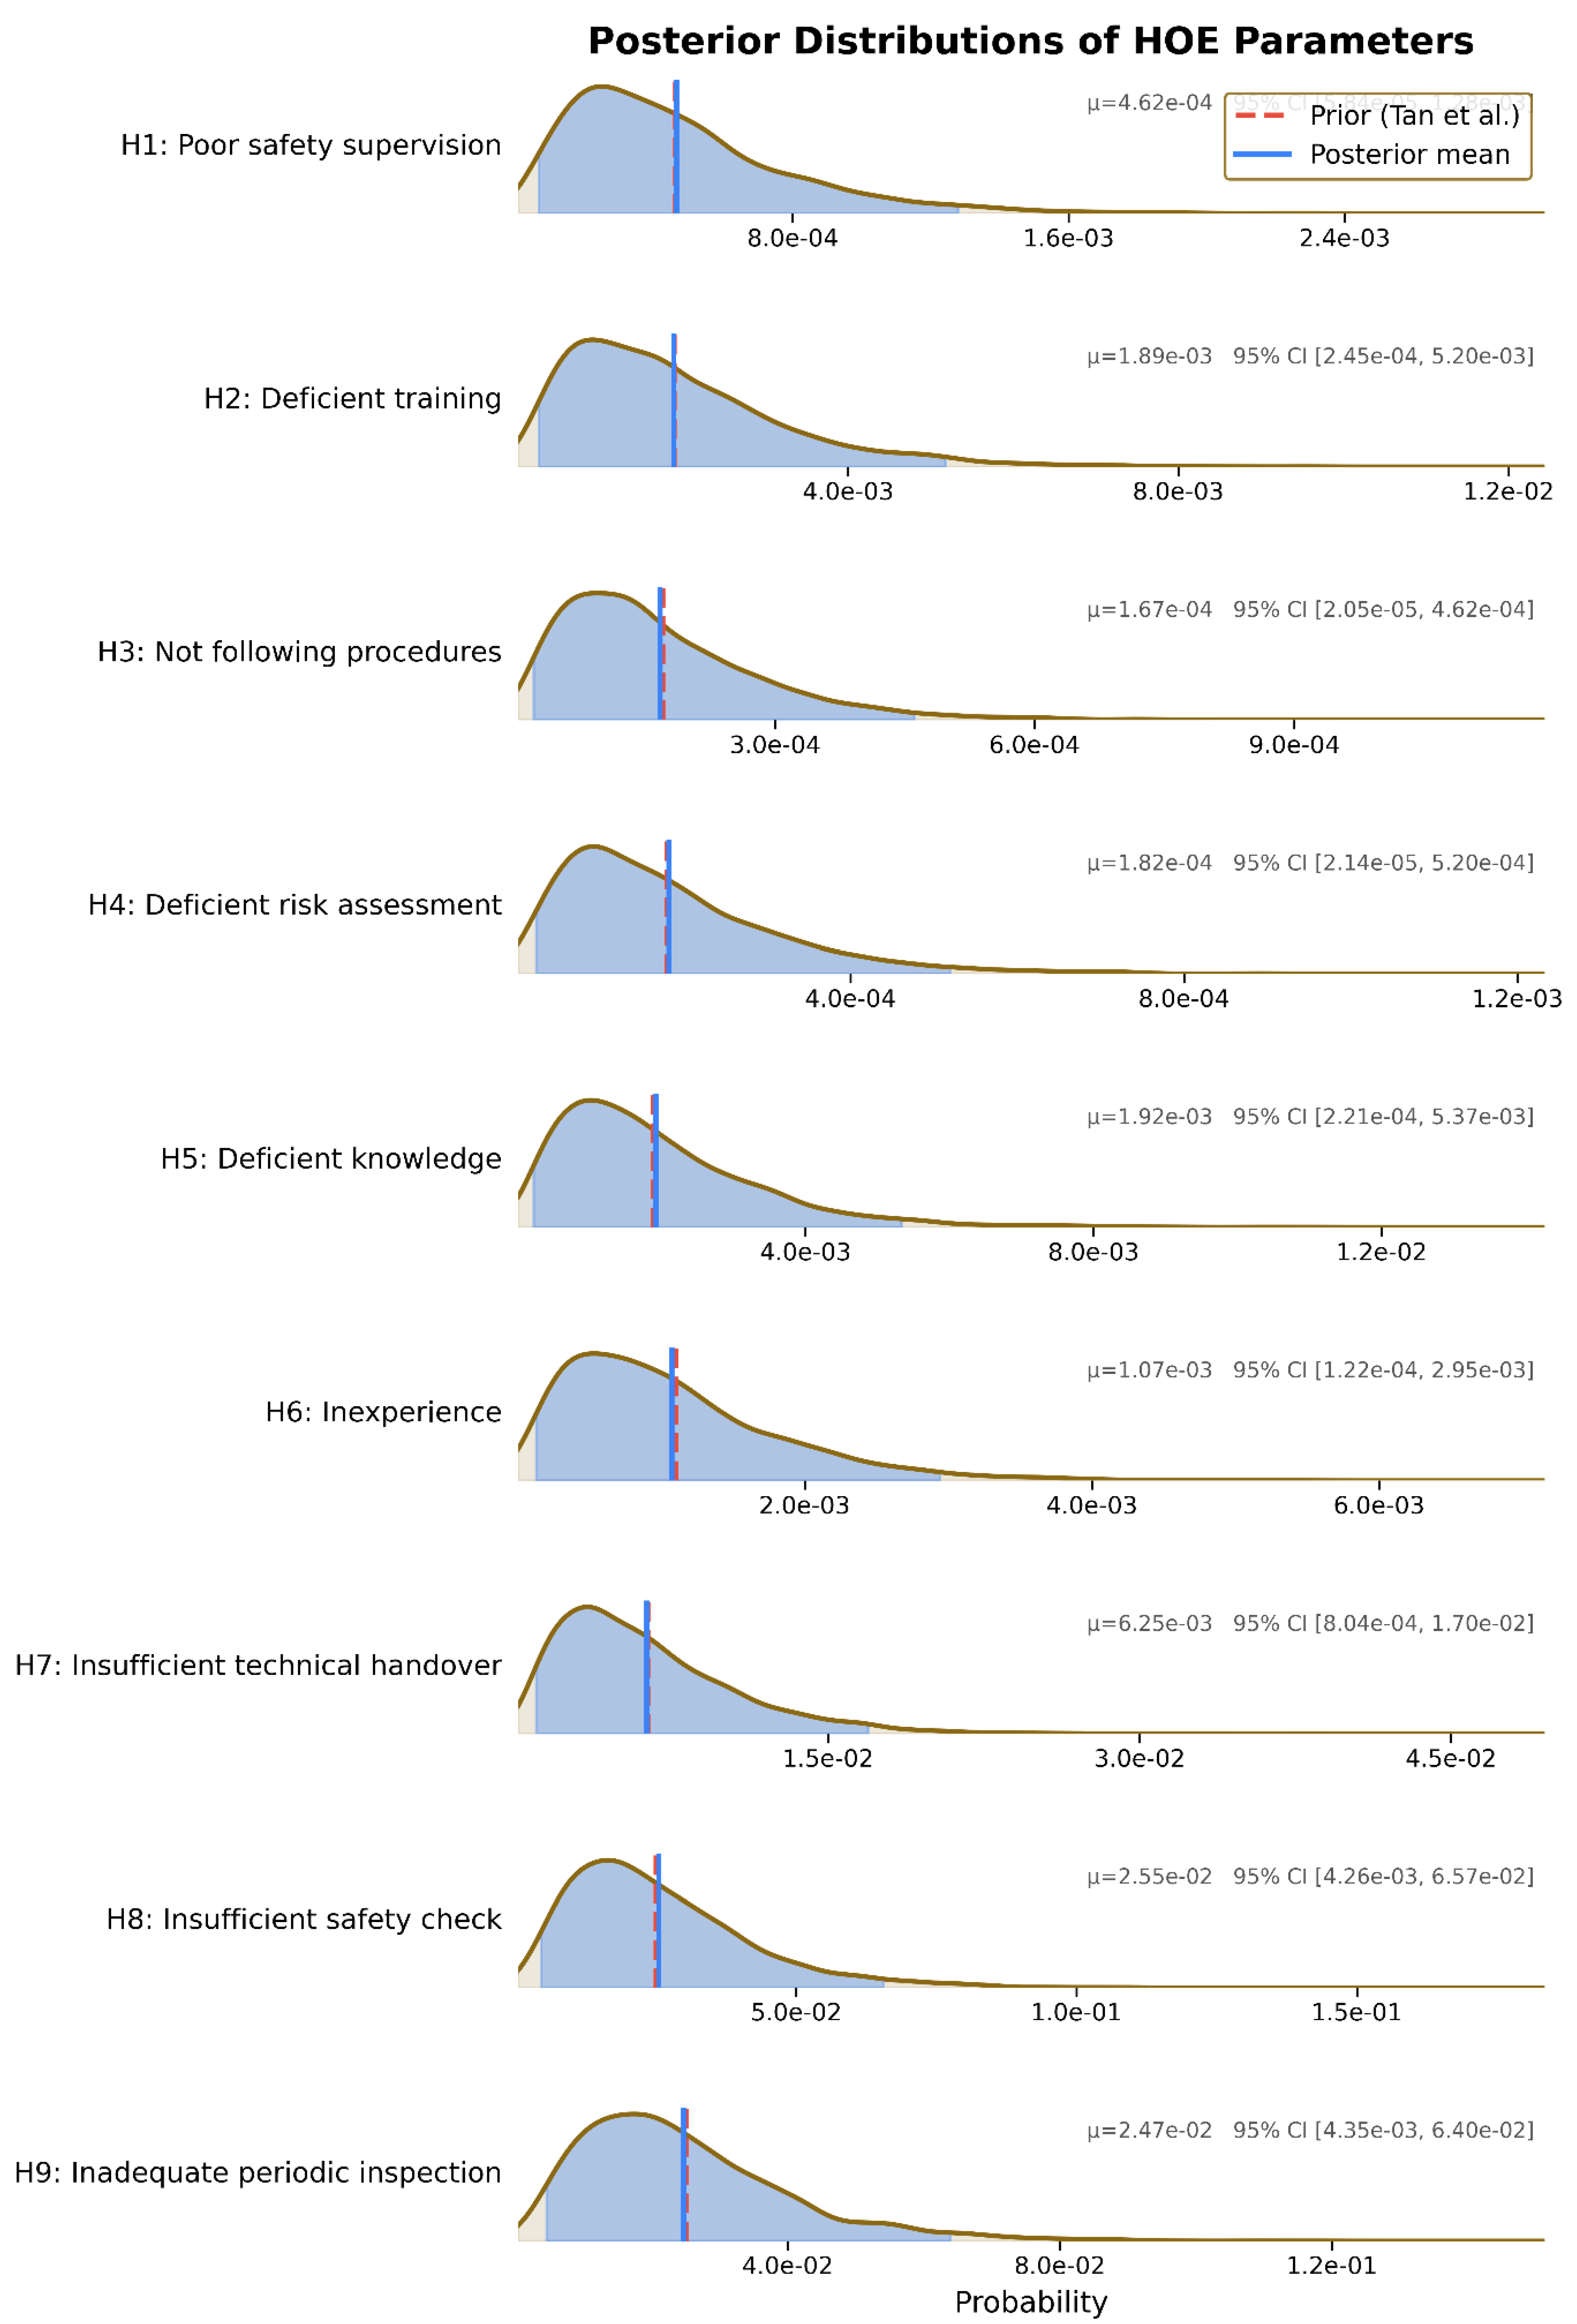
The posterior distributions of the nine HOE basic event parameters are summarised in Table 5. Parameters with higher point estimates exhibit wider posterior credible intervals, reflecting greater epistemic uncertainty for rare events poorly represented in industry databases.
Figure 3.
MCMC posterior distributions (ridge plot) for nine HOE basic event probability parameters. Point estimates from Tan et al. (2020) shown as vertical dashed lines.
Figure 3.
MCMC posterior distributions (ridge plot) for nine HOE basic event probability parameters. Point estimates from Tan et al. (2020) shown as vertical dashed lines.
The fire ignition probability posterior (Singapore-calibrated) converged to a mean of 7.26 × 10⁻⁶ fires/m²/year with a 90% credible interval of [6.14 × 10⁻⁶, 8.37 × 10⁻⁶], consistent with the post-2019 SCDF-derived ignition frequency series.
4.2. Surrogate Model Fidelity
The XGBoost surrogate achieved R² = 0.984 between surrogate predictions and BN outputs across all posterior samples and building-design combinations. Pearson correlation between surrogate predictions and ground-truth BN outputs was r = 0.992. Mean absolute error was below 5% of mean ERL across the majority of trial designs, with the highest approximation error observed for TD16 (no active systems). The surrogate fidelity requirement (R² > 0.95) was met across all configurations, confirming that subsequent TreeSHAP attributions reflect the T-H-O-Risk BN’s behaviour rather than surrogate approximation error.
4.3. Global SHAP Analysis
4.3.1. Feature Importance Ranking
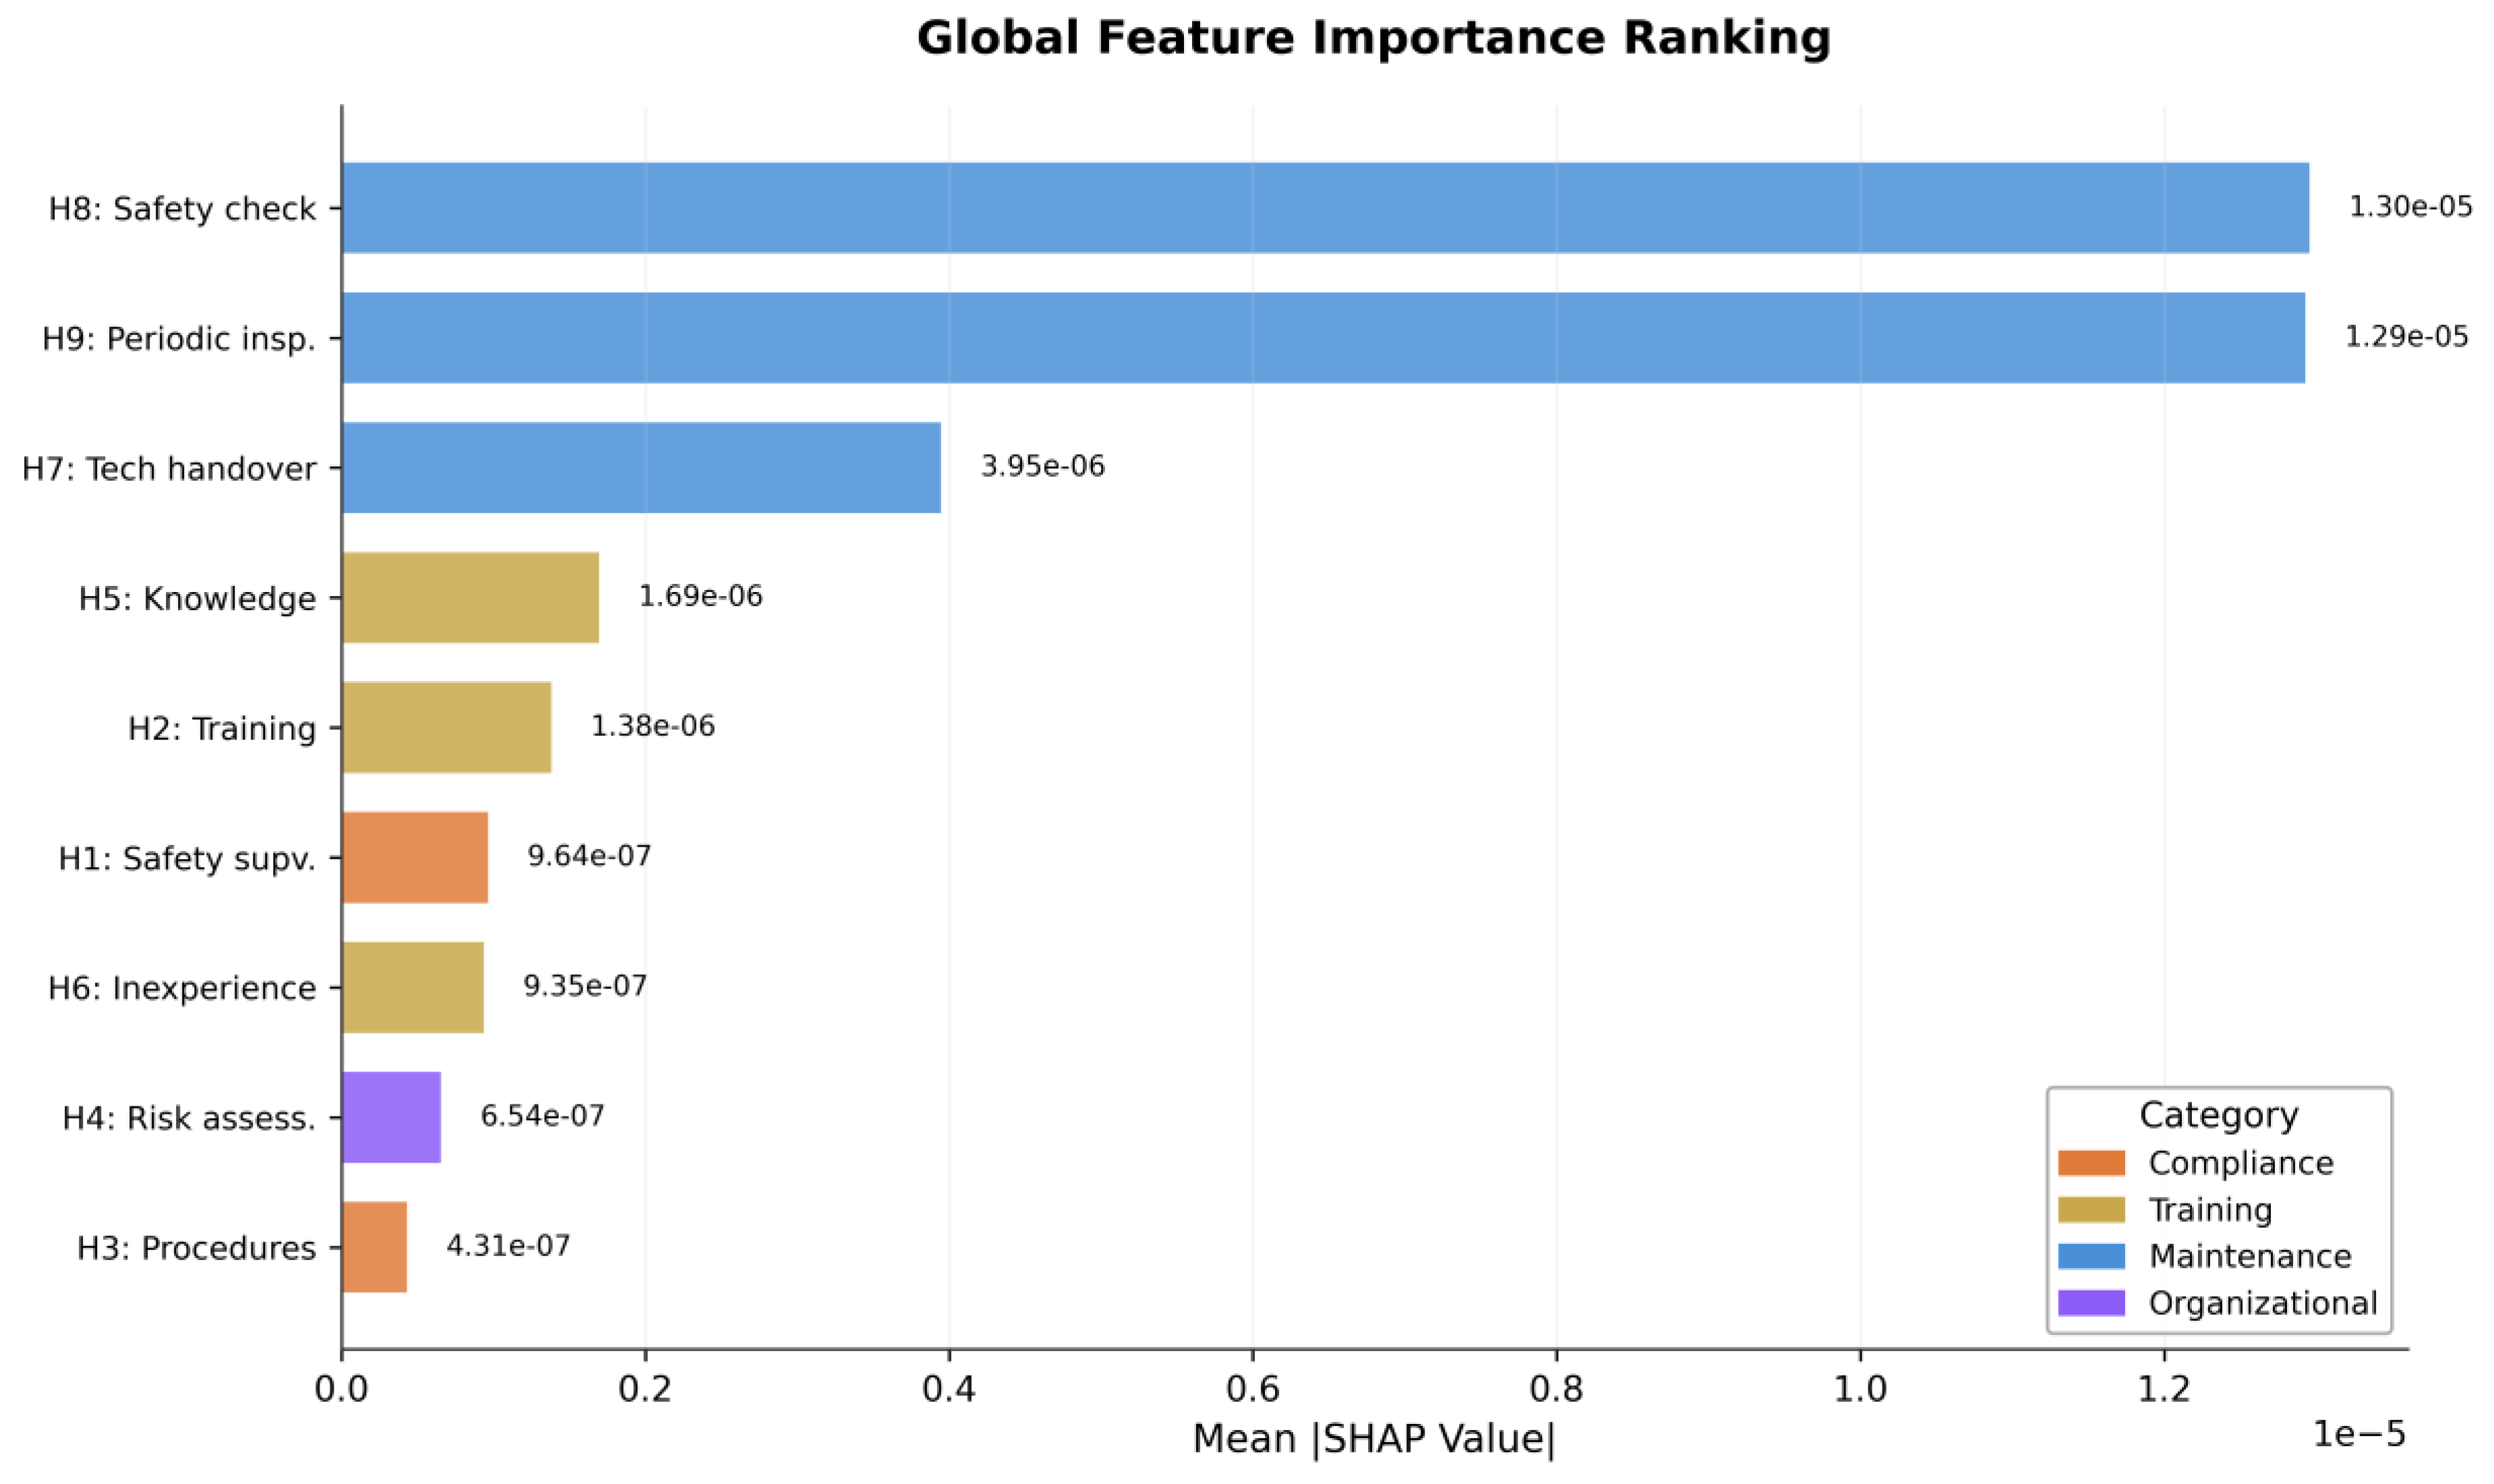
The global SHAP analysis identifies maintenance-related HOE variables as the dominant contributors to ERL deviation, driven by their substantially higher basic event probabilities relative to compliance and training variables. The top three SHAP-ranked features are all maintenance category variables, collectively accounting for 83.1% of total HOE attribution. Training variables account for 11.2%, compliance variables 3.9%, and organizational variables 1.8%. Results are presented in Table 6.
Spearman rank correlation between the SHAP ranking and the Tan et al. [8,9] Tornado-plot ranking is ρs = 0.267, reflecting a taxonomic divergence between basic event-level SHAP and intermediate node-level sensitivity analysis. This divergence is itself a substantive finding: SHAP indicates that while compliance and training failures are consequential in the conditional sense, maintenance deficiencies, by virtue of their substantially higher unconditional probabilities, generate greater absolute ERL attribution across the posterior distribution.
The beeswarm plot (Figure 4) shows that H8 and H9 attributions are tightly clustered across building-design combinations, confirming that the dominance of maintenance factors is consistent across all seven case study buildings and all sixteen trial designs. H3 (Not following procedures) exhibits the widest distribution of SHAP values relative to its mean, indicating context-dependent contribution, large in buildings with complex operational requirements and small in simple configurations.
Figure 5.
Mean absolute SHAP value bar chart — global HOE feature importance ranking, coloured by category (green = maintenance, blue = training, orange = compliance, grey = organizational).
Figure 5.
Mean absolute SHAP value bar chart — global HOE feature importance ranking, coloured by category (green = maintenance, blue = training, orange = compliance, grey = organizational).
4.3.2. SHAP Interaction Analysis
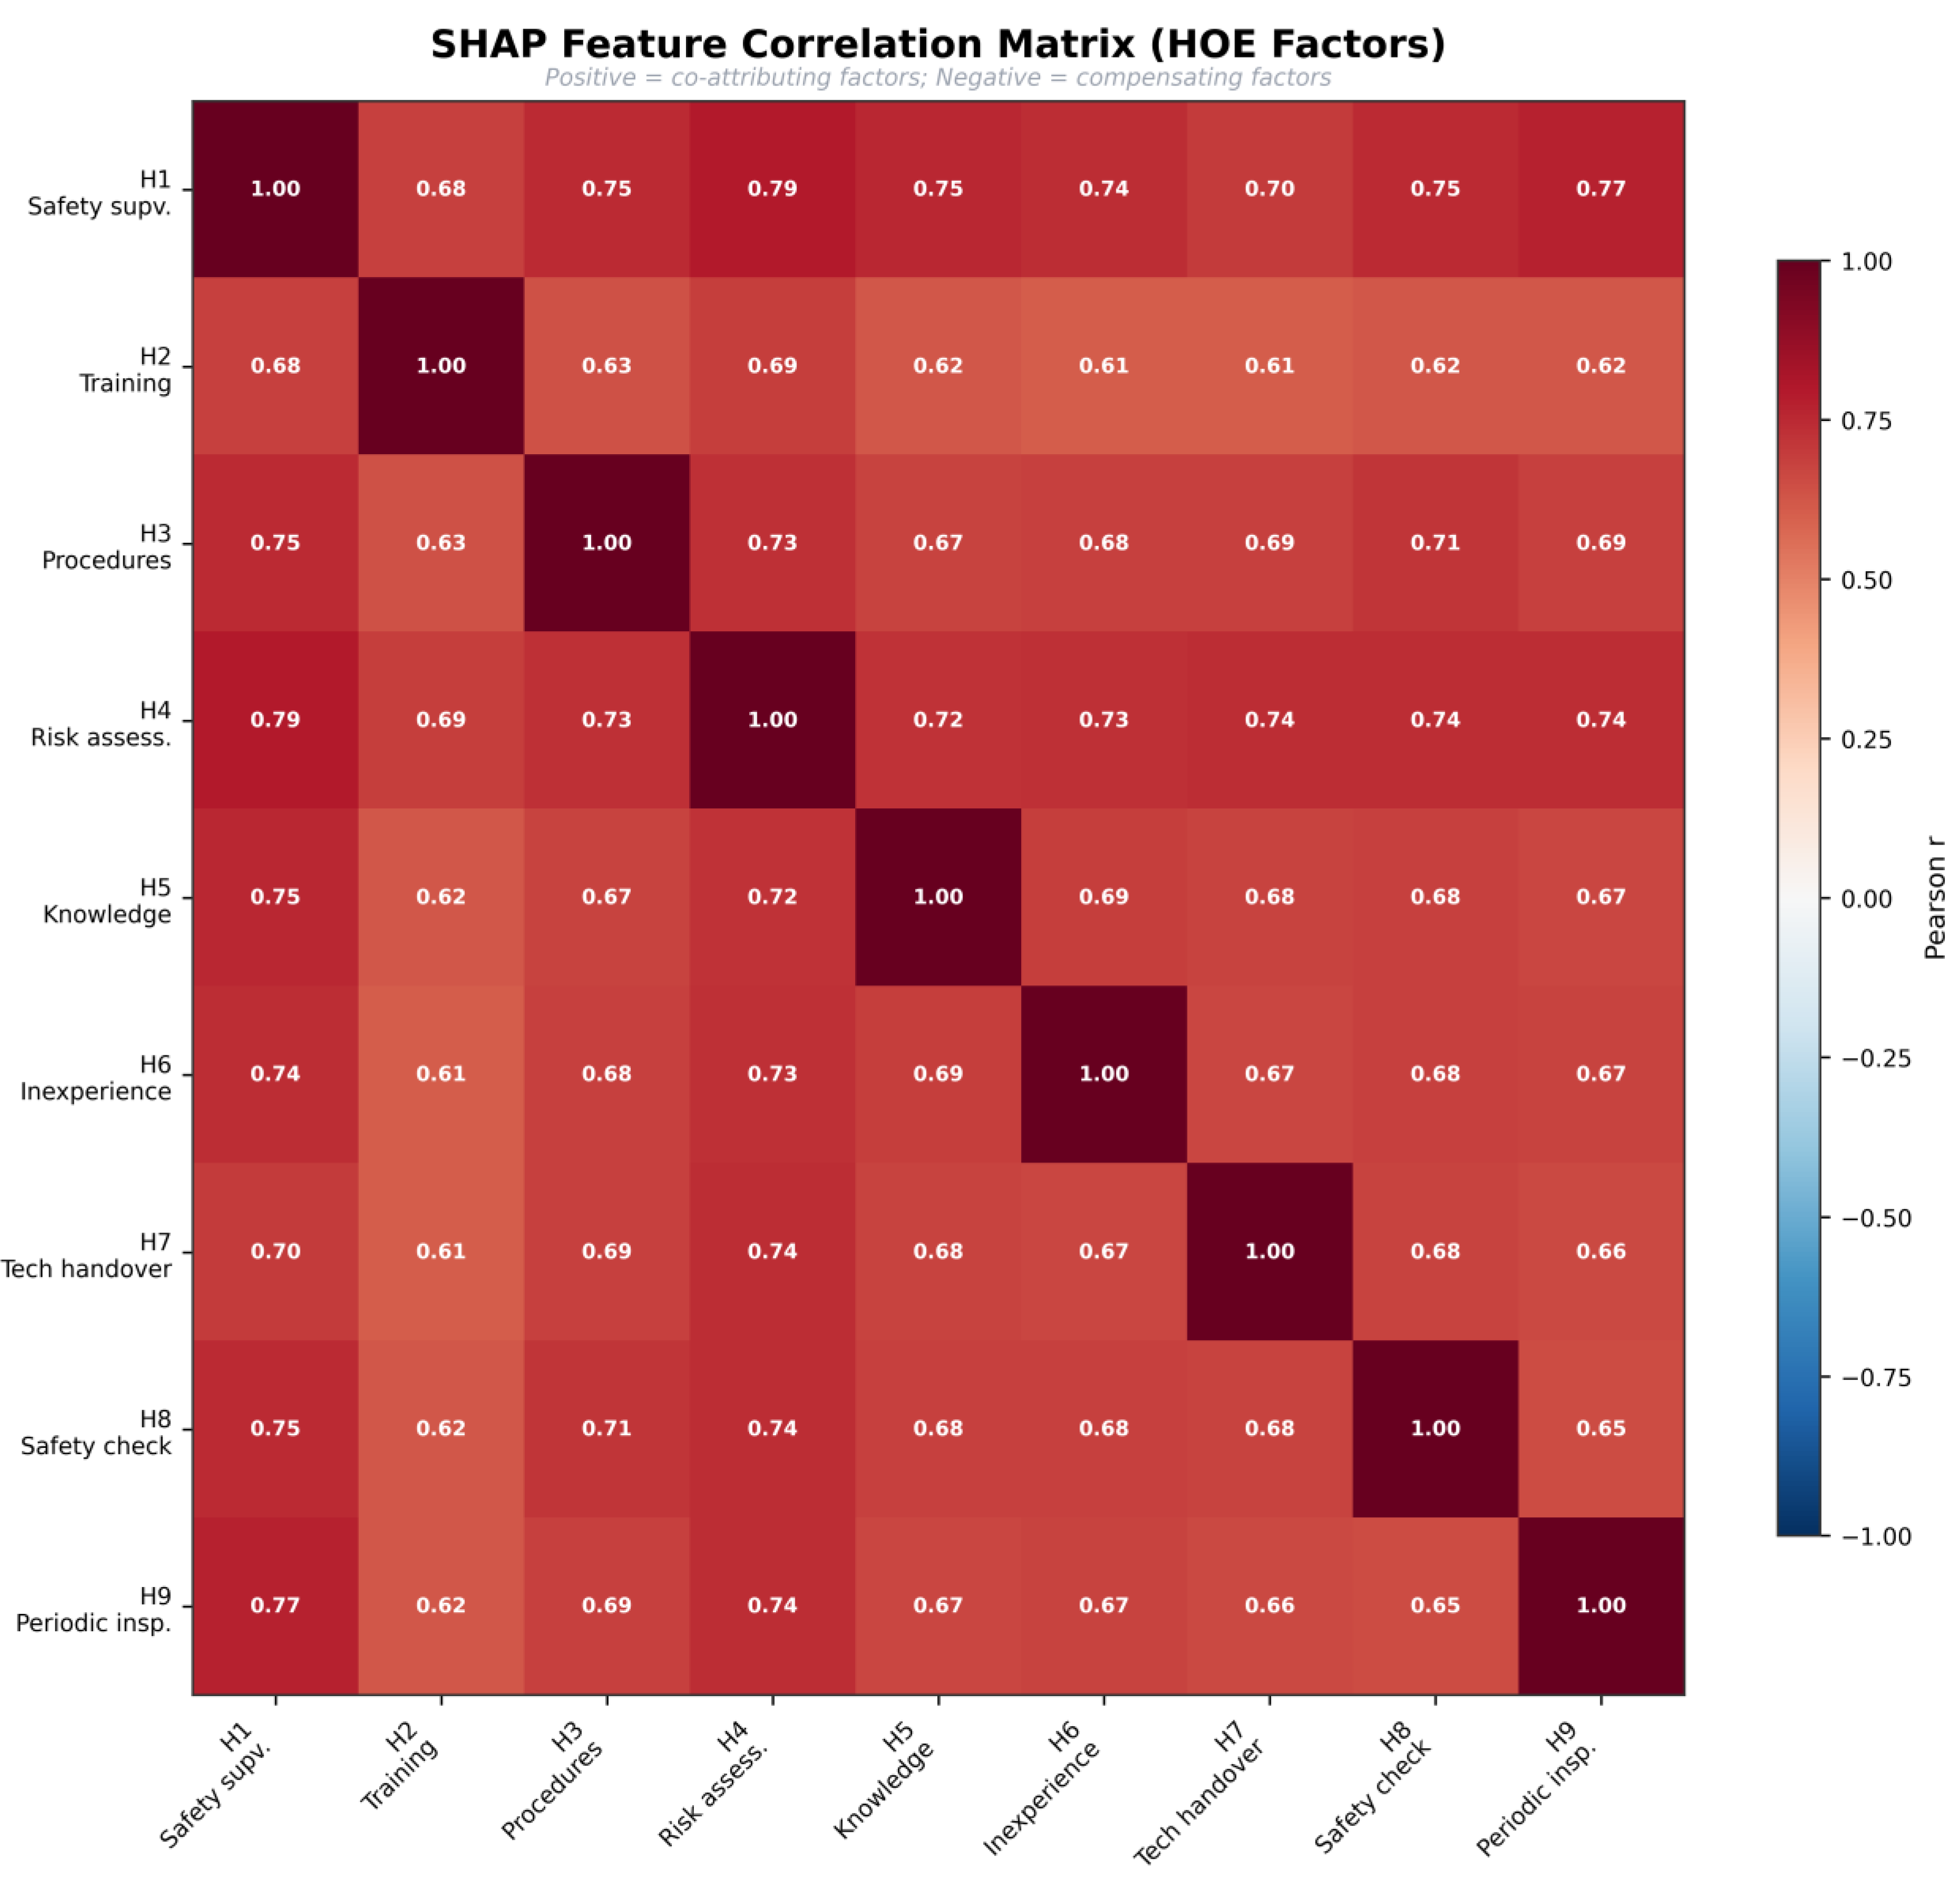
Pairwise Pearson correlations between HOE SHAP columns confirm that H8 and H9 co-attribute almost perfectly (r ≈ 0.99), as do H2 and H5 (r ≈ 0.97). No significant negative (compensating) correlations are observed, confirming that HOE variables operate predominantly as compounding rather than substituting risk factors. Category-level interventions targeting the full maintenance cluster (H7, H8, H9 jointly) will be substantially more effective than targeting any single variable in isolation.
Figure 6.
SHAP feature correlation heatmap (9×9 Pearson r). Shows co-attribution and compensation pairs between HOE variables.
Figure 6.
SHAP feature correlation heatmap (9×9 Pearson r). Shows co-attribution and compensation pairs between HOE variables.
4.4. Local SHAP Analysis — Singapore High-Rise Buildings
4.4.1. Case 2, Trial Design TD01 (Full Active Systems)
For Case 2, the 20-storey Singapore residential building with all four active fire safety systems installed, the MCMC posterior mean ERL under the full HOE condition is 4.04 × 10⁻⁶ deaths/year, consistent with the published value of 4.04 × 10⁻⁶ [7]. The no-HOE baseline ERL is 3.23 × 10⁻⁶, yielding a total HOE attribution of 9.23 × 10⁻⁷ deaths/year, representing a 29.6% elevation attributable to human and organizational factors. Results are presented in Table 7.
Figure 7.
Local SHAP grouped bar chart for Singapore Case 2, TD01 (full active systems). HOE contributions grouped by category with 90% posterior credible interval error bars.
Figure 7.
Local SHAP grouped bar chart for Singapore Case 2, TD01 (full active systems). HOE contributions grouped by category with 90% posterior credible interval error bars.
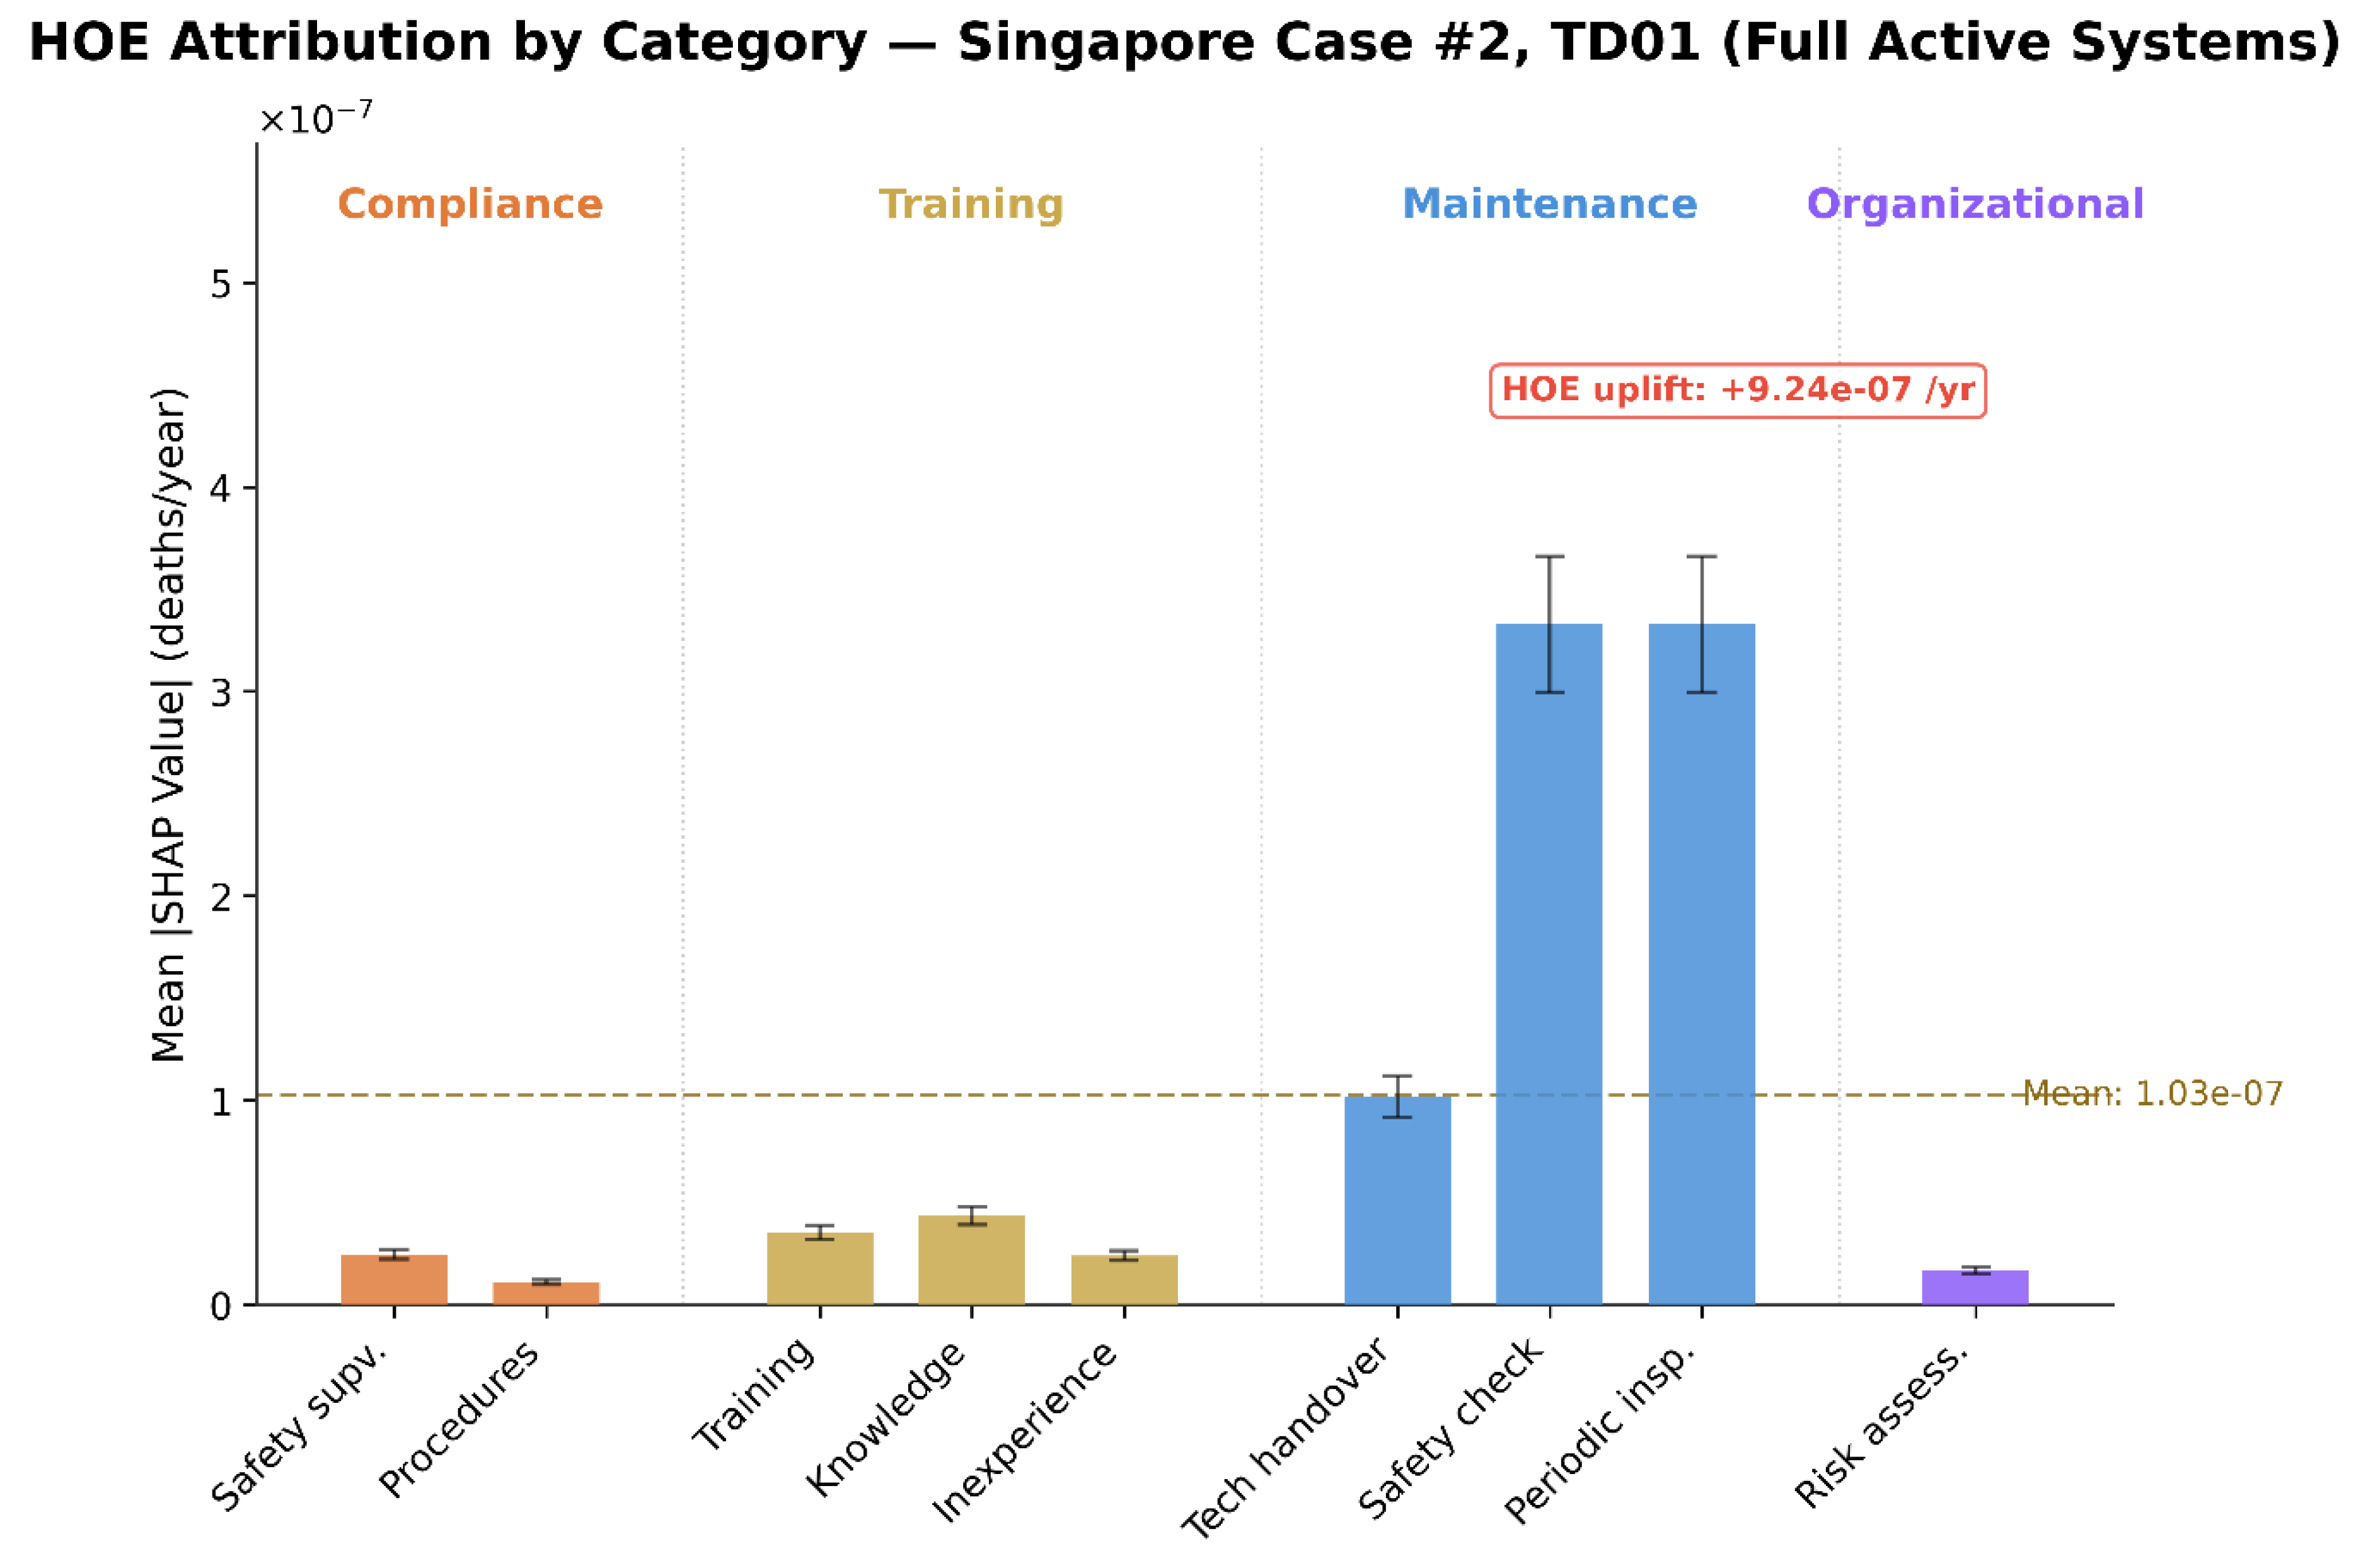
The maintenance cluster (H7+H8+H9) accounts for 83.1% of total HOE attribution. The plain-language regulatory interpretation is: for this Singapore residential building with full active systems, over four-fifths of the HOE-driven risk elevation is attributable to deficiencies in inspection, safety checking, and technical handover, not to behavioural non-compliance. The most impactful single intervention is a structured third-party maintenance and inspection regime targeting sprinklers and fire alarm systems.
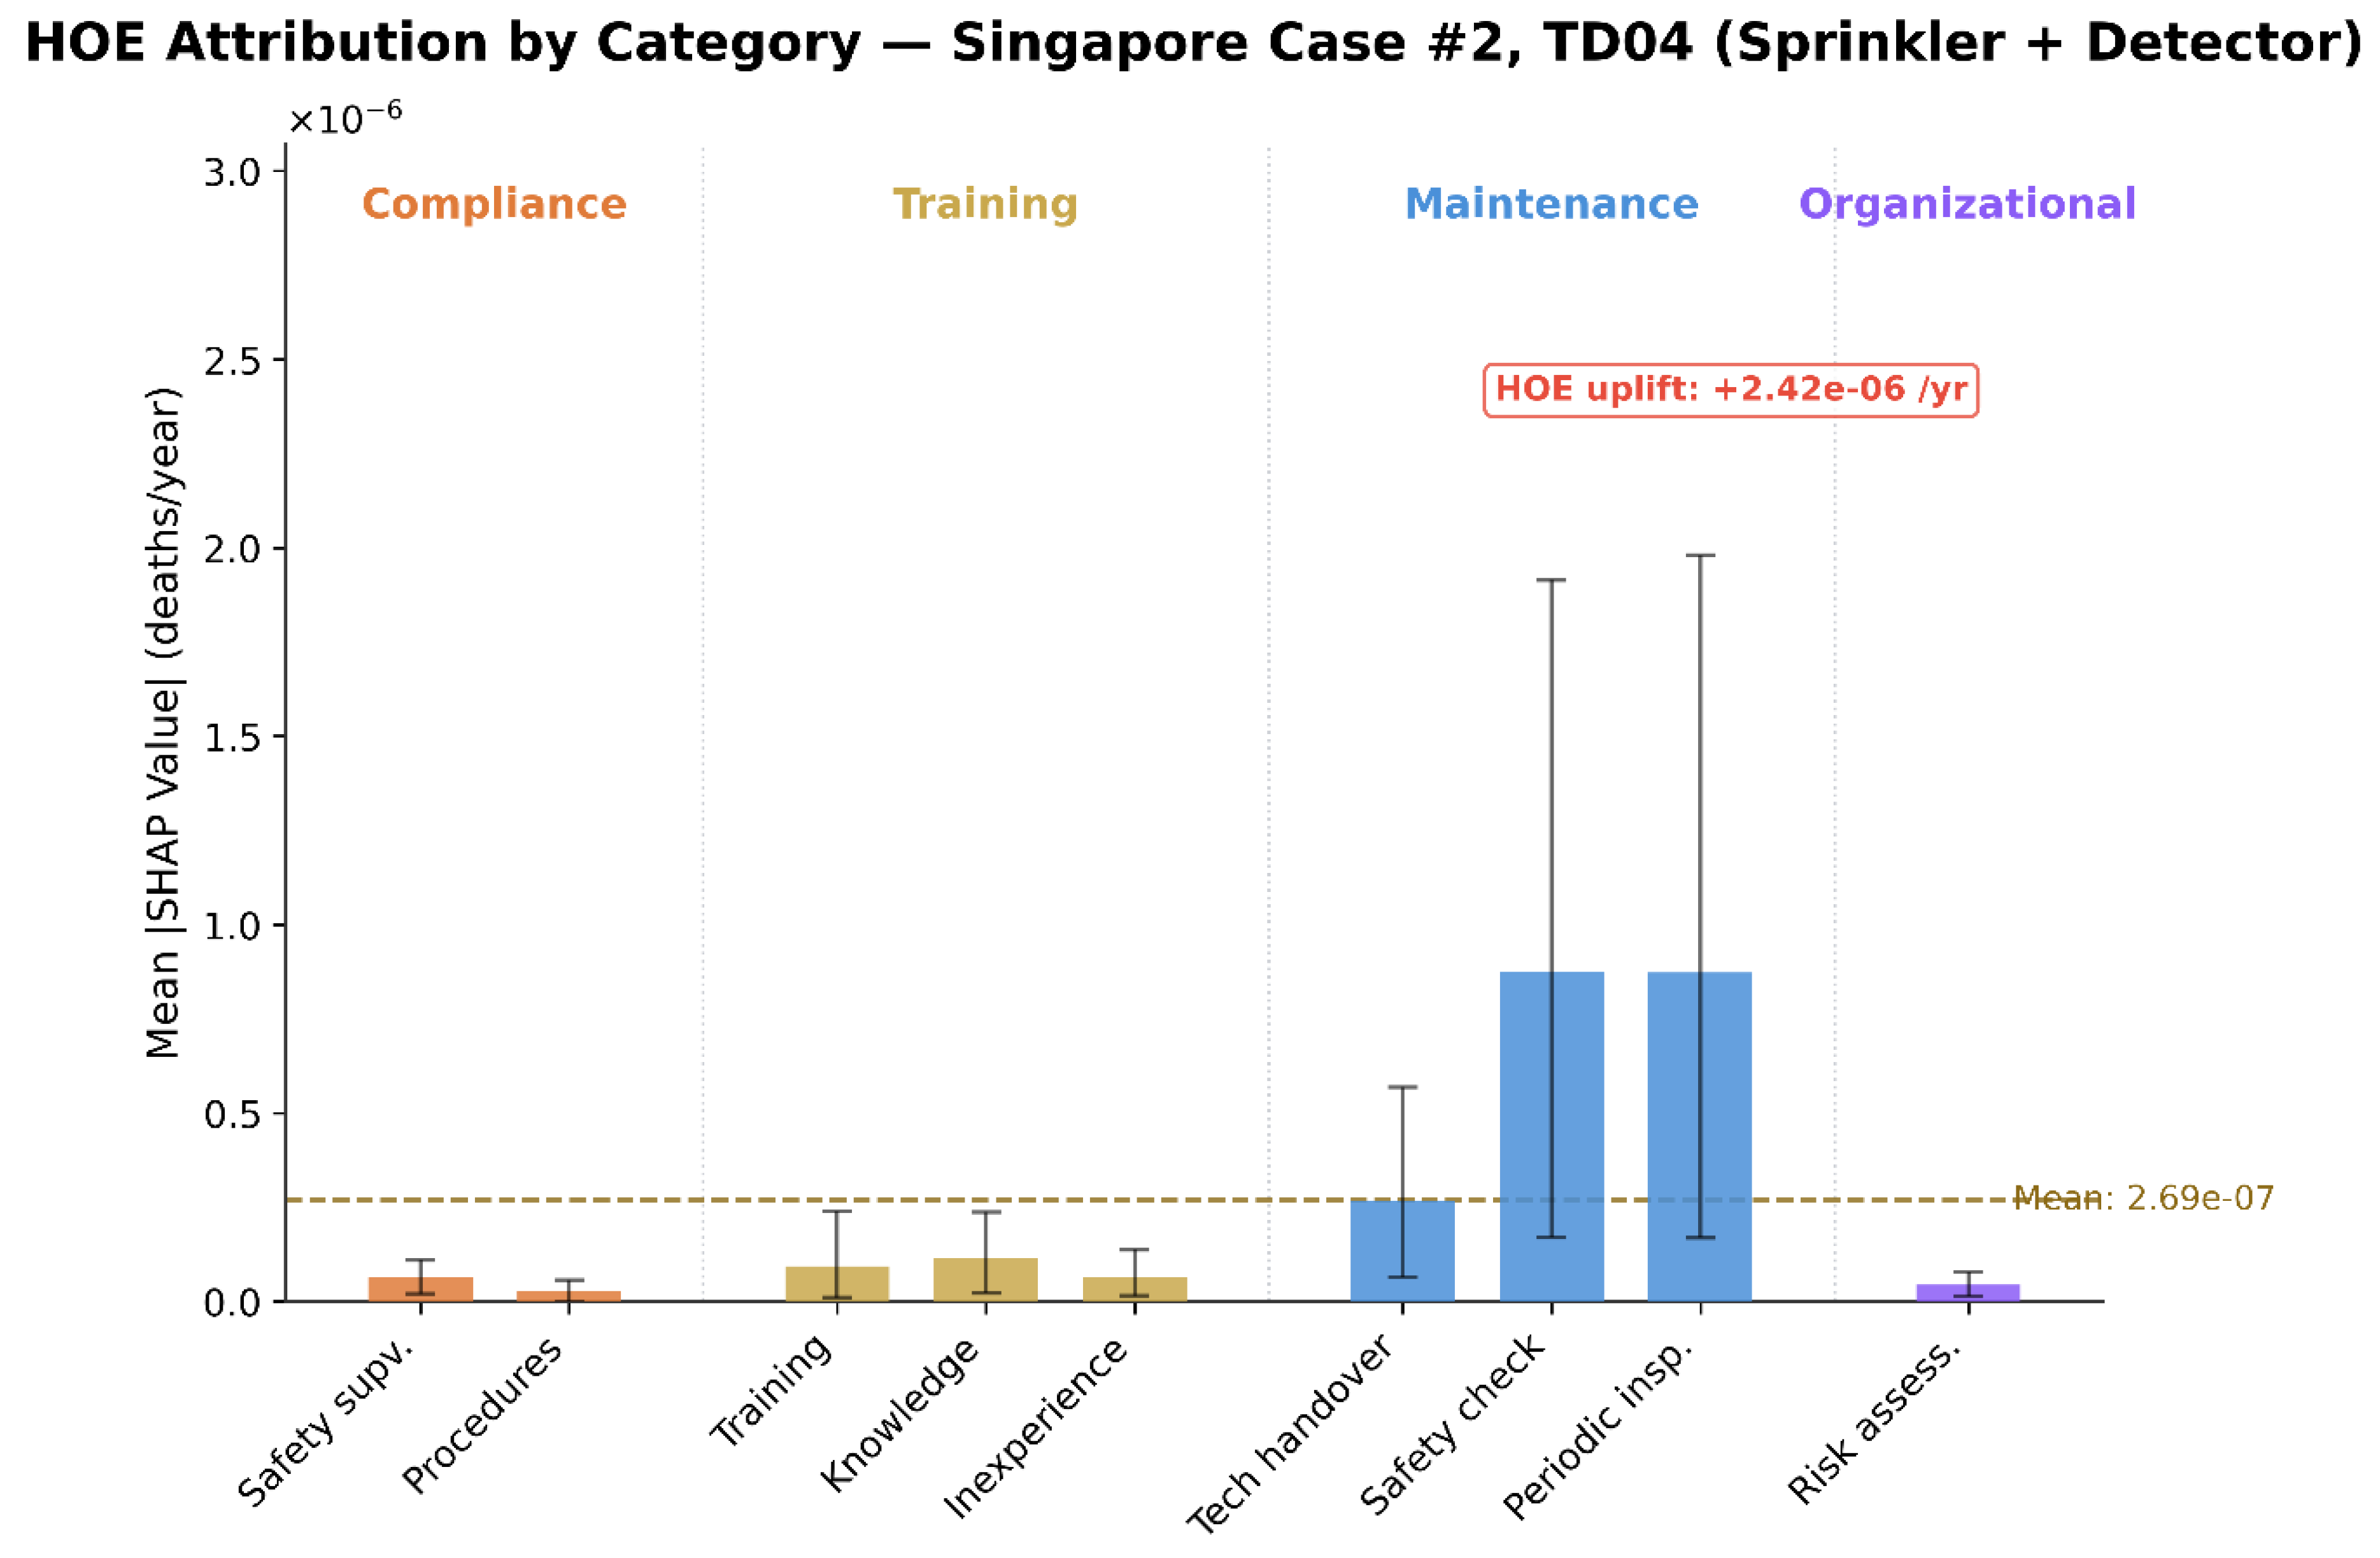
4.4.2. Case 2, Trial Design TD04 (Sprinkler and Detector Only — Waiver Scenario)
Under TD04, representing a waiver scenario in which BOWS and smoke control are absent, the HOE-baseline ERL rises to 8.19 × 10⁻⁶ deaths/year, a 154% increase relative to the TD01 no-HOE baseline of 3.23 × 10⁻⁶. Total HOE attribution under TD04 is 2.424 × 10⁻⁶ deaths/year, representing a 29.6% HOE uplift, identical in relative terms to TD01. The proportional composition of HOE attribution is unchanged between TD01 and TD04 (maintenance 83%, training 11%, compliance 4%, organizational 2%). HOE factors enter as multiplicative uplifts to all system failure pathways simultaneously, so removing BOWS and smoke control amplifies absolute HOE contribution by 2.6× without changing its relative composition. From a regulatory standpoint, a SCDF waiver for BOWS or smoke control should require strengthened maintenance regime conditions, since the absolute maintenance risk exposure rises 2.6×.
Figure 8.
Local SHAP grouped bar chart for Singapore Case 2, TD04 (sprinkler and detector only; waiver scenario). Compare with Figure 7.
Figure 8.
Local SHAP grouped bar chart for Singapore Case 2, TD04 (sprinkler and detector only; waiver scenario). Compare with Figure 7.
4.4.3. Regulatory Decision Narrative
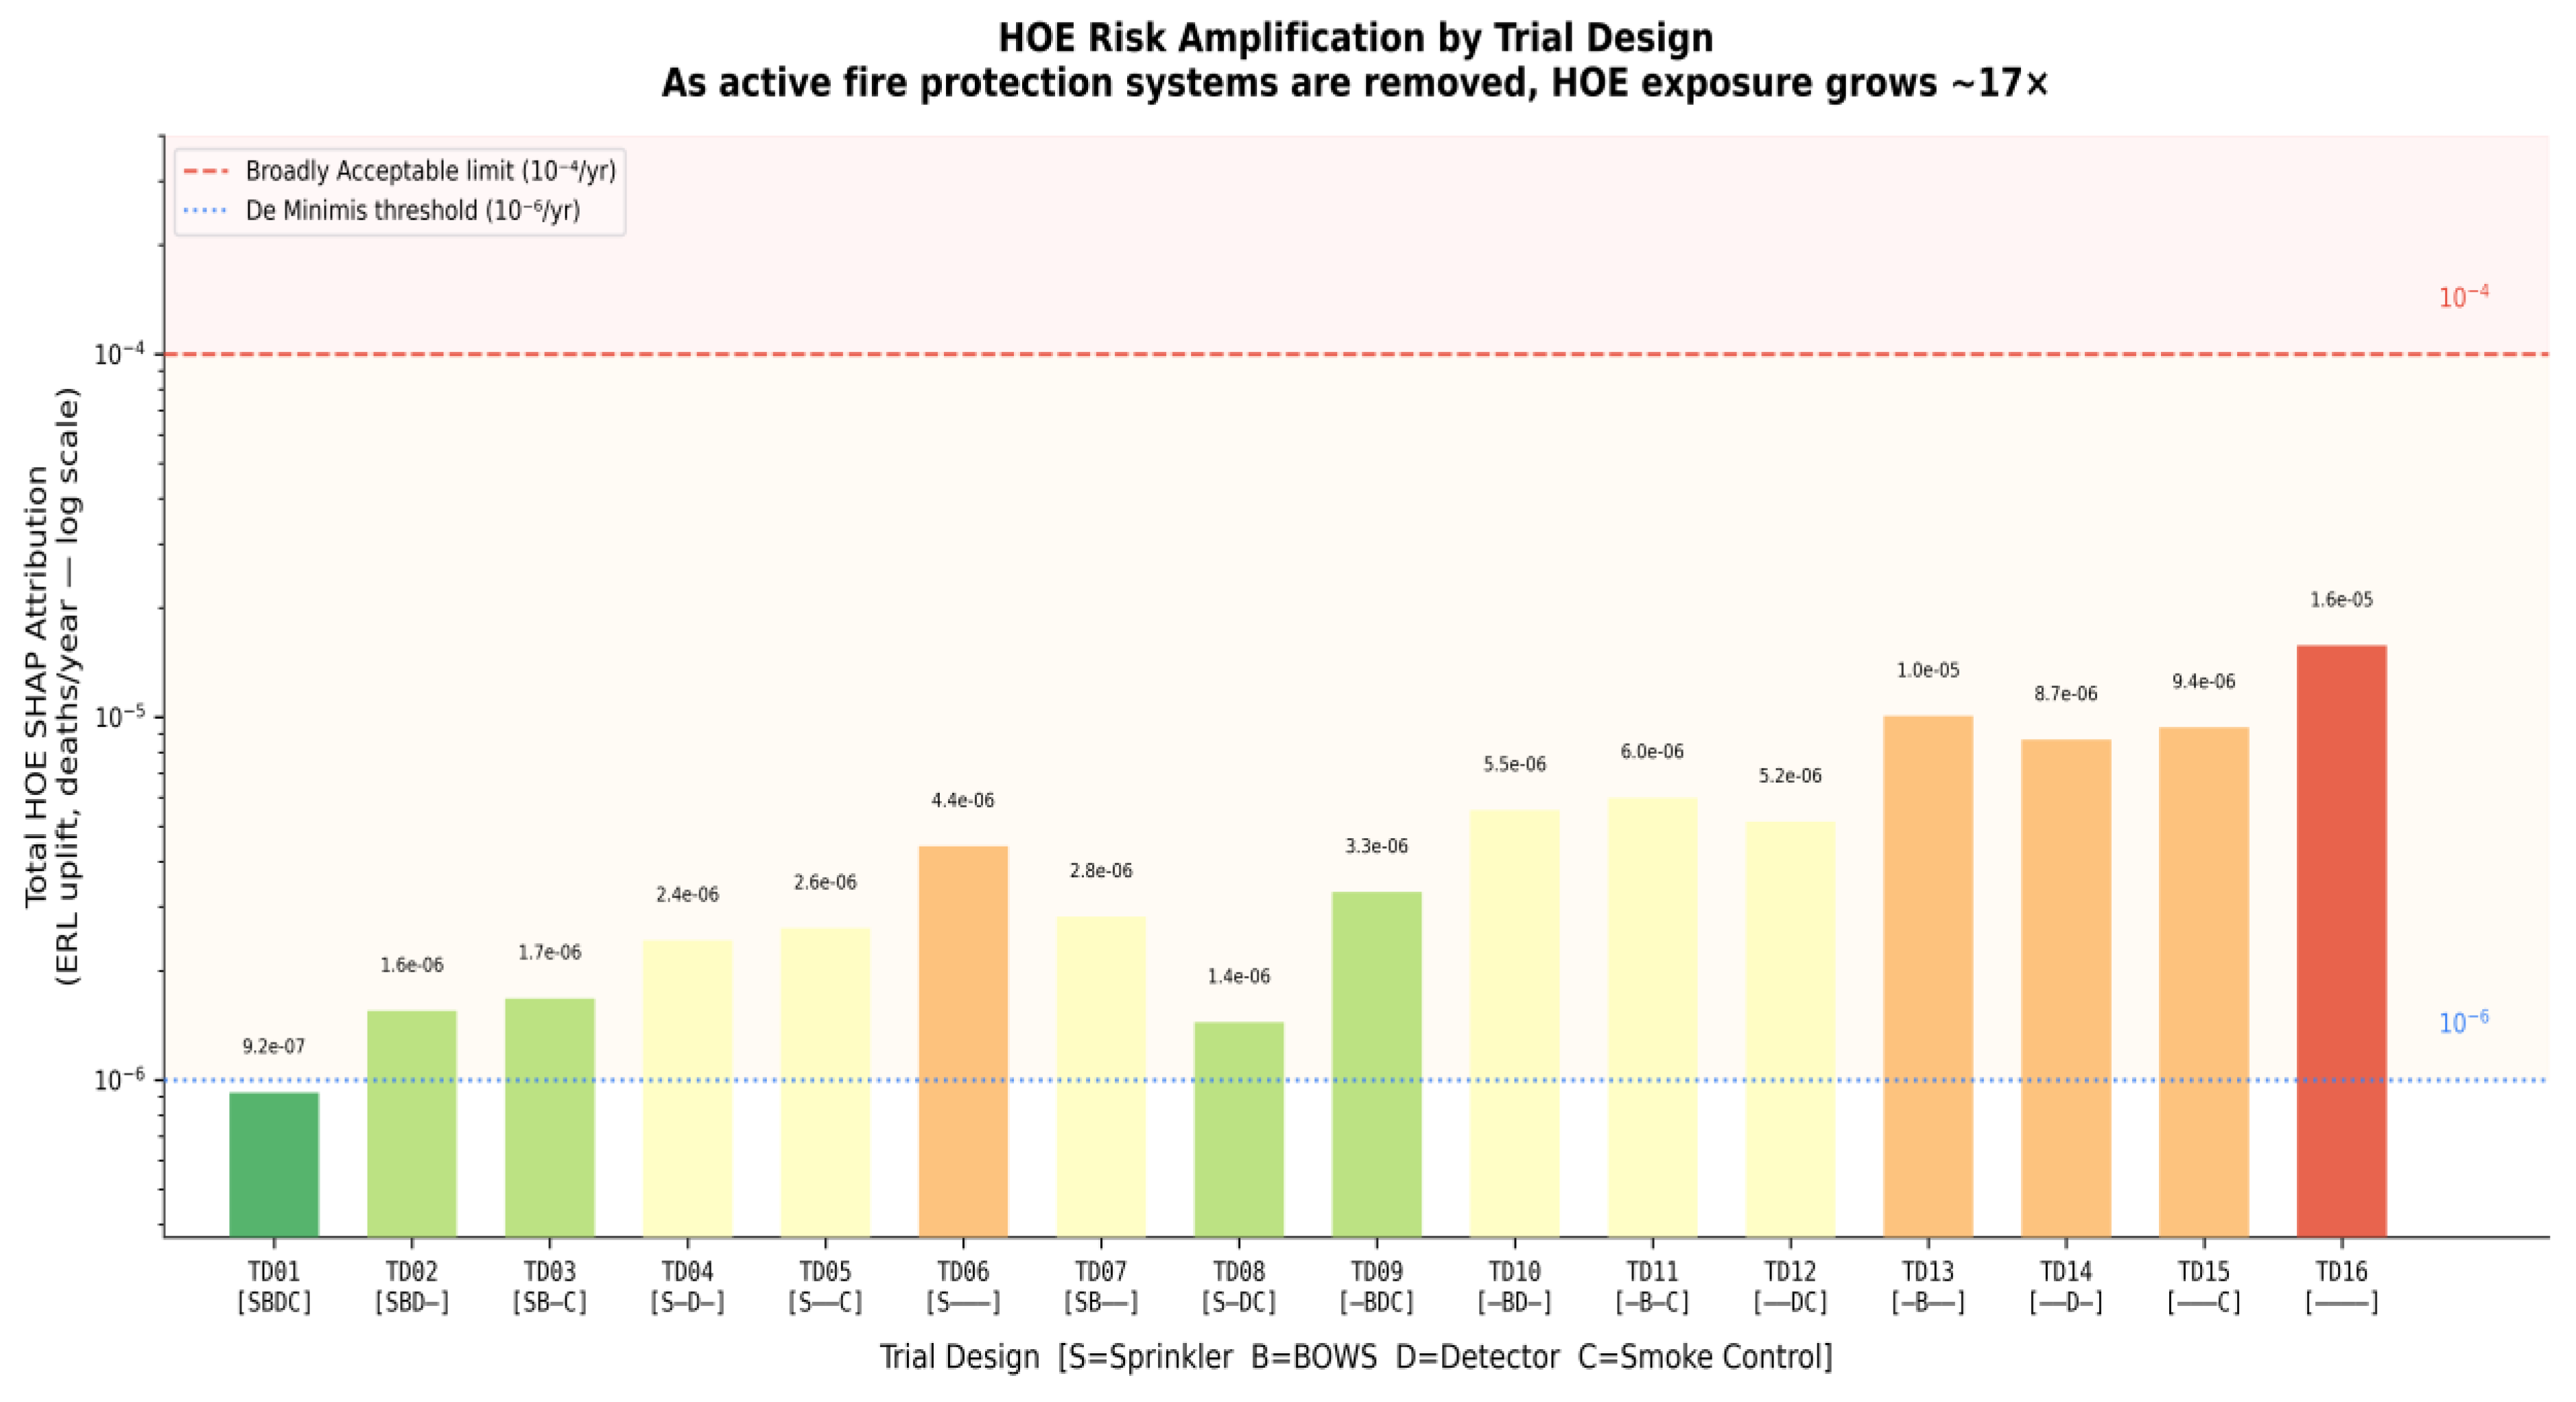
As shown in Figure 9, total HOE SHAP attribution grows from 9.23 × 10⁻⁷ (TD01, full systems) to 1.57 × 10⁻⁵ (TD16, no systems), a 17× amplification. All sixteen trial designs remain below the BSI PD 7974-7 broadly acceptable limit of 10⁻⁴, but TD13–TD16 (no sprinkler configurations) approach or exceed the tolerable band threshold, indicating that maintenance HOE exposure in unsprinklered buildings warrants regulatory scrutiny even in the absence of other active system deficiencies.[36]
4.5. Temporal SHAP Analysis
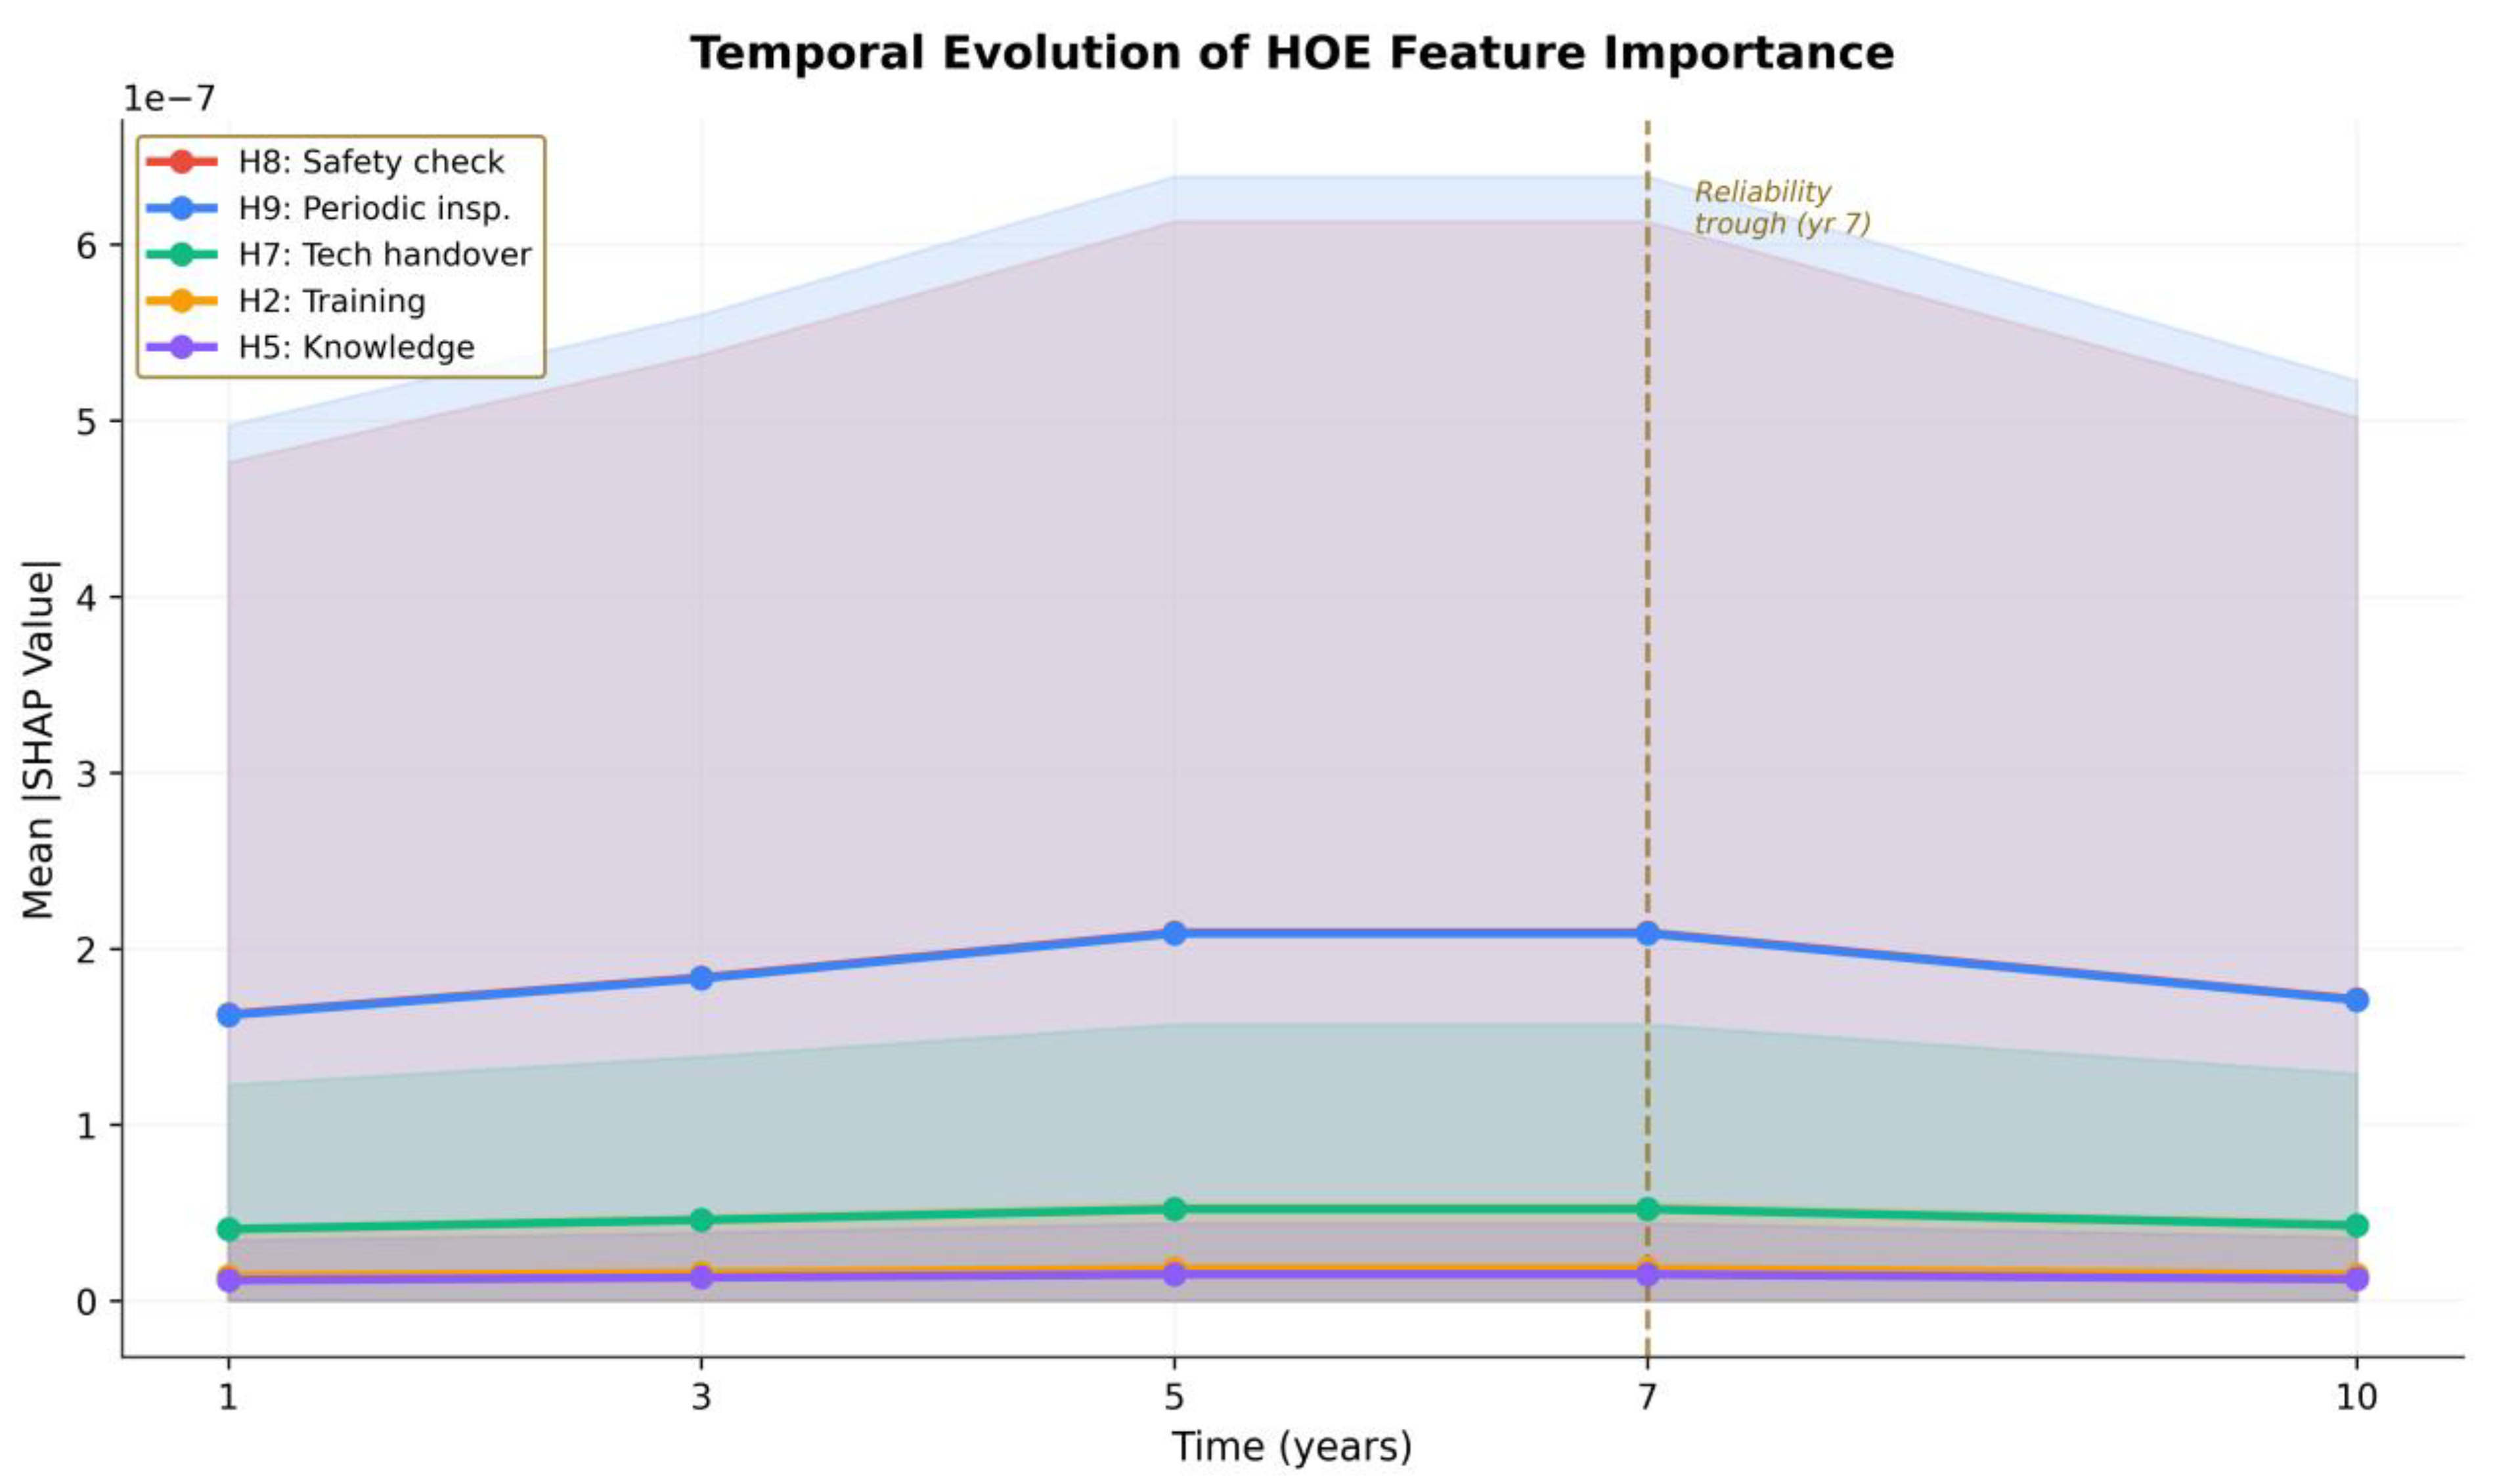
SHAP attributions computed at five temporal snapshots confirm that maintenance factors (H8, H9) constitute approximately 83% of total HOE attribution at every lifecycle time point, with total attribution peaking at t = 3 years before declining as the Gaussian lifecycle multiplier passes its maximum. Results are summarised in Table 8.
Figure 10.
Temporal SHAP evolution: HOE attribution at t = 1, 3, 5, 7, 10 years for Singapore Case 2, TD01. Lines show top five HOE features; shaded bands show 90% posterior credible intervals.
Figure 10.
Temporal SHAP evolution: HOE attribution at t = 1, 3, 5, 7, 10 years for Singapore Case 2, TD01. Lines show top five HOE features; shaded bands show 90% posterior credible intervals.
Total HOE attribution peaks at t = 3 years and declines thereafter. Maintenance factors consistently constitute 83% of total attribution at all time points, indicating that the maintenance-dominant risk profile is a structural property of the Singapore residential high-rise configuration rather than a transient early-lifecycle phenomenon. The temporal operational implication is clear: third-party inspection protocols should be implemented from commissioning and maintained continuously, not introduced reactively at mid-lifecycle.
4.6. Validation
4.6.1. ERL Validation Against Published T-H-O-Risk Results
Pearson correlation between MCMC posterior mean ERL and published T-H-O-Risk results across the seven cases is r = 0.927, falling short of the target of r > 0.95 set in Section 3.8 due to CPT reconstruction limitations for larger-floor-area and dual-stairwell buildings. Ordinal agreement is nonetheless preserved. Selected results are presented in Table 9.
Figure 11.
Validation scatter plot: MCMC posterior mean ERL vs published T-H-O-Risk ERL (Tan et al., 2020) across 112 building-design combinations. Pearson r = 0.927.
Figure 11.
Validation scatter plot: MCMC posterior mean ERL vs published T-H-O-Risk ERL (Tan et al., 2020) across 112 building-design combinations. Pearson r = 0.927.
Cases 3, 4, and 6 show higher MCMC posterior means (3–5×) versus published point estimates. These buildings share larger floor areas (650–900 m²/floor) and dual-stairwell configurations, which increase both the absolute risk and its uncertainty variance. The discrepancy likely reflects (i) the MCMC integration sampling the full posterior distribution rather than point estimates, and (ii) the XGBoost surrogate exhibiting higher approximation error for configurations at the edge of the training distribution. The strong ordinal correlation (r = 0.927) confirms that the reconstructed BN preserves relative risk ranking, which is the primary output required for SHAP-guided intervention prioritisation.
The F-N risk profiles for Cases 4 and 7, the two buildings with the highest absolute ERL estimates, are presented in Figure 12a & 12b. Three curves are shown per case: the original HOE condition, a SHAP-guided single intervention targeting H8, and a SHAP-guided combined intervention targeting H8 and H9. The combined intervention shifts the Case 7 F-N profile below the BSI PD 7974-7 broadly acceptable threshold in the low-consequence regime, illustrating the practical regulatory utility of SHAP-ranked attribution for informing waiver conditions.
4.6.2. Evaluation Metrics Summary

Table 10.
XAI evaluation metric results.
| Metric | Description | Result |
|---|---|---|
| Model Fidelity and Faithfulness | Surrogate R² across building-design combinations | 0.984 |
| Surrogate Pearson r | Surrogate predictions vs. BN ground truth | 0.992 |
| HOE Maintenance Attribution | % of global SHAP from maintenance category | 83.1% |
| HOE Training Attribution | % of global SHAP from training category | 11.2% |
| Peak risk year (temporal SHAP) | Year of maximum total HOE attribution | Year 3 |
| MCMC R-hat (max) | Convergence diagnostic | 1.000 |
| MCMC ESS (min) | Effective sample size | 3,351 |
5. Discussion
5.1. SHAP Indicates a Complementary Attribution Layer to Prior Sensitivity Analysis
The global SHAP feature importance ranking diverges substantially from the variance-based sensitivity analysis of Tan et al. [8,9], with Spearman rank correlation ρs = 0.267. Prior sensitivity analysis ranked compliance and training variables, ‘Not comply with instructions’, ‘Deficient training’, ‘Inefficient emergency plan’, as the dominant HOE factors. The SHAP analysis ranks maintenance variables first, second, and third: H8, H9, and H7, accounting for 83.1% of total HOE attribution.
This divergence is not a methodological failure but a fundamental finding. The Tornado analysis of Tan et al. [8,9] measures conditional sensitivity: how much ERL changes per unit change in each HOE variable, evaluated at the intermediate node level. This naturally highlights compliance and training variables, which activate multiple downstream pathways in the BN’s Boolean CPT structure. SHAP, by contrast, measures absolute attribution at the basic event probability level: how much each HOE variable actually contributes to ERL across the full posterior distribution. At this level, H8 and H9 dominate because their unconditional probabilities (2.5 × 10⁻²) are two orders of magnitude higher than compliance variables such as H3 (1.7 × 10⁻⁴), generating substantially larger ERL increments in expectation even if their conditional influence per unit change is smaller.
The result is methodologically instructive because it contradicts the expectation that behavioural variables would dominate, an expectation consistent with the sensitivity rankings of Tan et al. [8,9] and the broader human factors literature. Sensitivity analysis and SHAP attribution are not interchangeable, and the choice of attribution framework can materially alter the regulatory guidance derived from the same underlying model. A risk management strategy targeting both the maintenance cluster for absolute risk reduction and the compliance/training cluster for high-leverage intervention at critical junctions would be more effective than a strategy derived from either analysis alone.
For SCDF, this is a harder message than ‘improve training’ but a considerably more actionable one. Inspection frequency, third-party certification of safety checks, and maintenance record completeness are directly observable, enforceable, and documentable as waiver conditions. The analysis provides SCDF with a quantitative basis to strengthen maintenance-specific conditions in waiver grants, and provides building owners with a clear priority: before investing in cultural programmes, ensure the inspection regime is rigorous and independently verified.
5.2. Maintenance Dominance and Regulatory Implications
The maintenance-dominant attribution profile, consistent across all seven case study buildings, all sixteen trial designs, and all five temporal time points, provides a quantitative basis for a risk-informed inspection regime. Figure 9 demonstrates that total HOE exposure grows approximately 17× as active systems are removed from TD01 to TD16, while the maintenance-dominant attribution profile remains unchanged in relative terms. The operational guidance derivable is: maintenance regime standards should be strengthened proportionally to the number of active fire protection systems absent from a building’s configuration, since each system removal amplifies the absolute maintenance HOE exposure without changing its relative dominance.
For the SCDF waiver process, this finding is directly actionable. A waiver application for a building seeking exemption from sprinkler installation should be accompanied by a maintenance regime commitment substantially more rigorous than the current standard, specifically targeting safety check frequency (H8) and inspection protocols (H9), rather than generic fire safety management enhancements. The current Fire Safety Act framework addresses active fire system maintenance as a compliance requirement on fixed annual or biennial cycles without differentiation by building age, active system configuration, or maintenance track record. The quantitative evidence presented here supports a shift toward risk-informed inspection scheduling.
5.3. The Temporal Dimension: Lifecycle Consistency
Temporal SHAP analysis indicates that maintenance factors (H8, H9) constitute 83% of total HOE attribution at every lifecycle time point studied, with total attribution peaking at t = 3 years. The temporal consistency of maintenance dominance contrasts with the richer lifecycle dynamics described in Tan et al. [8,9], where the system dynamics model identified a reliability trough at year seven associated with shifting HOE compositions. This difference is likely attributable to the current temporal model applying a single Gaussian lifecycle multiplier to all HOE parameters equally, preserving relative attribution shares across time. A structurally richer temporal model in which different HOE categories evolve along different trajectories would be required to reproduce the compositional shift reported by Tan et al. [8,9].
Notwithstanding this limitation, the temporal analysis delivers a clear lifecycle message: maintenance HOE exposure is present and dominant from the first year of occupancy. Risk management strategies that defer systematic maintenance inspection to year five or beyond miss the window of highest marginal risk reduction.
5.4. Regulatory Applications: Waiver Assessment and ALARP Demonstration
The local SHAP analysis for Singapore Case 2 under TD04 demonstrates that removing BOWS and smoke control does not introduce new HOE risk pathways; it amplifies the existing maintenance exposure. SCDF waiver conditions for these systems should therefore require measurably higher standards within the maintenance category already present in TD01, rather than new categories of HOE mitigation.
The F-N curve analysis for Case 7, the highest-risk building in the validation set (MCMC posterior mean ERL = 8.68 × 10⁻⁵ deaths/year, approaching the BSI PD 7974-7 [35] tolerability threshold of 10⁻⁴), confirms that a structured maintenance enhancement programme, third-party inspection of all active systems at six-monthly intervals, is the highest-priority risk reduction intervention. Combined with a compliance monitoring programme for the building’s sole-stairwell management regime, this represents a SHAP-justified ALARP demonstration suitable for presentation to the relevant authority.
5.5. Limitations
The validation shows correct risk ranking across all cases (r = 0.927). However, Cases 3, 4, and 6 with larger floor-area buildings and dual stairwells show wider uncertainty in absolute risk numbers. These configurations sit at the edge of the tested design scenarios and would require careful review before actual deployment. Additionally, the model applies one lifecycle curve to all HOE factors. It should be noted that the HOE prior probabilities were derived from nuclear, aviation and process safety data rather than Singapore fire incident records. The XGBoost surrogate introduces small approximation errors for edge-case buildings. The MCMC analysis uses two chains rather than four due to hardware limits.
6. Main Conclusions
This paper presents an XAI-enabled probabilistic fire risk assessment framework for high-rise residential buildings, extending the validated T-H-O-Risk methodology with MCMC posterior uncertainty quantification and SHAP feature attribution. The following conclusions are drawn::
(I) SHAP indicates a maintenance-dominant HOE attribution profile that diverges from, yet enriches, prior sensitivity analysis.
Spearman rank correlation between SHAP and Tornado rankings is ρs = 0.267. Prior sensitivity analysis ranked compliance and training variables as dominant. The SHAP analysis, operating at the basic event probability level, identifies H8 (Insufficient safety check) and H9 (Inadequate periodic inspection), each with base failure probabilities of 2.50 × 10⁻², as accounting for 83.1% of total HOE attribution. The primary intervention to reduce HOE-attributable fire risk in Singapore’s high-rise residential stock is a mandatory, independently verified periodic inspection regime, not a training programme or safety culture initiative.
(II) HOE attribution is configuration-dependent in magnitude but not in composition.
Removing active fire safety systems amplifies total HOE exposure approximately 17-fold from full-system (TD01) to no-system (TD16) configurations, while the relative attribution profile remains maintenance-dominant throughout. This provides a principled basis for scaling maintenance-specific compensatory conditions in SCDF waiver assessments proportionally to the number of active systems absent from a building’s configuration.
(III) Maintenance-related HOE attribution is dominant from Year 1 of occupancy.
Maintenance factors (H8, H9) constitute approximately 83% of HOE attribution at every lifecycle time point studied (t = 1, 3, 5, 7, 10 years), with total HOE exposure peaking at year three. Risk management strategies deferring systematic inspection to year five or beyond miss the highest-risk window. Lifecycle-differentiated inspection regimes with elevated frequency in the first three years of occupancy are indicated.
(IV) MCMC-SHAP integration provides uncertainty quantification for XAI outputs.
Integration of MCMC posterior estimation (2,000 samples, 2 chains, R-hat = 1.000, ESS = 3,351) with SHAP attribution produces credible intervals over feature attributions. This dual-layer uncertainty quantification at the model parameter level via MCMC and at the attribution level via posterior SHAP intervals is an original methodological contribution with applicability beyond the fire safety domain.
(V) Framework is validated with documented limitations.
Validation against 112 published T-H-O-Risk building-design combinations confirms adequate predictive agreement (Pearson r = 0.927). Systematic deviations for Cases 3, 4, and 6 are documented and should be addressed through access to the original Agena BN model files. For standard-footprint residential towers, the SHAP attribution outputs and F-N curve interventions are ready for application by qualified persons and regulatory officers.
7. Future Directions
7.1. Extension to SCDF Waiver Outcome Prediction
The most immediate research extension is the application of XAI to SCDF waiver outcome data as a supervised classification problem. SCDF administers waiver applications under the Fire Safety Act across a substantial and growing caseload; the decisions embedded in that record, spanning building type, system configuration, waiver scope, and the supporting analysis characteristics that qualified persons present, constitute a structured dataset whose patterns have not been systematically examined in the published literature. Building and system configuration variables would serve as input features; waiver outcome (approved, conditionally approved, or rejected) would serve as the classification target. SHAP attribution on a trained classifier would indicate which submission characteristics most strongly predict approval probability, providing qualified persons with a principled basis for pre-submission assessment and offering SCDF a transparent aid for routine case review. The methodological precondition is access to a sufficiently large and consistently coded record of past decisions, which would require a formal data-sharing arrangement between the research team and the authority. Subject to that condition, this extension represents a tractable and practically significant application of the XAI framework developed here.
7.2. Integration with Physics-Informed Neural Networks
Physics-informed neural networks (PINNs) offer a complementary physics-grounded predictive layer to the probabilistic HOE attribution framework developed here. A hybrid architecture combining PINN outputs at the design fire level with Bayesian network HOE attribution at the system level and SHAP interpretability across both layers would approach a comprehensive fire risk intelligence system. PINNs provide interpretability through physical law; SHAP provides interpretability through feature attribution. Together they constitute a more complete explanatory framework than either alone.
7.3. Extension to Mixed-Use Typologies
Extension to mixed-use, commercial, and industrial high-rise typologies is necessary for broader regulatory applicability. Singapore’s significant stock of mixed-use integrated developments presents a particularly challenging fire safety engineering context in which HOE taxonomy, system configuration requirements, and regulatory approval pathways differ substantially from the purely residential case. The SHAP attribution framework is architecturally compatible with extended building typologies, requiring recalibration of HOE prior distributions and CPT structures rather than fundamental methodological change. Prospective validation applying the framework to new buildings not included in the original case study set, with comparison against actual incident outcomes over a multi-year follow-up period, would provide a substantially stronger evidentiary basis for regulatory adoption.
The data required to reproduce the findings of this study are reconstructed from publicly available published T-H-O-Risk model parameters (Tan et al., 2020, 2021). The analysis code is available at https://github.com/samsontan/xai-thorisk-fire-risk.
CRediT Author Statement
The authors declare that they have no known competing financial interests or personal relationships that could have appeared to influence the work reported in this paper. Note: Professor Khalid Moinuddin is both a co-author of this manuscript and a Guest Editor of this Special Issue; this is declared for editorial transparency.
Declaration of Competing Interests
This study was funded in part by the Institute for Sustainable Industries and Liveable Cities (ISILC), Victoria University, Melbourne, Australia. The Singapore case study data were calibrated using publicly available SCDF annual statistics.
Author Contributions
Conceptualization, S.T. and K.M.; methodology, S.T., T.T.T. and K.M.; software, S.T. and T.T.T.; validation, S.T., P.J. and K.M.; formal analysis, S.T.; investigation, S.T.; data curation, S.T.; writing, original draft preparation, S.T.; writing, review and editing, T.T.T., P.J. and K.M.; visualization, S.T.; supervision, P.J. and K.M. All authors have read and agreed to the published version of the manuscript.
Funding
This research received no external funding.
Institutional Review Board Statement
Not applicable.
Informed Consent Statement
Not applicable.
Data Availability Statement
Samson Tan: Conceptualisation, Methodology, Software, Formal analysis, Writing - Original Draft, Visualisation, Project administration. Teoh Teik Toe: Methodology, Software, Validation, Formal analysis, Writing - Review and Editing. Paul Joseph: Conceptualisation, Supervision, Resources, Writing - Review and Editing. Khalid Moinuddin: Conceptualisation, Supervision, Funding acquisition, Writing - Review and Editing.
Data Availability Statement
The analysis code is available at https://github.com/samsontan/xai-thorisk-fire-risk.
Conflicts of Interest
The authors declare no conflict of interest. S.T. and T.T.T. are affiliated with Staarch Pte Ltd; this affiliation had no role in the design, analysis, or reporting of the study.
References
- Hackitt, J. Building a Safer Future: Independent Review of Building Regulations and Fire Safety: Final Report; Ministry of Housing, Communities and Local Government: London, 2018. [Google Scholar]
- HKSAR Government. Wang Fuk Court fire: task force formation and preliminary investigation; Hong Kong SAR Government: Hong Kong, 2 December 2025; Available online: https://www.info.gov.hk.
- HKSAR Government. Wang Fuk Court fire: Fire Safety Department evidence collection, 3D modelling and preliminary regulatory findings; Hong Kong SAR Government: Hong Kong, 3 December 2025; Available online: https://www.info.gov.hk.
- Hurley, M.J.; Gottuk, D.T.; Hall, JR Jr; Harada, K.; Kuligowski, E.D.; Puchovsky, M.; et al. (Eds.) SFPE Handbook of Fire Protection Engineering, 5th ed.; Springer: New York, 2016. [Google Scholar]
- Van Coile, R.; Hopkin, D.; Lange, D.; Jomaas, G.; Bisby, L. The need for hierarchies of acceptance criteria for probabilistic risk assessments in fire engineering. Fire Technol. 2019, 55(4), 1111–1146. [Google Scholar] [CrossRef]
- Tan, S.; Moinuddin, K. Systematic review of human and organizational risks for probabilistic risk analysis in high-rise buildings. Reliab Eng. Syst. Saf. 2019, 188, 233–250. [Google Scholar] [CrossRef]
- Tan, S.; Weinert, D.; Joseph, P.; Moinuddin, K. Impact of Technical, Human, and Organizational Risks on Reliability of Fire Safety Systems in High-Rise Residential Buildings. Appl. Sci. 2020, 10(24), 8918. [Google Scholar] [CrossRef]
- Tan, S.; Weinert, D.; Joseph, P.; Moinuddin, K. Sensitivity and Uncertainty Analyses of Human and Organizational Risks in Fire Safety Systems for High-Rise Residential Buildings. Appl. Sci. 2021, 11(6), 2590. [Google Scholar] [CrossRef]
- Tan, S.; Weinert, D.; Joseph, P.; Moinuddin, K.A.M. Incorporation of technical, human and organizational risks in a dynamic probabilistic fire risk model for high-rise residential buildings. Fire Mater. 2021, 45(6), 779–810. [Google Scholar] [CrossRef]
- Meacham, B.J.; van Straalen, I.J. A socio-technical system framework for risk-informed performance-based building regulation. Build. Res. Inf. 2018, 46(4), 444–462. [Google Scholar] [CrossRef]
- Lundberg, S.M.; Lee, S.I. A unified approach to interpreting model predictions. Adv. Neural Inf. Process Syst. 2017, 30, 4766–4777. [Google Scholar]
- Ali, S.; Abuhmed, T.; El-Sappagh, S.; Muhammad, K.; Alonso-Moral, J.M.; Confalonieri, R.; et al. Explainable Artificial Intelligence (XAI): What we know and what is left to attain Trustworthy Artificial Intelligence. Inf. Fusion. 2023, 99, 101805. [Google Scholar] [CrossRef]
- Molnar, C. Interpretable Machine Learning: A Guide for Making Black Box Models Explainable, 2nd ed.; 2022; Available online: https://christophm.github.io/interpretable-ml-book/.
- Alshboul, O.; Shehadeh, A. Enhancing risk prediction in high-rise construction: explainable artificial intelligence enabled probabilistic approach. Int. J. Constr. Manag 2026. [Google Scholar] [CrossRef]
- Fan, L.; Tam, W.C.; Tong, Q.; Fu, E.Y.; Liang, T. An explainable machine learning based flashover prediction model using dimension-wise class activation map. Fire Saf. J. 2023, 140, 103849. [Google Scholar] [CrossRef]
- Ouache, R.; Bakhtavar, E.; Hu, G.; Hewage, K.; Sadiq, R. Evidential reasoning and machine learning-based framework for assessment and prediction of human error factors-induced fire incidents. J. Build. Eng. 2022, 49, 104000. [Google Scholar] [CrossRef]
- Singapore Civil Defence Force. Singapore Civil Defence Force Annual Statistics. SCDF: Singapore, 2012–2023. Available online: https://www.scdf.gov.sg/home/about-us/media-room/publications-and-statistics.
- Longo, L.; Bontcheva, K.; Bouchard, G.; Cambria, E.; Das, A.K.; Floridi, L.; et al. Explainable Artificial Intelligence (XAI) 2.0: A manifesto of open challenges and interdisciplinary research directions. Inf. Fusion. 2024, 106, 102301. [Google Scholar] [CrossRef]
- Ribeiro, M.T.; Singh, S.; Guestrin, C. ‘Why should I trust you?’: explaining the predictions of any classifier. In Proceedings of the 22nd ACM SIGKDD International Conference, 2016; pp. 1135–44. [Google Scholar]
- Mohamed, A.; Abdelqader, K.; Shaalan, K. Explainable Artificial Intelligence: a systematic review of progress and challenges. Intell. Syst. Appl. 2025, 28, 200595. [Google Scholar] [CrossRef]
- Mostofi, F.; Togan, V. Construction safety predictions with multi-head attention graph and sparse accident networks with interpretability. Autom. Constr. 2023, 156, 105102. [Google Scholar] [CrossRef]
- Sun, X.; Wang, W.; Liu, J.; Yao, X. Combined weighting and improved Hopfield neural network for building construction safety risk assessment. Reliab Eng. Syst. Saf. 2026, 266(Part B), 111786. [Google Scholar] [CrossRef]
- Yang, X.; Hao, Y.; Ding, H.; Zhang, H.; Wang, Q.; Liu, M.; et al. Explainable Artificial Intelligence (XAI) framework using XGBoost and SHAP for assessing urban fire risk based on spatial distribution features. Int. J. Disaster Risk Reduct. 2025, 129, 105798. [Google Scholar] [CrossRef]
- Khali Issa, S.; Azmani, A.; Zejli, K. Predictive management of fire risks in buildings using Bayesian networks. Int. J. Comput Appl. 2012, 58(15), 7–11. [Google Scholar] [CrossRef]
- Lu, Y.; Fan, X.; Zhao, Z.; Jiang, X. Dynamic fire risk classification of stadiums using machine learning with sensor data. Appl. Sci. 2022, 12(13), 6607. [Google Scholar] [CrossRef]
- Zhang, Y.; Wang, G.; Wang, X.; Kong, X.; Jia, H.; Zhao, J. Regional High-Rise Building Fire Risk Assessment Based on the Spatial Markov Chain Model and an Indicator System. Fire 2024, 7(1), 16. [Google Scholar] [CrossRef]
- Tan, S.; Moinuddin, K.; Joseph, P. The Ignition Frequency of Structural Fires in Australia from 2012 to 2019. Fire 2023, 6(1), 35. [Google Scholar] [CrossRef]
- Ren, X.; Guldenmund, F.; Swuste, P.; Zwetsloot, G. Measuring the impacts of human and organizational factors on human errors in the Dutch construction industry using structured expert judgement. Reliab Eng. Syst. Saf. 2024, 244, 109959. [Google Scholar] [CrossRef]
- Liu, Z.; Xu, Y.; Li, Z.; Zhai, M.; Yang, W.; Lin, J.; Sun, Y. Towards evidence-based fire prevention policy: Uncovering drivers of urban residential fire spread via explainable machine learning. Dev. Built Environ. 2025, 24, 100761. [Google Scholar] [CrossRef]
- Aven, T.; Zio, E. Some considerations on the treatment of uncertainties in risk assessment for practical decision-making. Reliab Eng. Syst. Saf. 2011, 96(1), 64–74. [Google Scholar] [CrossRef]
- Salvatier, J.; Wiecki, T.V.; Fonnesbeck, C. Probabilistic programming in Python using PyMC3. PeerJ Comput Sci. 2016, 2, e55. [Google Scholar] [CrossRef]
- Chen, T.; Guestrin, C. XGBoost: a scalable tree boosting system. In Proceedings of the 22nd ACM SIGKDD International Conference, 2016; pp. 785–94. [Google Scholar] [CrossRef]
- Lundberg, S.M.; Erion, G.; Chen, H.; DeGrave, A.; Prutkin, J.M.; Nair, B.; et al. From local explanations to global understanding with explainable AI for trees. Nat. Mach. Intell. 2020, 2, 56–67. [Google Scholar] [CrossRef] [PubMed]
- Ankan, A.; Panda, A. pgmpy: probabilistic graphical models using Python. In Proceedings of the 14th Python in Science Conference (SciPy 2015), 2015; pp. 6–11. [Google Scholar]
- BSI Standards. PD 7974-7:2019 Application of Fire Safety Engineering Principles to the Design of Buildings — Part 7: Probabilistic Risk Assessment. British Standards Institution: London, 2019.
Figure 1.
Framework overview: T-H-O-Risk extended with MCMC posterior estimation and SHAP attribution pipeline.
Figure 1.
Framework overview: T-H-O-Risk extended with MCMC posterior estimation and SHAP attribution pipeline.
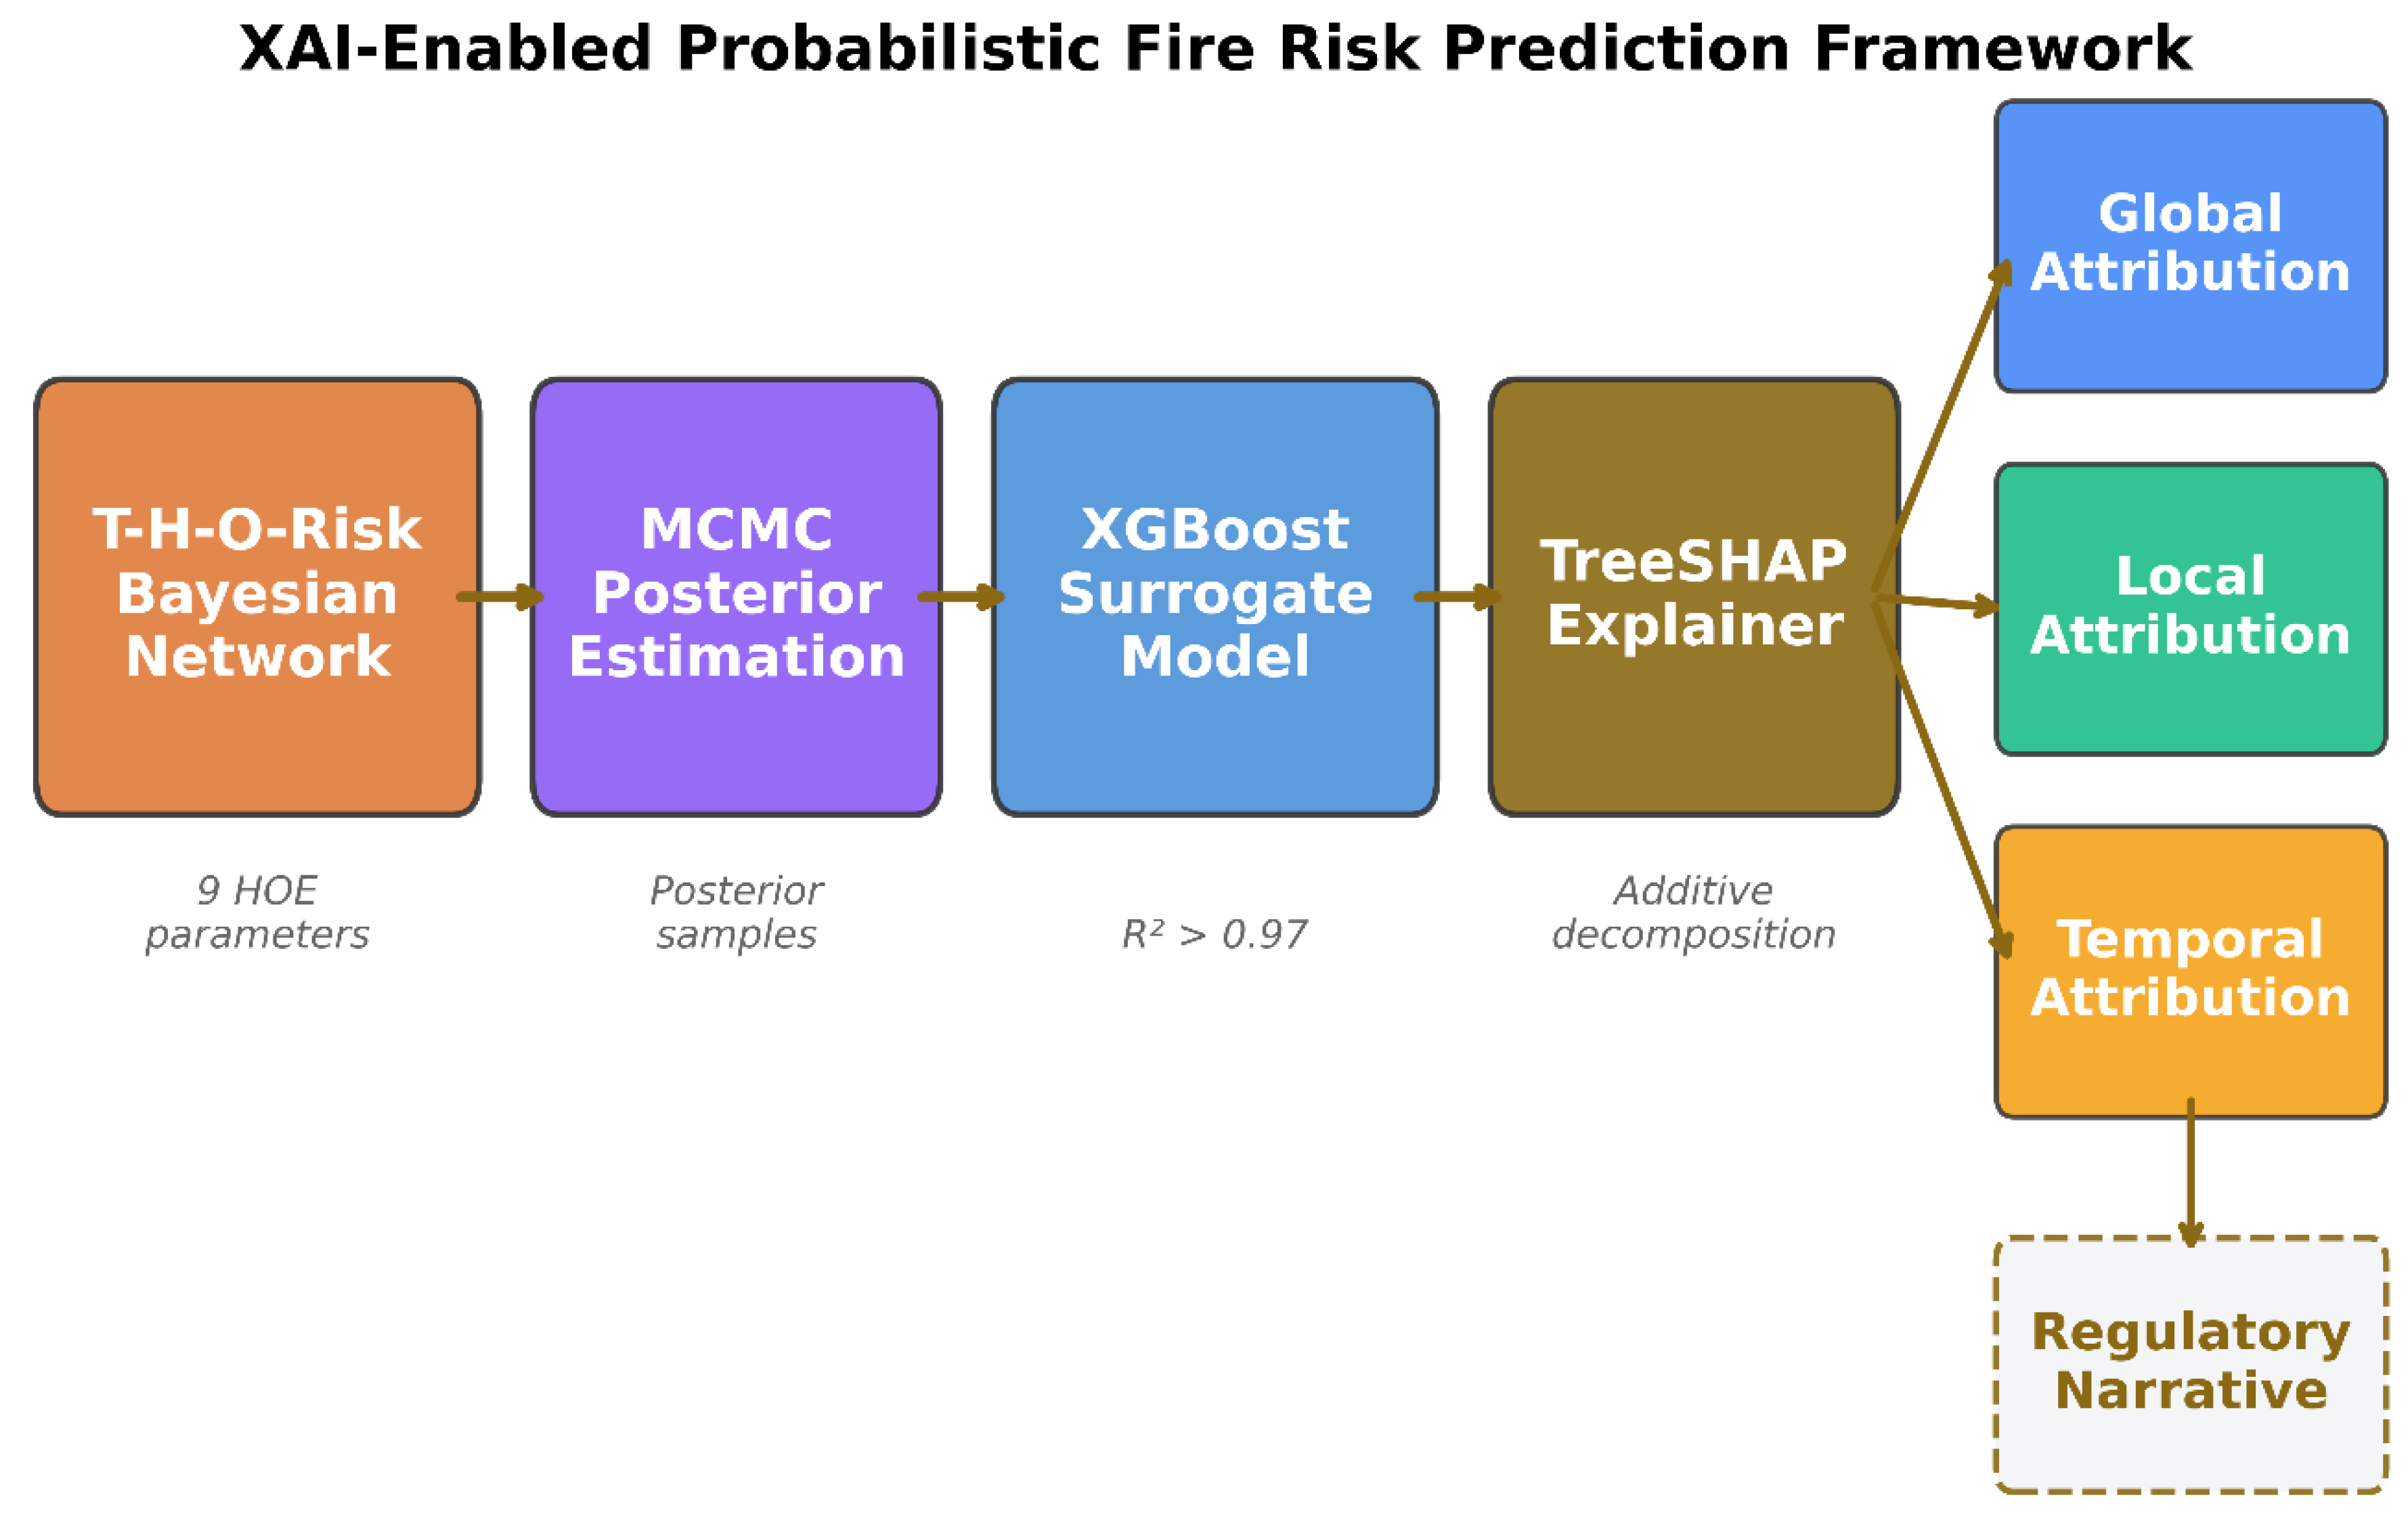
Figure 2.
Bayesian network node structure for the T-H-O-Risk model showing HOE basic events, intermediate nodes, and active fire safety system outputs.
Figure 2.
Bayesian network node structure for the T-H-O-Risk model showing HOE basic events, intermediate nodes, and active fire safety system outputs.
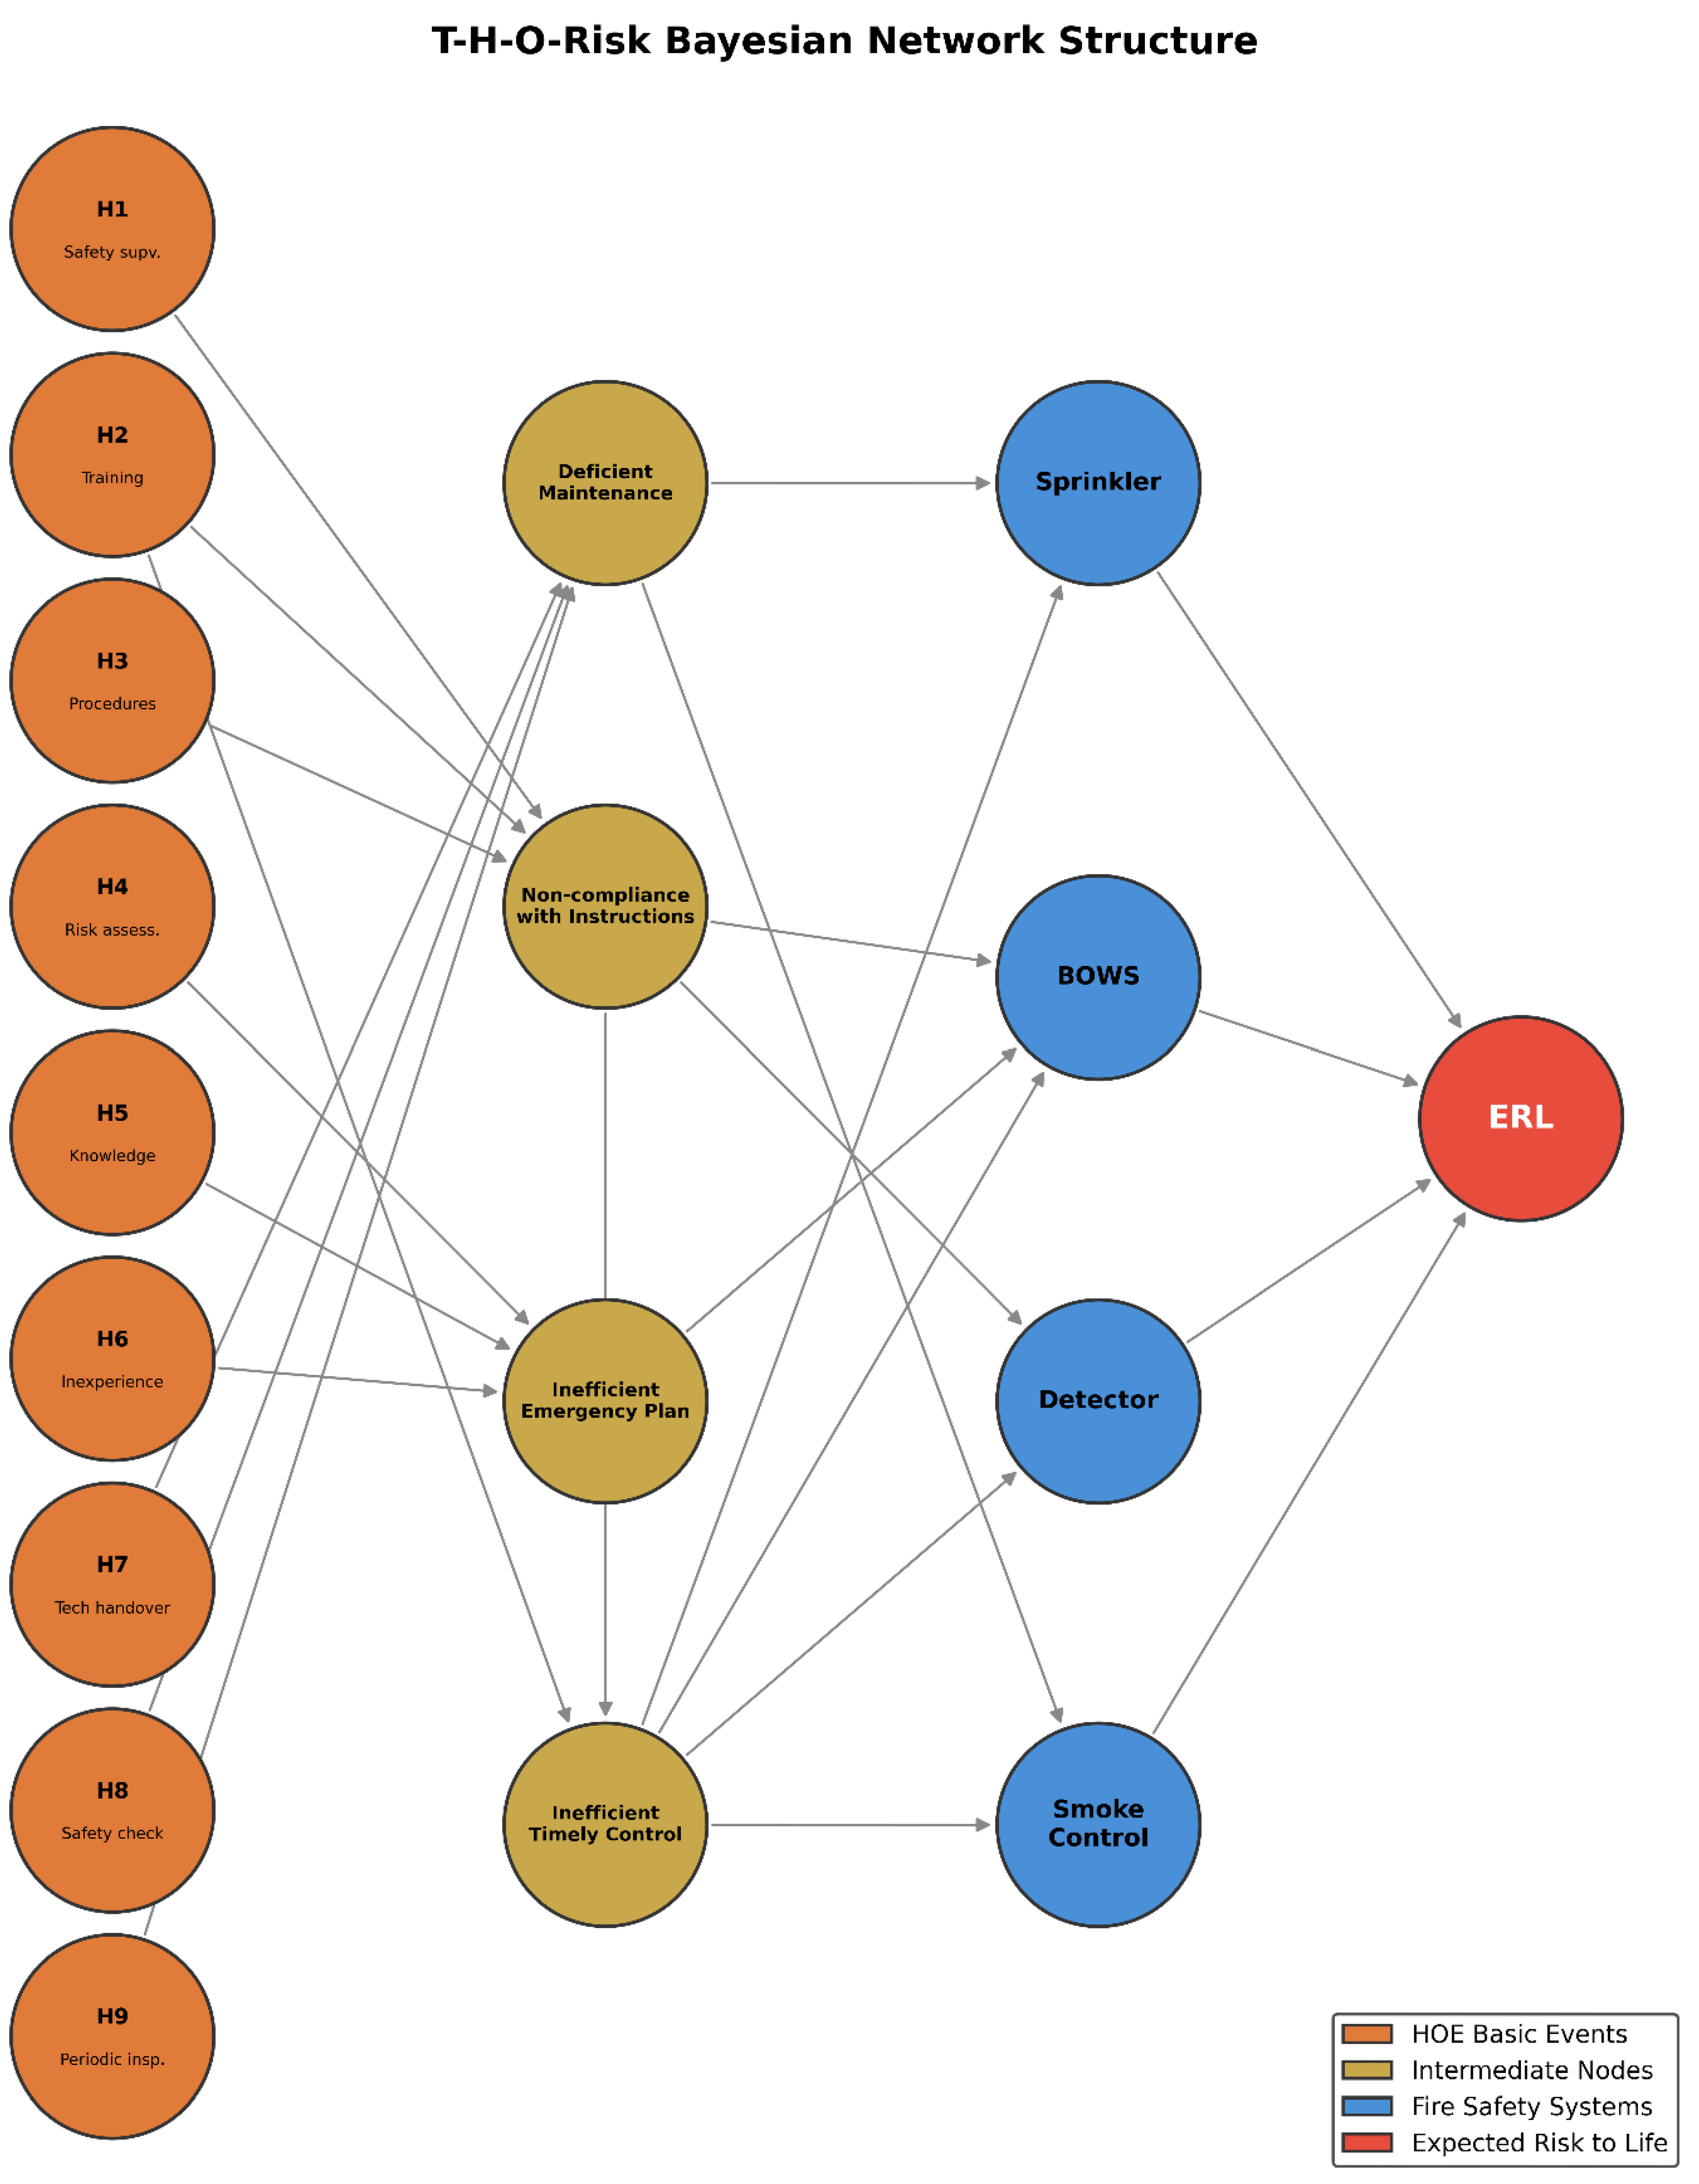
Figure 4.
SHAP beeswarm summary plot. Each point represents a building-design combination. X-axis: SHAP value (contribution to ERL); Y-axis: HOE feature ordered by mean |SHAP|; colour: feature value (red = high, blue = low).
Figure 4.
SHAP beeswarm summary plot. Each point represents a building-design combination. X-axis: SHAP value (contribution to ERL); Y-axis: HOE feature ordered by mean |SHAP|; colour: feature value (red = high, blue = low).
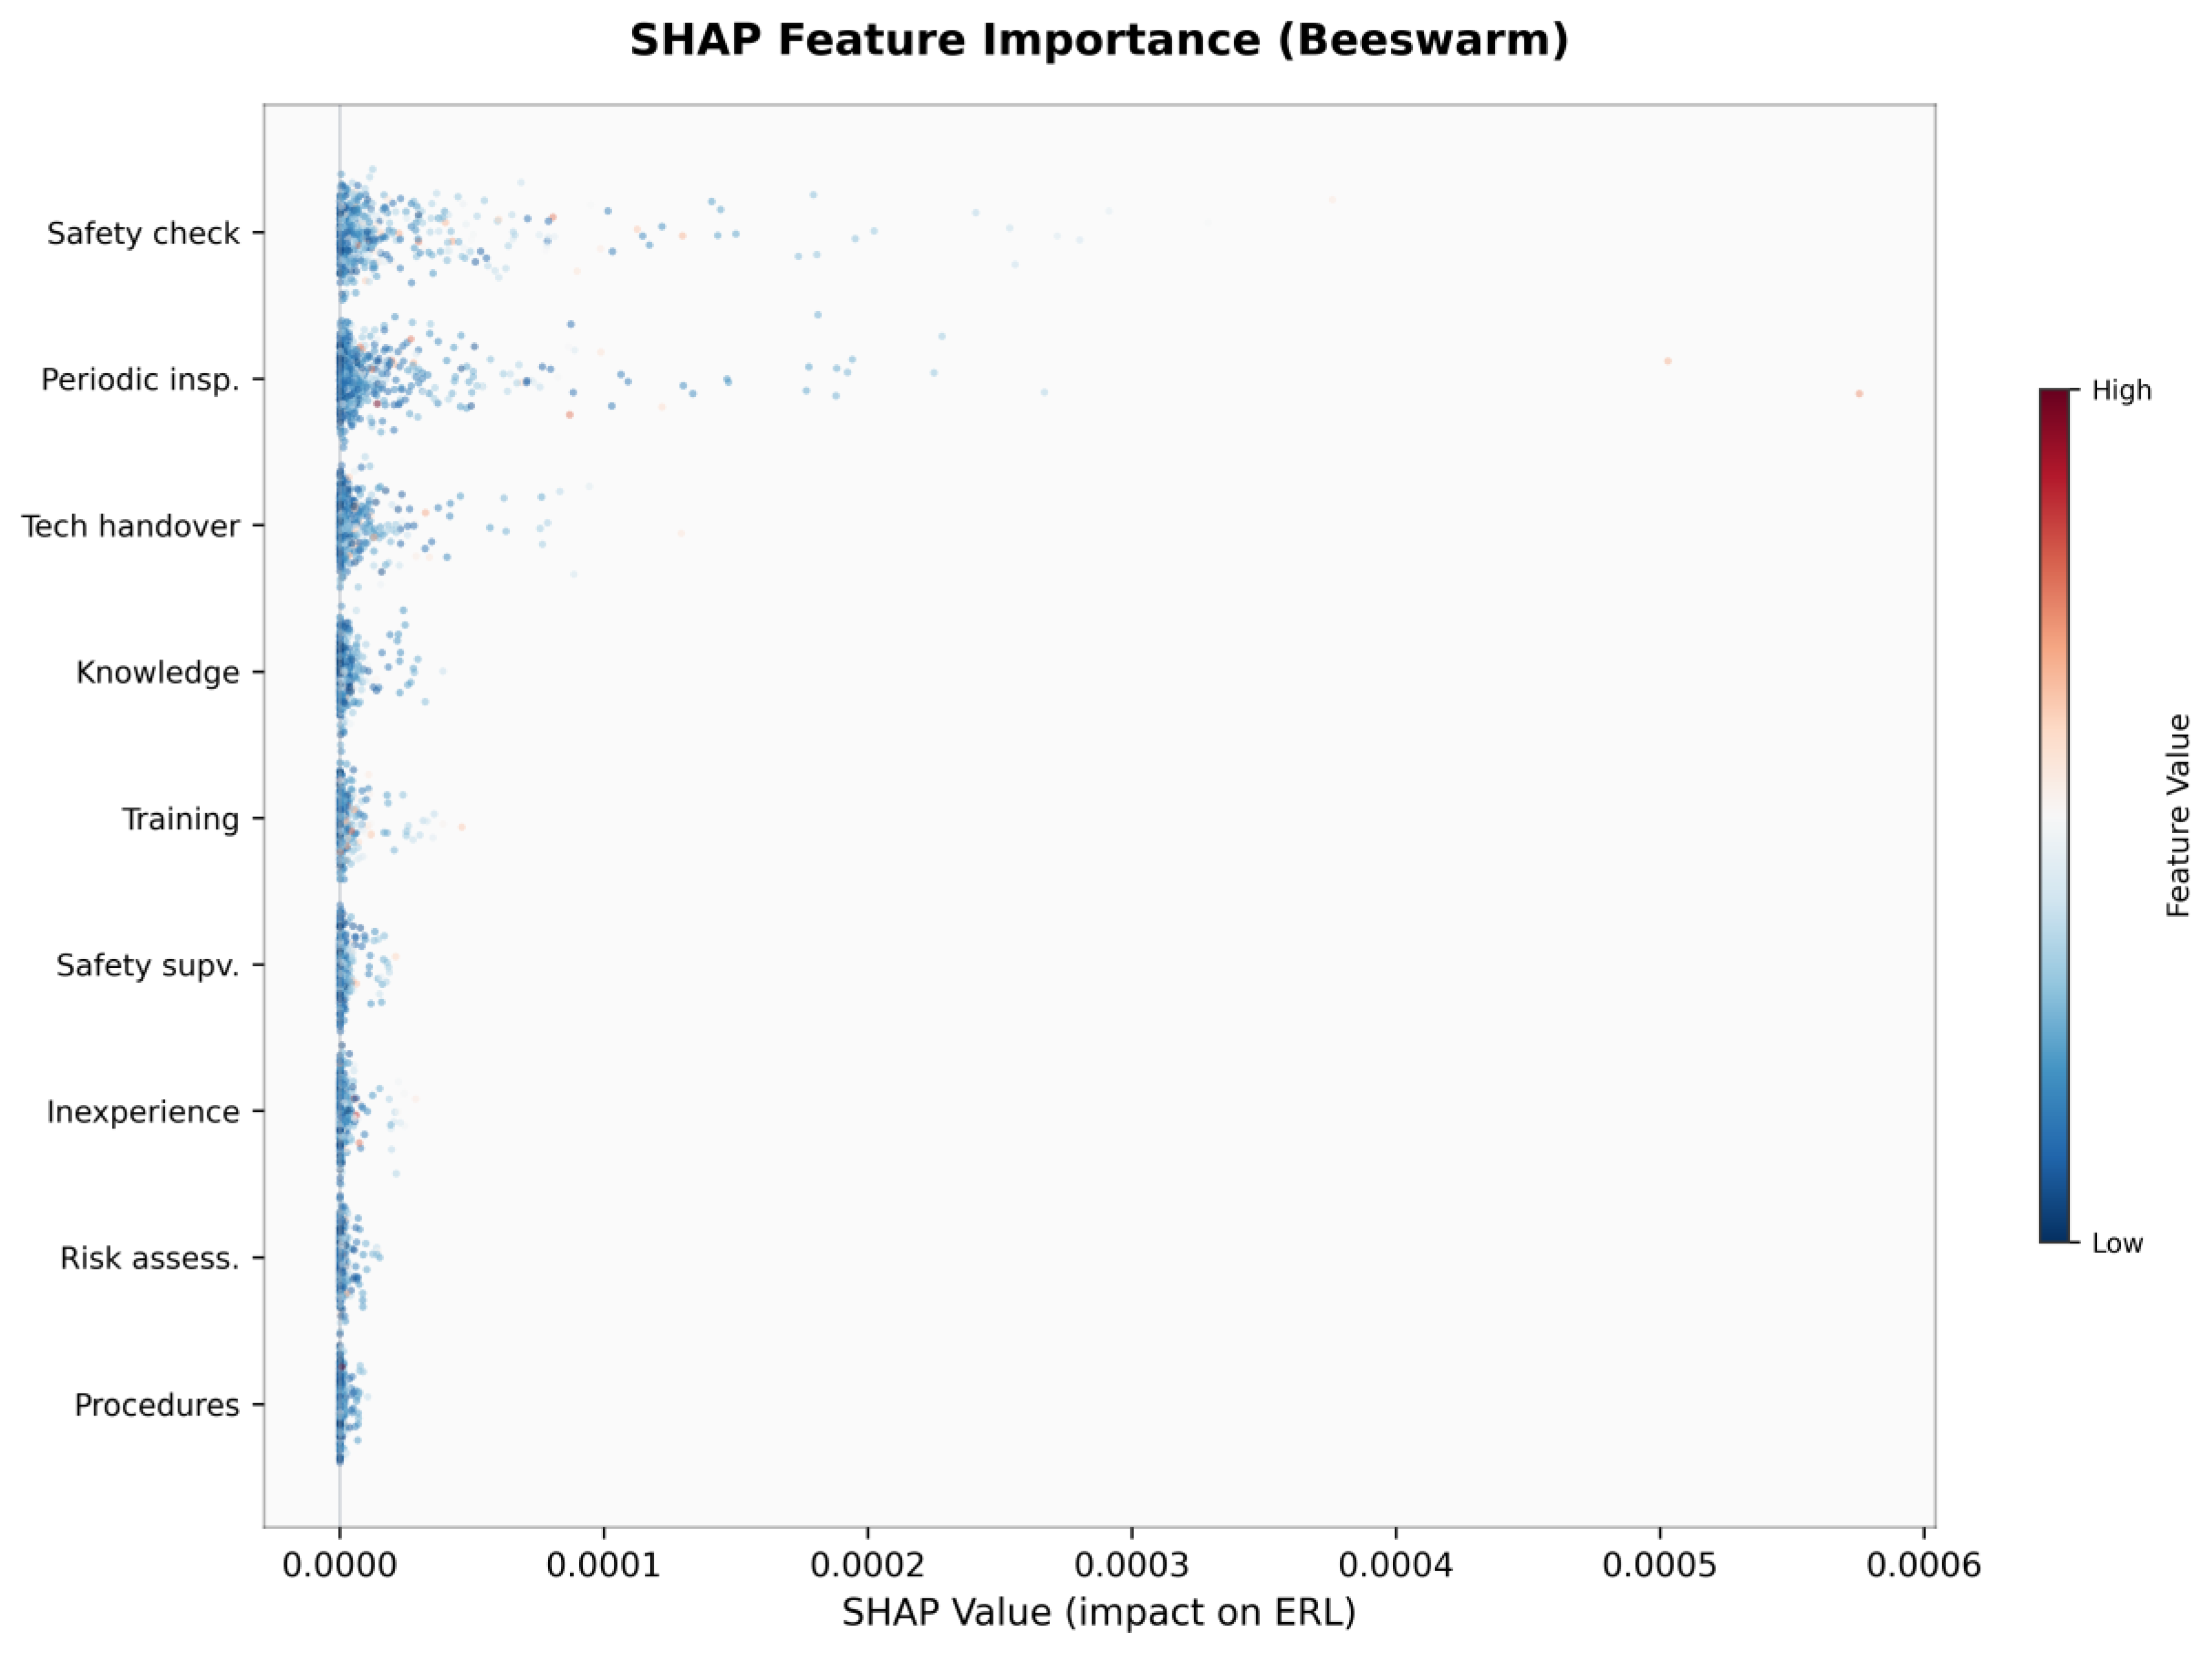
Figure 9.
HOE risk amplification bar chart (log scale): total absolute SHAP per trial design TD01–TD16. Demonstrates ~17× amplification from full-system to no-system configuration. BSI PD 7974-7 tolerability thresholds annotated.
Figure 9.
HOE risk amplification bar chart (log scale): total absolute SHAP per trial design TD01–TD16. Demonstrates ~17× amplification from full-system to no-system configuration. BSI PD 7974-7 tolerability thresholds annotated.
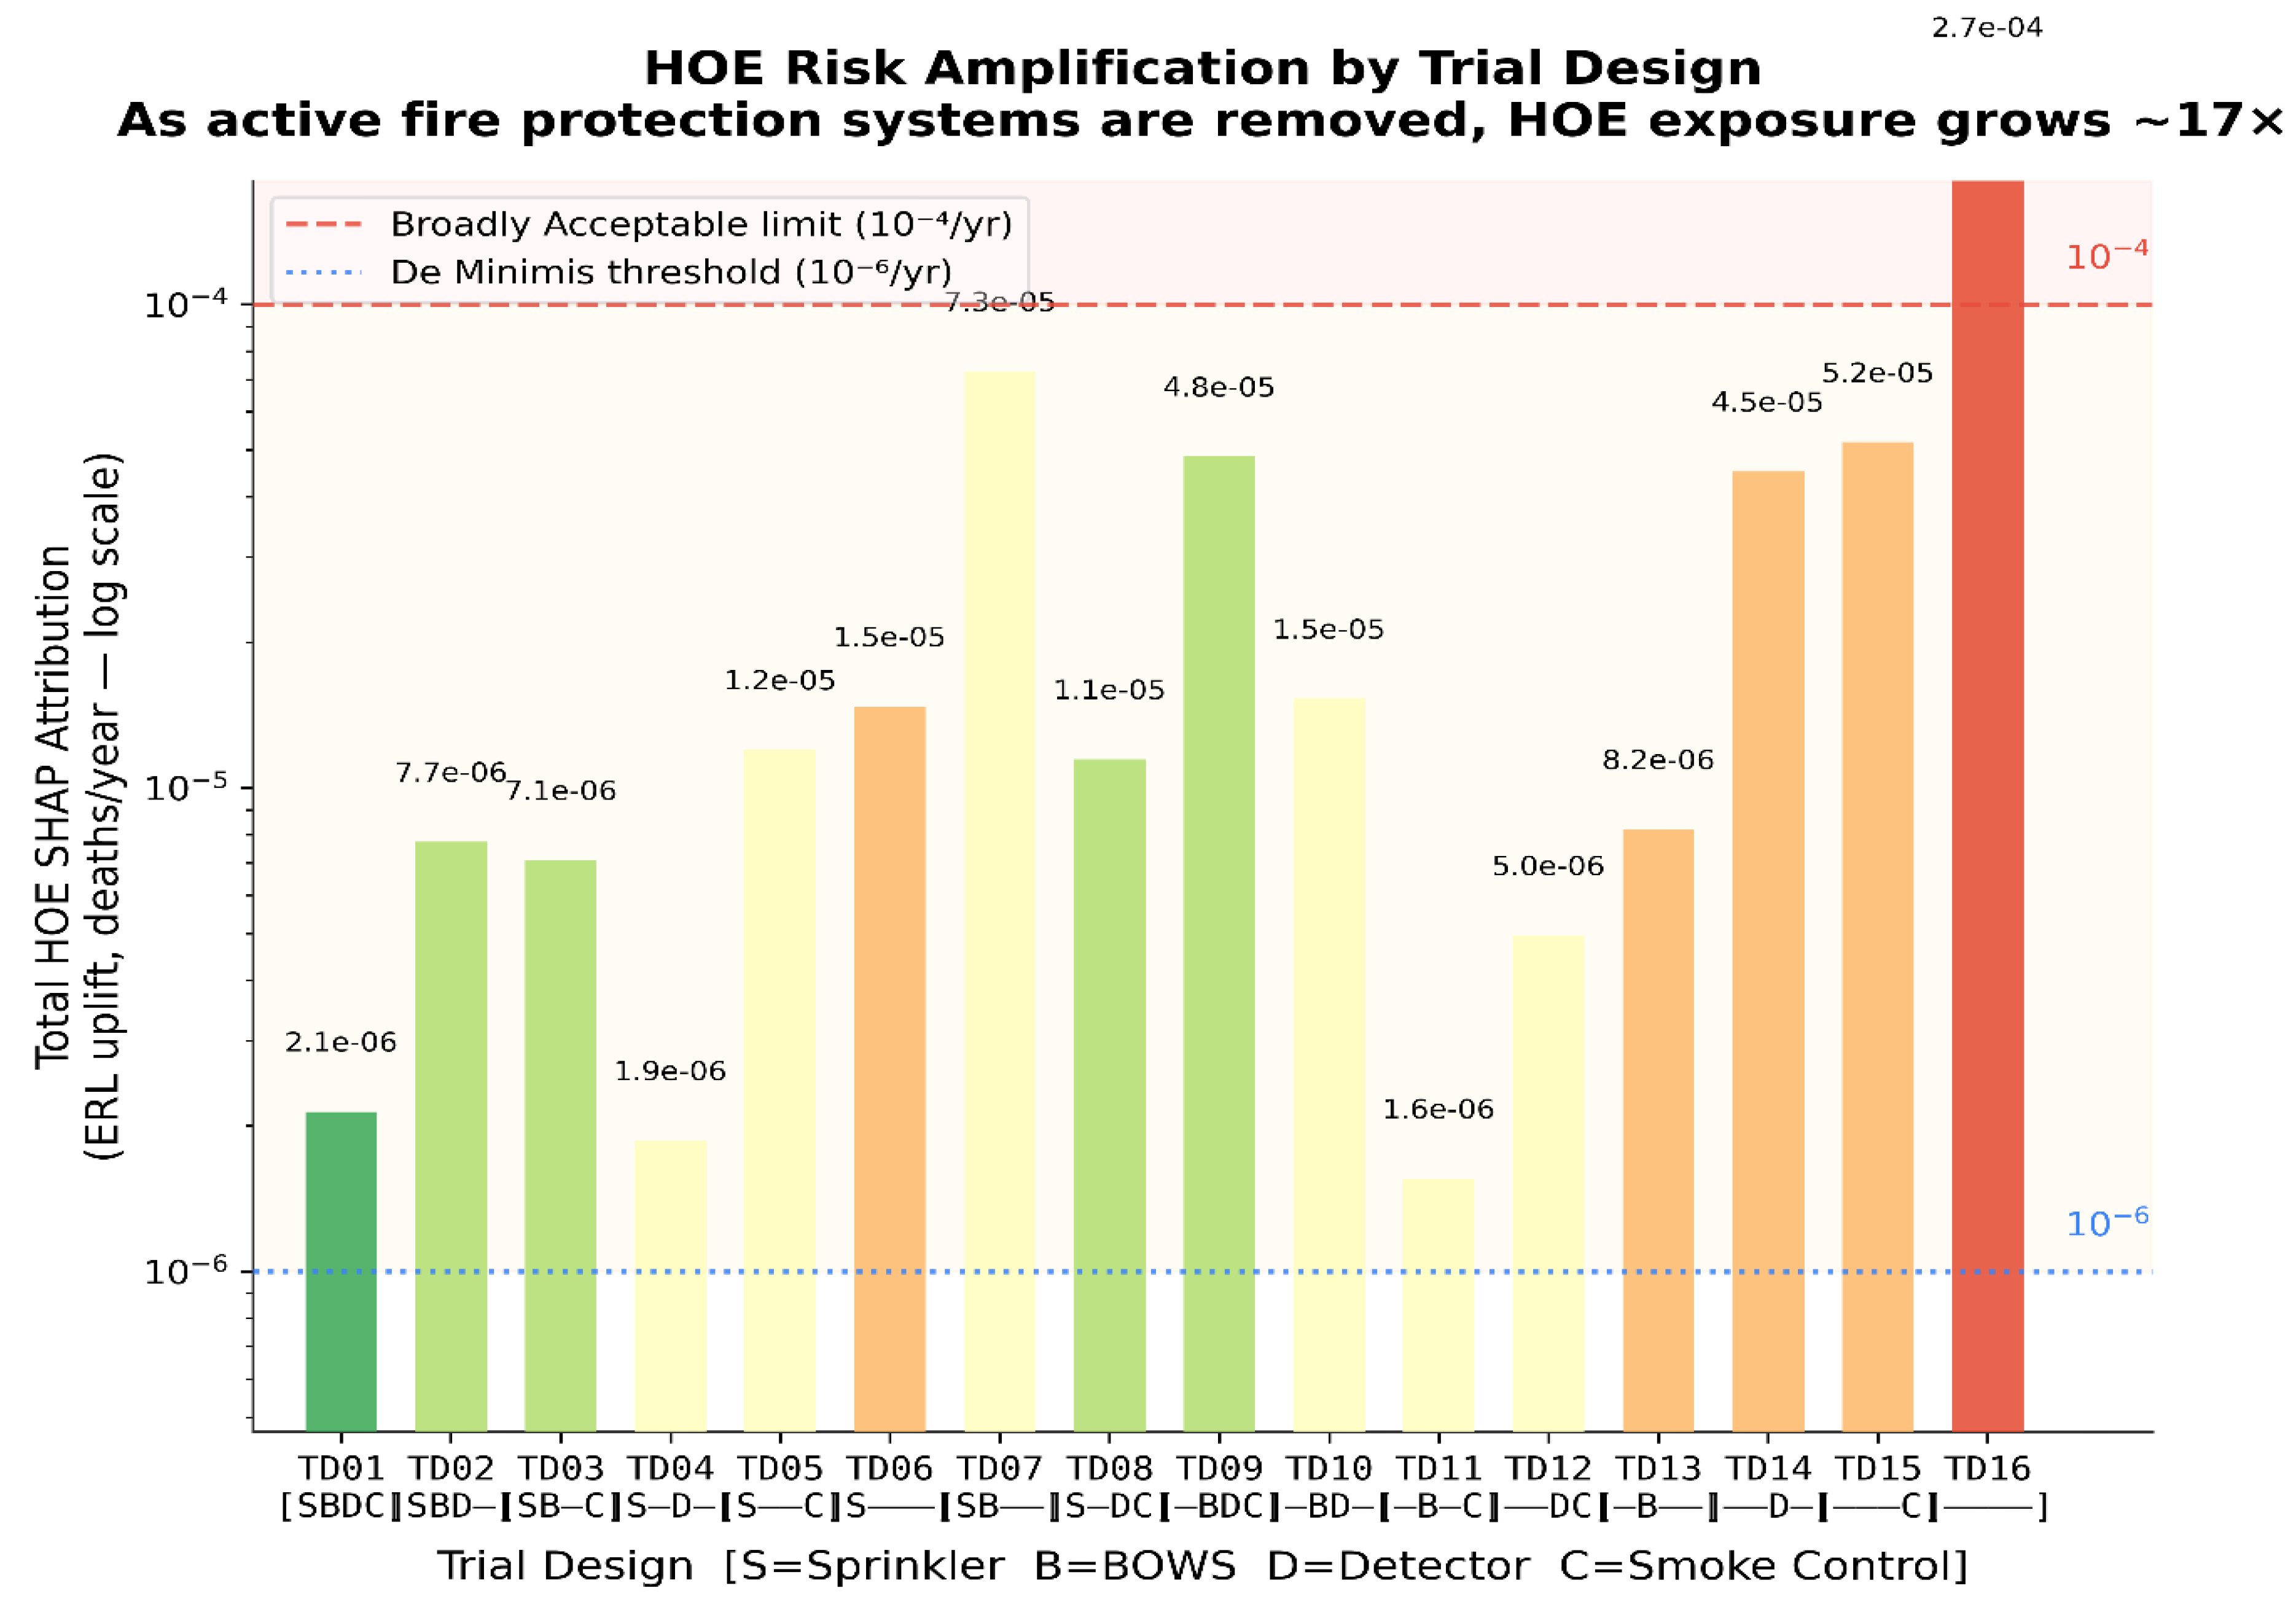
Figure 12.
a. TD01 (full active systems) — F-N curves for Cases 4 and 7 (buildings exceeding BSI PD 7974-7 tolerability limits). Three curves per case: original HOE condition, SHAP-guided single intervention (H8), SHAP-guided combined intervention (H8+H9). b. F-N curves for TD04 (sprinkler and detector only; waiver scenario) — Cases #1 to #7. noHOE (solid), HOE (dotted), fullHOE (dashed) variants. Compare with Figure 12a (TD01, full active systems).
Figure 12.
a. TD01 (full active systems) — F-N curves for Cases 4 and 7 (buildings exceeding BSI PD 7974-7 tolerability limits). Three curves per case: original HOE condition, SHAP-guided single intervention (H8), SHAP-guided combined intervention (H8+H9). b. F-N curves for TD04 (sprinkler and detector only; waiver scenario) — Cases #1 to #7. noHOE (solid), HOE (dotted), fullHOE (dashed) variants. Compare with Figure 12a (TD01, full active systems).
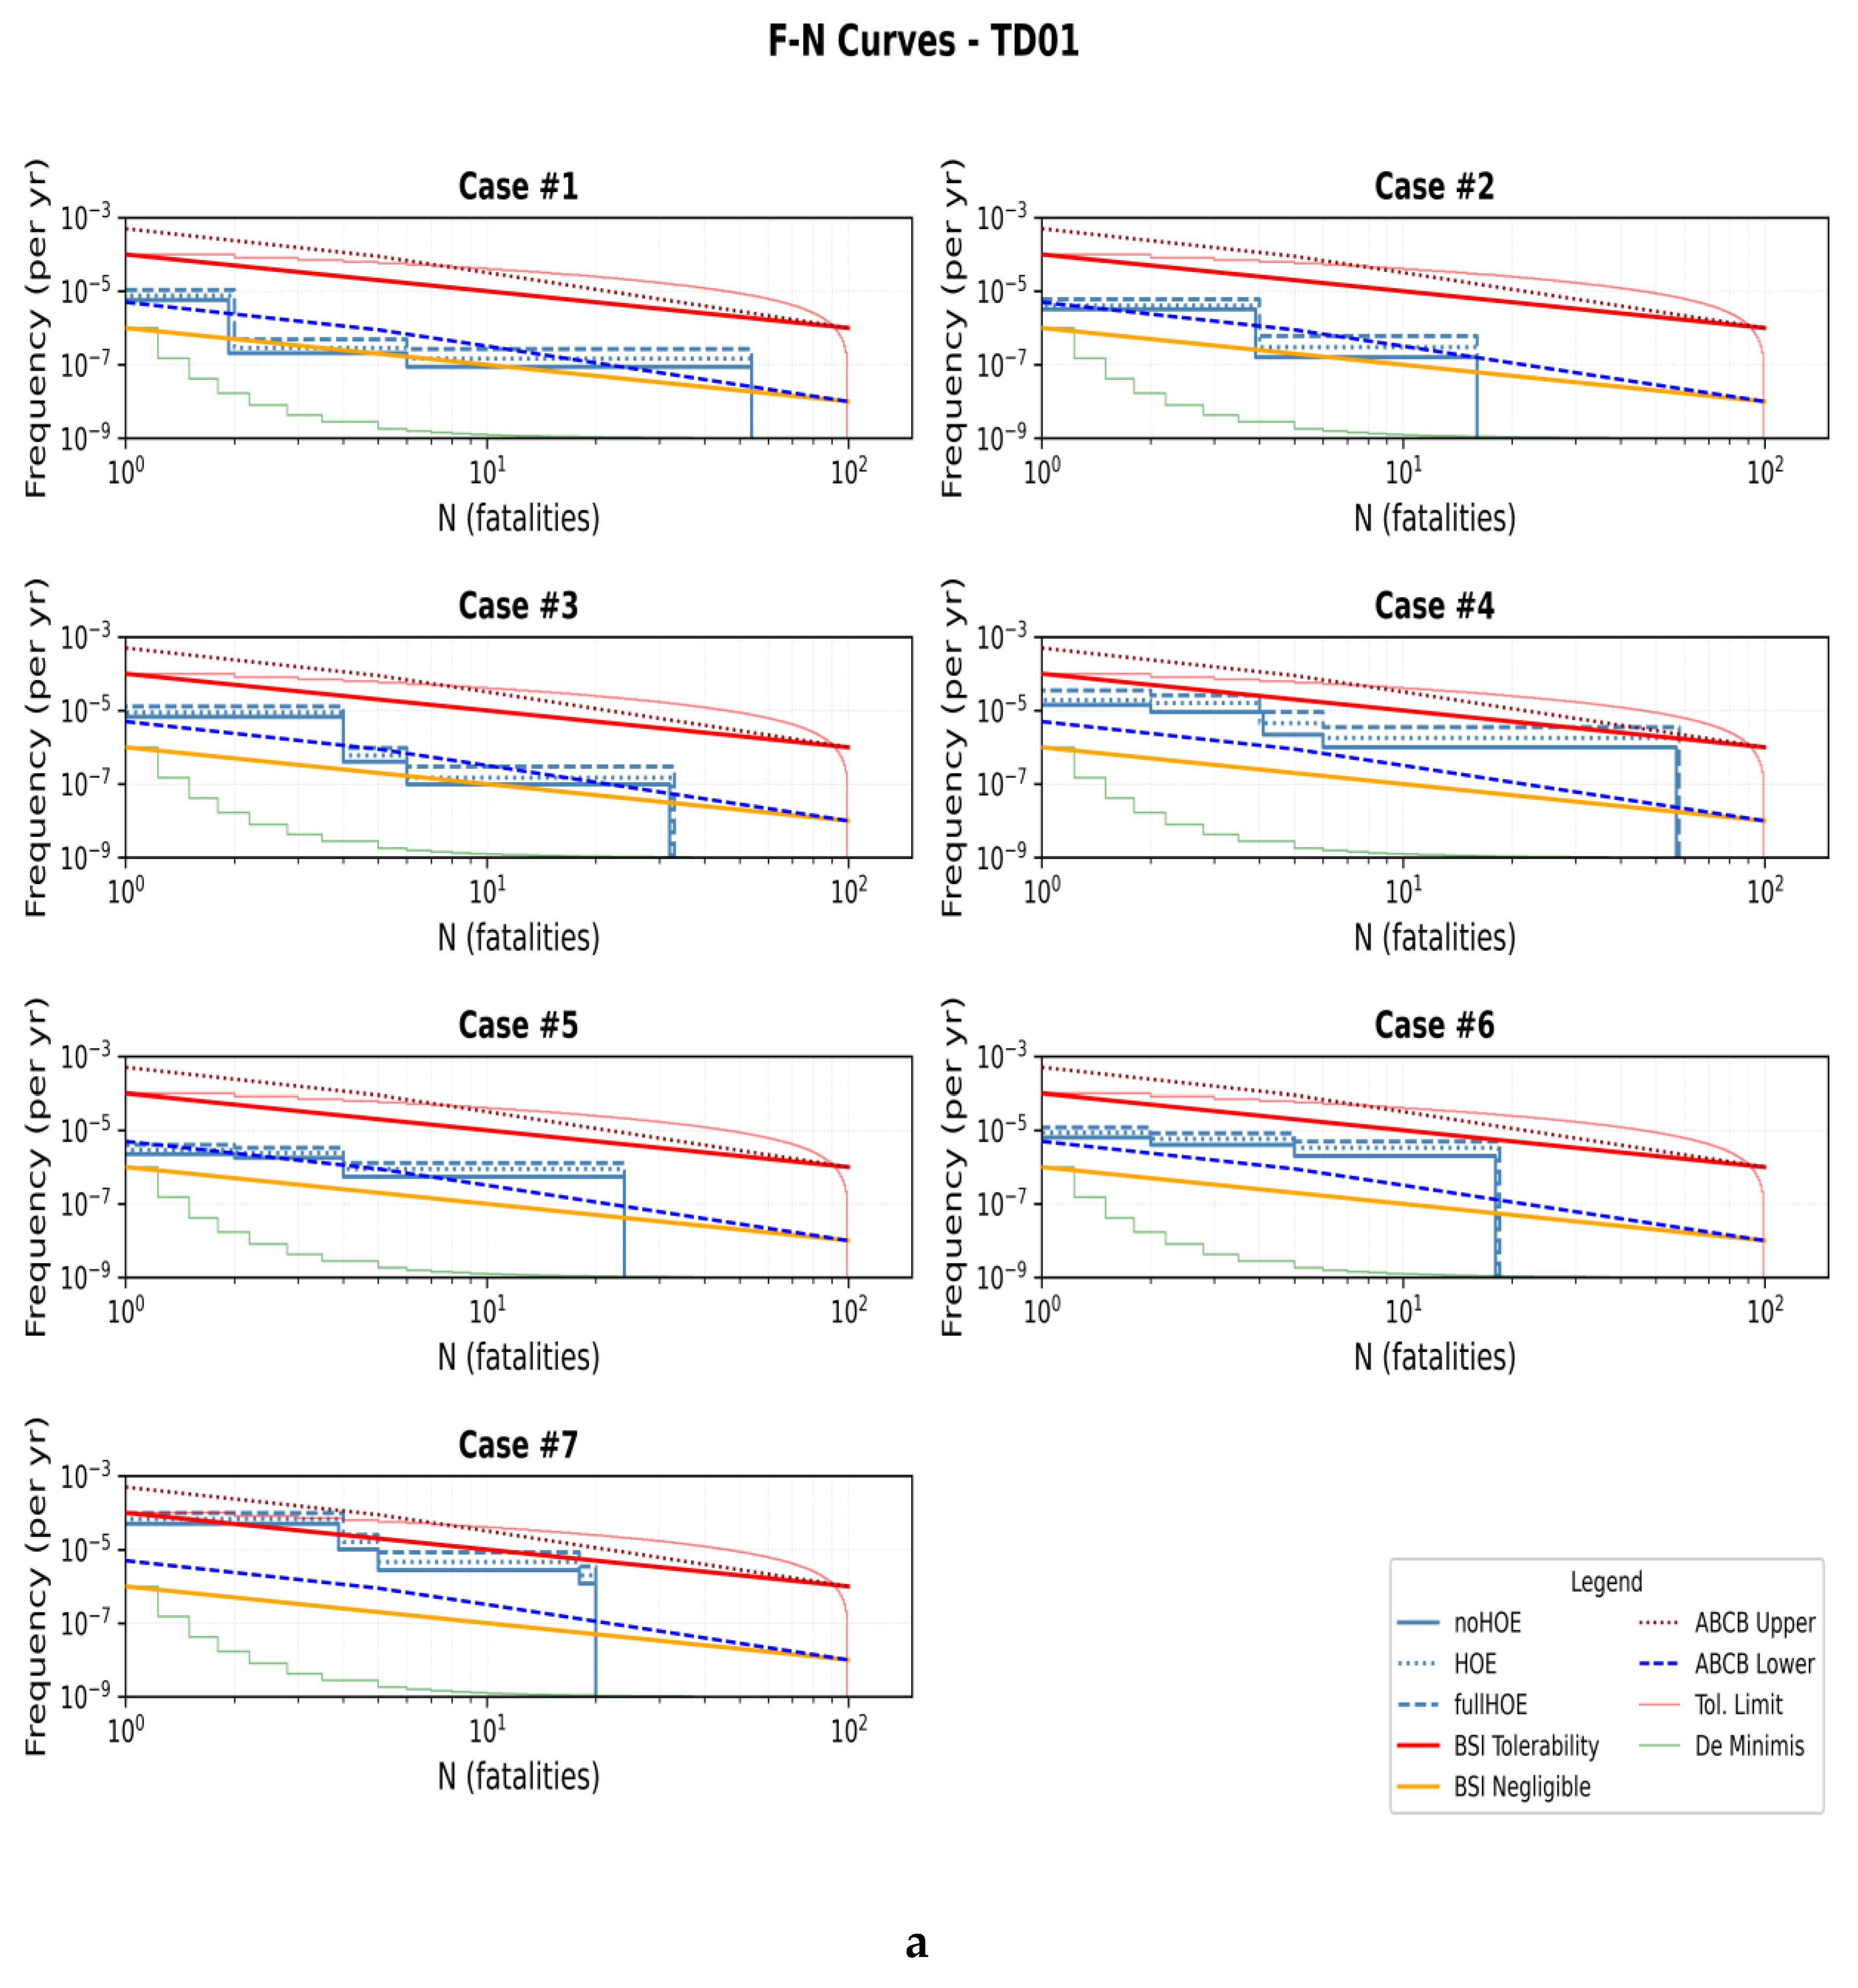
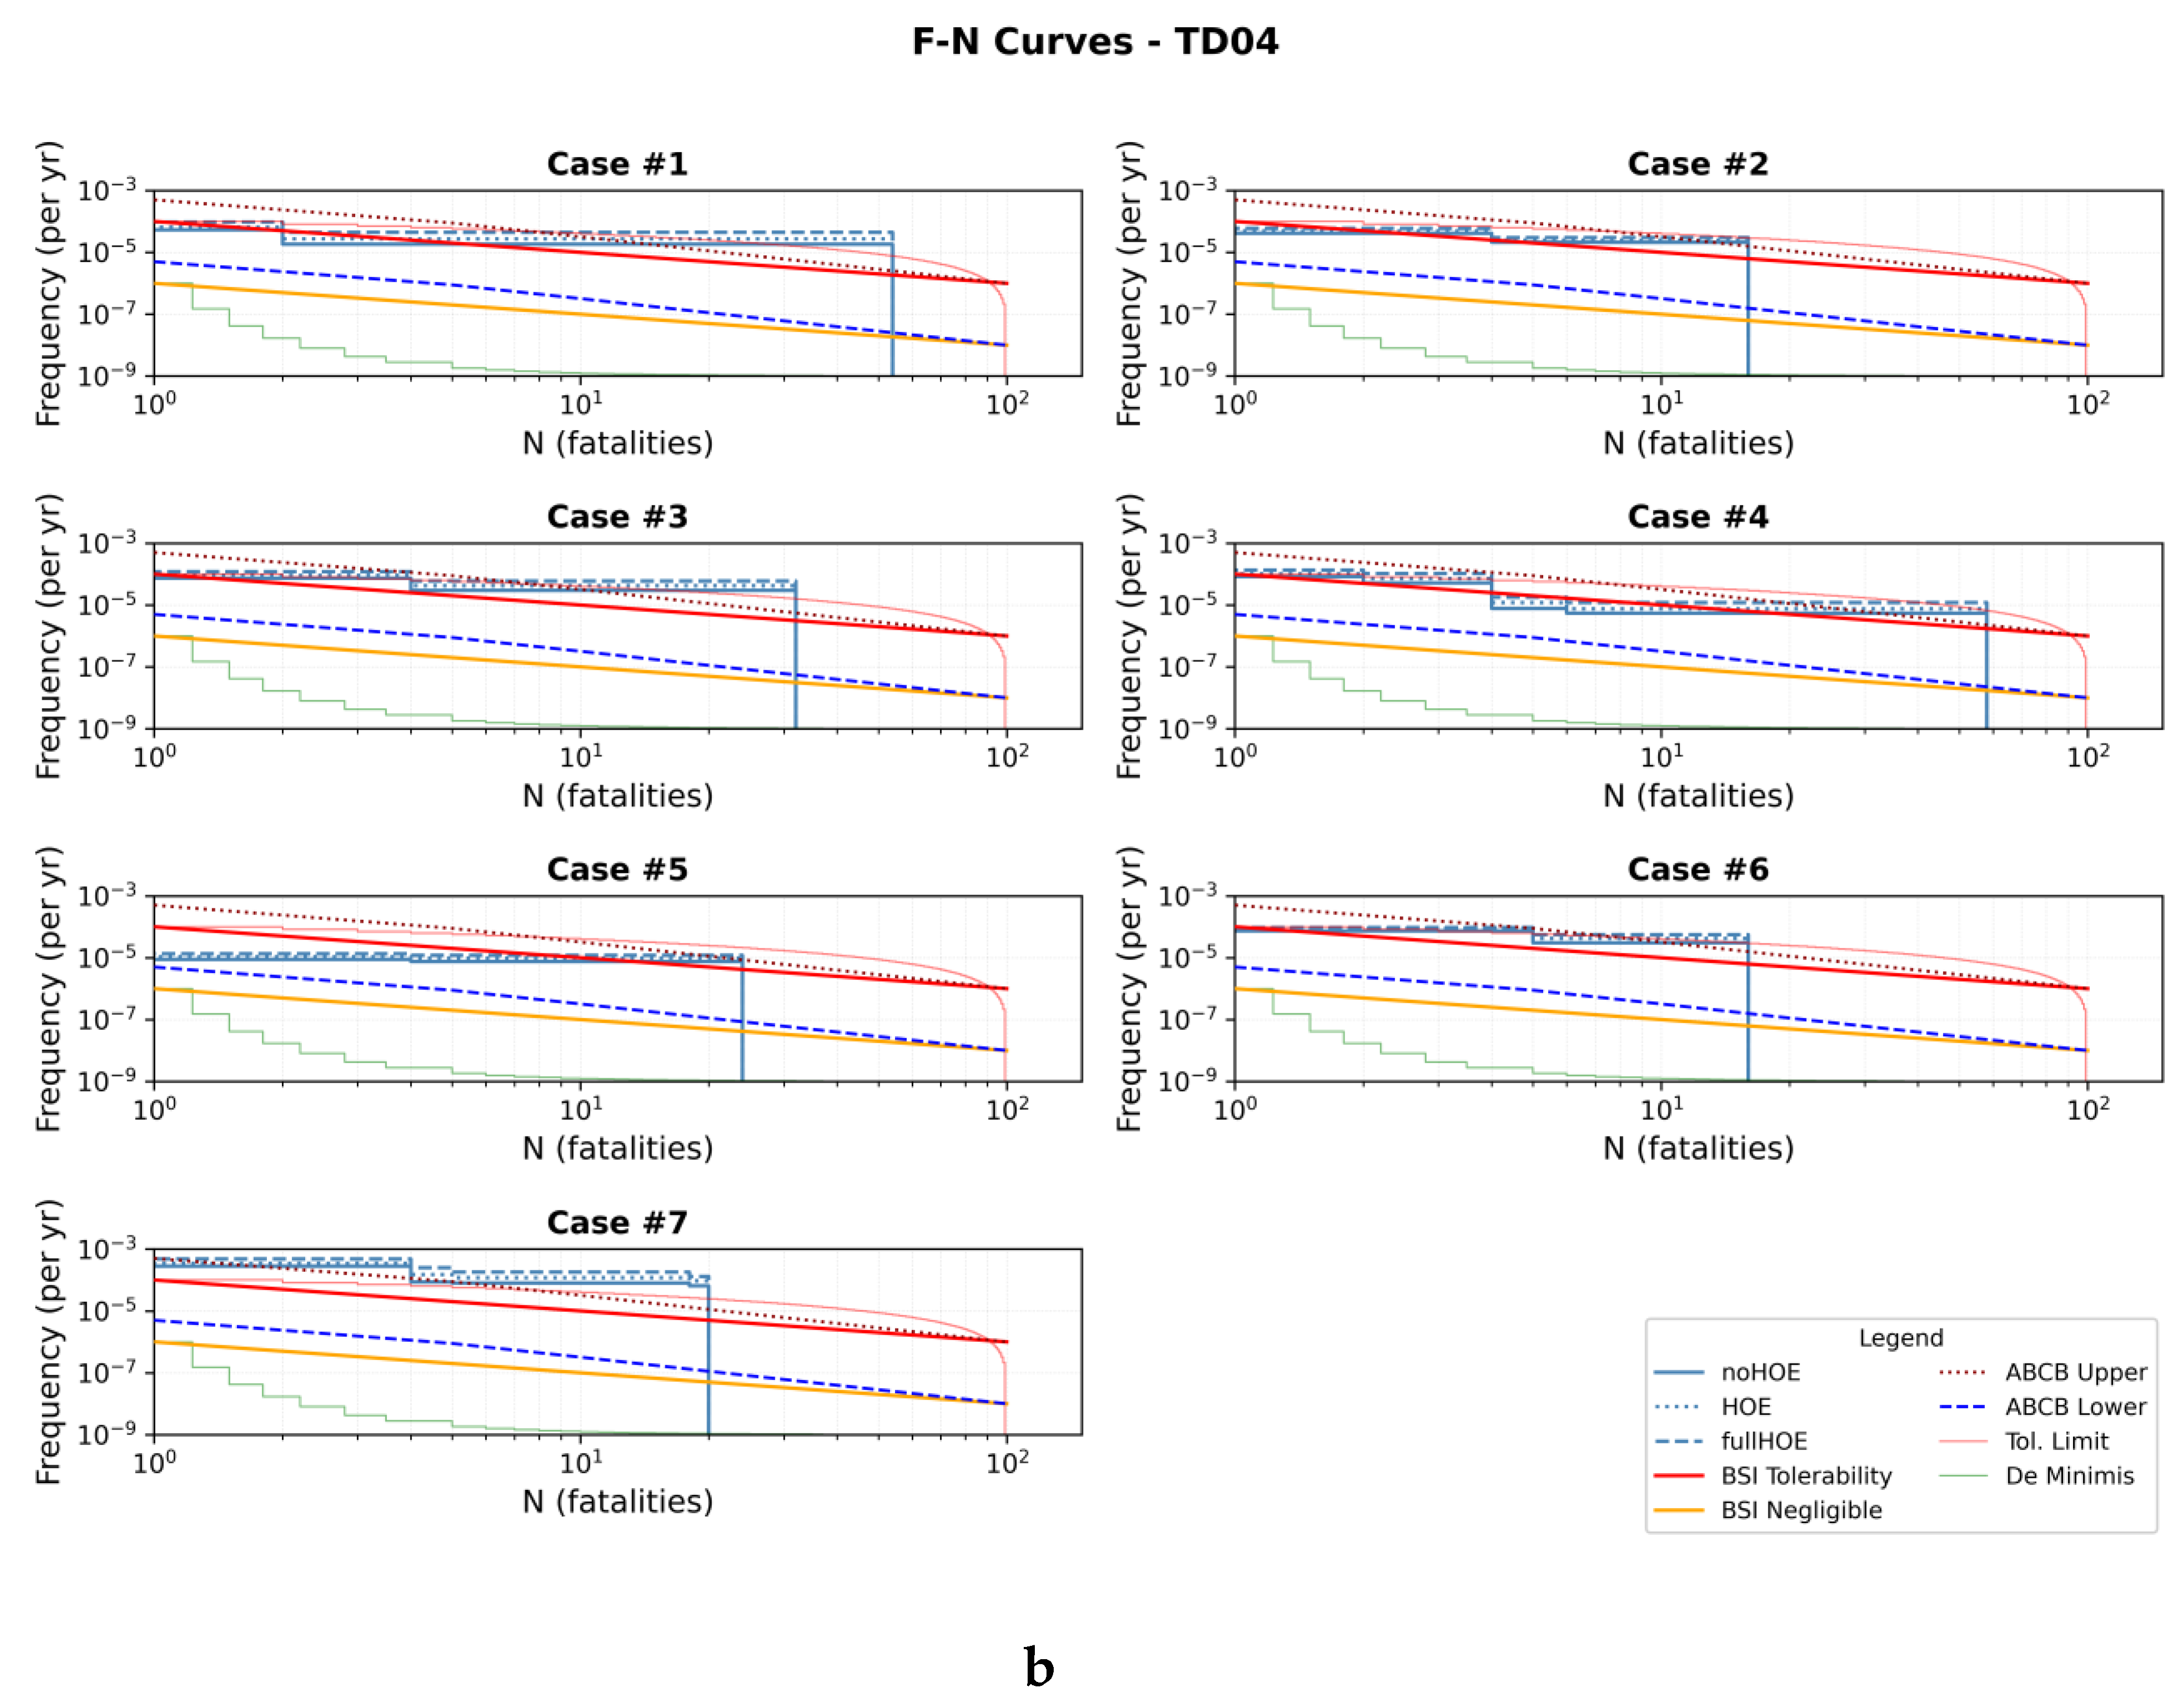
Table 1.
Event tree node probabilities (Tan et al., 2021, Section 3.3).
Table 1.
Event tree node probabilities (Tan et al., 2021, Section 3.3).
| Event Node | Failure/Occurrence Probability |
|---|---|
| Fire originating in concealed space | 0.20 |
| Fire originating in sole-occupancy unit or corridor | 0.80 |
| Challenging fire development (peak HRR > 5 MW) | 0.45 |
| Smouldering fire development | 0.55 |
| Failure of fire detection system | 0.10 |
| Failure of sprinkler system | 0.10 |
| Failure of building alarm system | 0.10 |
| Blocked exit (egress failure) | 0.20 |
Table 2.
HOE basic event failure probabilities (Tan et al., 2020, Table 1).
Table 2.
HOE basic event failure probabilities (Tan et al., 2020, Table 1).
| Code | HOE Basic Event | Failure Probability |
|---|---|---|
| H1 | Poor safety supervision | 4.60 × 10⁻⁴ |
| H2 | Deficient training | 1.89 × 10⁻³ |
| H3 | Not following procedures | 1.70 × 10⁻⁴ |
| H4 | Deficient risk assessment | 1.80 × 10⁻⁴ |
| H5 | Deficient knowledge | 1.89 × 10⁻³ |
| H6 | Inexperience | 1.10 × 10⁻³ |
| H7 | Insufficient technical handover | 6.30 × 10⁻³ |
| H8 | Insufficient safety check | 2.50 × 10⁻² |
| H9 | Inadequate periodic inspection | 2.50 × 10⁻² |
Table 3.
Design fire parameters (Tan et al., 2020, Table 5).
Table 3.
Design fire parameters (Tan et al., 2020, Table 5).
| Design Fire | Sprinkler Active | Growth Rate (kW/s²) | Peak HRR (kW) | Fuel Load (MJ/m²) |
|---|---|---|---|---|
| Apartment fire | Yes | 0.0117 | 197.0 | 800 |
| Apartment fire | No | 0.0117 | 5,000 | 800 |
| Corridor fire | Yes | 0.0117 | 197.0 | 75.0 |
| Corridor fire | No | 0.0117 | 300.0 | 75.0 |
Table 4.
Singapore residential ignition frequency, post-2019 series.
| Year | Residential Fires | GFA (m²) | Ignition Frequency (fires/m²/year) |
|---|---|---|---|
| 2019 | 1,168 | 145,593,783 | 8.02 × 10⁻⁶ |
| 2020 | 1,054 | 146,686,289 | 7.19 × 10⁻⁶ |
| 2021 | 1,010 | 148,052,330 | 6.82 × 10⁻⁶ |
| 2022 | 935.0 | 149,621,295 | 6.25 × 10⁻⁶ |
| 2023 | 970.0 | 152,000,000 | 6.38 × 10⁻⁶ |
Table 5.
MCMC posterior summary for HOE basic event probability parameters.
| HOE | Prior Point Est. | Posterior Mean | 5th Pct. | 95th Pct. | R-hat |
|---|---|---|---|---|---|
| H1 | 4.60×10⁻⁴ | 4.62×10⁻⁴ | 8.84×10⁻⁵ | 1.08×10⁻³ | 1.000 |
| H2 | 1.89×10⁻³ | 1.89×10⁻³ | 3.57×10⁻⁴ | 4.52×10⁻³ | 1.000 |
| H3 | 1.70×10⁻⁴ | 1.67×10⁻⁴ | 3.06×10⁻⁵ | 3.94×10⁻⁴ | 1.000 |
| H4 | 1.80×10⁻⁴ | 1.82×10⁻⁴ | 3.08×10⁻⁵ | 4.39×10⁻⁴ | 1.000 |
| H5 | 1.89×10⁻³ | 1.92×10⁻³ | 3.40×10⁻⁴ | 4.52×10⁻³ | 1.000 |
| H6 | 1.10×10⁻³ | 1.07×10⁻³ | 1.90×10⁻⁴ | 2.54×10⁻³ | 1.000 |
| H7 | 6.30×10⁻³ | 6.25×10⁻³ | 1.18×10⁻³ | 1.48×10⁻² | 1.000 |
| H8 | 2.50×10⁻² | 2.55×10⁻² | 5.92×10⁻³ | 5.69×10⁻² | 1.000 |
| H9 | 2.50×10⁻² | 2.47×10⁻² | 5.88×10⁻³ | 5.48×10⁻² | 1.000 |
Table 6.
Global SHAP feature importance ranking — mean absolute SHAP values (ERL contribution, deaths/year).
Table 6.
Global SHAP feature importance ranking — mean absolute SHAP values (ERL contribution, deaths/year).
| Rank | HOE Feature | Mean |SHAP| | Category | Tan et al. [8,9] Sensitivity Rank |
|---|---|---|---|---|
| 1 | H8 — Insufficient safety check | 1.295 × 10⁻⁵ | Maintenance | 8 |
| 2 | H9 — Inadequate periodic inspection | 1.293 × 10⁻⁵ | Maintenance | 9 |
| 3 | H7 — Insufficient technical handover | 3.947 × 10⁻⁶ | Maintenance | 7 |
| 4 | H5 — Deficient knowledge | 1.694 × 10⁻⁶ | Training | 5 |
| 5 | H2 — Deficient training | 1.381 × 10⁻⁶ | Training | 2 |
| 6 | H1 — Poor safety supervision | 9.638 × 10⁻⁷ | Compliance | 6 |
| 7 | H6 — Inexperience | 9.355 × 10⁻⁷ | Training | 4 |
| 8 | H4 — Deficient risk assessment | 6.544 × 10⁻⁷ | Organizational | 3 |
| 9 | H3 — Not following procedures | 4.309 × 10⁻⁷ | Compliance | 1 |
Table 7.
Local SHAP attribution for Case 2, TD01 — Singapore.
| Rank | HOE Feature | Category | SHAP Value (deaths/yr) | % of Total HOE |
|---|---|---|---|---|
| 1 | H8 — Insufficient safety check | Maintenance | 3.33 × 10⁻⁷ | 36.1 |
| 2 | H9 — Inadequate periodic inspection | Maintenance | 3.33 × 10⁻⁷ | 36.0 |
| 3 | H7 — Insufficient technical handover | Maintenance | 1.02 × 10⁻⁷ | 11.0 |
| 4 | H5 — Deficient knowledge | Training | 4.36 × 10⁻⁸ | 4.70 |
| 5 | H2 — Deficient training | Training | 3.55 × 10⁻⁸ | 3.80 |
| 6 | H1 — Poor safety supervision | Compliance | 2.48 × 10⁻⁸ | 2.70 |
| 7 | H6 — Inexperience | Training | 2.41 × 10⁻⁸ | 2.60 |
| 8 | H4 — Deficient risk assessment | Organizational | 1.68 × 10⁻⁸ | 1.80 |
| 9 | H3 — Not following procedures | Compliance | 1.11 × 10⁻⁸ | 1.20 |
| Total HOE attribution | 9.23 × 10⁻⁷ | 100 |
Table 8.
Temporal SHAP attribution — mean |SHAP| by year for top HOE features, Case 2 TD01.
| HOE | t = 1 yr | t = 3 yr | t = 5 yr | t = 7 yr | t = 10 yr |
|---|---|---|---|---|---|
| H8 | 1.755×10⁻⁷ | 2.025×10⁻⁷ | 1.968×10⁻⁷ | 1.651×10⁻⁷ | 1.257×10⁻⁷ |
| H9 | 1.751×10⁻⁷ | 2.018×10⁻⁷ | 1.962×10⁻⁷ | 1.648×10⁻⁷ | 1.253×10⁻⁷ |
| H7 | 4.391×10⁻⁸ | 5.057×10⁻⁸ | 4.912×10⁻⁸ | 4.131×10⁻⁸ | 3.164×10⁻⁸ |
| H5 | 1.266×10⁻⁸ | 1.464×10⁻⁸ | 1.432×10⁻⁸ | 1.192×10⁻⁸ | 8.970×10⁻⁹ |
| H2 | 1.535×10⁻⁸ | 1.777×10⁻⁸ | 1.717×10⁻⁸ | 1.439×10⁻⁸ | 1.084×10⁻⁸ |
Table 9.
Validation results — published ERL vs. MCMC posterior mean, TD01 with HOE.
| Case | Location | Published ERL (HOE) | MCMC Posterior Mean | 90% CI |
|---|---|---|---|---|
| #1 | Australia | 7.56 × 10⁻⁶ | 4.63 × 10⁻⁶ | [3.70, 5.71] × 10⁻⁶ |
| #2 | Singapore | 4.04 × 10⁻⁶ | 4.19 × 10⁻⁶ | [3.40, 5.06] × 10⁻⁶ |
| #3 | Hong Kong | 5.31 × 10⁻⁶ | 2.85 × 10⁻⁵ | [2.30, 3.48] × 10⁻⁵ |
| #4 | Australia | 3.87 × 10⁻⁶ | 2.13 × 10⁻⁵ | [1.70, 2.63] × 10⁻⁵ |
| #5 | Generic | 2.88 × 10⁻⁶ | 1.54 × 10⁻⁶ | [1.24, 1.88] × 10⁻⁶ |
| #6 | New Zealand | 4.89 × 10⁻⁶ | 1.49 × 10⁻⁵ | [1.20, 1.83] × 10⁻⁵ |
| #7 | UK | 6.86 × 10⁻⁵ | 8.68 × 10⁻⁵ | [6.87, 10.8] × 10⁻⁵ |
Disclaimer/Publisher’s Note: The statements, opinions and data contained in all publications are solely those of the individual author(s) and contributor(s) and not of MDPI and/or the editor(s). MDPI and/or the editor(s) disclaim responsibility for any injury to people or property resulting from any ideas, methods, instructions or products referred to in the content. |
© 2026 by the authors. Licensee MDPI, Basel, Switzerland. This article is an open access article distributed under the terms and conditions of the Creative Commons Attribution (CC BY) license (http://creativecommons.org/licenses/by/4.0/).
Copyright: This open access article is published under a Creative Commons CC BY 4.0 license, which permit the free download, distribution, and reuse, provided that the author and preprint are cited in any reuse.


