

Submitted:
03 June 2026
Posted:
04 June 2026
You are already at the latest version
Abstract
This study addresses the power dispatching of a DC-coupled three-phase grid-connected photovoltaic (PV) and energy storage integrated system by proposing a peak shaving and valley filling control architecture based on time-of-use (TOU) pricing. The research involves achieving maximum power point tracking (MPPT) for PVMAs using a boost converter combined with the perturb and observe (P&O) method. A lithium-iron phosphate battery pack is integrated into the DC link via a bidirectional buck-boost converter, where charging and discharging control is executed according to peak and off-peak periods to regulate and stabilize the DC link voltage. Furthermore, bidirectional power flow control for peak and off-peak electricity consumption is realized using hysteresis current control and sinusoidal pulse width modulation (SPWM) technologies within a smart inverter. By integrating the aforementioned power control architecture, the grid system can store energy from the utility during off-peak hours and release the stored energy during peak hours to reduce the load demand on the utility side. Initially, a simulation environment was established using Matlab/Simulink software, followed by control verification of the proposed system on a physical platform. Simulation and experimental results confirm that the integrated control architecture can precisely control the system's DC link voltage at 800 V and stabilize the grid-connected AC voltage at an effective value (RMS) of 380 V. Moreover, under conditions of peak/off-peak switching and load variations, the system effectively demonstrates its stability and efficacy in performing valley filling and peak shaving. The research topic is a scientific and integrated approach related to sustainable development. In addition, the results of the research were of economic benefit to environmental maintenance.
Keywords:
three-phase grid-connected
; photovoltaic energy storage system
; peak shaving and valley filling
; time-of-use
; perturb and observe
; maximum power point tracking
; bidirectional buck-boost converter
; smart inverter
; sustainable development
; economic benefit
1. Introduction
As industrial prosperity continues to flourish, the demand for electricity has increased substantially. Concurrently, the extensive use of fossil fuels and the resulting large-scale carbon emissions have progressively exacerbated the greenhouse effect. The surge in power demand during summer peak periods imposes significant pressure on the dispatching operations of utility companies. If improper dispatching leads to the shutdown of generating units, it may cause disasters such as fires or explosions in industrial machinery, directly impacting economic stability and productivity. Given the growing global focus on warming issues, large-scale photovoltaic (PV) power generation systems—characterized by high efficiency and low pollution—have been widely deployed to balance environmental protection with the mitigation of residential and industrial power demands during peak hours. However, as the scale of grid-connected PV systems grows, the original load profile has evolved into the "duck curve" [1]. During noon hours, the massive influx of PV power causes a significant drop in net load demand, forming a pronounced valley. In the evening, the rapid decline in PV generation, combined with rising electricity demand, results in an extremely steep ramp-up slope in the load curve. This poses a risk of generator tripping if the units cannot sustain the load. In light of this, battery energy storage systems (BESS) are employed in conjunction with the utility's time-of-use (TOU) pricing for power dispatching to alleviate the pressure on the utility’s spinning reserve during peak periods.
To enhance grid stability under the influence of the duck curve, researchers have conducted numerous studies on PV systems, battery packs, and smart inverters in recent years [2,3,4,5]. Specifically, literature [2] focused on resolving the efficiency issues of traditional three-phase rectifiers by controlling switching elements to achieve higher voltages and implementing power factor correction (PFC). Although this approach addressed drawbacks such as non-sinusoidal phase currents, total harmonic distortion (THD), and phase shifts associated with uncontrolled rectifiers, there remains room for further reduction in THD. Literature [3] addressed the control and energy management of grid-connected PV systems with integrated storage using model predictive control (MPC). While it successfully managed battery charging/discharging and load supply based on state-of-charge (SOC) simulations, the reliance on a minimum cost function to control the voltage source inverter involves a high number of case considerations, leading to a heavy computational burden. Furthermore, literature [4] applied a decision tree learning algorithm to a grid-connected microgrid for vehicle-to-grid (V2G) energy management. By considering load demand and price fluctuations, electric vehicles were used as mobile storage for peak shaving. However, this method requires accounting for daily load profiles, renewable energy output, and user lifestyles; the resulting data volume and controller complexity significantly increase system implementation costs. Recently, literature [5] introduced a novel optimized charging algorithm for storage systems, combining four charging methods under three SOC conditions to reduce charging time to under one hour. Although it used negative current pulses to mitigate lithium plating and extend battery life, the frequent switching between modes requires real-time temperature sensing and results in high switching frequencies. This imposes strict requirements on circuit design and component precision, thereby increasing hardware costs.
To address the shortcomings identified in [2,3,4,5], this paper proposes a power dispatch strategy for a DC-coupled three-phase grid-connected solar PV and battery storage integrated system. The proposed approach optimizes power quality through DC-link voltage control and simplifies the control architecture, thereby reducing computational complexity and enhancing dispatch capability. This enhances the economic efficiency of the microgrid and ensures the sustainability of peak shaving and valley filling. By utilizing a smart charging/discharging strategy within contract capacity limits, the system balances battery longevity with overall costs. The proposed control architecture not only improves grid stability under the impact of the PV duck curve but also ensures grid safety and adherence to contract limits, providing a feasible power dispatch solution for large-scale renewable energy integration.
2. Peak Shaving and Valley Filling Control Technology
Peak shaving and valley filling [6] is a power dispatching strategy promoted to mitigate the "duck curve" effect in power demand caused by variations in PV power generation. By utilizing the electricity price differential between peak and off-peak periods, this strategy encourages consumers to store electricity in energy storage systems (ESS) during off-peak intervals. During peak demand periods, the energy stored during off-peak hours is released as an auxiliary power supply to achieve the goals of shaving peak loads and filling off-peak valleys, thereby smoothing out the load demand. To implement this dispatching strategy, it is essential to integrate PV and ESS using appropriate control architectures tailored to various power demands and operational modes.
2.1. Control Circuit Design of the Proposed Grid-Connected PV-Battery System
This study adopts a DC-coupled grid-connected power system [7], the overall architecture of which is illustrated in Figure 1. By connecting the PVMAs and the lithium-iron phosphate battery pack to the DC link through a boost converter and a bidirectional buck-boost converter, respectively, the system can directly store the DC power generated by the PV modules into the battery pack. This architecture effectively avoids the energy losses associated with multi-stage AC-DC conversions, thereby enhancing the energy conversion efficiency and cost-effectiveness of the power system. The detailed electrical specifications for the boost converter, bidirectional buck-boost converter, and three-phase smart inverter utilized in the system are summarized in Table 1, Table 2, and Table 3, respectively.
2.2. Integrated Controller Design for the Proposed Grid-Connected PV-Battery System
For the DC-coupled grid-connected architecture, the controller design and system integration are implemented based on peak and off-peak periods. This includes the inverter’s DC-link voltage controller, load-following controller, peak shaving and valley filling controller, and hysteresis current control. Additionally, it incorporates the constant current-constant voltage (CC-CV) charging controller and the anti-over-contract-capacity charging controller for the lithium-iron phosphate battery pack, as well as the maximum power point controller for the PVMAs utilizing a boost converter combined with the P&O method.
2.2.1. Maximum Power Point Control for Photovoltaic Module Arrays
To ensure the power generation efficiency of the PVMAs, this study adopts the P&O method [12,13] to achieve MPPT. The system dynamically adjusts the perturbation amount by observing power variations to balance the tracking response speed and steady-state oscillation losses. This ensures that the PVMAs can output maximum power continuously and stably under various solar irradiance conditions.
2.2.2. Phase-Locked Loop
To achieve precise synchronization between the inverter and the utility grid, this study utilizes a synchronous reference frame phase-locked loop (SRF-PLL) [14] to extract the real-time phase of the grid [15]. The control architecture is illustrated in Figure 2. Through coordinate transformation [16,17], the system employs a proportional-integral (P-I) controller to force the quadrature-axis (q-axis) voltage component to zero [18], thereby locking the d-axis vector to the grid voltage phase. The calculated synchronous phase angle is continuously fed back to provide an accurate reference basis for the inverter’s grid-connected control and coordinate transformations.
2.2.3. Energy Storage and Inverter Control during Off-Peak Periods
In this paper, a battery pack and PVMAs are connected to the DC link. The battery pack is controlled to draw power from the utility grid during off-peak periods to perform valley filling. However, since the battery pack operates with DC power for charging and discharging, the AC power from the utility must be converted into DC power via the smart inverter. The rectified output DC-link voltage is controlled to remain stable at a predefined setpoint. Subsequently, a bidirectional buck-boost converter is used to regulate the terminal voltage for battery charging. The circuit control architecture is illustrated in Figure 3.
Constant Current-Constant Voltage (CC-CV) Charging Controller with Anti-Over-Contract-Capacity Protection
To balance the charging efficiency of the lithium-iron phosphate battery pack with the electricity costs on the utility side, this study proposes a constant CC-CV charging controller featuring anti-over-contract-capacity protection [19]. This controller is implemented using P-I controllers, and its block diagram is shown in Figure 4. During the initial stage of battery charging, to achieve constant current control, the error between the feedback battery current and the maximum charging current reference is input into a P-I controller for calculation. The governing equation is expressed as Equation (1).
When the battery terminal voltage reaches its maximum allowable value, the control architecture switches to a voltage outer-loop P-I control. The error between the feedback battery voltage and the full-charge voltage setpoint is processed by the P-I controller to calculate the charging current command, as expressed in Equation (2).
Finally, the resulting control signal is compared with a triangular carrier wave to generate PWM signals, which control the power switches of the bidirectional buck-boost converter, thereby realizing stable and efficient CC-CV fast charging.
Considering the stochastic fluctuations of the AC-side load, if the battery is charged at a constant high current, the total demand—comprising both the charging demand and the local load—may exceed the contract capacity, risking over-contract penalties. Therefore, the power outer-loop of this controller takes the error between the measured power and the contract capacity setpoint and processes it via P-I calculation. This result is used to dynamically adjust (down-regulate) the charging reference command of the current inner-loop, as expressed in Equation (3).
Hysteresis Current Controller
In this study, hysteresis current control [20] is employed for current regulation, and its control block diagram is illustrated in Figure 5. The system first captures the actual DC-link voltage and compares it with the reference voltage. The resulting error is processed by a P-I controller to obtain the required reference component for the AC-side d-axis current, as expressed in Equation (4).
Subsequently, the system utilizes the phase angle provided by the phase-locked loop (PLL) to transform the d-axis and q-axis current components into three-phase AC reference currents. Following this, the measured grid currents are compared with these reference currents, and their errors are restricted within a predefined hysteresis band. This process directly triggers the switching of the inverter’s bridge arms. The comparison between the current and switching signals is illustrated in Figure 6. This control method features a rapid dynamic response and forces the actual current to accurately track the current command, thereby achieving PFC and effectively improving the THD.
2.2.4. Energy Storage and Inverter Control during Peak Periods
After the off-peak period ends, the control strategy shifts to supplying power to the AC-side load using the PVMAs and the lithium-iron phosphate battery pack connected in parallel to the DC link, as electricity prices are higher during peak periods. To compensate for electricity consumption exceeding the contract capacity, the proposed DC-coupled power system must be controlled to perform energy dispatching for both the PVMAs and the battery pack. Accordingly, this Section discusses the integration and design of controllers under various conditions based on the battery's SOC and whether the contract capacity is exceeded, ensuring the stable operation of the power system. The control architecture is illustrated in Figure 7.
Inverter Active Power Dispatch and Peak Shaving Controller Design
During peak electricity demand periods, the system control strategy actively regulates the inverter's output active power to supply the AC-side load. To balance the discharge depth of the lithium-iron phosphate battery and prevent exceeding the utility contract capacity, this study integrates "load following" and "peak shaving control" into a single active power dispatch architecture. The control block diagram is illustrated in Figure 8. The control strategy first compares the actual load demand with the contract capacity to dynamically determine the calculation path for the d-axis current reference value. If the load demand is less than the contract capacity, the system enters the load-following control mode, where the inverter is controlled to ensure that the power supply equals the load demand. To control the inverter's output power according to the load requirements, the system performs power measurement on the AC-side load to provide feedback signals [21]. The load current required is then obtained through Equations (10) and (11) to serve as the d-axis current reference for the current control loop.
Conversely, when the load is excessive, leading to a situation where the load demand exceeds the contract capacity, relying solely on the lithium-iron phosphate battery pack to fully compensate for the required load power would result in an excessively high discharge current and a rapid decline in the SOC. Once the battery is depleted, it may be unable to perform compensation during other periods of over-contract power consumption. To effectively dispatch the energy of the storage system, the system automatically switches to the peak shaving control mode. In this mode, the instantaneous power error between the load demand and the contract capacity is first calculated by Equation (12), and the current required for peak shaving is subsequently obtained via Equation (13) to serve as the inverter's output current reference.
After determining the d-axis current reference based on the aforementioned conditions, the q-axis current reference is set to zero to maximize the power generation utilization rate of the PVMAs, ensuring that the inverter output consists entirely of active power. After comparing the errors of the d-axis and q-axis current components, the respective voltage components are obtained through P-I controllers, as expressed in Equations (14) and (15).
Finally, these two-axis voltage components undergo inverse coordinate transformation (from axis to axes) and are combined with sinusoidal pulse width modulation (SPWM) technology to generate PWM signals for driving the switching elements within the inverter.
Design of the Lithium-Iron Phosphate Battery Charge/Discharge Controller
The inverter controller described in Section 2.2.4.1 is responsible for regulating the magnitude of the load current output to the AC side. To ensure that the inverter operates stably within the linear modulation region, the control block diagram is illustrated in Figure 9. The DC-link voltage error is obtained by comparing the actual feedback DC-link voltage with its reference value. This error is then processed through a P-I controller to output the battery charge/discharge current command, as expressed in Equation (16). Once the charge/discharge current command is obtained, it is subtracted from the actual feedback battery current to determine the error. Subsequently, an inner-loop P-I controller is used to generate the control signal, as shown in Equation (17). Finally, the PWM signals for driving the bidirectional buck-boost converter are generated through PWM control.
Design of the Inverter DC-Link Voltage Controller
When the lithium-iron phosphate battery pack is no longer capable of regulating the DC-link voltage, the inverter must be used to stabilize the DC-link voltage at a predefined setpoint to supply the energy generated by the PVMAs to the grid side. Specifically, when the PV power generation exceeds the demand, the excess power is controlled to flow into the grid. Conversely, when the PV power generation is lower than the load demand, the grid compensates for the deficit. The control block diagram employed for this purpose is illustrated in Figure 10 [22].
As the PVMAs continue to supply power with increasing solar irradiance, the actual DC-link voltage will rise. At this point, the current error command of the inner-loop current controller must be positive to control the inverter to output a larger current, thereby reducing the DC-link voltage. Therefore, in the voltage outer-loop control circuit, the actual measured DC-link voltage must be controlled using positive feedback. This ensures that the voltage error compared with the reference value remains positive. After processing this error through a P-I controller, the output current command required by the inverter to stabilize the DC-link voltage is obtained as a positive and increasing value, as expressed in Equation (18). This control framework is similar to the inverter control described in Section 2.2.4.1, with the only difference being the inclusion of the voltage outer-loop control circuit; thus, further details are omitted.
3. Simulation Results
Based on the daily load profile and the contract capacity schematic shown in Figure 11, integrated control for both off-peak and peak periods was simulated using Matlab/Simulink. The performance of the proposed control strategy when applied to the main circuit architecture of the power system was also observed. The design specifications for the three-phase grid-connected inverter proposed in this study include a DC-link voltage of 800 V and an output AC voltage with an effective (RMS) value of 380 V at a frequency of 60 Hz. The lithium-iron phosphate battery pack has a rated voltage of 287.1 V and a capacity of 93.1 kWh. The total capacity of the PVMA, configured with 22 series and 5 parallel strings, is 24.7 kW. The electrical specifications for the PV modules [23] and the lithium-iron phosphate batteries [24] are summarized in Table 4 and Table 5, respectively.
3.1. Simulation of Maximum Power Point Tracking
In this study, the assumed solar irradiance profile is shown in Figure 12. A boost converter employing the P&O method is used to implement MPPT control under continuously varying irradiance levels. By observing the relationship between the input power and output power of the converter in Figure 13, the power conversion efficiency of the converter under standard test conditions (STC) is determined to be 89.5%.
3.2. Simulation of Peak Shaving and Valley Filling Control under Different Battery SOC
This section simulates the steady-state response performance of the integrated control for the DC-coupled three-phase grid-connected PV-battery system during peak and off-peak periods under various battery charge levels. The system operating states under "fully charged" and "insufficient power (low SOC)" conditions of the battery pack are simulated and discussed in Section 3.2.1 and Section 3.2.2, respectively.
3.2.1. Simulation of the Lithium-Iron Phosphate Battery Pack under Sufficient SOC
Case 1: Battery SOC at 50%
According to the daily load profile comparison of peak shaving and valley filling control (SOC at 50%) in Figure 14, the operating states can be divided into six stages, described as follows.
Stage 1: The lithium-iron phosphate battery pack is charged by the grid using constant current (power is defined as negative). As the time approaches the peak period, the PVMAs begin to generate power, alleviating the supply pressure on the grid. However, as the load demand rises rapidly, continuous constant current charging would lead to exceeding the contract capacity. Therefore, the battery charging power must be controlled to decrease gradually as the grid supply increases to avoid over-contract penalties.
Stage 2: Upon entering the peak electricity demand period, the load demand has not yet exceeded the contract capacity. To minimize electricity costs, a self-consumption PV energy dispatch control is adopted, and the battery pack provides auxiliary power to the load (power is defined as positive).
Stage 3: The load demand exceeds the contract capacity, forming the "first peak". At this time, the PVMAs output the current required for peak shaving through the inverter. Since the PV power generation is currently in surplus, the battery pack stores the excess energy, ensuring that the power drawn from the grid is controlled within the contract capacity limits to facilitate energy dispatching for the subsequent "second peak".
Stage 4: During the plant's lunch break, the load demand falls below the contract capacity. Power is released from both the PVMAs and the battery pack to the load, bringing the grid power supply close to zero.
Stage 5: The load demand enters the "second peak". Observing the power variation of the battery pack, it initially stores the surplus PV energy. As solar irradiance declines, the battery switches to auxiliary power supply. Consequently, the post-control grid power is successfully suppressed within the contract capacity.
Stage 6: Entering the nighttime period, due to the absence of solar irradiance, the battery pack—having sufficient residual energy—independently releases power to the nighttime load to maximize the reduction of energy charges.
Case 2: Battery SOC at 90%
According to the daily load profile comparison of peak shaving and valley filling control (SOC at 90%) in Figure 15, the operating conditions for Stages 2, 4, 5, and 6 are identical to those in the previous case. Therefore, the following description focuses only on Stages 1 and 3.
Stage 1: As the lithium-iron phosphate battery pack is already in a fully charged state, the charging mode is set to constant voltage (CV) charging, with the charging current approaching zero. Compared to Case 1, since the battery pack has no charging demand, the energy generated by the PVMAs is supplied to the AC-side load via the inverter.
Stage 3: The inverter's output power is controlled to shave the demand of the "first peak". Since the maximum SOC limit in this study is set to 90%, once the battery pack is detected to have reached this threshold, the charging power instantaneously drops to zero, and the battery stops regulating the DC-link voltage. By controlling the inverter to output all energy produced by the PV module arrays, the power drawn from the grid is significantly reduced, thereby eliminating concerns regarding potential damage to the battery pack from overcharging.
3.2.2. Simulation of the Lithium-Iron Phosphate Battery Pack under Low SOC
This Section simulates the power control method of the proposed hybrid power system during nighttime when the depth of discharge (DOD) of the lithium-iron phosphate battery pack reaches 90%. The results are presented in Figure 16, which shows the daily load profile comparison for peak shaving and valley filling control (Battery SOC at 10%). Compared to Figure 15, the operating states from Stage 1 to Stage 5 are identical. However, during Stage 6, as the system detects that the SOC has dropped to the predefined DOD threshold, it instantaneously controls the battery pack to stop discharging. Simultaneously, since there is no power generation from the PVMAs due to the absence of solar irradiance, the utility grid supplies the entire load demand at this time.
4. Experimental Results
To verify the simulation results, the proposed DC-coupled three-phase grid-connected PV-battery system was implemented and tested using PLECS, a multi-functional power electronics simulation software developed by Plexim GmbH, in conjunction with the RT box and the analog breakout board [25].
4.1. Experimental Integration of the Controller during Off-Peak Periods
Considering that battery cycle life is susceptible to charging temperatures [26], this study employs a constant current (CC) charging control at a rate of 0.2C (65 A). This approach not only reduces the current stress on the converter but also effectively lowers the temperature of the lithium-iron phosphate battery pack, thereby extending its lifespan. However, while the battery draws power from the grid in CC charging mode, a heavy AC-side load may cause the total grid supply to exceed the contract capacity. Therefore, this section describes the experimental results of the battery charging control under both high and low AC-side load demands.
Case 1: Low load demand
When the sum of the battery charging demand and the AC-side load demand does not exceed the contract capacity, the battery pack adopts the CC-CV charging mode, as shown in Figure 17. It can be observed from the figure that the DC-link voltage is rectified and regulated at 800 V by the smart inverter. This allows the bidirectional buck-boost converter to operate stably in buck mode while supplying power to the battery. During the CC charging process, the battery terminal voltage rises continuously. Once the voltage reaches 311.1 V (the terminal voltage corresponding to a 90% SOC), the charging mode switches to the predefined constant voltage (CV). At this stage, the charging current decreases as the SOC increases. After the SOC reaches 90%, the charging current approaches zero, and the battery pack enters a float charging state with a minimal current.
During the CC-CV charging process of the lithium-iron phosphate battery pack, the supply current from the utility grid varies in accordance with the battery pack's charging current. To verify that the hysteresis current control employed by the smart inverter can perform PFC and reduce the THD of the current across different battery SOC levels, the phase voltages and currents of the three-phase system were measured. Figure 18 shows the measured voltage and current waveforms of the inverter using hysteresis current control. Since the inverter absorbs energy from the grid to supply the DC side, the voltage and current waveforms are 180° out of phase.
Case 2: High load demand
When the total power demand from the lithium-iron phosphate battery charging and the AC-side load exceeds the contract capacity, the battery pack enters the prevention-of-over-contract charging mode. The experimental results are shown in Figure 19. It can be observed that in the initial stage of the hybrid power system operation, the battery is charged at a constant current of 0.2C (65 A). As the AC-side load demand suddenly rises, the charging current is controlled to decrease rapidly. Due to the short transient response time, the battery charging current quickly stabilizes back to a steady state.
The hysteresis current control employed by the smart inverter successfully stabilizes the DC-link voltage at the predefined setpoint even as the battery charging current decreases. Simultaneously, it maintains the grid supply power within the contract capacity limits. During this period, the supply current from the grid is regulated at 75 A. Calculations using Equation (10) verify that the grid supply power is 35 kW, which aligns with the contract capacity value established in this study. The measured results for the grid are illustrated in Figure 20.
4.2. Experimental Integration of the Controller during Peak Periods
When the smart inverter and the lithium-iron phosphate battery pack perform peak clipping during peak electricity demand periods, excessive or insufficient loads will cause the battery pack to regulate DC-link voltages that are either too high or too low. Consequently, the battery pack may encounter scenarios where the DC-link voltage is excessively high while the battery remains fully charged, or where the DC-link voltage is too low while the battery's SOC is also insufficient.
In response to these conditions, this Section describes the experimental results under two specific cases, utilizing the proposed integrated controller architecture as explained below.
Case 1: Excessive DC-link voltage with battery SOC at 90%
This scenario occurs when the power generation from the PVMAs exceeds the current power demand of the smart inverter, leading to a rise in the DC-link voltage. Once the battery pack detects that the DC-link voltage is higher than the setpoint, it begins to absorb the excess energy from the DC link. However, since the battery's SOC has reached 90%, it can no longer continue to regulate the DC-link voltage and must immediately stop charging. The measured results for the DC-link voltage, battery terminal voltage, and battery current are shown in Figure 21.
Under this condition, according to the measured output current waveforms of the smart inverter in Figure 22, it can be observed that while the lithium-iron phosphate battery pack absorbs energy from the DC link, the inverter simultaneously outputs current to the AC-side load. Once the battery pack can no longer absorb energy, the inverter outputs all the electrical energy generated by the PVMA to the AC side, causing its output current to increase.
Furthermore, according to the measured output current waveforms of the grid in Figure 23, it can be observed that while the battery pack absorbs DC-link energy, the utility grid does not supply power to the load. Once the smart inverter outputs the entire energy from the PVMA, the AC-side load demand is supplied with priority, and the remaining surplus energy is absorbed by the grid.
Case 2: Insufficient DC-link voltage with battery SOC at 10%
This scenario occurs when the power generated by the PV module array is lower than the current demand of the smart inverter, leading to a decrease in the DC-link voltage. Upon detecting that the DC-link voltage is below the setpoint, the lithium-iron phosphate battery pack must compensate for the energy deficit in the DC link. However, once the battery's SOC reaches 10%, it can no longer continue to regulate the DC-link voltage and must immediately cease discharging. The measured results for the DC-link voltage, battery terminal voltage, and current under this condition are shown in Figure 24.
Under this condition, according to the measured output current waveforms of the smart inverter in Figure 25, the battery pack initially compensates for the DC-link energy to meet the system voltage requirements. After the battery pack stops discharging, the smart inverter only delivers the total energy from the PVMA to the AC-side load, resulting in a decrease in the inverter's output current.
Furthermore, according to the measured current results on the grid side in Figure 26, the utility grid does not supply power to the load while the battery pack is compensating for the DC-link energy. Once the battery power is insufficient and the smart inverter switches its control mode, the demand of the AC-side load is prioritized, and the remaining power deficit is compensated for by the grid.
4.3. Experimental Results of the Inverter Control Transition Between Peak and Off-Peak Periods
The energy dispatch strategy for peak shaving and valley filling based on the summer two-stage TOU electricity pricing discussed in this study applies off-peak rates from 00:00 AM to 9:00 AM, and peak rates after 9:00 AM. Therefore, the smart inverter determines whether to execute peak shaving or valley filling based on the time of day. The smart inverter must undergo controller switching twice daily: from off-peak to peak, and from peak to off-peak. Thus, this Section presents the experimental measurements of the inverter's output voltage and current at the instant of control mode transition, which are described under two conditions.
Case 1: Transition from off-peak to peak
After undergoing CC-CV charging during the off-peak period, the lithium-iron phosphate battery pack reaches a fully charged state and transitions to float mode; consequently, the charging current drawn from the grid side approaches zero. Under this operating state, the smart inverter switches to SPWM control. The measured results are illustrated in Figure 27. It can be observed from the figure that at the instant of the control mode transition, the three-phase currents of the smart inverter can recover to sinusoidal waveforms within a very short time. They remain in phase with the grid voltages, enabling the system to fully deliver active power to the utility grid, thereby improving the DC energy utilization efficiency of the PVMA and the battery pack.
Case 2: Peak to off-peak transition
Because the lithium-iron battery pack provides auxiliary power to the DC link during the peak period, its SOC is relatively low. Therefore, once the smart inverter switches to the hysteresis current control mode, it adopts a constant current for charging. Consequently, at the instant of control mode switching, the inverter's output current instantaneously transitions from releasing electrical energy to absorbing it; the measured results are depicted in Figure 28. As observed in the figure, the three-phase currents are in phase with the grid voltage during the peak period. Upon entering the off-peak period, the inverter draws energy from the grid to charge the battery, causing the currents to be in anti-phase with the grid voltage. At the exact moment of the control mode transition, the three-phase currents can track the grid phase within an extremely short time, thereby enhancing the power supply stability and power quality of the grid-side power equipment.
5. Conclusion
Both simulation and experimental results confirm that during the bidirectional power conversion process of the smart inverter, the power factor between the output voltage and current approaches unity in both off-peak and peak periods. Furthermore, controlled by the inverter, the three-phase currents can rapidly track the real-time phase of the grid, thereby enhancing the overall energy efficiency of the power system. Regarding the peak-shaving and valley-filling control, to verify that the proposed controller enables a fast energy regulation response for the lithium-iron battery pack, the stability of the CC-CV charging controller and the over-contract prevention charging controller were experimentally evaluated during off-peak periods. It was also verified that the lithium-iron battery pack is capable of instantly detecting grid over-contract conditions and adjusting the charging current accordingly. Moreover, during peak periods, by regulating the DC-link voltage, the lithium-iron battery pack can quickly determine whether the power generation from the PVMA exceeds the demand. Finally, the charging and discharging currents of the battery can rapidly return to a steady state at the exact moment of switching between different controllers, effectively validating the feasibility and reliability of the proposed controller integration.
Author Contributions
Conceptualization, project administration, writing—review & editing and resources: K.-H.C.; Software and writing—original draft: Y.-H.W.; Methodology and formal analysis: C.-D.W. All authors have read and agreed to the published version of the manuscript.
Institutional Review Board Statement
Not applicable.
Informed Consent Statement
Not applicable.
Data Availability Statement
This study did not report any data.
Conflicts of Interest
The authors of the manuscript declare no conflicts of interest.
Nomenclature
| Acronyms | ||
| PV | : | photovoltaic |
| TOU | : | time-of-use |
| MPPT | : | maximum power point tracking |
| SPWM | : | sinusoidal pulse width modulation |
| BESS | : | battery energy storage systems |
| PFC | : | power factor correction |
| THD | : | total harmonic distortion |
| MPC | : | model predictive control |
| SOC | : | state-of-charge |
| V2G | : | vehicle-to-grid |
| ESS | : | energy storage systems |
| CC-CV | : | constant current-constant voltage |
| SRF-PLL | : | synchronous reference frame phase-locked loop |
| P-I | : | proportional-integral |
| q-axis | : | quadrature-axis |
| d-axis | : | direct-axis |
| PLL | : | phase-locked loop |
| CV | : | constant voltage |
| DOD | : | depth of discharge |
| CC | : | constant current |
| Symbols | ||
| : | current control command | |
| : | maximum charging current reference | |
| : | battery current | |
| : | P-I controller gains | |
| : | battery current command | |
| : | maximum battery voltage | |
| : | battery voltage | |
| : | d-axis current reference | |
| : | reference dc-link voltage | |
| : | dc-link voltage | |
| : | reference power | |
| : | peak reference current | |
| : | peak grid voltage | |
| : | peak shaving power | |
| : | load demand power | |
| : | contract capacity power | |
| : | d-axis voltage component | |
| : | d-axis current | |
| : | q-axis voltage component | |
| : | q-axis current |
References
- Watari, D.; Taniguchi, I.; Onoye, T. Duck Curve Aware Dynamic Pricing and Battery Scheduling Strategy Using Reinforcement Learning. IEEE Trans. Smart Grid 2023, 15, 457–471. [Google Scholar] [CrossRef]
- Pavlova, Y.V.; Grigorii, B.V. The Synthesis of a Control System of the Active Rectifier. In Proceedings of the IEEE Conference of Russian Young Researchers in Electrical and Electronic Engineering (EIConRus), Moscow/St. Petersburg, Russia, 29 January–1 February 2018; pp. 941–944. [Google Scholar]
- Remache, S.; Remache, S.E.I.; Barra, K. Algeria Power Management of Grid Connected PV System with Integrated Energy Storage. In Proceedings of the 1st International Conference on Sustainable Renewable Energy Systems and Applications (ICSRESA), Tebessa, Algeria, 4–5 December 2019; pp. 1–4. [Google Scholar]
- Attou, N.; Zidi, S.-A.; Hadjeri, S.; Khatir, M. Improved Peak Shaving and Valley Filling Using V2G Technology in Grid Connected Microgrid. In Proceedings of the 3rd International Conference on Transportation and Smart Technologies (TST), Oran, Algeria, 27–28 May 2021; pp. 53–58. [Google Scholar]
- Kumar, D.; Das, M. Optimized Charging Method for Fast Charging of EV Batteries. In Proceedings of the 49th Annual Conference of the IEEE Industrial Electronics Society (IECON), Singapore, Singapore, 16–19 October 2023; pp. 1–6. [Google Scholar]
- Saaravia-Guerrero, J.A.; EsP-Inosa-Juárez, E. Optimal Sizing of BESS for Industrial Peak Shaving Applications Considering Different Electricity Billing Rates. In Proceedings of the 4th International Conference on Electrical, Computer and Communication Technologies (ICECCT), Erode, India, 15–17 September 2021; pp. 1–6. [Google Scholar]
- Manandhar, U.; Ukil, A.; Beng Gooi, H.; Tummuru, N.R.; Kollimalla, S.K. A Low Complexity Control and Energy Management for DC-coupled Hybrid Microgrid with Hybrid Energy Storage System. In Proceedings of the IEEE Power & Energy Society General Meeting, Chicago, IL, USA, 16–20 July 2017; pp. 1–5. [Google Scholar]
- Rao, C.V.R.; Ganesh, M.S.R.; Sekhar, K.C.; Sudha, R.P.; Dangeti, L.K.; Duvvuri, S.S.S.R.S. A Generalized MPPT Controlled DC-DC Boost Converter for PV System Connected to Utility Grid. In Proceedings of the Innovations in Power and Advanced Computing Technologies, Vellore, India, 22–23 March 2019; pp. 1–5. [Google Scholar]
- Jian, J.J. Energy Storage System with Uniform Battery Charging and Discharging Control. Master's Thesis, National Chin-Yi University of Technology, Taichung, Taiwan, July 2020. [Google Scholar]
- Cha, H.; Vu, T.K. Comparative Analysis of Low-pass Output Filter for Single-phase Grid-connected Photovoltaic Inverter. In Proceedings of the 25th Annual IEEE Applied Power Electronics Conference and Exposition (APEC), Palm Springs, CA, USA, 21–25 February 2010; pp. 1659–1665. [Google Scholar]
- Channegowda, P.; John, V. Filter Optimization for Grid Interactive Voltage Source Inverters. IEEE Trans. Ind. Electron. 2010, 57, 4106–4114. [Google Scholar] [CrossRef]
- Boumassata, A.; Chourouk, B.; Achouak, S. Experimental Validation of P&O and P&O-P-I MPPT Using RT-Lab under Real Atmospheric Conditions. In Proceedings of the 2nd International Conference on Electronics, Energy and Measurement (IC2EM), Boumerdes, Algeria, 28–30 November 2023; pp. 1–6. [Google Scholar]
- Ba, O.A.; Ndiaye, A.; Ba, A.; Ndiaye, E.H.M.; Tankari, M.A. Optimization of the P&O-MPPT Controller by the Adaptive Method (Ad-P&O) for Stand-alone PV Systems. In Proceedings of the 11th International Conference on Smart Grid (icSmartGrid), Paris, France, 4–7 June 2023; pp. 1–8. [Google Scholar]
- Sonam, K.; Nikhil, P.; Sudeep, B.; Atul, G. Implementation of Single-phase Modified SRF-PLL Using Model Based Development Approach. In Proceedings of the North American Power Symposium (NAPS), Morgantown, WV, USA, 17–19 September 2017; pp. 1–6. [Google Scholar]
- Zhou, G.; Shi, X.; Fu, C.; Wang, Y. Operation of a Three-phase Soft Phase Locked Loop under Distorted Voltage Conditions Using Intelligent P-I Controller. In Proceedings of the IEEE Region 10 Technical Conference (TENCON), Hong Kong, China, 14–17 November 2006; pp. 1–4. [Google Scholar]
- Zou, Y.; Zhang, L.; Xing, Y.; Zhang, Z.; Zhao, H.; Ge, H. Generalized Clarke Transformation and Enhanced Dual-loop Control Scheme for Three-phase PWM Converters under the Unbalanced Utility Grid. IEEE Trans. Power Electron. 2022, 37, 8935–8947. [Google Scholar] [CrossRef]
- Triki, Y.; Bechouche, A.; Seddiki, H.; Abdeslam, D.O. Improved D-Q Frame Controller for Stand-alone Single-phase Inverters. In Proceedings of the IEEE International Conference on Industrial Technology (ICIT), Buenos Aires, Argentina, 26–28 February 2020; pp. 53–58. [Google Scholar]
- Mennai, N.; Soufi, Y.; Medoued, A.; Faleh, A. Grid Synchronization Techniques Analysis of DG Systems under Grid Fault Conditions. In Proceedings of the 19th International Multi-Conference on Systems, Signals & Devices (SSD), Setif, Algeria, 6–10 May 2022; pp. 917–922. [Google Scholar]
- Chaudhary, C.; Mishra, S.; Nangia, U. A Bridgeless Isolated Zeta Converter for Battery Charging Aided with Solar Photovoltaic System. In Proceedings of the International Conference on Smart Generation Computing, Communication and Networking (SMART GENCON), Pune, India, 29–30 October 2021; pp. 1–6. [Google Scholar]
- Bouhouta, A.; Moulahoum, S.; Kabache, N.; Benyamina, A. Design and Real Time Implementation of Three Phase Shunt Active Power Filter Using Indirect Current Control Technique. In Proceedings of the International Conference on Advanced Electrical Engineering (ICAEE), El Oued, Algeria, 19–21 November 2019; pp. 1–6. [Google Scholar]
- Zhang, C.; Yu, S.; Jiang, K.; Ge, X.; Ma, J. A Fast Instantaneous Power Calculation Algorithm for Single-phase Rectifiers Based on Arbitrary Phase-delay Method. IEEE Trans. Ind. Appl. 2019, 55, 3935–3945. [Google Scholar] [CrossRef]
- Dong, H.; Jun, S.; Qiang, Z.; Liang, Z.; Chuanxiu, W. Control Strategy of Grid Connected Photovoltaic Power with Energy Storage System. In Proceedings of the IEEE 4th Information Technology, Networking, Electronic and Automation Control Conference (ITNEC), Chongqing, China, 12–14 June 2020; pp. 2409–2413. [Google Scholar]
- Data Sheet of A10 Green Technology A10J-M60-225 Solar Panel. Available online: http://www.solarhub.com/solarhub_products/3317-A10J-M60-225-A10Green-Technology (accessed on 25 December 2024).
- Data Sheet of A123 Li-iron-phosphate ANR26650M1. Available online: https://www.sullivanuv.com/wp-content/uploads/2014/06/A123-Cell-Datasheet-2008-08.pdf (accessed on 25 December 2024).
- Plexim GmbH. PLECS User Manual; Plexim GmbH: Zurich, Switzerland, 2022; Available online: https://www.plexim.com/sites/default/files/plecsmanual.pdf (accessed on 25 December 2024).
- Liu, J.; Gao, D.; Cao, J. Study on the Effects of Temperature on LiFePO4 Battery Life. In Proceedings of the IEEE Vehicle Power and Propulsion Conference, Seoul, Republic of Korea, 9–12 October 2012; pp. 1436–1440. [Google Scholar]
Figure 1.
Architecture diagram of the DC-coupled system.
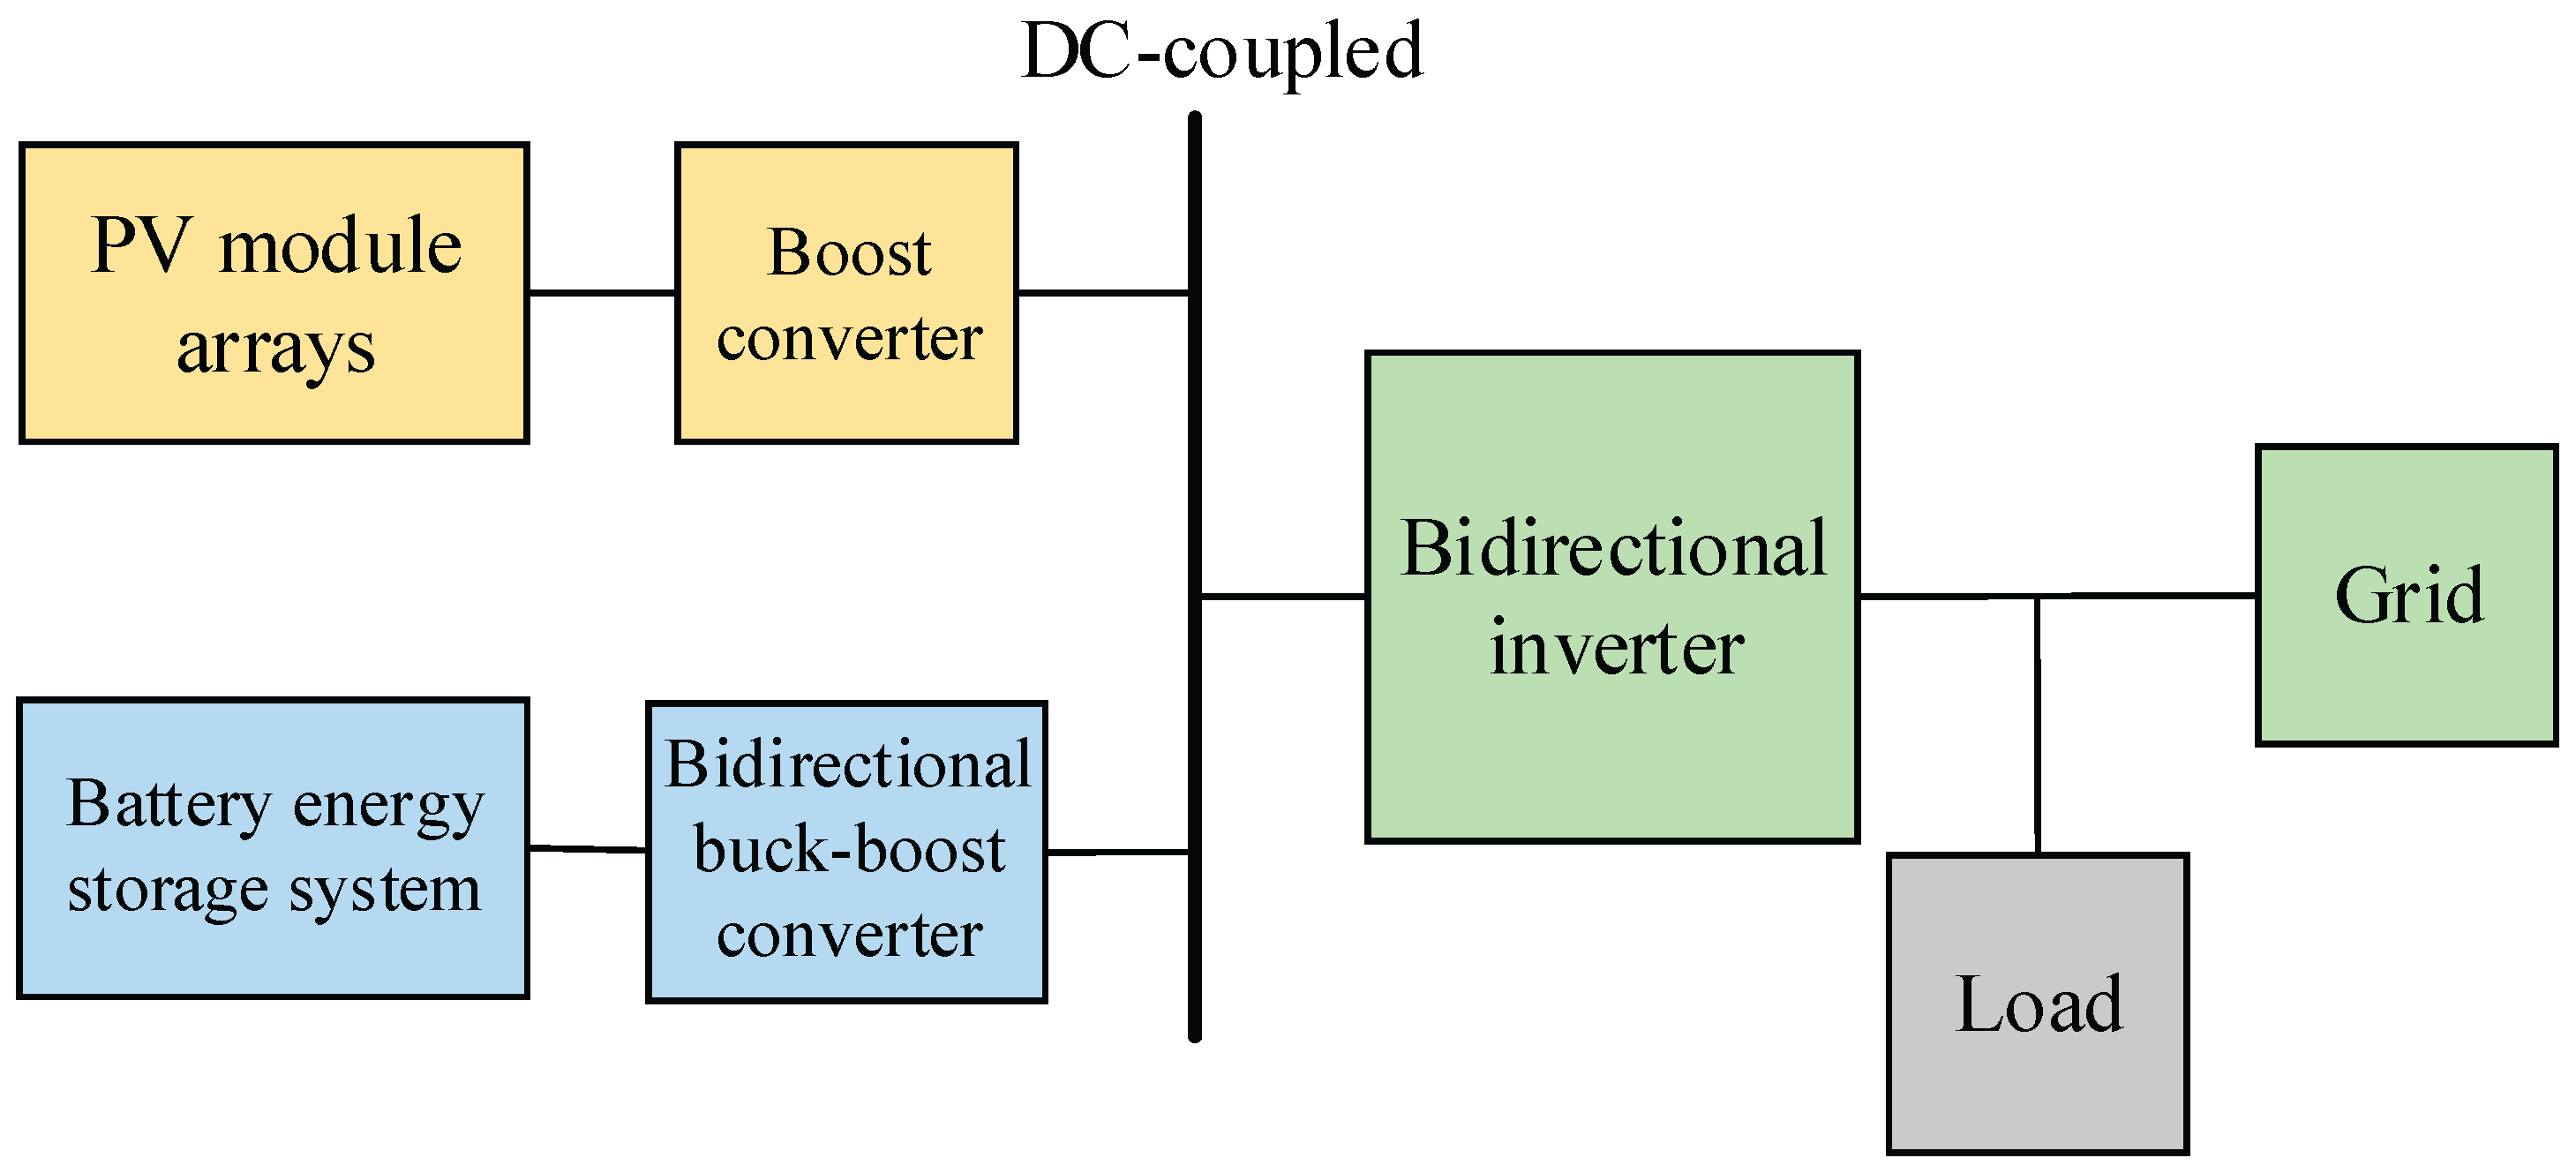
Figure 2.
Architecture diagram of the SRF-PLL [14].
Figure 2.
Architecture diagram of the SRF-PLL [14].
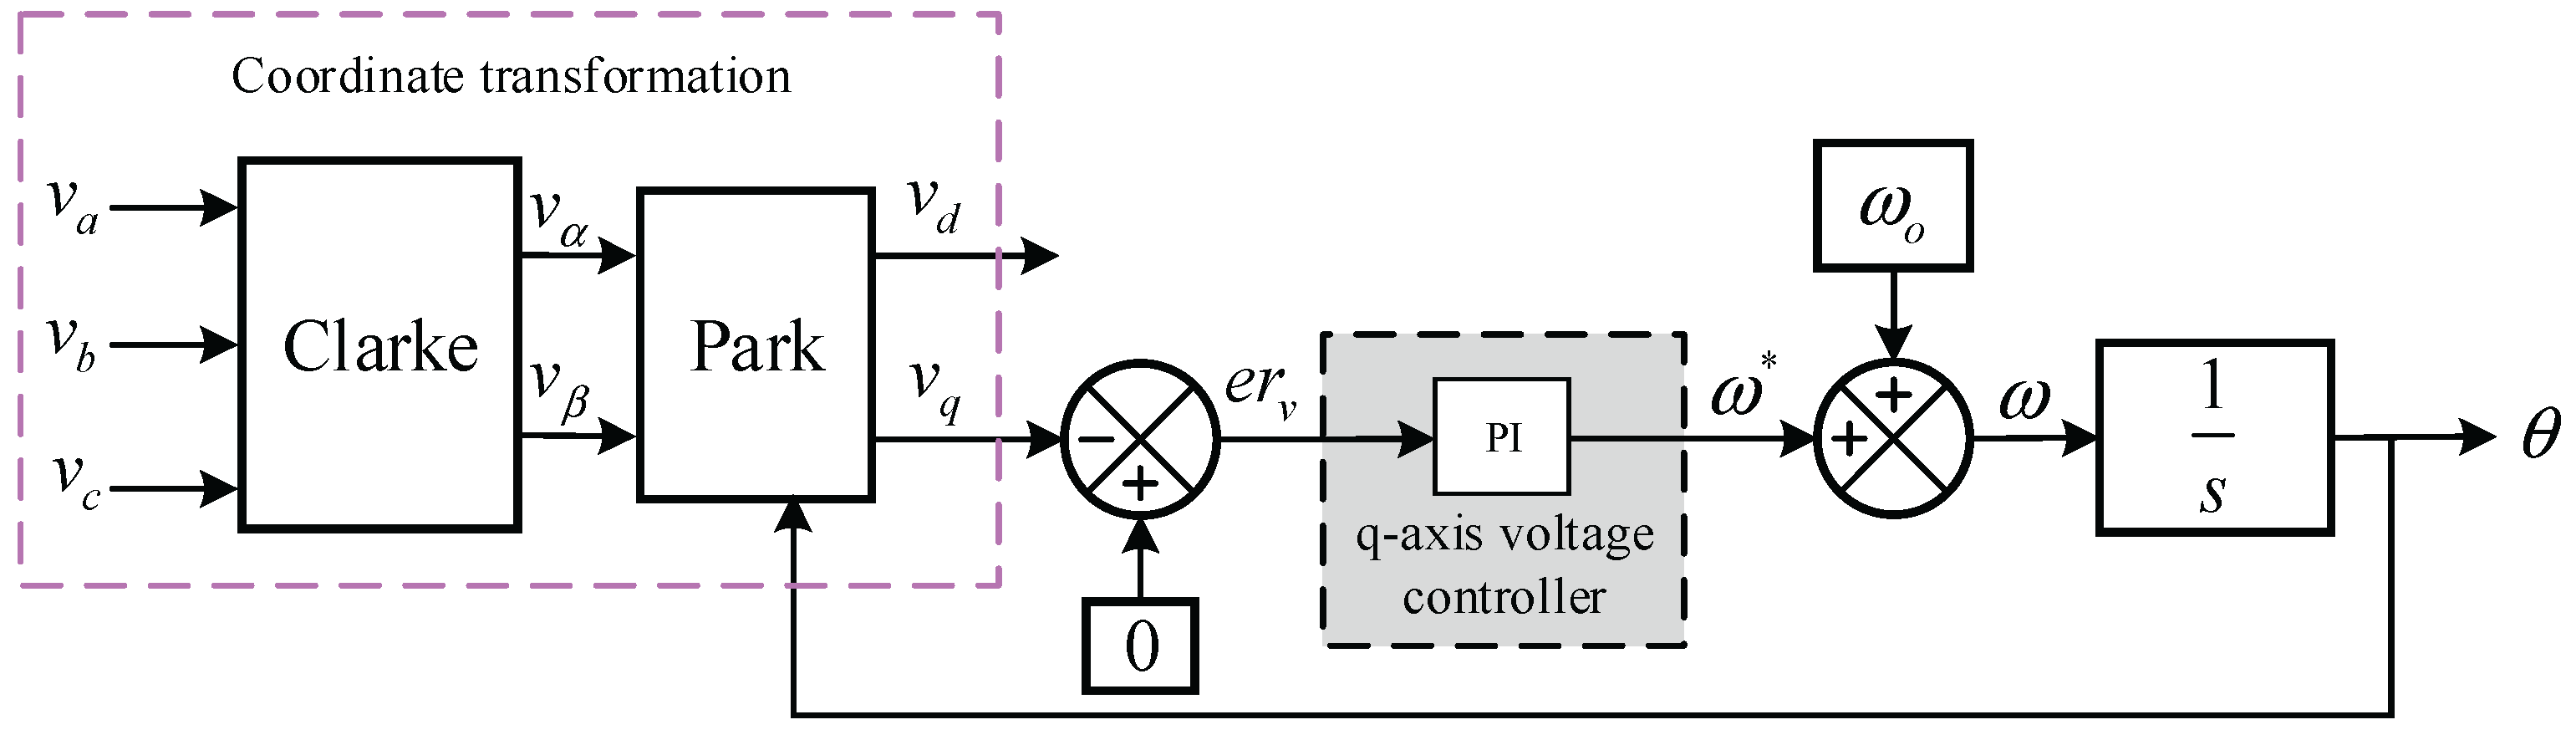
Figure 3.
Energy storage and inverter control architecture during off-peak periods.
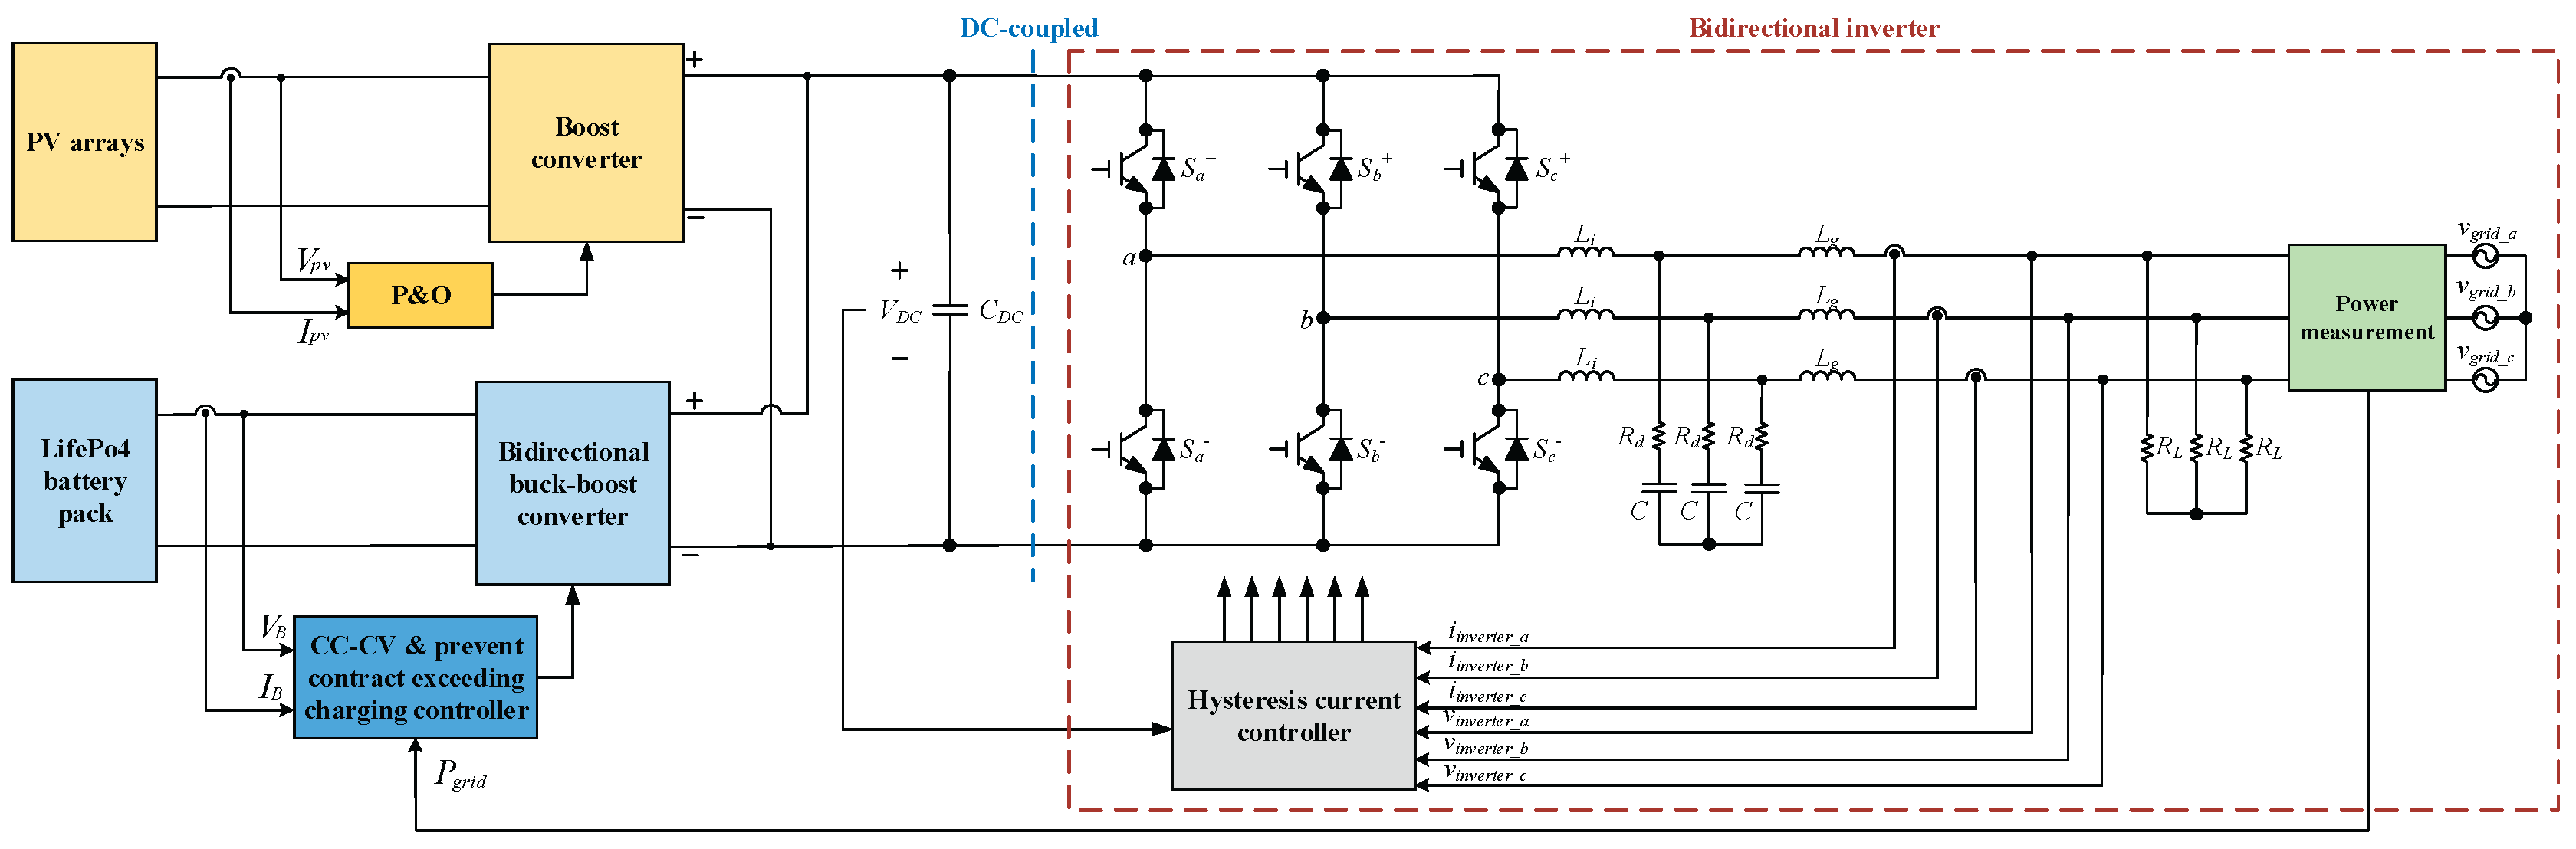
Figure 4.
Block diagram of the CC-CV integrated charging control with anti-over-contract-capacity protection.
Figure 4.
Block diagram of the CC-CV integrated charging control with anti-over-contract-capacity protection.
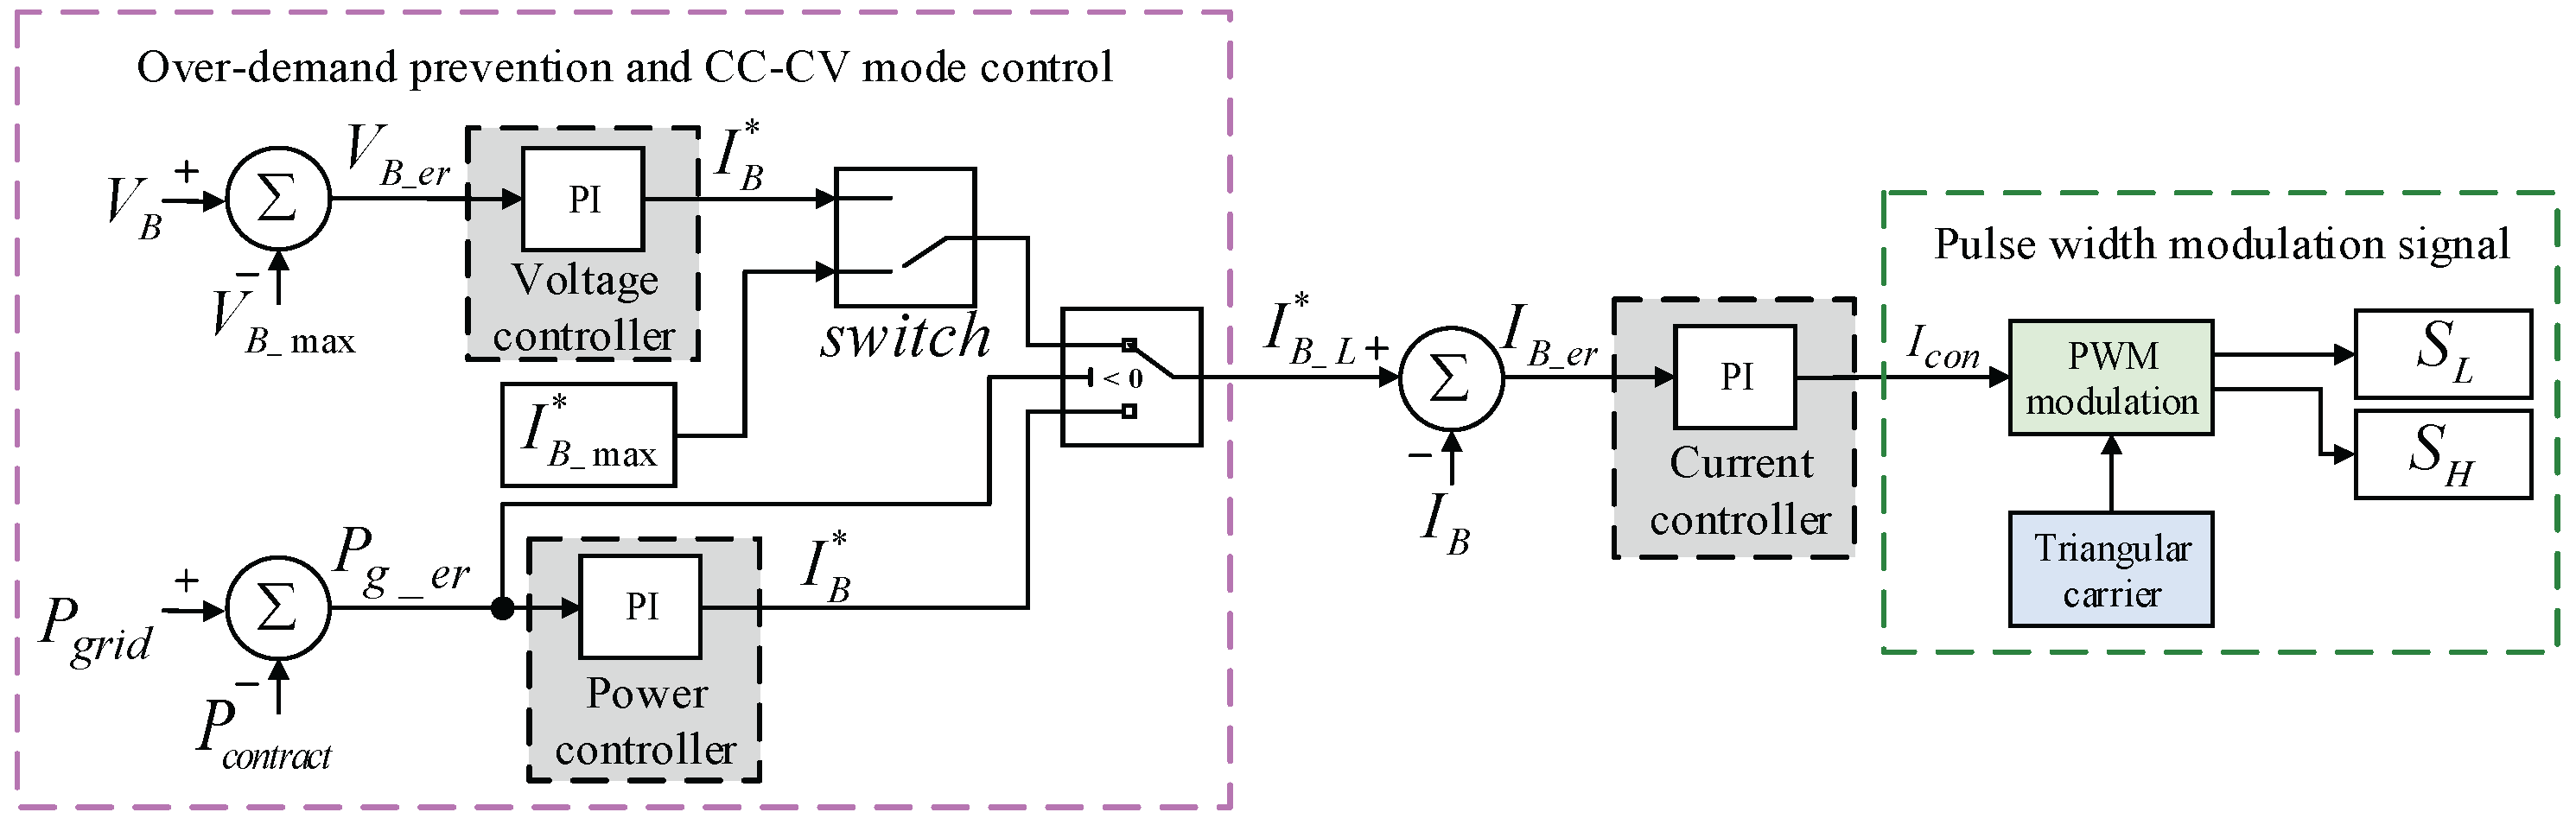
Figure 5.
Block diagram of the hysteresis current control.
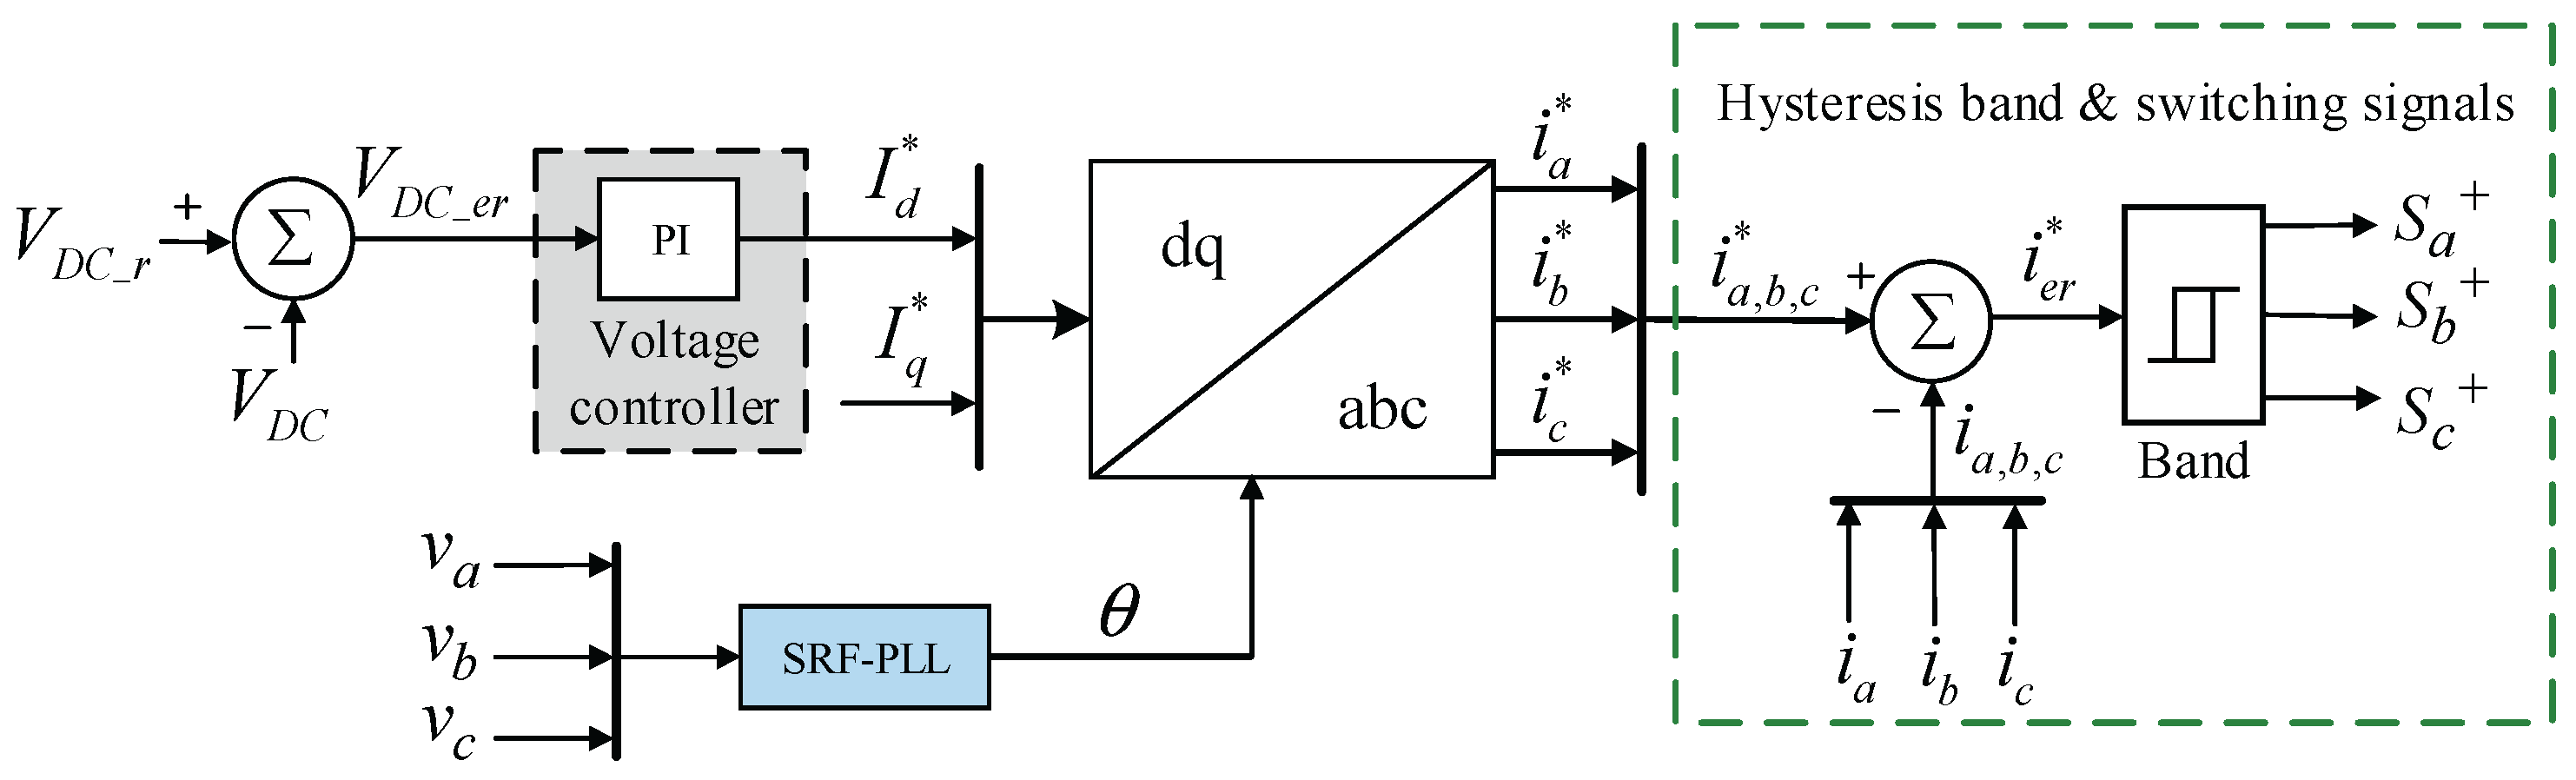
Figure 6.
Comparison of current and switching control signals in hysteresis current control.
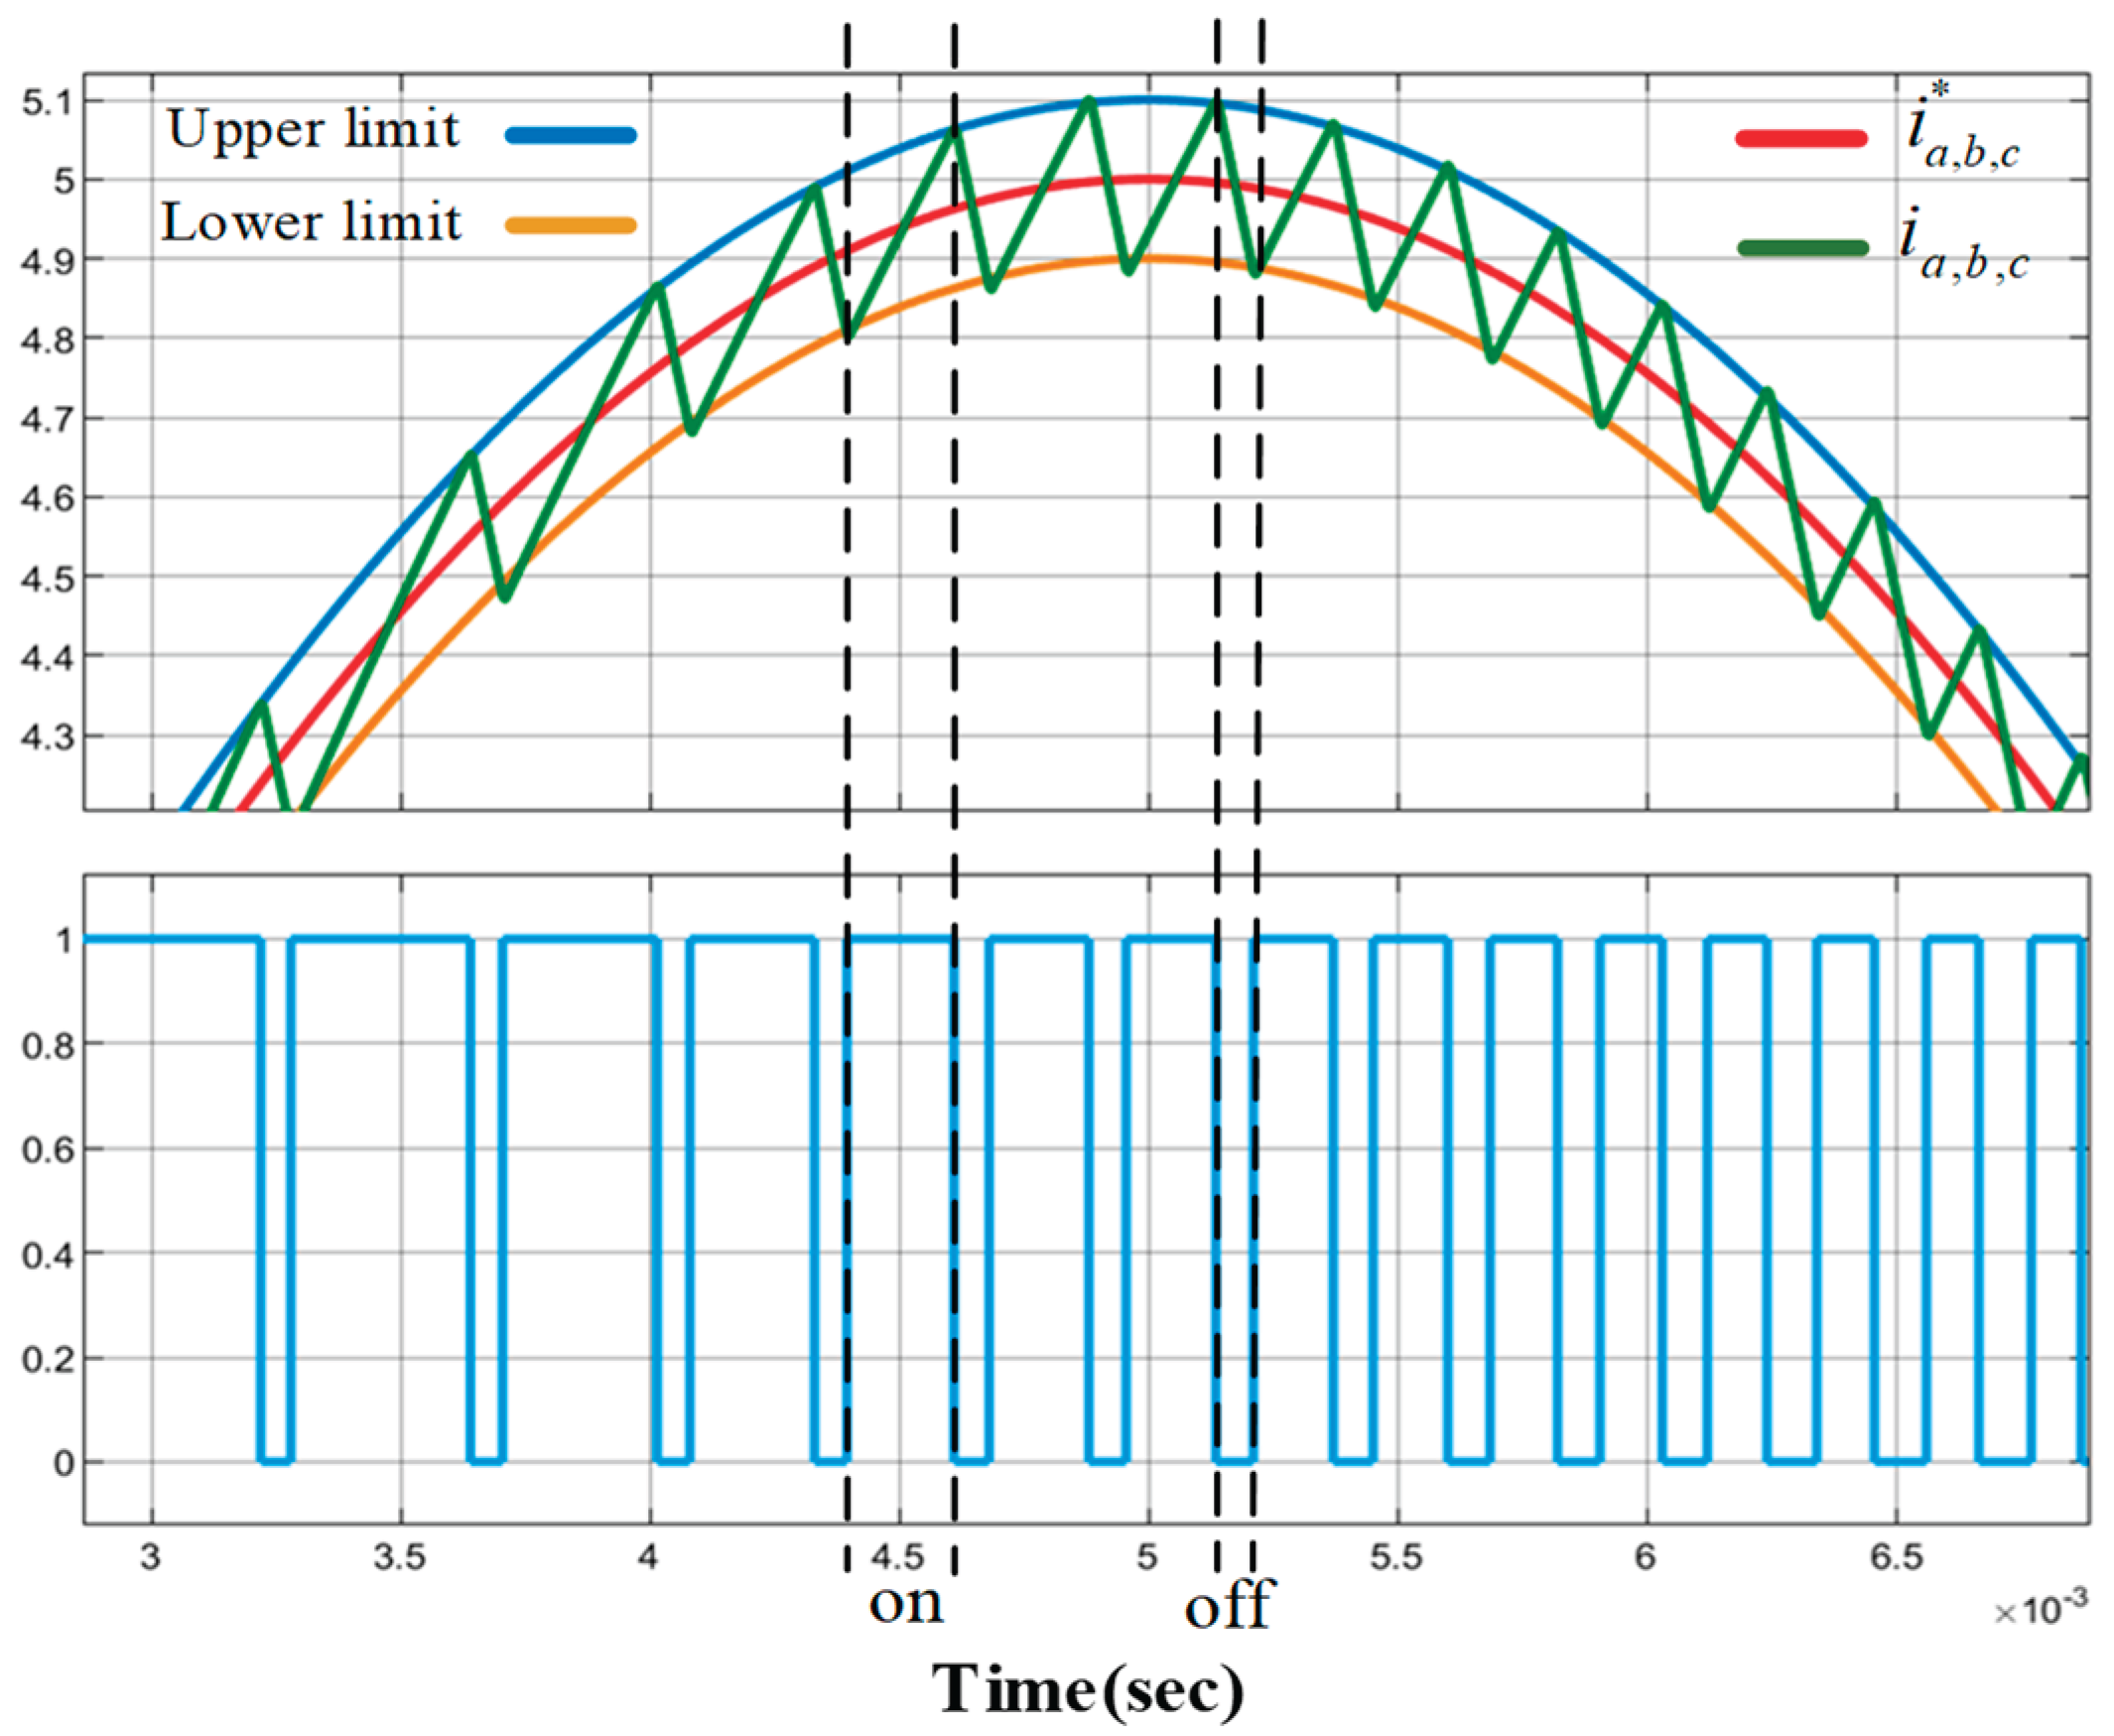
Figure 7.
Energy storage and inverter control architecture during peak periods.
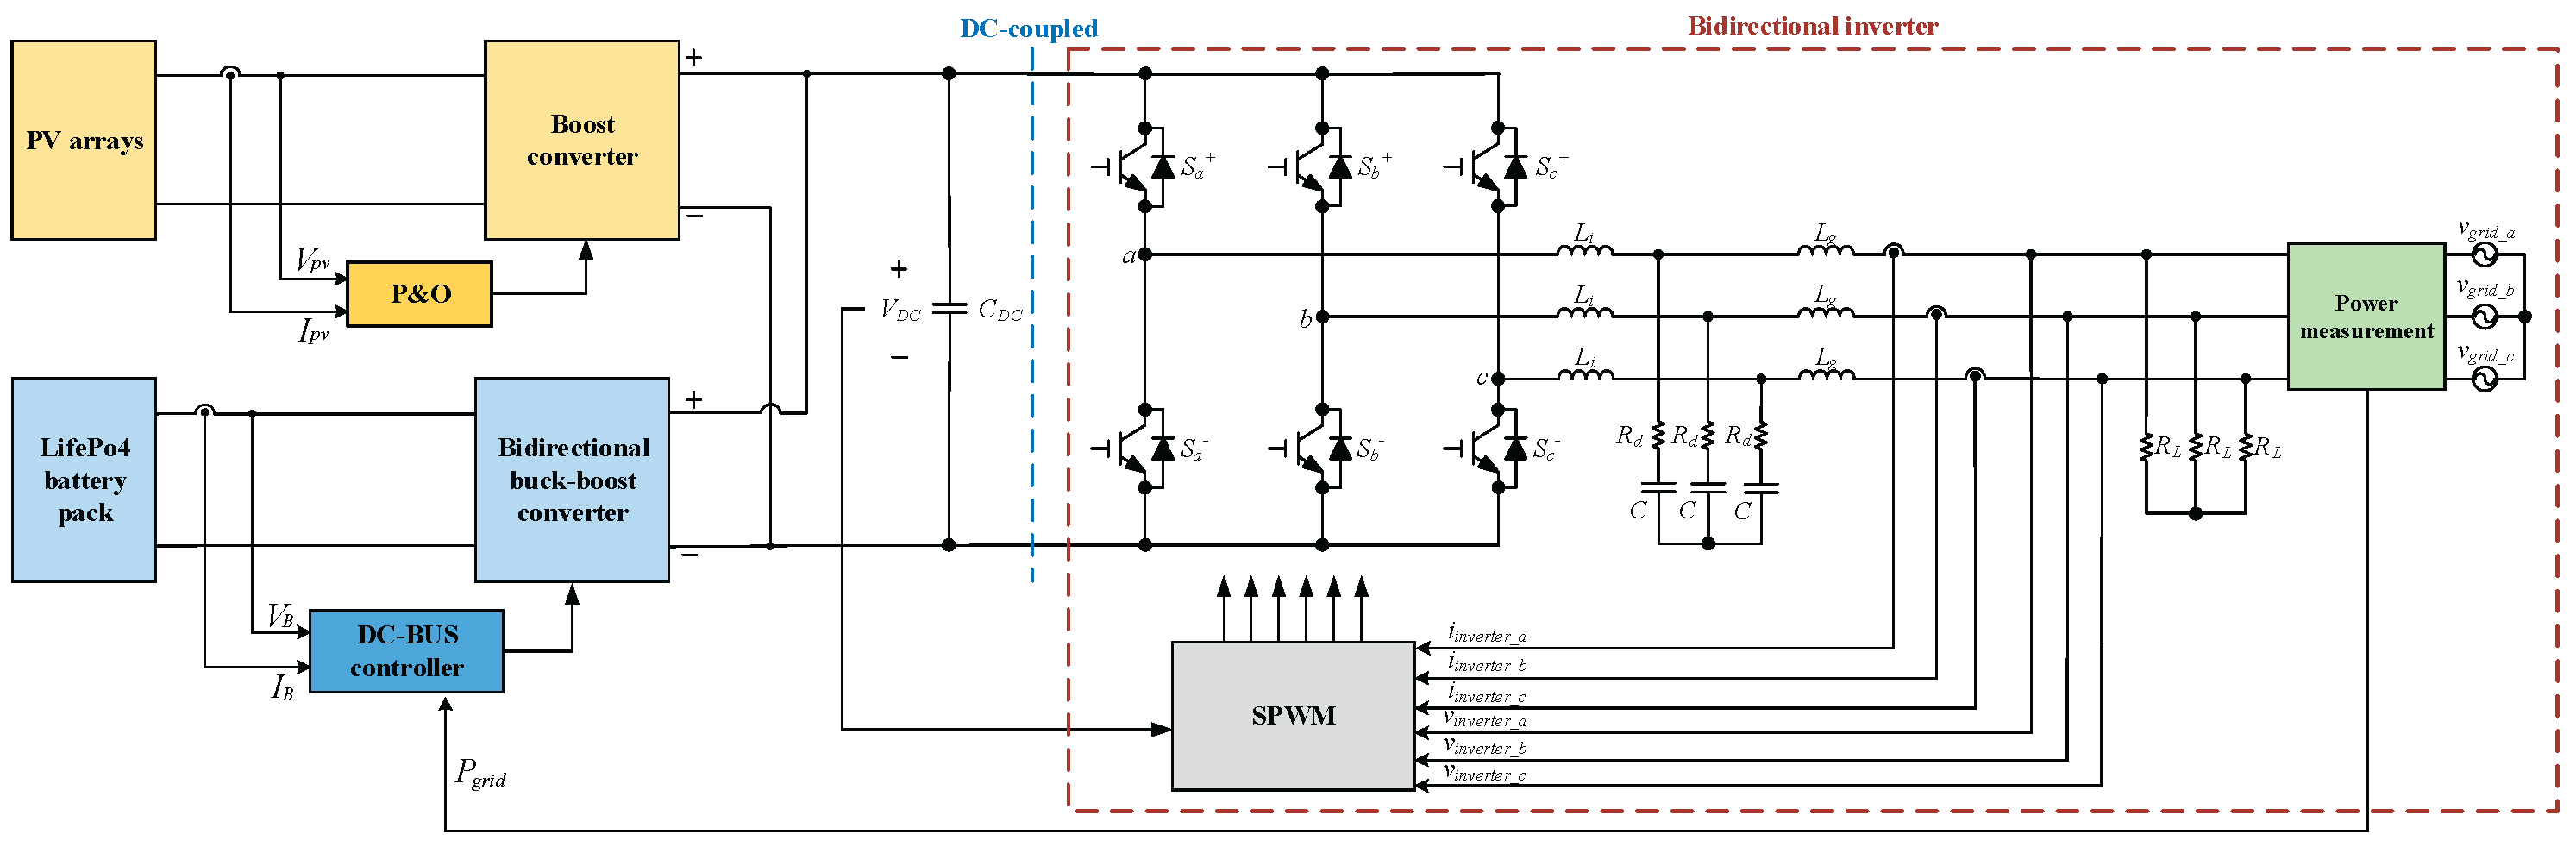
Figure 8.
Block diagram of the inverter active power dispatch and peak shaving controller.
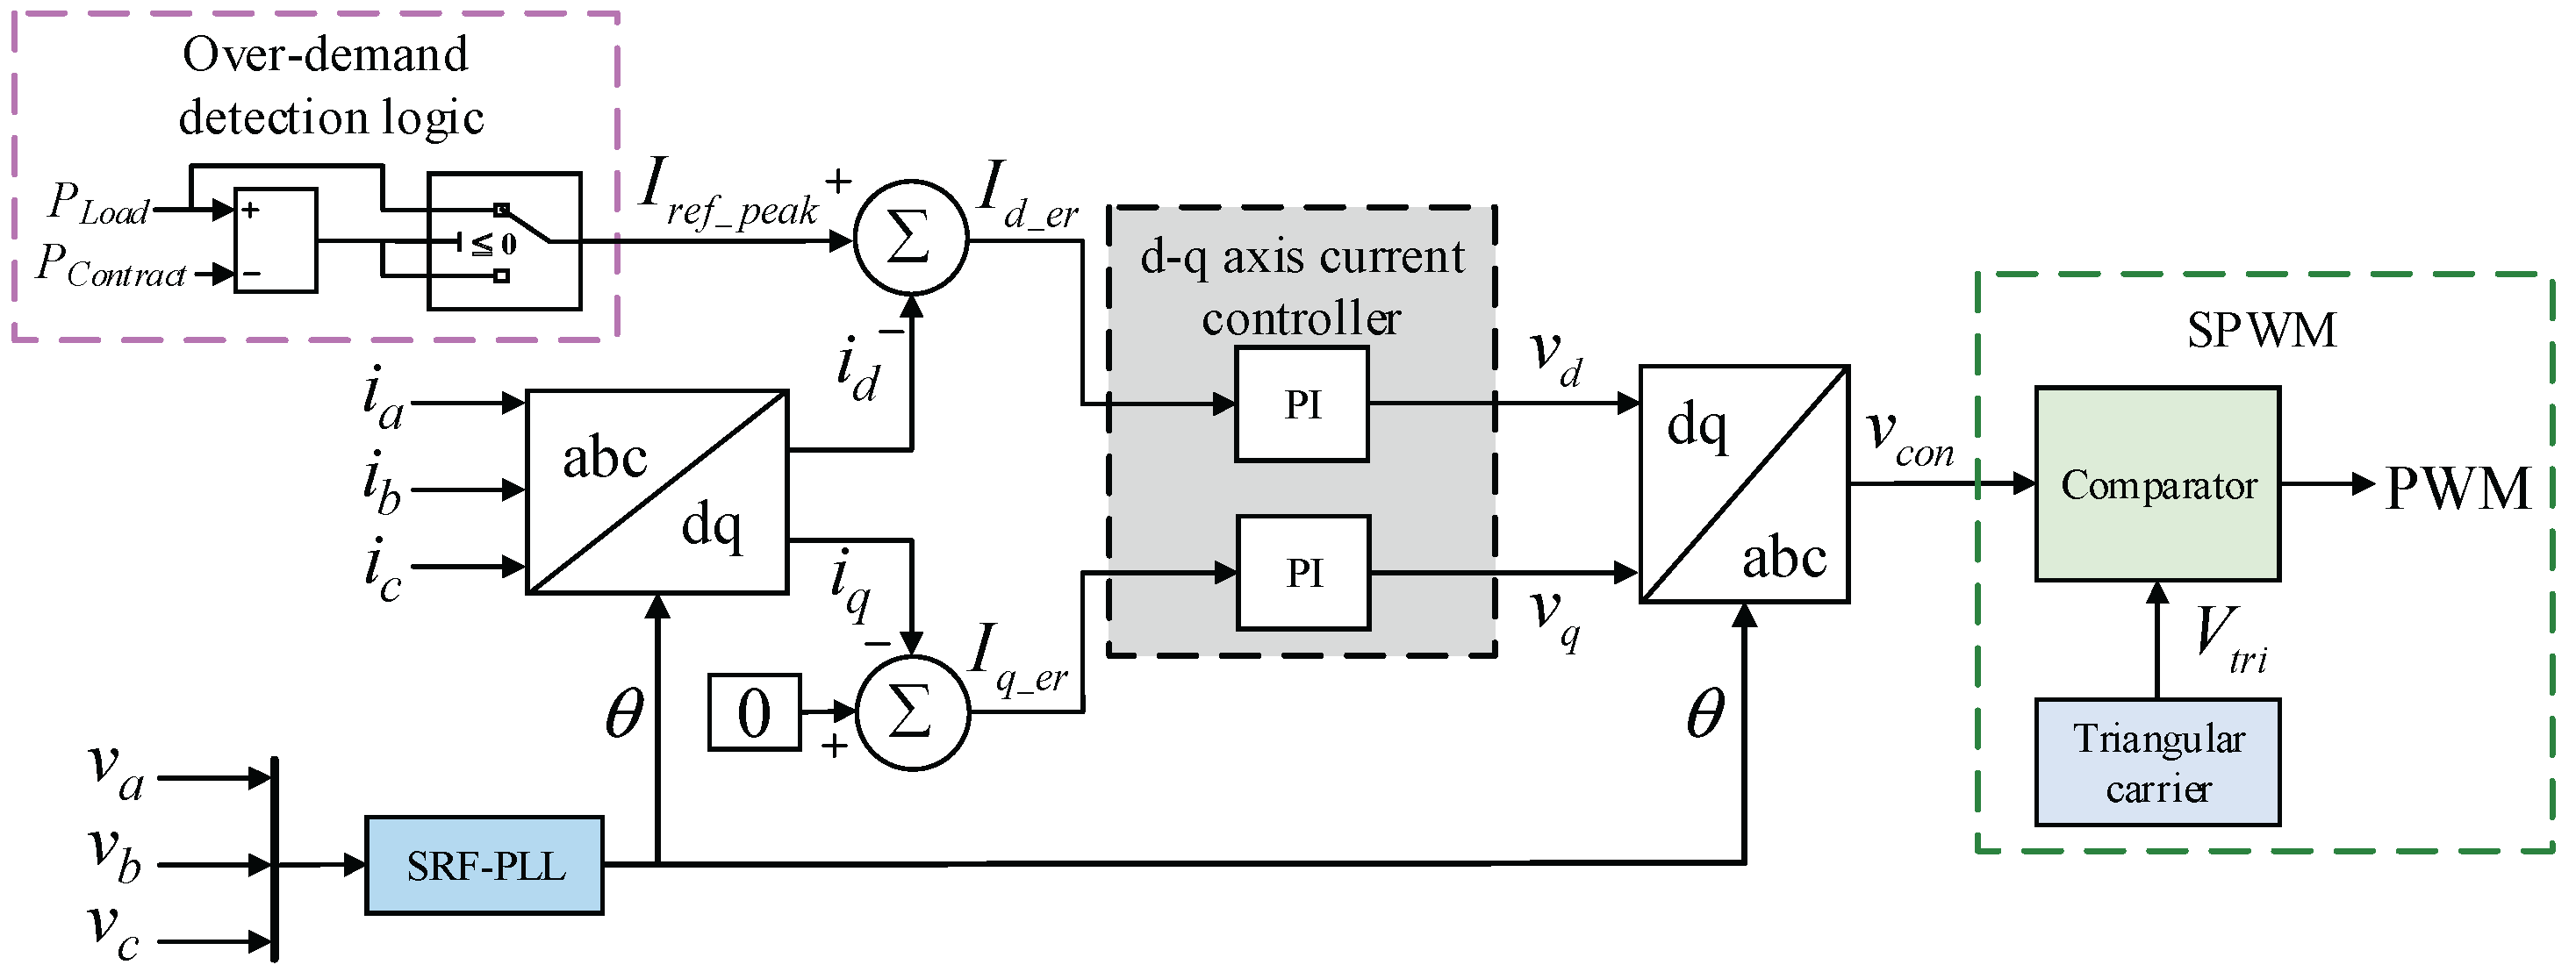
Figure 9.
Block diagram of the lithium-iron phosphate battery charge/discharge control.
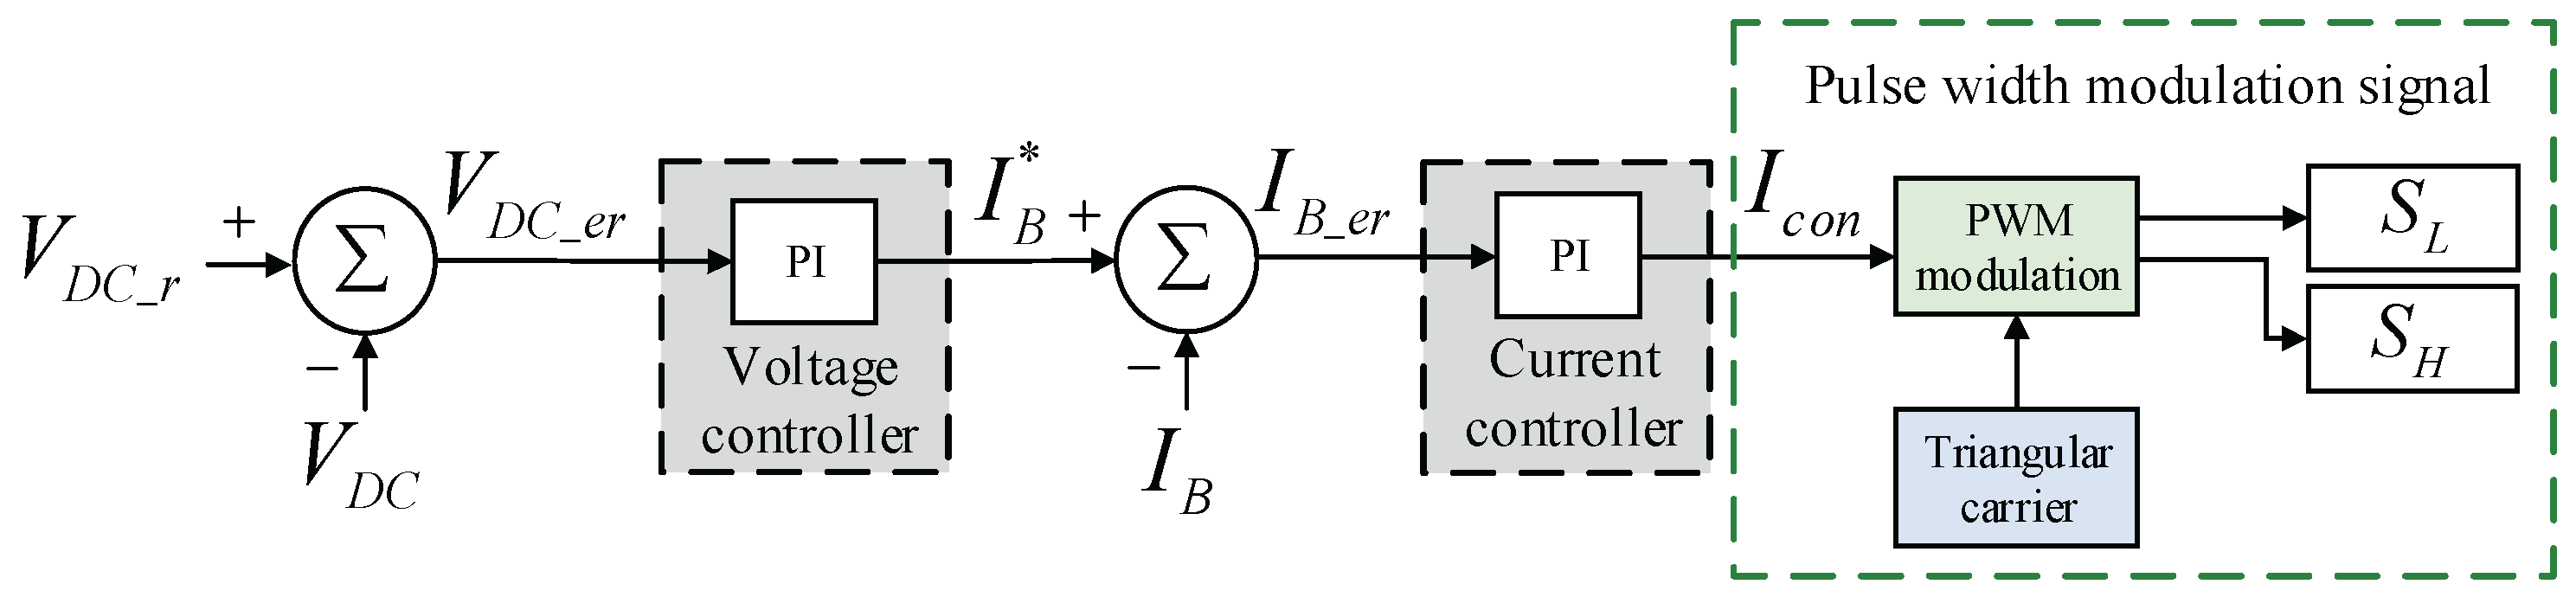
Figure 10.
Block diagram of the inverter DC-link voltage control.
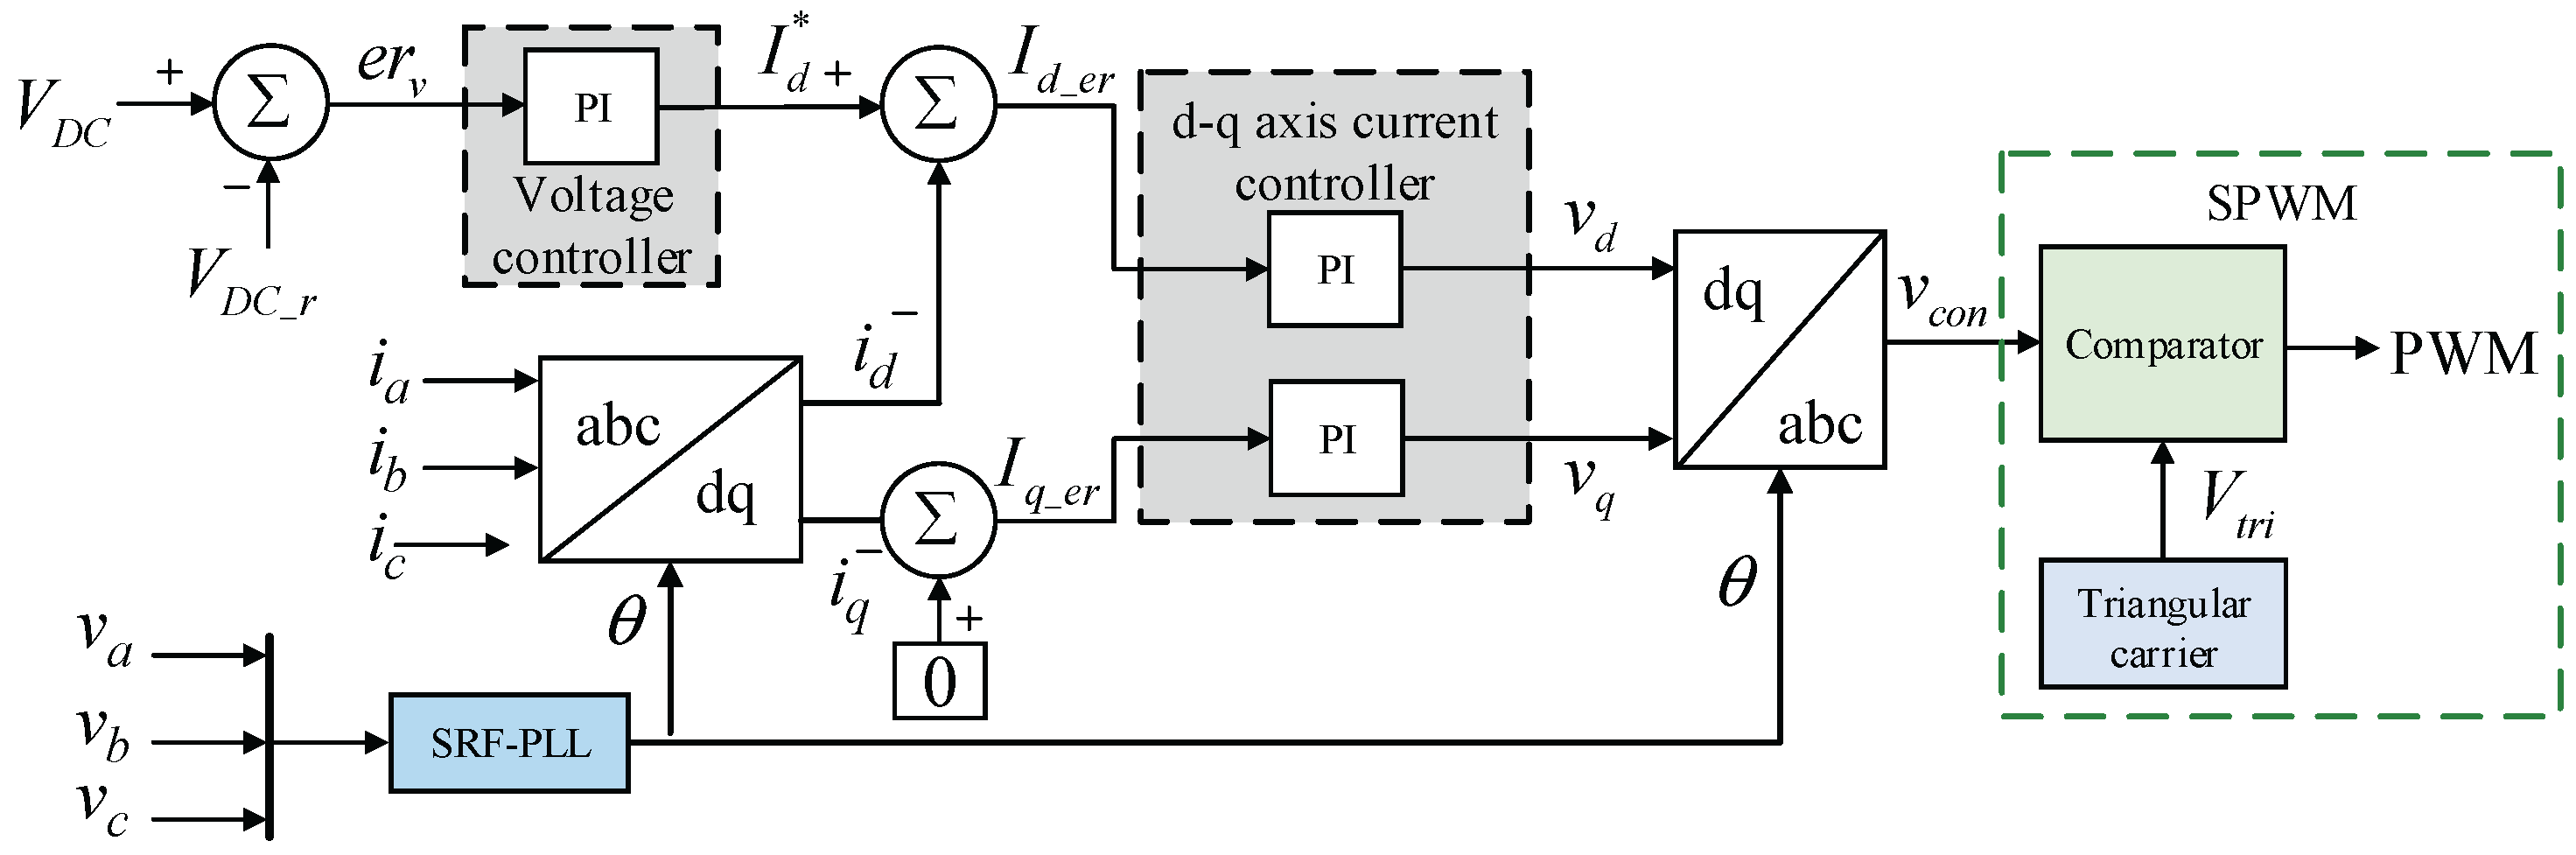
Figure 11.
Schematic diagram of the plant's daily load profile and contract capacity.
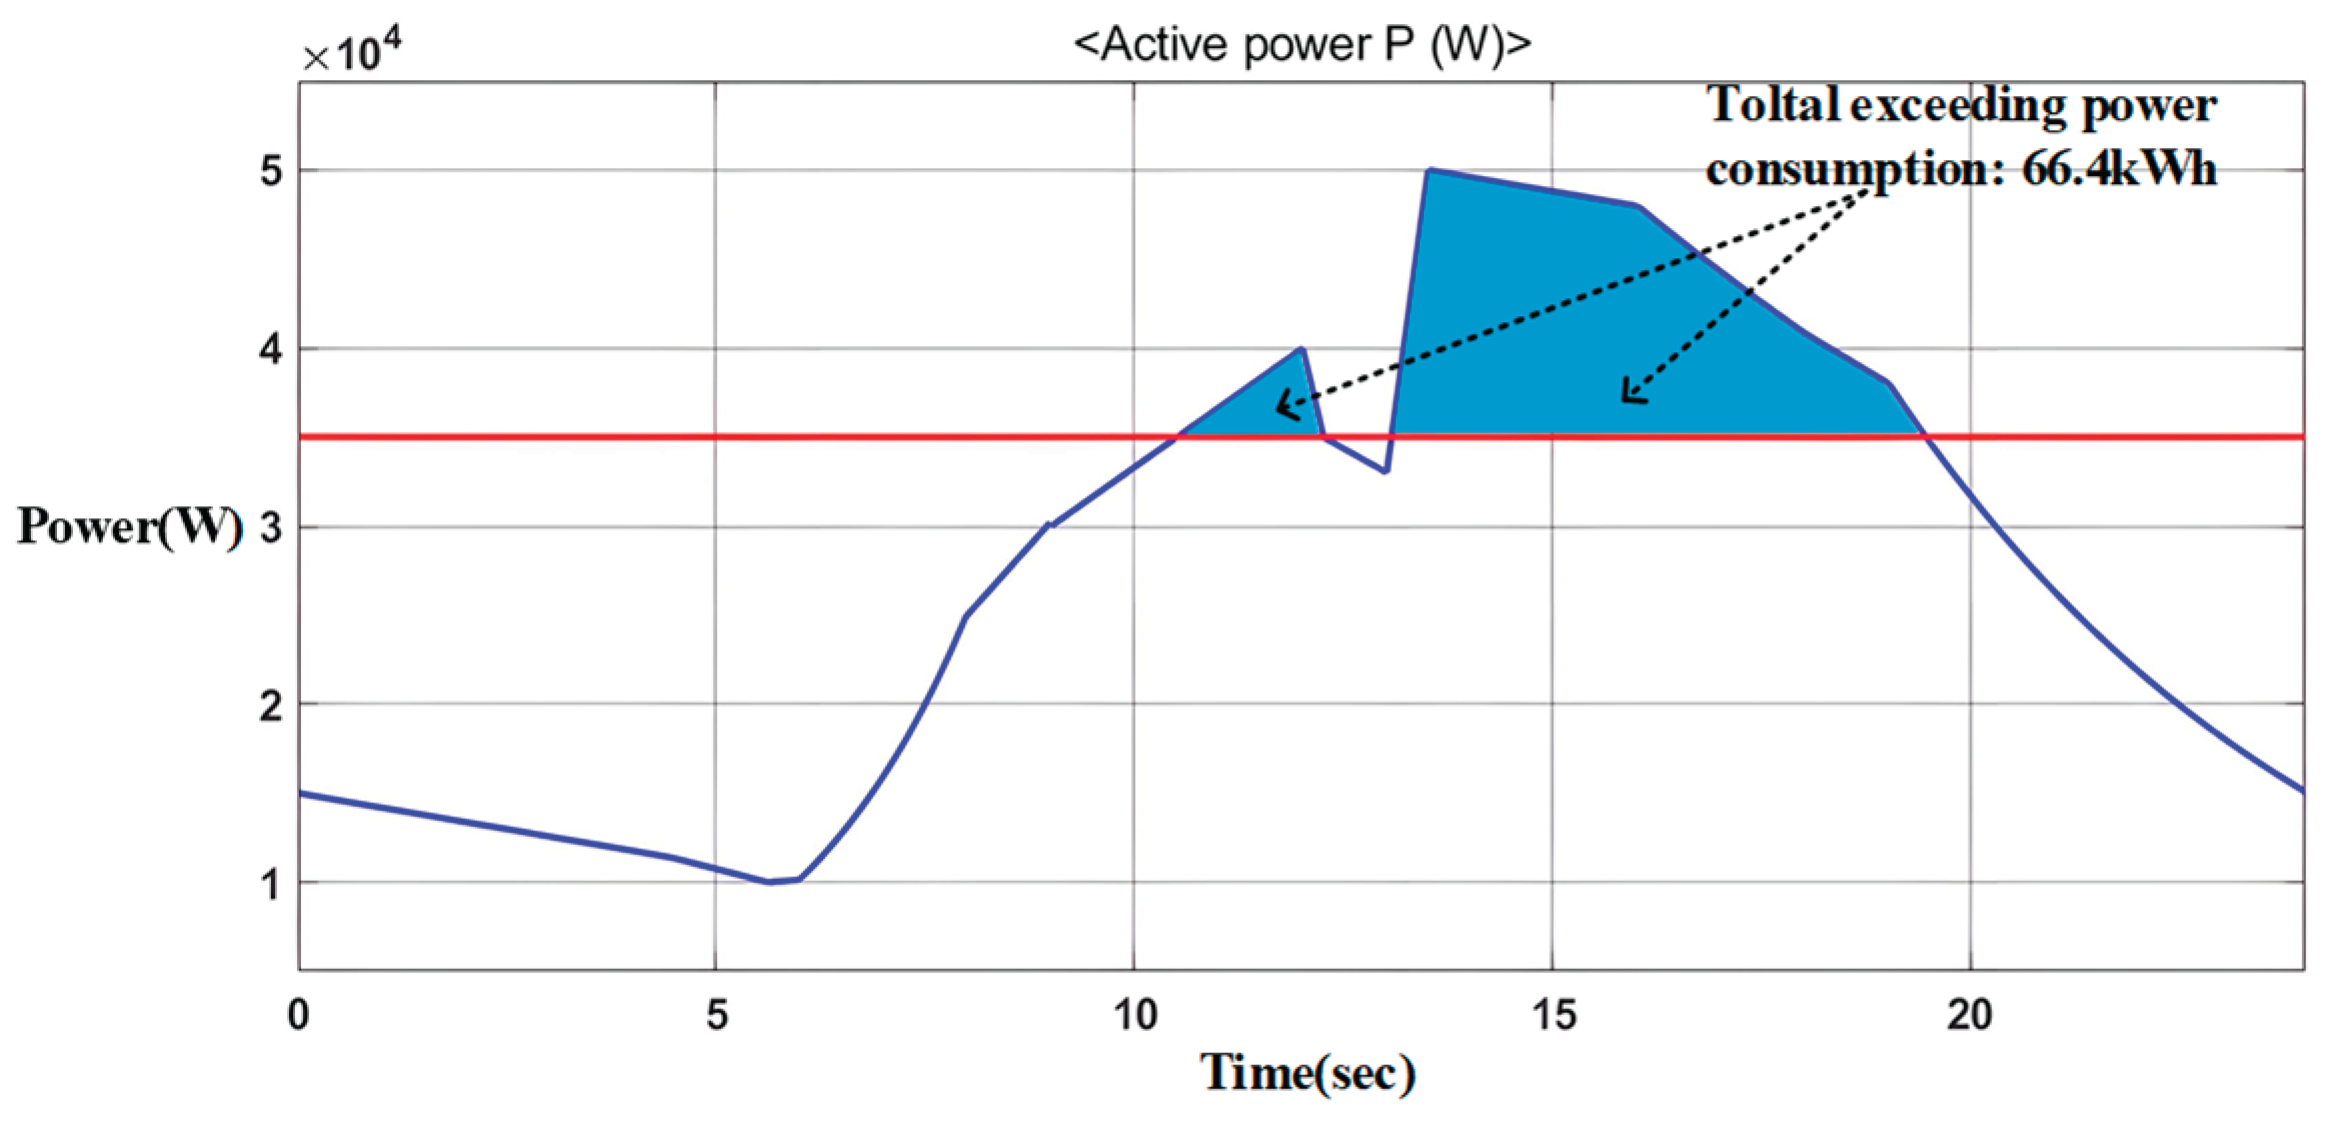
Figure 12.
Assumed solar irradiance profile.
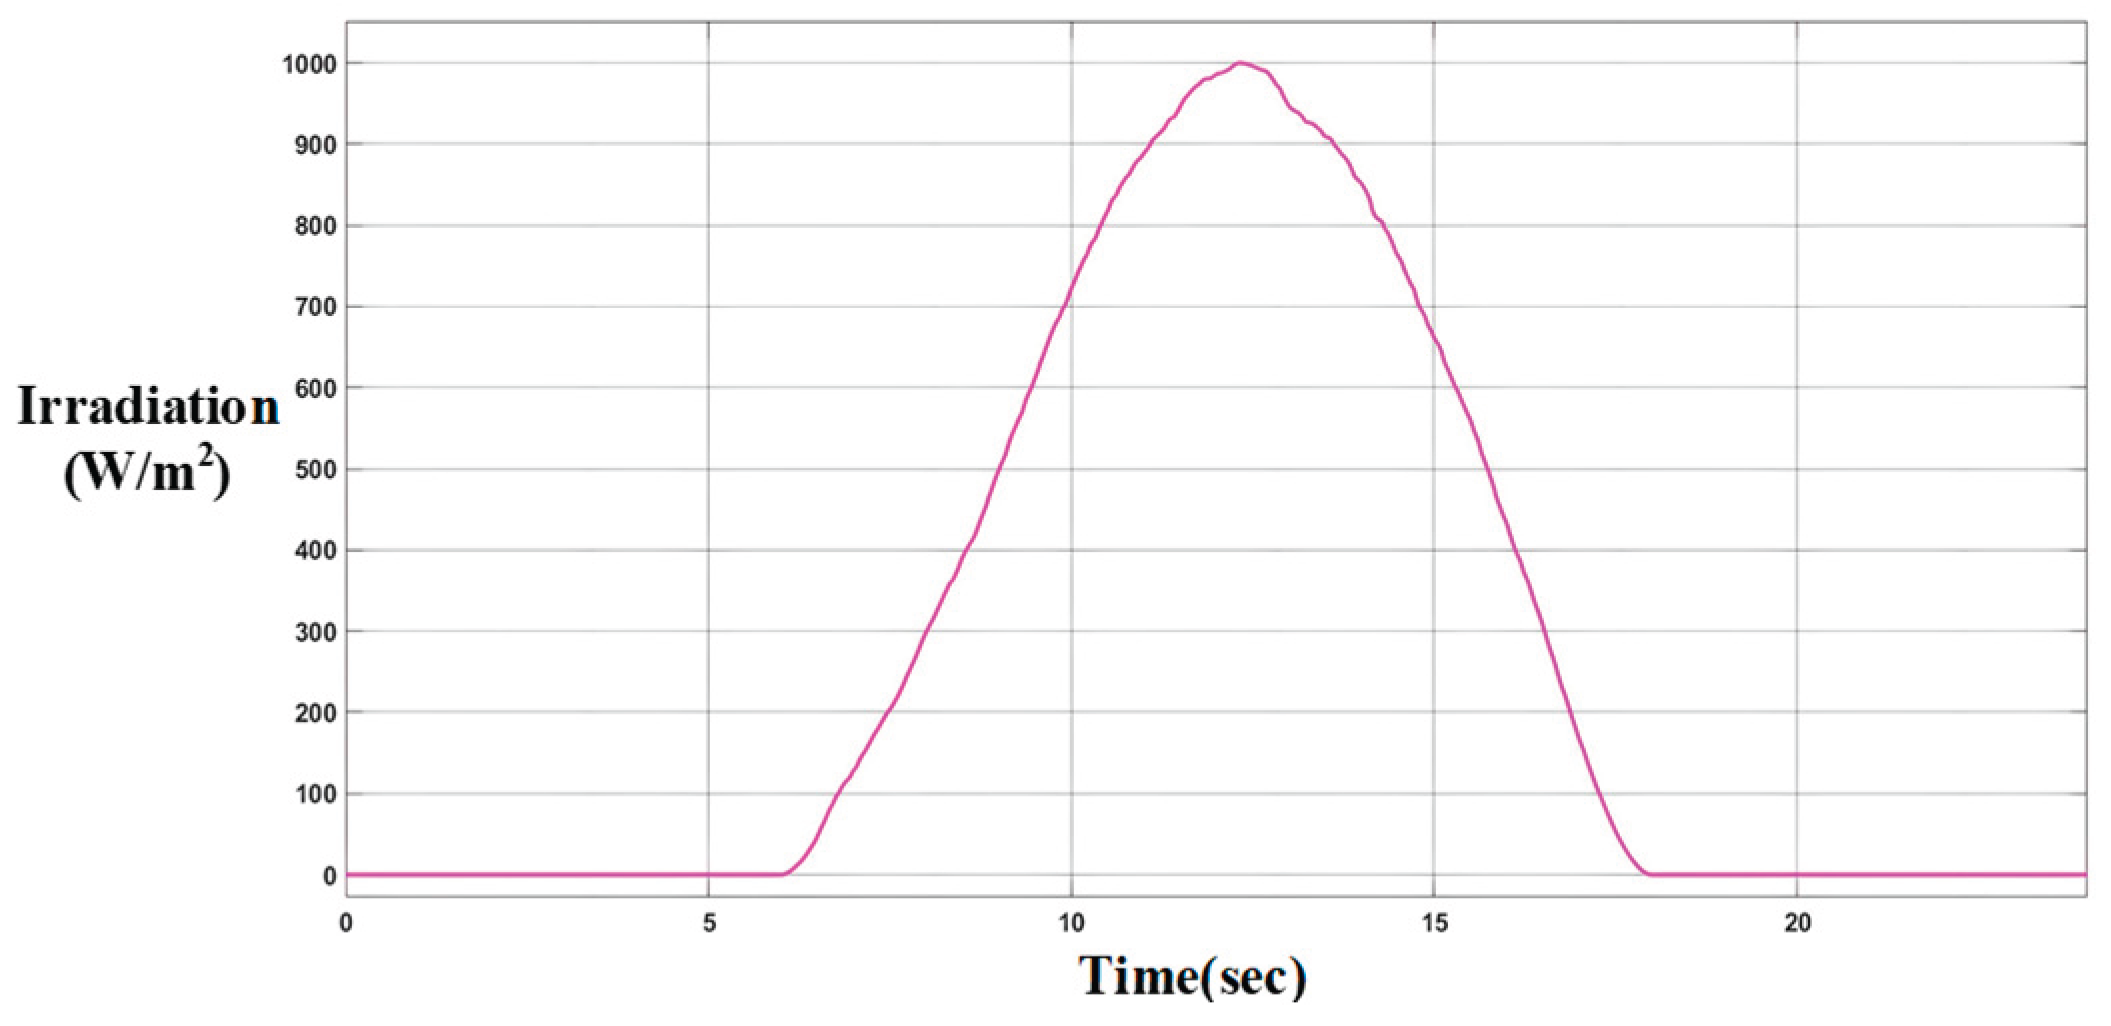
Figure 13.
Conversion efficiency of the boost converter.
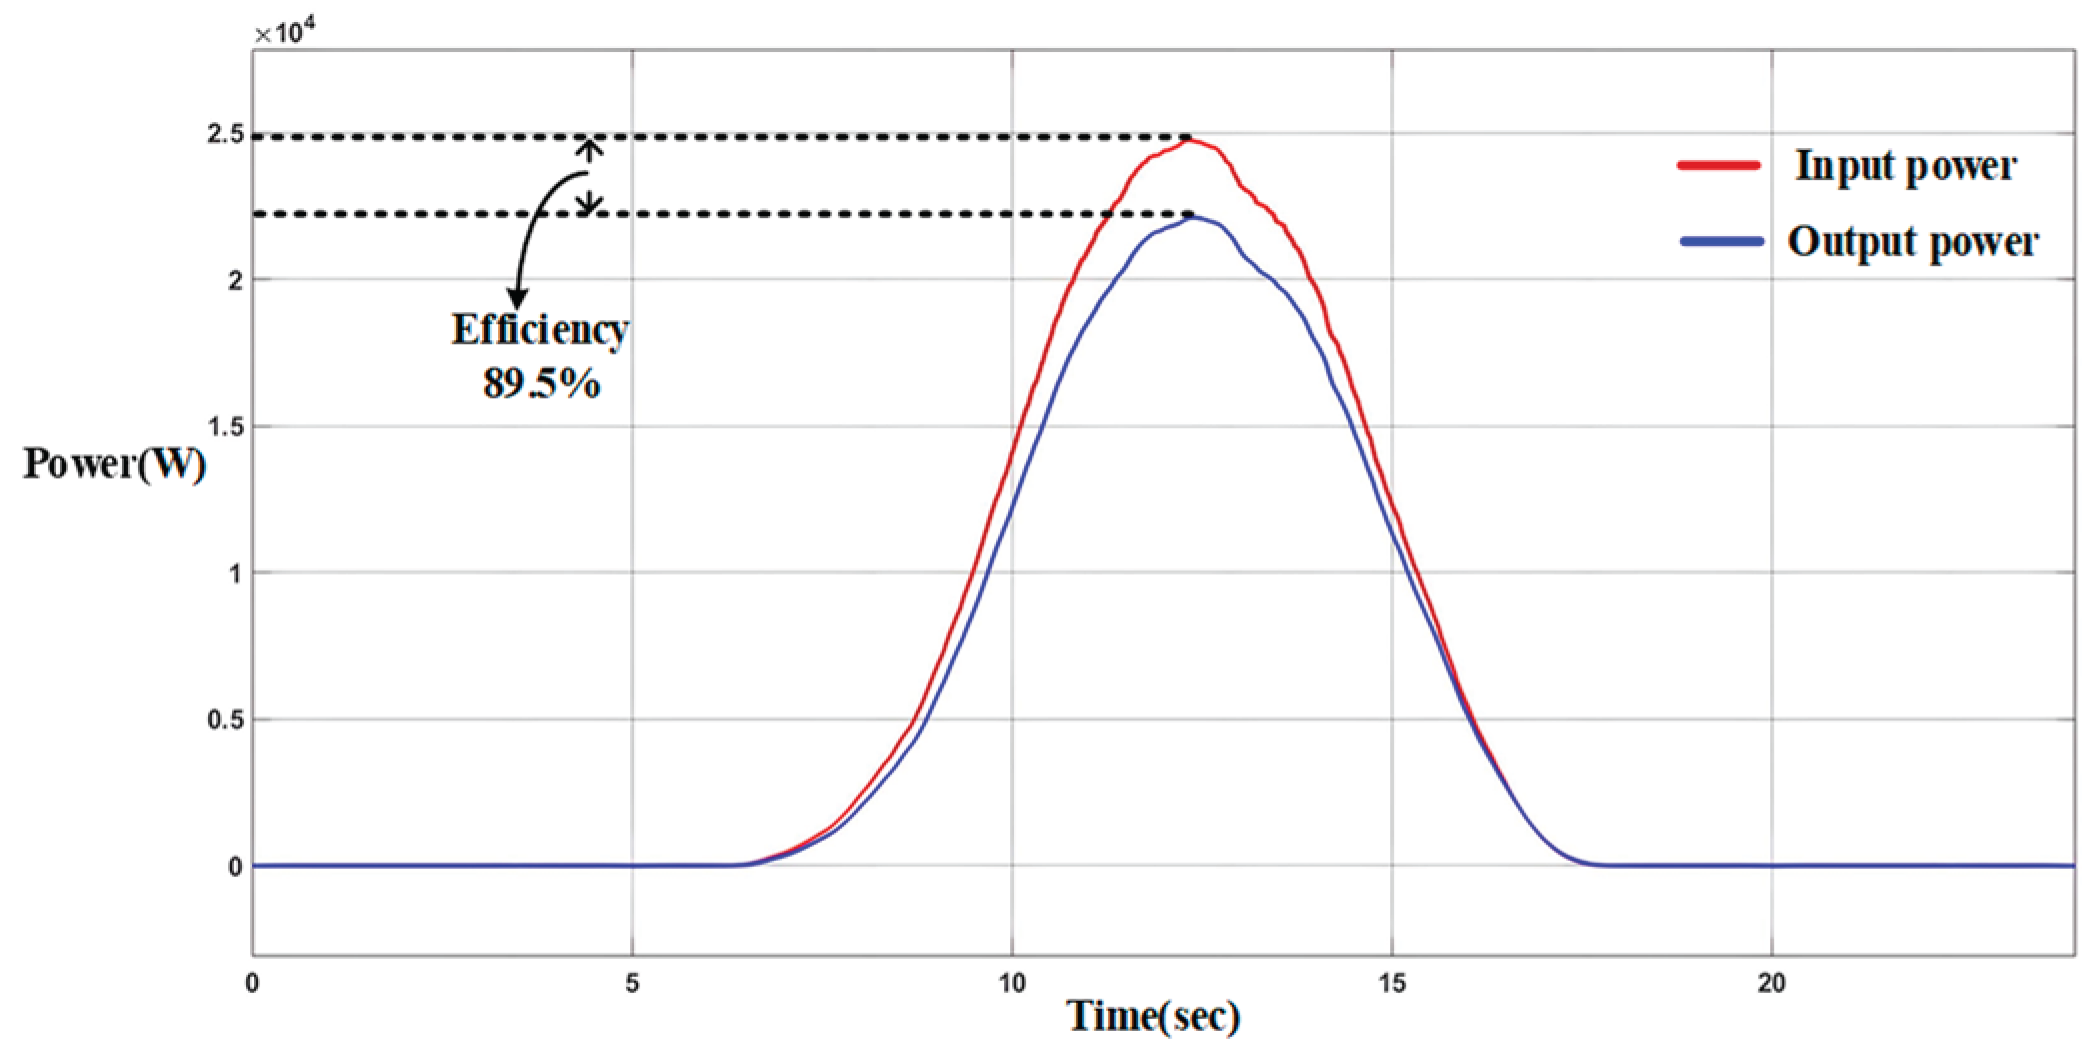
Figure 14.
Comparison of daily load profiles with peak shaving and valley filling control (Battery SOC at 50%).
Figure 14.
Comparison of daily load profiles with peak shaving and valley filling control (Battery SOC at 50%).
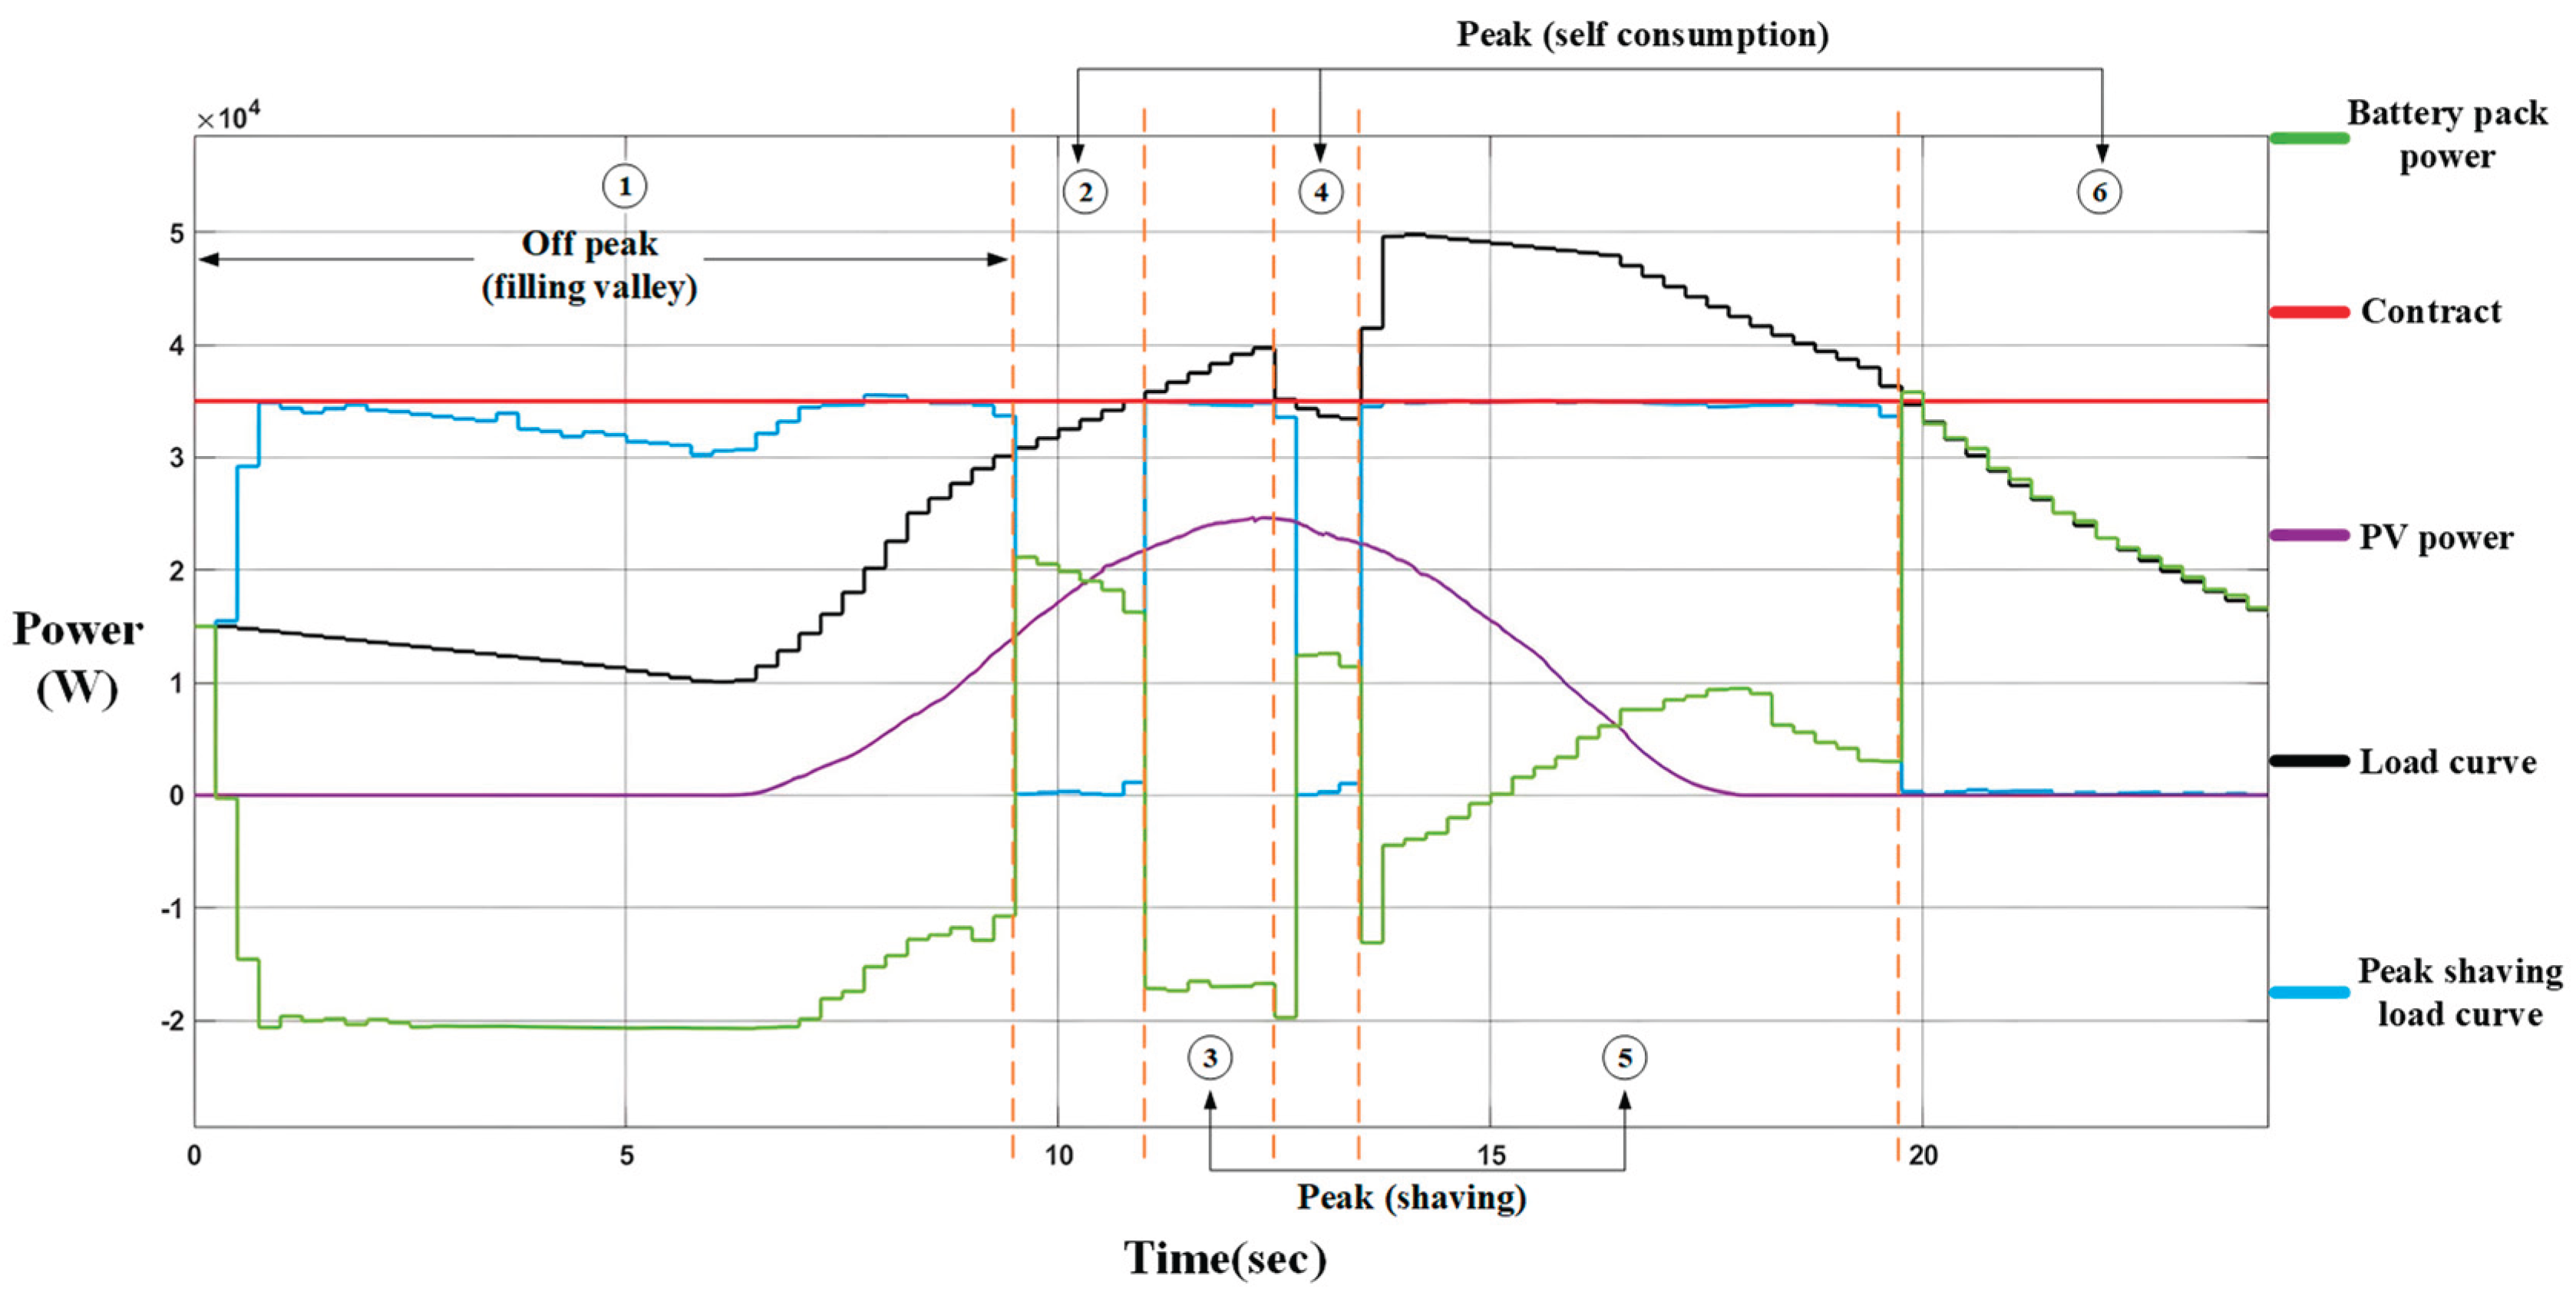
Figure 15.
Comparison of daily load profiles with peak shaving and valley filling control (Battery SOC at 90%).
Figure 15.
Comparison of daily load profiles with peak shaving and valley filling control (Battery SOC at 90%).
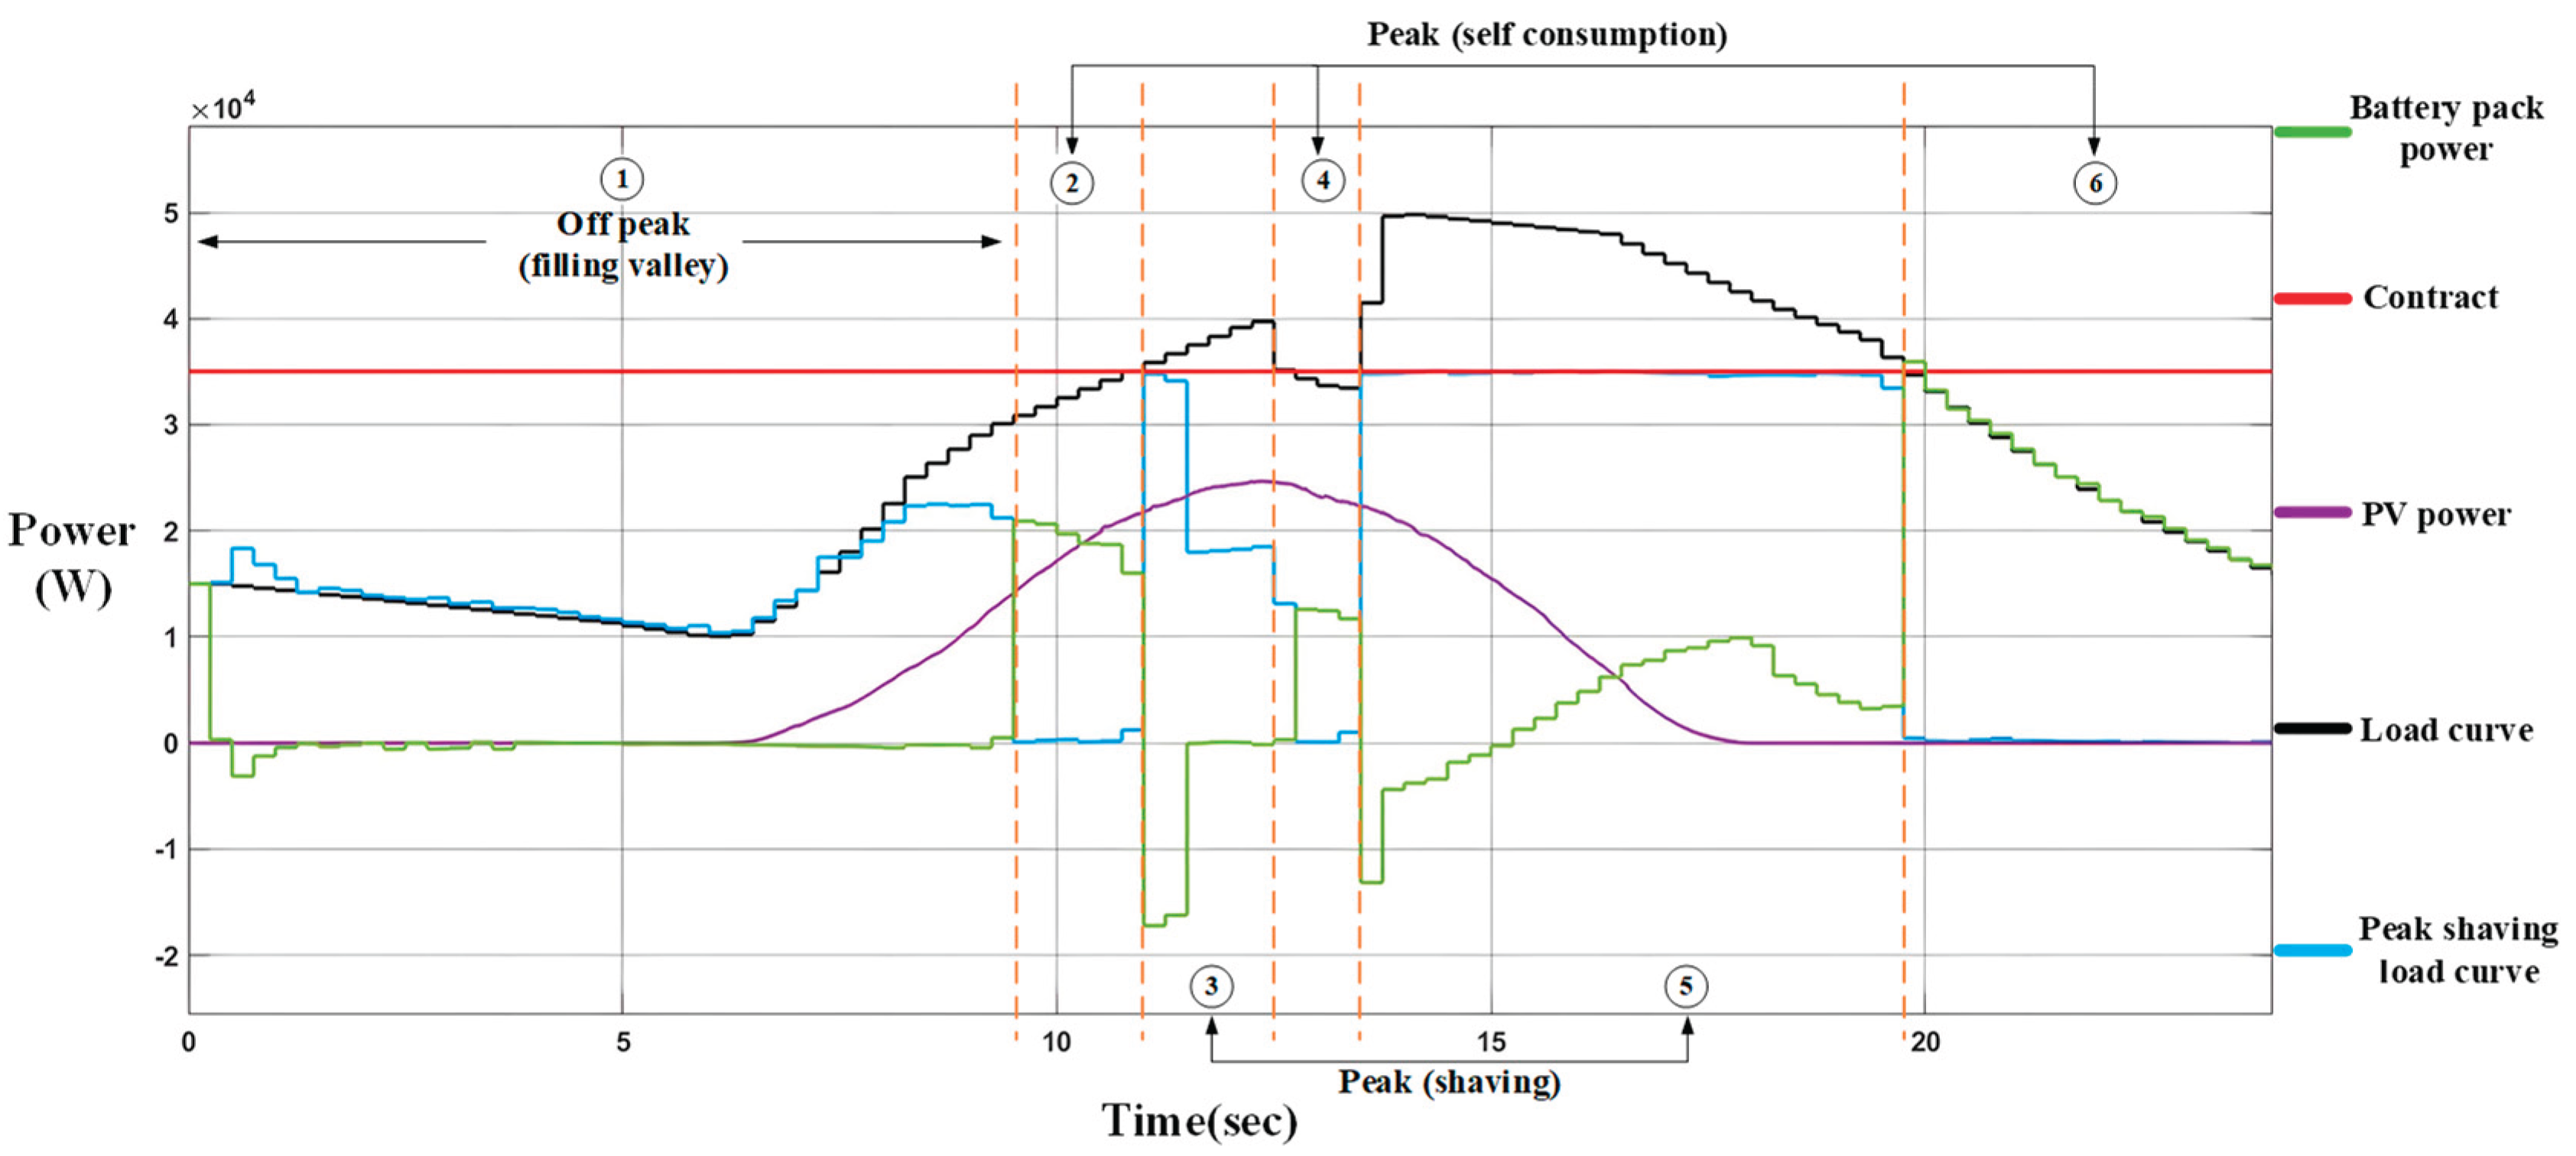
Figure 16.
Comparison of daily load profiles with peak shaving and valley filling control (Battery SOC at 10%).
Figure 16.
Comparison of daily load profiles with peak shaving and valley filling control (Battery SOC at 10%).
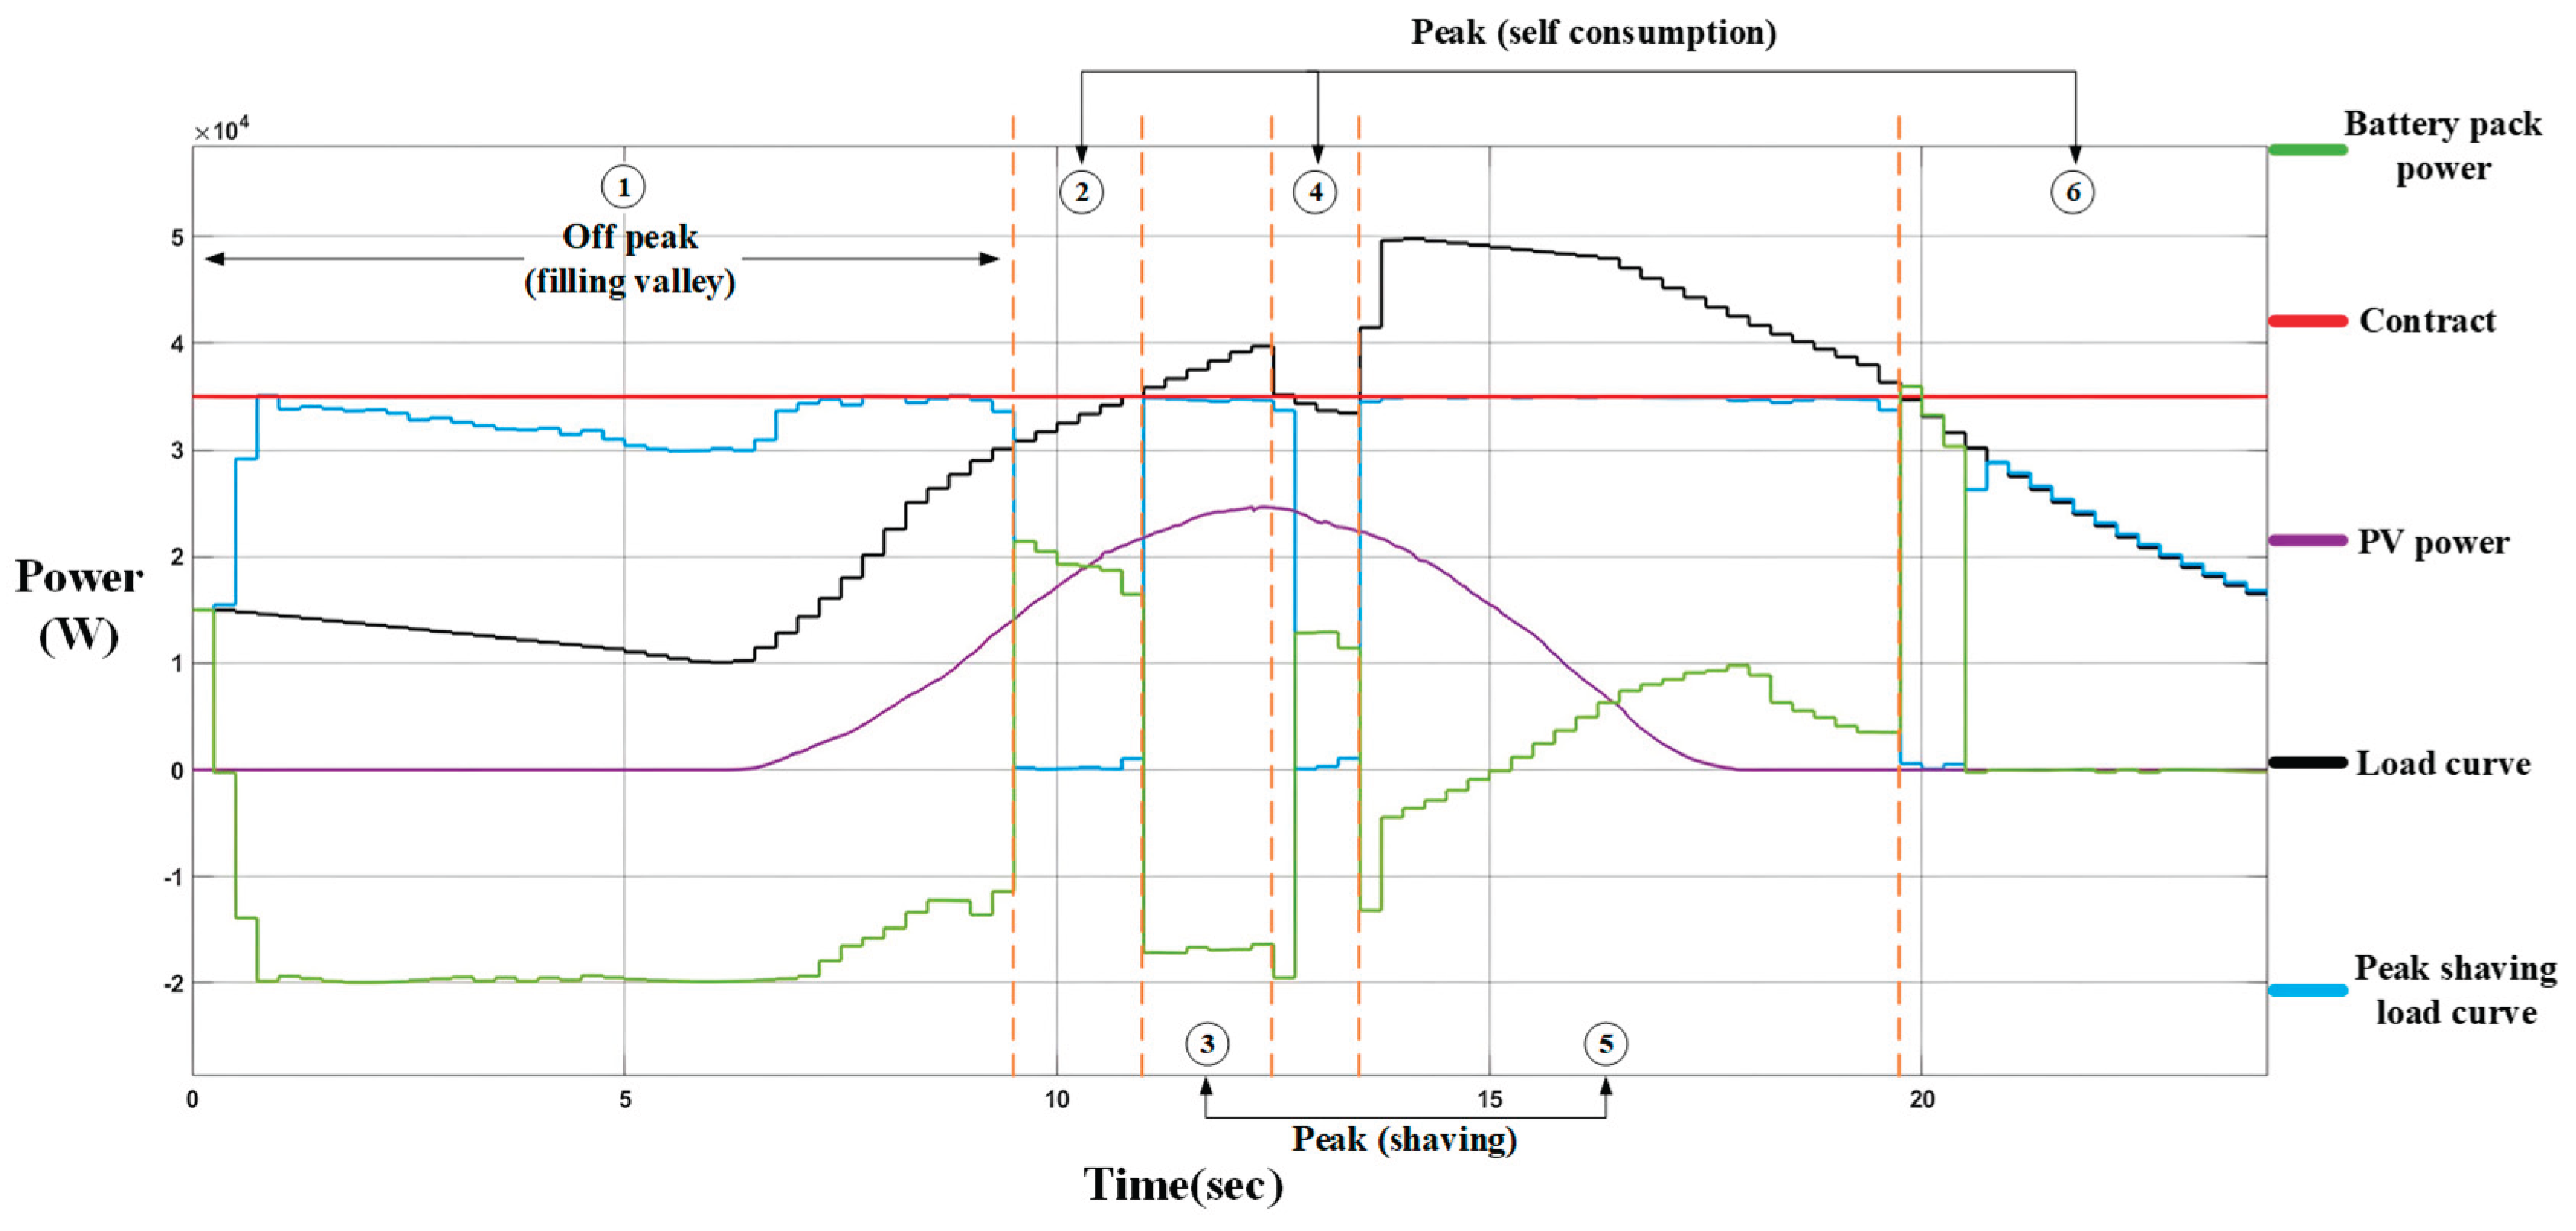
Figure 17.
Battery charging response using the CC-CV controller at 10% SOC.
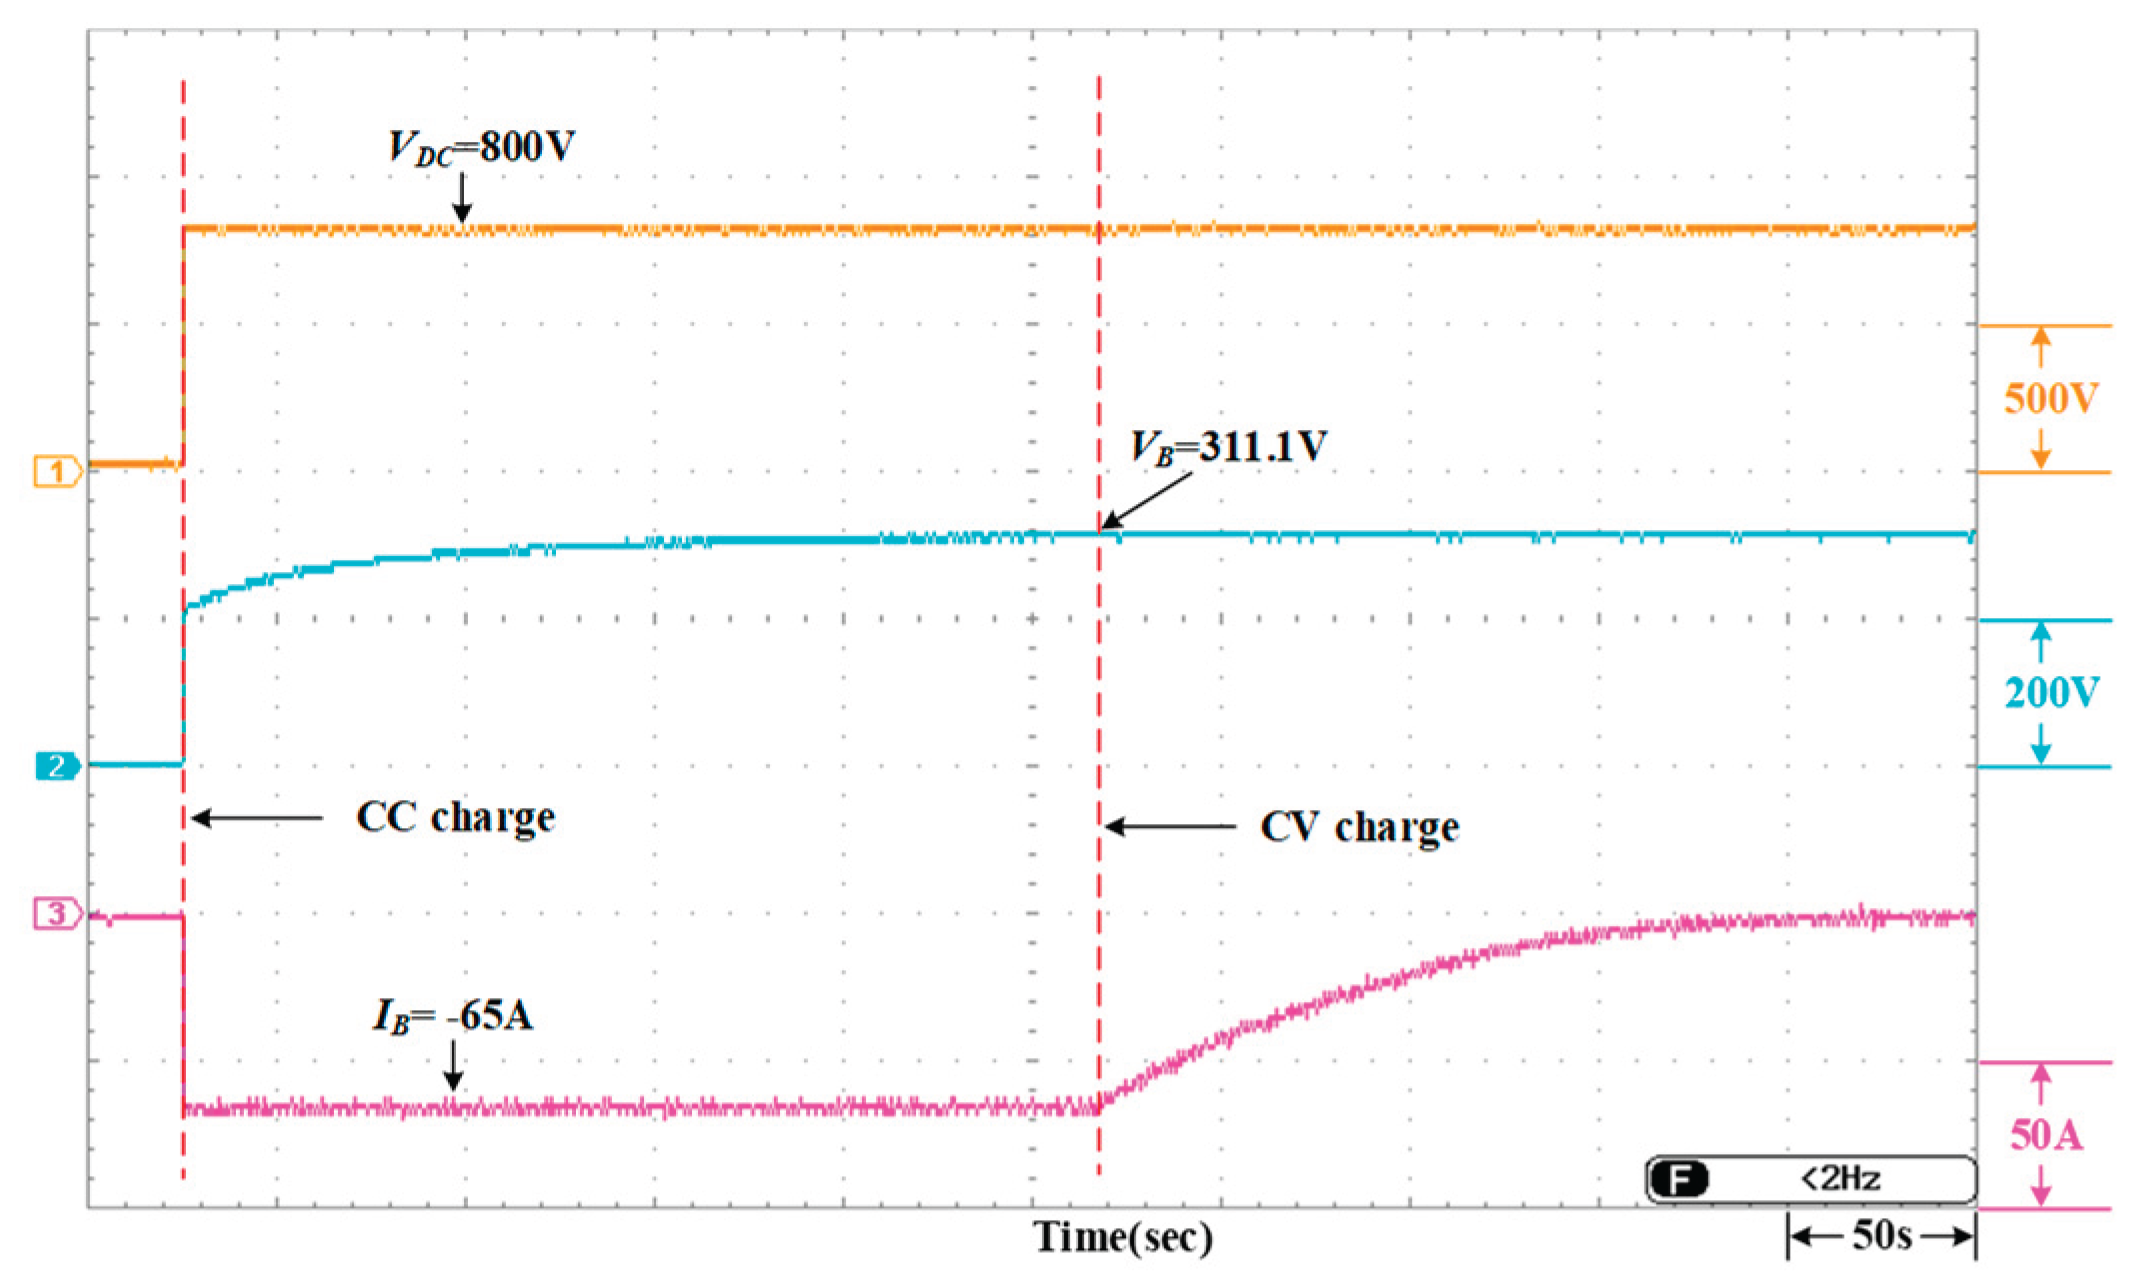
Figure 18.
Measured voltage and current waveforms of the inverter using hysteresis current control: (a) Battery SOC 10%–75%; (b) Battery SOC 85%; (c) Battery SOC 90%.
Figure 18.
Measured voltage and current waveforms of the inverter using hysteresis current control: (a) Battery SOC 10%–75%; (b) Battery SOC 85%; (c) Battery SOC 90%.
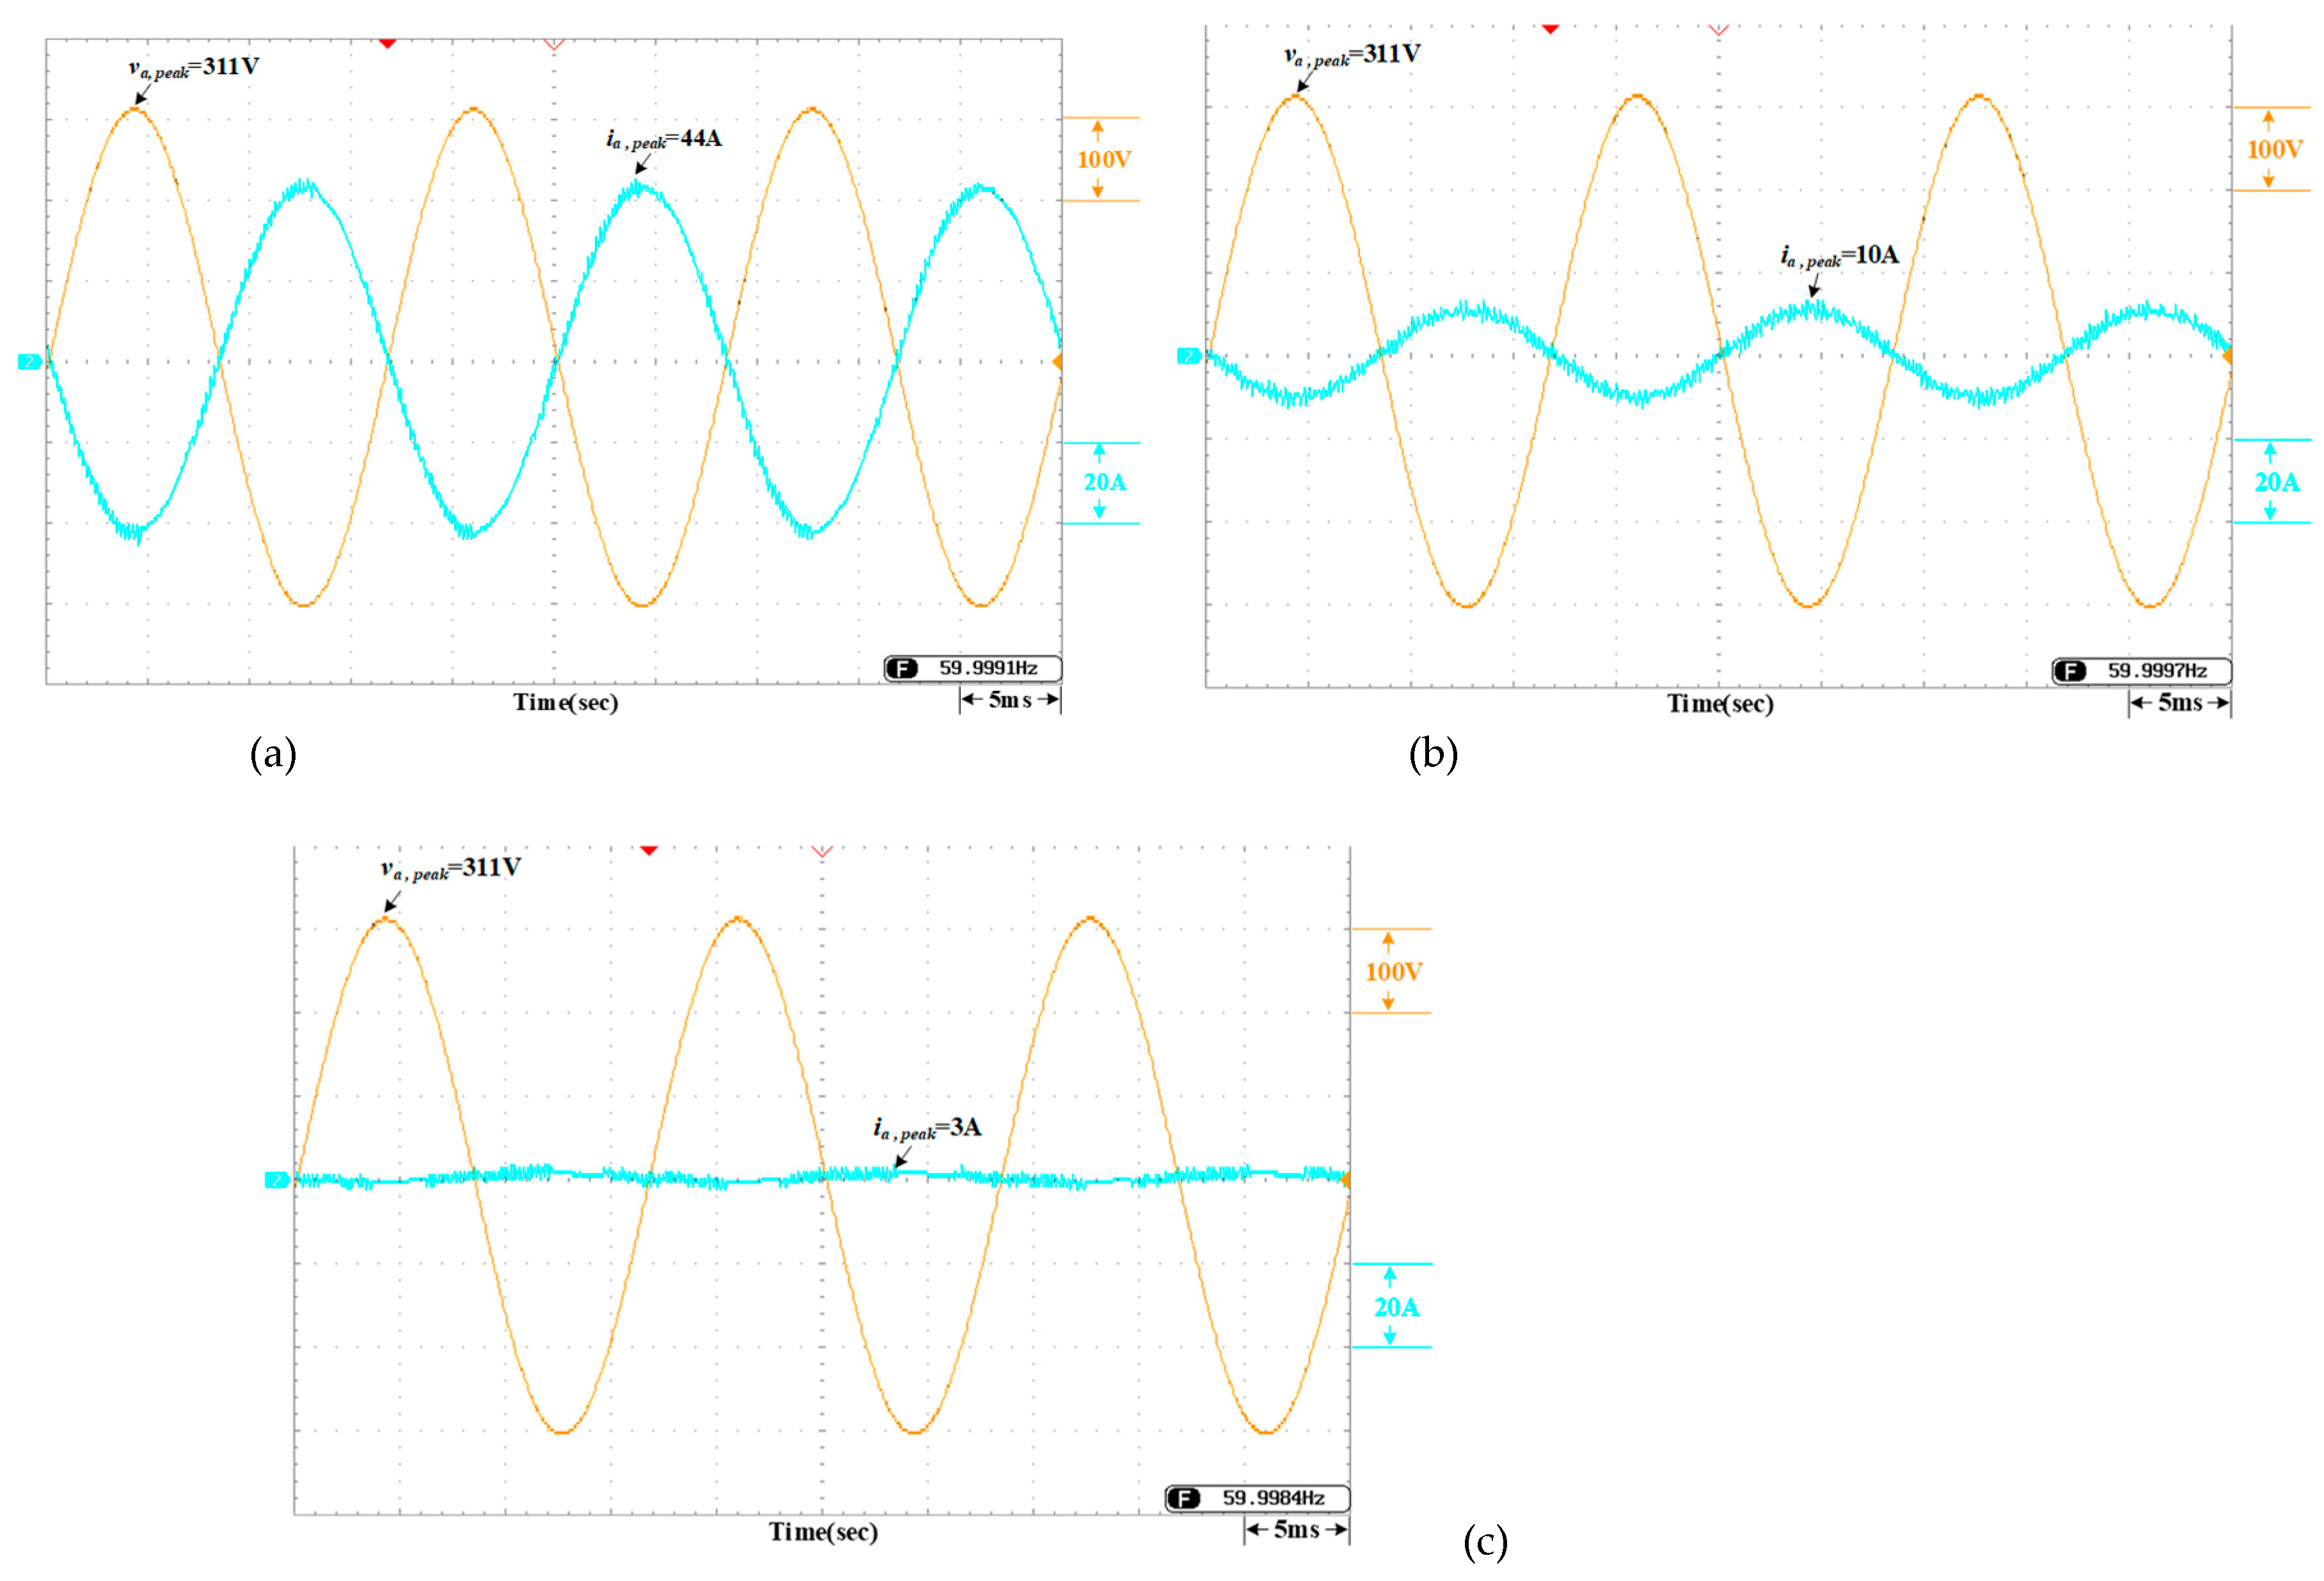
Figure 19.
Measured battery charging response under prevention-of-over-contract charging mode.
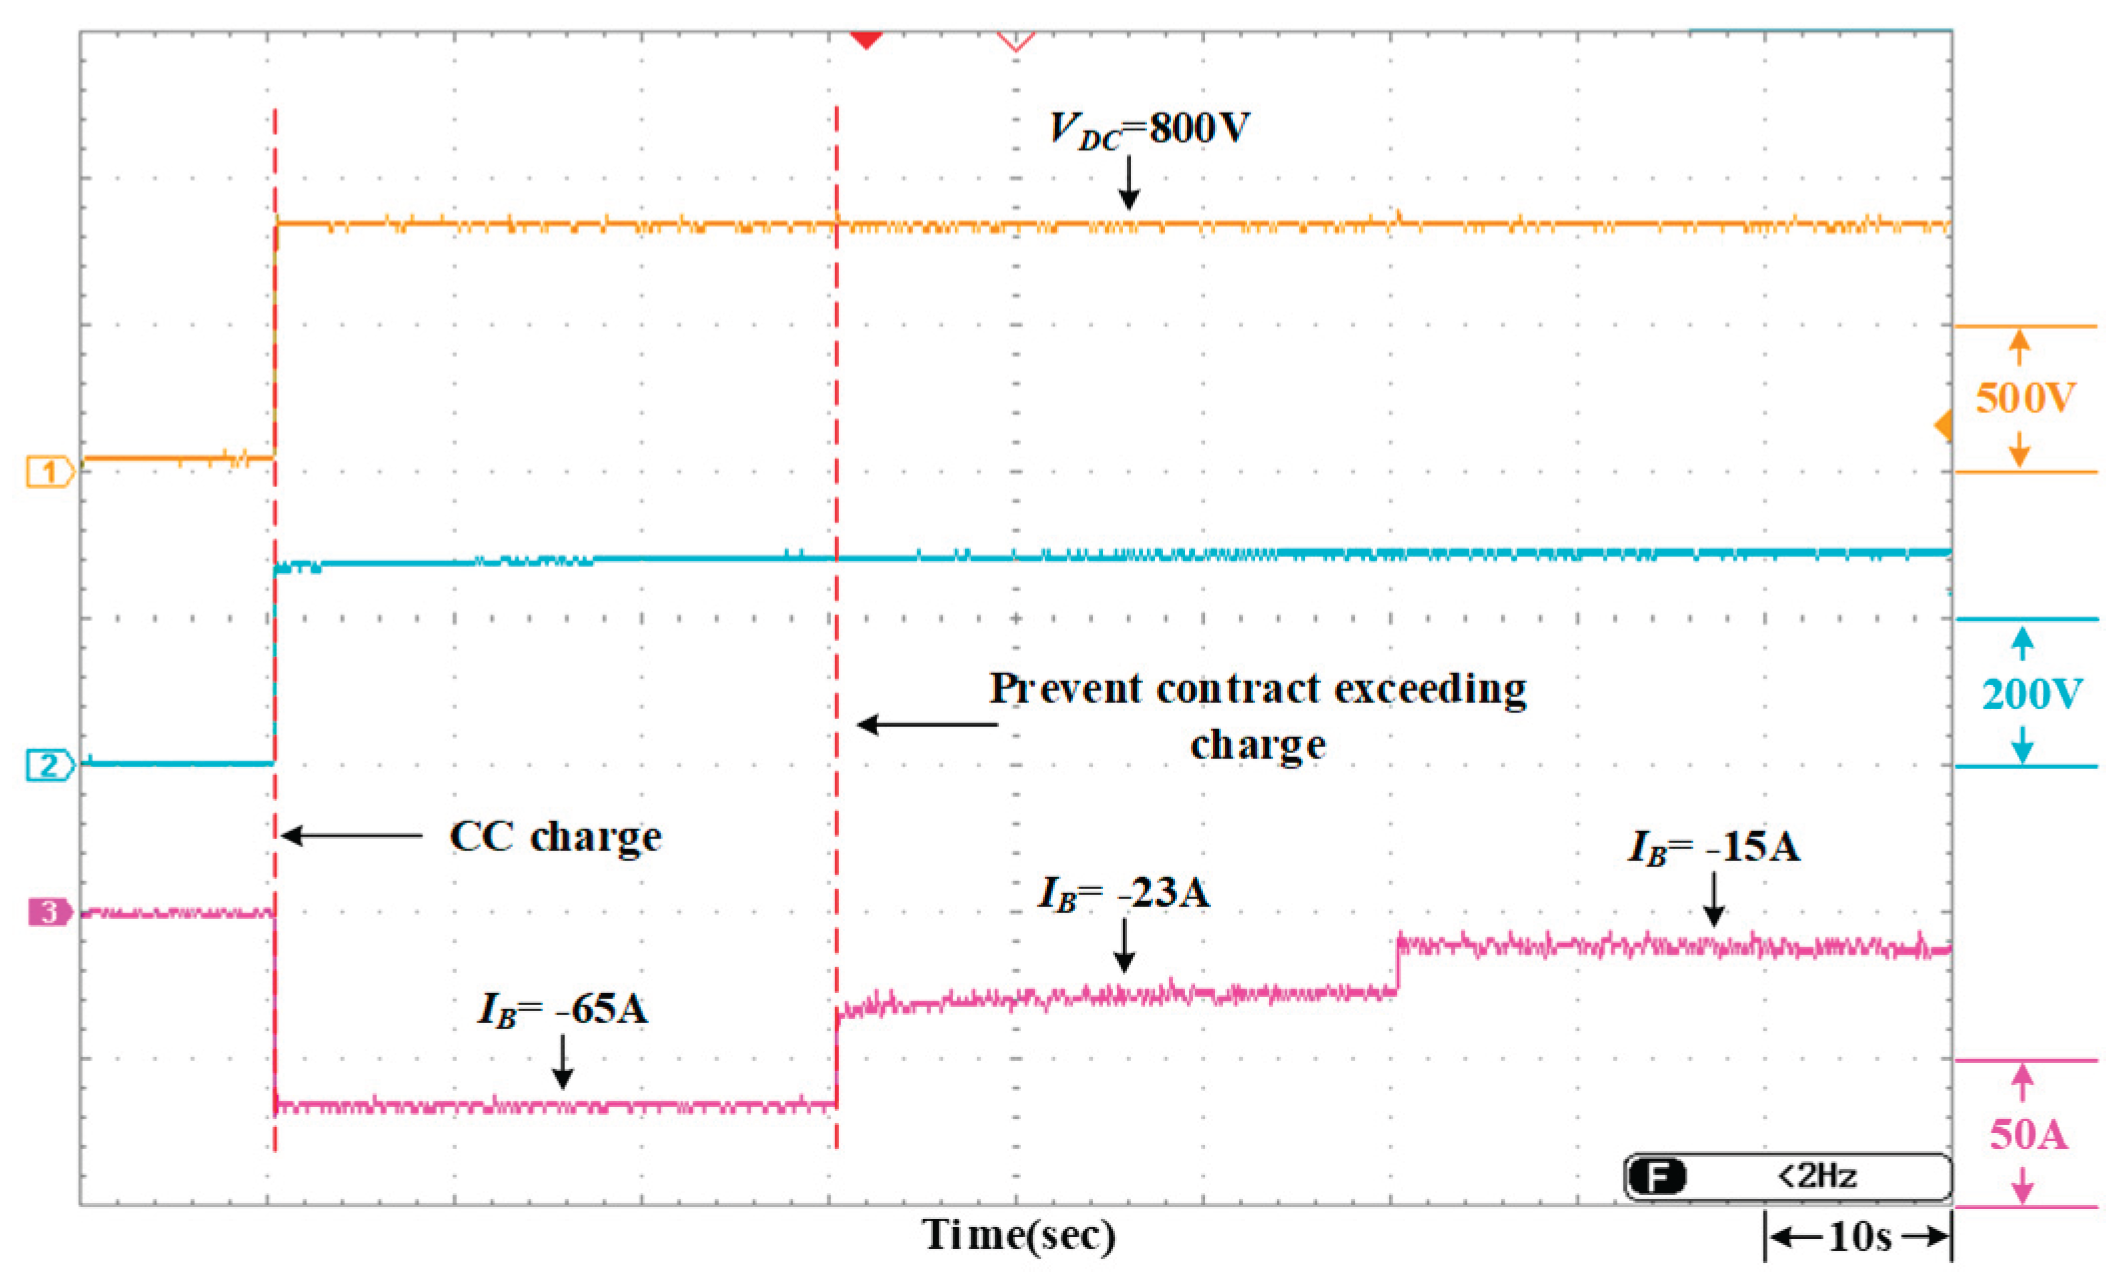
Figure 20.
Measured grid-side output current waveforms under over-contract prevention control.
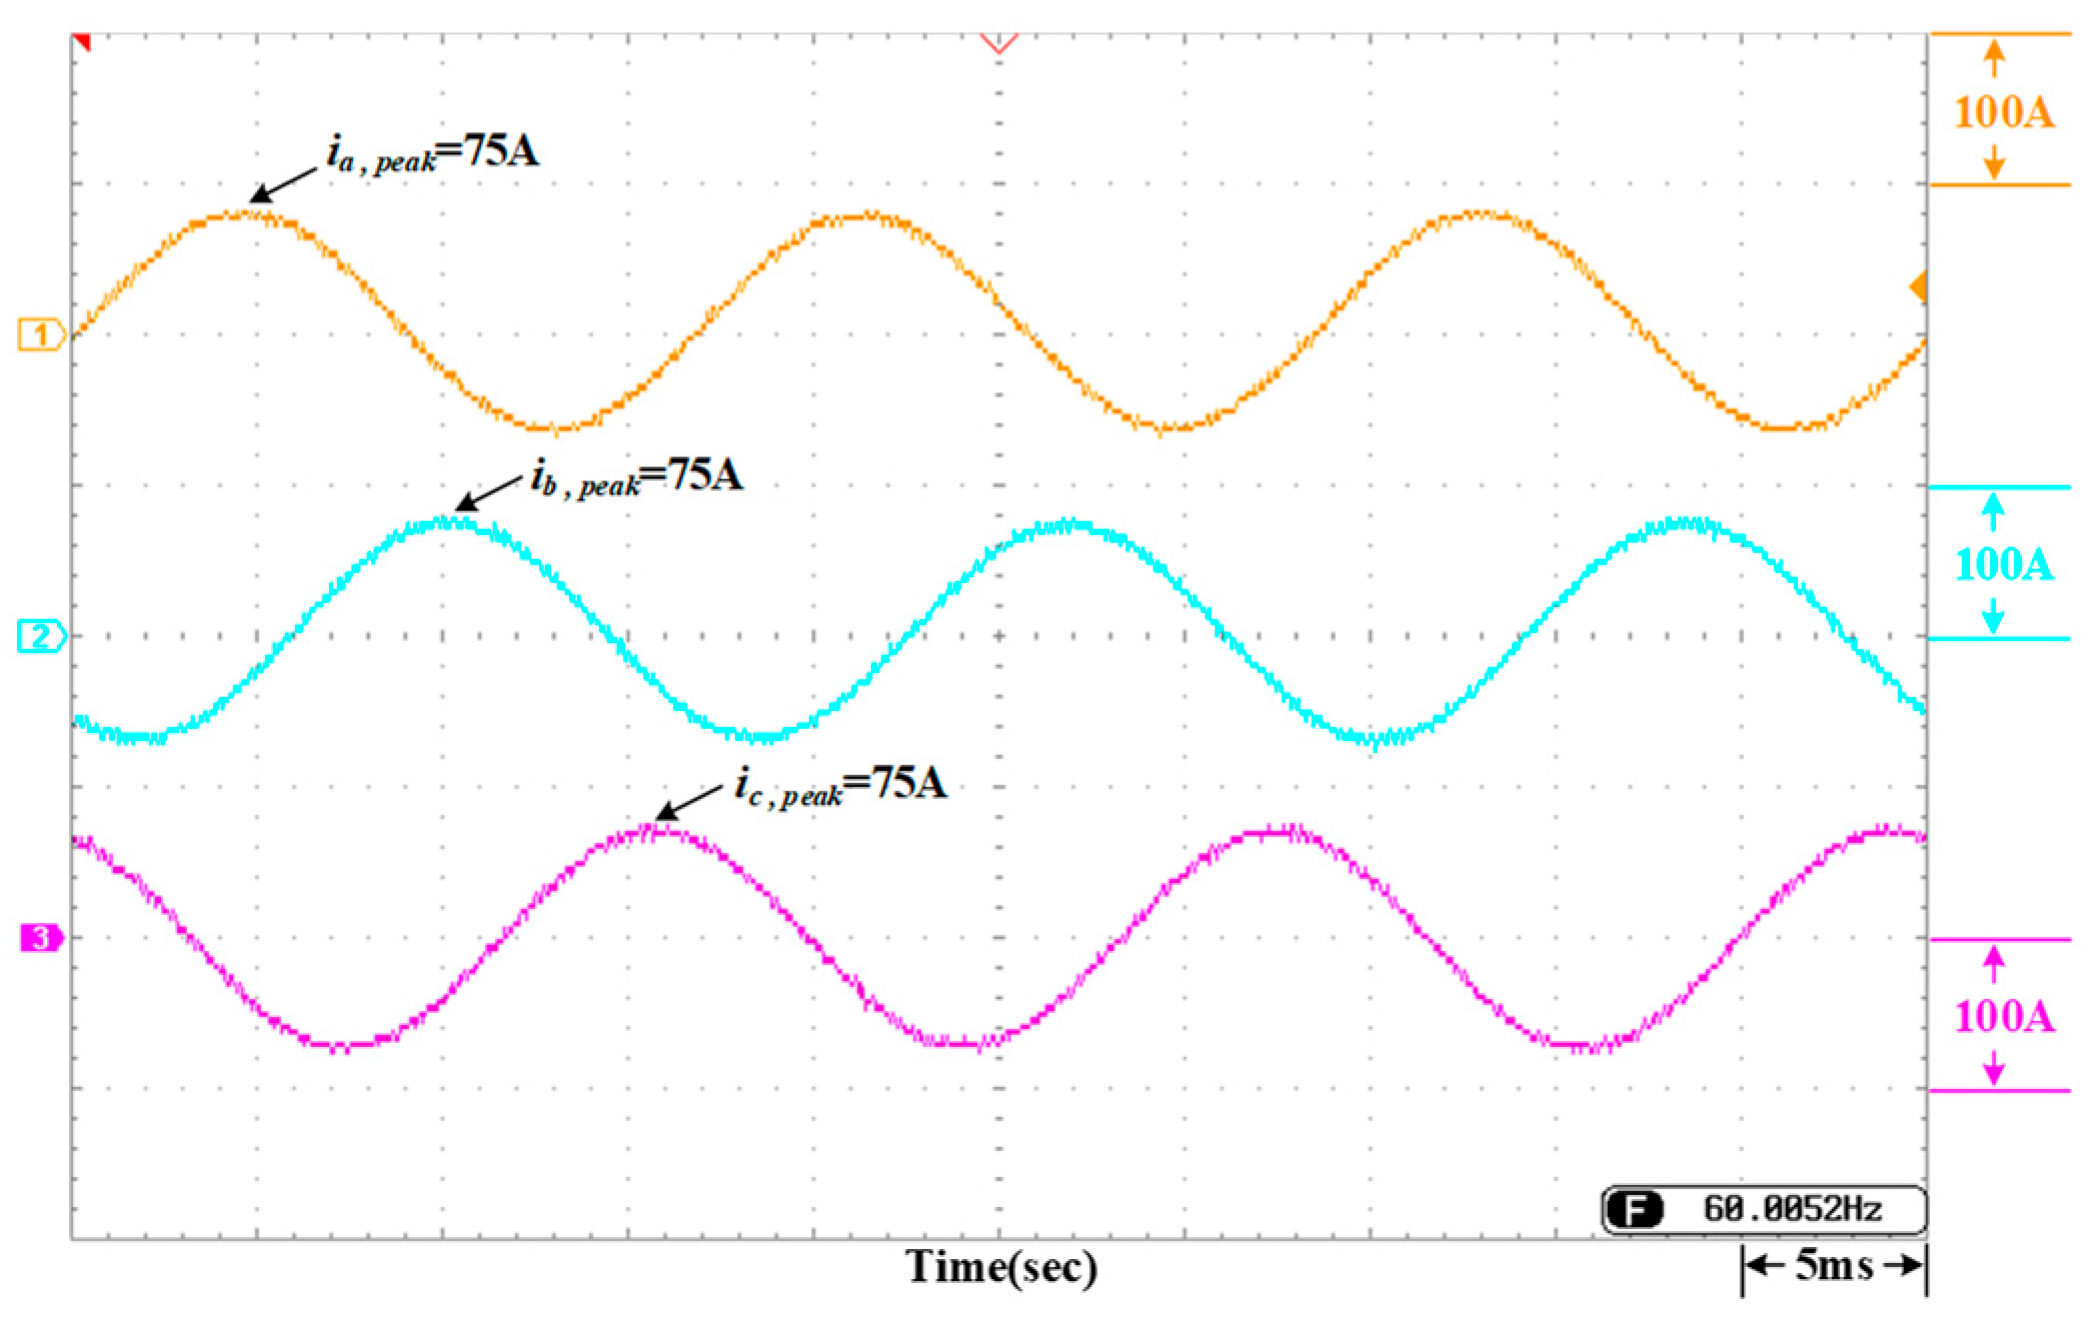
Figure 21.
Measured results of DC-link voltage, battery terminal voltage, and current for Case 1 during peak periods.
Figure 21.
Measured results of DC-link voltage, battery terminal voltage, and current for Case 1 during peak periods.
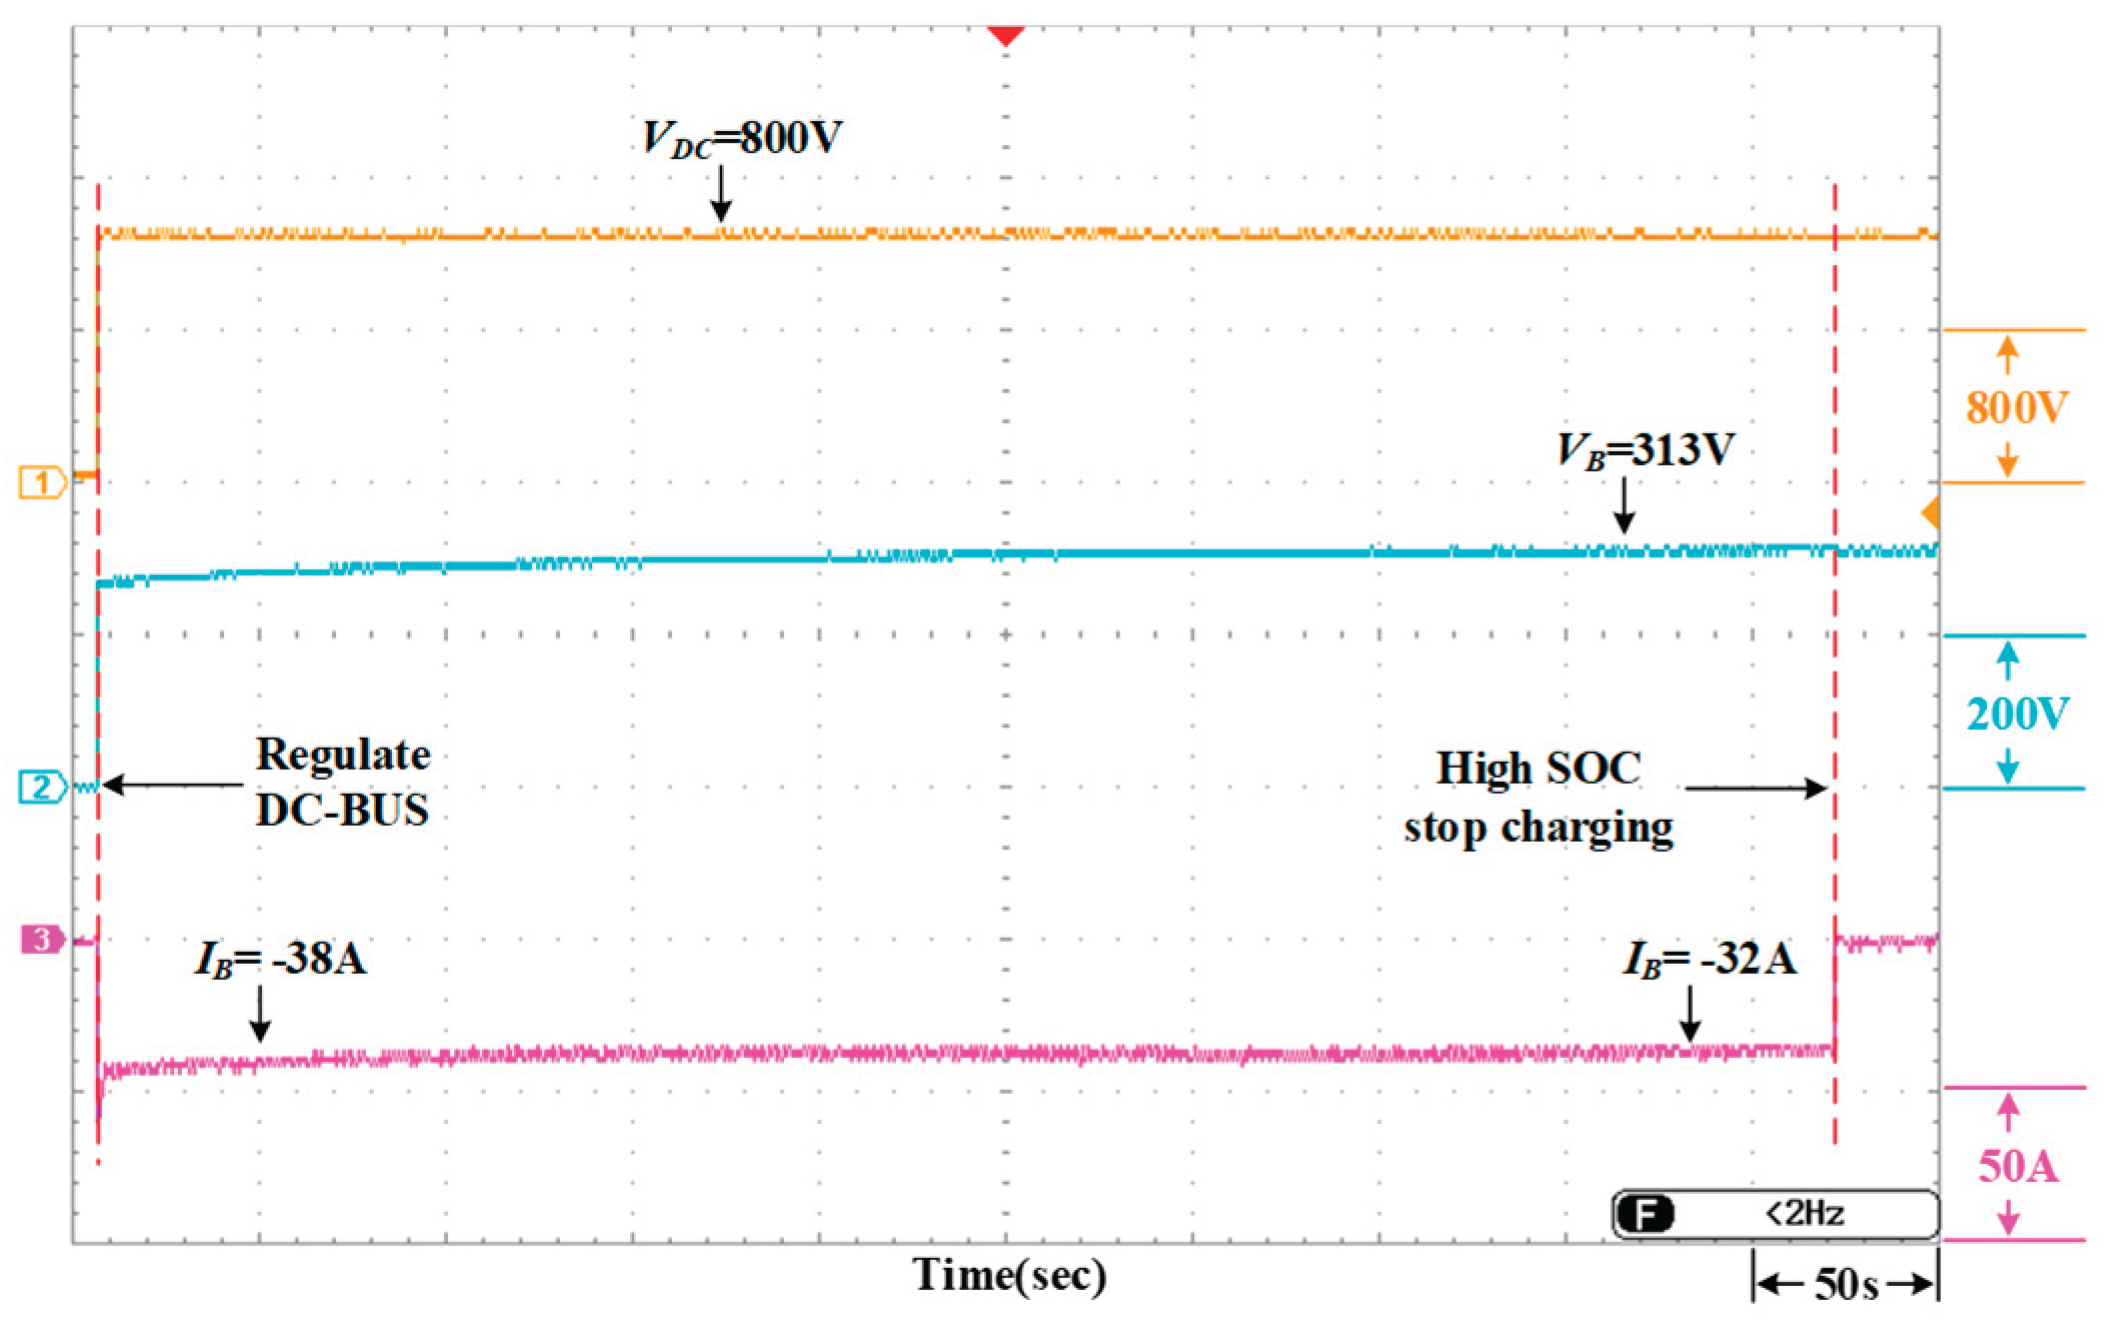
Figure 22.
Measured output current waveforms of the smart inverter for Case 1 during peak periods.
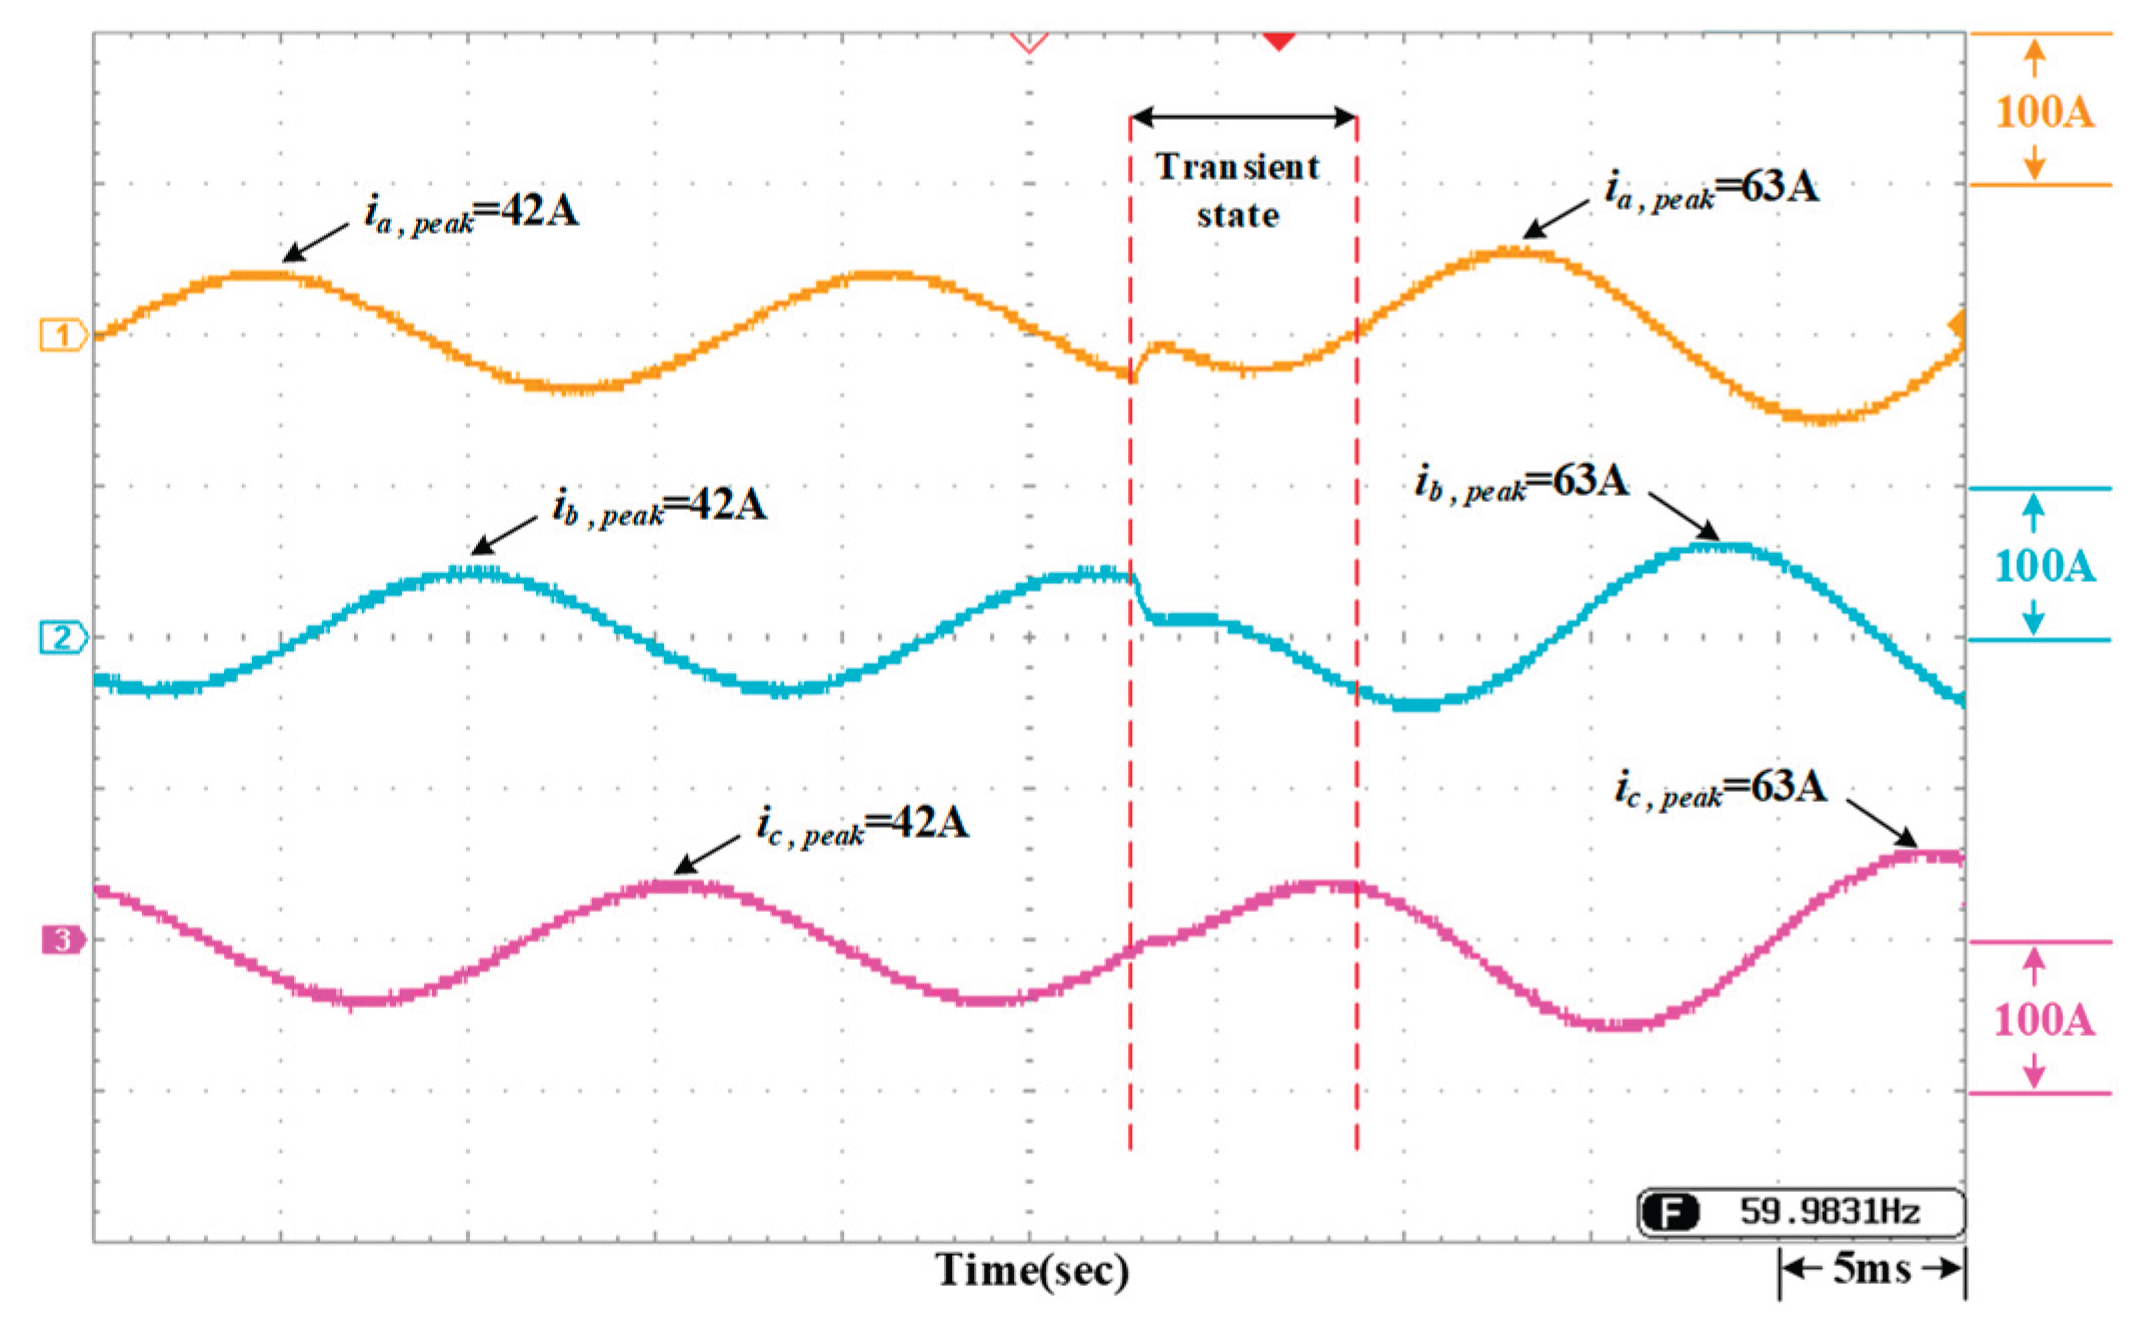
Figure 23.
Measured three-phase output current waveforms on the grid side for Case 1 during peak periods.
Figure 23.
Measured three-phase output current waveforms on the grid side for Case 1 during peak periods.
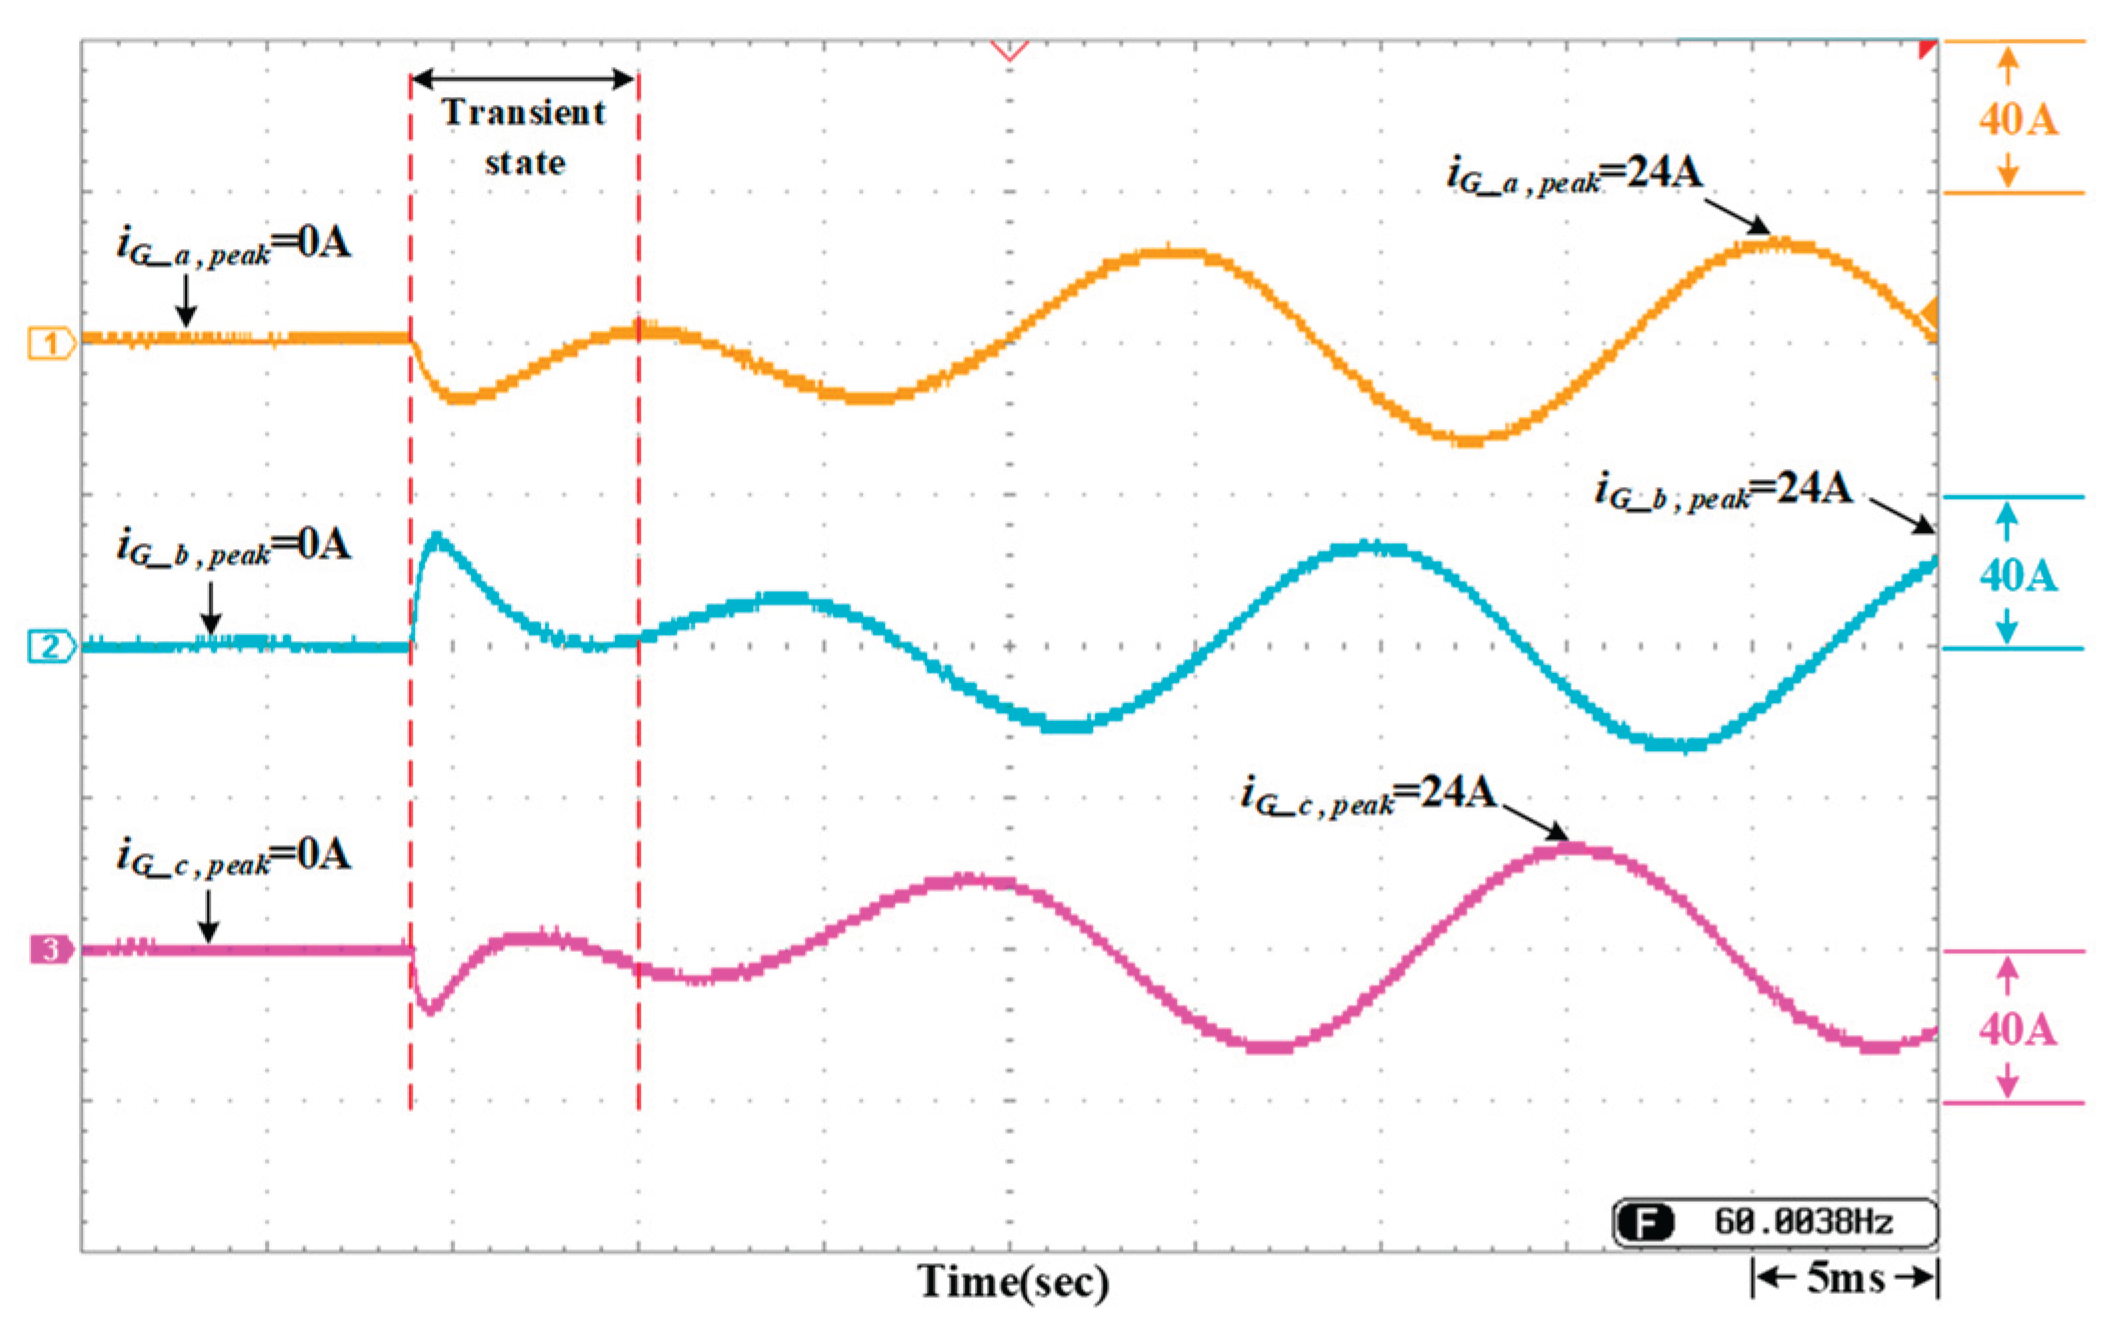
Figure 24.
Measured results of DC-link voltage, battery terminal voltage, and current for Case 2 during peak periods.
Figure 24.
Measured results of DC-link voltage, battery terminal voltage, and current for Case 2 during peak periods.
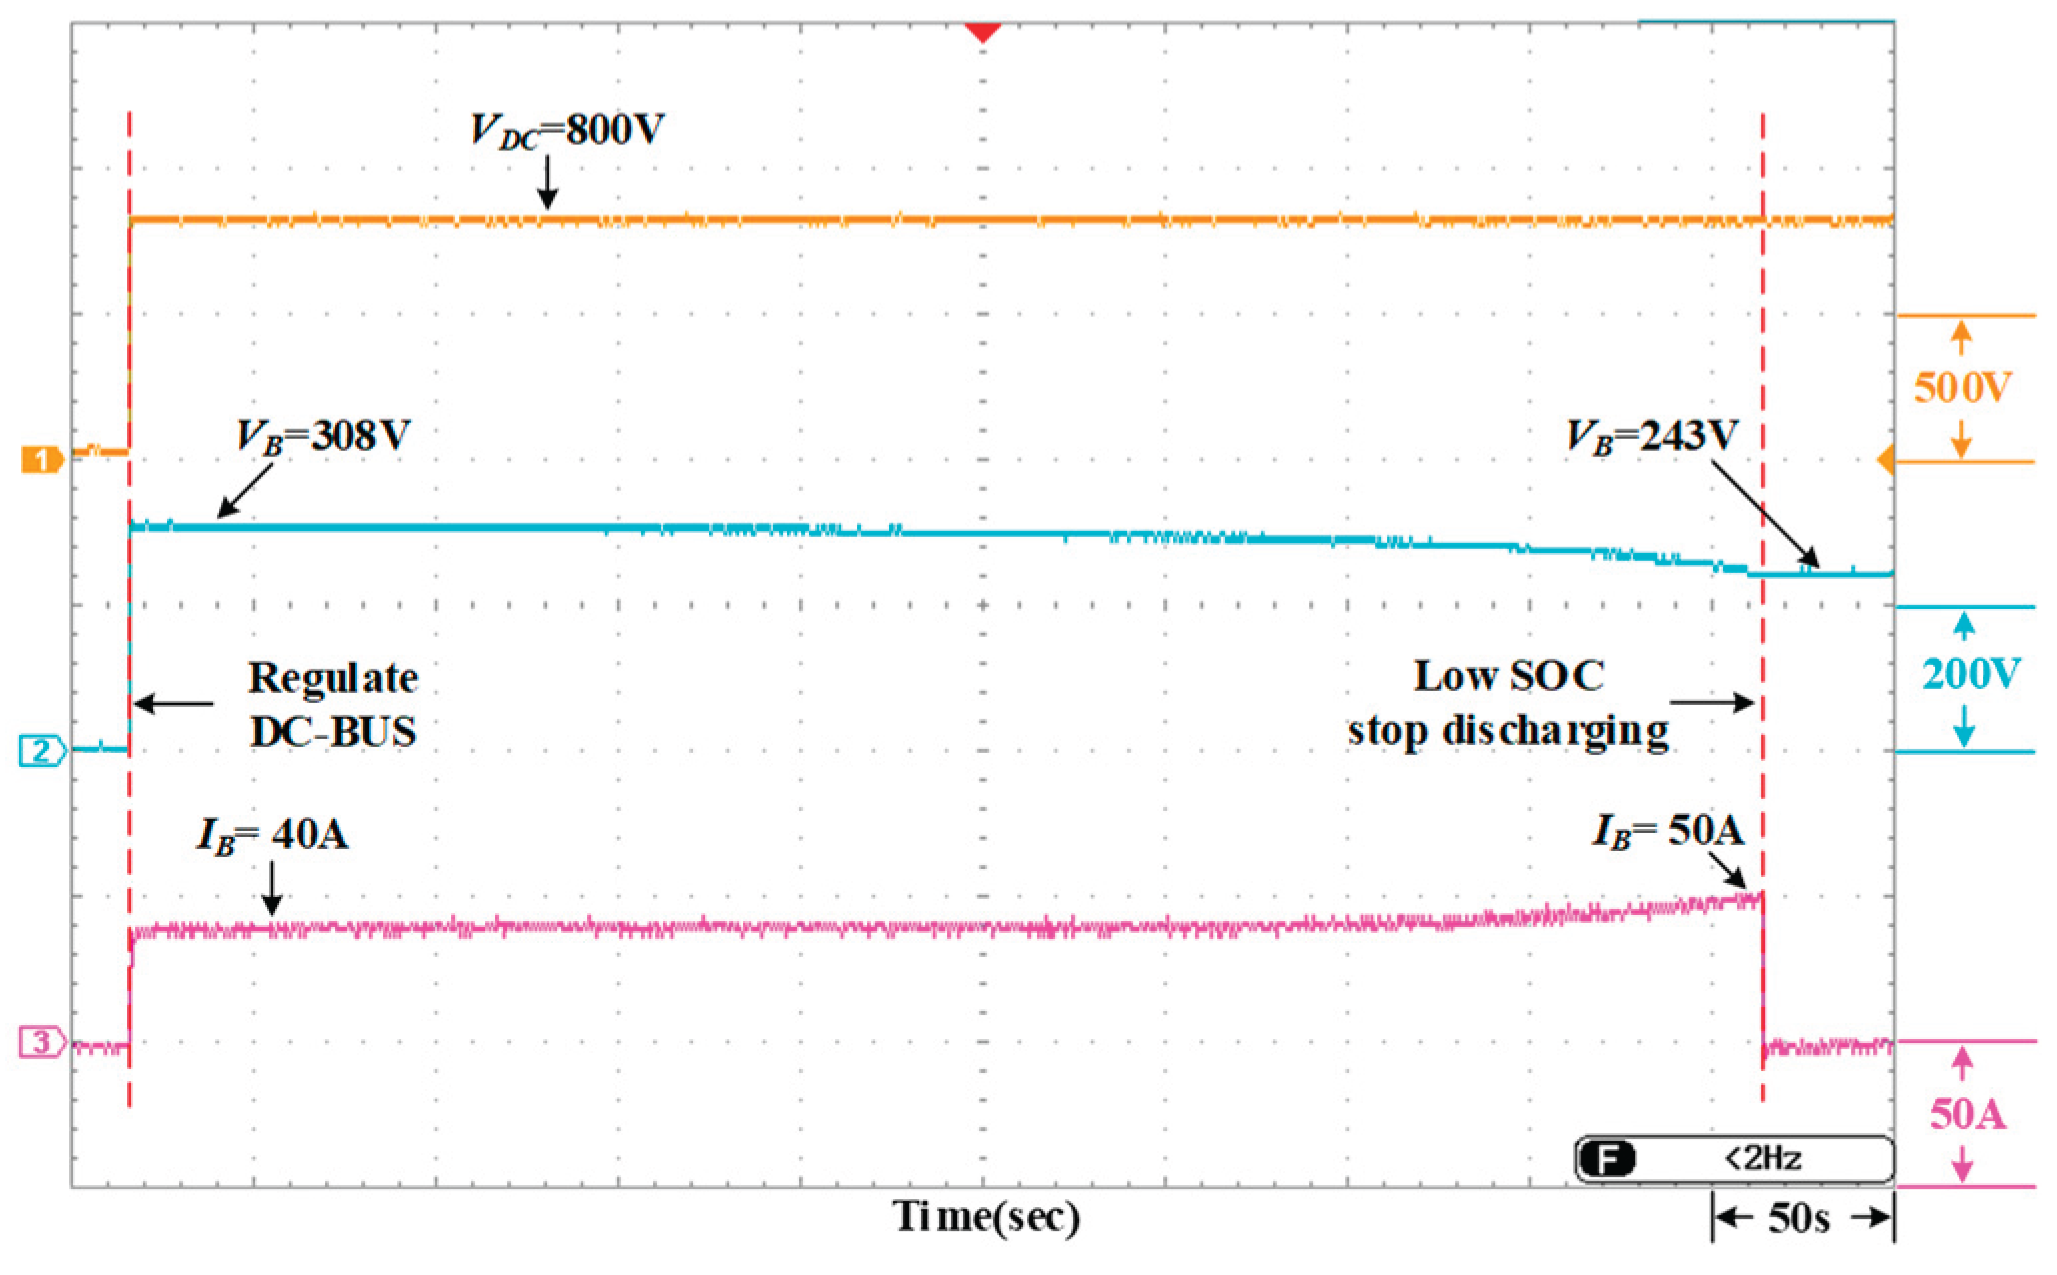
Figure 25.
Measured output current waveforms of the smart inverter for Case 2 during peak periods.
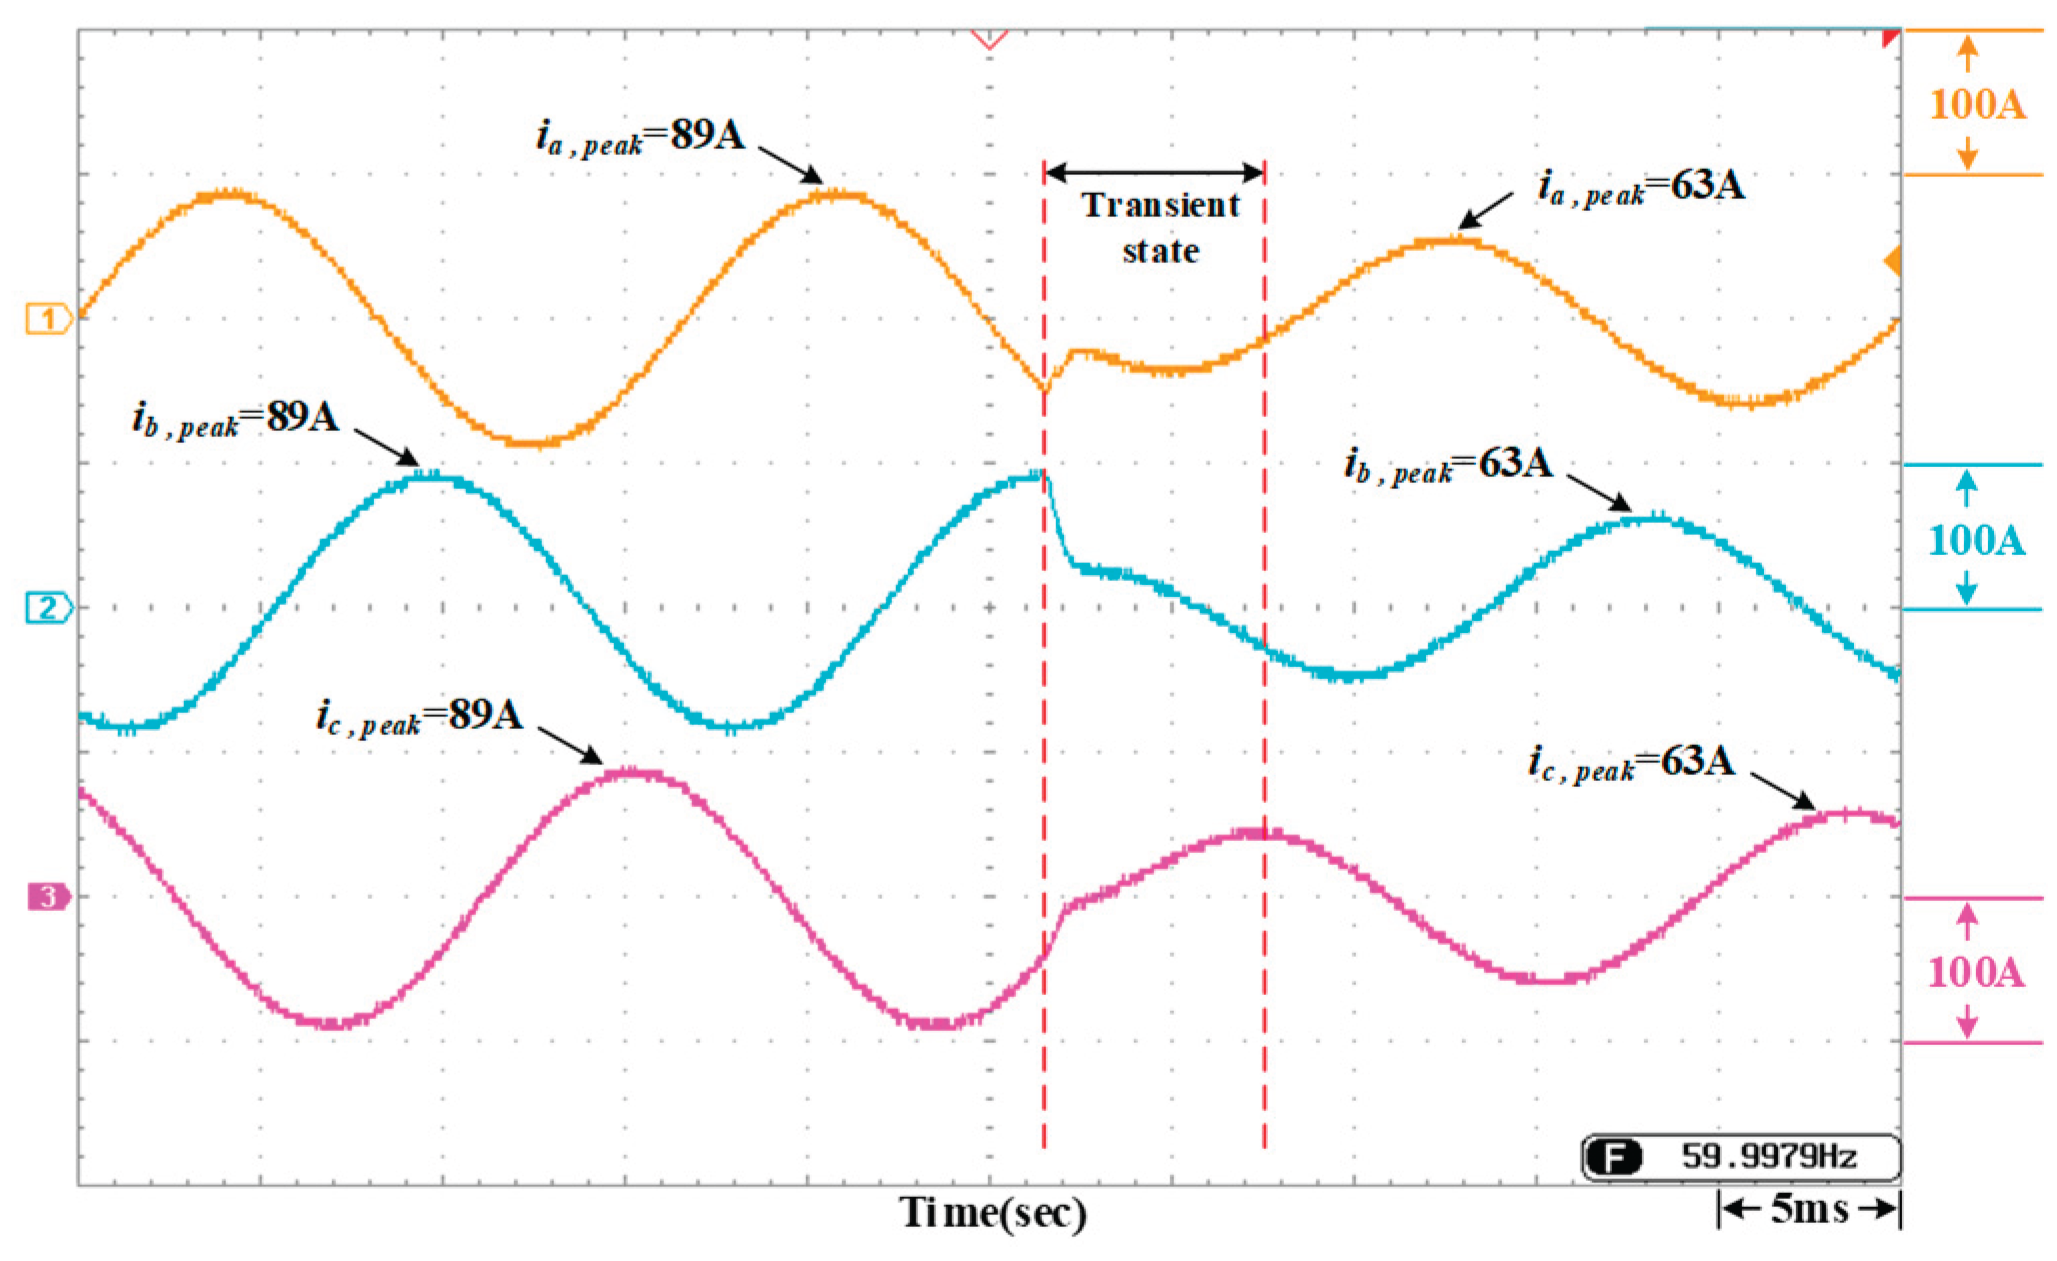
Figure 26.
Measured output current waveforms on the grid side for Case 2 during peak periods.
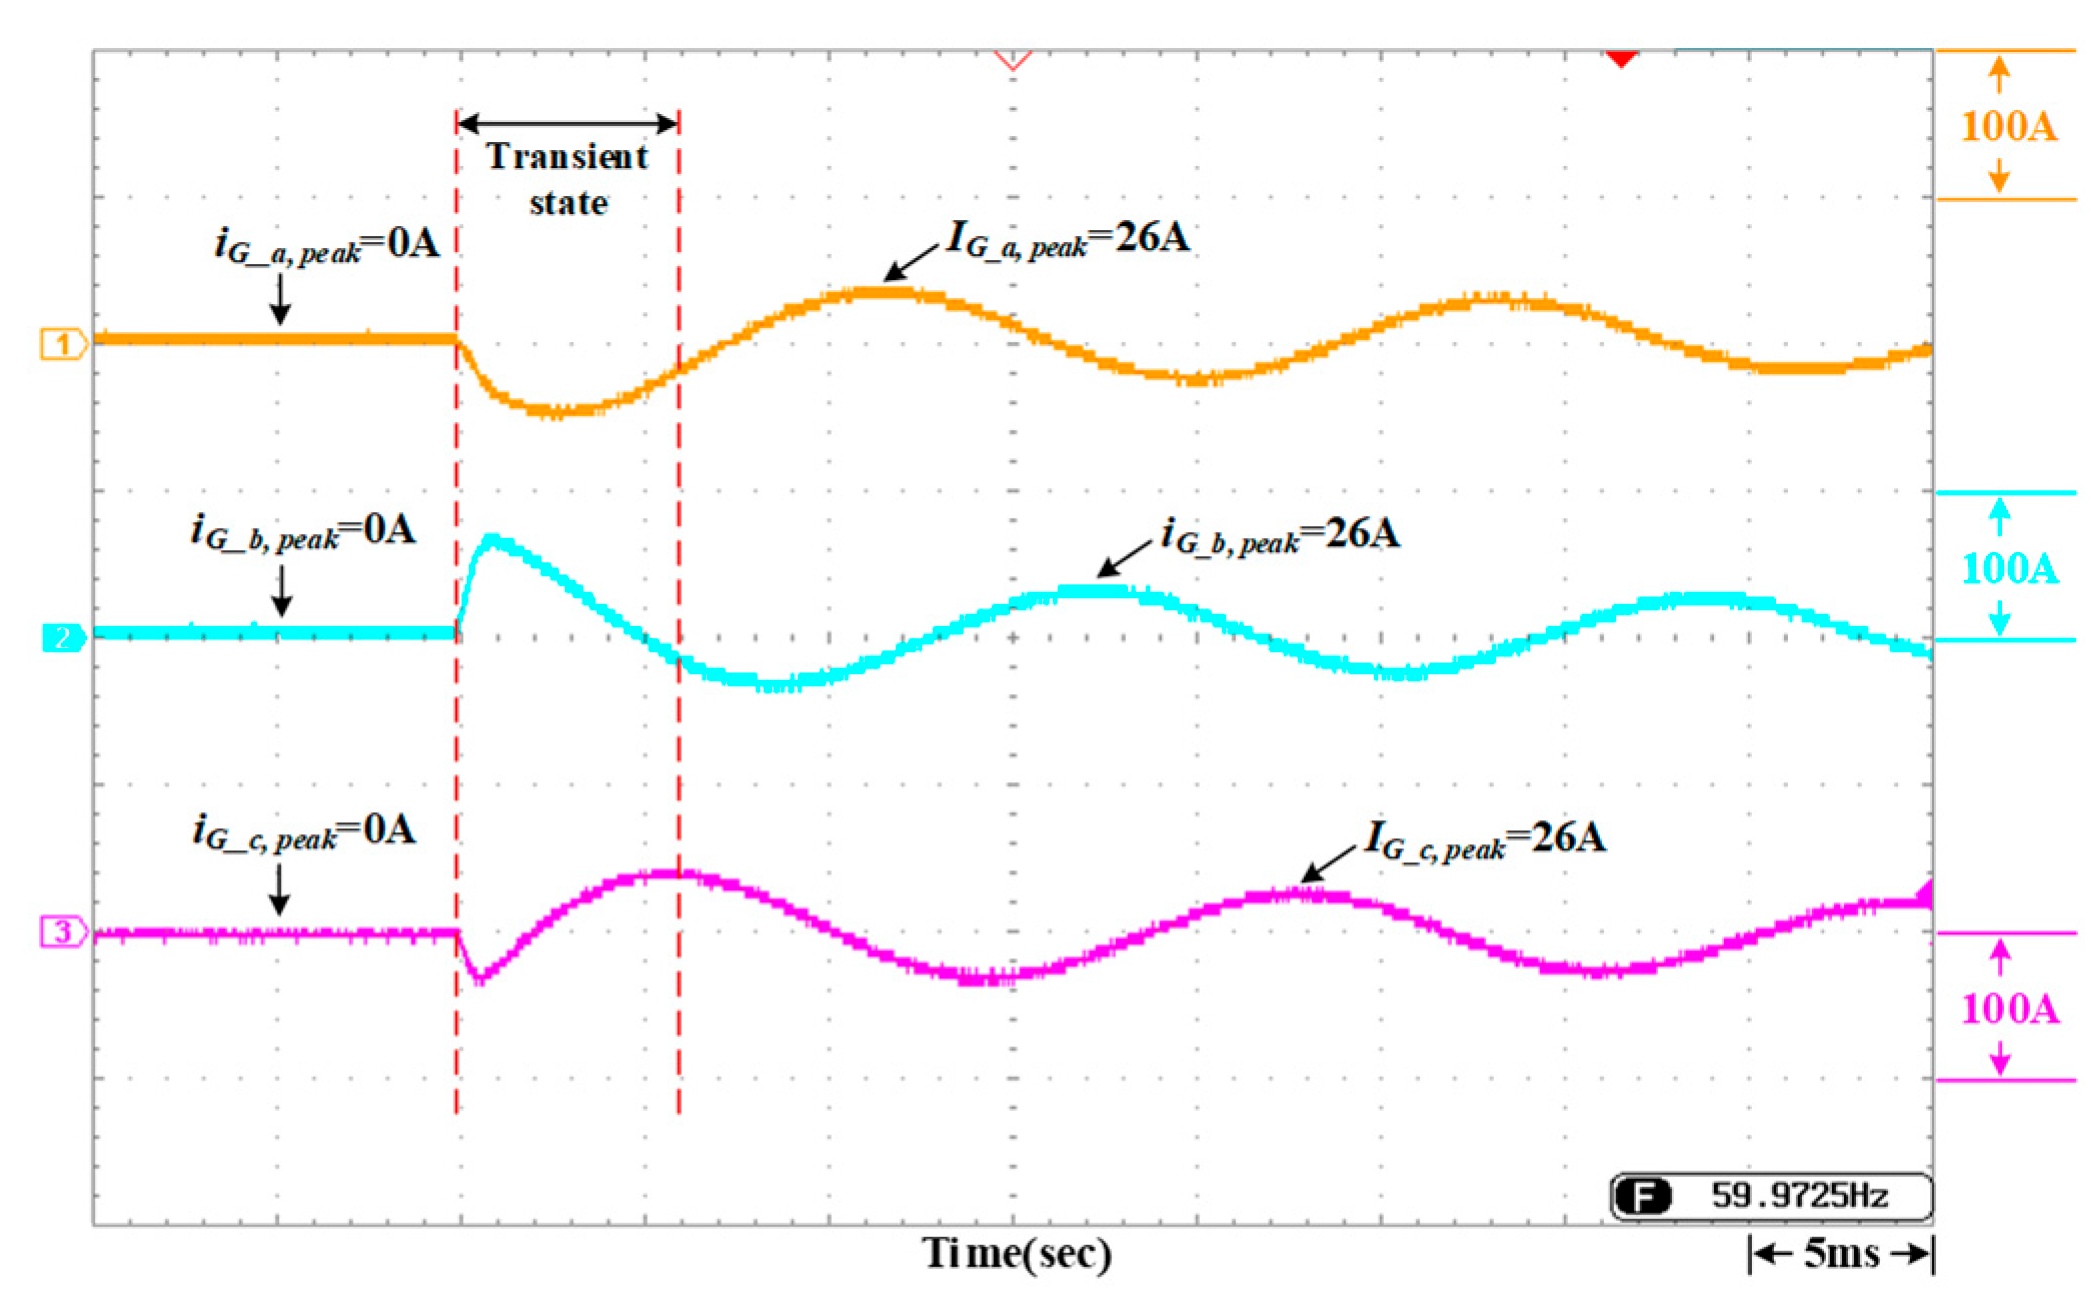
Figure 27.
Measured output voltage and current waveforms of the inverter during the control transition from off-peak to peak: (a) Phase a; (b) Phase b; (c) Phase c.
Figure 27.
Measured output voltage and current waveforms of the inverter during the control transition from off-peak to peak: (a) Phase a; (b) Phase b; (c) Phase c.
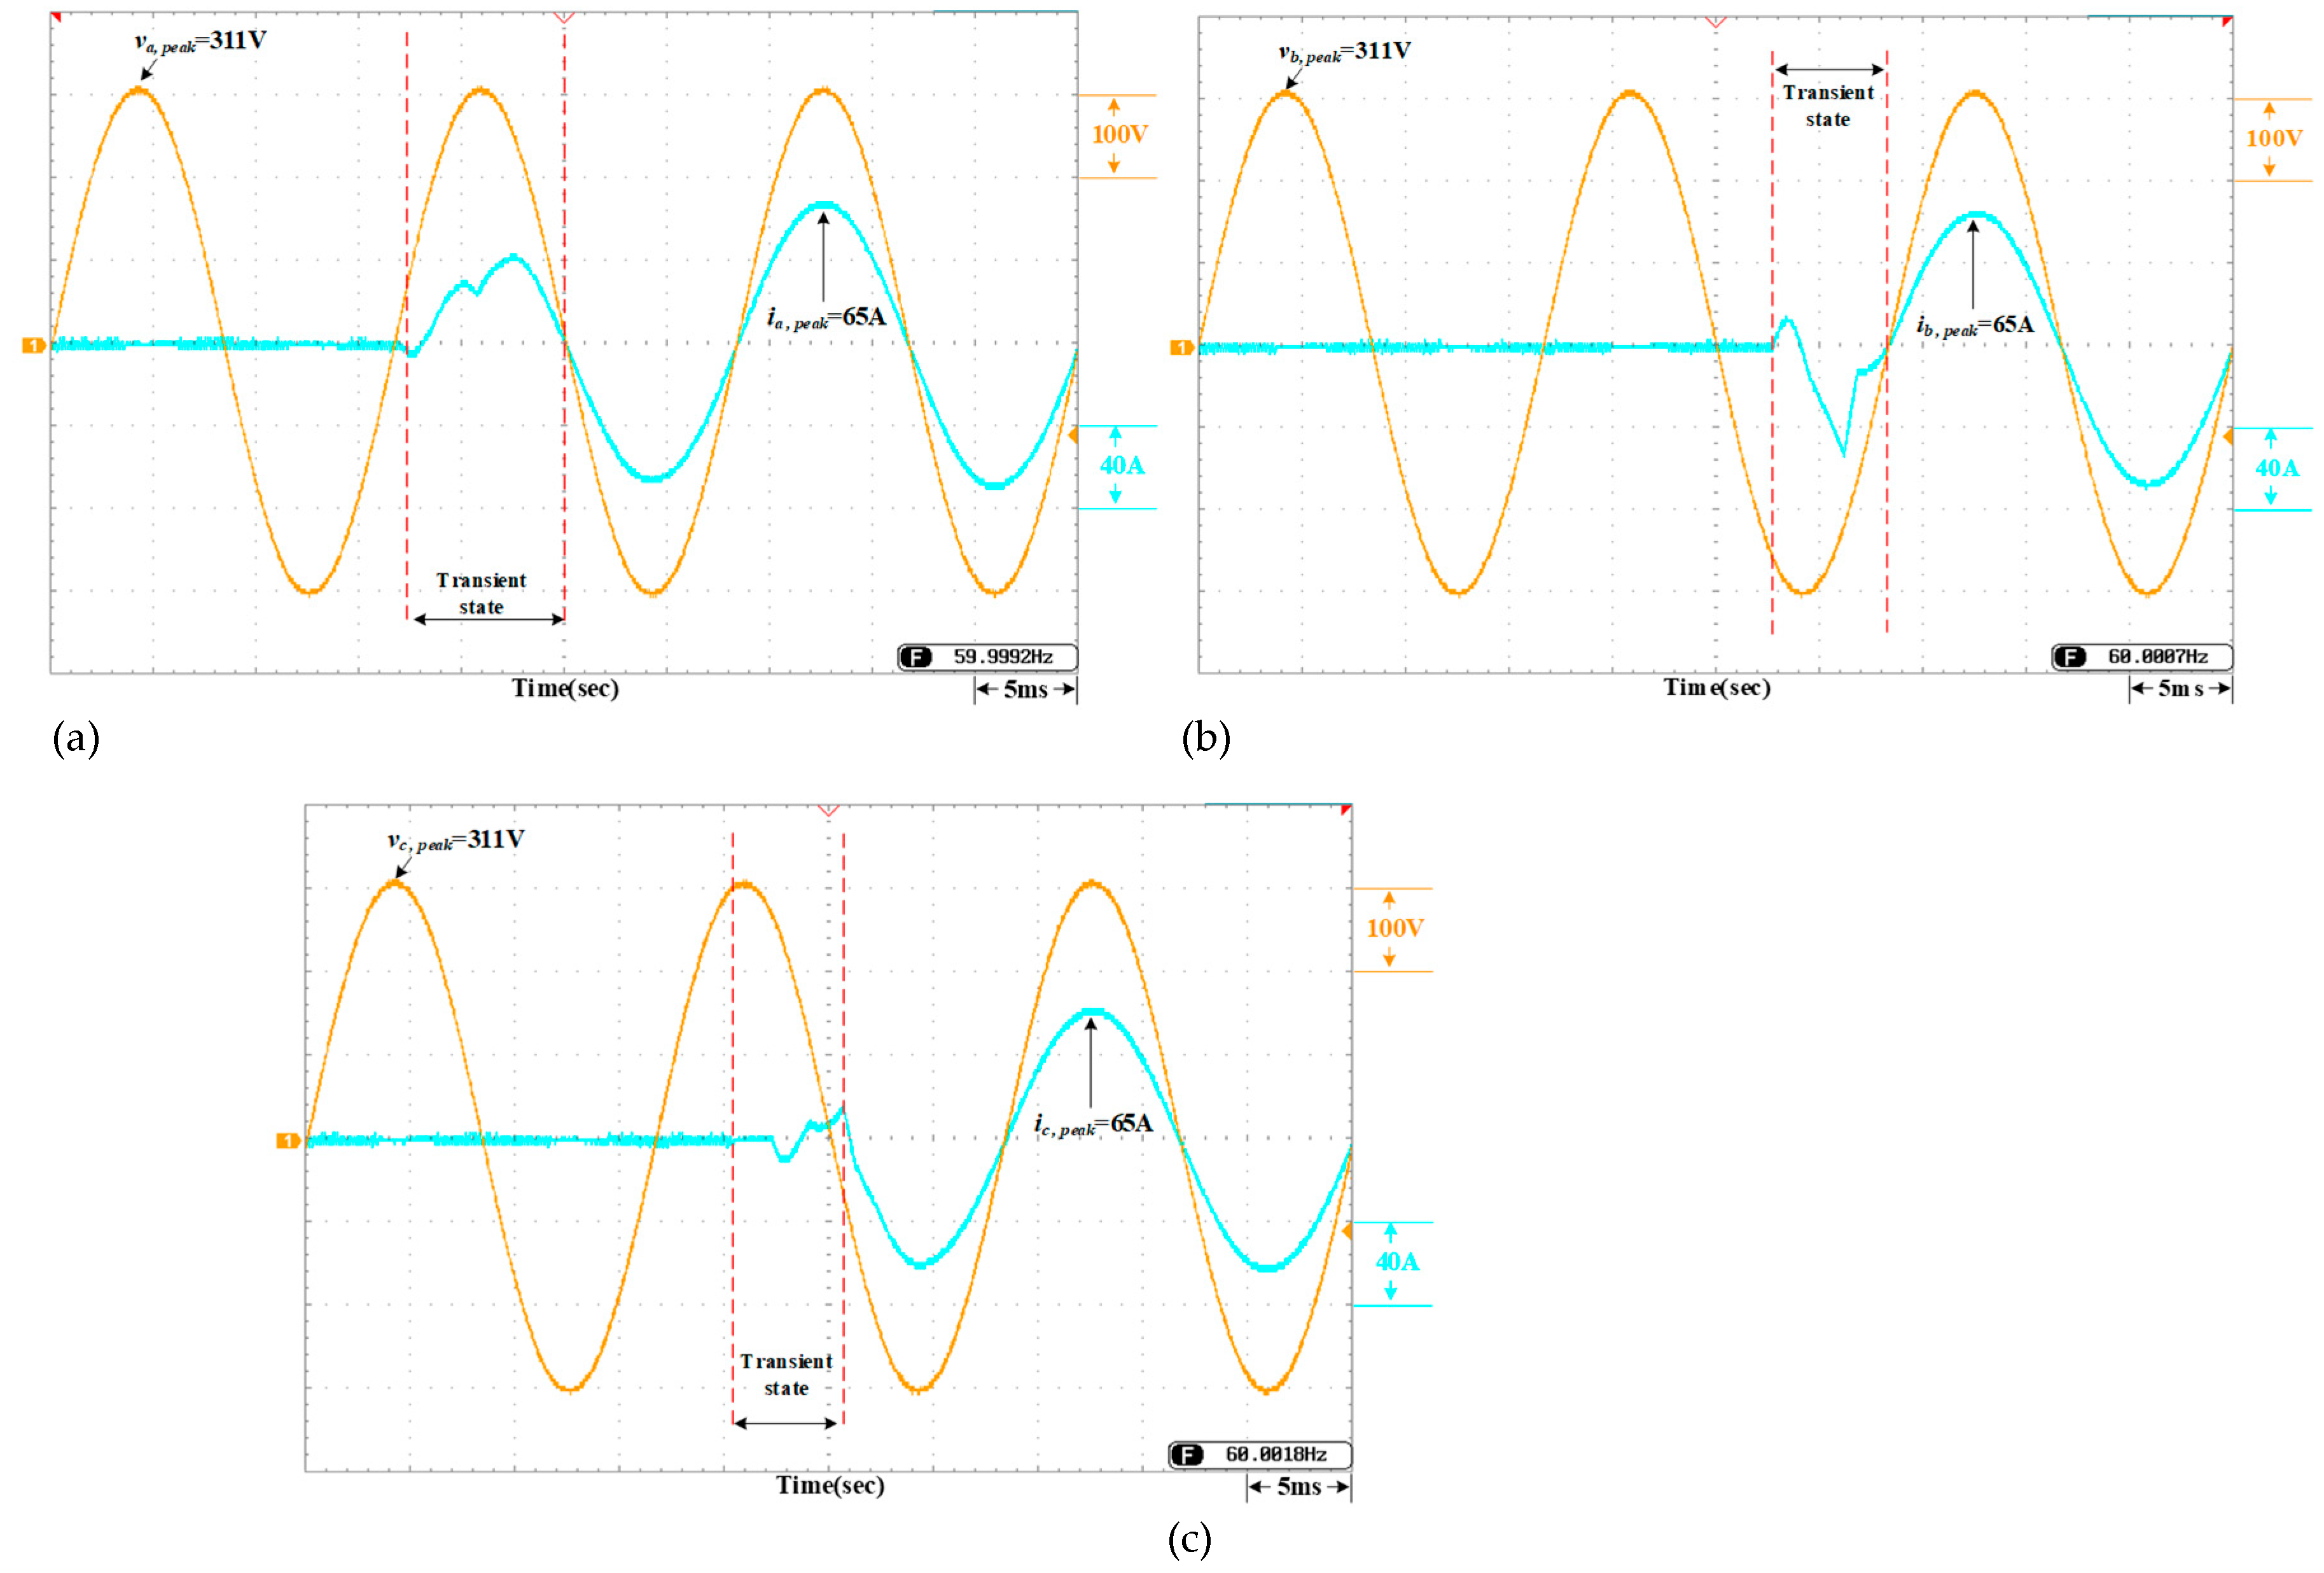
Figure 28.
Measured waveforms of the inverter output voltage and current during the control transition from peak to off-peak periods: (a) Phase a; (b) Phase b; (c) Phase c.
Figure 28.
Measured waveforms of the inverter output voltage and current during the control transition from peak to off-peak periods: (a) Phase a; (b) Phase b; (c) Phase c.
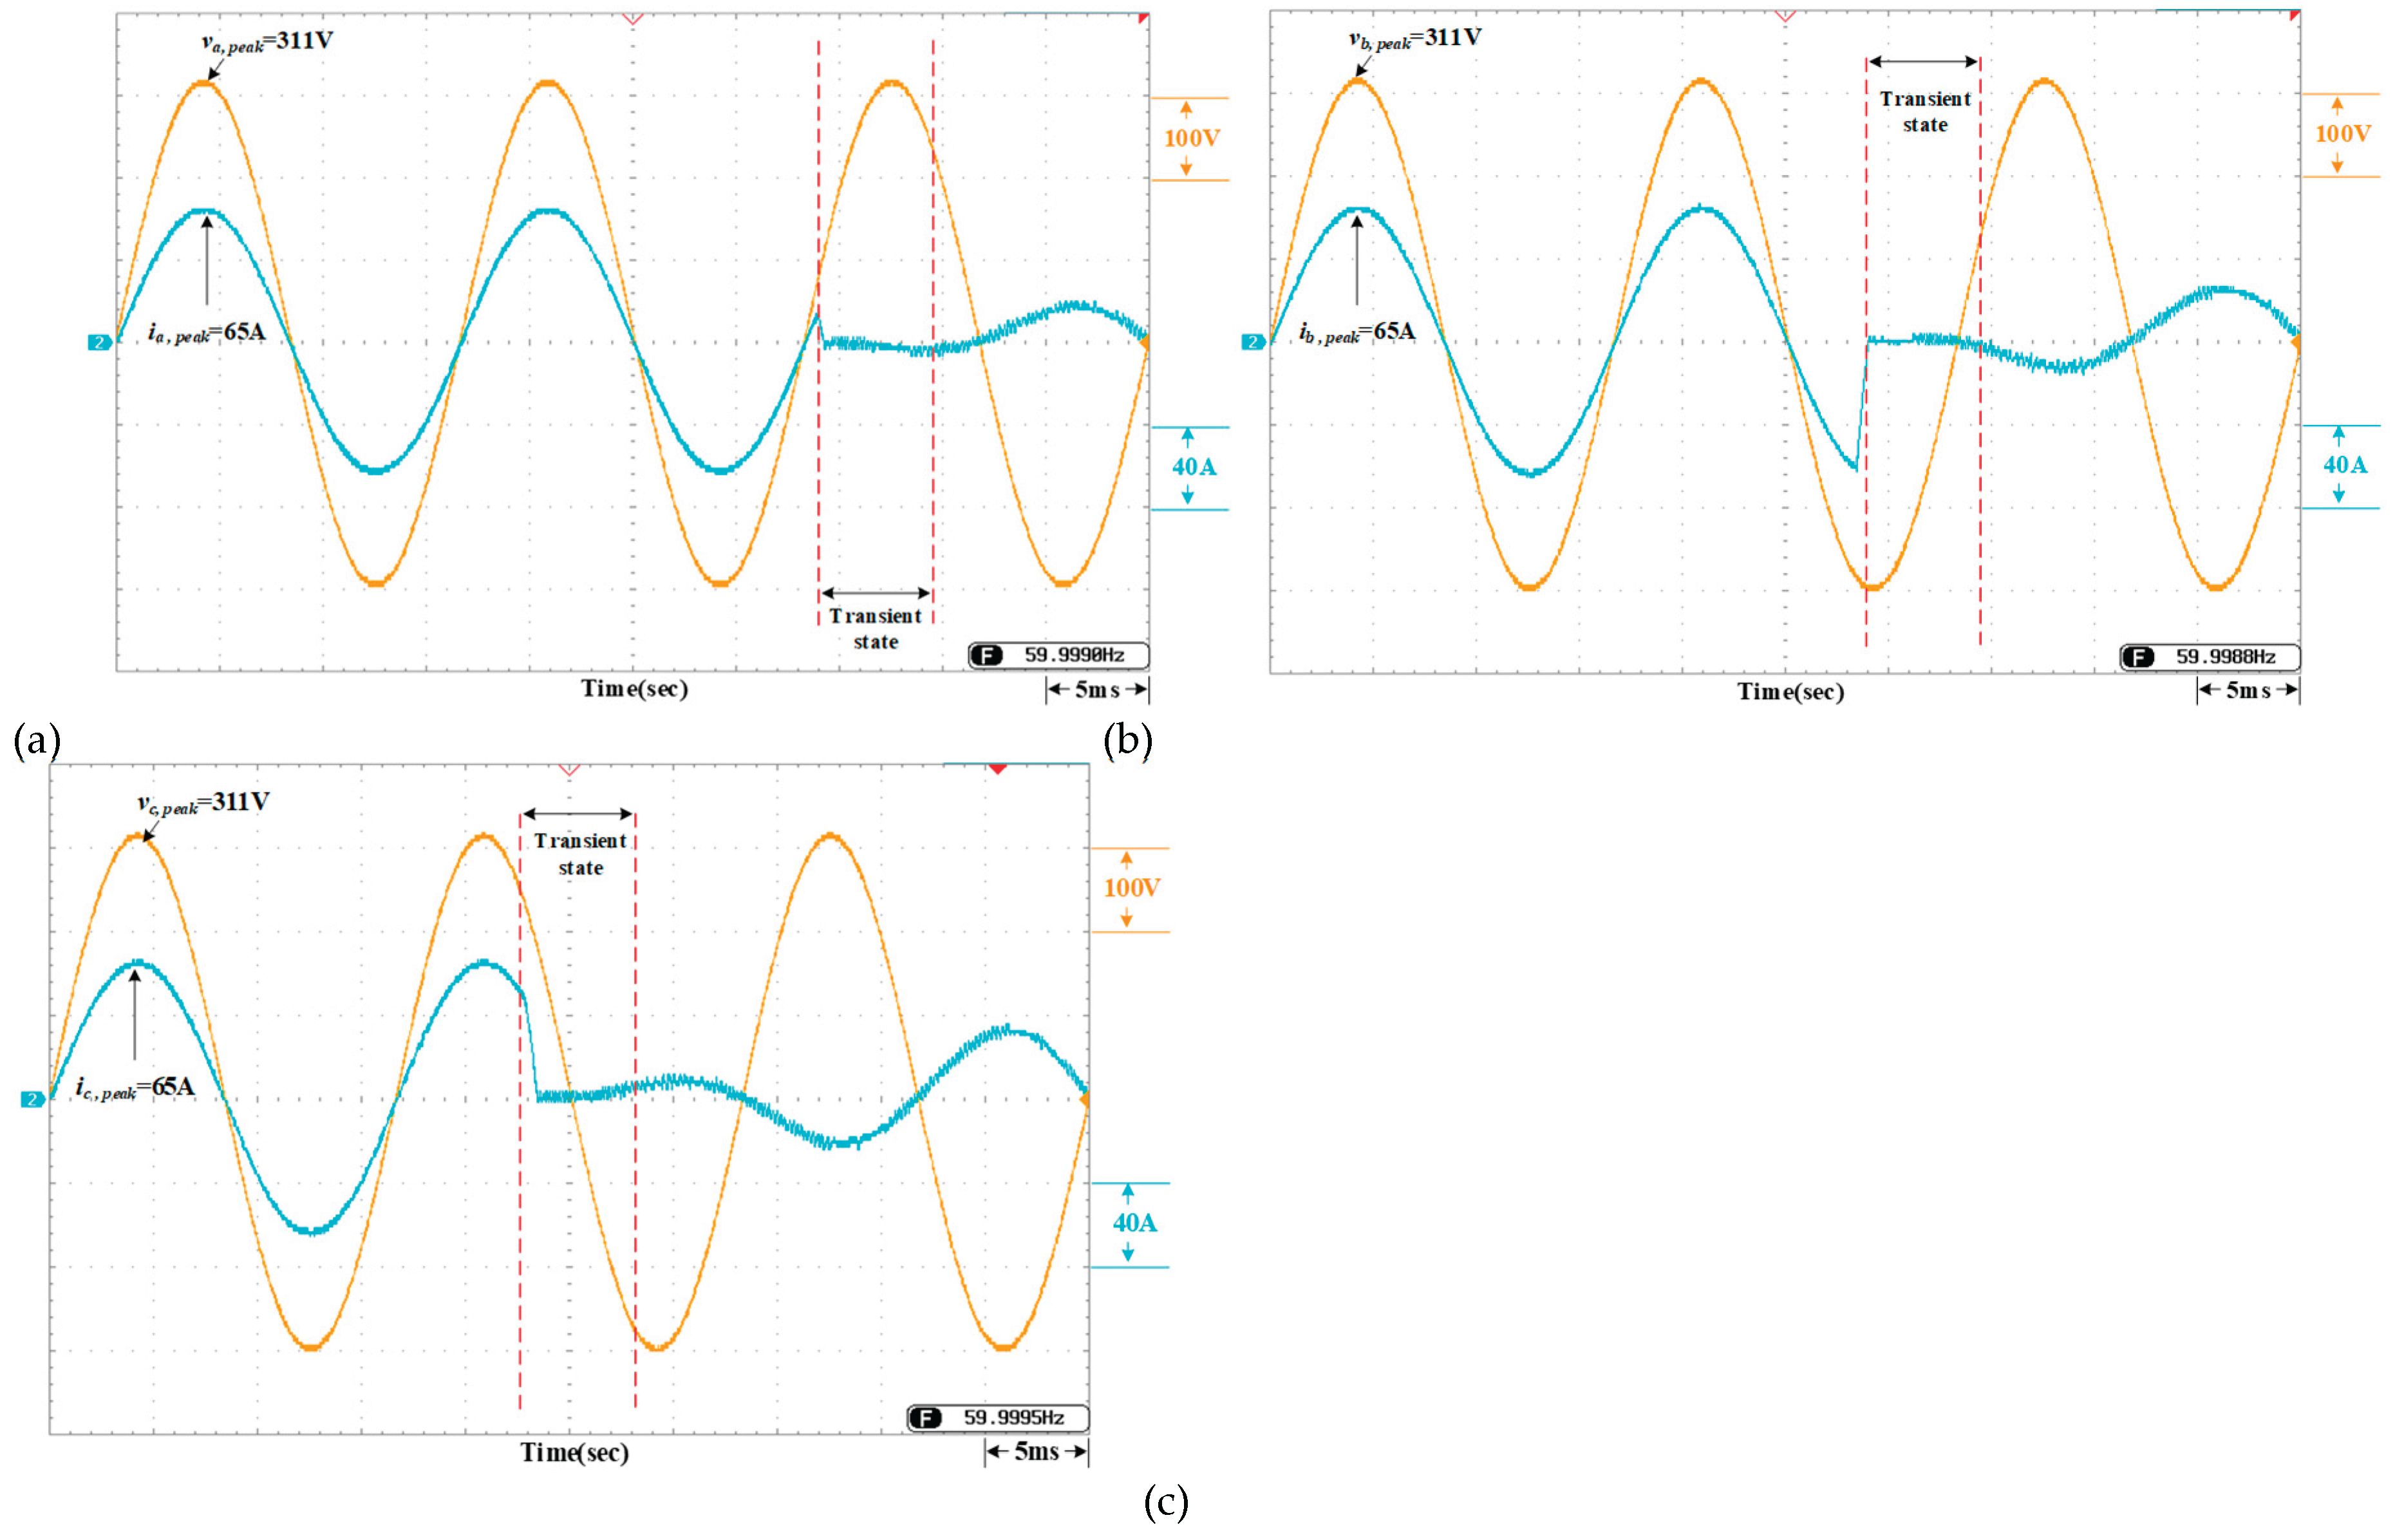

Table 1.
Electrical specifications of the boost converter [8].
Table 1.
Electrical specifications of the boost converter [8].
| ElectricalParameters | Specifications |
| Input capacitance (Cs) | 800 μF/900 VDC |
| Input voltage (vS) | 665.28 Vrms |
| Inductance (L) | 158 mH |
| Output capacitance (CDC) | 800 μF/900 VDC |
| Output voltage (VDC) | 800 V |
| Switching frequency (fsw) | 15 kHz |
Table 2.
Electrical specifications of the bidirectional buck-boost converter [9].
Table 2.
Electrical specifications of the bidirectional buck-boost converter [9].
| ElectricalParameters | Specifications |
| Input capacitance (CB) | 800 μF/450 VDC |
| Rated voltage of battery pack (VB) | 287.1 V |
| Inductance (LB) | 0.2 mH |
| Output capacitance (CDC) | 800 μF/900 VDC |
| Output voltage (VDC) | 800 V |
| Switching frequency (fsw) | 15 kHz |
| ElectricalParameters | Specifications |
| DC-link voltage (VDC) | 800 V |
| Filter inductance (Li) | 4.265 mH |
| Filter inductance (Lg) | 0.853 mH |
| Filter capacitance (C) | 36.7 μF/400 VAC |
| Damping resistance (Rd) | 4.4 Ω |
| AC grid voltage (vgrid) | 380 Vrms |
| SPWM switching frequency (fsw) | 15 kHz |
Table 4.
Electrical specifications of the A10 Green Technology A10J-M60-225 photovoltaic module. [23].
Table 4.
Electrical specifications of the A10 Green Technology A10J-M60-225 photovoltaic module. [23].
| ElectricalParameters | Specifications |
| Open-circuit voltage ( Voc ) | 36.24 V |
| Short-circuit current ( Isc ) | 8.04 A |
| Rated maximum output power ( Pmpp ) | 224.98 W |
| Maximum power point voltage ( Vmpp ) | 30.24 V |
| Maximum power point current ( Impp ) | 7.44 A |
Table 5.
Electrical specifications of the lithium-iron phosphate battery [24].
Table 5.
Electrical specifications of the lithium-iron phosphate battery [24].
| A123 Li-iron-phosphate ANR26650M1 | |
| Rated capacity (Ah) | 2.3 Ah |
| Rated voltage (V) | 3.3 V |
| Maximum discharge current (A) | 70 A |
| Charging operating temperature (℃) | -50~60 ℃ |
| Discharging operating temperature (℃) | -30~60 ℃ |
| Internal impedance (mΩ) | 10 mΩ |
| Weight (g) | 70 g |
Disclaimer/Publisher’s Note: The statements, opinions and data contained in all publications are solely those of the individual author(s) and contributor(s) and not of MDPI and/or the editor(s). MDPI and/or the editor(s) disclaim responsibility for any injury to people or property resulting from any ideas, methods, instructions or products referred to in the content. |
© 2026 by the authors. Licensee MDPI, Basel, Switzerland. This article is an open access article distributed under the terms and conditions of the Creative Commons Attribution (CC BY) license (http://creativecommons.org/licenses/by/4.0/).
Copyright: This open access article is published under a Creative Commons CC BY 4.0 license, which permit the free download, distribution, and reuse, provided that the author and preprint are cited in any reuse.


