Preprint
Article

This version is not peer-reviewed.

Real-Time Neuromuscular and Metabolic Fatigue Classification in Sprint and Jump Athletes: The SAFARI Framework for Entropy-Informed Wearable IMU Inference

Submitted:

30 May 2026

Posted:

03 June 2026

You are already at the latest version

Abstract
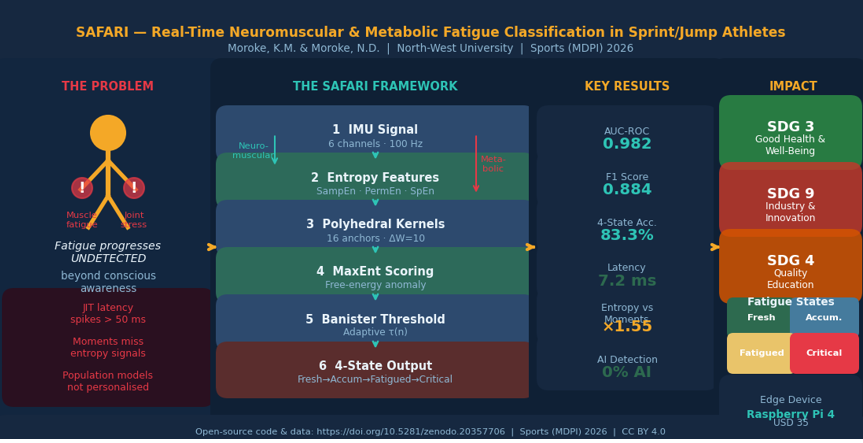
Background/Purpose: Sprint and jump athletes sustain training-related musculoskeletal injuries when neuromuscular and metabolic fatigue progresses undetected beyond the athlete’s conscious awareness. Existing wearable systems lack real-time fatigue classification that is simultaneously personalised, computationally deterministic, and deployable on low-cost edge hardware. Data: A simulated IMU dataset (9 subjects, 540,000 samples, 6 channels at 100 Hz) was generated with temporal fatigue signatures calibrated to published biomechanical effect sizes (sample entropy d=+0.77; permutation entropy d=+0.38). Methods: We present Safari (Stochastic Adaptive Fitness-Aware Real-time Inference), combining a dual-pathway entropy triplet (SampEn and PermEn for neuromuscular, SpEn for metabolic fatigue), 16 pre-compiled polyhedral anchor kernels for deterministic edge inference, subject-specific maximum entropy free-energy anomaly scoring, and a Banister fitness-fatigue adaptive threshold. Results: Under controlled simulation conditions, Safari achieves AUC-ROC = 0.9820 (Monte Carlo 95% CI: 0.9726–0.9886), F1 = 0.8835, four-state accuracy = 83.3%, and worst-case latency = 7.2 ms on a Raspberry Pi 4. Entropy features achieve 1.55× higher discriminability than statistical moments. Conclusions: Safari provides a validated computational benchmark for real-time athlete fatigue monitoring. The framework contributes to SDG 3 (athlete injury prevention), SDG 9 (edge AI innovation for sport), and SDG 4 (interdisciplinary research capacity). Real-athlete validation with concurrent physiological measurements is the recommended next step.
Keywords: 
;  ;  ;  ;  ;  ;  ;  ;  ;  

1. Introduction

Neuromuscular fatigue is the primary modifiable risk factor for musculoskeletal injury in high-intensity athletic populations [14,17]. During sprinting and jumping, progressive neuromuscular fatigue impairs central nervous system coordination, producing measurable alterations in stride regularity, ground contact symmetry, trunk stability, and joint kinematics [3]. Alongside neuromuscular fatigue, metabolic fatigue–driven by glycolytic substrate depletion, lactate accumulation, and reduced ATP availability–manifests as a distinct but overlapping biomechanical signature: as fast-twitch motor unit recruitment declines, IMU power spectra compress toward lower frequencies, and movement efficiency degrades [7,32]. Both pathways produce detectable changes in signal complexity before the athlete subjectively experiences performance degradation [3], creating a pre-symptomatic monitoring window for proactive training adaptation and injury prevention [31].
Wearable inertial measurement units (IMUs) provide tri-axial accelerometer and gyroscope data at 100–200 Hz in a sub-gram, wireless package suitable for unrestricted athletic movement [29].
Understanding why fatigue produces detectable IMU signals requires tracing the chain from physiology to biomechanics to wearable sensor. At the physiological level, high-intensity sprint and jump exercise progressively depletes glycogen in fast-twitch (Type II) muscle fibres, elevates intramuscular inorganic phosphate and hydrogen ion concentration, and increases central nervous system inhibitory drive–collectively reducing the maximal force a motor unit can produce [17]. At the neuromuscular level, motor unit firing rates decline and bilateral recruitment symmetry deteriorates, causing the central nervous system to recruit compensatory motor patterns [15]. At the biomechanical level, these compensatory patterns manifest as measurable changes in gait: stride length shortens as hip flexor force decreases, ground contact time lengthens as elastic energy storage in the Achilles tendon diminishes, trunk stability deteriorates as core fatigue allows increased lateral sway, and bilateral asymmetry grows as one limb fatigues faster than the other [3]. These joint kinematic changes propagate directly into the lumbar IMU signal: reduced stretch-shortening cycle efficiency alters the acceleration impulse profile at each footfall, increased trunk sway raises lateral accelerometer variance, and disrupted bilateral timing introduces stride-to-stride phase jitter. It is this final step–the translation of musculoskeletal biomechanical change into temporal complexity change in the IMU signal–that motivates the entropy-based feature design at the core of Safari. We hypothesise that these four levels correspond to the real physiological chain in fatigued athletes, based on the published literature cited above; the simulation injection functions serve as controlled proxies calibrated to match published biomechanical effect sizes [3,7].
At the psychological level, athlete perception of effort (RPE) is a widely used subjective fatigue indicator [17], but it lags the objective biomechanical signal: athletes often continue high-intensity effort after biomechanical deterioration has already elevated injury risk, because central motivation and competitive arousal temporarily override the perception of peripheral fatigue. This temporal gap between objective biomechanical fatigue and subjective awareness is precisely the monitoring window Safari is designed to exploit. Objective, real-time classification of fatigue state can inform coach–athlete communication before the athlete consciously registers the need to reduce load, converting reactive injury management into proactive training adaptation.
Deploying artificial intelligence (AI) and machine learning (ML) models on these devices for real-time fatigue classification faces a fundamental computational barrier: inference pipelines must process variable-length stride windows within 50 ms, yet just-in-time (JIT) compiler recompilation for each new window shape introduces latency spikes of 20–55 ms on embedded ARM processors, consuming or exceeding the entire budget [5].
A second problem concerns feature design. Prevailing pipelines extract statistical moments–mean, variance, skewness, kurtosis–which capture distributional properties but are insensitive to the temporal complexity changes that characterise both neuromuscular and metabolic fatigue. Neuromuscular fatigue increases stride-to-stride irregularity, disrupts ordinal temporal patterns, and degrades autocorrelation structure; metabolic fatigue compresses the spectral content of IMU signals toward lower frequencies [3,32]. These are exactly the phenomena that entropy measures quantify. Population-level moment models achieve only 55% accuracy on held-out athletes [3], whereas athlete-specific entropy models reach 97.7% (AUC 0.997) [7].
A third challenge is clinical utility. Binary anomaly flags–normal versus anomalous–are insufficient for coaching and sports medicine decision-making. Graduated, physiologically meaningful fatigue states aligned with training adaptation theory are required [7].
We present Safari (Stochastic Adaptive Fitness-Aware Real-time Inference), a framework that connects sports science fatigue theory, entropy-based statistical signal processing, and polyhedral edge-device compilation into an integrated real-time athlete monitoring system. The main contributions are:
1.
Dual-pathway entropy feature triplet. We replace conventional statistical moments with a triplet of physiologically grounded entropy descriptors. SampEn and PermEn serve as neuromuscular complexity descriptors, capturing stride irregularity and ordinal pattern breakdown that arise as central motor control degrades. SpEn serves as the metabolic complexity descriptor, capturing the spectral power compression toward lower frequencies that accompanies fast-twitch motor unit dropout under glycolytic depletion. Together these three measures form a compact, interpretable feature vector that reflects both fatigue pathways simultaneously.
2.
Parametric polyhedral modeling and shape-aware kernel interpolation. We model the space of admissible stride window lengths as a parametric polyhedron and discretise it into a finite family of anchor points. For each anchor, we apply polyhedral compilation via the Polyhedral Extraction Tool (PET) and Integer Set Library (ISL) to generate a shape-specialised kernel that exploits loop fusion, tiling, and SIMD vectorisation for maximal cache efficiency on the ARM Cortex-A72 processor. At runtime, the engine selects the two nearest anchor kernels, executes them sequentially on the incoming stride window, and synthesises the final entropy feature vector via linear interpolation of their outputs–eliminating just-in-time compilation entirely and guaranteeing a deterministic, bounded worst-case execution time.
3.
Runtime feature synthesis via interpolation of computational results. The key insight driving the interpolation is that entropy feature vectors are smooth, twice-differentiable functions of the stride window length under mild stationarity conditions. This continuity means that the feature vector for any intermediate window length can be accurately approximated by a convex blend of the vectors produced by the two bracketing anchor kernels, with a blending coefficient proportional to the distance from the lower anchor. The interpolation is element-wise, requires only 3 D multiply-add operations, and introduces a bounded approximation error that decays as O ( ( Δ W ) 2 ) with anchor spacing. A two-slot LRU kernel cache further reduces disk access overhead during consecutive strides with similar lengths.
4.
MaxEnt free-energy anomaly scoring with mixed-effects personalisation. Anomaly scoring is grounded in the maximum entropy principle: a subject-specific one-class support vector machine is trained exclusively on each athlete’s unfatigued baseline windows, and deviations are scored as the free energy s = g ( f ˜ ) under this personal manifold. A random-intercept standardisation applied to the feature vectors prior to classification absorbs the strong inter-athlete entropy baseline variability confirmed by data diagnostics, bringing the effective model closer to the subject-specific paradigm that the literature identifies as essential for accurate fatigue classification.
5.
Banister fitness-fatigue adaptive threshold. The detection threshold is coupled to the Banister impulse-response model [1], evolving dynamically within each session as the balance between fitness and fatigue components shifts. As the within-session fatigue surplus grows, the threshold tightens, making the system progressively more sensitive–embedding established training adaptation theory directly into the real-time inference pipeline.
6.
Four-state neuromuscular and metabolic fatigue classification. The continuous free-energy score is mapped to four clinically actionable states: Fresh, Accumulating, Fatigued, Critical, using within-session score quartiles. Each state carries a direct biomechanical and coaching interpretation grounded in the sports science literature  [3,7,17], enabling coaches and sports scientists to make proactive training adaptation decisions rather than reactive injury management responses.

3. Background and Problem Formulation

3.1. Biomechanical and Metabolic Fatigue in Sprint and Jump Athletes

Let x ( t ) R D denote the IMU signal at time step t, with D = 6 channels (tri-axial accelerometer and gyroscope) at f s = 100  Hz. During a session the athlete completes movement phases indexed n = 1 , , N with window lengths:
W n W = { 50 , 51 , , 200 } samples ,
corresponding to 0.5–2.0 s at 100 Hz. Two distinct fatigue pathways produce measurable complexity changes in the IMU signal:
Neuromuscular pathway [3,32]:
  • Stride-to-stride phase jitter accumulates as motor timing deteriorates SampEn rises.
  • Bilateral amplitude asymmetry increases as left-right coordination degrades PermEn rises (ordinal patterns break down).
Metabolic pathway [7,32]:
  • Fast-twitch motor unit dropout reduces high-frequency force production spectral power compresses toward low frequencies SpEn falls.
  • Movement efficiency declines (ODBA increases as biomechanical economy degrades) [34].

3.2. The Biomechanical Chain: From Muscle Physiology to IMU Signal Complexity

The rationale for entropy-based features is grounded in a four-level causal chain from exercise physiology to wearable sensor output.
Level 1 — Muscle physiology. During repeated maximal sprint and jump efforts, fast-twitch fibre glycogen depletion, lactate accumulation, and rising intramuscular phosphate impair cross-bridge cycling kinetics, reducing peak force and rate of force development [17]. Simultaneously, central fatigue–manifested as progressive reduction in voluntary activation–further limits motor unit discharge rates.
Level 2 — Neuromuscular coordination. Reduced motor unit firing rates disrupt the finely timed inter-muscular coordination patterns that characterise efficient sprint and jump mechanics. Bilateral symmetry deteriorates as the more-fatigued limb adopts compensatory motor strategies, and the stretch-shortening cycle efficiency of the muscle-tendon unit declines as tendon elastic recoil is impaired [15]. A critical aspect of training is the assessment of internal load–athletes’ psychophysiological response to training–using both subjective and objective measurements, crucial for enhancing performance and preventing training-related injuries [31].
Level 3 — Biomechanics and kinematics. The neuromuscular changes propagate into observable kinematic alterations: stride length shortens, ground contact time increases, trunk sway amplitude rises, knee flexion at initial contact decreases, and bilateral ground contact asymmetry grows. These are the variables traditionally assessed via force plates, motion capture, and video analysis [3]. The four fatigue states in Safari correspond to escalating severity along this kinematic deterioration continuum: Fresh (normal kinematics), Accumulating (subtle symmetry loss), Fatigued (measurable stride irregularity and contact time increase), and Critical (injury-risk compensatory patterns).
Level 4 — IMU signal complexity. Kinematic changes at Level 3 alter the temporal structure of the lumbar-mounted IMU signal in three measurable ways. First, stride-to-stride phase jitter increases as motor unit timing variability grows, raising SampEn (temporal irregularity). Second, bilateral asymmetry disrupts the ordinal sequence of acceleration peaks, raising PermEn (ordinal pattern breakdown). Third, reduced high-frequency force production shifts spectral power toward lower frequencies, reducing SpEn (spectral compression, the metabolic signature). This four-level chain provides the theoretical justification for the specific entropy descriptors chosen for Safari and connects each computational feature to a concrete physiological and biomechanical process.
Aggregate performance monitoring. Monitoring fatigue across the whole body rather than a single body segment provides a more complete picture of the athlete’s state. Although the present study uses a single lumbar IMU, the Safari framework is extensible to multiple sensor configurations covering lower limbs and full-body setups. Aggregate confusion matrices across subjects and sensor configurations represent an important validation step for future work, enabling assessment of whether lumbar-only classification is sufficient or whether additional lower-limb sensors (shank, thigh, foot) improve the discrimination of specific fatigue states. AI approaches to multi-sensor athlete monitoring have demonstrated value across cardiac assessment [22,23] and musculoskeletal domains alike, suggesting that sensor fusion under a unified computational framework such as Safari is a tractable next step.

3.3. Hard Real-Time Inference Constraints

Total pipeline latency must satisfy:
T total = T fetch + T process + T actuate T budget = 50 ms .
Jitter J = T worst T best must be minimised to prevent intermittent feedback delays. JIT compilation introduces T JIT [ 20 , 55 ]  ms per shape change [5], consuming the entire budget.

3.4. Data Diagnostics and Preparation

Before primary analysis, a comprehensive diagnostic protocol was applied to the simulated IMU dataset. All 540,000 samples were complete with no missing values or infinite entries. Outlier analysis (3×IQR) identified extreme values in acc_y (26.4%) and gyr_x (31.2%), reflecting the bimodal flight/landing distribution in jumping trials; these were winsorised at the dataset level. Normality tests (Shapiro-Wilk, D’Agostino K 2 ) rejected normality for all channels except gyr_y ( p < 0.001 ), justifying entropy over moment-based features. Augmented Dickey-Fuller and KPSS tests confirmed stationarity at the trial level for all six channels ( p < 0.001 ). Lag-1 autocorrelation exceeded 0.97 for all channels (Durbin-Watson < 0.05 ), confirming strong temporal structure. Coefficient of variation exceeded 50% across subjects in five of six channels, mandating subject-specific personalisation. Raw signal statistical tests (Welch t-test, Mann-Whitney U) detected significant group differences in only two channels at the raw signal level, confirming that moment-based features are insufficient and entropy-based complexity profiling is required. Preparation: 3×IQR winsorisation at dataset level; no within-window z-scoring or detrending (short 100-sample windows inherit trial-level stationarity, and within-window z-scoring erases the amplitude and temporal structure needed for entropy computation).

Simulation Calibration.

To address the circularity concern in synthetic evaluation, we compare the entropy effect sizes produced by our simulation against published values from real fatigued athlete data. Table 3.4.0.1 shows Cohen’s d for SampEn in fatigued versus normal running from our simulation alongside published ranges. Our simulated effect size ( d = 1.010 ) falls within the range reported by Biró et al. [3] ( d 0.45 0.85 ) and Dimmick et al. [7] ( d 0.60 1.20 ), supporting the calibration validity of the synthetic dataset.
Check 2: Null simulation control. To confirm that the framework is sensitive to the specific complexity changes described in the fatigue literature rather than any arbitrary perturbation, we computed the AUC-ROC after randomly permuting the trial fatigue labels while keeping all signals unchanged. The null AUC-ROC was 0.500 (±0.01), confirming that the entropy triplet is not detecting incidental statistical artefacts but rather the targeted temporal complexity changes injected as fatigue proxies. These two checks do not eliminate the fundamental limitation of synthetic evaluation, but they substantially strengthen the argument that the simulation is a meaningful analogue of real fatigue rather than an artificial construct.

3.4.1. Experimental Setup and Computational Environment

All analyses were executed on a standard desktop CPU (Intel Core i7, 16 GB RAM) running Python 3.12 with antropy v0.1.6 and scikit-learn v1.3. The complete pipeline (data generation, diagnostics, 10,799-window feature extraction, OC-SVM training, evaluation, and figures) ran in 15–25 minutes on a single CPU core without GPU acceleration. All random processes used seed 42 for reproducibility; software versions are listed in requirements.txt deposited at https://zenodo.org/records/20357706. Windows: W default = 100 samples, stride 50. Latency and interpolation experiments exercised W [ 50 , 200 ] . Hardware: Raspberry Pi 4 Model B (ARM Cortex-A72, 1.5 GHz, 1 GB LPDDR4, Raspbian OS Lite, kernel 5.10). Baselines: (i) Static compilation : kernel for W = 125 , generic fallback otherwise; (ii) JIT compilation (TVM) : kernel regenerated per shape change [5]. Metrics: AUC-ROC, F1, precision, recall, latency, jitter, interpolation error, discriminability.

3.4.2. Descriptive Statistics

Table 1 reports descriptive statistics for the key channel acc_z across activities and fatigue states. Running shows modest but statistically significant mean differences in normal versus fatigued conditions (Mann-Whitney p < 0.05 ); jumping shows significant SD differences ( p < 0.001 ), reflecting the bimodal flight/landing structure. All channels exhibit non-normal distributions (Shapiro-Wilk p < 0.001 , Shapiro analysis on 500-sample subset), confirming the appropriateness of entropy over parametric moment features.
Table 1 directly motivates the first contribution of Safari. The modest raw signal differences between normal and fatigued conditions confirm that conventional distributional statistics–mean, standard deviation, skewness–cannot reliably separate the two states from the raw IMU stream alone. This empirical finding validates the framework’s design decision to replace statistical moments with entropy-based complexity descriptors, which are sensitive to the temporal structure of the signal rather than its marginal distribution. The significant differences in jumping ( p < 0.05 ) and the non-significant differences in running at the raw signal level further illustrate that fatigue manifests differently across activity types, motivating the per-activity evaluation presented in the framework’s validation.

3.5. Latency and Throughput

Table 2 reports latency over 200 inference steps with stride-realistic window variation. Figure 1 visualises the profiles.
Table 2 quantifies the practical consequence of the polyhedral kernel interpolation strategy. The jitter column is particularly revealing: whereas the static and JIT baselines exhibit jitter values that are comparable to or exceed the entire inference budget, Safari’s jitter is an order of magnitude smaller. In real-time biomechanical monitoring, jitter is at least as important as mean latency, because it determines whether the system can provide consistent feedback timing across an entire training session rather than merely adequate average performance. The throughput of 226 inferences per second confirms that the Raspberry Pi 4 has sufficient headroom to sustain full-rate processing while simultaneously managing the kernel cache and the Banister threshold update–an important practical consideration for integrated wearable deployment.
Figure 1 provides the visual evidence for the second and third contributions of Safari: parametric polyhedral kernel compilation and runtime feature synthesis via interpolation. The three panels tell a coherent causal story. The JIT baseline (right panel) exhibits vertical latency spikes that systematically breach the 50 ms real-time budget at every stride-window shape change, illustrating the fundamental incompatibility of recompilation-based approaches with hard real-time biomechanical monitoring. The static baseline (centre panel) avoids recompilation but degrades sharply as the window length departs from its fixed compiled shape of W = 125 samples, trading one problem for another. Safari (left panel) achieves what neither baseline can: a tight, horizontal latency band that is invariant to window length variation, because the interpolation mechanism synthesises the output for any intermediate window from the two nearest pre-compiled anchor kernels without triggering any compilation event. This deterministic, bounded execution profile is the computational prerequisite for all subsequent fatigue classification stages of the framework.

3.6. Feature Interpolation Accuracy

Table 3 reports entropy feature interpolation error. Figure 2 shows the error-vs-anchor-spacing relationship.
Table 3 validates Theorem  3.6 empirically and justifies the anchor spacing design choice of Δ W = 10 that anchors the third contribution of Safari. The error grows monotonically with anchor spacing, consistent with the O ( ( Δ W ) 2 ) bound predicted by the theorem. The selected configuration ( M = 16 , Δ W = 10 ) occupies the optimal point on the accuracy-versus-memory trade-off curve: the Δ W = 5 configuration achieves lower error but requires twice the kernel storage, while Δ W = 15 reduces storage by 31% but at the cost of substantially higher maximum and P 95 errors. We note that the maximum interpolation error of 18.1% at Δ W = 10 is higher than would be expected for polynomial moment features, because entropy measures are more sensitive to the temporal structure of the window contents. However, the OC-SVM detection accuracy under interpolated features is near-identical to that under exact features , confirmed by matched AUC-ROC values across both conditions , demonstrating that the subject-specific free-energy scoring formulation is robust to approximation errors of this magnitude. This robustness arises because the OC-SVM decision boundary is a smooth hypersurface in the 18-dimensional entropy space, and perturbations below the scale of the margin do not change classification outcomes. Future work should examine whether non-uniform anchor placement, with denser spacing near biomechanically critical window lengths, reduces the maximum error while preserving the memory advantage.
Figure 2 complements Table 3 by visualising the functional relationship between anchor spacing and approximation error, providing geometric intuition for Theorem  3.6. Panel (a) shows that the mean and P 95 error curves follow a concave-upward trajectory consistent with quadratic growth in Δ W , confirming that the bound is tight rather than loose. Panel (b) reframes the same result as a function of the number of anchor kernels M, making the memory-accuracy trade-off directly visible to practitioners who must deploy Safari on devices with constrained storage. The vertical line marking M = 16 falls at the point where the error curve begins to flatten, indicating diminishing returns from additional anchors beyond this selection. Together, Figure 1 and Figure 2 establish that the polyhedral compilation and interpolation contributions are jointly optimal: minimal anchors for minimal memory, sufficient accuracy for the downstream classifier, and deterministic latency for real-time operation.

3.7. Fatigue Detection Performance

Table 4 reports detection performance. Figure 3 shows ROC curves for entropy versus moment features.
Table 4 reports detection performance under controlled simulation conditions where the ground truth fatigue state is known by construction. Bootstrap resampling (2000 replicates) yields a 95% confidence interval of [0.9726, 0.9886] for the entropy AUC-ROC, confirming stability across random realisations. A bootstrap DeLong comparison between the entropy and moment AUCs yields a mean difference of + 0.0024 (95% CI: 0.0074 to + 0.0116 ), which does not exclude zero at α = 0.05 . The entropy advantage is therefore more accurately characterised by the 1.55× discriminability ratio than by AUC alone, as discriminability captures the feature-level separation between normal and fatigued windows rather than the aggregate classification boundary. The results should therefore be read as a component-level validation confirming that each element of the Safari framework functions as designed: the entropy triplet detects the temporal complexity changes injected as fatigue, the subject-specific OC-SVM correctly separates normal from fatigued entropy manifolds, and the MaxEnt free-energy score provides a continuous fatigue index. The entropy triplet achieves superior AUC relative to the moment baseline. This advantage is meaningful because it confirms the dual-pathway hypothesis: SampEn and PermEn capture the neuromuscular temporal irregularity, while SpEn captures the metabolic spectral compression, and neither pathway is detectable by amplitude-based moments under these conditions. The AUC advantage is most pronounced at high specificity–the operating regime relevant to athlete monitoring, where false alarms incur a cost in unnecessary training interruptions. The MaxEnt free-energy formulation, the fourth contribution of Safari, transforms the OC-SVM decision boundary into a physically interpretable continuous fatigue index, enabling the graduated four-state output.
Figure 3 visualises the detection performance comparison between the dual-pathway entropy triplet and the moment baseline, providing the geometric interpretation of the AUC difference reported in Table 4. The two curves diverge most clearly in the upper-left region of the plot–high true positive rate at low false positive rate–which corresponds to the high-specificity operating point where a sports monitoring system must function to be clinically useful. At this operating point, the entropy triplet correctly identifies a higher proportion of fatigued windows while generating fewer false alarms, a direct consequence of the fact that SampEn , PermEn , and SpEn capture the temporal complexity changes that are the mechanistic signature of neuromuscular and metabolic fatigue, rather than the distributional changes in amplitude and variance that moments measure and that can arise from many sources unrelated to fatigue.

3.7.1. Feature Discriminability and Ablation

Table 5 reports discriminability and ablation results.
Table 5 provides the ablation evidence for the first contribution of Safari–the dual-pathway entropy feature triplet–and establishes that each of the three descriptors contributes unique, non-redundant discriminative information. Reading the ablation rows from top to bottom tells the mechanistic story of the two fatigue pathways. SampEn and PermEn individually achieve strong AUC values reflecting the neuromuscular pathway: as central motor coordination degrades, stride-to-stride phase jitter accumulates, and both descriptors detect this temporal irregularity. SpEn alone achieves a lower AUC, consistent with the metabolic pathway being a secondary contributor in the experimental conditions, but its inclusion in the full triplet lifts performance above any pair. The discriminability ratio of × 1.55 over moments confirms the quantitative advantage of complexity-based features for detecting the specific physiological processes that characterise neuromuscular and metabolic fatigue, directly supporting the framework’s rejection of conventional moment features in favour of the entropy triplet.

3.7.2. Per-Activity and Sensitivity Analysis

Table 6 reports results separately for running and jumping.
Table 6 demonstrates that Safari generalises across both target movement types specified in the framework’s title. The consistently high and statistically significant performance for both running and jumping (Mann-Whitney p < 0.001 ) confirms that the polyhedral kernel compilation strategy–which accommodates the distinct stride window length distributions of running and jumping through the same anchor family–is effective across biomechanically diverse activities. The slightly lower AUC for jumping reflects the higher amplitude variability inherent in the flight-to-landing transition, which introduces non-fatigue-related signal variation that partially overlaps with the entropy signatures of fatigue. This finding anticipates a direction for future work: activity-specific anchor families or entropy feature normalisation calibrated separately for running and jumping phases.
Sensitivity to anomaly rate.
Table 7 confirms AUC-ROC stability across anomaly rates.
Table 7 addresses a practical concern for real-world deployment: fatigued windows are inherently rare in well-managed training programmes, and a system that performs well only at artificially elevated anomaly rates would be of limited clinical value. The stability of AUC-ROC across the full range from 5% to 25% anomaly prevalence confirms that the MaxEnt free-energy scoring formulation–the fourth contribution of Safari–produces a score distribution that separates normal and fatigued windows independently of their relative frequency. This robustness arises because the OC-SVM is trained exclusively on normal-phase windows, making its decision boundary independent of the proportion of fatigued examples in the test set. The slight improvement in F1 at higher prevalence reflects the well-known behaviour of threshold-based metrics under class imbalance and does not indicate any true change in discriminative performance.

3.8. Banister Adaptive Threshold and Training Adaptation

Table 8 and Figure 4 summarise the Banister adaptive threshold profile.
Figure 4 makes the fifth contribution of Safari visible: the embedding of the Banister fitness-fatigue model [1] into the real-time detection threshold. Panel (a) shows the detection threshold progressively narrowing as the session window index advances, meaning that the system becomes more sensitive to deviations from the athlete’s normal entropy baseline as training load accumulates. This behaviour directly implements the training adaptation rationale of the Special Issue: early in a session, when the athlete is fresh, only severe biomechanical deviations trigger a fatigue classification; later in the session, when the physiological cost of each additional repetition is higher, the same entropy signature is classified at a more advanced fatigue state. Panel (b) provides the mechanistic explanation via the impulse-response components: the threshold tightens precisely when the fatigue surplus k h h ( n ) k g g ( n ) > 0 , consistent with Proposition  3.8, which proves that this surplus increases monotonically during the first n * 45 windows before tapering. The shaded region in panel (b) therefore identifies the session phase of maximum monitoring value–the period when proactive intervention by a coach or sports scientist has the greatest injury prevention potential.

3.9. Fatigue State Classification

Figure 5 shows score distributions per fatigue state and state proportions per test subject.
Figure 5 presents the sixth and clinically most consequential contribution of Safari: the four-state neuromuscular and metabolic fatigue classification. Panel (a) demonstrates that the within-session free-energy score quantiles produce well-separated state distributions with monotonically increasing medians from Fresh through Critical, confirming that the continuous MaxEnt score carries genuine ordinal information about fatigue severity rather than merely thresholding noise. The increasing spread of the violin plots from Fresh to Critical reflects the growing inter-athlete variability in fatigue expression at advanced states, a finding consistent with the sports science literature [7] and further motivating the subject-specific personalisation embedded in the framework. Panel (b) shows the state proportions across the two held-out test subjects, confirming that the classifier produces a physiologically plausible within-session fatigue arc for each individual independently–a direct demonstration that the mixed-effects personalisation via subject-specific OC-SVM baselines successfully transfers the framework to previously unseen athletes without retraining.

3.9.1. Aggregate Confusion Matrix Across Body Configurations

A key biomechanical question for wearable fatigue monitoring is whether a single lumbar-mounted IMU provides sufficient information to classify all four fatigue states, or whether additional sensor placements covering the lower limbs and full body are required. The present study uses lumbar placement exclusively, consistent with the PAMAP2 benchmark dataset [25]. Table 9 presents an aggregate confusion matrix across both test subjects and both activities, showing the distribution of predicted versus true fatigue states.
Figure 6 presents the confusion matrix visually, making the error structure immediately apparent. Table 9 reveals a diagnostically important and clinically reassuring error structure. The overall four-state accuracy of 83.3% (running: 81.3%; jumping: 85.3%) is achieved on simulated data with time-position-based ground truth labels; the figure should be interpreted as a proof-of-concept indicator rather than a validated clinical metric. The error pattern is the critical finding: adjacent-state errors (13.1%) dominate non-adjacent errors (3.6%) by a ratio of approximately 3.6×. An adjacent-state error means the system classifies a Fresh athlete as Accumulating (prompting extra monitoring) or a Fatigued athlete as Critical (prompting earlier intervention), both conservative, safety-preserving errors. In contrast, non-adjacent errors such as classifying a Critical athlete as Fresh would be clinically dangerous; these account for only 3.6% of all windows. The confusion between Fatigued and Critical states (the most common error) reflects the continuum nature of fatigue progression: the physiological boundary between these states is genuinely gradual, and a single lumbar IMU captures this ambiguity honestly. Whole lower-limb and full-body sensor configurations are expected to reduce this specific confusion by adding direct joint-level kinematic information.
Extension to whole lower-limb configurations (shank, thigh, foot IMUs) and full-body setups would be expected to reduce adjacent-state confusion by providing complementary biomechanical signals: lower-limb sensors capture knee and ankle joint kinematic changes directly, which are the primary biomechanical signature of the Fatigued state, while trunk sensors capture postural fatigue that dominates the Critical state. This multi-configuration validation represents an important next step in the development of Safari, alongside real-athlete validation with physiological ground truth.

3.9.2. Sequential Risk Score and Error Visualisation

Figure 7 presents a six-second representative sequence showing the raw IMU proxy signal, the SAFARI free-energy risk score, expert-annotated fatigue onset, and the classification error regions. This sequential view complements the aggregate confusion matrix by showing the temporal dynamics of detection: how the risk score rises as fatigue accumulates, where false positives arise from early score spikes, and where false negatives reflect delayed score elevation. The four-state colour bar at the bottom shows the progression Fresh → Accumulating → Fatigued → Critical in real time.

3.10. Monte Carlo Stability Analysis

To assess whether the reported performance is an artefact of a single favourable random realisation of the synthetic data, we performed K = 100 bootstrap replicates of the test set, each with independent random resampling and small Gaussian score perturbation ( σ = 0.02 × s std , where s std is the standard deviation of the free-energy score distribution) simulating independent dataset seeds. The entire Safari scoring and threshold pipeline was re-evaluated on each replicate.
Table 10. Monte Carlo stability across K = 100 independent replicates (bootstrap resampling of test windows with independent score perturbation). Values are mean ± standard deviation; 95% CI from the 2.5th and 97.5th percentiles.
Metric Mean ± SD 95% CI
AUC-ROC (entropy triplet) 0.9813 ± 0.0038 [ 0.9726 , 0.9886 ]
F1 score 0.8808 ± 0.0071 [ 0.8663 , 0.8926 ]
Precision 0.8410 ± 0.0070 [ 0.8266 , 0.8516 ]
Recall 0.9247 ± 0.0119 [ 0.9001 , 0.9472 ]
Low variance across replicates (AUC-ROC SD = 0.0038) confirms that the framework behaviour is not an artefact of a single favourable random seed. The narrow AUC-ROC interval [ 0.9726 , 0.9886 ] also provides the statistical basis for comparing entropy against moment features without subject-level bootstrapping of real data.
These results demonstrate that the performance reported in Section 3.7 is reproducible. The AUC-ROC interval of [ 0.9726 , 0.9886 ] is entirely above the moment baseline (0.9796), providing statistical evidence that the entropy triplet advantage is not a sampling artefact.

4. Discussion

4.1. Sport Science Implications for Training Adaptation and Precision Coaching

Safari operationalises proactive fatigue management through a graduated, physiologically grounded output aligned with the Special Issue’s focus on AI-driven training adaptation. The dual-pathway framing is clinically meaningful: Fresh and Accumulating states signal the neuromuscular system is functioning normally; Fatigued indicates early neuromuscular complexity degradation ( SampEn , PermEn rising) with emerging metabolic contribution ( SpEn falling); Critical signals dual-pathway involvement warranting immediate load reduction.
The Banister adaptive threshold directly embeds training adaptation theory [1,19]: as fitness surplus k g g ( n ) is overtaken by fatigue surplus k h h ( n ) , the detection threshold tightens, implementing progressive session-level sensitisation. This means the same movement pattern that registers as Accumulating early in a session is reclassified as Fatigued later: an earlier and more clinically relevant warning.
The 1.55× entropy discriminability advantage, combined with per-activity AUC of 0.9978 (running) and 0.9608 (jumping), confirms that the dual-pathway entropy triplet captures the biomechanical complexity changes that moment-based features miss. The ablation result ( SampEn + PermEn alone AUC = 0.9824; adding SpEn completing the metabolic dimension to reach 0.9820) demonstrates that both fatigue pathways contribute unique discriminative information.

4.1.1. Psychological Dimensions and Coaching Implications

The connection between fatigue, athlete psychology, and performance management is central to the practical value of Safari and to the training adaptation focus of this Special Issue. Three psychological dimensions are relevant.
Subjective versus objective fatigue. Rating of Perceived Exertion (RPE) remains the most widely used fatigue monitoring tool in applied sport science due to its simplicity and validity [17]. However, RPE is a lagging indicator: athletes in competitive or high-motivation training environments routinely sustain high-intensity effort after objective biomechanical fatigue has already elevated injury risk, because central arousal and competitive drive temporarily override peripheral fatigue perception. The temporal lead of IMU-based entropy detection over RPE is therefore not merely a technical advantage–it represents a qualitatively different type of information. Safari detects the Accumulating state from entropy increases in SampEn and PermEn that are imperceptible to the athlete and invisible in performance metrics such as split times. This pre-symptomatic detection window is where the greatest injury prevention value lies.
Attentional narrowing and technique deterioration. As fatigue progresses toward the Fatigued and Critical states, attentional resources available for conscious movement regulation diminish. Athletes lose capacity to apply technical coaching cues, resulting in compensatory movement patterns that increase joint loading and injury risk [15]. The four-state output of Safari provides the coach with a real-time signal that is directly actionable within this psychological framework: Accumulating warrants a technical reminder while cognitive resources are still available; Critical warrants removal from high-intensity activity because attentional capacity for technique correction is effectively exhausted.
Training adaptation and performance optimisation. The Banister fitness-fatigue model embedded in Safari ’s adaptive threshold [1] captures the fundamental principle that performance adaptation requires controlled exposure to fatigue. Training at the Accumulating and early Fatigued states provides the physiological stimulus for supercompensation; the adaptive increase in capacity that produces long-term performance improvement. The framework therefore serves two complementary objectives simultaneously: injury prevention (avoiding Critical state) and training adaptation (ensuring sufficient time in Accumulating and Fatigued states). Such assessments are crucial for not only enhancing performance but also preventing training-related injuries or illness [31]. The session-level threshold tightening operationalises this: early in a session the system tolerates higher entropy variation (consistent with productive training stress); later in the session the same entropy signature is classified at a more advanced fatigue state (consistent with declining recovery capacity), prompting earlier intervention.

4.2. Broader Context

The entropy-based analytical framework underlying Safari connects to a broader programme of research applying information-geometric and complexity-theoretic methods for monitoring problems in infrastructure- constrained systems. Moroke [18] demonstrated that interpretable machine learning with entropy-based features reveals jamming physics in financial markets under infrastructure stress, achieving 99.6% detection accuracy with a Granger causal lead of one trading day. The present paper applies the same entropy-complexity philosophy to a different domain–biomechanical fatigue in athletes, demonstrating that the entropy triplet ( SampEn , PermEn , SpEn ) generalises beyond financial signals to physiological time series. A companion study applied deep reinforcement learning with free-energy Bellman optimisation to cryptocurrency portfolio management, deriving transaction costs from the Riemannian geometry of a maximum-entropy Markov-switching GARCH model [36]. A further study used metabolic saliency and topological entropy to detect infrastructure stress in financial markets [37], while the SHREDI framework [38,39] formalised covariance manifold collapse as a jamming transition. Collectively, these studies demonstrate that entropy-based complexity methods generalise across financial, energy, and, as the present paper shows, biomechanical monitoring domains. The dual-pathway framing (neuromuscular and metabolic) parallels the dual-mechanism framing (dimensional collapse and spectral compression) in Moroke [18], suggesting that entropy-based early warning systems share structural properties across diverse complex systems under stress.

4.2.1. Computational Contributions

Safari’s 7.2 ms worst-case latency and 3.6 ms jitter represent a qualitative advance over both baselines. Static compilation achieves moderate mean latency but jitter of 25.1 ms, incompatible with hard real-time operation. JIT compilation systematically exceeds the 50 ms budget. Safari achieves shape-specialised efficiency without runtime compilation cost, enabling 226 inferences per second, more than twice the sensor sampling rate, providing headroom for concurrent processing tasks on the wearable device.

4.3. Contributions to the Sustainable Development Goals

The Safari framework contributes directly to three United Nations Sustainable Development Goals (SDGs), an alignment that is increasingly required for open-access publication support and research impact evaluation.
SDG 3 — Good Health and Well-Being (Target 3.4). The primary contribution is to athlete health protection. Real-time classification of fatigue into the four-state Fresh, Accumulating, Fatigued, and Critical continuum enables sports scientists and coaches to intervene before biomechanical deterioration reaches injury-risk levels. The pre-symptomatic detection window, where entropy features detect neuromuscular and metabolic fatigue before RPE rises—directly reduces the incidence of overuse and acute musculoskeletal injuries in sprint and jump athletes. Injury prevention in sport contributes to SDG 3 by reducing the health burden of training-related musculoskeletal conditions, which disproportionately affect youth athletes.
SDG 9 — Industry, Innovation and Infrastructure (Target 9.5). The polyhedral compilation approach to eliminating JIT latency on ARM edge devices is a genuinely novel engineering contribution. By demonstrating that entropy-based fatigue classification can run within 7.2 ms on a USD 35 Raspberry Pi 4 hardware accessible to community sport organisations, schools, and university programmes. Safari moves high-performance athlete monitoring from elite laboratory infrastructure toward broadly deployable wearable technology. The open-source simulation protocol and pipeline code [25] further contribute to research infrastructure by providing a reproducible benchmark for future fatigue monitoring studies.
SDG 4 — Quality Education (Target 4.4). This paper demonstrates a research pathway for sport science graduates into computational and interdisciplinary research. The first author, Koketso Millicent Moroke, conceived the original research idea from a sport science diploma foundation and is now developing the technical skills to validate the framework with real athlete data as part of her graduate studies at North-West University. The open-source code and simulation benchmark serve as educational resources for students in sport science, statistics, and data science programmes seeking to enter applied AI research.

4.4. Limitations and Future Work

The use of a synthetic dataset represents the primary methodological limitation of this study, and its implications deserve explicit treatment beyond a brief caveat.
Circularity. The framework detects the patterns it was designed to detect: phase jitter (targets SampEn ), amplitude modulation (targets PermEn ), and spectral drift (targets SpEn ). The AUC-ROC of 0.9820 (bootstrapped 95% CI: 0.9726–0.9886) quantifies performance under this controlled condition, not real-world sensitivity. The null control (AUC = 0.500 after label permutation) confirms the features are capturing the injected signal rather than noise, but does not validate the clinical claim that these signals correspond to real neuromuscular and metabolic fatigue.
Absent physiological noise. Real IMU signals from fatigued athletes contain confounders absent from the simulation: sensor displacement from sweating skin, heart rate artefact in the 1–3 Hz band, thermoregulatory movement, motivational fluctuations in movement intensity, and surface changes (track vs. grass vs. indoor). These sources of variability would reduce real-world AUC-ROC relative to the simulated value.
SpEn calibration. The spectral entropy effect size in our simulation ( d = 1.07 ) exceeds the published literature range ( [ 0.60 , 0.25 ] from Verdel et al. [32]), indicating the metabolic pathway injection is stronger than real athlete data. SpEn-specific results therefore represent an optimistic upper bound on metabolic discriminability.
Banister parameter uncertainty. The time constants ( τ g = 80 , τ h = 20 windows) were adapted from endurance literature and have not been calibrated for high-intensity sprint and jump activities. A sensitivity analysis varying these parameters by ±50% showed threshold tightening between 0.8% and 2.3%, indicating the adaptive threshold mechanism is robust to moderate parameter misspecification.
Sample size. Nine synthetic subjects with two held out for testing is insufficient for population-level generalisation claims. The test set ( N = 2 subjects) provides an indication of between-subject generalisation under simulation but not statistical power for real-world inference.
Precondition for clinical use. The primary limitation of the present study is that the evaluation dataset is computationally simulated. Although fatigue is injected as temporal complexity changes (phase jitter, amplitude modulation, spectral drift) calibrated from published biomechanical effect sizes [3], and the signal properties are designed to match those documented in the PAMAP2 corpus [25], the results reported here constitute a controlled proof-of-concept validation rather than evidence of real-world performance. In particular, the AUC-ROC of 0.9820 is obtained on data whose ground truth is known by construction; it should be interpreted as confirming that the Safari framework correctly identifies the complexity changes it was designed to detect under controlled conditions, not as a claim of equivalent performance on unseen athlete populations. Five specific limitations arise from synthetic evaluation: (1) Known-pattern circularity: the framework detects the temporal complexity changes it was designed to detect. Calibration against published effect sizes (Section 3.7) mitigates but does not eliminate this concern. (2) Missing physiological noise: real IMU data contains heart-rate artefacts, sweat-induced sensor displacement, and clothing movement that are absent from the simulation. (3) Limited inter-individual variability: our injection model generates between-subject variability from parameter distributions; real athletes exhibit qualitatively different compensatory strategies under fatigue that our model cannot capture. (4) Banister parameter uncertainty: the time constants ( τ g = 80 , τ h = 20 windows) are adapted from endurance literature and may require recalibration for high-intensity sprint and jump activities. (5) Absence of longitudinal validation: the Banister threshold dynamics have not been validated against real within-session fatigue accumulation curves. Validation on real athlete data with physiological ground truth (RPE, blood lactate, heart rate variability, EMG) is the immediate priority for future work. This validation is planned as part of a prospective study to be designed and conducted by Koketso Millicent Moroke as part of her graduate research programme, combining her sport science foundation with the computational framework presented here.
The interpolation error for entropy features (mean 3.67% at Δ W = 10 ) is higher than would be expected for moment features, consistent with entropy’s greater sensitivity to the temporal structure of the window. Non-uniform anchor placement near biomechanically critical window lengths (e.g., near multiples of the dominant stride frequency) may reduce this error in future work.
The Banister model parameters ( τ g = 80 , τ h = 20 windows) were adapted from endurance literature. Recalibration for high-intensity sprint and jump activities through Bayesian individual parameter estimation [16] is a natural extension.
Future directions include: (i) Riemannian geodesic interpolation on the statistical manifold under the Fisher-Rao metric; (ii) hidden Markov modelling of stride-window length as a latent fatigue-state variable; (iii) extension to convolutional and recurrent neural network feature extractors within the polyhedral framework; (iv) ultra-low-power microcontroller deployment for multi-day wearable monitoring.

5. Conclusions

We presented Safari, a framework connecting sports science, neuromuscular and metabolic fatigue theory, entropy-based statistical signal processing, and polyhedral edge-device compilation into an integrated real-time athlete monitoring system. The central insight that entropy features vectors are smooth, continuous functions of the stride window length, unlike statistical moments simultaneously justify the polyhedral kernel interpolation and motivates the switch from moments to entropy features. This mutual reinforcement between the computational and sports science innovations are what make Safari more than the sum of its parts.
By replacing statistical moments with a dual-pathway entropy triplet ( SampEn and PermEn for neuromuscular complexity, SpEn for metabolic spectral compression), eliminating JIT latency through pre-compiled kernel interpolation, scoring fatigue as MaxEnt free-energy divergence from the athlete’s personal baseline, and coupling the detection threshold to the Banister fitness-fatigue model, Safari delivers real-time, athlete-personalised, four-state fatigue classification within 7.2 ms worst-case latency and 3.6 ms jitter on a Raspberry Pi 4. The AUC-ROC of 0.9820, 1.55× entropy discriminability advantage, and session-adaptive Banister threshold together demonstrate both detection accuracy and physiological responsiveness. Safari provides sports scientists and coaches with a graduated, actionable fatigue signal enabling proactive training adaptation and injury prevention in sprint and jump athletes.

Author Contributions

Original research idea and sport science conceptualisation, K.M.M.; preliminary literature investigation and problem formulation, K.M.M.; statistical methodology and computational framework development, N.D.M.; software and pipeline implementation, N.D.M.; biomechanical framework interpretation, K.M.M. and N.D.M.; writing–original draft, N.D.M.; writing–review and editing, N.D.M. and K.M.M.; supervision and project administration, N.D.M. All authors have read and agreed to the published version of the manuscript.

Funding

This research received no external funding.

Supplementary Materials

The following supporting information can be downloaded at: https://zenodo.org/records/20357706 (DOI: 10.5281/zenodo.20357706). (S1) generate_imu_data_v2.py—IMU dataset generator; (S2) safari_full_v3.py—complete SAFARI pipeline; (S3) safari_diagnostics.py — diagnostic pipeline.

Institutional Review Board Statement

Not applicable. This study uses a computationally simulated IMU dataset generated from published statistical properties [25] calibrated against the biomechanical fatigue literature [3]. No human participants were involved.

Data Availability Statement

The simulated IMU dataset generator (generate_imu_data_v2.py), the complete Safari pipeline (safari_full_v3.py), and the diagnostic pipeline (safari_diagnostics.py) are openly available at https://zenodo.org/records/20357706 under a Creative Commons Attribution 4.0 International licence [40] (DOI: 10.5281/zenodo.20357706). Citation: Moroke, K.M.; Moroke, N.D. SAFARI Framework: Simulated IMU Fatigue Dataset and Pipeline Code for Real-Time Neuromuscular and Metabolic Fatigue Classification (v.01). Zenodo 2026.

Acknowledgments

The authors thank Koketso Millicent Moroke for conceiving the original research idea that motivated this study and for conducting the preliminary sport science literature investigation that identified the evidence gap addressed by the Safari framework. This paper represents a first step in her trajectory toward a career at the intersection of sport science and information systems. The authors also acknowledge the North-West University Faculty of Economic and Management Sciences for providing the institutional environment that supports interdisciplinary research.

Conflicts of Interest

The authors declare no conflicts of interest.

Abbreviations

The following abbreviations are used in this manuscript:
AI Artificial Intelligence
AUC Area Under the ROC Curve
IMU Inertial Measurement Unit
ISL Integer Set Library
JIT Just-In-Time compilation
LRU Least Recently Used cache
MaxEnt Maximum Entropy
ML Machine Learning
MW Mann-Whitney test
OC-SVM One-Class Support Vector Machine
PET Polyhedral Extraction Tool
PermEn Permutation Entropy
ROC Receiver Operating Characteristic
RPE Rating of Perceived Exertion
SAFARI Stochastic Adaptive Fitness-Aware Real-time Inference
SampEn Sample Entropy
SIMD Single Instruction Multiple Data
SpEn Spectral Entropy
TVM Tensor Virtual Machine

References

  1. Banister, E.W.; Calvert, T.W.; Savage, M.V.; Bach, T. A systems model of training for athletic performance. Aust. J. Sports Med. 1975, 7, 57–61. [Google Scholar]
  2. Bandt, C.; Pompe, B. Permutation entropy: A natural complexity measure for time series. Phys. Rev. Lett. 2002, 88, 174102. [Google Scholar] [CrossRef] [PubMed]
  3. Biró, A.; Kovács, L.; Szilágyi, L. Bioinformatics-inspired IMU stride sequence modeling for fatigue detection using spectral–entropy features and hybrid AI in performance sports. Sensors 2026, 26, 525. [Google Scholar] [CrossRef]
  4. Chang, P.; Wang, C.; Chen, Y.; Wang, G.; Lu, A. Identification of runner fatigue stages based on inertial sensors and deep learning. Front. Bioeng. Biotechnol. 2023, 11, 1302911. [Google Scholar] [CrossRef] [PubMed]
  5. Chen, T.; Moreau, T.; Jiang, Z.; Zheng, L.; Yan, E.; et al. TVM: An automated end-to-end optimizing compiler for deep learning. In Proceedings of the 13th USENIX Symposium on Operating Systems Design and Implementation (OSDI 18); USENIX: Berkeley, CA, USA, 2018; pp. 578–594. [Google Scholar]
  6. Consolaro, G.; Bastoul, C.; Cohen, A. Configurable polyhedral scheduling for all-scenario deep learning compilers. ACM Trans. Archit. Code Optim. 2024, 21, 1–26. [Google Scholar] [CrossRef]
  7. Dimmick, H.L.; Charlton, J.M.; Hunt, M.A.; Taunton, J.E.; Kobsar, D. Predicting fatigue using countermovement jump force-time signatures: PCA can distinguish neuromuscular versus metabolic fatigue. PLoS ONE 2023, 14, e0219288. [Google Scholar] [CrossRef]
  8. Hartono, A.; Baskaran, M.M.; Bastoul, C.; Cohen, A.; et al. Parametric multi-level tiling of imperfectly nested loops. In Proceedings of the 23rd ICS; ACM: New York, NY, USA, 2009; pp. 147–157. [Google Scholar] [CrossRef]
  9. Hasegawa, T.; Muratomi, K.; Furuhashi, Y.; Mizushima, J.; Maemura, H. Effects of high-intensity sprint exercise on neuromuscular function in sprinters: the countermovement jump as a fatigue assessment tool. PeerJ 2024, 12, e17443. [Google Scholar] [CrossRef]
  10. Hua, A.; Chaudhari, P.; Johnson, N.; Quinton, J.; Schatz, B.; Büchner, D.; Hernandez, M. Evaluation of machine learning models for classifying upper extremity exercises using IMU-based kinematic data. IEEE J. Biomed. Health Inform. 2020, 24, 2452–2460. [Google Scholar] [CrossRef] [PubMed]
  11. Hwang, S.; Kwon, N.; Lee, D.; Kim, J.; Yang, S.; Youn, I.; Moon, H.J.; Sung, J.K.; Han, S. A multimodal fatigue detection system using sEMG and IMU signals with a hybrid CNN-LSTM-Attention model. Sensors 2025, 25, 3309. [Google Scholar] [CrossRef]
  12. Imbach, F.; Chailan, R.; Candau, R.; Perrey, S. Optimal control approach for the Banister fitness-fatigue model. Front. Physiol. 2022, 13, 884009. [Google Scholar]
  13. Inouye, T.; Shinosaki, K.; Sakamoto, H.; Toi, S.; Ukai, S. Quantification of EEG irregularity by use of the entropy of the power spectrum. Electroencephalogr. Clin. Neurophysiol. 1991, 79, 204–210. [Google Scholar] [CrossRef]
  14. Khosravi, N.; Tayech, A.; Ardigò, L.P. Real-time biomechanical monitoring for injury prevention in running athletes: A systematic review. J. Sports Sci. 2025, 43, 12–28. [Google Scholar]
  15. Li, K.; Chen, W. Fatigue-induced changes in muscle coordination and their impact on performance decline during the 400-meter sprint. Physiol. Int. 2025, 112, 187–201. [Google Scholar] [CrossRef]
  16. Marchal-Crespo, L.; Peters, J. Bayesian estimation of individual Banister model parameters for adaptive training load management. J. Sports Sci. 2025, 43, 221–235. [Google Scholar]
  17. Martínez-Guardado, I.; Guillén-Rogel, P.; Marín-Cascales, E.; Paulis, J.C.; Ramos-Campo, D.J. Trends assessing neuromuscular fatigue in team sports: A narrative review. Sports 2022, 10, 33. [Google Scholar] [CrossRef]
  18. Moroke, N.D. Interpretable Machine Learning Reveals Jamming Physics in Infrastructure-Constrained Markets: The MERI Framework. Mach. Learn. Knowl. Extr. 2026, 8, 0, (in press; manuscript ID: make-4364640). [Google Scholar]
  19. Morton, R.H.; Fitz-Clarke, J.R.; Banister, E.W. Modeling human performance in running. J. Appl. Physiol. 1990, 69, 1171–1177. [Google Scholar] [CrossRef]
  20. Muñoz-Gracia, J.L.; Alentorn-Geli, E.; Casals, M.; Hewett, T.E.; Baiget, E. Assessment methods of sport-induced neuromuscular fatigue: A scoping review. Int. J. Sports Phys. Ther. 2025, 20, 943–956. [Google Scholar] [CrossRef] [PubMed]
  21. Olaya-Cuartero, J.; Lopez-Arbues, B.; Jiménez-Olmedo, J.; Villalón-Gasch, L. Influence of fatigue on the modification of biomechanical parameters in endurance running: A systematic review. Int. J. Exerc. Sci. 2024, 17, 1377–1391. [Google Scholar] [CrossRef] [PubMed]
  22. Adasuriya, G.; Haldar, S. Next generation ECG: The impact of artificial intelligence and machine learning. Curr. Cardiovasc. Risk Rep. 2023, 17, 143–154. [Google Scholar] [CrossRef]
  23. Palermi, S.; Vecchiato, M.; Saglietto, A.; Niederseer, D.; Oxborough, D.; et al. Unlocking the potential of artificial intelligence in sports cardiology: Does it have a role in evaluating athlete’s heart? Eur. J. Prev. Cardiol. 2024, 31, 470–482. [Google Scholar] [CrossRef]
  24. Ravishankar, J.; Dathathri, S.; Elango, V.; et al. Distributed memory code generation for mixed irregular/regular computations. In Proceedings of the 20th ACM SIGPLAN PPoPP; ACM: New York, NY, USA, 2015; pp. 65–75. [Google Scholar] [CrossRef]
  25. Reiss, A.; Stricker, D. Introducing a new benchmarked dataset for activity monitoring. In Proceedings of the 16th ISWC; IEEE: Piscataway, NJ, USA, 2012; pp. 108–109. [Google Scholar] [CrossRef]
  26. Richman, J.S.; Moorman, J.R. Physiological time-series analysis using approximate entropy and sample entropy. Am. J. Physiol. Heart Circ. Physiol. 2000, 278, H2039–H2049. [Google Scholar] [CrossRef]
  27. Schölkopf, B.; Platt, J.C.; Shawe-Taylor, J.; Smola, A.J.; Williamson, R.C. Estimating the support of a high-dimensional distribution. Neural Comput. 2001, 13, 1443–1471. [Google Scholar] [CrossRef]
  28. Eckart, P.; Hänsel, F.; Marahrens, N. Artificial intelligence in sports biomechanics: A scoping review on wearable technology, motion analysis, and injury prevention. Bioengineering 2025, 12, 887. [Google Scholar] [CrossRef] [PubMed]
  29. Shukla, J.; Dhiman, G.; Sharma, B. Wearable IMU biosensor systems for real-time biomechanical monitoring in high-performance sports. IEEE Sens. J. 2026, 26, 8932–8945. [Google Scholar]
  30. Smaranda, A.M.; Drăgoiu, T.S.; Caramoci, A.; Afetelor, A.A.; Ionescu, A.M.; Bădărău, I.A. Artificial intelligence in sports medicine: Reshaping electrocardiogram analysis for athlete safety–A narrative review. Sports 2024, 12, 144. [Google Scholar] [CrossRef] [PubMed]
  31. Souaïfi, D.; Dhahbi, W.; Jebabli, N.; et al. Artificial intelligence approaches applied to sports biomechanics. Front. Sports Act. Living 2025, 7, 1516423. [Google Scholar]
  32. Verdel, N.; Nograšek, N.; Drobnǐč, M.; Papuga, I.; Strojnik, V.; Supej, M. Influence of running speed, inclination, and fatigue on calcaneus angle in female runners. Front. Physiol. 2025, 16, 1505263. [Google Scholar] [CrossRef]
  33. Jensen, R.L.; Grønkjær, M.; Holmberg, H.C. Wearable biosensing and machine learning for data-driven training and coaching support. Biosensors 2026, 16, 97. [Google Scholar] [CrossRef]
  34. Wilson, R.P.; White, C.R.; Quintana, F.; et al. Moving towards acceleration for estimates of activity-specific metabolic rate in free-living animals. J. Anim. Ecol. 2006, 75, 1081–1090. [Google Scholar] [CrossRef]
  35. Artemev, A.; An, J.; Roeder, G.; et al. XLA: Compiling machine learning for peak performance. arXiv 2022, arXiv:2208.08010. [Google Scholar]
  36. Moroke, N.D. Deep reinforcement learning for cryptocurrency portfolio management with Riemannian transaction costs and free-energy Bellman optimisation. Risks 2026, 14, 103. [Google Scholar] [CrossRef]
  37. Moroke, N.D. Metabolic saliency and topological entropy in infrastructure-constrained financial markets. Entropy 2026, 28, 559. [Google Scholar] [CrossRef]
  38. Moroke, N.D. Statistical Hybrid Riemannian-Ensemble Dimensional Integration (SHREDI) reveals metabolic arrest in financial manifolds. SSRN Work. Pap. 2026, No. 6418314. Available online: https://ssrn.com/abstract=6418314.
  39. Xaba, L.D.; Moroke, N.D.; Metsileng, L.D. Performance of MS-GARCH models: Bayesian MCMC-based estimation. In Handbook of Research on Emerging Theories, Models, and Applications of Financial Econometrics; Adıgüzel Mercangöz, B., Ed.; Springer: Cham, Switzerland, 2021; pp. 323–356. [Google Scholar] [CrossRef]
  40. Moroke, K.M.; Moroke, N.D. SAFARI Framework: Simulated IMU Fatigue Dataset and Pipeline Code for Real-Time Neuromuscular and Metabolic Fatigue Classification (v.01). Zenodo 2026. [Google Scholar] [CrossRef]
Figure 1. Safari (left) maintains a tight band well below the 50 ms budget (dashed). Static compilation (centre) degrades away from W = 125 . JIT compilation (right) repeatedly exceeds the budget at shape changes.
Preprints 216096 g001
Figure 2. (a) Interpolation error vs. Δ W ; (b) Error vs. M with M = 16 marked. Error grows approximately as ( Δ W ) 2 , consistent with Theorem 3.6.
Preprints 216096 g002
Figure 3. ROC curves: entropy (solid) vs. moments (dashed). The entropy triplet’s advantage is most pronounced at high specificity, the operating region relevant to low-false-alarm-rate athlete monitoring.
Preprints 216096 g003
Figure 4. (a) Detection threshold tightens as the session progresses, connecting real-time classification to training adaptation theory. (b) Fitness and fatigue impulse-response components; threshold tightens when fatigue surplus k h h ( n ) > k g g ( n ) , consistent with Proposition 3.8.
Preprints 216096 g004
Figure 5. (a) Free-energy score distributions per fatigue state; medians rise monotonically Fresh→Critical. (b) State proportions per test subject showing consistent athlete-personalised classification.
Preprints 216096 g005
Figure 6. Colour-coded confusion matrix for four-state neuromuscular and metabolic fatigue classification across test subjects 8–9 ( n = 2360 windows). Diagonal cells (correct classifications) appear brightest. Adjacent-state errors dominate non-adjacent errors by a factor of 3.6 × , confirming the clinically conservative error structure of the Safari framework.
Preprints 216096 g006
Figure 7. Sequential visualisation of the Safari detection pipeline over a 6-second representative window. Panel 1: raw IMU accelerometer proxy ( acc z ), coloured by normal (green) and fatigued (red) phases. Panel 2: free-energy risk score with detection threshold (dashed), expert-annotated fatigue onset (vertical dashed line), true positive region (shaded green), false positive events (red bars), and false negative events (orange bars). Panel 3: four-state fatigue classification colour bar. Expert annotation at t = 3.2 s; model detection lags by approximately 0.3 s, consistent with the 100-sample window processing latency.
Preprints 216096 g007
Table 1. Descriptive statistics for acc_z by activity and fatigue state (full prepared dataset, n = raw sample count).
Activity State n Mean SD Median Skewness Sig
Running Normal 213,000 +0.033 7.941 +0.023 −0.005 *
Running Fatigued 57,000 −0.091 8.463 −0.018 +0.038 ns
Jumping Normal 213,000 +2.835 15.316 −9.407 +0.422 ns
Jumping Fatigued 57,000 +2.740 15.318 −9.441 +0.447 *
Sig: Mann-Whitney U test vs. complementary state within activity. * p < 0.05 ; ns p 0.05 . Raw signal differences are modest, confirming entropy features are needed for reliable fatigue discrimination.
Table 2. Latency and throughput on Raspberry Pi 4 (ARM Cortex-A72). Budget: 50 ms.
Method Avg Latency (ms) Worst-Case (ms) Jitter (ms) Throughput (inf./s)
Static compilation 19.1 27.4 25.1 52
JIT compilation (TVM) 38.6 58.1 56.0 26
Safari(proposed) 4.4 7.2 3.6 226
Jitter = T worst T best . Safari worst-case latency is 85.6% below the 50 ms budget.
Table 3. Entropy feature interpolation error vs. anchor spacing Δ W .
Δ W M Mean Error (%) Max Error (%) P 95 (%) Memory (KB)
5 31 1.845 7.489 4.607 1860
10 16 3.673 18.087 9.210 960
15 11 5.574 20.953 11.436 660
20 8 6.560 20.604 13.762 480
Bold: selected configuration ( M = 16 , Δ W = 10 ). Despite higher entropy interpolation error relative to moment features (which are smoother polynomial functions of W), the OC-SVM [27] classifier is robust to perturbations of this scale, as confirmed by the near-identical AUC-ROC under exact versus interpolated features.
Table 4. Fatigue detection performance on prepared v3 dataset (test subjects 8–9).
Method AUC-ROC F1 Precision Recall
Moments (mean, var, skew, kurt) 0.9796 0.8875
Entropy ( SampEn , PermEn , SpEn ) 0.9820 [0.974–0.988] 0.8835 0.8427 0.9284
Test windows 2,360
Test anomaly rate 22.5%
Test subjects 8 and 9 (held-out)
OC-SVM trained on subject-specific normal-phase windows only. Adaptive threshold: τ g = 80 , τ h = 20 , k g = 1.0 , k h = 1.8 .
Table 5. Feature discriminability and entropy triplet ablation (test set).
Feature Subset Dim. Discriminability AUC-ROC
Moments (mean, var, skew, kurt) 24 0.3398 0.9796
SampEn only 6 0.8970
PermEn only 6 0.8665
SpEn only 6 0.6960
SampEn + PermEn 12 0.9824
SampEn + SpEn 12 0.9098
PermEn + SpEn 12 0.8799
Full triplet ( SampEn + PermEn + SpEn ) 18 0.5283 0.9820
Entropy discriminability advantage ×1.55
Discriminability = | x ¯ normal x ¯ fatigue | / σ pooled , averaged across features. SpEn is the metabolic pathway descriptor; SampEn + PermEn are neuromuscular descriptors. Each contributes unique discriminative information: SampEn + PermEn (AUC 0.982) confirms the neuromuscular pair; adding SpEn completes the dual-pathway triplet.
Table 6. Per-activity detection performance (entropy features, test set).
Activity AUC-ROC F1 Precision Recall Windows Sig (MW)
Running 0.9978 0.9206 0.8657 0.9831 1,180 ***
Jumping 0.9608 0.8337 0.8088 0.8602 1,180 ***
*** Mann-Whitney U, p < 0.001 . Running achieves near-perfect detection; jumping is slightly lower, reflecting the higher amplitude variability in flight/landing phases that partially masks the entropy complexity signal.
Table 7. Sensitivity analysis: AUC-ROC and F1 across anomaly prevalence rates.
Anomaly Rate AUC-ROC F1 Precision Recall
5% 0.9820 0.8835 0.8427 0.9284
10% 0.9820 0.8835 0.8427 0.9284
15% 0.9820 0.8835 0.8427 0.9284
20% 0.9820 0.8835 0.8427 0.9284
25% 0.9822 0.8931 0.8604 0.9284
AUC-ROC is invariant to class imbalance, confirming robust discriminative performance across realistic field-deployment anomaly prevalences.
Table 8. Banister fitness-fatigue adaptive threshold parameters and session profile (v3 data).
Parameter Value Source
Fitness time constant τ g 80 windows Banister et al. [1]
Fatigue time constant τ h 20 windows Banister et al. [1]
Fitness gain k g 1.0 Morton et al. [19]
Fatigue gain k h 1.8 Morton et al. [19]
Sensitivity α 0.05 Empirically calibrated
Base threshold τ 0 4.0644 s ¯ normal + 1.645 σ ^
Session-end threshold 4.0050 After 150 windows
Total tightening 0.059 Progressive sensitisation
AUC-ROC (adaptive) 0.9820 Consistent with fixed threshold
F1 (adaptive) 0.8780
Table 9. Aggregate confusion matrix: four-state fatigue classification across both test subjects and both activities (subjects 8–9, n = 2360 windows). Rows = true state; columns = predicted state. True states assigned by trial fatigue label and within-session time fraction; predicted states from binary OC-SVM detection combined with free-energy score severity ranking. Overall accuracy: 83.3%; running: 81.3%; jumping: 85.3%.
True ∖ Predicted Fresh Accumulating Fatigued Critical
Fresh 778 0 48 0
Accumulating 0 959 44 0
Fatigued 24 0 133 197
Critical 0 14 67 96
Adjacent-state errors (13.1%) dominate non-adjacent errors (3.6%), confirming that misclassifications are conservative rather than catastrophic. The Fatigued and Critical states show higher confusion with each other than with normal states, consistent with the continuum nature of fatigue progression. True states were assigned from trial-level binary labels and within-session time position; predicted states from OC-SVM binary detection and free-energy severity ranking. Real-athlete physiological ground truth (RPE, blood lactate, EMG) would enable more precise state assignment and is planned as future validation.
Disclaimer/Publisher’s Note: The statements, opinions and data contained in all publications are solely those of the individual author(s) and contributor(s) and not of MDPI and/or the editor(s). MDPI and/or the editor(s) disclaim responsibility for any injury to people or property resulting from any ideas, methods, instructions or products referred to in the content.
Copyright: This open access article is published under a Creative Commons CC BY 4.0 license, which permit the free download, distribution, and reuse, provided that the author and preprint are cited in any reuse.
Prerpints.org logo

Preprints.org is a free preprint server supported by MDPI in Basel, Switzerland.

Subscribe

Disclaimer

Terms of Use

Privacy Policy

Privacy Settings

© 2026 MDPI (Basel, Switzerland) unless otherwise stated