

Submitted:
01 June 2026
Posted:
02 June 2026
You are already at the latest version
Abstract
This two-year study proposes the application of industrial computed tomography (CT) as a complementary technique to conventional capacity and internal resistance measurements for evaluating not only the state of health (SOH) of different lithium-ion battery types used in electric vehicles, but also to predict its past. While commonly used assessment methods primarily focus on electrical properties of batteries, industrial CT allows non-destructive, three-dimensional visualization and systematic evaluation of internal structural changes within individual battery cells and allows to compare different lithium battery type internal structure changes. The study investigates two lithium-ion battery chemistries: lithium iron phosphate (LFP) and nickel manganese cobalt oxide (NMC). The effects of different discharge rates (1C, 2C, and 3C) on battery degradation were analyzed by comparing CT scan data obtained for the cells in their initial (new) condition and after reaching 60% SOH following cycling-induced aging. The findings provide improved understanding of the physical processes associated with battery aging under varying discharge conditions, enabling a more complete evaluation of battery health.
Keywords:
lithium battery internal structure analysis
; electric vehicle
; industrial computed tomography
1. Introduction
Although lithium-ion battery technologies share similar structural and operating principles, they exhibit substantial differences in key performance parameters, including cycle life, permitted charge and discharge rates (C-rate), and thermal stability, particularly with respect to the onset temperature of thermal runaway [1,2,3]. The most widely studied lithium-ion chemistries include lithium cobalt oxide (LCO), lithium manganese oxide (LMO), NMC, LFP, lithium nickel cobalt aluminum oxide (NCA), and lithium titanate (LTO) [4]. Among these, LFP, LMO, NMC, and NCA are predominantly employed in electric vehicles due to their favorable balance between power capability and energy density, as well as their relatively low self-discharge rates compared with alternative energy storage technologies [5].
A comprehensive understanding of lithium-ion battery aging mechanisms enables the identification of optimal operating conditions that can significantly extend battery lifetime. In electric vehicles, battery operating conditions can be controlled through limitations on vehicle performance and charging rates to mitigate degradation and prolong service life [6]. Furthermore, a detailed comparison of the SOH evolution among different lithium-based battery chemistries supports the selection of appropriate battery technologies for specific electric vehicle applications [7].
A useful method for advancing the understanding of lithium-ion battery degradation and safety involves de-tailed analysis of internal structural characteristics, such as anode overhang, electrode layer delamination, and other degradation-related structural changes [8]. Establishing a reliable baseline using destructive analysis requires disassembly and inspection of one group of cells prior to the use and a separate group after the use [9]. However, this procedure is complex and potentially hazardous, as it must be performed in an inert gas environment. Because cell disassembly is inherently destructive, the same lithium-ion battery cannot be practically examined both before and after operation using conventional methods [10].
Industrial CT provides a non-destructive alternative based on X-ray imaging, enabling three-dimensional visualization and inspection of internal battery structure [11,12]. The method is based on acquiring a large number of X-ray projections at different rotation angles and reconstructing them computationally into a three-dimensional volumetric dataset composed of voxels that represent local X-ray absorption [13]. By optimizing X-ray energy, exposure parameters, and geometric magnification, CT can achieve high spatial resolution and material contrast, allowing identification of internal features such as electrode layers, current collectors, separator regions, voids, layer misalignment, and delamination [14].
Because CT examination does not require cell disassembly, the same battery cell can be scanned repeatedly at different stages of its service life. This allows direct comparison of volumetric scan data obtained before and after aging [15]. Structural changes related to degradation can therefore be evaluated within the same cell. Repeated measurements reduce uncertainty caused by cell-to-cell variability and improve the reliability of the structural degradation analysis [16,17]. In this work, CT-based evaluation and comparison of internal structural changes before and after aging are performed for LFP and NMC batteries at three different battery discharge rates.
The objective of this study is to systematically investigate and compare the internal structural degradation of LFP and NMC batteries subjected to different discharge rates using non-destructive CT. By conducting repeated CT scans of the same cells before and after aging, this work aims to quantify and correlate structural changes with electrochemical stress conditions, thereby improving the understanding of degradation mechanisms under varying operational regimes. The scientific novelty of this research lies in the application of longitudinal, cell-specific CT analysis to directly track structural evolution within identical battery samples, eliminating uncertainties associated with cell-to-cell variability. Furthermore, the study provides a comparative assessment of how different chemistries respond structurally to increased discharge rates, offering new insights into the relationship between operational conditions, material behavior, and long-term battery reliability.
2. Materials and Methods
Commercially available 18650 NMC cells (2600 mAh, 11C), 18650 LFP high temperature cells (1800 mAh, 3C) were studied in this work (Table 1).
The two types of batteries were selected because they used common electrode formulations in electric vehicles, were manufactured by reputable companies, and were the exact same size.
In this study, individual lithium battery cells were tested instead of complete battery packs, in order to minimize energy consumption and reduce experimental costs associated with the higher price of full battery packs. Lithium battery cycle aging was performed using EBC-A40L battery testing system with EB tester software. Each charge and discharge cycle for each battery cell has been measured and recorded to a personal computer via a lithium battery tester with voltage accuracy of 0.2% ± 0.003 V and current accuracy of 0.2 % ± 0.01 A.
A spot-welding system (Glitter 801D) was used to form reliable electrical connections between nickel-plated strips and the terminals of 18650 lithium-ion cells, ensuring proper joint formation while limiting thermal exposure and preventing heat-induced damage to the battery cells. Each nickel-plated strip was soldered to a 2.5 mm² cross-section copper conductor (30 cm length), which was subsequently connected to the battery testing equipment via a 5.26 mm² cross-section conductor of 1 m length. The total resistance of the connecting conductors and the associated power losses were negligible relative to the measured battery capacities and remained constant across all test conditions. During cycling, the cells were placed in fireproof chamber with high airflow.
Battery cells were scanned using an industrial CT system (Nikon XT H 225) equipped with a 225 kV microfocus reflection target X-ray source, supporting up to 150 times geometric magnification and a 2520-pixel flat-panel detector. By adjusting the geometric magnification between 7 and 9, a CT voxel resolution in the range of 9 µm to 16 µm was achieved. During 30 minutes scanning process, Nikon XT H 225 industrial CT system takes 1800 very high-definition images (2520p x 2520p) while battery makes one revolution. Images acquired with the industrial CT scanner are reconstructed using Inspect-X (Nikon) reconstruction software to produce a three-dimensional volumetric dataset composed of several billion voxels. This voxel-based model represents the internal X-ray attenuation distribution within the scanned battery cell. The reconstructed volume is then analysed using VGStudio MAX software, which enables three-dimensional visualization and virtual cross-sectional view of the internal battery structure.
Newly purchased battery cells were screened for manufacturing defects by measuring their rated capacity and internal resistance to verify cell quality and suitability for experimental testing and publication.
Each LFP and NMC battery cell used in this research was scanned with industrial CT before and after aging degradation. To increase spatial resolution and achieve higher image definition, the negative and positive terminals of each battery cell were scanned separately rather than scanning the entire cell in a single acquisition. This approach enabled the use of higher geometric magnification and region-specific scan parameters for each area of interest, resulting in improved detail and contrast in the reconstructed volumetric data. For each battery cell, two scans were performed before aging and two additional scans were conducted after degradation, with separate acquisitions for both terminals.
During typical electric vehicle operation, the highest continuous battery discharge rates generally occur under high-load conditions, such as rapid acceleration or sustained high-speed driving. Under these operating scenarios, the effective discharge rate can reach approximately 1C to 3C, depending on the total battery pack capacity and the instantaneous power demand of the vehicle drivetrain. The resulting C-rate is determined by the ratio between the power drawn from the high-voltage lithium-ion battery and its nominal energy capacity. These high-discharge conditions represent a worst-case scenario for battery degradation behavior.
Independent battery cells were tested under constant current (CC) conditions at discharge rates of 1C, 2C, and 3C, with each discharge rate applied to a separate cell to evaluate internal battery degradation under different discharge conditions Table 2. A depth of discharge (DOD) of 100% was applied for all battery types, test conditions, and discharge rates. Upon completion of each discharge cycle, the cells were recharged using a CC protocol at a charge rate of 1C, followed by a constant voltage (CV) charging stage until the charging current decreased to 0.25 A. The effect of lower DOD levels will be addressed in a separate publication.
In this study, repeated charge–discharge cycling was performed until the SOH of each battery decreased to 60% of its initial nominal capacity. This SOH threshold was selected to represent an advanced stage of degradation, at which structural changes within the cell are expected to be more pronounced and easier to detect. As many experimental studies limits testing to approximately 80% of SOH, the 60% threshold applied in this work enables evaluation of degradation behavior under more advanced aging conditions.
After reaching this predefined degradation level, the batteries were examined again using industrial CT. The CT scan data obtained after aging were then processed and analysed, and the results were compared with the scan data collected before aging to identify structural changes related to battery degradation.
In addition, multiple performance metrics were monitored throughout testing to quantify the level of battery degradation, including equivalent full cycle count (EFC), charged and discharged energy, capacity, and round-trip efficiency (RTE). A more detailed analysis of these parameters will be presented in a subsequent publication.
3. Results and Discussion
All tested battery cells reached the defined end-of-life threshold of 60% SOH, although the number of cycles required to reach this condition differed between the tested specimens. Among the LFP cells, specimen No. 3, which was cycled at a discharge rate of 3C, reached the end-of-life criterion after 588 cycles, corresponding to approximately 436 EFC (Table 3). The relatively reduced cycle life observed for the LFP cell at 3C is likely associated with the fact that this current corresponds to the manufacturer-specified maximum continuous discharge rate. Operation near this limit increases internal polarization and accelerates electrochemical degradation processes. Furthermore, the tested 18650 LFP cells are primarily designed for operation at elevated temperatures, which may reduce cycle stability under the experimental conditions applied in this study [18]. Experimental results obtained using high-performance LFP cells will be presented in a subsequent publication.
In contrast, the NMC cells demonstrated comparatively stable electrochemical performance across all investigated discharge rates. Under identical cycling conditions, and assuming that similar operating conditions could be maintained in an electric vehicle application, the projected cumulative driving distance until reaching 60% SOH would be approximately 664,400 km in the worst-case scenario corresponding to a 3C discharge rate, assuming an average driving range of 400 km per full charge cycle. Under more moderate operating conditions corresponding to a 1C discharge rate, the projected cumulative driving distance until reaching the same degradation threshold would increase to approximately 1,444,800 km. It should be noted, however, that such projections represent an idealized scenario. In real electric vehicle operation, cycling conditions vary considerably and calendar aging mechanisms, which contribute significantly to long-term lithium-ion battery degradation, are not included in this analysis.
Sectional views in the XZ and YZ planes of each tested battery cell were analysed Figure 1. These sections correspond to an 18650 cell bisected along two orthogonal vertical planes. In addition, a third vertical section was selected at the location exhibiting the most pronounced internal layer delamination for each cell.
Horizontal cross-sectional views in the YX plane were analysed at the anode overhang level and at a height of 12 mm from the top of the cell Figure 2. These sections correspond to the 18650 cell bisected along horizontal planes. Following aging-induced degradation, an additional YX cross-section was analysed at a height of 20 mm from the top of the cell to evaluate the progression of internal structural changes toward the central region of the cell.
3.1. Internal LFP Battery Positive Terminal Analysis
Prior to the aging procedure, all examined LFP battery cells exhibited a typical anode overhang on the positive terminal side ranging from 60 µm to 135 µm (Table 4). No negative overhang was observed in the analyzed specimens. Controlled electrode overhang is a standard design feature in cylindrical lithium-ion batteries, where it serves to compensate for minor electrode misalignment during the jelly-roll winding process and helps reduce the risk of internal short circuits caused by electrode edge overlap [19]. Recent studies have highlighted that precise electrode positioning and dimensional tolerances play an important role in maintaining the mechanical integrity of cylindrical lithium-ion cells during long-term cycling [20,21].
After the aging procedure, the measured anode overhang values ranged from 50 µm to 140 µm. Although these measurements indicate that the global electrode geometry remained largely unchanged, localized deformation of the anode overhang region was observed in several specimens. Such deformation is commonly attributed to electro-chemo-mechanical coupling processes occurring during cycling. Repeated lithiation and delithation cause periodic expansion and contraction of electrode materials, generating internal stresses within the spirally wound electrode assembly. Over extended cycling periods, these stresses can lead to electrode distortion, separator displacement, and structural degradation within the jelly-roll structure [21].
For specimen No. 1, the maximum and minimum anode overhang values decreased slightly by approximately 10 µm, indicating only minor dimensional variation after cycling (Figure 3). No pronounced deformation of the electrode edge was detected in the overhang region.
Despite the stable geometry of the electrode edge, substantial structural degradation was observed within the interior of the cell. Layer delamination and deformation of the electrode stack increased progressively toward the central region of the battery. At a height of approximately 12 mm from the positive terminal, up to seven layers of delamination were identified (Figure 4).
Such multilayer separation is commonly associated with mechanical fatigue of the electrode coatings and gradual weakening of the binder network that maintains adhesion between the active material layer and the current collector. Similar degradation mechanisms have been reported in recent post-mortem investigations of aged lithium-ion cells subjected to prolonged cycling [22].
For Specimen No. 2, the maximum and minimum anode overhang values decreased by approximately 10–15 µm following the aging procedure. Although the dimensional change was relatively small, noticeable deformation of the anode overhang region was observed (Figure 5). Such deformation is typically associated with radial mechanical pressure generated by electrode swelling during long-term cycling.
The internal structure of this cell showed even more pronounced degradation than that observed in specimen No. 1. At a height of 12 mm from the positive terminal, up to eleven layers of electrode delamination were identified (Figure 6). In addition, two separate regions of delamination were detected within the electrode winding closer to the center of the cell. The occurrence of delamination in multiple locations indicates the presence of non-uniform stress distribution within the electrode stack [23]. Mechanical analyses of cylindrical lithium-ion batteries have demonstrated that radial stresses generated during cycling can vary significantly across the jelly-roll structure due to differences in mechanical constraint between inner and outer electrode layers [21].
For specimen No. 3, the measured anode overhang increased slightly by approximately 5–15 µm. Unlike specimen No. 1, noticeable deformation of the electrode edge was detected, particularly near the cell casing (Figure 7).
At the level of the anode overhang, no significant layer delamination was observed. However, cross-sectional analysis performed 12 mm below the positive terminal revealed the onset of electrode layer separation and structural deformation (Figure 8). These observations indicate that the degradation process had begun within the electrode assembly but had not progressed to the same extent as in specimens No. 1 and No. 2.
Overall, the results suggest that higher discharge rates primarily influence deformation of the electrode edge, whereas severe layer delamination occurs mainly in cells subjected to lower discharge rates (1C and 2C). These cells experienced a greater total number of charge–discharge cycles, indicating that cumulative cycling stress plays a dominant role in the development of electrode delamination.
3.2. Internal NMC Battery Positive Terminal Analysis
Prior to the aging procedure, the investigated NMC battery cells exhibited anode overhang values ranging from 50 µm to 100 µm on the positive terminal side (Table 5). Similar to the LFP cells, no negative overhang was detected.
After cycling, the anode overhang values ranged between 50 µm and 100 µm. Although the overall dimensional variation was small, noticeable deformation of the electrode edge was detected in several cells. Such de-formation is generally linked to mechanical stresses generated during repeated electrochemical cycling [21].
In specimen No. 4, the measured anode overhang values increased slightly by approximately 5–10 µm. However, clear deformation of the electrode edge was observed near the cell casing (Figure 9).
Structural analysis revealed progressive electrode delamination within the cell interior. At a height of 12 mm, two layers of delamination were detected (Figure 10). Further toward the central region of the cell, the degree of delamination increased.
At a height of 20 mm, up to five layers of delamination were observed, accompanied by significant swelling of the electrode assembly (Figure 11). The mandrel itself did not undergo structural deformation. Instead, the electrode winding exerted compressive pressure on the mandrel due to radial expansion of the jelly-roll structure. The mandrel in cylindrical lithium-ion batteries is typically manufactured from rigid metallic materials and serves as a structural support for the electrode winding [24]. This structural element also contributes to maintaining an open central channel within the cell, which can facilitate pressure relief and gas transport during abnormal conditions such as thermal runaway [25]. During cycling, radial stresses generated by electrode expansion can lead to contact pressure between the electrode layers and the mandrel without causing permanent deformation of the mandrel itself. Recent mechanical studies of cylindrical cells have demonstrated that radial stress within the jelly-roll assembly can increase substantially during cycling and may result in compression forces acting on the central mandrel [21].
For Specimen No. 5, the maximum and minimum anode overhang values increased by approximately 5 µm, again indicating negligible overall dimensional changes (Figure 12). However, despite the relatively stable overhang dimensions, noticeable deformation of the electrode edges was observed, particularly near the cell walls.
At a height of approximately 12 mm from the top of the cell, two layers of electrode delamination were detected within the electrode stack (Figure 13).
At 20 mm, the degree of delamination increased to four layers, indicating progressive structural degradation within the jelly-roll assembly (Figure 14). As observed in specimen No. 4, the electrode layers exerted compressive pressure toward the center of the cell. This radial compression resulted in contact between the electrode stack and the mandrel but did not lead to mechanical failure of the mandrel structure.
For Specimen No. 6, the maximum and minimum anode overhang values decreased slightly, by approximately 5 µm, indicating that the global geometry of the electrode overhang remained largely unchanged. How-ever, significant deformation of the anode overhang region was again observed, particularly near the cell casing (Figure 15).
In this specimen, three layers of electrode delamination were observed at a height of 12 mm (Figure 16). Additionally, the mandrel was found to be touching from several directions, indicating substantial internal mechanical stress within the cell structure.
Overall, the results indicate that NMC battery cells develop noticeable deformation of the anode overhang region under all investigated discharge rates. Despite the relatively small changes in the absolute overhang dimensions, significant internal structural degradation occurred within the electrode stack, including electrode layer delamination, swelling, and touching the mandrel.
Recent mechanical investigations of cylindrical lithium-ion batteries have demonstrated that the jelly-roll structure experiences complex stress distributions during cycling. Expansion of the electrode layers generates radial compression toward the mandrel while the outer casing constrains the electrode assembly. This interaction between the casing, electrode winding, and mandrel plays an important role in the mechanical stability of cylindrical cells [21].
Furthermore, consistent with observations made for LFP batteries in this study, the most pronounced layer delamination occurred in cells subjected to lower discharge rates but experiencing a higher number of total charge-discharge cycles. Lower discharge rates typically allow for deeper lithiation and longer cycling durations, which increases the cumulative mechanical stress imposed on the electrode materials. Over extended cycling periods, this stress can lead to progressive loss of structural integrity within the electrode assembly, ultimately contributing to capacity fade and performance degradation [26].
3.3. Internal LFP and NMC Battery Positive Terminal Degradation Comparison
Degradation behavior between LFP and NMC lithium-ion batteries revealed several important differences in their aging mechanisms and structural stability. Both chemistries exhibited deformations in anode overhang geometry after cycling and significant internal delamination was identified. Even though LFP cells demonstrated more severe structural damage, with up to 11 delaminated layers, compared to a maximum of 5 layers in NMC cells, LFP cells show lower anode overhang region deformation (Table 6).
In both chemistries, layer delamination can be observed to be most pronounced towards the center of battery cell. Jelly-roll swelling is similar in both chemistries, except in a LFP battery which was discharged at 3C rate.
In addition, the LFP cell operated at a 3C discharge rate reached the end-of-life criterion in the least number of charge-discharge cycles, indicating higher sensitivity to aggressive discharge conditions. By contrast, NMC cells showed comparatively lower levels of internal mechanical degradation, suggesting better structural stability under the tested operating conditions.
4. Conclusions
This study investigated the aging behavior and internal structural degradation of cylindrical lithium-ion batteries with LFP and NMC chemistries subjected to different discharge rates. Post-mortem analysis was conducted to evaluate changes in anode overhang geometry and internal electrode structure after the cells reached the defined end-of-life criterion of 60% SOH. Based on the obtained experimental results, the following conclusions can be drawn:
Cycle life and discharge rate influence. All tested cells reached the defined end-of-life condition, although the number of cycles required varied depending on the applied discharge rate and cell chemistry. The LFP cell operated at a 3C discharge rate exhibited the lowest cycle life, reaching 60% SOH after 588 cycles (436 EFC). This behavior is likely associated with operation close to the manufacturer’s maximum continuous discharge limit, which increases internal polarization and accelerates electrochemical degradation processes.
Anode overhang stability. Measurements performed before and after the aging process showed that the absolute anode overhang dimensions in both LFP and NMC cells changed only slightly. The measured variations were typically within 5–15 µm, indicating that the global electrode geometry remained largely stable during cycling. Nevertheless, localized deformation of the electrode edges was observed in several specimens, particularly near the cell casing.
Internal structural degradation. Despite relatively small geometric changes in the electrode overhang region, significant internal degradation of the electrode stack was observed in multiple specimens. The most pronounced degradation mechanism was layer delamination within the jelly-roll electrode structure, which increased toward the central region of the cells. In the most severe cases, up to 11 layers of delamination were identified in LFP cells and 5 layers in NMC cells.
Radial mechanical stress effects. The observed structural degradation is attributed primarily to the accumulation of electro-chemo-mechanical stresses during repeated lithiation and delithiation cycles. Expansion of electrode materials during cycling generates radial pressure within the wound electrode assembly, leading to internal compression toward the center of the cell. This radial pressure resulted in contact forces acting on the mandrel, however, the mandrel itself remained structurally intact and did not undergo mechanical deformation.
Effect of discharge rate on degradation mechanisms. Higher discharge rates contributed mainly to localized deformation of the electrode edges, whereas severe layer delamination occurred primarily in cells cycled at lower discharge rates (1C and 2C). These cells experienced a higher number of total charge-discharge cycles, suggesting that cumulative cycling stress plays a dominant role in the development of electrode layer separation and structural degradation.
Implications for cylindrical battery design. The results demonstrate that internal mechanical degradation can occur even when external geometric changes appear minimal. Therefore, maintaining structural stability of the jelly-roll electrode assembly is essential for ensuring long-term reliability of cylindrical lithium-ion batteries used in high-cycle applications such as electric vehicles.
Study result implications in electric vehicles. Although lower discharge rates (corresponding to lower vehicle acceleration) tend to promote severe electrode layer delamination, sustained operation at high discharge rates (high acceleration) is also undesirable, as it reduces the equivalent cycle life of LFP and NMC batteries and exacerbates deformation in the anode overhang region. Consequently, limiting the maximum available power output of electric vehicles may contribute to extending battery pack lifespan and should therefore be considered in the design and optimization of battery management systems.
Overall, the findings highlight the importance of electro-chemo-mechanical interactions in lithium-ion battery aging and demonstrate that post-mortem structural analysis provides valuable insight into degradation mechanisms that cannot be detected through electrochemical measurements alone.
Future work will focus on extending the analysis to high-performance LFP cells and additional operating conditions, as well as integrating non-destructive imaging techniques such as X-ray CT to better characterize internal structural evolution during battery aging.
Author Contributions
Conceptualization, J.M. and S.S.; methodology, J.M.; software, J.M.; validation, J.M., S.S.; formal analysis, J.M.; investigation, J.M.; resources, J.M.; data curation, J.M.; writing—original draft preparation, J.M.; writing—review and editing, J.M. and S.S.; visualization, J.M.; supervision, S.S.; project administration, J.M. and S.S.; funding acquisition, J.M and S.S. All authors have read and agreed to the published version of the manuscript.
Funding
This research received no external funding.
Data Availability Statement
The original contributions presented in this study are included in the article. Further inquiries can be directed to the corresponding author.
Acknowledgments
During the preparation of this manuscript, the authors used OpenAI models (GPT-4o) for translation and language proofreading. The authors have reviewed and edited all outputs and take full responsibility for the content of this publication.
Conflicts of Interest
The authors declare no conflicts of interest.
Abbreviations
The following abbreviations are used in this manuscript:
| CT | Computed tomography |
| SOH | State of health |
| LFP | Lithium iron phosphate |
| NMC | Nickel manganese |
| LMO | Lithium manganese oxide |
| NCA | Lithium nickel cobalt aluminum |
| LTO | Lithium titanate |
| CC | Constant current |
| CV | Constant voltage |
| DOD | Depth of discharge |
| EFC | Equivalent full cycle |
| RTE | Round-trip efficiency |
References
- Schöberl, J.; Ank, M.; Schreiber, M.; Wassiliadis, N.; Lienkamp, M. Thermal runaway propagation in automotive lithium-ion batteries with NMC-811 and LFP cathodes: Safety requirements and impact on system integration. eTransportation 2024, 19, 100305. [Google Scholar] [CrossRef]
- Zhong, G.; Gong, J.; Wang, C.; Xu, K.; Chen, H. Comparison of the Electrochemical Performance and Thermal Stability for Three Kinds of Charged Cathodes. Front. Energy Res. 2018, 6(110). [Google Scholar] [CrossRef]
- Chen, Z.; Zhang, J.; Liu, C.; Yang, C.; Chen, S. Thermal Runaway in Lithium-Ion Batteries: A Review of Mechanisms, Prediction Approaches, and Mitigation Strategies. Batteries 2026, 12(3), 88. [Google Scholar] [CrossRef]
- Gao, Z. W.; Lan, T.; Yin, H.; Liu, Y. Development and Commercial Application of Lithium-Ion Batteries in Electric Vehicles: A Review. Processes 2025, 13(3), 756. [Google Scholar] [CrossRef]
- Koech, A. K.; Mwandila, G.; Mulolani, F.; Mwaanga, P. Lithium-ion battery fundamentals and exploration of cathode materials: A review. South Afr. J. Chem. Eng. 2024, 50, 321–339. [Google Scholar] [CrossRef]
- Leijon, J. Charging strategies and battery ageing for electric vehicles: A review. Energy Strategy Rev. 2025, 57, 101641. [Google Scholar] [CrossRef]
- Sciatti, F.; Tamburrano, P.; Distaso, E.; Amirante, R.; Radogna, A. V.; Morciano, A.; Grassi, G. A comprehensive overview of lithium-ion batteries for electric vehicles: Materials, performance, safety, recycling, and emerging technologies. J. Energy Storage 2026, 144, 119694. [Google Scholar] [CrossRef]
- Schmitt, C.; Kopljar, D.; Friedrich, K. A. Detailed investigation of degradation modes and mechanisms of a cylindrical high-energy Li-ion cell cycled at different temperatures. J. Energy Storage 2025, 120, 116486. [Google Scholar] [CrossRef]
- Blažek, P.; Klvač, O.; Šedina, M.; Čech, O.; Tkadlecová, M.; Stravová, Z.; Kazda, T.; Zikmund, T.; Schmitt, R.; Kaiser, J. Comprehensive analysis of degradation mechanisms in 18650 Li-ion cells under prolonged cycling conditions. J. Energy Storage 2025, 130, 117436. [Google Scholar] [CrossRef]
- Waldmann, T.; Iturrondobeitia, A.; Kasper, M.; Ghanbari, N.; Aguesse, F.; Bekaert, E.; Daniel, L.; Geniès, S.; Jiménez-Gordon, I.; Löble, M. W.; De Vito, E.; Wohlfahrt-Mehrens, M. Review—Post-Mortem analysis of aged lithium-ion batteries: Disassembly methodology and physico-chemical analysis techniques. J. Electrochem. Soc. 2016, 163(10), A2149–A2164. [Google Scholar] [CrossRef]
- Le Houx, J.; Kramer, D. X-ray tomography for lithium-ion battery electrode characterisation—A review. Energy Rep. 2021, 7, 9–14. [Google Scholar] [CrossRef]
- Chen, H.; Kalamaras, E. Experimental Study of Sidewall Rupture of Cylindrical Lithium-Ion Batteries under Radial Nail Penetration. J. Electrochem. Soc. 2022, 169(2), 120528. [Google Scholar] [CrossRef]
- Vásárhelyi, L.; Kónya, Z.; Kukovecz, Á.; Vajtai, R. Microcomputed tomography–based characterization of advanced materials: A review. Mater. Today Adv. 2020, 8, 100084. [Google Scholar] [CrossRef]
- Villarraga-Gómez, H.; Begun, D. L.; Bhattad, P.; Mo, K.; Norouzi Rad, M.; White, R. T.; Kelly, S. T. Assessing rechargeable batteries with 3D X-ray microscopy, computed tomography, and nanotomography. Nondestruct. Test. Eval. 2022, 37(5), 519–535. [Google Scholar] [CrossRef]
- Li, P.; Liang, G.; Tang, Y.; Yang, H.; Dai, H.; Yang, J.; Liu, B.; Tuo, X.; Wang, Q. In-operando investigation of internal aging of lithium-ion batteries at room temperature based on 2D/3D X-ray computed tomography. Radiat. Phys. Chem. 2026, 242, 113629. [Google Scholar] [CrossRef]
- Sun, W.; Chen, X.; Kubiak, P.; López, C. M. A new approach for health monitoring of cylindrical lithium-ion cells using X-ray computed tomography. J. Energy Storage 2025, 111, 115375. [Google Scholar] [CrossRef]
- Gao, J.; Wang, S.; Hao, F. A review of non-destructive testing for lithium batteries. Energies 2024, 17(16), 4030. [Google Scholar] [CrossRef]
- Groot, J.; Swierczynski, M.; Stan, A. I.; Kaer, S. K. On the complex ageing characteristics of high-power LiFePO₄/graphite battery cells cycled with high charge and discharge currents. J. Power Sources 2015, 286, 475–487. [Google Scholar] [CrossRef]
- Roth, T.; Frank, A.; Oehler, F.; Graule, A.; Kücher, S.; Jossen, A. Lithium plating at the cell edge induced by anode overhang during cycling in lithium-ion batteries: Part I. Modeling and mechanism. J. Electrochem. Soc. 2024, 171(5), 050547. [Google Scholar] [CrossRef]
- Baazouzi, S.; Feistel, N.; Wanner, J.; Landwehr, I.; Fill, A.; Birke, K. P. Design, Properties, and Manufacturing of Cylindrical Li-Ion Battery Cells—A Generic Overview. Batteries 2023, 9(6), 309. [Google Scholar] [CrossRef]
- Chen, J.; Wang, G.; Song, H.; Wang, B.; Wu, G.; Lei, J. Stress and displacement of cylindrical lithium-ion power battery during charging and discharging. Energies 2022, 15(21), 8244. [Google Scholar] [CrossRef]
- Guo, J.; Jin, S.; Sui, X.; Huang, X.; Xu, Y.; Li, Y.; Kristensen, P. K.; Wang, D.; Pedersen, K.; Gurevich, L.; Stroe, D.-I. Unravelling and quantifying the aging processes of commercial Li(Ni₀.₅Co₀.₂Mn₀.₃)O₂/graphite lithium-ion batteries under constant current cycling. J. Mater. Chem. A 2023, 11(1), 41–52. [Google Scholar] [CrossRef]
- Gelam, S. D.; Maddipatla, S.; Chicone, C.; Pecht, M. Anisotropic expansion-induced stress analysis of cylindrical Li-ion batteries. J. Power Sources 2025, 656, 238104. [Google Scholar] [CrossRef]
- Maddipatla, S.; Kong, L.; Pecht, M. Safety analysis of lithium-ion cylindrical batteries using design and process failure mode and effect analysis. Batteries 2024, 10(3), 76. [Google Scholar] [CrossRef]
- Finegan, D. P.; Darcy, E.; Keyser, M.; Tjaden, B.; Heenan, T. M. M.; Jervis, R.; Bailey, J. J.; Malik, R.; Vo, N. T.; Magdysyuk, O. V.; Atwood, R.; Drakopoulos, M.; DiMichiel, M.; Rack, A.; Hinds, G.; Brett, D. J. L.; Shearing, P. R. Charcterising thermal runaway within lithium-ion cells by inducing and monitoring internal short circuits. Energy Environ. Sci. 2017, 10(6), 1377–1388. [Google Scholar] [CrossRef]
- Waldmann, T.; Wilka, M.; Kasper, M.; Fleischhammer, M.; Wohlfahrt-Mehrens, M. Temperature dependent ageing mechanisms in lithium-ion batteries – A post-mortem study. J. Power Sources 2014, 262, 129–135. [Google Scholar] [CrossRef]
Figure 1.
Example of XZ, YZ section views placement.
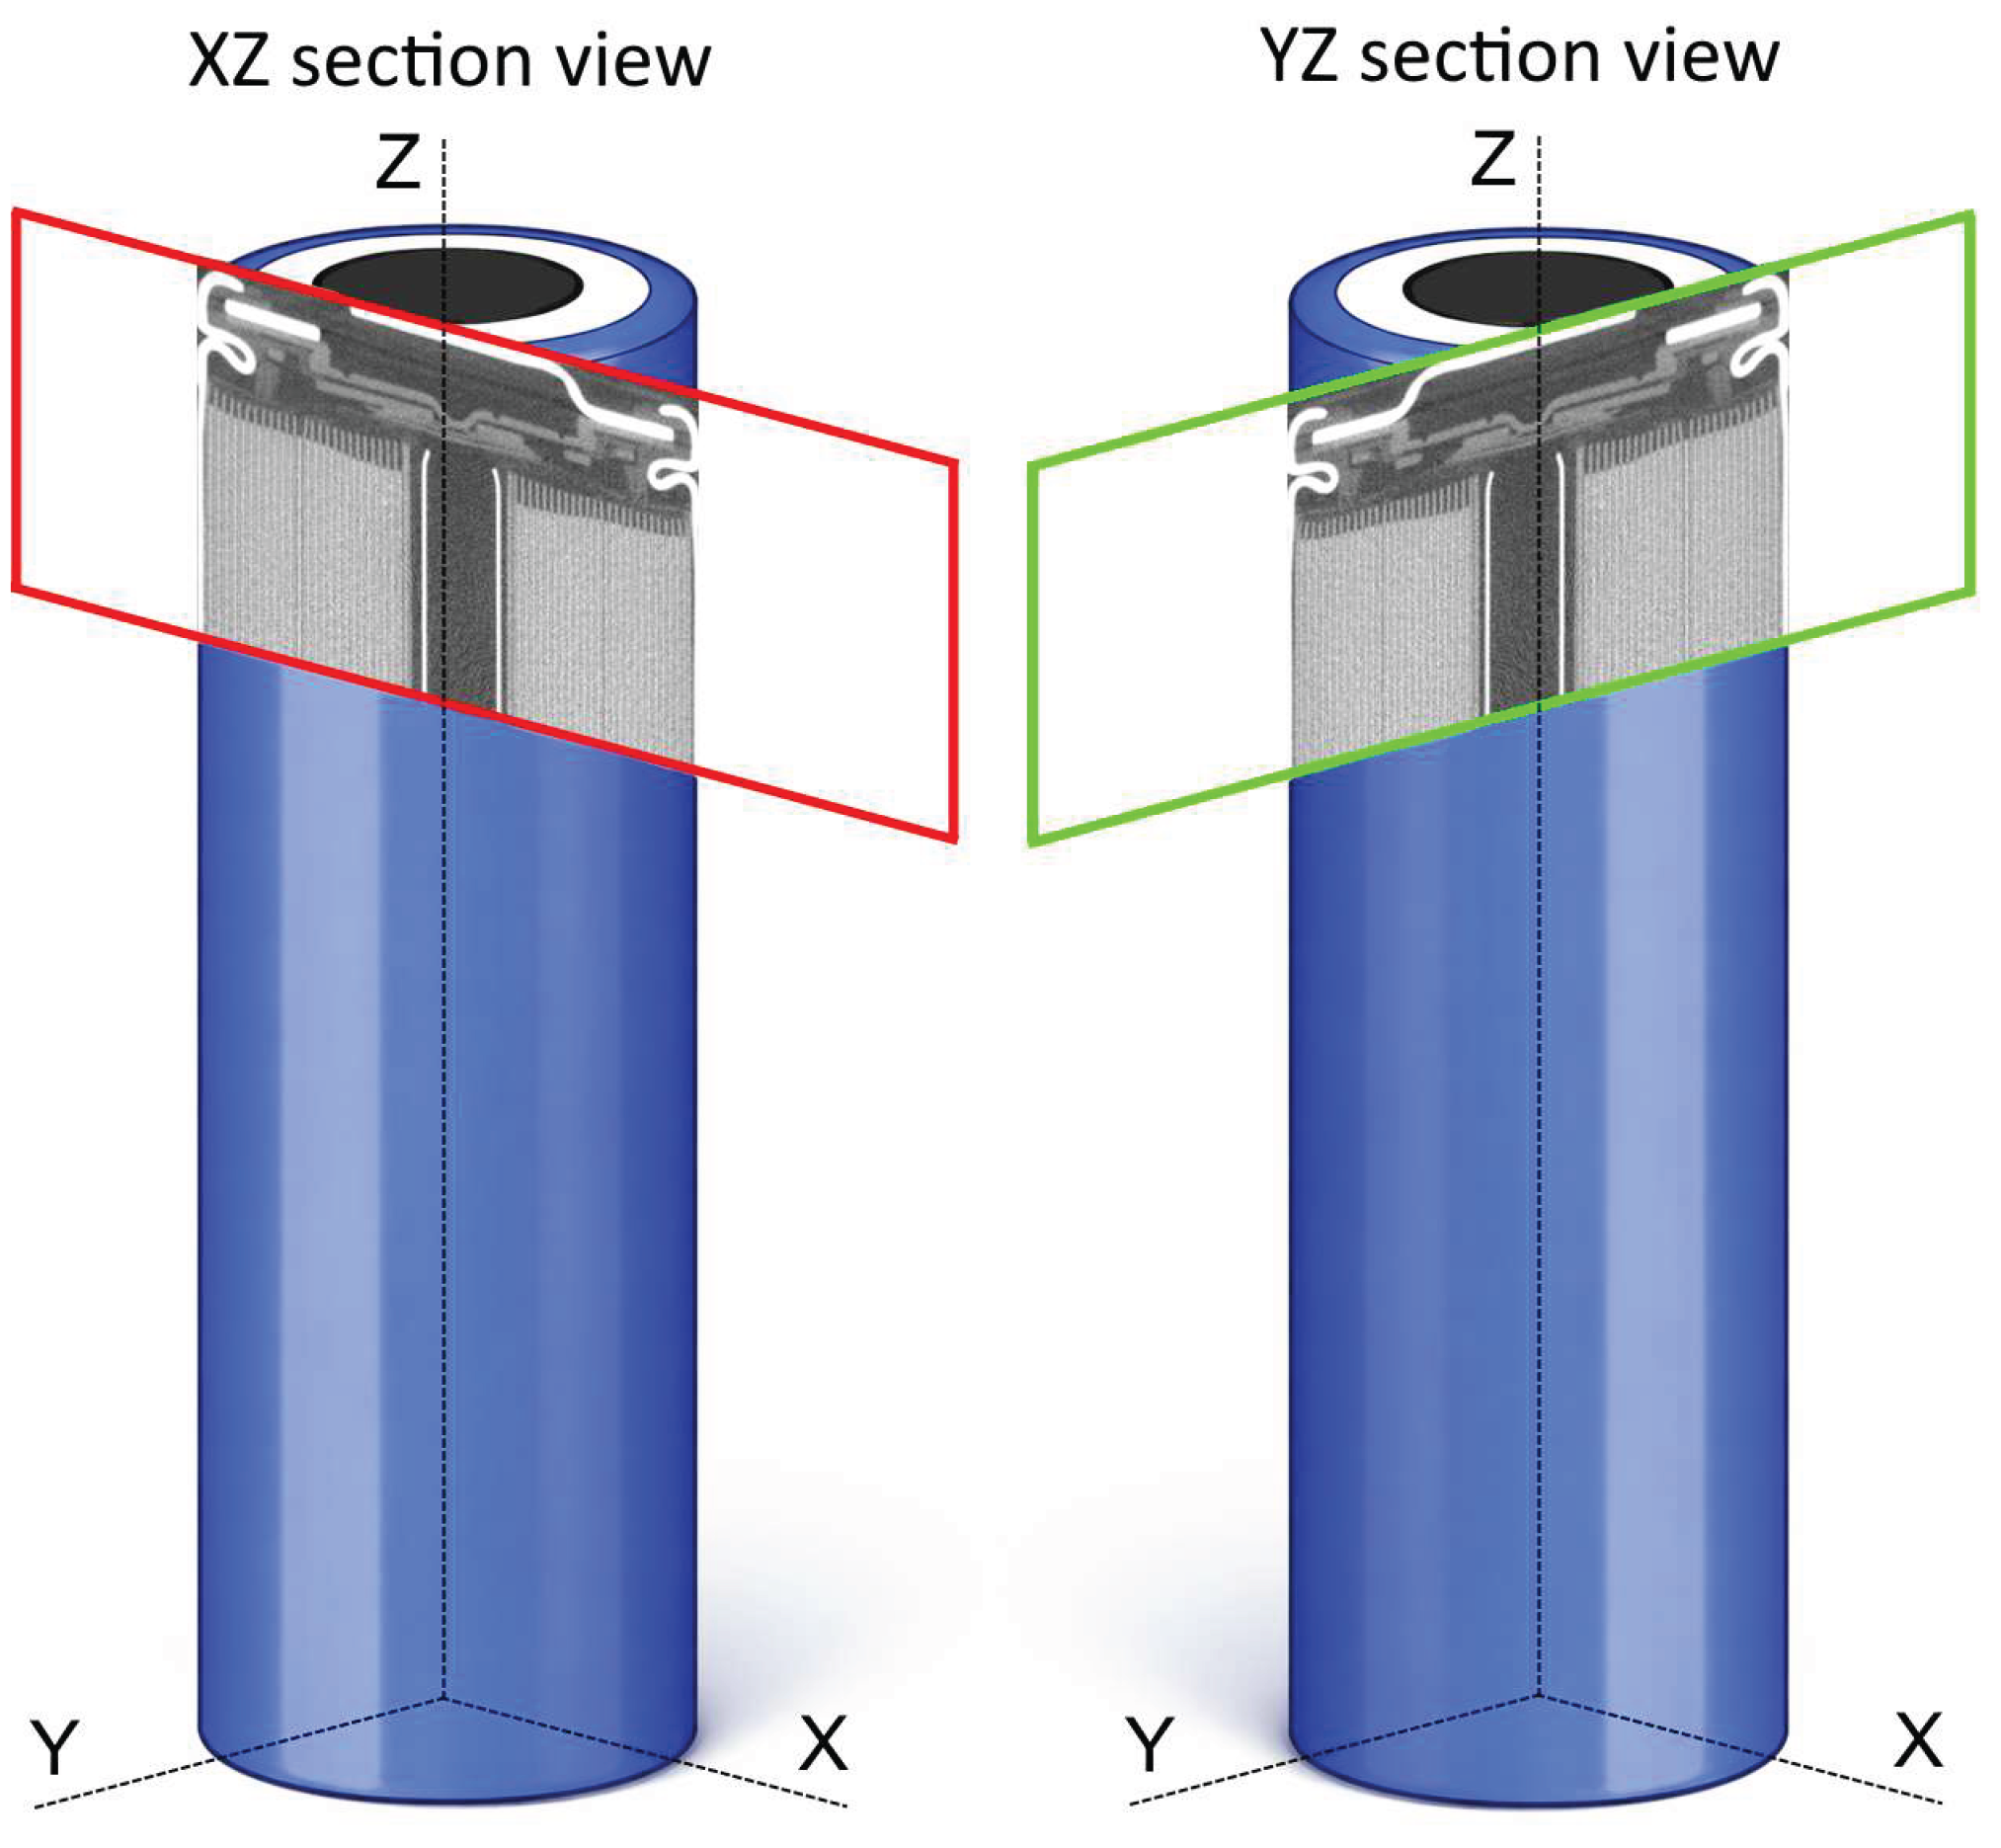
Figure 2.
Example of YX section views placement at different selected distances from the top of the 18650 cell.
Figure 2.
Example of YX section views placement at different selected distances from the top of the 18650 cell.
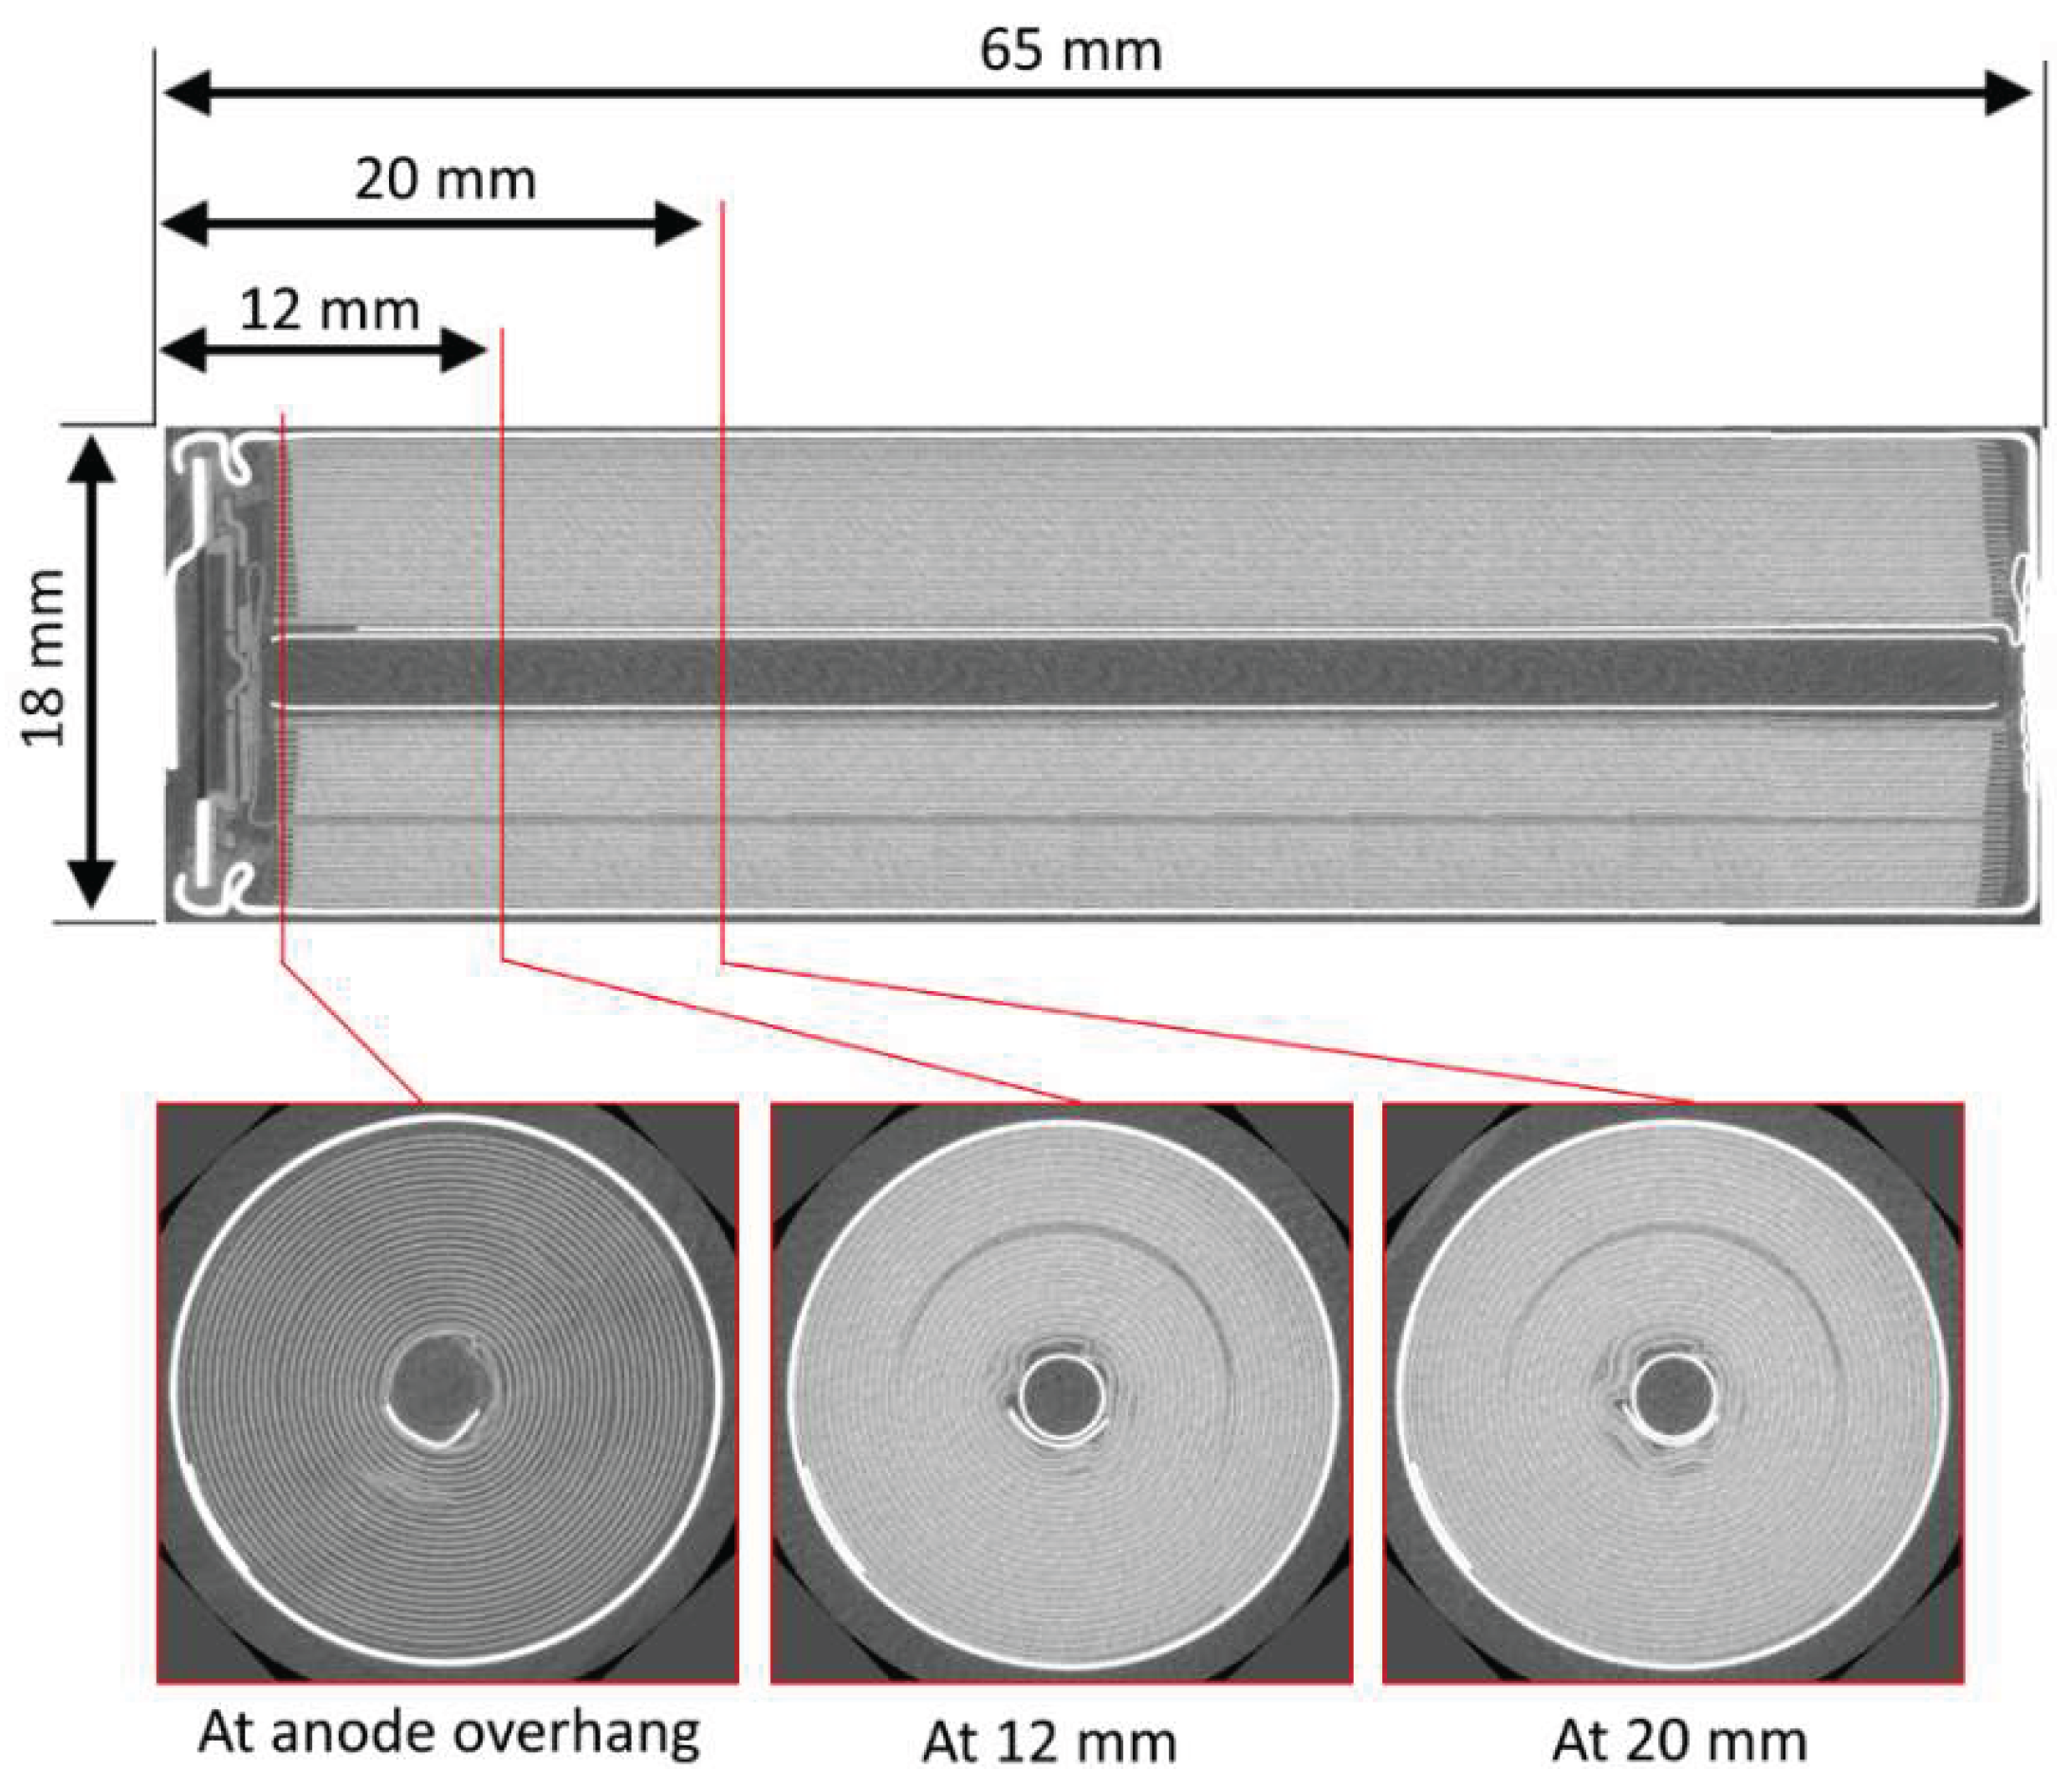
Figure 3.
XZ, YZ and worst delamination (WD) section views of tested LFP battery cell Number 1 (a) before aging and (b) after the aging process.
Figure 3.
XZ, YZ and worst delamination (WD) section views of tested LFP battery cell Number 1 (a) before aging and (b) after the aging process.
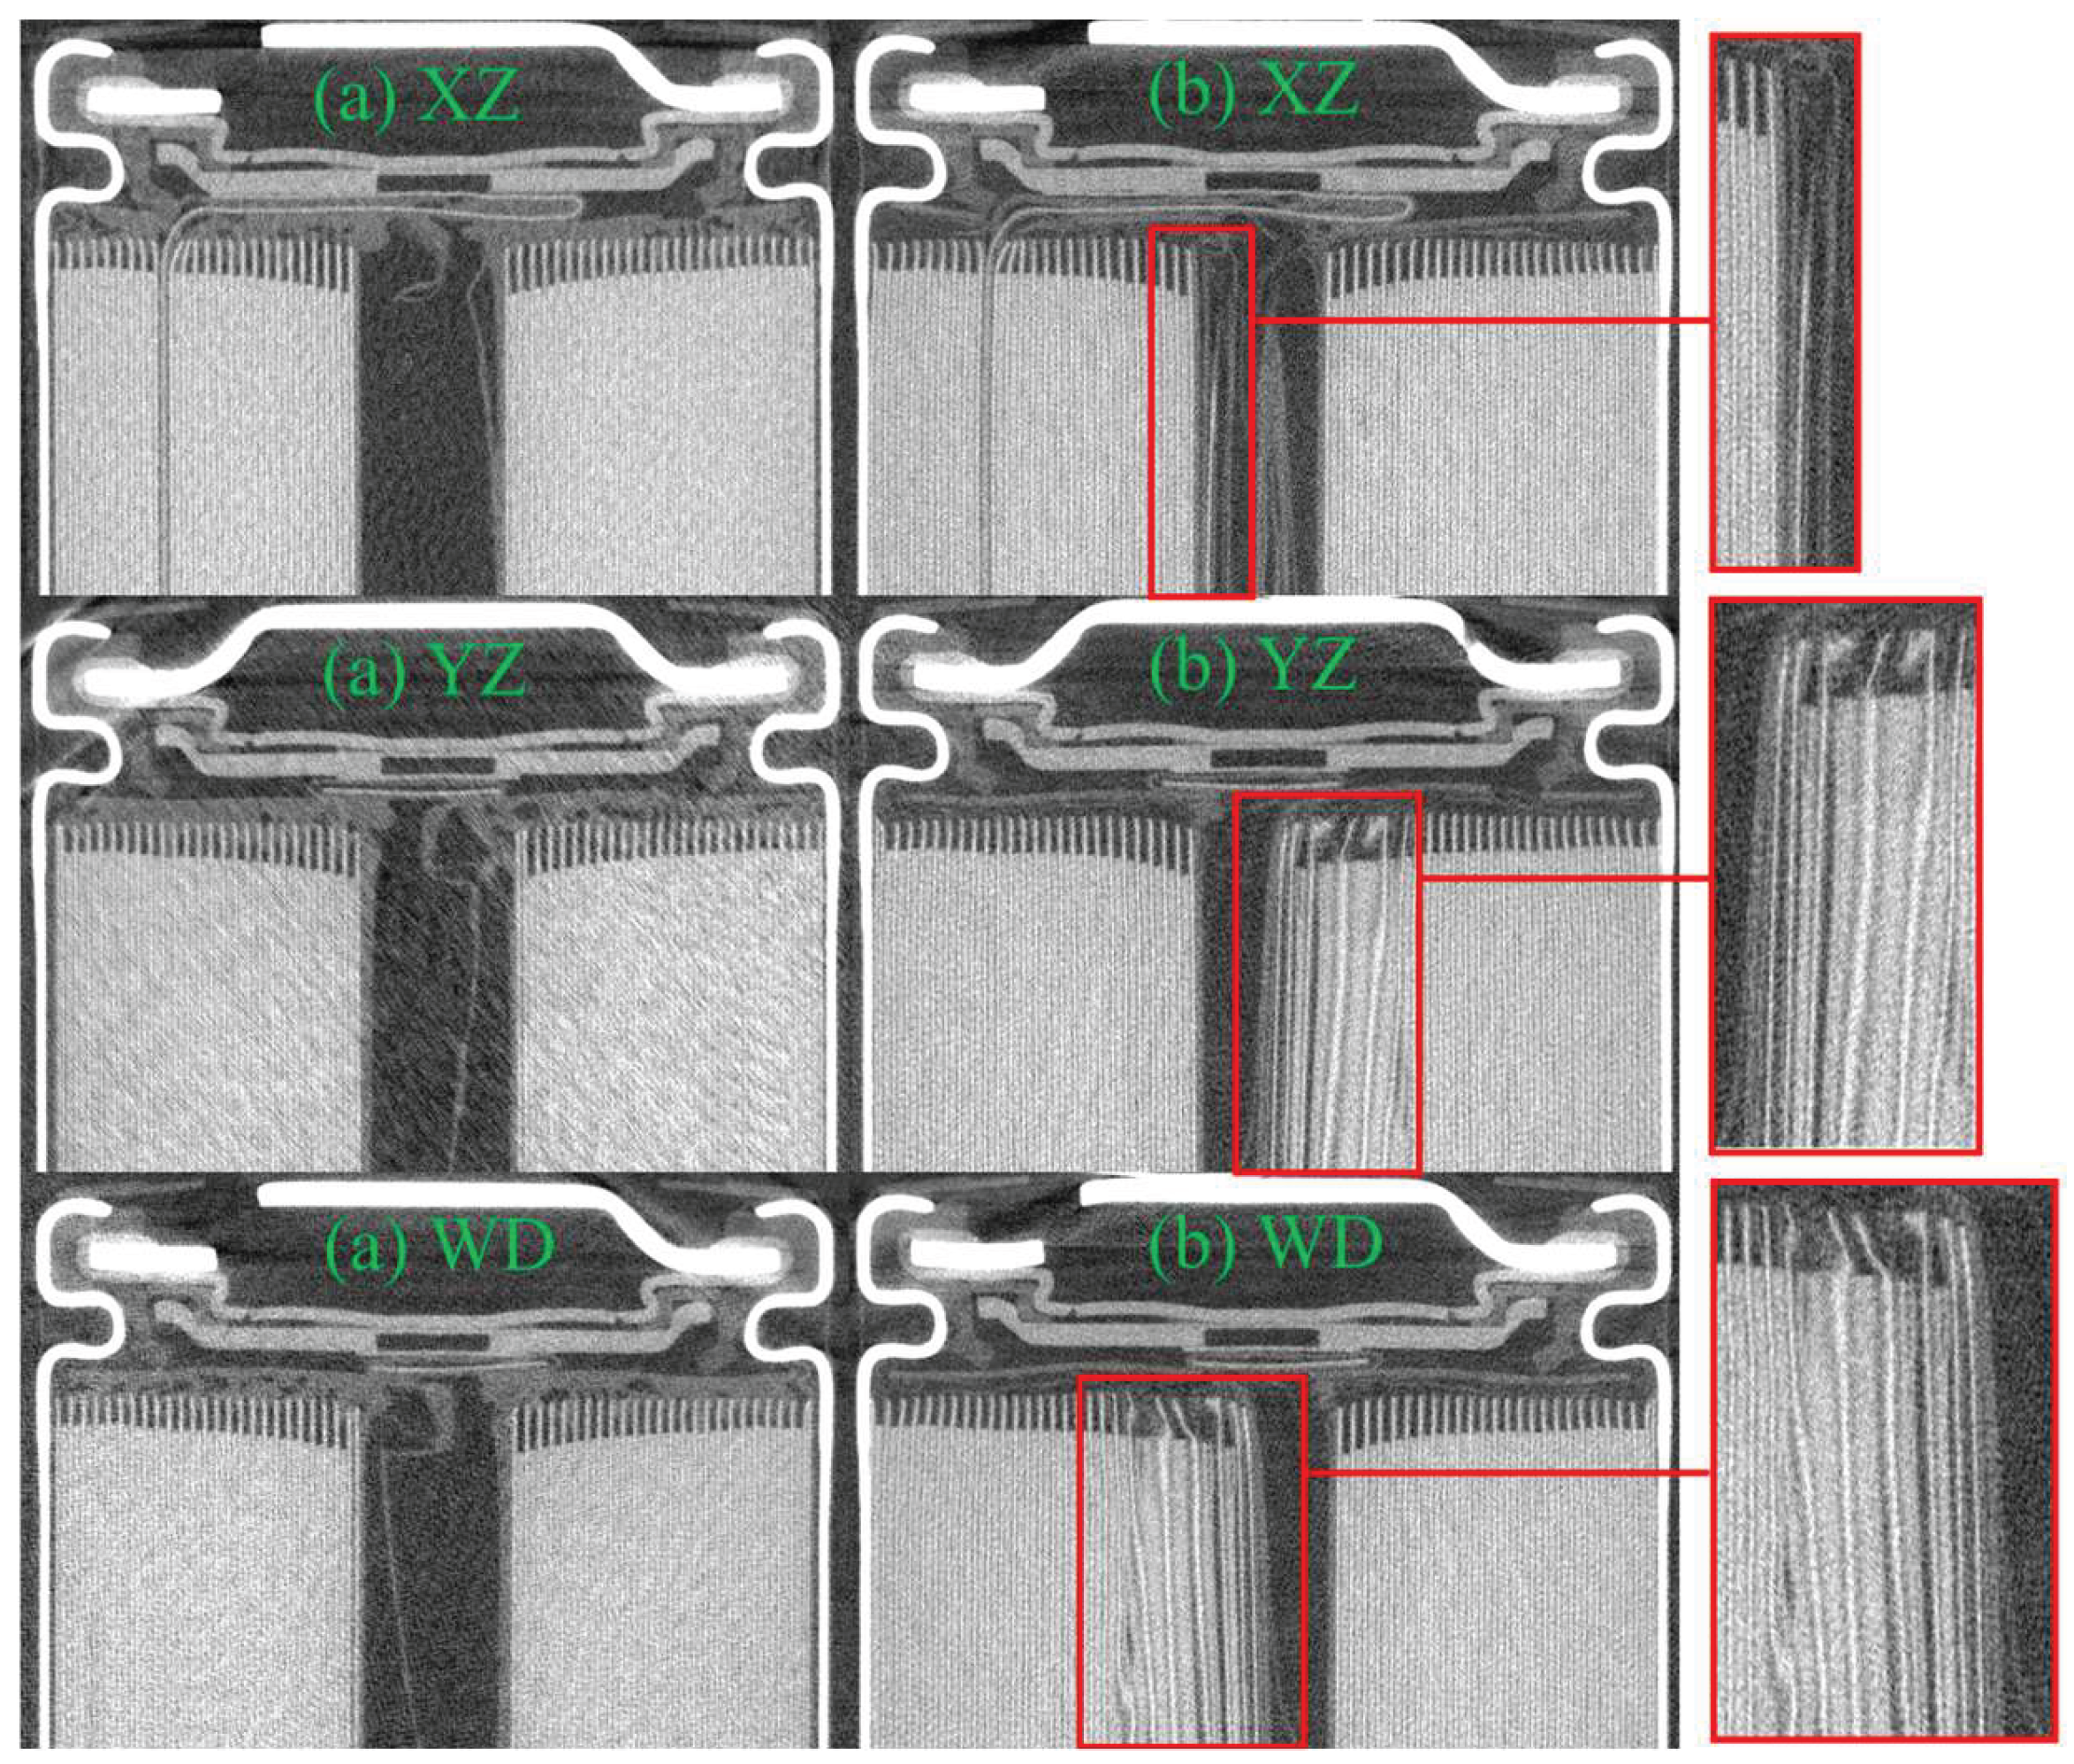
Figure 4.
YX section views of tested LFP battery cell Number 1 (a) before aging at anode overhang, (b) after the aging process at anode overhang, (c) before aging at 12 mm height from the top, (d) after aging at 12 mm height from the top.
Figure 4.
YX section views of tested LFP battery cell Number 1 (a) before aging at anode overhang, (b) after the aging process at anode overhang, (c) before aging at 12 mm height from the top, (d) after aging at 12 mm height from the top.
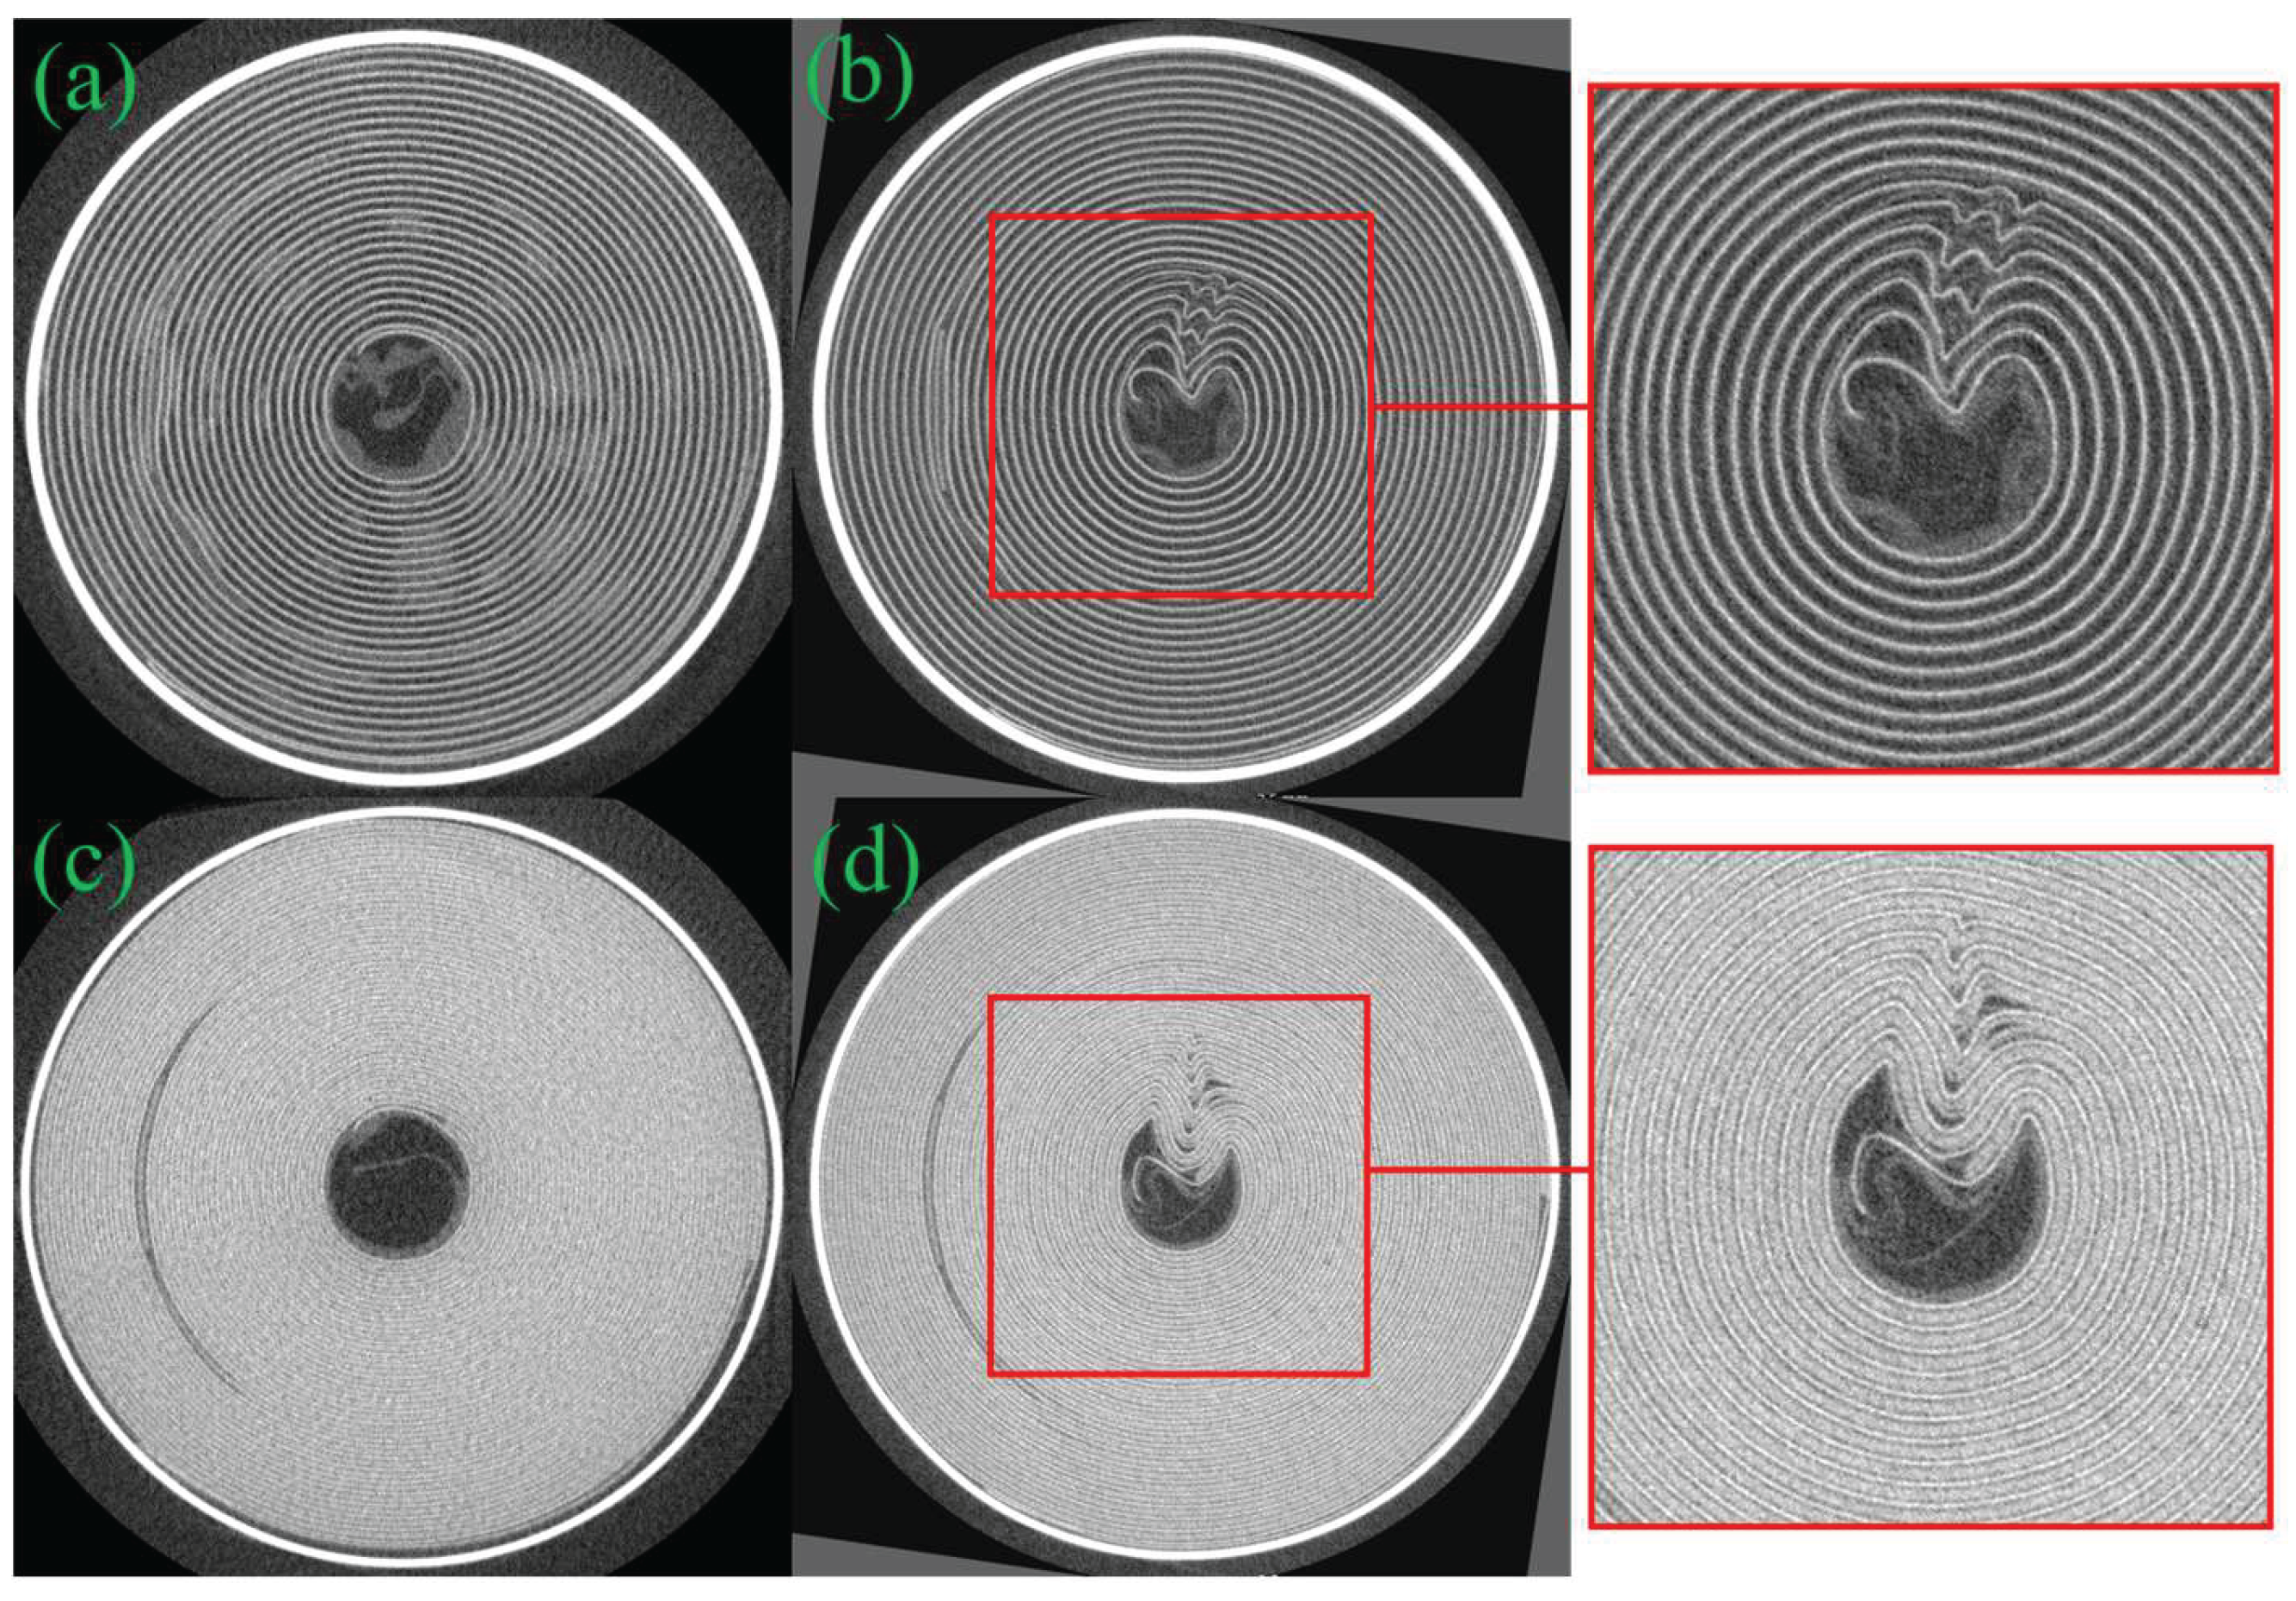
Figure 5.
XZ, YZ and worst delamination (WD) section views of tested LFP battery cell Number 2 (a) before aging and (b) after the aging process.
Figure 5.
XZ, YZ and worst delamination (WD) section views of tested LFP battery cell Number 2 (a) before aging and (b) after the aging process.
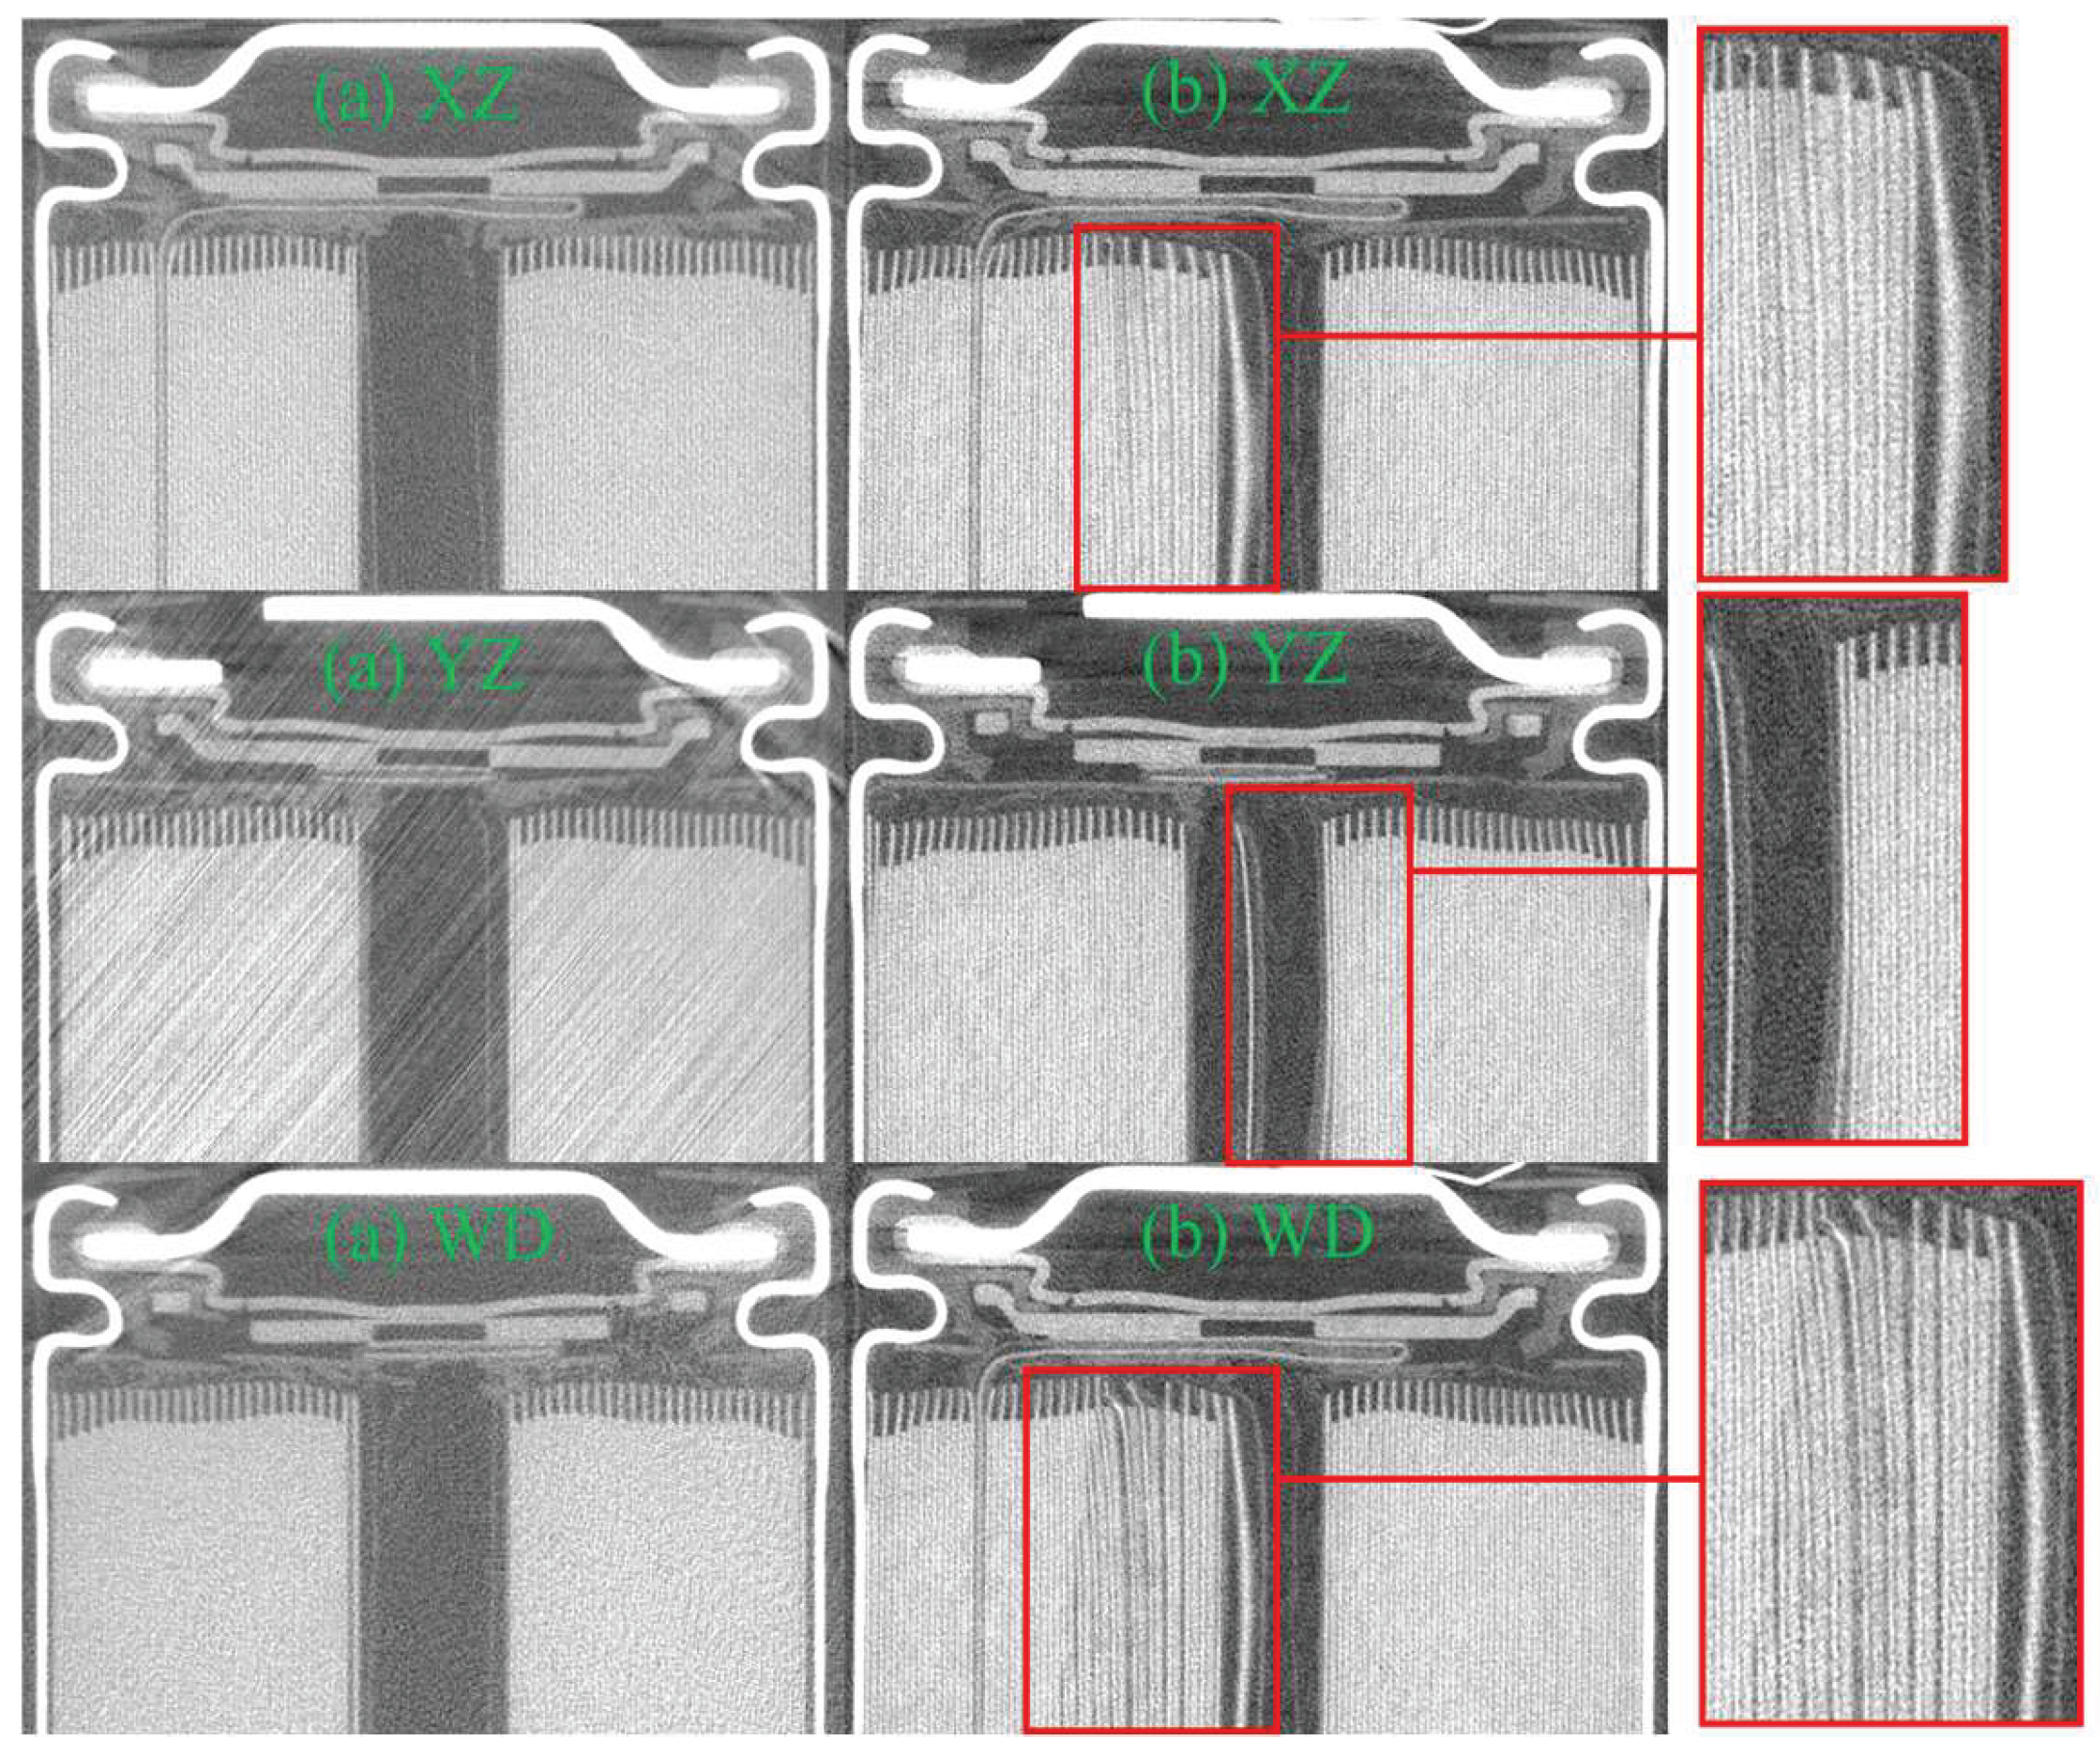
Figure 6.
YX section views of tested LFP battery cell Number 2 (a) before aging at anode overhang, (b) after the aging process at anode overhang, (c) before aging at 12 mm height from the top, (d) after aging at 12 mm height from the top.
Figure 6.
YX section views of tested LFP battery cell Number 2 (a) before aging at anode overhang, (b) after the aging process at anode overhang, (c) before aging at 12 mm height from the top, (d) after aging at 12 mm height from the top.
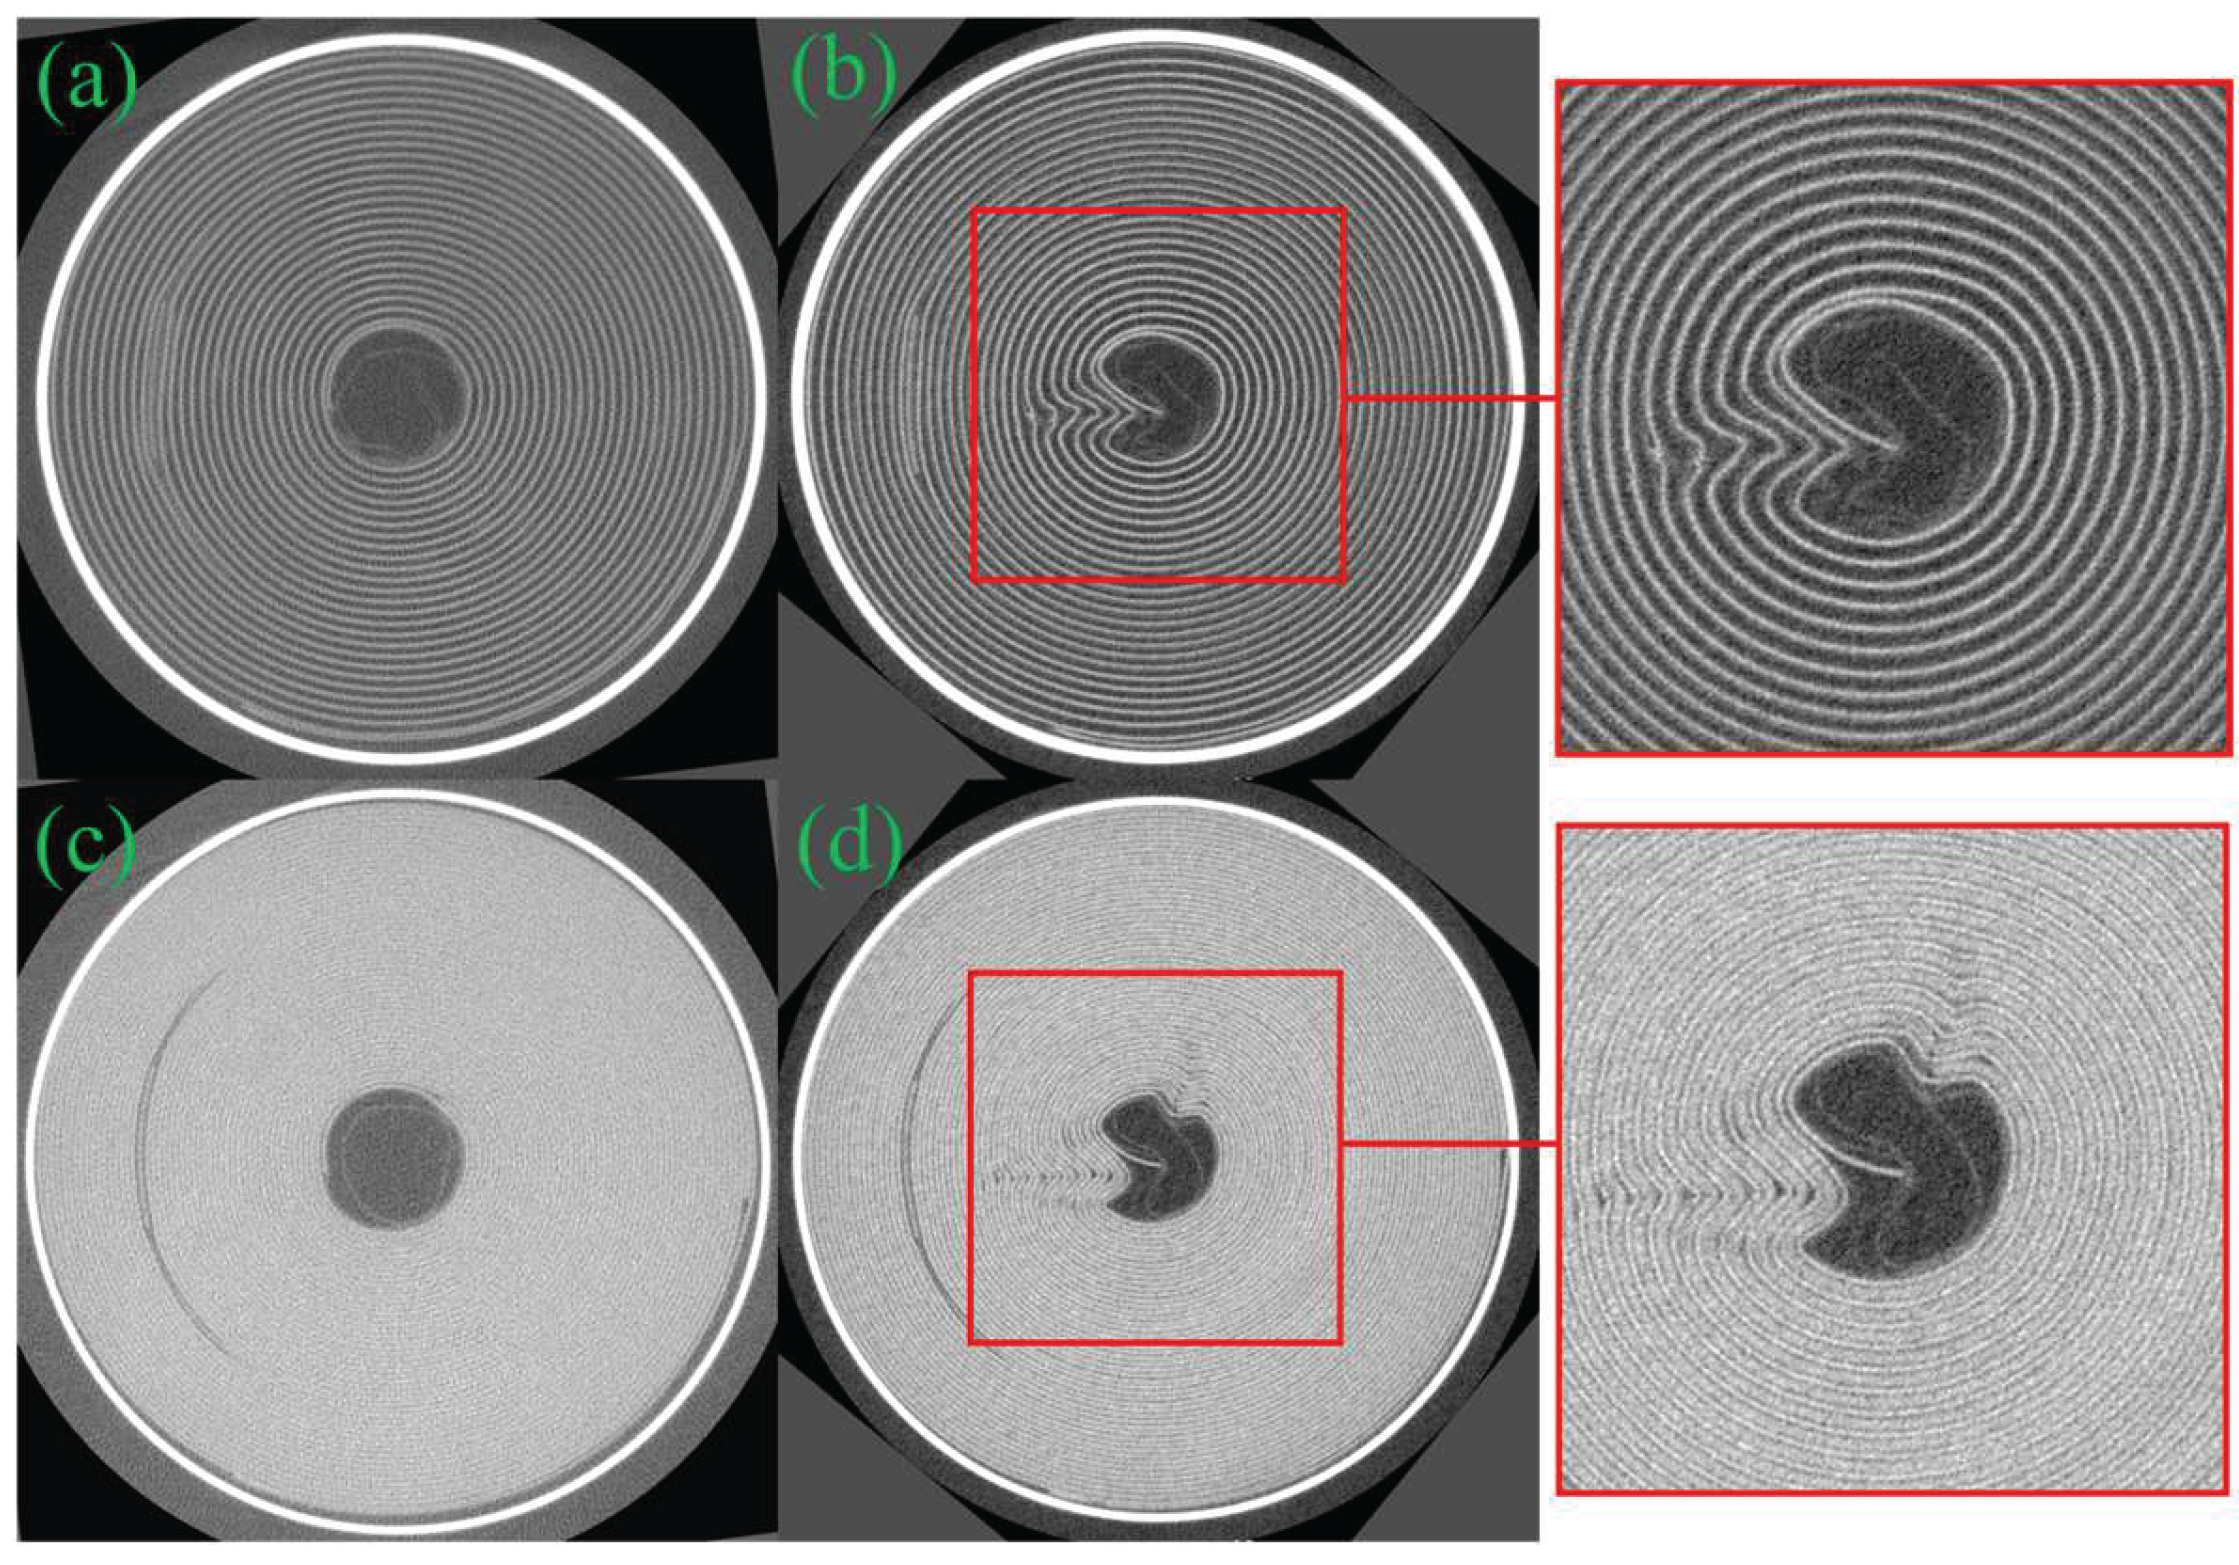
Figure 7.
XZ, YZ and worst delamination (WD) section views of tested LFP battery cell Number 3 (a) before aging and (b) after the aging process.
Figure 7.
XZ, YZ and worst delamination (WD) section views of tested LFP battery cell Number 3 (a) before aging and (b) after the aging process.
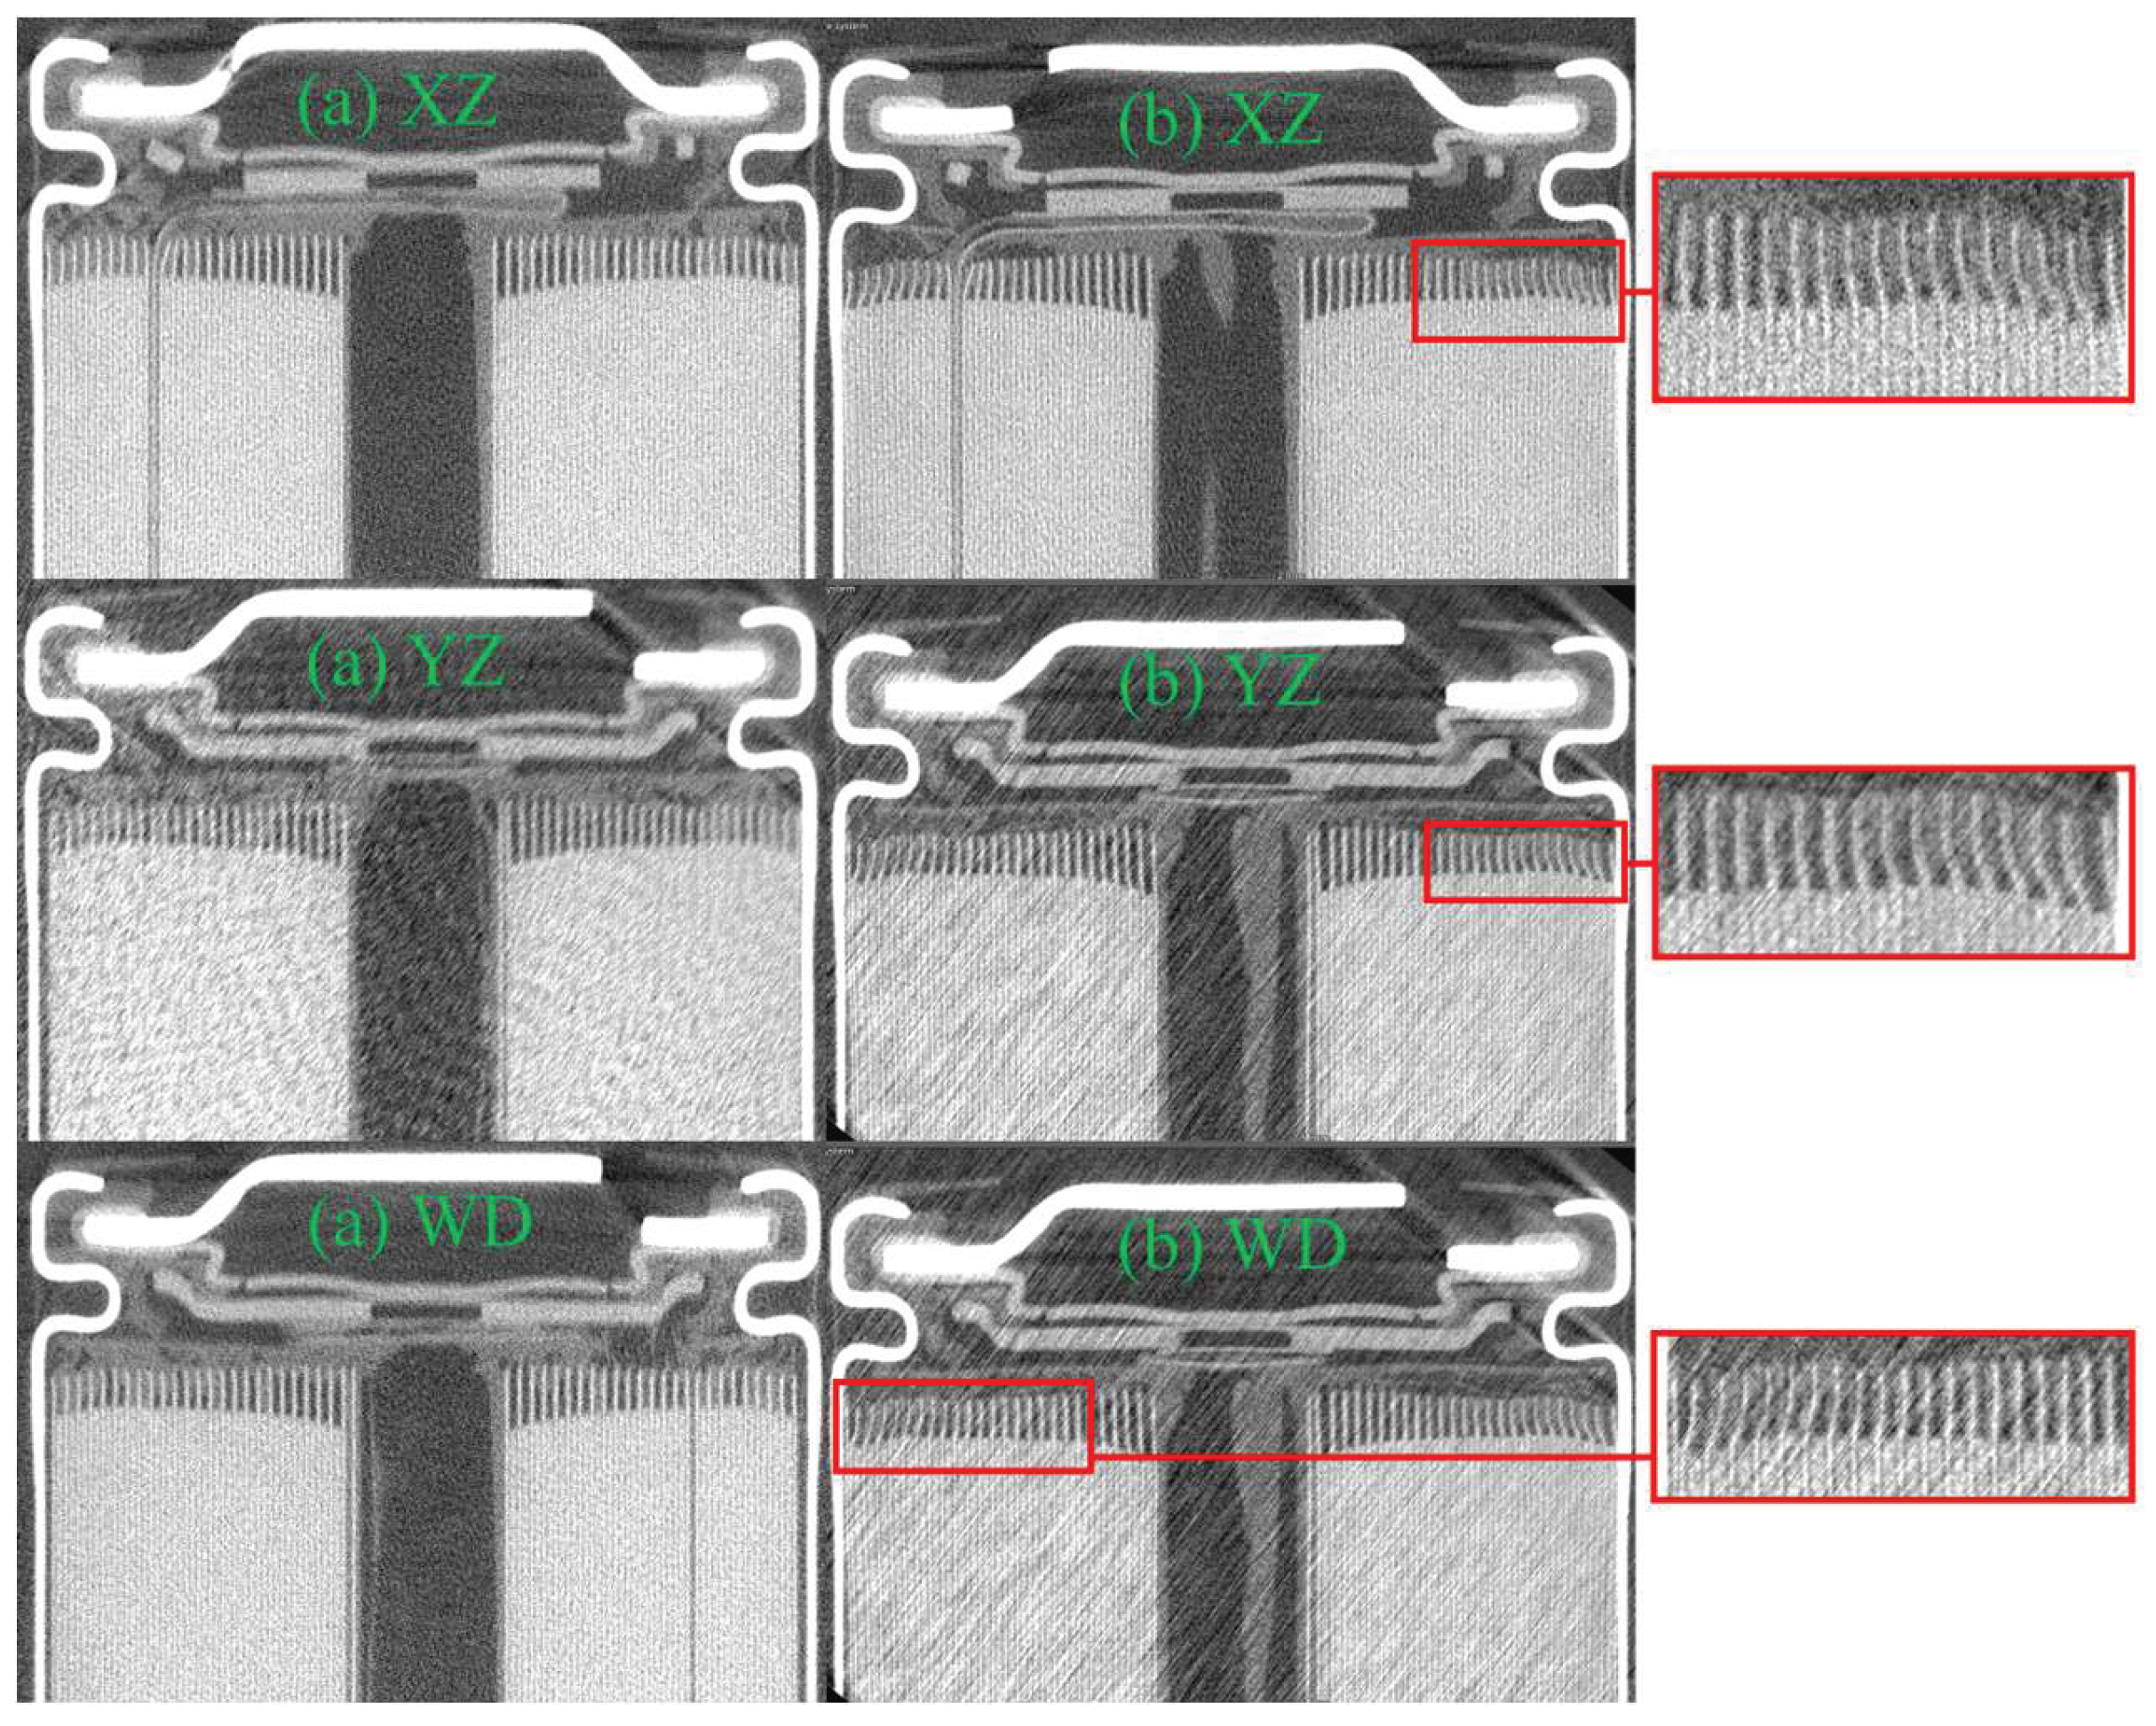
Figure 8.
YX section views of tested LFP battery cell Number 3 (a) before aging at anode overhang, (b) after the aging process at anode overhang, (c) before aging at 12 mm height from the top, (d) after aging at 12 mm height from the top.
Figure 8.
YX section views of tested LFP battery cell Number 3 (a) before aging at anode overhang, (b) after the aging process at anode overhang, (c) before aging at 12 mm height from the top, (d) after aging at 12 mm height from the top.
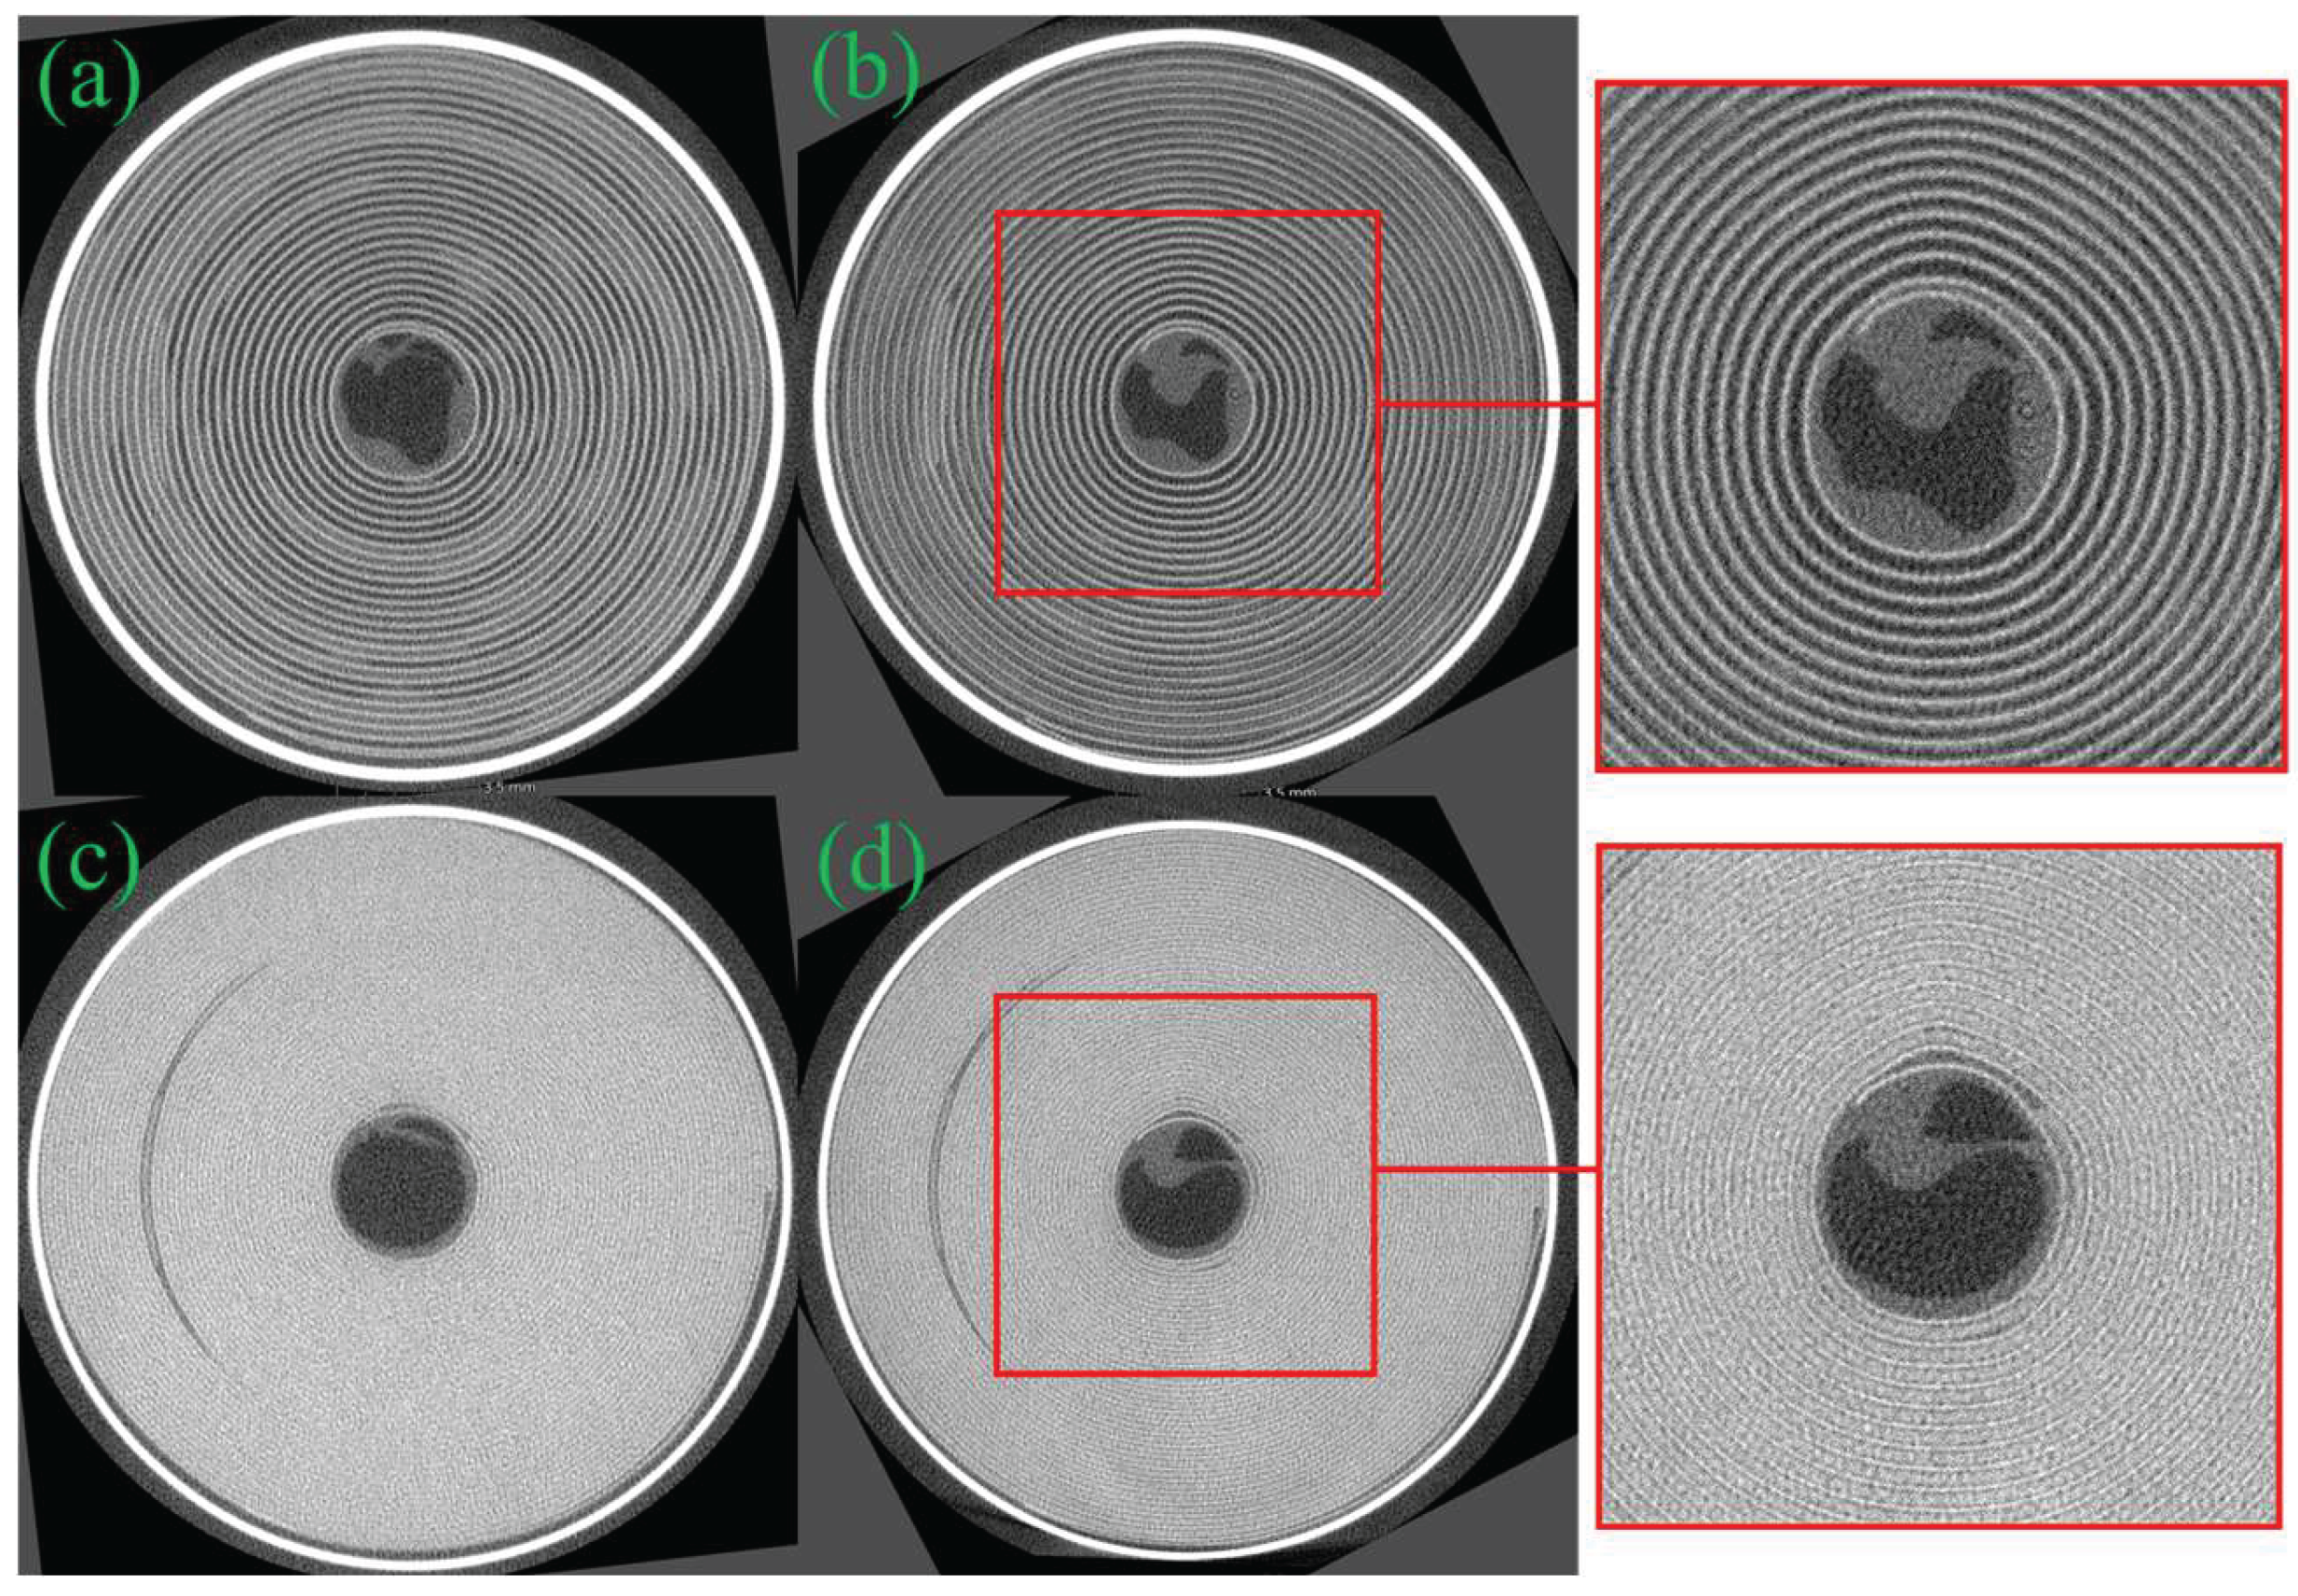
Figure 9.
XZ, YZ and worst delamination (WD) section views of tested NMC battery cell Number 4 (a) before aging and (b) after the aging process.
Figure 9.
XZ, YZ and worst delamination (WD) section views of tested NMC battery cell Number 4 (a) before aging and (b) after the aging process.
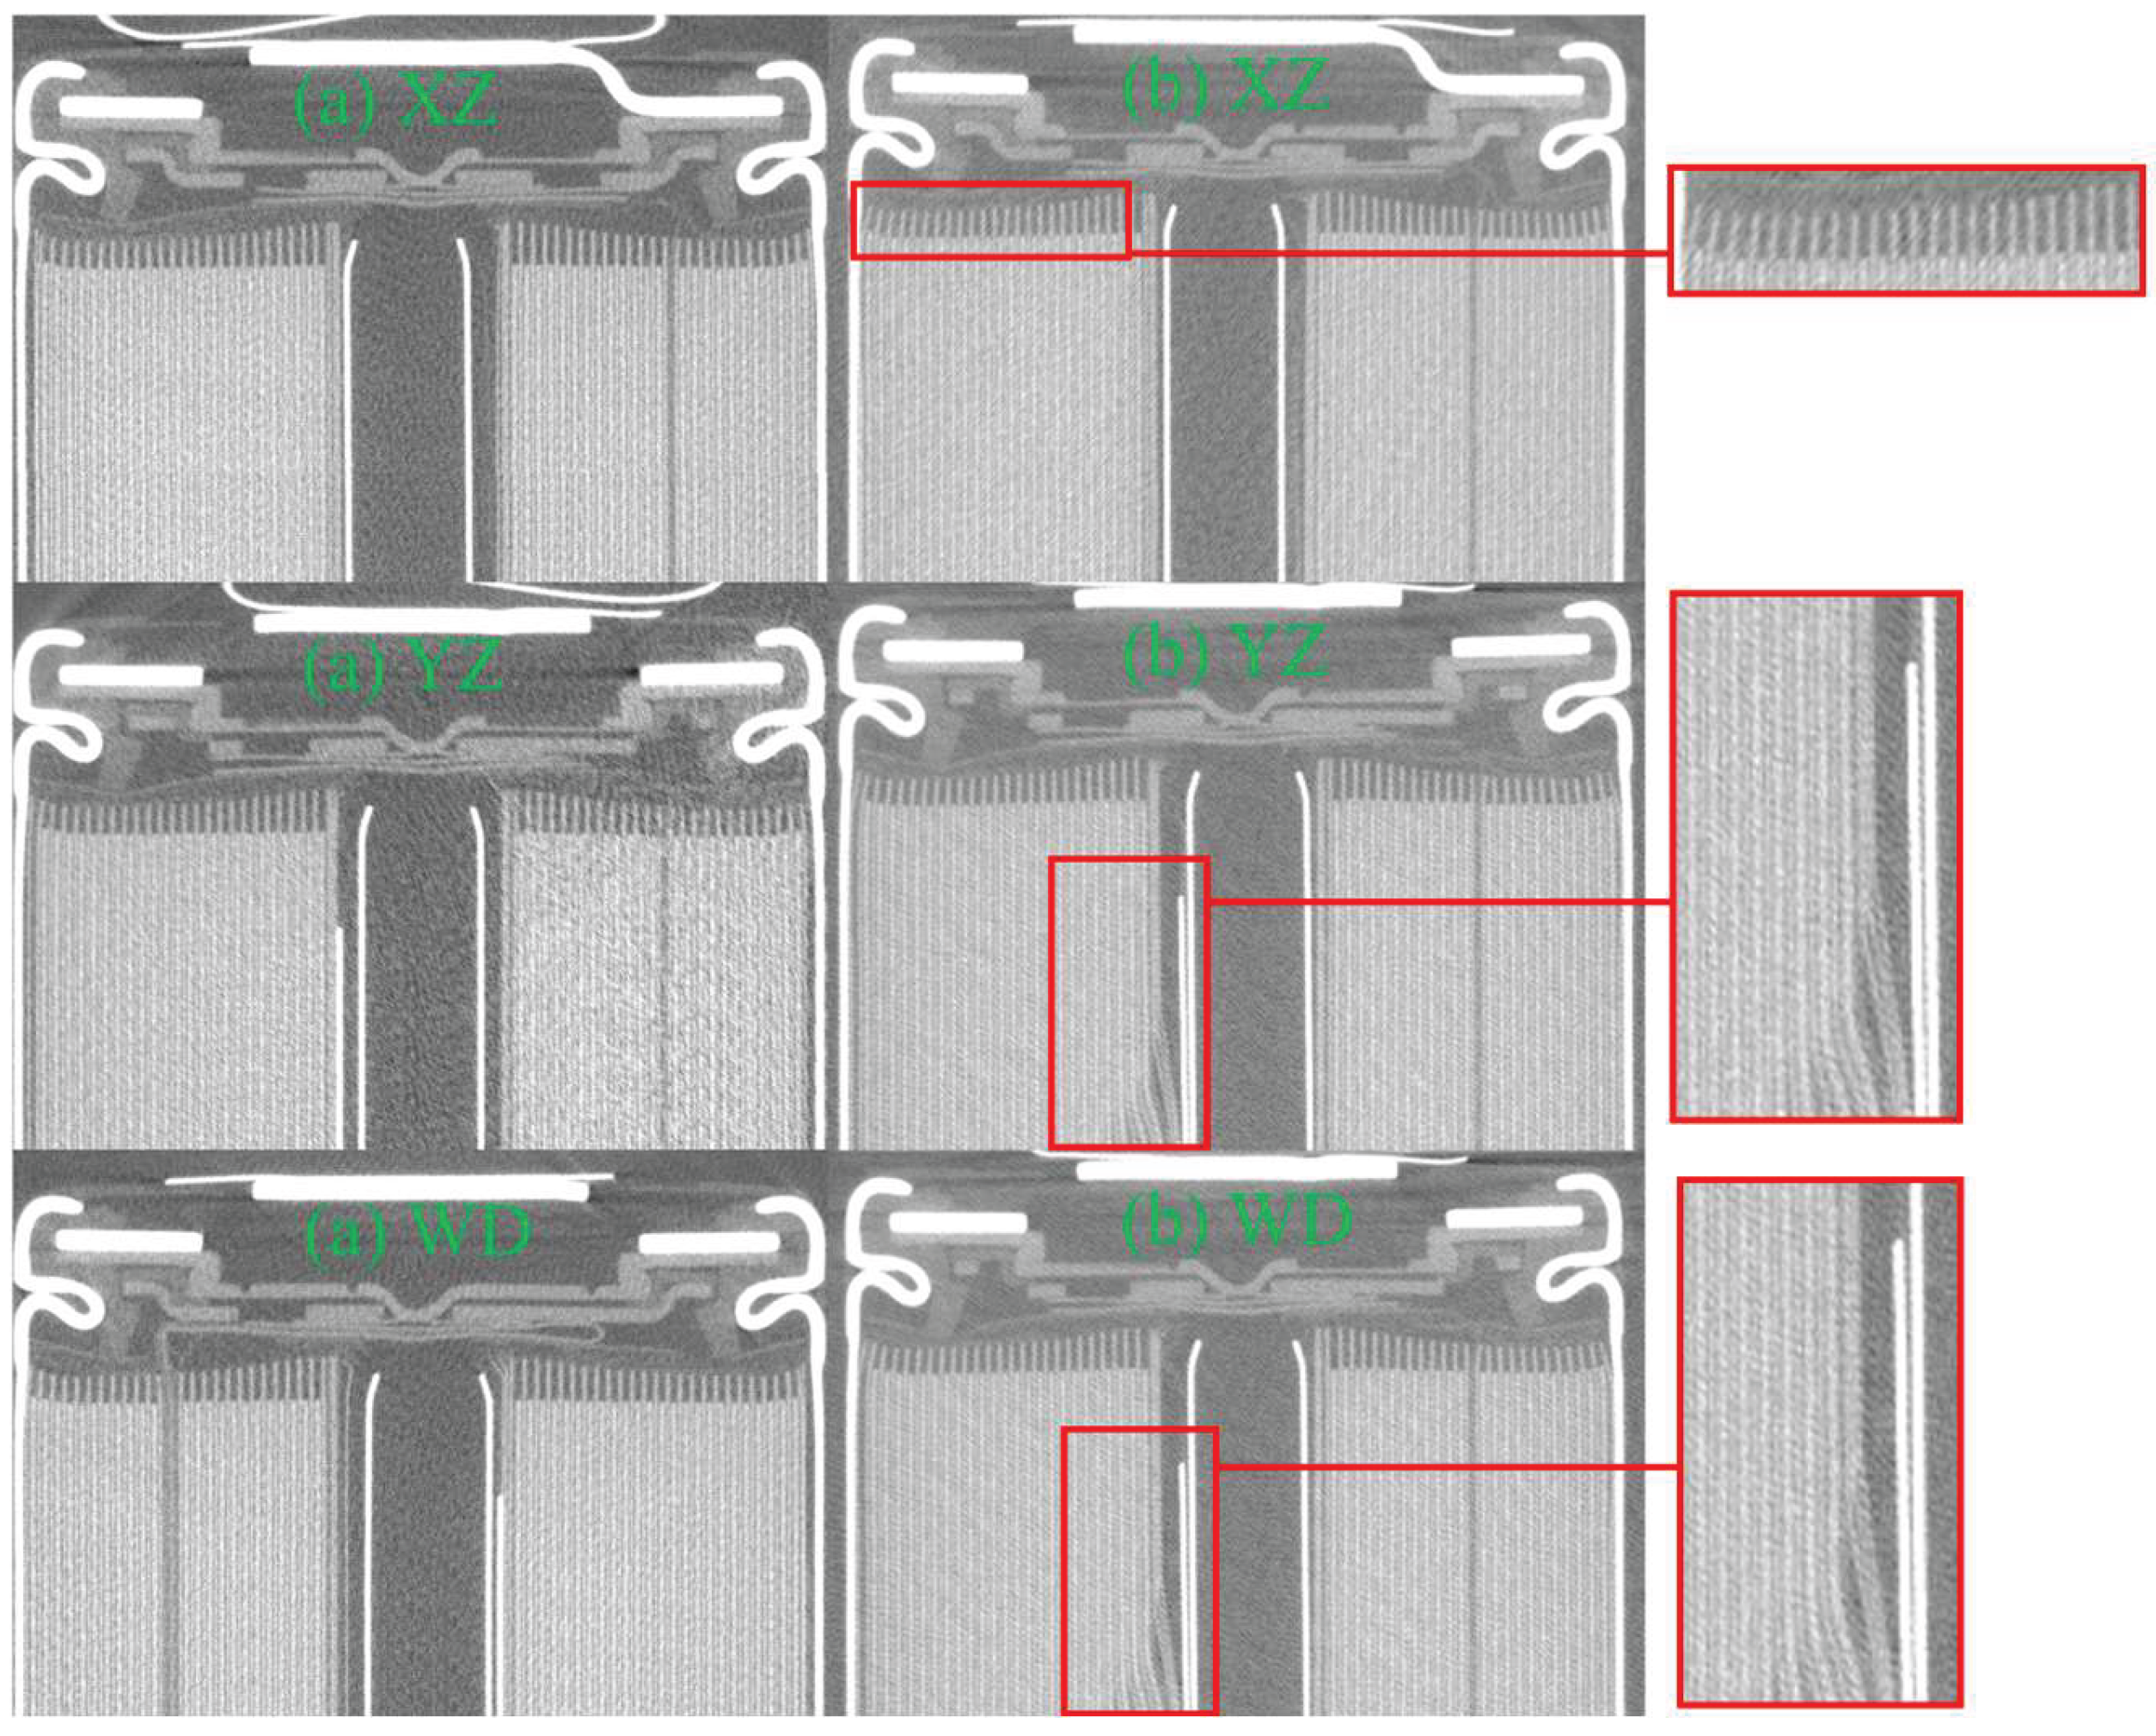
Figure 10.
YX section views of tested NMC battery cell Number 4 (a) before aging at anode overhang, (b) after the aging process at anode overhang, (c) before aging at 12 mm height from the top, (d) after aging at 12 mm height from the top.
Figure 10.
YX section views of tested NMC battery cell Number 4 (a) before aging at anode overhang, (b) after the aging process at anode overhang, (c) before aging at 12 mm height from the top, (d) after aging at 12 mm height from the top.
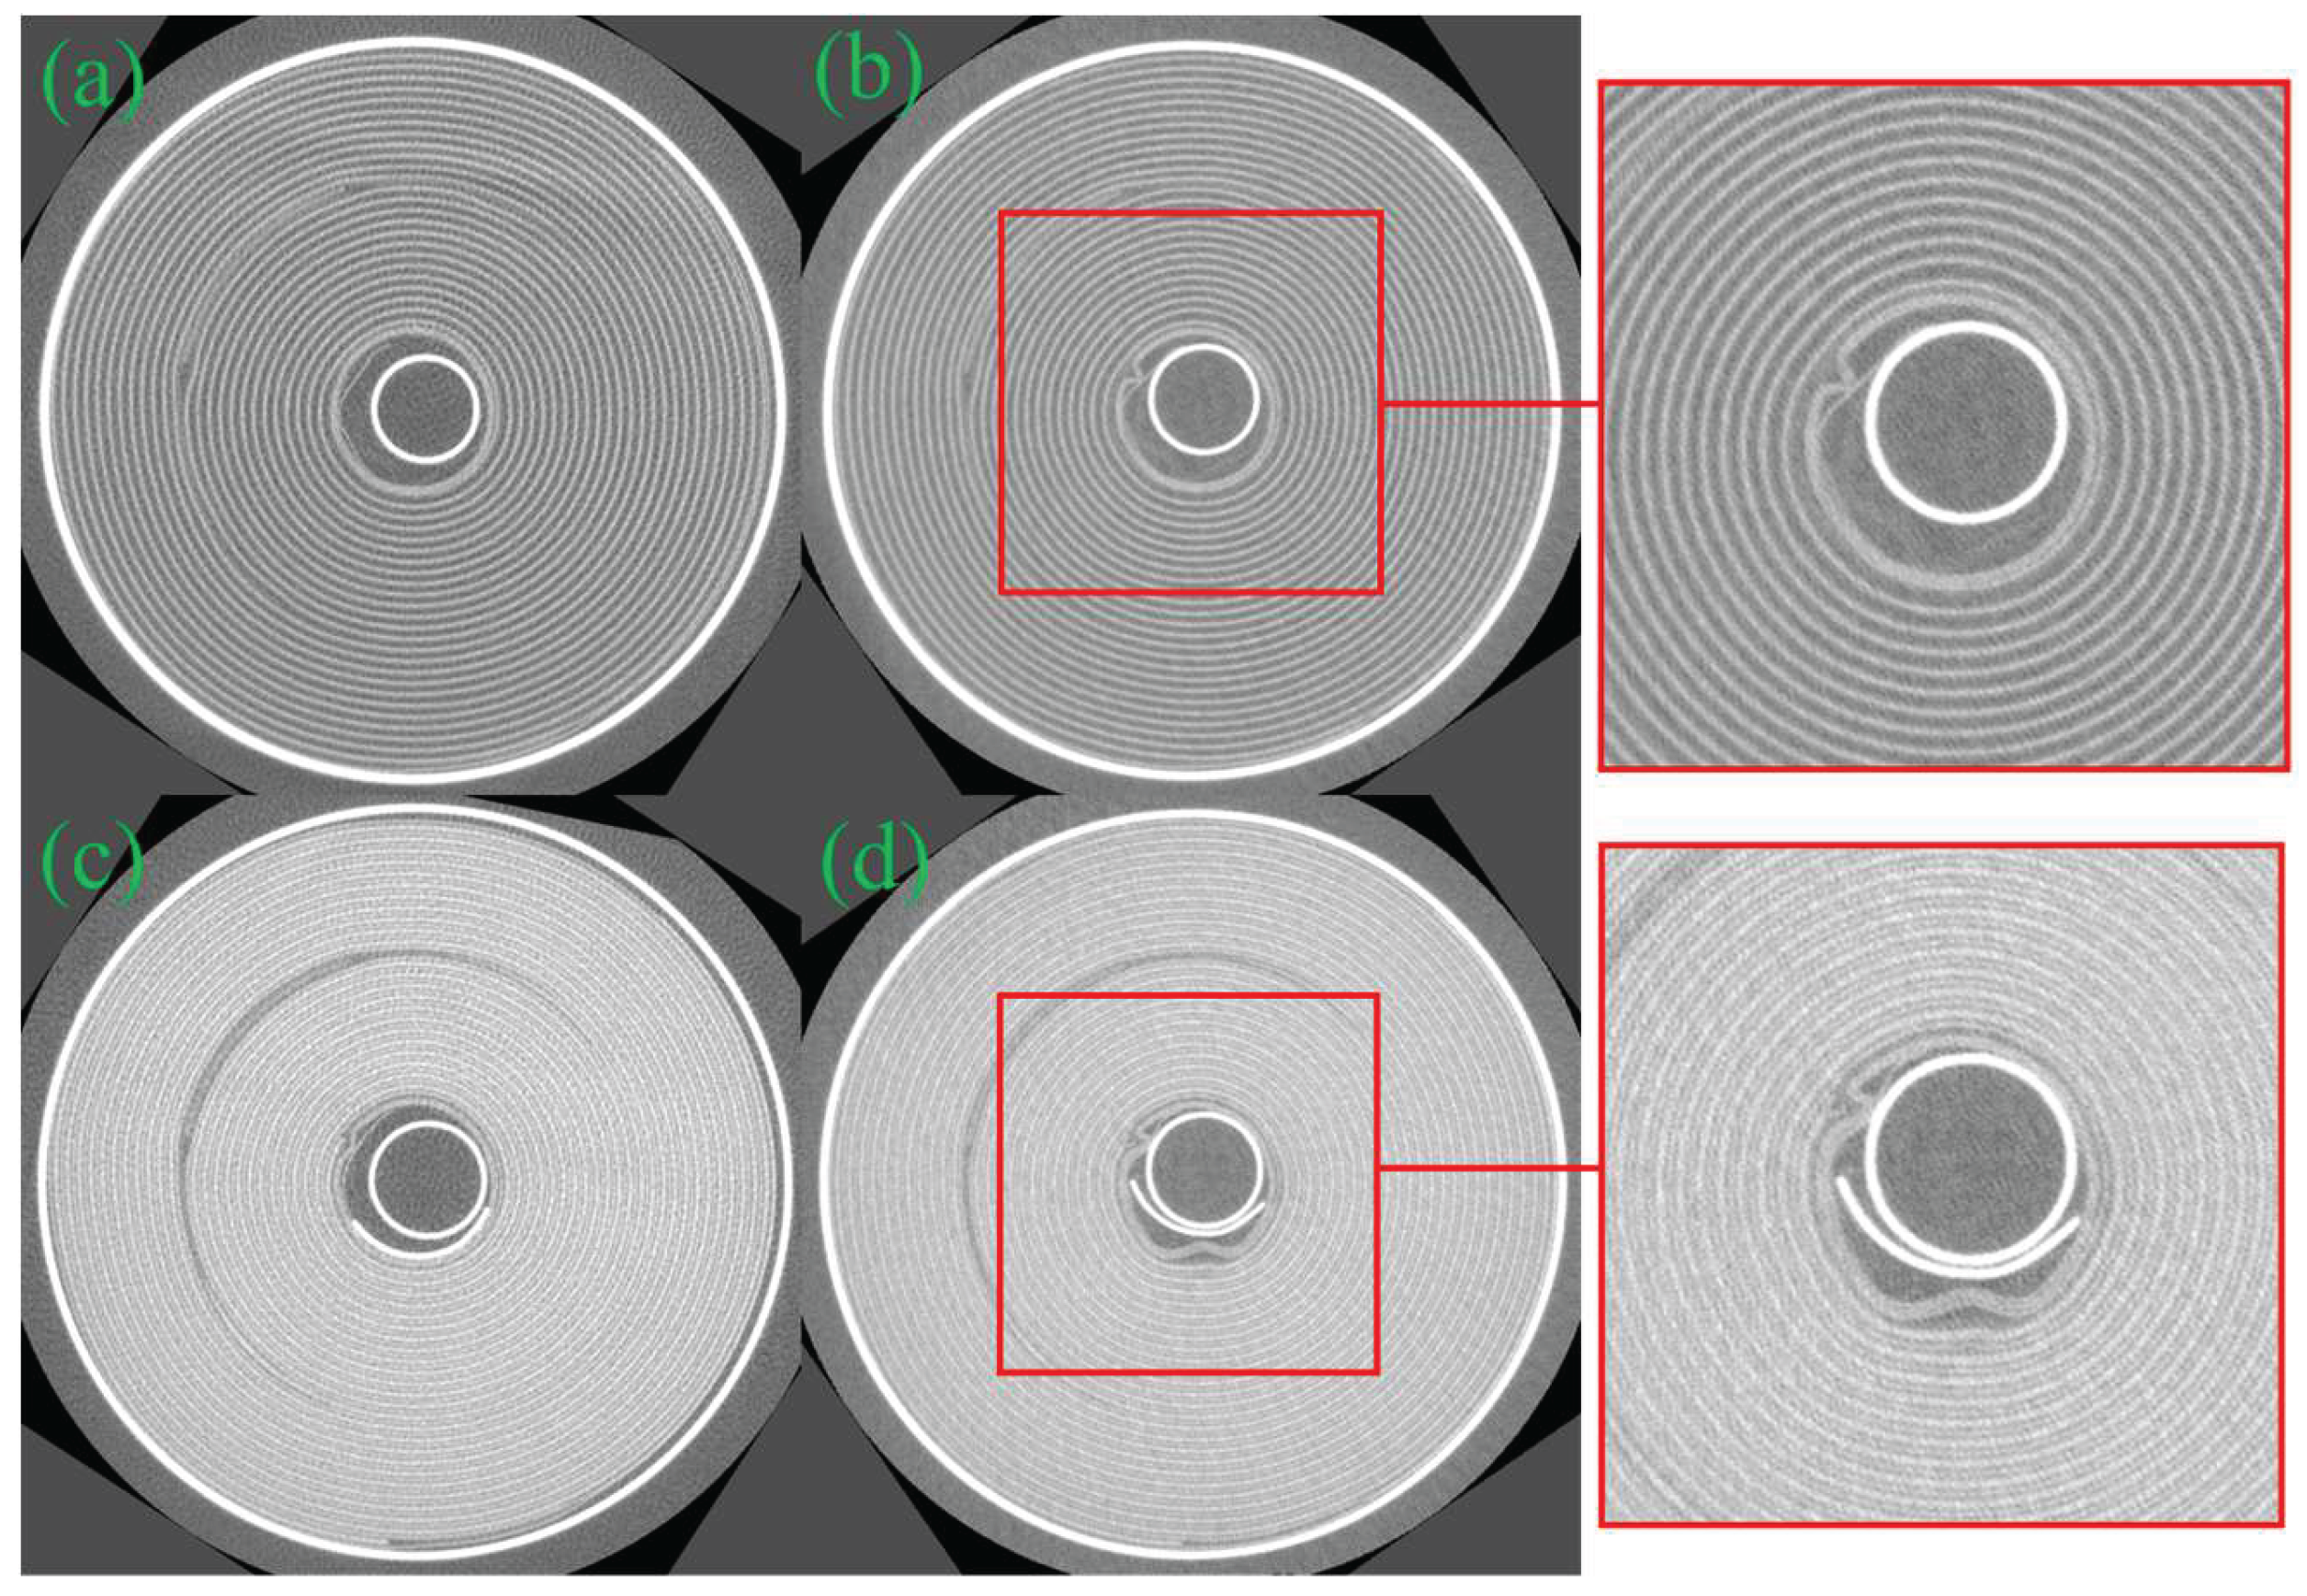
Figure 11.
YX section view of tested NMC battery cell Number 4 after aging at 20 mm height from the top.
Figure 11.
YX section view of tested NMC battery cell Number 4 after aging at 20 mm height from the top.
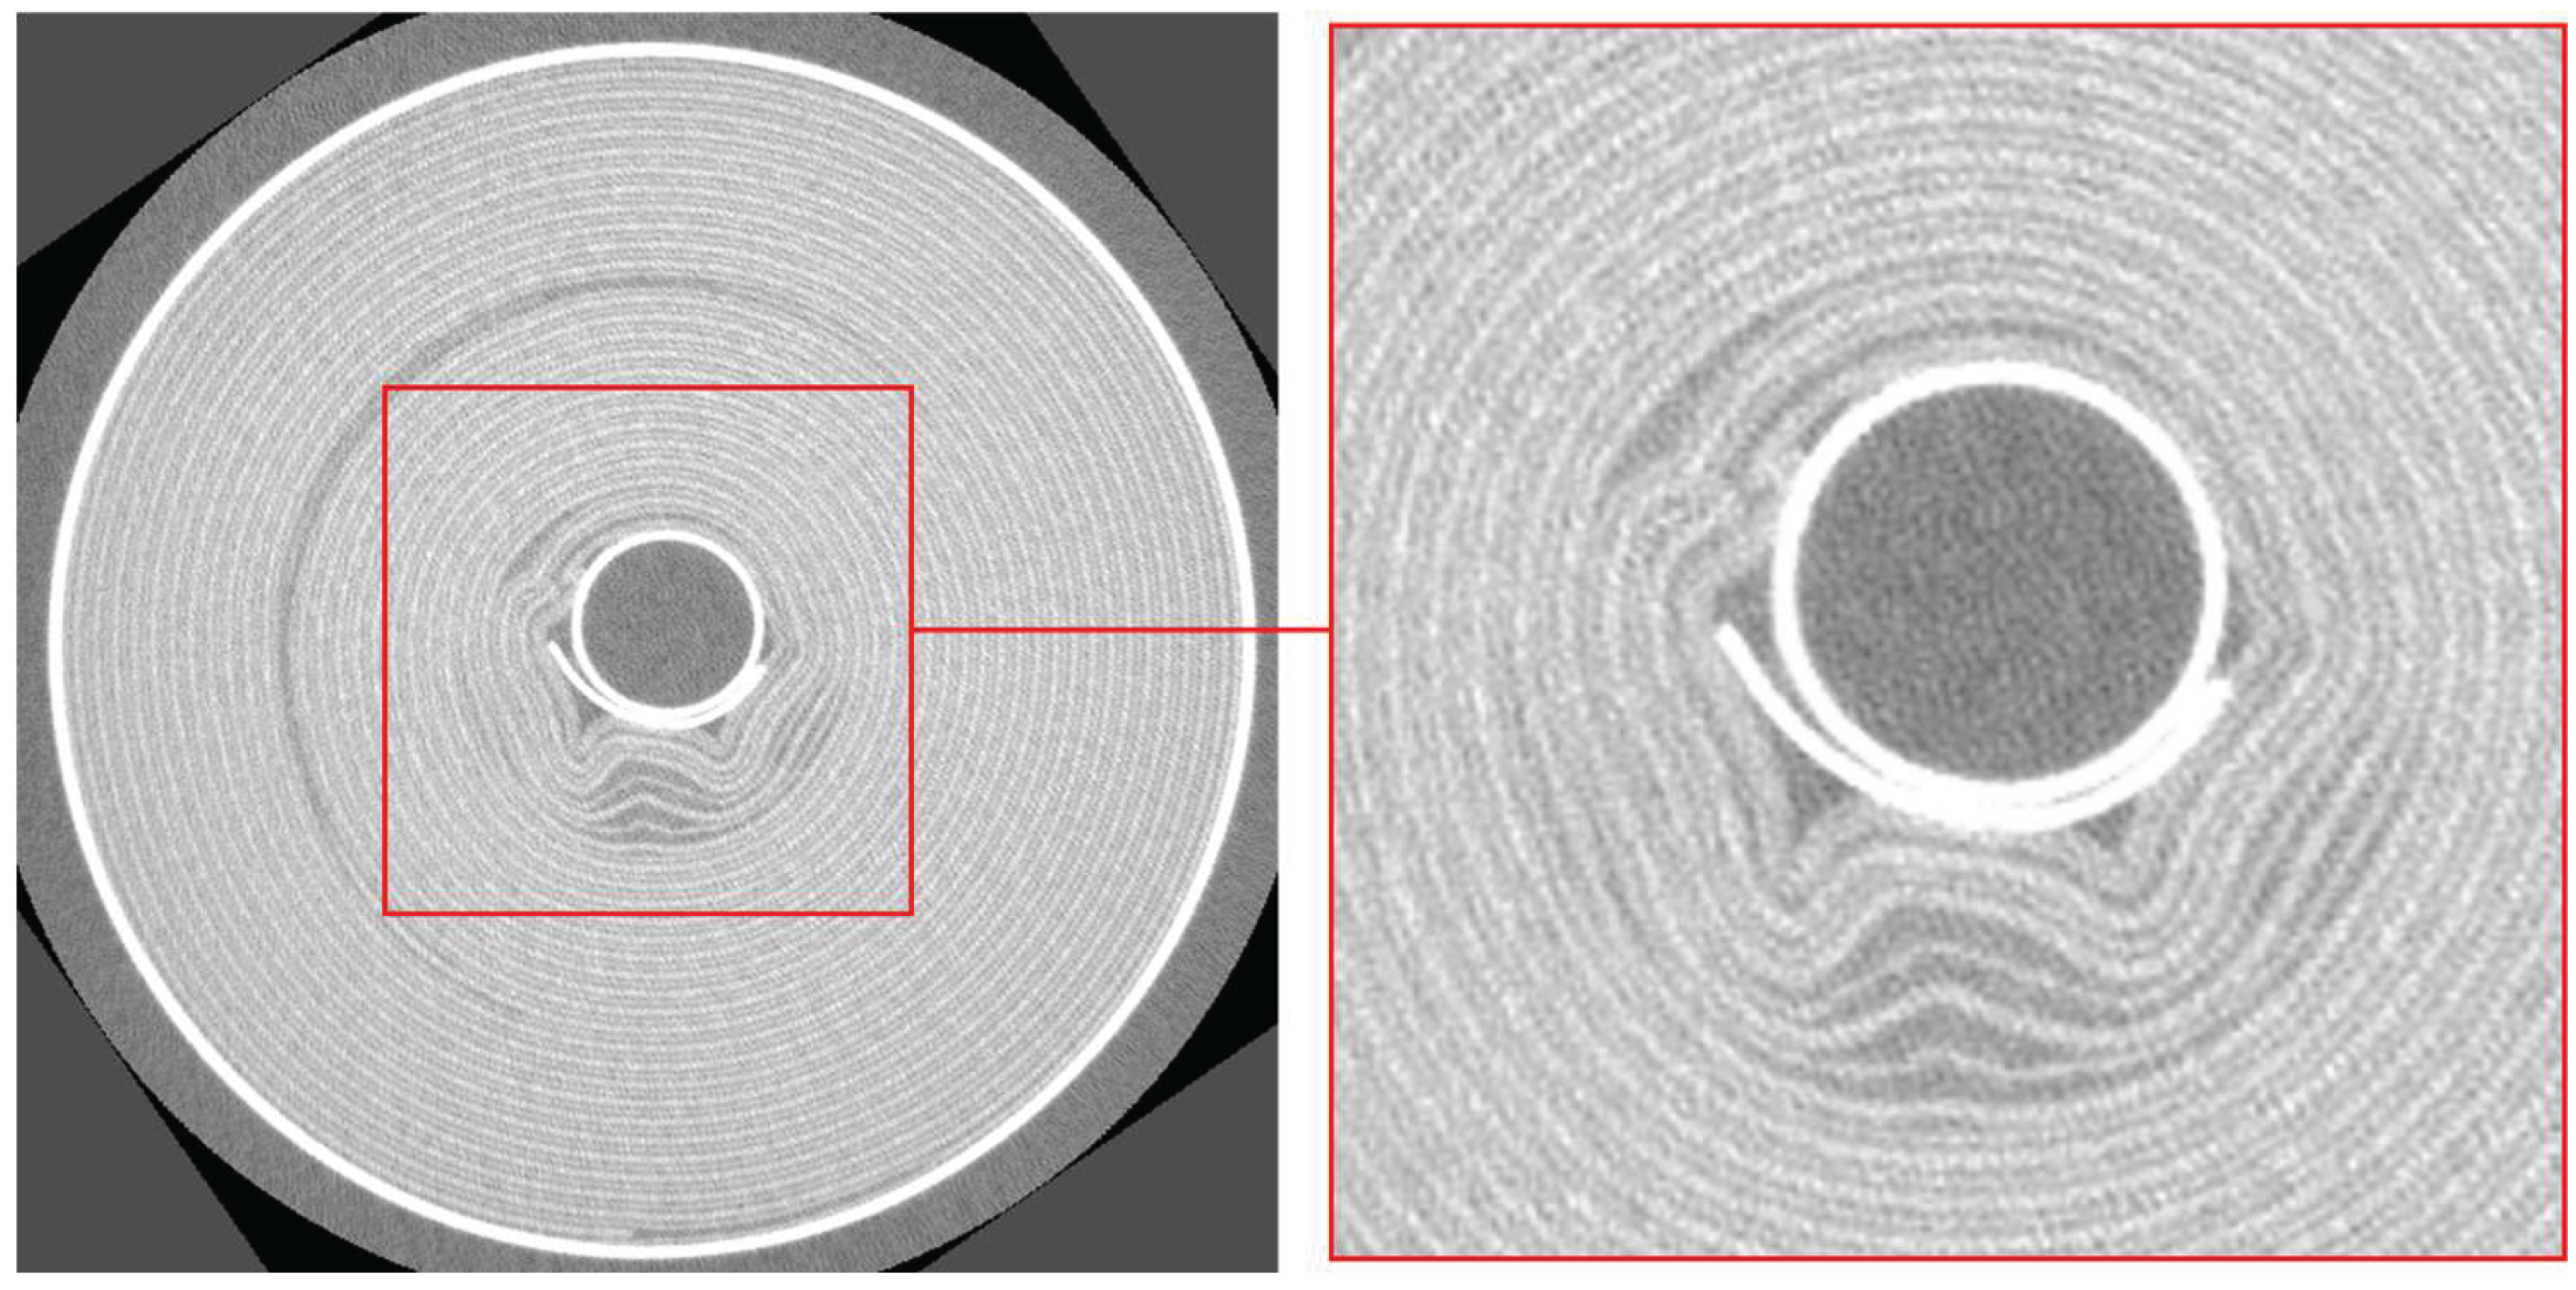
Figure 12.
XZ, YZ and worst delamination (WD) section views of tested NMC battery cell Number 5 (a) before aging and (b) after the aging process.
Figure 12.
XZ, YZ and worst delamination (WD) section views of tested NMC battery cell Number 5 (a) before aging and (b) after the aging process.
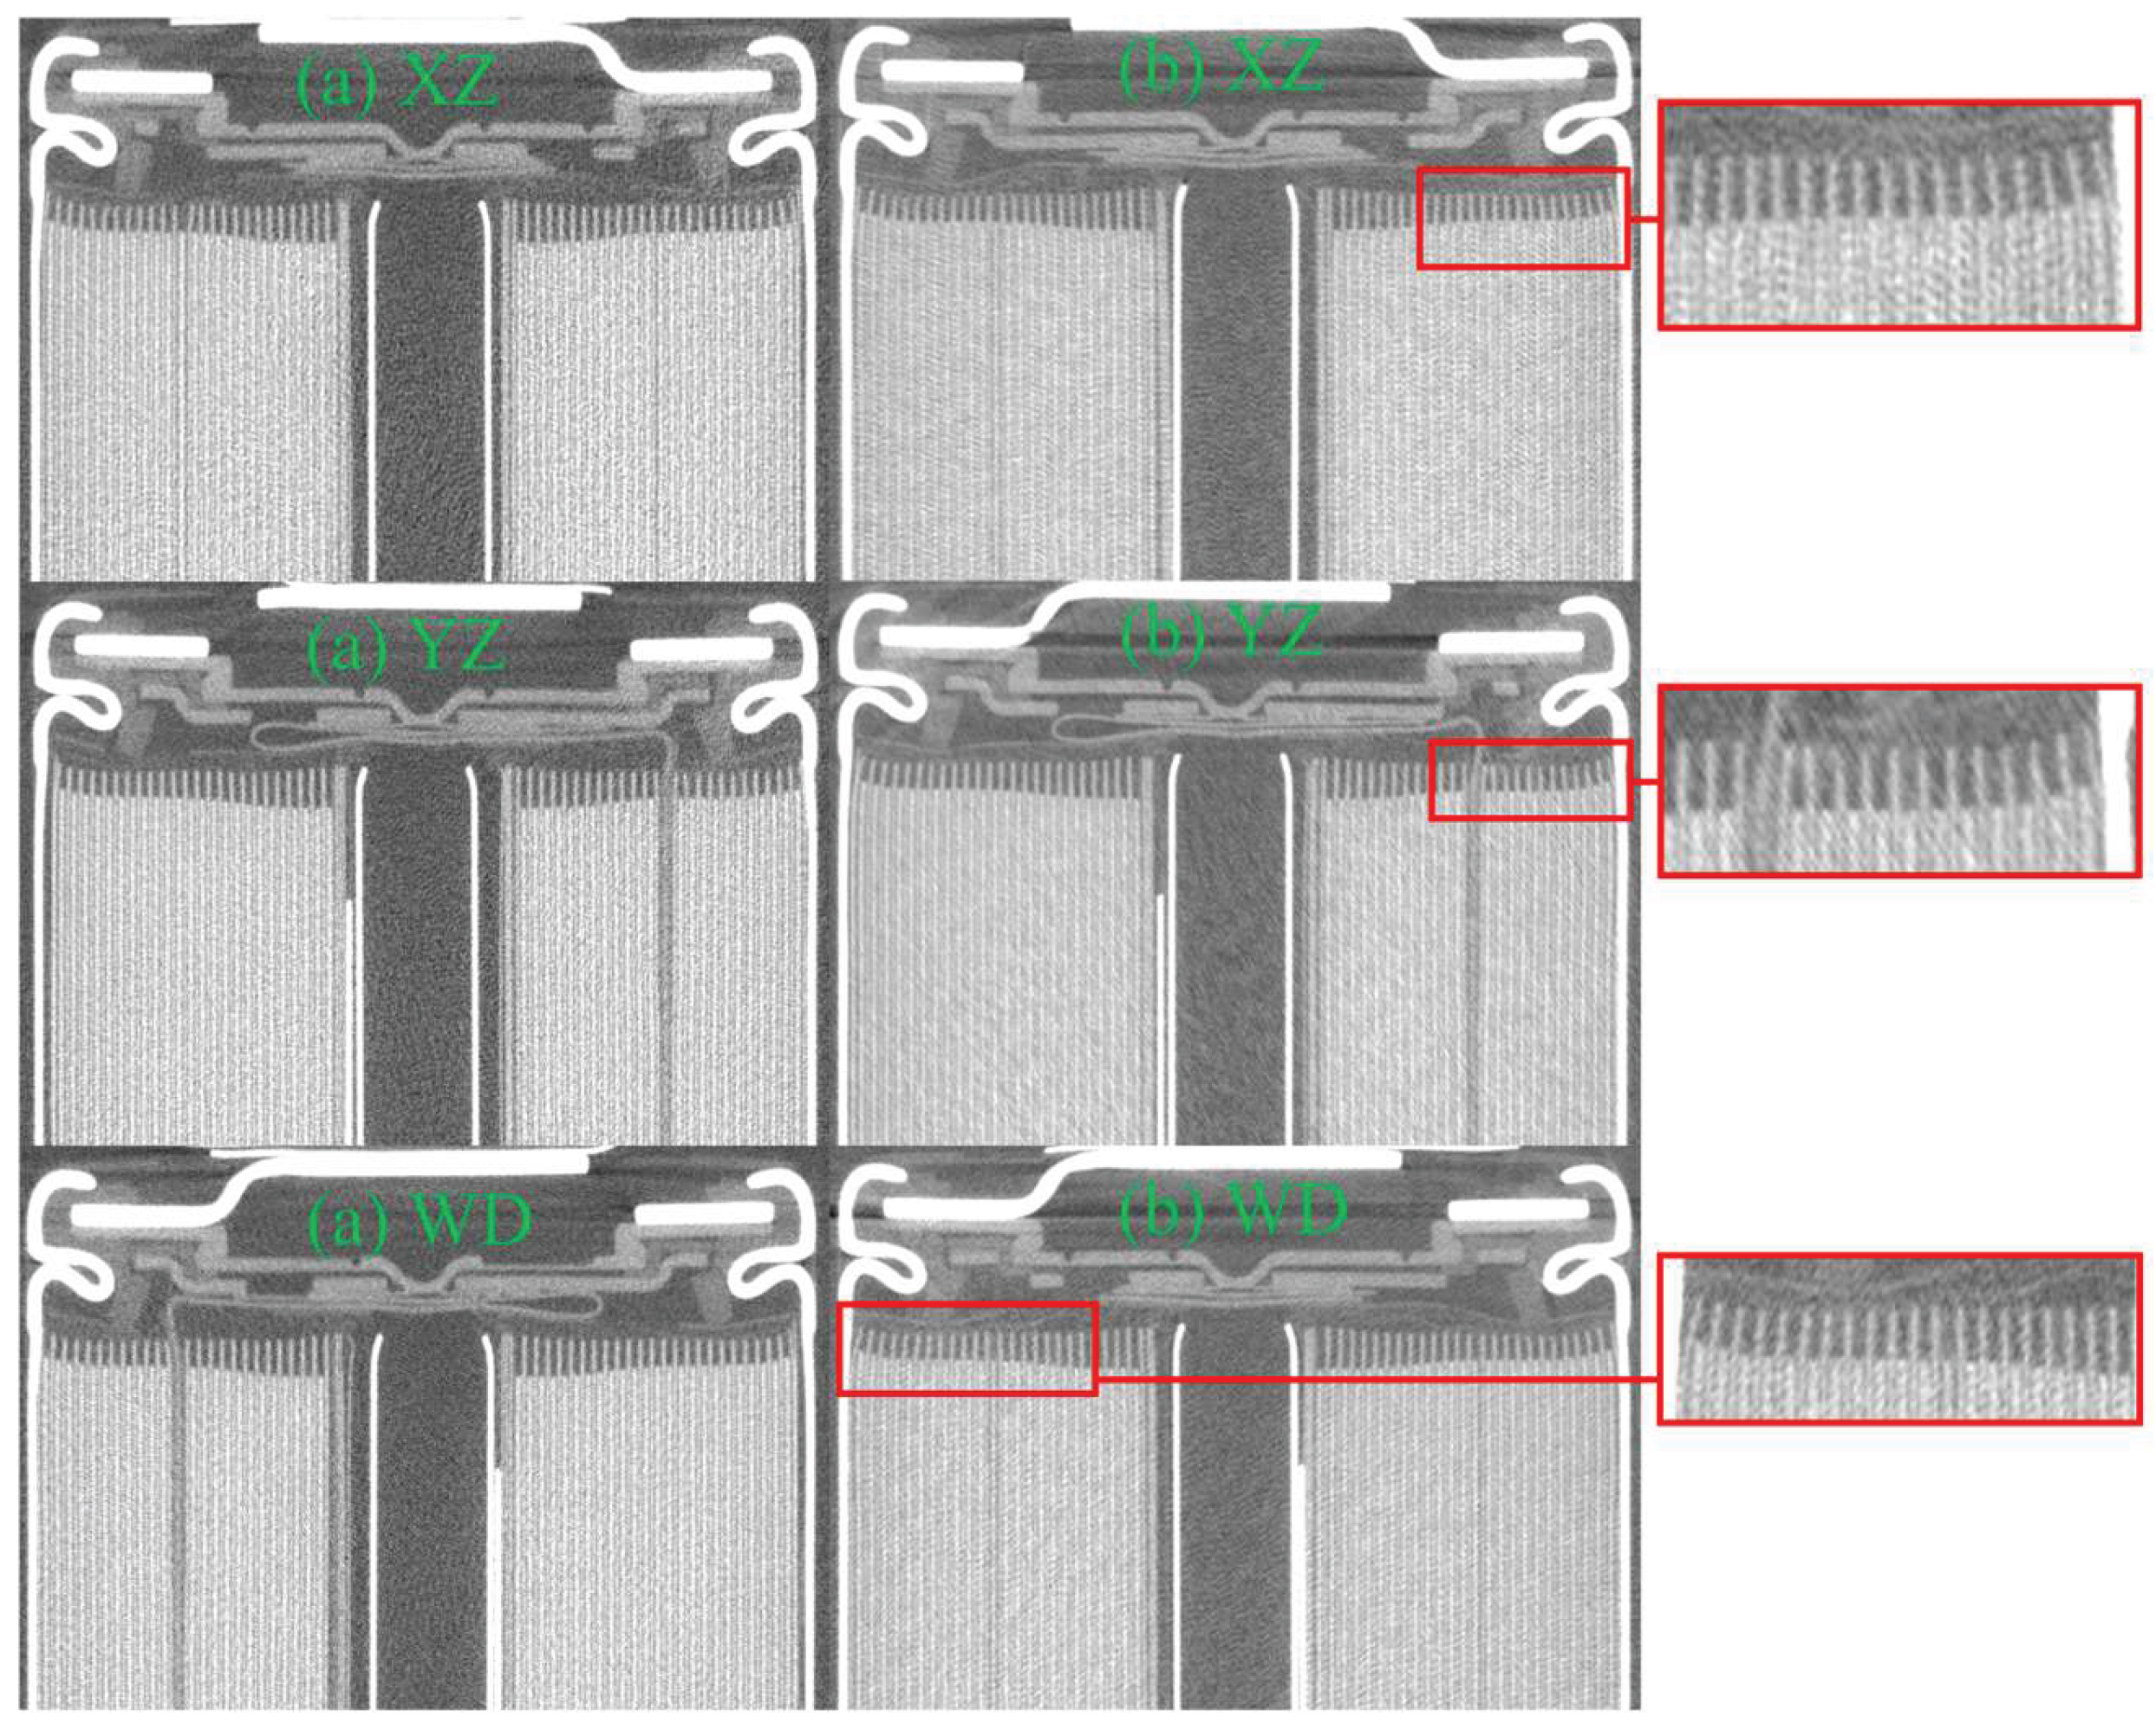
Figure 13.
YX section views of tested NMC battery cell Number 5 (a) before aging at anode overhang, (b) after the aging process at anode overhang, (c) before aging at 12 mm height from the top, (d) after aging at 12 mm height from the top.
Figure 13.
YX section views of tested NMC battery cell Number 5 (a) before aging at anode overhang, (b) after the aging process at anode overhang, (c) before aging at 12 mm height from the top, (d) after aging at 12 mm height from the top.
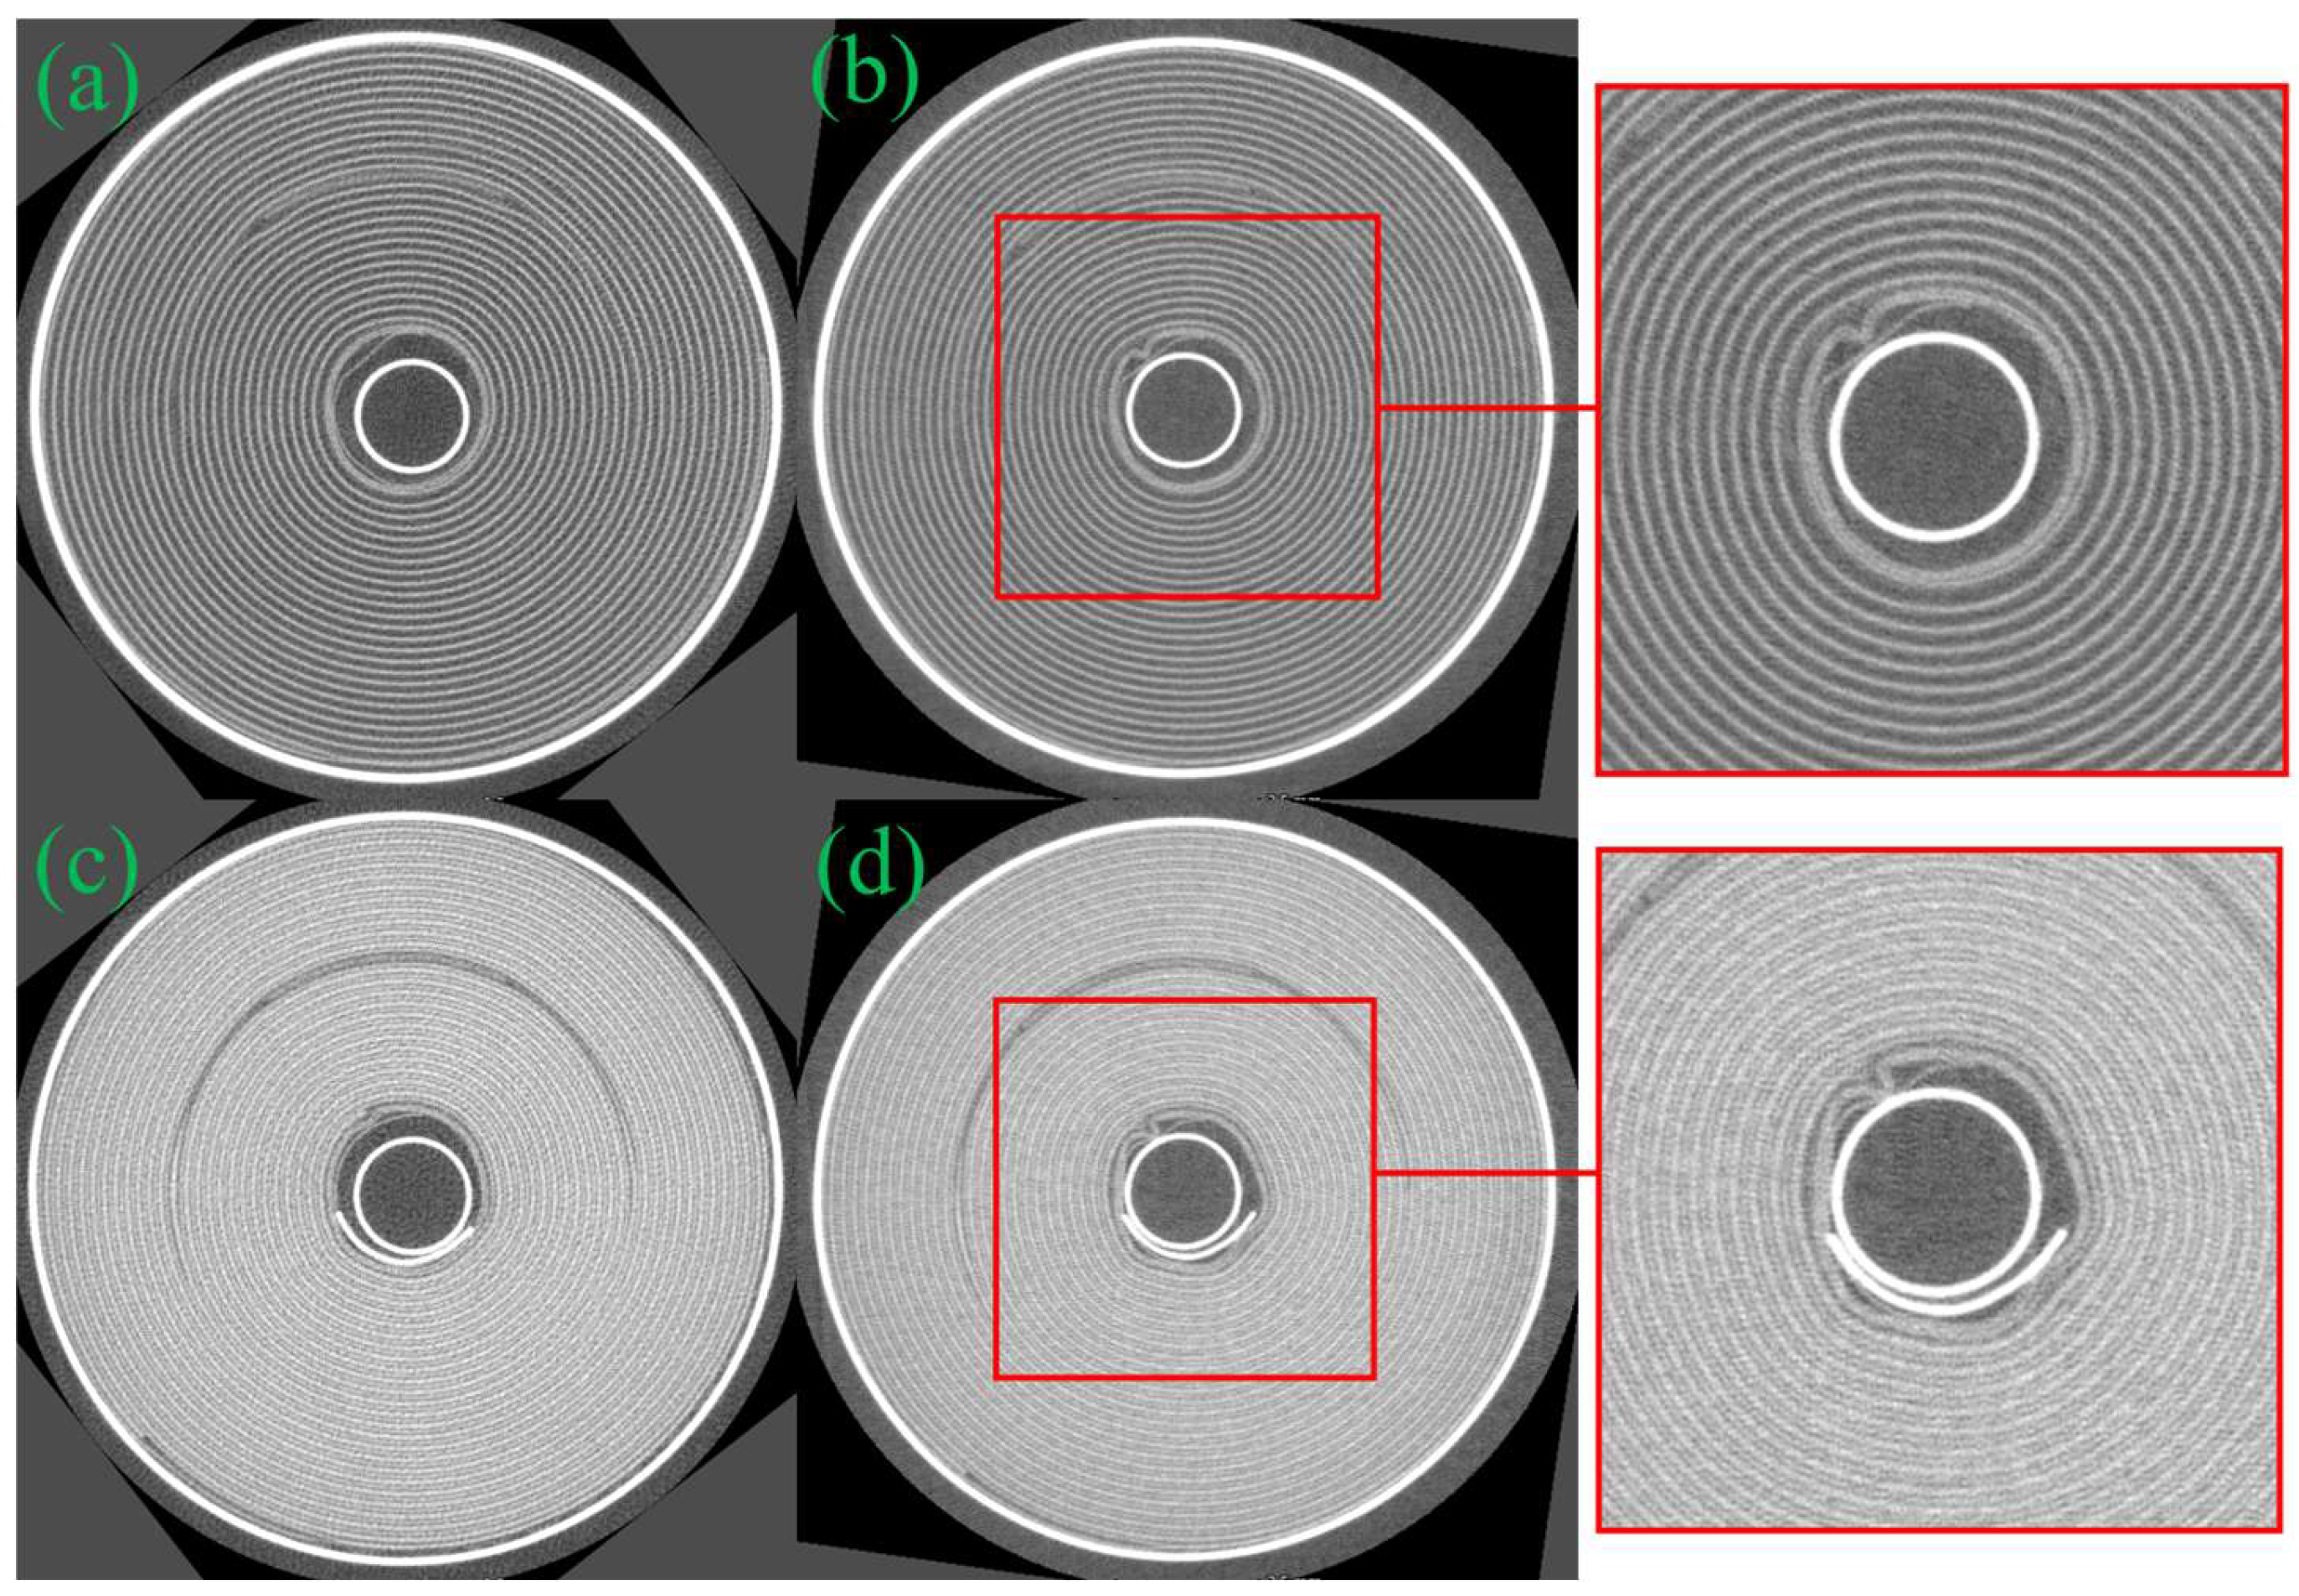
Figure 14.
YX section view of tested NMC battery cell Number 5 after aging at 20 mm height from the top.
Figure 14.
YX section view of tested NMC battery cell Number 5 after aging at 20 mm height from the top.
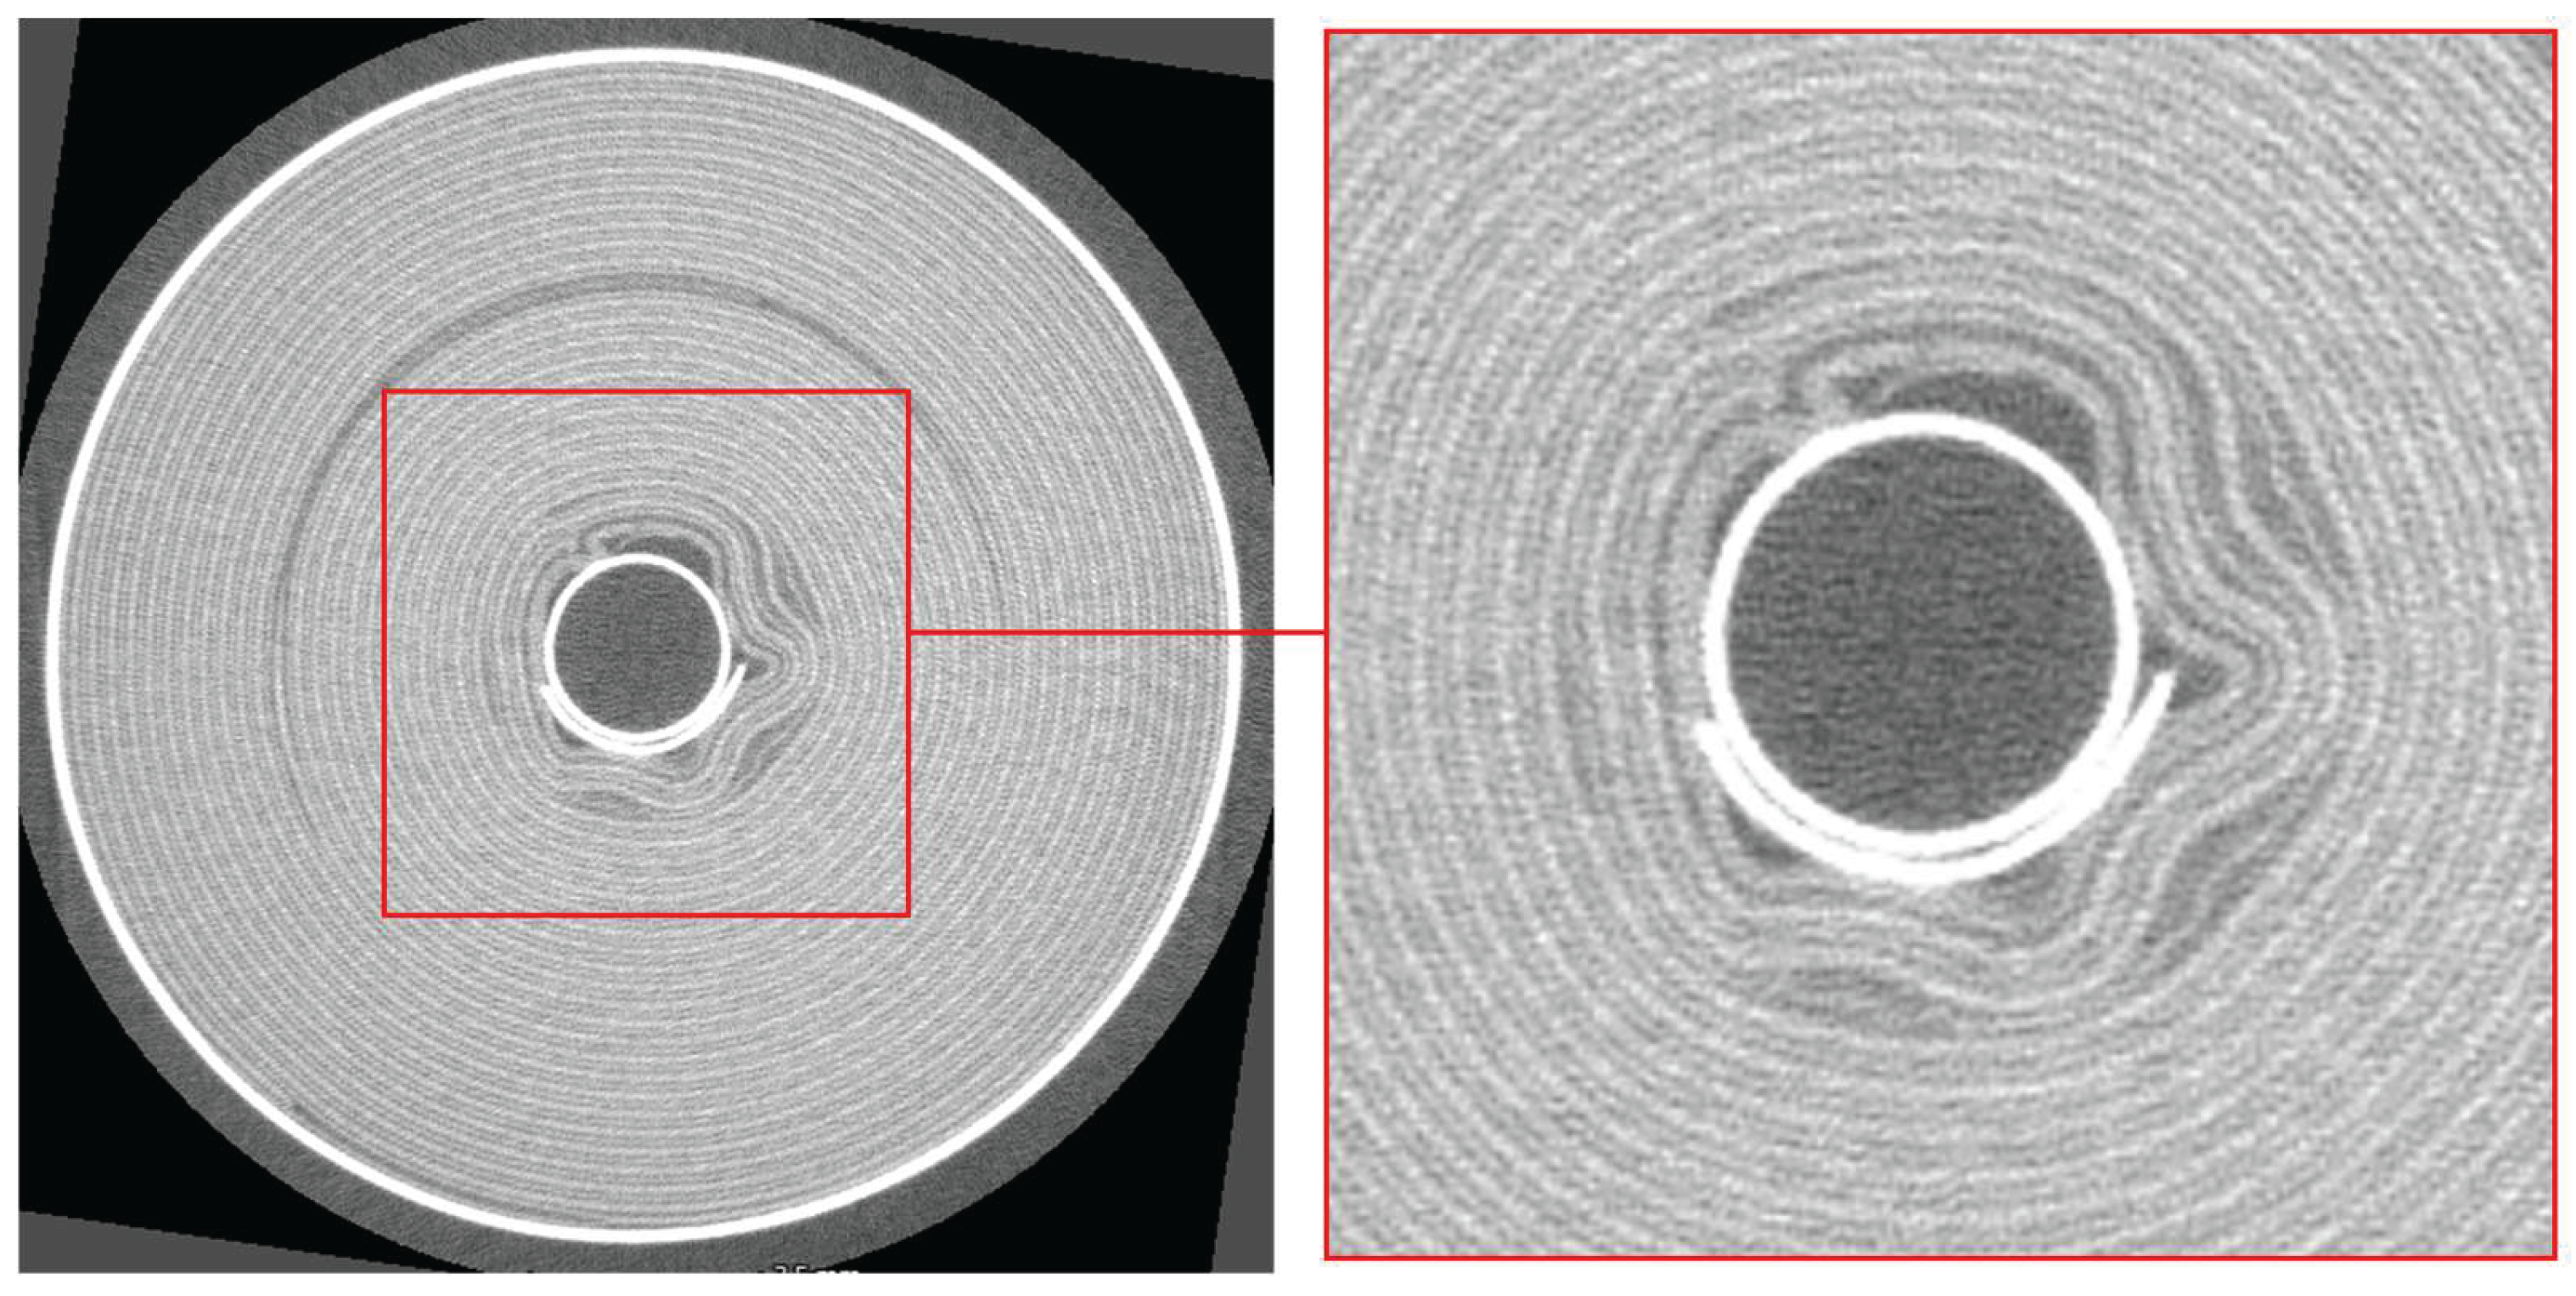
Figure 15.
XZ, YZ and worst delamination (WD) section views of tested NMC battery cell Number 6 (a) before aging and (b) after the aging process.
Figure 15.
XZ, YZ and worst delamination (WD) section views of tested NMC battery cell Number 6 (a) before aging and (b) after the aging process.
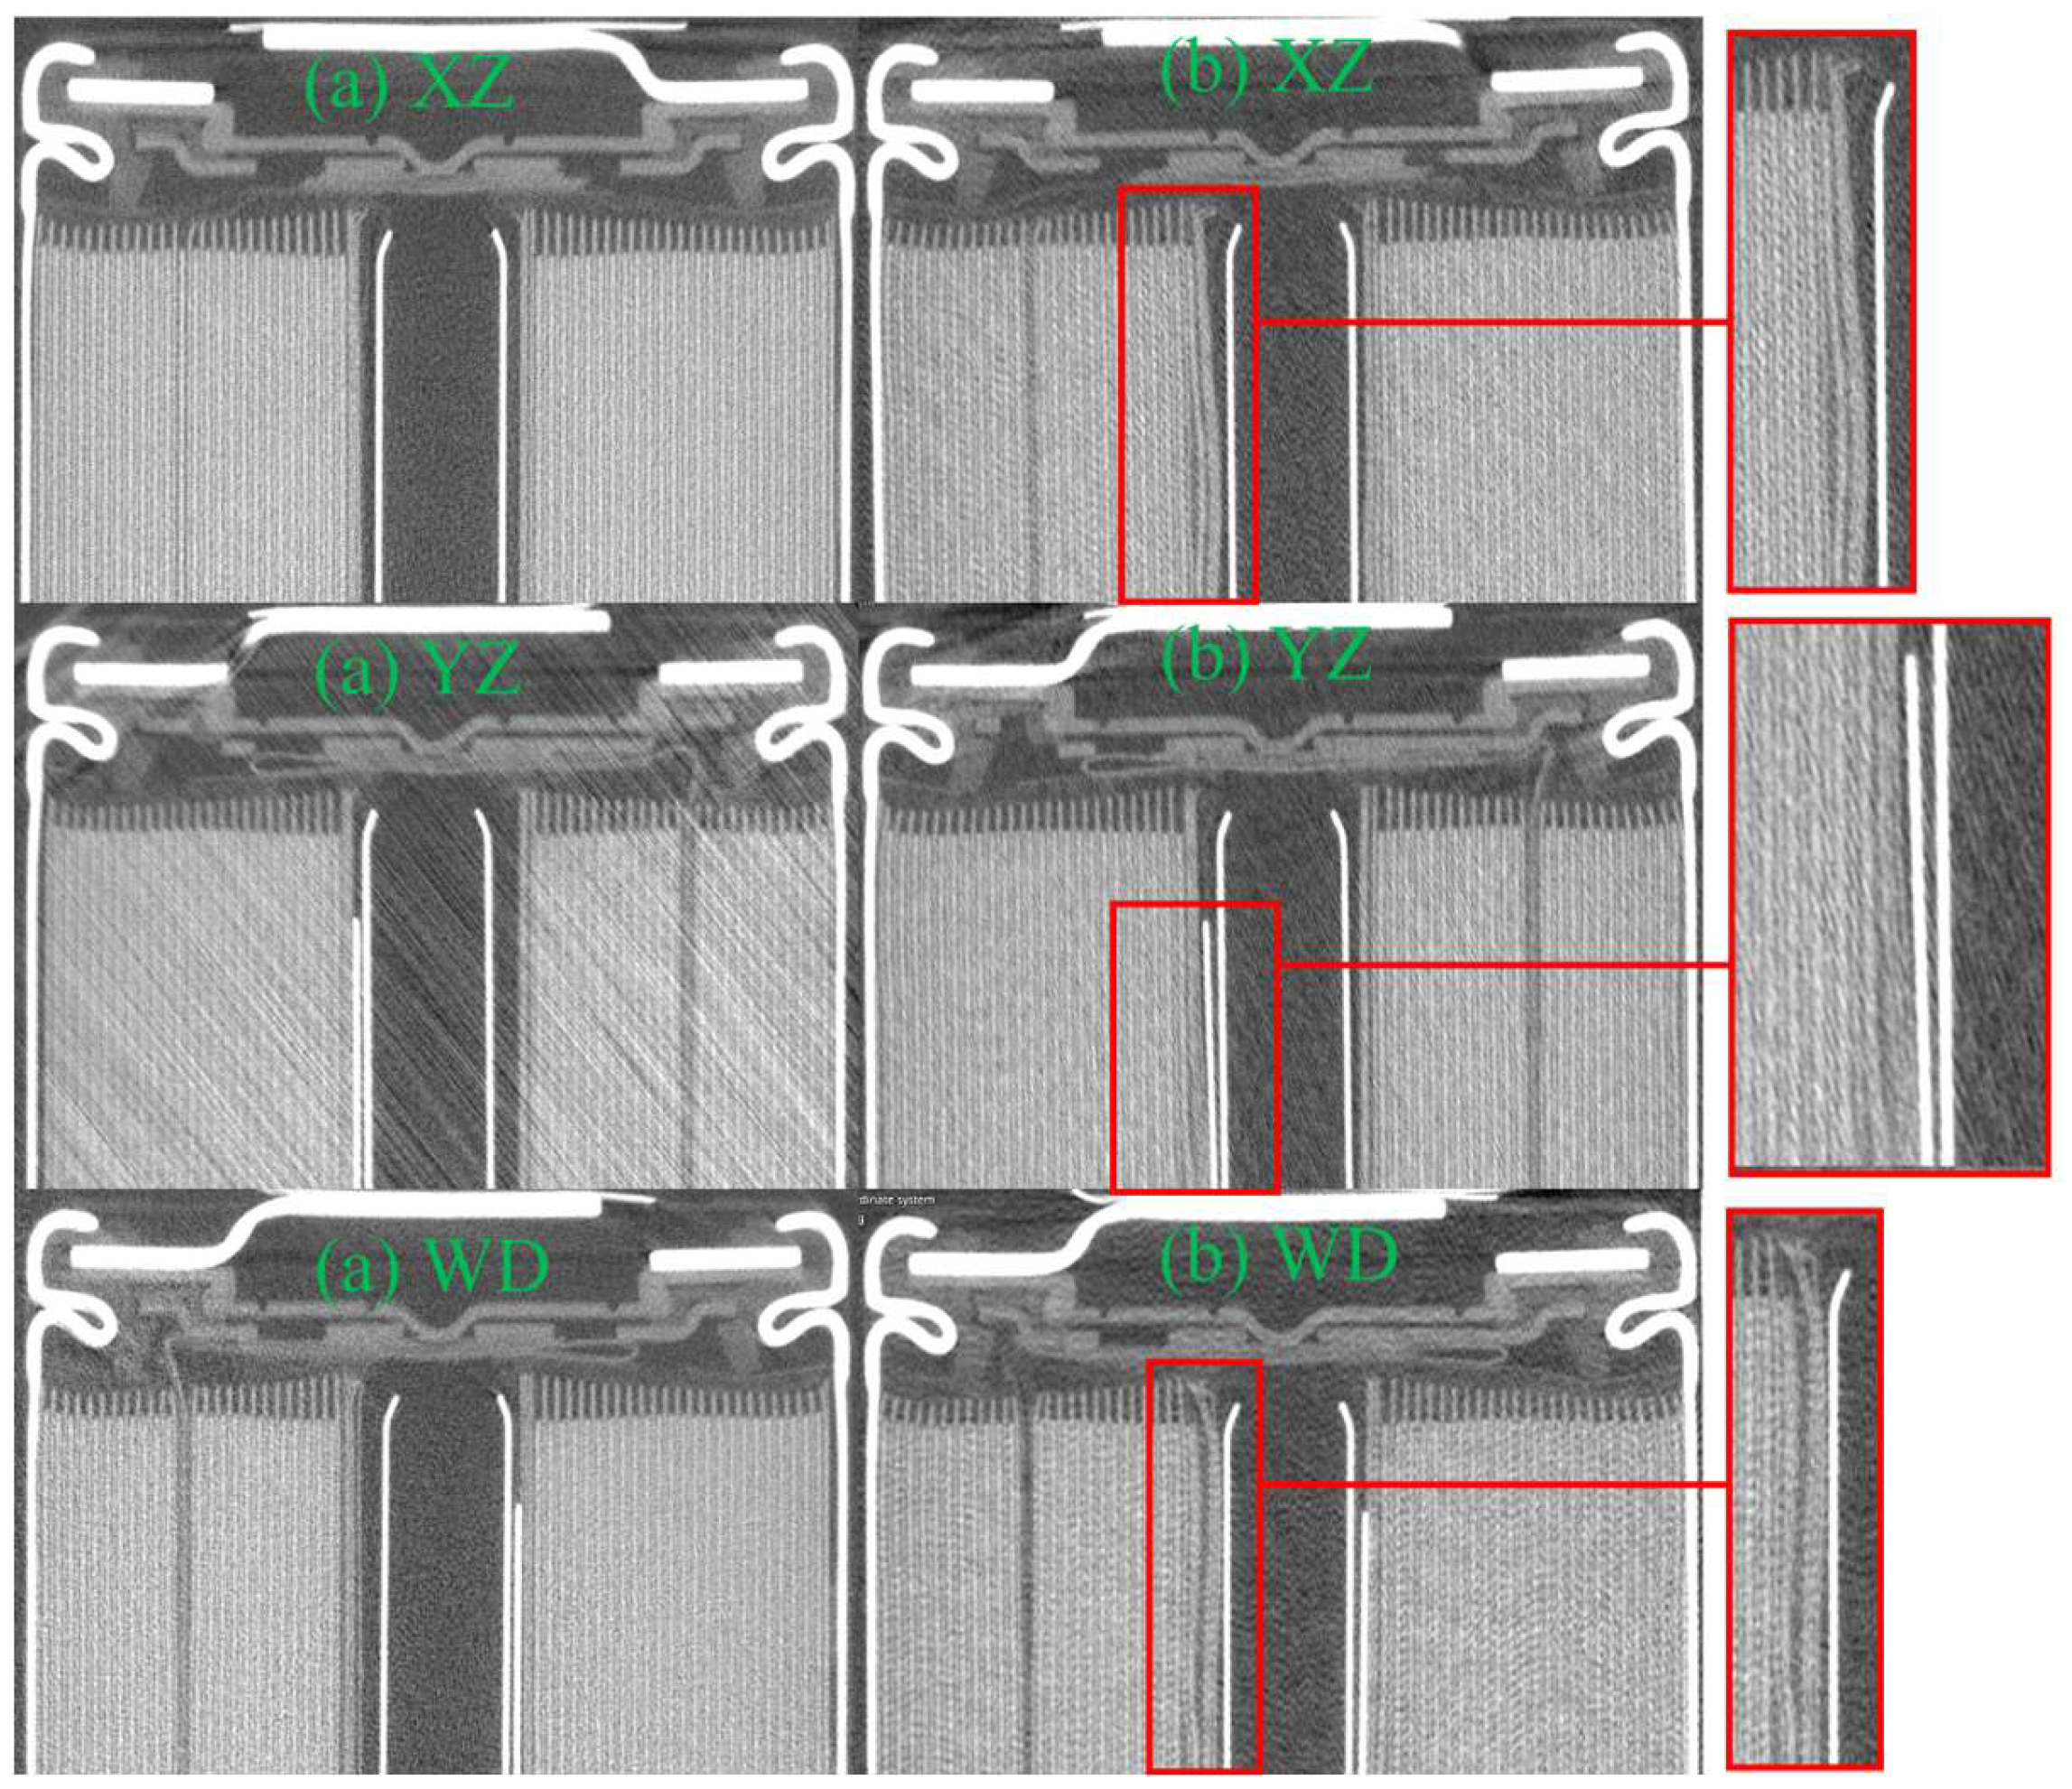
Figure 16.
YX section views of tested NMC battery cell Number 6 (a) before aging at anode overhang, (b) after the aging process at anode overhang, (c) before aging at 12 mm height from the top, (d) after aging at 12 mm height from the top.
Figure 16.
YX section views of tested NMC battery cell Number 6 (a) before aging at anode overhang, (b) after the aging process at anode overhang, (c) before aging at 12 mm height from the top, (d) after aging at 12 mm height from the top.
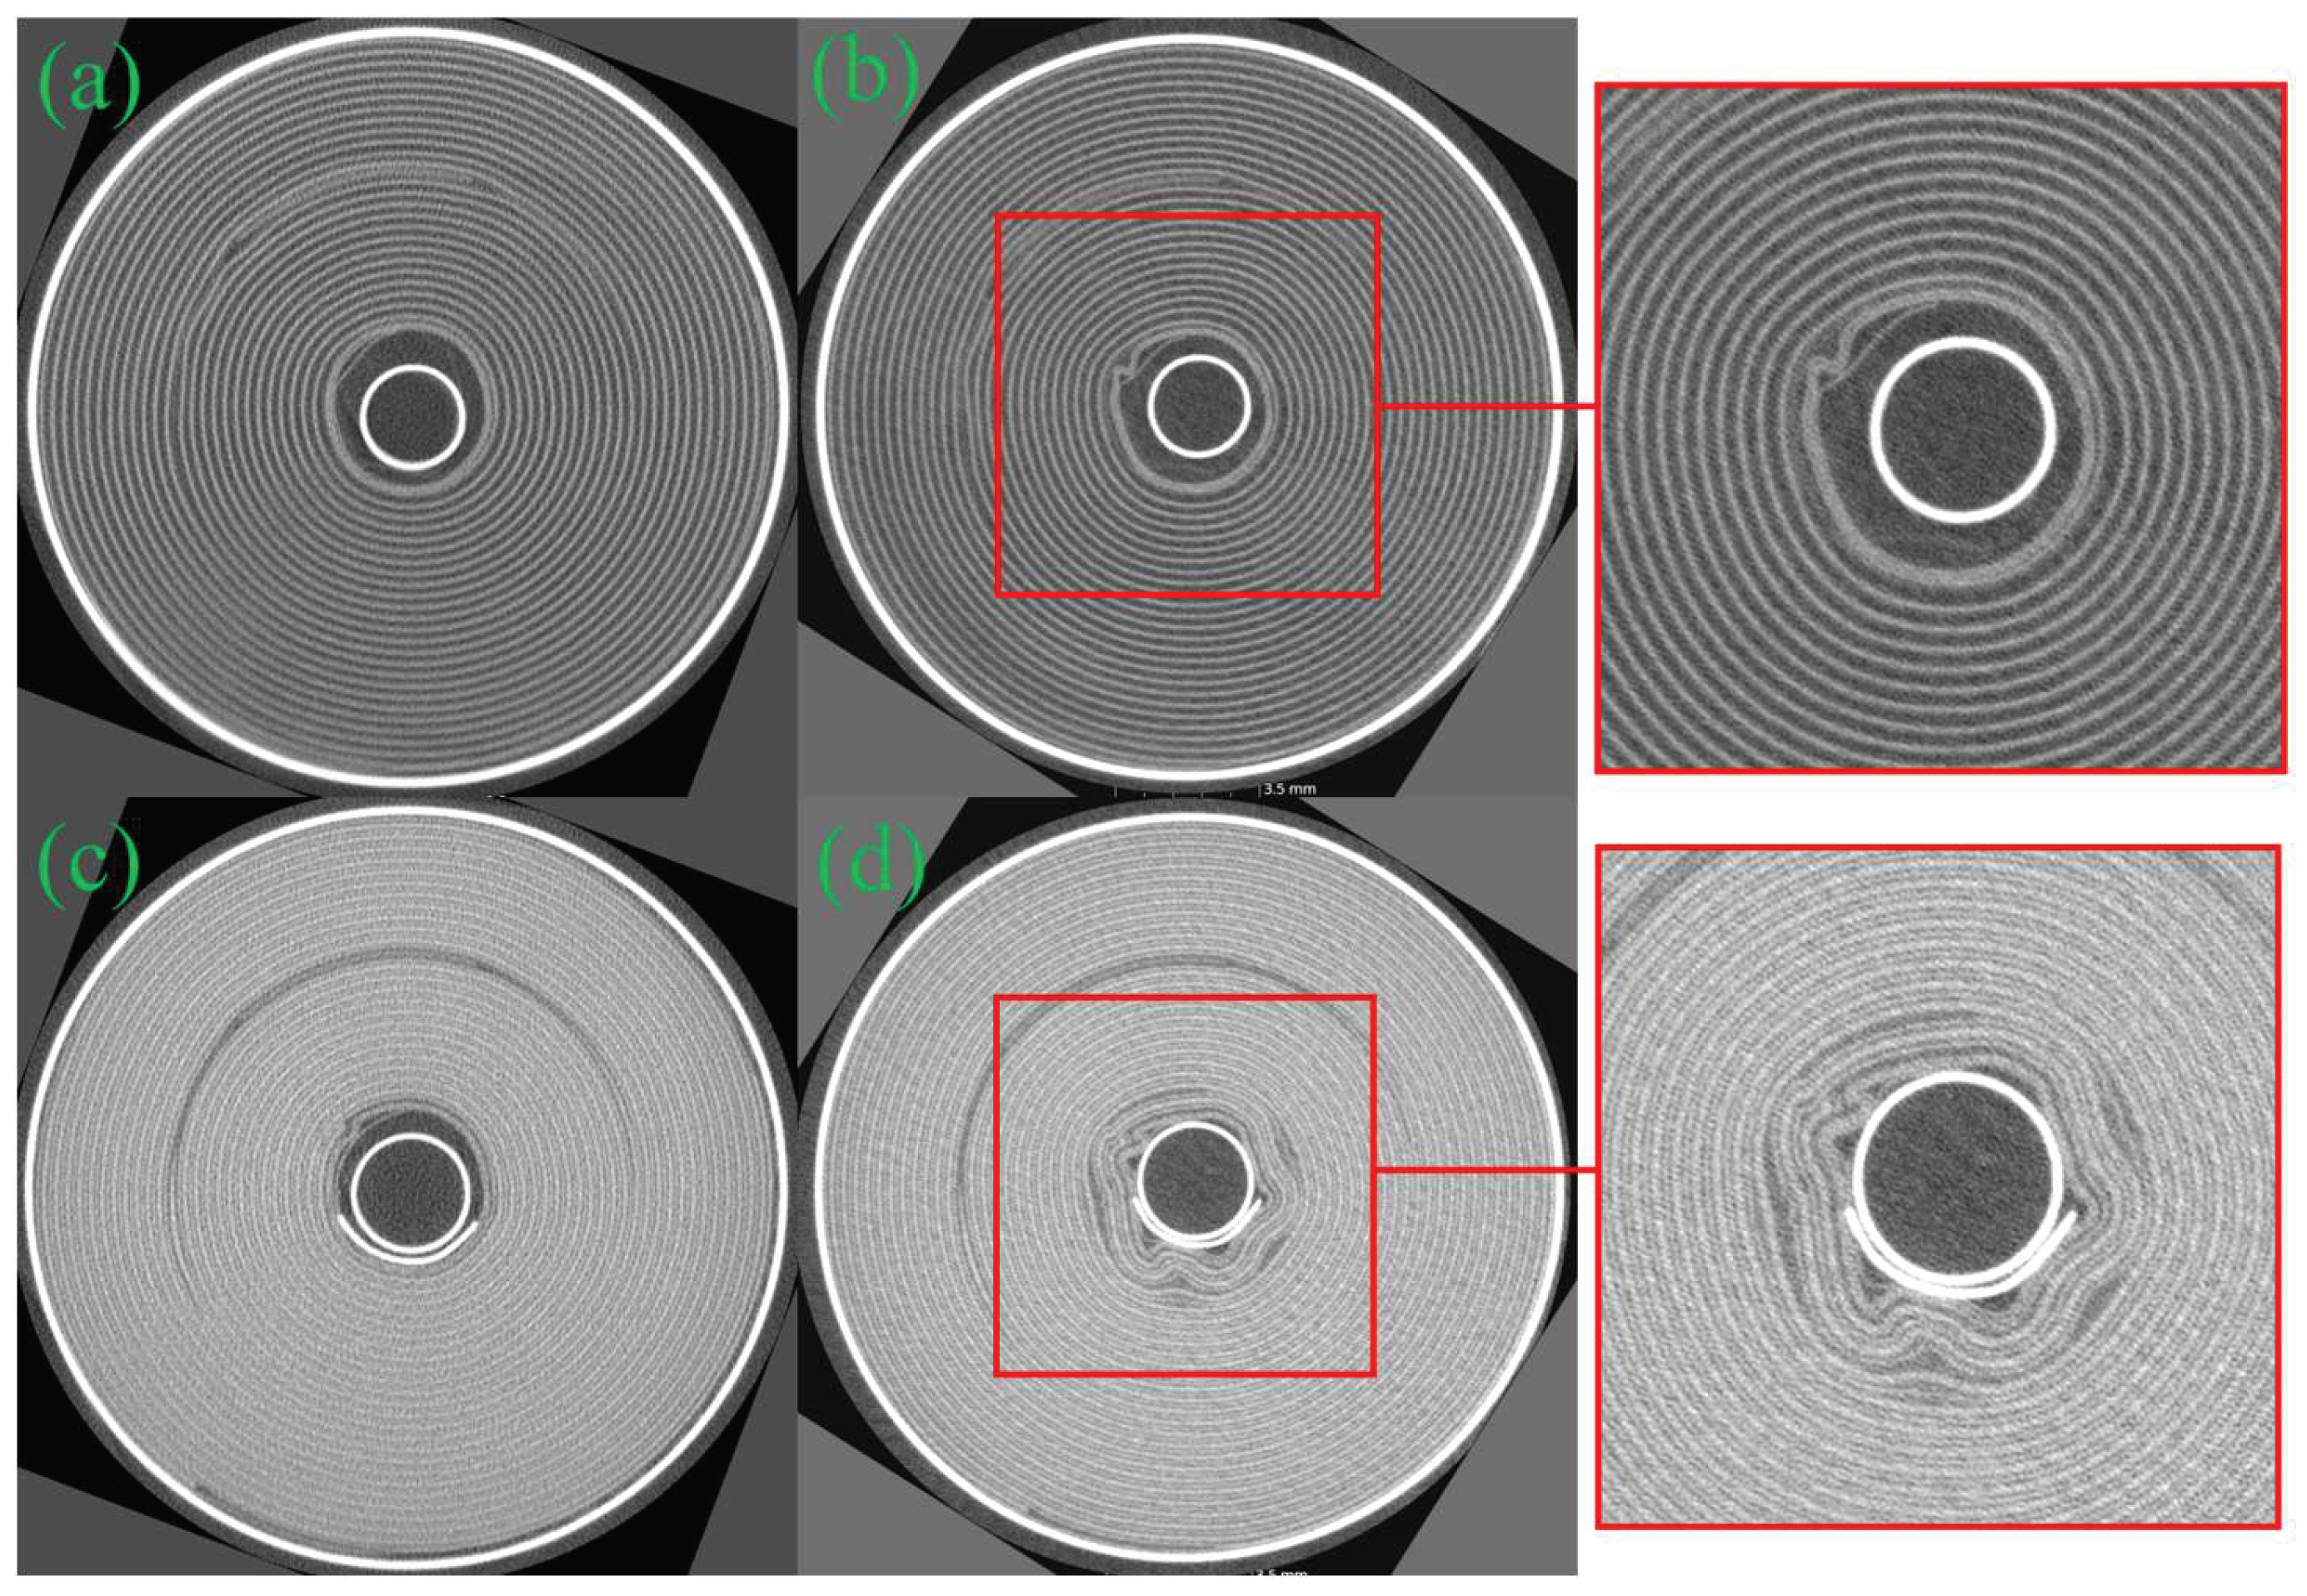

Table 1.
Used lithium battery types and their characteristics.
| Battery | 18650 NMC | 18650 LFP temp |
|---|---|---|
| Nominal capacity, Ah | 2600 | 1800 |
| Nominal voltage, V | 3.6 | 3.2 |
| Voltage range, V | 2.5 to 4.2 | 2.5 to 3.65 |
| Max discharge rate, C | 11 | 3 |
| Nominal mass, g | 44.3 | 42 |
Table 2.
Used lithium battery charge and discharge rates.
| Specimen Number | Battery type | Capacity, Ah | Charge current, A | Charge rate, C | Discharge current, A | Discharge rate, C |
|---|---|---|---|---|---|---|
| 1 | 18650 NMC | 2.6 | 2.6 | 1 | 2.6 | 1 |
| 2 | 18650 NMC | 2.6 | 2.6 | 1 | 5.2 | 2 |
| 3 | 18650 NMC | 2.6 | 2.6 | 1 | 7.8 | 3 |
| 4 | 18650 LFP | 1.8 | 1.8 | 1 | 1.8 | 1 |
| 5 | 18650 LFP | 1.8 | 1.8 | 1 | 3.6 | 2 |
| 6 | 18650 LFP | 1.8 | 1.8 | 1 | 5.4 | 3 |
Table 3.
Lithium battery cells cycle count until 60 % SOC.
| Specimen Number | Battery type | Discharge rate, C | Cycle count | Equivalent full cycle count |
|---|---|---|---|---|
| 1 (0052) | 18650 LFP | 1 | 3754 | 2950 |
| 2 (0054) | 18650 LFP | 2 | 3182 | 2444 |
| 3 (0053) | 18650 LFP | 3 | 588 | 436 |
| 4 (0004) | 18650 NMC | 1 | 4608 | 3612 |
| 5 (0006) | 18650 NMC | 2 | 3483 | 2456 |
| 6 (0005) | 18650 NMC | 3 | 2382 | 1661 |
Table 4.
LFP battery anode overhang before and after degradation.
| Specimen Number | Before aging | After aging | ||
|---|---|---|---|---|
| Highest anode overhang, µm | Lowest anode overhang, µm | Highest anode overhang, µm | Lowest anode overhang, µm | |
| 1 | 120 | 60 | 110 | 50 |
| 2 | 120 | 65 | 105 | 50 |
| 3 | 135 | 75 | 140 | 90 |
Table 5.
LFP battery anode overhang before and after degradation.
| Specimen Number | Before aging | After aging | ||
|---|---|---|---|---|
| Highest anode overhang, µm | Lowest anode overhang, µm | Highest anode overhang, µm | Lowest anode overhang, µm | |
| 4 | 90 | 50 | 100 | 55 |
| 5 | 95 | 50 | 95 | 55 |
| 6 | 100 | 50 | 95 | 50 |
Table 6.
Acquired LFP and NMC degradation data.
| Specimen Number | Delamination layer count at anode overhang | Delamination layer count at 12 mm height | Delamination layer count at 20 mm height | Anode overhand region deformation | Jelly-roll swelling |
|---|---|---|---|---|---|
| 1 | 6 | 7 | Unknown | Minor | Major |
| 2 | 7 | 11 | Unknown | Minor | Major |
| 3 | 0 | 1 | Unknown | Major | Minor |
| 4 | 0 | 2 | 5 | Major | Major |
| 5 | 1 | 2 | 4 | Major | Major |
| 6 | 1 | 3 | Unknown | Major | Major |
Disclaimer/Publisher’s Note: The statements, opinions and data contained in all publications are solely those of the individual author(s) and contributor(s) and not of MDPI and/or the editor(s). MDPI and/or the editor(s) disclaim responsibility for any injury to people or property resulting from any ideas, methods, instructions or products referred to in the content. |
© 2026 by the authors. Licensee MDPI, Basel, Switzerland. This article is an open access article distributed under the terms and conditions of the Creative Commons Attribution (CC BY) license (http://creativecommons.org/licenses/by/4.0/).
Copyright: This open access article is published under a Creative Commons CC BY 4.0 license, which permit the free download, distribution, and reuse, provided that the author and preprint are cited in any reuse.


