
Submitted:
29 May 2026
Posted:
29 May 2026
You are already at the latest version
Abstract
Agricultural drought represents a critical global environmental challenge that directly jeopardizes food security. Monitoring agricultural drought is essential for effective agricultural planning and robust water resource management. This study rigorously analyzed monthly precipitation (mm) and maximum and minimum temperatures (°C) from 14 grid points derived from the ERA5-Land dataset of the European Centre for Medium-Range Weather Forecasts (ECMWF), covering the period from 1981 to 2025. The Standardized Precipitation Evapotranspiration Index (SPEI) at a six-month time scale (SPEI-6) was calculated, and the Mann–Kendall test was employed to identify trends. The findings indicate that each grid point experiences varying intensities of drought. G4 stands out as the grid point with the highest drought events, followed closely by G7, G8, G1, G3, G5, G13, and G14 grid points. In stark contrast, G11, G12, G9, G6, G10, and G2 grid points reported the fewest events. The Mann–Kendall test results confirm that only one grid point (G14) exhibits a statistically insignificant decreasing trend (p>0.05). Conversely, 93% of the grid points reveal a statistically significant decreasing trend in the SPEI values, pointing to the fact that agricultural droughts are expected soon in these areas. These findings establish a strong foundation for future research on drought prediction and provide critical insights for effective decision-making in drought risk management. By highlighting the significant temporal and spatial variability in agricultural drought across Mpumalanga Province, this research decisively supports the development of adaptive strategies and policies necessary for managing these conditions effectively.
Keywords:
agricultural drought
; SPEI
; frequency
; intensity
; Mann-Kendall test
1. Introduction
Drought, a pressing global issue, significantly impacts food production, water availability, and economic stability. Despite the lack of a universally accepted definition, it is most clearly understood as a period of arid weather caused by insufficient precipitation, leading to a significant imbalance in water supply and causing moisture deficiency that affects human activity and environmental processes [1]. Changes in precipitation, river flows, groundwater levels, and soil moisture often lead to the interpretation of this natural hazard as a shift in weather and climate [2]. It can be classified as meteorological, hydrological, agricultural, and socioeconomic, each type with distinct impacts and durations [3,4,5,6].
Apurv et al. [7] highlighted that multiple droughts are driven by a combination of reduced precipitation and higher evaporation rates, affecting the entire water cycle. Meteorological drought happens when there is an extended period of minimal to no rainfall in a region [8,9]. Agricultural drought occurs when soil moisture decreases due to increased atmospheric dryness, which results from extended precipitation deficits and rising temperatures [10]. According to Bhardwaj et al. [11], hydrological drought happens when underground water levels decline due to high demand for water that is not adequately supplied. Additionally, socio-economic drought occurs when there is a water shortage for people [12]. A recent paper by
Crausbay et al. [13] argues that ecological drought should be classified as the fifth type of drought. It happens when there is a shortage of water for ecosystems, and this severe lack of water affects the ecosystems’ services and causes harm to both nature and humans. Additionally, Otkin et al. [14] highlight another type of drought called flash drought, characterized by a short-term, severe drought with a rapid onset and involving specific processes.
Droughts are natural phenomena that occur slowly and in complex ways. Droughts have become more prevalent and severe in recent years, primarily due to ongoing climate change caused by humans and natural phenomena like El Niño [15,16,17,18]. The impacts of drought differ significantly across regions, with distinct spatial and temporal patterns. For example, in Pakistan from 1999 to 2002, drought affected 3.3 million people, primarily in Pakistan’s Sindh and Baluchistan provinces, and caused many deaths from starvation [19]. In Namibia in 2019, drought affected more than 500,000 people, and more than 60,000 animals died from drought [20]. The situation is similar in Zimbabwe; the 2018-2019 drought resulted in low crop harvests and livestock losses [21].
In South Africa, a recent study conducted by Diko [22] found that in 2016/17, maize production in Free State Province declined from 7.3 million tons to 5.2 million tons in 2017/18 and further to 4 million tons in 2018/19. Similar declines were observed in the Mpumalanga Province, from 3.4 million tons to 2.8 million tons to 2.6 million tons, and in Northwest Province, from 3.1 million tons to 2 million tons and then to 1.6 million tons due to drought. In Mpakeni, Mpumalanga Province, farmers mention that they had to sell their livestock at low prices because they could not afford to feed them due to the drought that hit them in 2015 and 2017 [23]. Furthermore, drought does not affect food security and the agricultural sector only; it also hinders us from achieving the 2030 Sustainable Development Goals (SDGs), such as SDG 1 (No poverty), SDG 2 (Zero hunger), and SDG 3 (Good health and well-being) [24]. Therefore, these highlight the crucial need to monitor agricultural drought for water management and drought mitigation strategies.
Preventative measures and monitoring can minimize agricultural drought impacts if detected early. Several indices are employed to monitor agricultural drought, including the Standardized Soil Moisture Index (SSMI) [25], Crop Moisture Index (CMI) [26], and Vegetation Condition Index (VCI) [27]. However, due to data limitations in the region, this study used a meteorological drought index, which is the Standardized Precipitation Evapotranspiration Index (SPEI), to assess agricultural drought. The SPEI was proposed to improve the Standardized Precipitation index (SPI) by Vicente-Serrano et al. [28]. It’s a multi-scalar index that offers a flexible way to characterise the combined effects of precipitation and evaporative demand on droughts [29,30].
Numerous studies have used the SPEI to monitor agricultural drought because it incorporates evapotranspiration (ET), an essential component of the agricultural water budget, making it a suitable index for assessing agricultural drought [31]. The effectiveness of SPEI in identifying agricultural drought was confirmed by studies conducted in Pakistan [32], Argentina [33], the South-Central United States [34], and Southwest China [35]. Since the SPEI can be calculated over time scales ranging from 1 to 48 months, it is used to assess different types of droughts, especially in regions with limited data, such as Mpumalanga Province. The SPEI follows the SPI guidelines, indicating that agricultural drought can be detected at 6-month timescales (SPEI6) [36]. Additionally, several scholars, Parsons et al. [37], and Tian et al. [38], demonstrated that the 6-month timescale (SPEI6) is particularly effective for evaluating agricultural drought.
Due to the reasons that are provided above, this study computed the SPEI at a 6-month timescale (SPEI6) to evaluate agricultural drought from 1981 to 2025. This study is of paramount importance as it provides the occurrence, frequency, intensity, trends, and spatial patterns of agricultural drought in Mpumalanga Province. It offers crucial insights into how agricultural droughts develop and evolve over time, providing valuable information for more effective water management and drought prevention.
2. Materials and Methods
2.1. Study Area
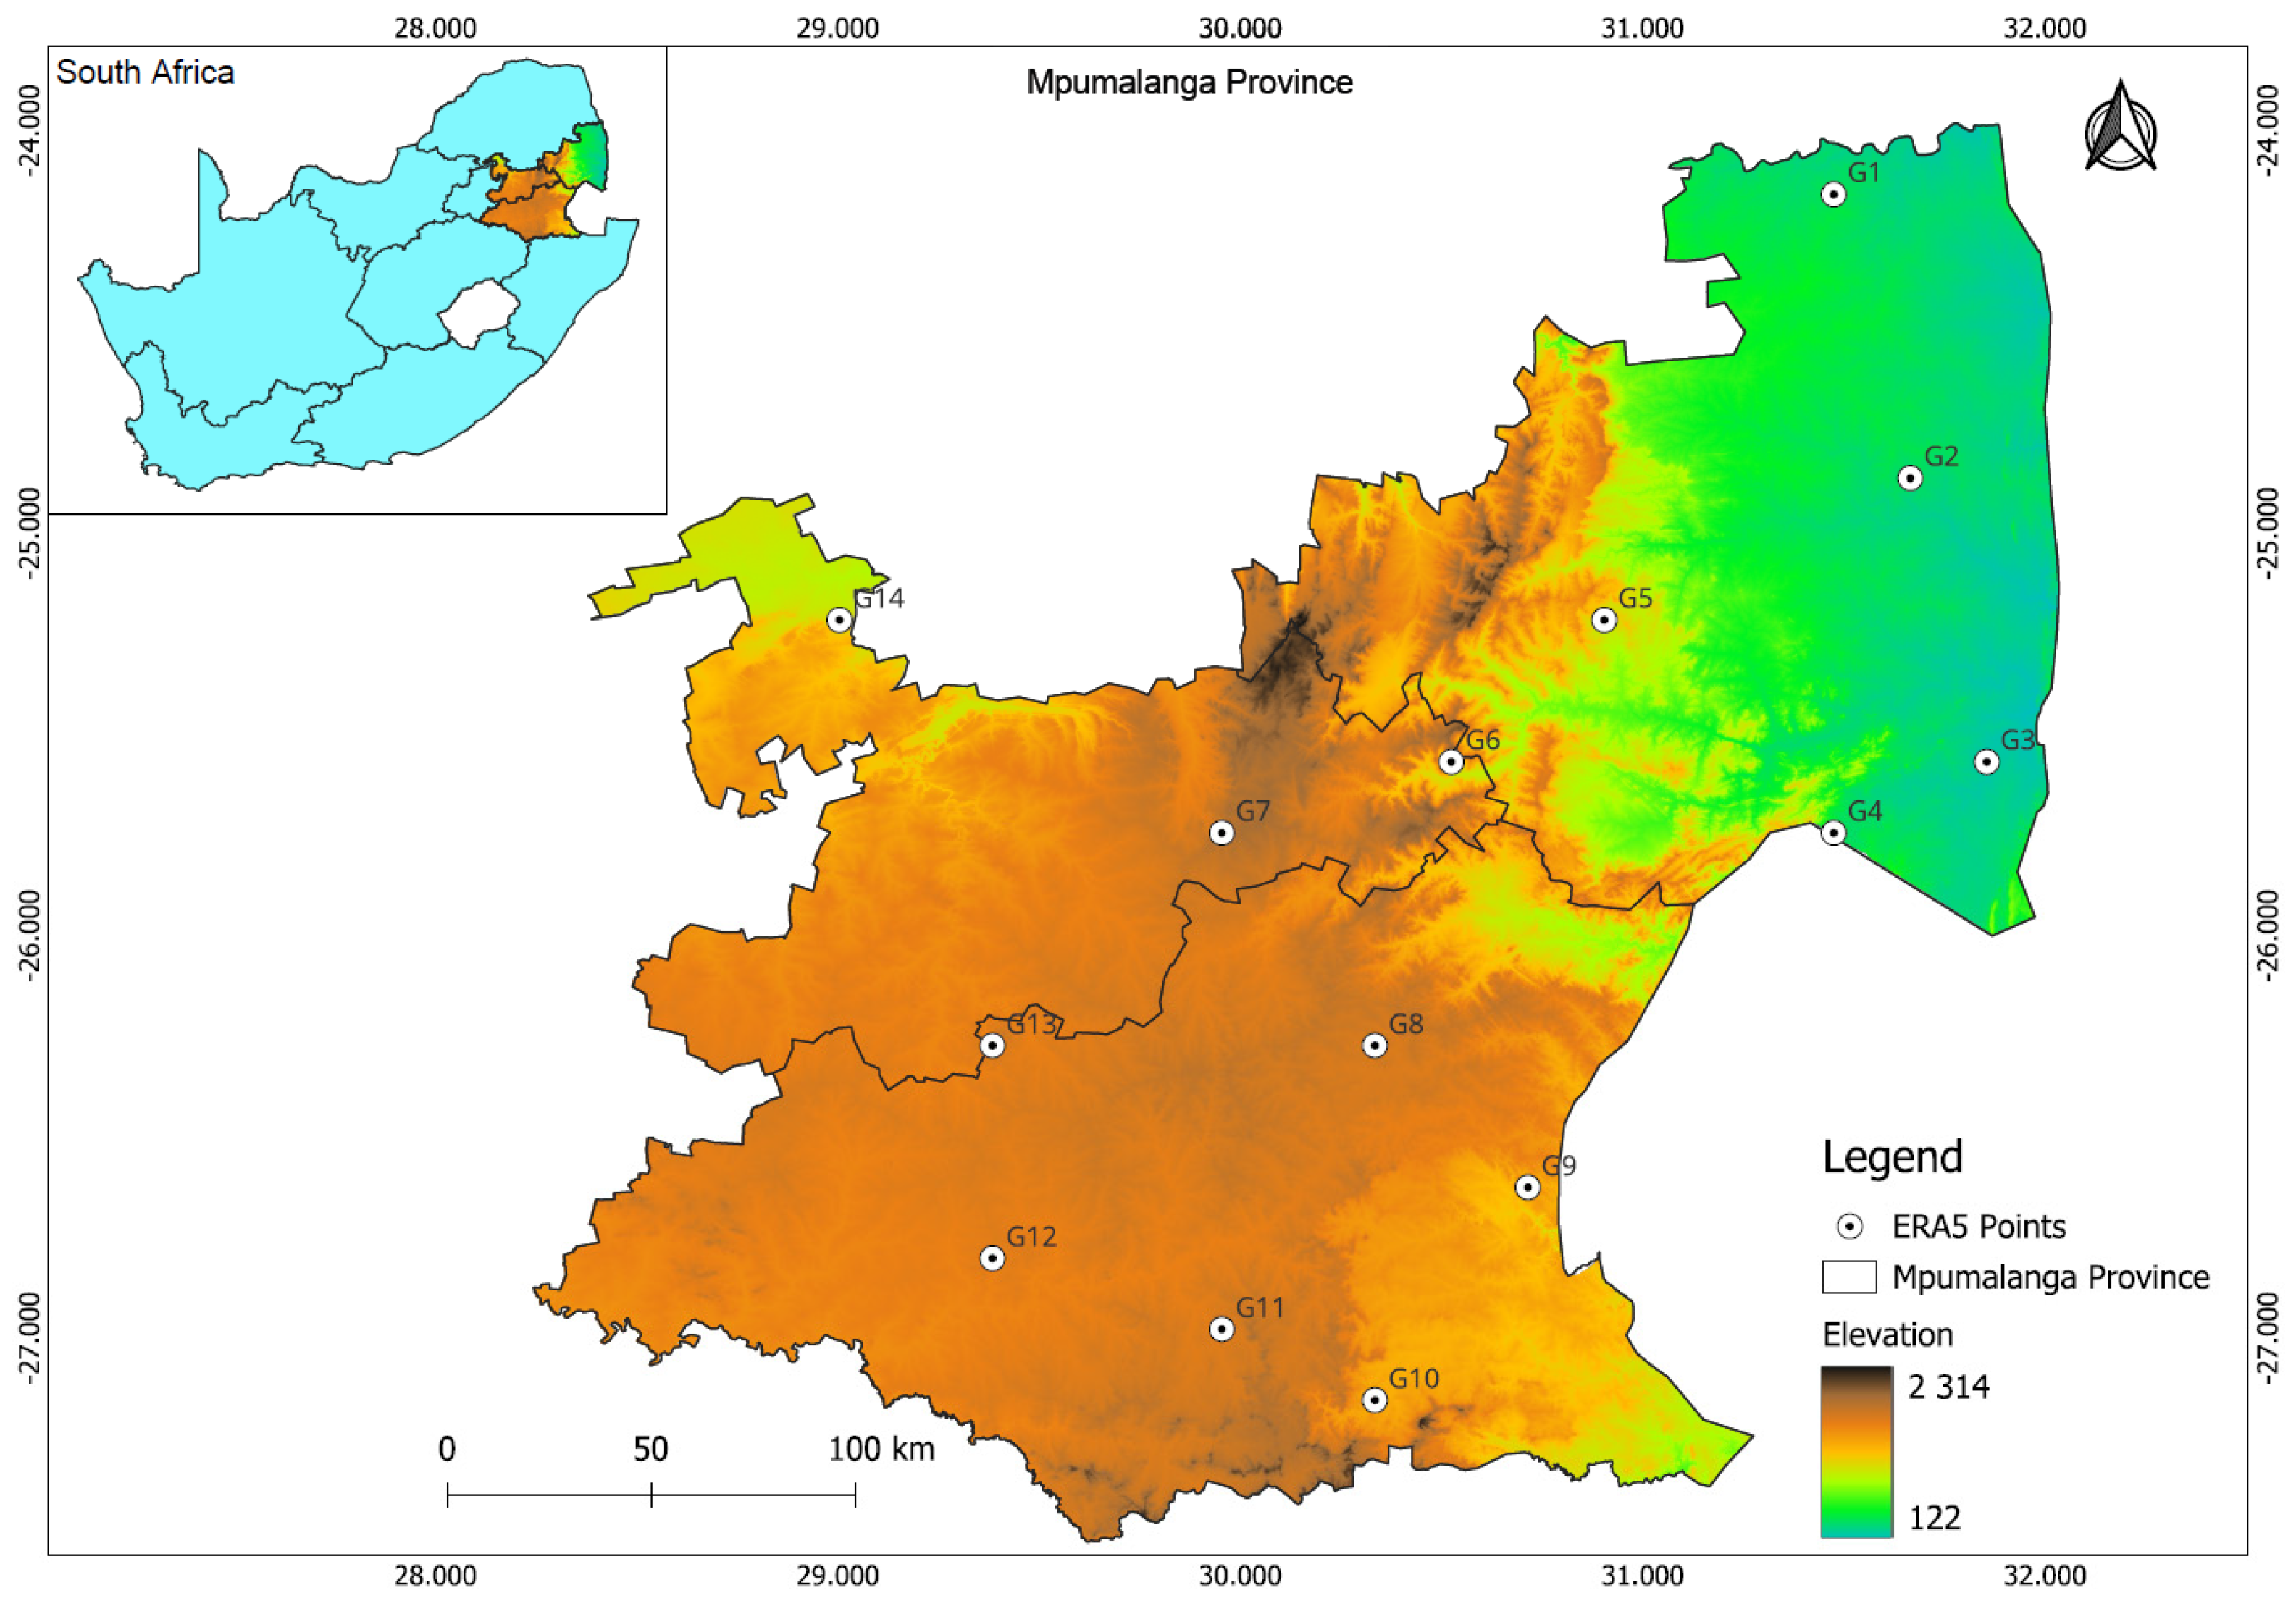
This study was conducted in Mpumalanga Province, which is in northeastern South Africa (latitude −29.8167; longitude 30.6167). It covers an area of 76,495 square kilometres and has an average elevation of 494 metres above sea level [39]. It is divided into three districts: Nkangala, Ehlanzeni, and Gert Sibande. These 3 districts are subdivided into 17 local municipalities. The Mpumalanga Province receives high rainfall between October and March, making it a summer rainfall region. The rainfall pattern is influenced by topography, where the highveld receives the most annual rainfall of up to 1000 mm, while the lowveld receives the lowest annual rainfall of 600 mm [40]. According to recent scientific literature, there is a lack of studies that provide a comprehensive understanding of agricultural drought in this region, even though the region is prone to drought, which is why it was chosen.
Figure 1.
Geographical location of the selected study area and ERA5 Grids Points, (Source: Author, 2026).
Figure 1.
Geographical location of the selected study area and ERA5 Grids Points, (Source: Author, 2026).
2.2. Methodology
This study used the ERA5-Land dataset from the European Centre for Medium-Range Weather Forecasts (ECMWF), which provides hourly climate data from 1950 to the present. The data was collected and processed using Google Earth Engine (Accessed on March 02, 2026). 14 grid points were selected to cover the entire province of Mpumalanga, and we named them G1 to G14. This study focused on the period 1981–2025 (45 years), using monthly precipitation (mm) and maximum and minimum temperatures (°C) derived from hourly data.
Standardized Precipitation Evapotranspiration Index (SPEI) which is widely recognized for assessing agricultural drought by calculating the difference between precipitation (P) and potential evapotranspiration (PET) was computed at a 6-month timescale which is referred to as SPEI6 to identify the agricultural drought occurrence, frequency, and trends over the past 45 years. The SPEI, proposed by Vicente-Serrano et al. [28], is a significant advancement over the Standardized Precipitation Index (SPI). Unlike the SPI, the SPEI does not consider precipitation only as input data; it also incorporates temperature data, making it a more comprehensive and advanced tool for drought analysis. This choice of index ensures that our study is informed by the latest developments in the field.
The SPEI was computed using “SPEI” package in RStudio. The first step is to calculate the Potential Evapotranspiration (PET), which is calculated using different equations such as Penman-Monteith (PM), Thornthwaite (Th), and Hargreaves (HG), and each of these equations requires different data [41]. However, in this study, the Hargreaves equation was chosen due to its simplicity and accuracy in estimating PET, especially in regions with limited meteorological data. This was followed by calculating the Climate Water Balance (CWB), which is the difference between the Precipitation (P) and Potential Evapotranspiration (PET). It was calculated as follows:
CWB = P − PET
CWB represents the climate water balance, P represents the monthly precipitation, and PET represents the monthly potential evapotranspiration. A log-logistic distribution is then applied to fit the CWB values and transform them into a standard normal distribution, which are the SPEI values. The SPEI values were classified according to [42] into seven classes: extremely wet (>2), severely wet (1.5 to 1.99), moderately wet (1.0 to 1.49), near normal (-0.99 to 0.99), moderate drought (-1.0 to -1.49), severe drought (-1.5 to -1.99), and extreme drought (< -2), indicating that wet conditions start when SPEI values reach positive 1.00 and above and drought conditions start when SPEI values reach -1.00 and below.
The Inverse Distance Weighted (IDW) interpolation method in QGIS (Version: 3.32.2) was utilized to map the spatial extent of agricultural drought based on point data. IDW is a deterministic interpolation method used to satisfy specified statistical assumptions. It assumes that an unmeasured point’s value is equal to the weighted average of the nearby known values [43,44]. To identify the trend of the agricultural drought incidence, we used the Mann-Kendall test, which is a non-parametric test. It is used to determine if a time series dataset has a monotonic trend, either rising or dropping. According to Muhammad et al. [45], the Mann–KendallMann-Kendall test is a statistical technique used to examine hydroclimatic series’ temporal trends and spatial variation. It was performed using the “Kendall” package in RStudio.
3. Results
3.1. Historical Agricultural Drought Events
Historical agricultural drought and wet conditions observed by the SPEI at a 6-month timescale within 14 grid points in Mpumalanga Province, covering the period from 1981 to 2025, are shown in Figure 2. The graph uses colour to differentiate between wet and drought events; the blue bars represent wet events, while the red bars indicate drought events. A more significant downward movement of the red bar indicates more severe drought conditions, whereas an upward movement of the blue bar shows a more intense wet period.
The duration of the agricultural drought was determined by identifying when the negative SPEI values began, marking this point as the onset date. The end date was determined by identifying the month when the SPEI values returned to positive values, marking the end of the duration. The frequency of agricultural drought was calculated by counting the total number of drought events over 45 years. To classify the severity of each drought event, we analyzed SPEI values during each event. An event with SPEI values reaching -1.00 to -1.49 was classified as a moderate drought, while values between -1.5 and -1.99 indicated a severe drought, and less than < -2 indicate an extreme drought event, and so on.
The events observed differ significantly in intensity, ranging from extremely wet conditions to extreme drought. The G1 grid point recorded 18 drought events, including 8 moderate, 6 severe, and 4 extreme events. However, areas around this grid point experienced their worst drought, classified as extreme events, from September 1991 to November 1992 and from June 2015 to January 2017. In contrast, the G2 experienced 14 drought events (4 moderate, 6 severe, and 4 extreme). Its worst drought occurred from September 2014 to January 2017 and again from August 2018 to January 2020. On the other hand, the G3 observed 18 drought events, including 7 moderate, 9 severe, and 2 extreme events, with the worst occurring from July 1990 to November 1992 and from October 2015 to December 2016.
In the G4 grid point, a total of 21 drought events were recorded (12 moderate, 5 severe, and 4 extreme). The worst drought event emerged from December 1991 to February 1993 and from January 2015 to January 2017. Similarly, G5 grid point recorded 18 drought events from 1981 to 2025, including 11 moderate, 4 severe, and 3 extreme events. Its worst drought occurred from December 1991 to April 1993 and from June 2014 to January 2017. However, the G6 grid point recorded 15 events, including 3 moderate, 8 severe, and 4 extreme events, indicating that the area surrounding this point is more prone to severe drought events, and its worst drought events occurred from September 2014 to April 2017. Additionally, the G7 noted a total of 20 drought events, including 7 moderate, 10 severe, and 3 extreme drought events, with the worst drought events occurring from May 2015 to June 2016 and from October 2023 to January 2025.
A total of 20 drought events were recorded from the G8, including 8 moderate, 9 severe, and 3 extreme events, with the worst drought occurring from October 2015 to July 2018. In contrast, the G9 observed 16 events (6 moderate, 4 severe, and 6 extreme); its worst drought emerged from May 2015 to June 2018. In contrast, the G10 grid point noted 15 drought events (4 moderate, 7 severe, and 4 extreme), with the worst occurring from September 2018 to June 2020. Overall, the G11 grid point recorded 17 drought events during the study period, consisting of 8 moderate, 4 severe, and 5 extreme events. Its worst drought emerged from September 2018 to May 2021.
The G12 noted a total of 16 events, consisting of 10 moderate, 2 severe, and 4 extreme drought events. Its worst drought events occurred from September 2014 to June 2016 and from September 2018 to August 2020. However, the G13 observed 18 drought events, including 9 moderate, 6 severe, and 3 extreme events. It recorded two of the worst drought events occurring from September 2014 to May 2026 and from September 2018 to March 2020. Furthermore, the G14 grid point recorded 18 drought events, including 8 moderate, 8 severe, and 2 extreme events, with the worst events occurring from September 2018 to December 2019 and from November 2023 to January 2025.
3.2. Spatial Distribution of Agricultural Drought
To show which areas were affected by different drought severities (moderate, severe, and extreme) throughout the study period, we counted the months with moderate, severe, or extreme drought, rather than using drought events, because a drought event can span multiple severity levels. The obtained results were pre-processed using the Inverse Distance Weighted (IDW) interpolation method in QGIS to create a distribution map, and the results are shown in Figure 3.
Figure 3 shows the spatial distribution of monthly agricultural drought occurrence classified into (A) moderate drought, (B) severe drought, (C) extreme drought, and (D) combined drought severities. The results show the spatial variability of agricultural drought conditions across Mpumalanga Province. However, a high frequency of moderate intensity occurred in central and western areas and in a few areas of the southern part of the province, ranging from 59 to 66 months, with a decline in the frequency of moderate droughts towards the northeast (Figure 3A). In contrast, Figure 3B shows that the western side and a few areas in the central and southern parts were most affected by severe droughts, with frequencies ranging from 32 to 38 months, while a few frequent severe droughts were noted in the southern and northeastern parts of the region. On the other hand, a high frequency of extreme drought events was observed in the northeast, ranging from 14 to 17 months, with a decline in their frequency towards the west (Figure 3C).
Furthermore, Figure 3D, which highlights combined drought severities, indicates that most droughts with different intensities occurred in the central area and a few areas on the western side, while a few frequencies were observed on the northern side of the region (Figure 3D). Additionally, the results show that each part of Mpumalanga Province experienced different types of drought severity, but their frequency varies significantly across the region. These spatial patterns show which areas were prone to which levels of drought over the past 45 years.
3.3. Trends of Agricultural Drought Incidence
The Mann-Kendall trend test was used to identify significant increasing or decreasing monotonic trends in the SPEI values from 1981 to 2025 at 14 grid points across Mpumalanga Province. The results of this trend analysis are shown in Table 1. Two statistics from the Mann-Kendall test (Kendall’s tau and the p-value) were used to detect a trend in the data. The Kendall tau statistic was used to identify whether the trend is increasing or decreasing. In contrast, the p-value was used to show whether the trend is statistically significant (p < 0.05) or insignificant (p > 0.05). The results were performed at a 95% confidence interval.
The results reveal that out of the 14 grid points, only one grid point, which is the G14, showed a statistically insignificant trend (p > 0.05), whereas 93% of the grid points exhibit a statistically significant decreasing trend of the SPEI values, indicating that more agricultural drought events are expected in this region soon. This decrease highlighted the need for agricultural planning and water resource management as more drought events are expected in these areas. The potential impact of these findings on agricultural planning cannot be overstated, as they provide crucial insights into future resource management strategies.
4. Discussion and Conclusions
Agricultural drought is a significant threat to food security in Mpumalanga Province, as noted by recent papers on the vulnerability of subsistence farmers and drought risk in South African agriculture [23,24], yet studies providing a comprehensive understanding of this natural phenomenon are lacking. This study aims to fill this gap by assessing the occurrence, frequency, trends, and spatial patterns of agricultural droughts from 1981 to 2025.
The results reveal that this region is prone to various agricultural drought intensity events, providing a significant contribution to understanding this crucial issue. Chivangulula et al. [46] and Chikoore and Jury [47] noted that droughts occur more frequently in southern Africa; this aligns with the results observed in this study, as most grid points recorded high drought events. For example, the highest total number of drought events was recorded in G4 (21 events), followed by G7 (20 events), G8 (20 events), and G1, G3, G5, G13, and G14 (18 events each). In contrast, the fewest drought events were recorded at G11 (17 events), G12 (16 events), G9 (16 events), G6 (15 events), G10 (15 events), and G2 (14 events). These results show that areas in Mpumalanga Province are prone to varying levels of drought intensity. These findings are supported by previous research demonstrating that drought risk varies significantly across municipalities and provinces [47].
In support of the study conducted by Moeletsi and Walker [48], which highlights that droughts are associated with significant variations in both intra-seasonal and interannual rainfall throughout the majority of southern Africa, it was noted in the results that agricultural drought started to be more frequent after the year 2000, when the wet event conditions started to decrease. This indicate that changing in rainfall patterns and increase in temperature variability is making agriculture drought to be worse in the region. Furthermore, recent studies have indicated that South Africa experienced its worst drought since the 1980s and 1990s during the 2015/2016 period [49,50,51]. However, this research reveals that not all areas of Mpumalanga Province experienced their worst drought during the 2015/2016 period, but most did.
For example, the G1 experienced its worst drought from September 1991 to November 1992 and from June 2015 to January 2017, while G3 highlighted that its worst drought occurred from July 1990 to November 1992 and from October 2015 to December 2016. In contrast, G4 noted its worst drought event from December 1991 to February 1993 and from January 2015 to January 2017. However, the G5 experienced its worst drought from December 1991 to April 1993 and from June 2014 to January 2017. The G6 experienced its worst drought events from September 2014 to April 2017. On the other hand, the G7 reported the worst drought events from May 2015 to June 2016 and from October 2023 to January 2025. Overall, the G8 faced its worst from October 2015 to July 2018.
The G9 experienced its worst drought from May 2015 to June 2018. On the other hand, the G10 grid point experienced its worst drought from September 2018 to June 2020. In the G11, the worst drought was faced from September 2018 to May 2021. Similarly, the G12 point noted their worst drought events from September 2014 to June 2016 and from September 2018 to August 2020. However, the G13 recorded the worst drought events from September 2014 to May 2026 and from September 2018 to March 2020. In addition, the G14 grid point observed its worst drought events occurring from September 2018 to December 2019 and from November 2023 to January 2025.
Additionally, the G2 grid point experienced its worst drought events from September 2014 to January 2017 and again from August 2018 to January 2020. The 2014-2017 drought event was supported by a study by Ebhuoma et al. [23] in Mpakeni, an area near the G2 grid point, where farmers reported selling their livestock at lower prices due to the drought that affected them during this period. These findings highlight the necessity for monitoring and management strategies by showing the variation in drought intensity across Mpumalanga Province.
Spatial distribution maps of agricultural drought show that a high frequency of moderate intensity occurred in central and western areas (Figure 3A). In contrast, the western side and a few areas in the central and southern parts were most affected by severe droughts (Figure 3B). A high frequency of extreme drought events was observed in the northeast (Figure 3C). The combined drought severity map highlighted in Figure 3D indicates that most droughts, with varying intensities, occurred in the central area and a few areas on the western side. These spatial patterns show that drought risk varies across the region, influenced by topography and rainfall distribution. Furthermore, Nembilwi et al. [52] reported that wetter areas are frequently more affected by drought than drier areas, which aligns with the results of this study, which reveal that the highveld, which receives high rainfall, experienced more drought frequency than the lowveld, which receives less rainfall. Additionally, spatial distribution maps of agricultural drought can help farmers and policymakers better plan and allocate resources more effectively by identifying the areas most vulnerable to varying drought intensities.
The Mann-Kendall test results reveal that only one grid point shows a statistically insignificant decreasing trend, while 93% of the grid points exhibit a statistically significant decreasing trend in SPEI values, indicating an increase in agricultural drought soon. These results correspond with those of a study by Letswamotse et al. [53], which indicates that agricultural drought is expected to increase in Mpumalanga Province. Furthermore, these results confirmed that agricultural drought is indeed prevalent in this area and underscore the urgent need for proactive measures to minimize its impact, as more drought events are expected at 93% of grid points. These can help farmers and policymakers to make informed decisions.
This research also faced a few limitations. Due to data limitations, the SPEI model, which considers temperature and precipitation data, was used in this study. However, although the SPEI model does provide accurate results, but it overlooks important factors such as vegetation health, soil moisture, and land surface characteristics, which are necessary for a comprehensive understanding of the impacts of agricultural drought. To address these limitations, future studies must integrate the SPEI model with satellite data, such as land surface temperature, vegetation indices, and soil moisture data. This integrated approach would improve the accuracy of agricultural drought assessment and give a more comprehensive picture of agricultural drought conditions. Therefore, it would help close data gaps and improve the accuracy of agricultural drought monitoring and forecasts.
Author Contributions
Humbulani Baloyi was responsible for collecting data and data analysis as well as writing the manuscript. The manuscript was reviewed and improved by the Wisemen Chingombe. All authors have read and agreed to the published version of the manuscript.
Funding
The author would like to thank the ETDP-SETA bursary for the financial support.
Data Availability Statement
This study used ERA5-Land from the European Centre for Medium-Range Weather Forecasts (ECMWF), which is publicly available online.
Acknowledgments
The authors acknowledge the European Centre for Medium-Range Weather Forecasts (ECMWF) for providing the ERA5-Land reanalysis dataset, which was utilized to get monthly precipitation and minimum and maximum temperature data for this research.
Conflicts of Interest
The authors declare that they have no competing interests.
References
- Degefu, M. A.; Bewket, W. Trends and spatial patterns of drought incidence in the omo-ghibe river basin, ethiopia. Geogr. Ann. Ser. A Phys. Geogr. 2015, 97, 395–414. [Google Scholar] [CrossRef]
- Belal, A.-A.; El-Ramady, H. R.; Mohamed, E. S.; Saleh, A. M. Drought risk assessment using remote sensing and GIS techniques. Arab. J. Geosci. 2014, 7, 35–53. [Google Scholar] [CrossRef]
- Sun, F.; Mejia, A.; Zeng, P.; Che, Y. Projecting meteorological, hydrological and agricultural droughts for the Yangtze River basin. Sci. Total Environ. 2019, 696, 134076. [Google Scholar] [CrossRef]
- Yang, P.; Zhai, X.; Huang, H.; Zhang, Y.; Zhu, Y.; Shi, X.; Zhou, L.; Fu, C. Association and driving factors of meteorological drought and agricultural drought in Ningxia, Northwest China. Atmos. Res. 2023, 289, 106753. [Google Scholar] [CrossRef]
- Torelló-Sentelles, H.; Franzke, C. L. Drought impact links to meteorological drought indicators and predictability in Spain. Hydrol. Earth Syst. Sci. 2022, 26, 1821–1844. [Google Scholar] [CrossRef]
- Shi, H.; Zhou, Z.; Liu, L.; Liu, S. A global perspective on propagation from meteorological drought to hydrological drought during 1902–2014. Atmos. Res. 2022, 280, 106441. [Google Scholar] [CrossRef]
- Apurv, T.; Sivapalan, M.; Cai, X. Understanding the role of climate characteristics in drought propagation. Water Resour. Res. 2017, 53, 9304–9329. [Google Scholar] [CrossRef]
- Spinoni, J.; Barbosa, P.; De Jager, A.; Mccormick, N.; Naumann, G.; Vogt, J. V.; Magni, D.; Masante, D.; Mazzeschi, M. A new global database of meteorological drought events from 1951 to 2016. J. Hydrol. Reg. Stud. 2019, 22, 100593. [Google Scholar] [CrossRef]
- Ayala, J. J. H.; Heslar, M. Examining the spatiotemporal characteristics of droughts in the Caribbean using the standardized precipitation index (SPI). Clim. Res. 2019, 78, 103–116. [Google Scholar] [CrossRef]
- Gonzalez Cruz, M.; Hernandez, E. A.; UddamerI, V. Climatic influences on agricultural drought risks using semiparametric kernel density estimation. Water 2020, 12, 2813. [Google Scholar] [CrossRef]
- Bhardwaj, K.; Shah, D.; Aadhar, S.; Mishra, V. Propagation of meteorological to hydrological droughts in India. J. Geophys. Res. Atmos. 2020, 125, e2020JD033455. [Google Scholar] [CrossRef]
- Liu, Y.; Chen, J. Future global socioeconomic risk to droughts based on estimates of hazard, exposure, and vulnerability in a changing climate. Sci. Total Environ. 2021, 751, 142159. [Google Scholar] [CrossRef]
- Crausbay, S. D.; Ramirez, A. R.; Carter, S. L.; Cross, M. S.; Hall, K. R.; Bathke, D. J.; Betancourt, J. L.; Colt, S.; Cravens, A. E.; Dalton, M. S. Defining ecological drought for the twenty-first century. Bull. Am. Meteorol. Soc. 2017, 98, 2543–2550. [Google Scholar] [CrossRef]
- Otkin, J. A.; Svoboda, M.; Hunt, E. D.; Ford, T. W.; Anderson, M. C.; Hain, C.; Basara, J. B. Flash droughts: A review and assessment of the challenges imposed by rapid-onset droughts in the United States. Bull. Am. Meteorol. Soc. 2018, 99, 911–919. [Google Scholar] [CrossRef]
- Baudoin, M.-A.; Vogel, C.; Nortje, K.; Naik, M. Living with drought in South Africa: lessons learnt from the recent El Niño drought period. Int. J. Disaster Risk Reduct. 2017, 23, 128–137. [Google Scholar] [CrossRef]
- Siderius, C.; Gannon, K.; Ndiyoi, M.; Opere, A.; Batisani, N.; Olago, D.; Pardoe, J.; Conway, D. Hydrological response and complex impact pathways of the 2015/2016 El Niño in Eastern and Southern Africa. Earth’s Future 2018, 6, 2–22. [Google Scholar] [CrossRef]
- Cheng, L.; Hoerling, M.; Aghakouchak, A.; Livneh, B.; Quan, X.-W.; Eischeid, J. How has human-induced climate change affected California drought risk? J. Clim. 2016, 29, 111–120. [Google Scholar] [CrossRef]
- Mukherjee, S.; Mishra, A.; Trenberth, K. E. Climate change and drought: a perspective on drought indices. Curr. Clim. Change Rep. 2018, 4, 145–163. [Google Scholar] [CrossRef]
- Chandrasekara, S. S.; Kwon, H.-H.; Vithanage, M.; Obeysekera, J.; Kim, T.-W. Drought in South Asia: A review of drought assessment and prediction in South Asian countries. Atmosphere 2021, 12, 369. [Google Scholar] [CrossRef]
- Shikangalah, R. N. The 2019 drought in Namibia: An overview. Change 2020, 16, 617–628. [Google Scholar]
- Ruwanza, S.; Thondhlana, G.; Falayi, M. Research progress and conceptual insights on drought impacts and responses among smallholder farmers in South Africa: a review. Land 2022, 11, 159. [Google Scholar] [CrossRef]
- Diko, A. Influencing factors of maize production in South Africa: The Case of Mpumalanga, free state and North West Provinces. Asian J. Adv. Agric. Res. 2020. [Google Scholar] [CrossRef]
- Ebhuoma, E. E.; Donkor, F. K.; Ebhuoma, O. O.; Leonard, L.; Tantoh, H. B. Subsistence farmers’ differential vulnerability to drought in Mpumalanga province, South Africa: Under the political ecology spotlight. Cogent Soc. Sci. 2020, 6, 1792155. [Google Scholar] [CrossRef]
- Meza, I.; Siebert, S.; Döll, P.; Kusche, J.; Herbert, C.; Eyshi rezaei, E.; NOURI, H.; Gerdener, H.; Popat, E.; Frischen, J. Global-scale drought risk assessment for agricultural systems. Nat. Hazards Earth Syst. Sci. 2020, 20, 695–712. [Google Scholar] [CrossRef]
- Xu, Y.; Wang, L.; Ross, K. W.; Liu, C.; Berry, K. Standardized soil moisture index for drought monitoring based on soil moisture active passive observations and 36 years of north American land data assimilation system data: A case study in the southeast United States. Remote Sens. 2018, 10, 301. [Google Scholar] [CrossRef]
- Palmer, W. C. Keeping track of crop moisture conditions, nationwide: The new crop moisture index. Accessed. 1968. (accessed on 15 February 2026).
- Jiao, W.; Zhang, L.; Chang, Q.; Fu, D.; Cen, Y.; Tong, Q. Evaluating an enhanced vegetation condition index (VCI) based on VIUPD for drought monitoring in the continental United States. Remote Sens. 2016, 8, 224. [Google Scholar] [CrossRef]
- Vicente-Serrano, S. M.; Beguería, S.; López-Moreno, J. I. A multiscalar drought index sensitive to global warming: the standardized precipitation evapotranspiration index. J. Clim. 2010, 23, 1696–1718. [Google Scholar] [CrossRef]
- Guo, M.; LI, J.; Wang, Y.; Long, Q.; Bai, P. Spatiotemporal variations of meteorological droughts and the assessments of agricultural drought risk in a typical agricultural province of China. Atmosphere 2019, 10, 542. [Google Scholar] [CrossRef]
- Tirivarombo, S.; Osupile, D.; Eliasson, P. Drought monitoring and analysis: standardised precipitation evapotranspiration index (SPEI) and standardised precipitation index (SPI). Phys. Chem. Earth Parts A/b/c 2018, 106, 1–10. [Google Scholar] [CrossRef]
- Moorhead, J. E.; Gowda, P. H.; Singh, V. P.; Porter, D. O.; Marek, T. H.; Howell, T. A.; Stewart, B. Identifying and evaluating a suitable index for agricultural drought monitoring in the Texas high plains. JAWRA J. Am. Water Resour. Assoc. 2015, 51, 807–820. [Google Scholar] [CrossRef]
- Hussain, A.; Jadoon, K. Z.; Rahman, K. U.; Shang, S.; Shahid, M.; Ejaz, N.; Khan, H. Analyzing the impact of drought on agriculture: evidence from Pakistan using standardized precipitation evapotranspiration index. Nat. Hazards 2023, 115, 389–408. [Google Scholar] [CrossRef]
- Sosa, G.; Fernández-Long, M.; Vicente-Serrano, S. M. Evaluating the performance of drought indices for assessing agricultural droughts in Argentina. Agron. J. 2025, 117, e70008. [Google Scholar] [CrossRef]
- Tian, L.; Yuan, S.; Quiring, S. M. Evaluation of six indices for monitoring agricultural drought in the south-central United States. Agric. For. Meteorol. 2018a, 249, 107–119. [Google Scholar] [CrossRef]
- Zeng, Z.; Wu, W.; Li, Z.; Zhou, Y.; Guo, Y.; Huang, H. Agricultural drought risk assessment in Southwest China. Water 2019, 11, 1064. [Google Scholar] [CrossRef]
- Svoboda, M.; Hayes, M.; Wood, D. Standardized precipitation index: user guide. Accessed. 2012. (accessed on 17 February 2026).
- Parsons, D. J.; Rey, D.; Tanguy, M.; Holman, I. P. Regional variations in the link between drought indices and reported agricultural impacts of drought. Agric. Syst. 2019, 173, 119–129. [Google Scholar] [CrossRef]
- Tian, Y.; Xu, Y.-P.; Wang, G. Agricultural drought prediction using climate indices based on Support Vector Regression in Xiangjiang River basin. Sci. Total Environ. 2018b, 622, 710–720. [Google Scholar] [CrossRef]
- Oduniyi, O. S. Climate change awareness: a case study of small-scale maize farmers in Mpumalanga province, South Africa, University of South Africa (South Africa). Accessed. 2013. (accessed on 04 March 2026).
- Botai, C. M.; Botai, J. O.; Mukhawana, M. B.; De Wit, J.; Masilela, N. S.; Zwane, N.; Tazvinga, H. Evaluation of rainfall distribution based on the precipitation concentration index: a case study over the selected summer rainfall regions of South Africa. Hydrology 2025, 12, 136. [Google Scholar] [CrossRef]
- Beguería, S.; Vicente-Serrano, S. M.; Reig, F.; Latorre, B. Standardized precipitation evapotranspiration index (SPEI) revisited: parameter fitting, evapotranspiration models, tools, datasets and drought monitoring. Int. J. Climatol. 2014, 34, 3001–3023. [Google Scholar] [CrossRef]
- Mckee, T. B.; Doesken, N. J.; Kleist, J. The relationship of drought frequency and duration to time scales. In Proceedings of the 8th Conference on Applied Climatology, 1993; pp. 179–183. [Google Scholar]
- Noor, I. M. M.; Prasetyowati, S. S.; Sibaroni, Y. Prediction map of rainfall classification using random forest and inverse distance weighted (IDW). Build. Inform. Technol. Sci. (BITS) 2022, 4, 723–731. [Google Scholar]
- Abu Arra, A.; Şişman, E. Evaluating Droughts and Trends in Data-Scarce Regions: A Case Study of Palestine Using ERA5, Standardized Precipitation Index, Bias Correction, Classical and Innovative Trend Approaches. Water 2025, 17, 2780. [Google Scholar] [CrossRef]
- Muhammad, M.; Azmi, M. A. F.; Zawawi, M. A. M.; 4.5. Rainfall trend analysis using the Mann-Kendall test with pyMannKendall: A case study of Jeli, Kelantan. BIO Web of Conferences, 2024; EDP Sciences; p. 05018. [Google Scholar]
- Chivangulula, F. M.; Amraoui, M.; Pereira, M. G. The drought regime in Southern Africa: A systematic review. Climate 2023, 11, 147. [Google Scholar] [CrossRef]
- Chikoore, H.; Jury, M. R. South African drought, deconstructed. Weather Clim. Extrem. 2021, 33, 100334. [Google Scholar] [CrossRef]
- Moeletsi, M.; Walker, S. Rainy season characteristics of the Free State Province of South Africa with reference to rain-fed maize production. Water SA 2012, 38, 775–782. [Google Scholar] [CrossRef]
- Archer, E. R. M.; Landman, W. A.; Tadross, M. A.; Malherbe, J.; Weepener, H.; Maluleke, P.; Marumbwa, F. M. Understanding the evolution of the 2014–2016 summer rainfall seasons in southern Africa: Key lessons. Clim. Risk Manag. 2017, 16, 22–28. [Google Scholar] [CrossRef]
- Mare, F.; Bahta, Y. T.; Van Niekerk, W. The impact of drought on commercial livestock farmers in South Africa. Dev. Pract. 2018, 28, 884–898. [Google Scholar] [CrossRef]
- Kolusu, S. R.; Shamsudduha, M.; Todd, M. C.; Taylor, R. G.; Seddon, D.; Kashaigili, J. J.; Ebrahim, G. Y.; Cuthbert, M. O.; Sorensen, J. P.; Villholth, K. G. The El Niño event of 2015–2016: climate anomalies and their impact on groundwater resources in East and Southern Africa. Hydrol. Earth Syst. Sci. 2019, 23, 1751–1762. [Google Scholar] [CrossRef]
- Nembilwi, N.; Chikoore, H.; Kori, E.; Munyai, R. B.; Manyanya, T. C. The occurrence of drought in mopani district municipality, South Africa: Impacts, vulnerability and adaptation. Climate 2021, 9, 61. [Google Scholar] [CrossRef]
- Letswamotse, T. V.; Arshad, S.; Bashir, B.; Alsalman, A.; Harsányi, E.; Al-dalahmeh, M.; Mohammed, S. Integrating maize yield and agricultural drought analysis for sustainable food security: a provincial study in South Africa (1993–2022). Food Energy Secur. 2024, 13, e70006. [Google Scholar] [CrossRef]
Figure 2.
Historical agricultural drought events observed from 1981 to 2025 form 14 points across the Mpumalanga Province.
Figure 2.
Historical agricultural drought events observed from 1981 to 2025 form 14 points across the Mpumalanga Province.
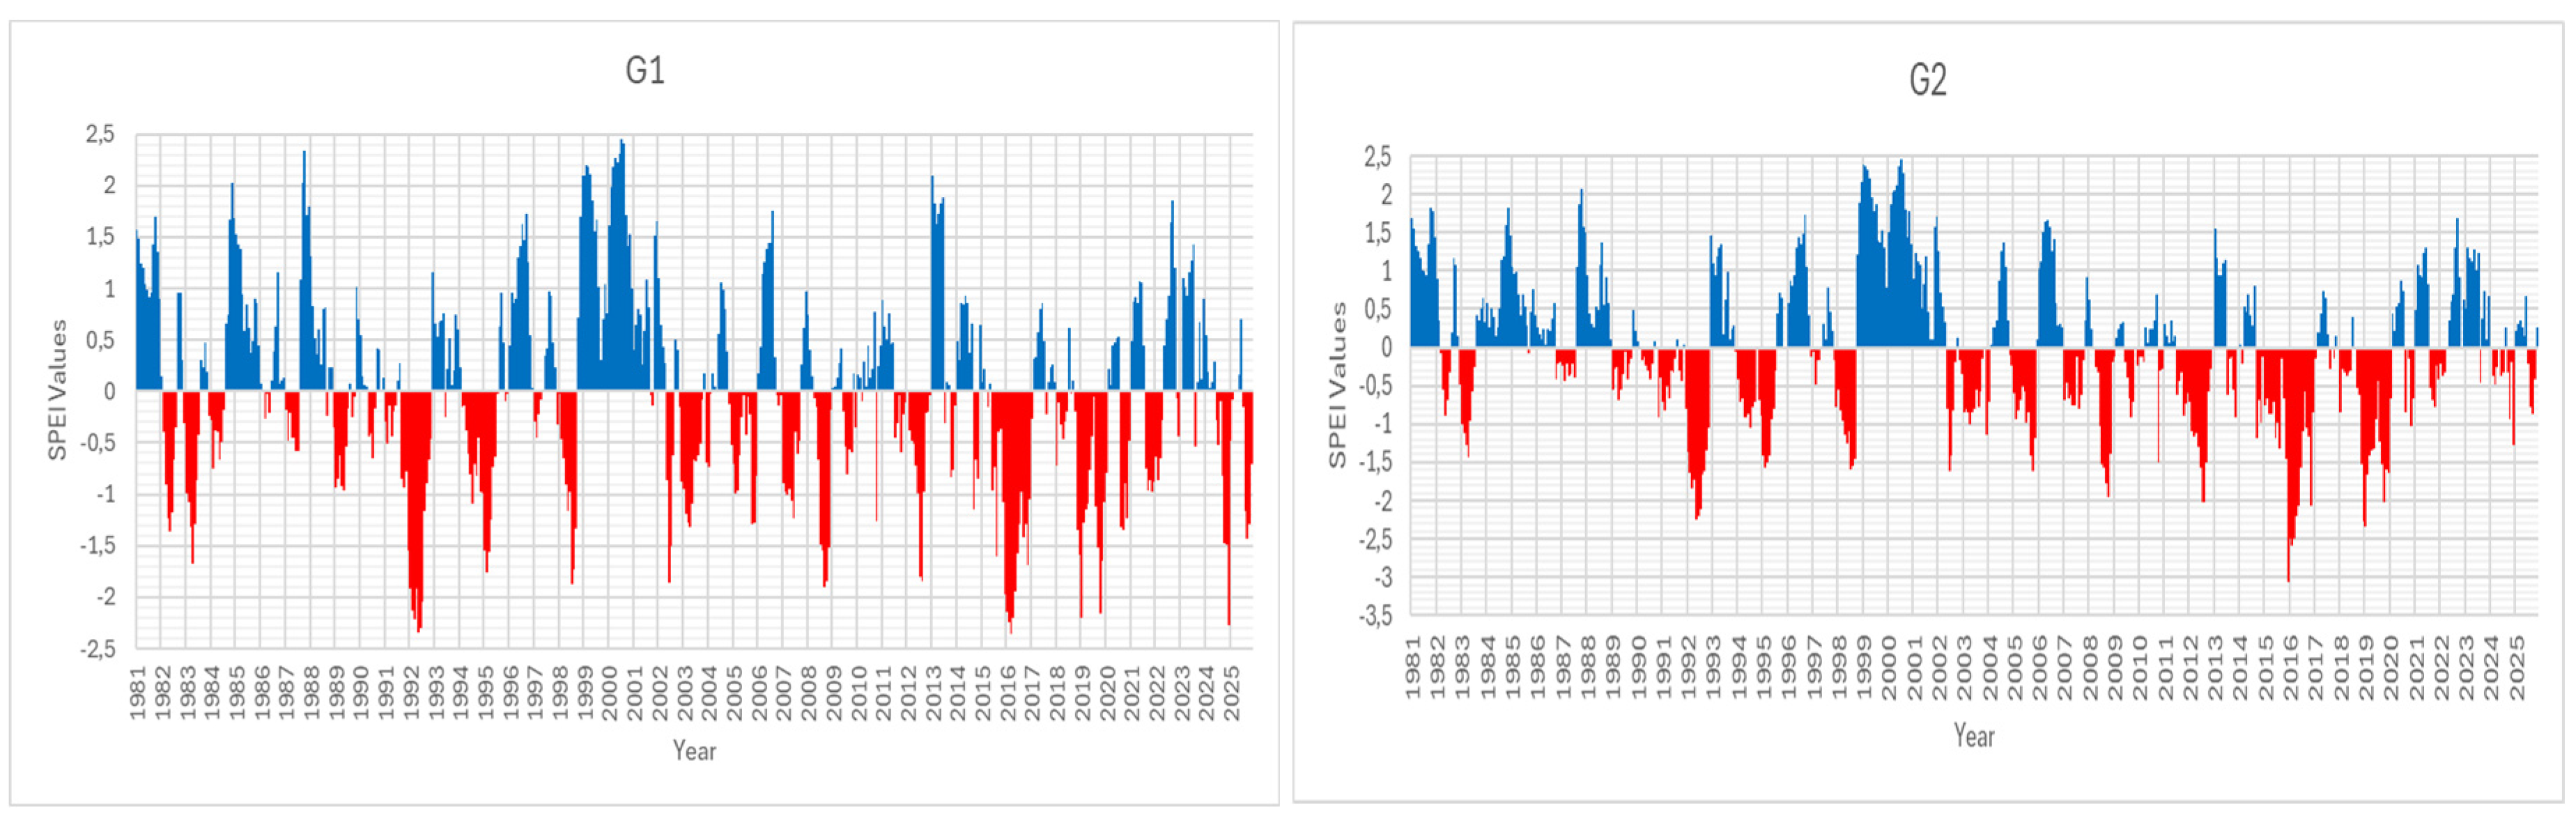
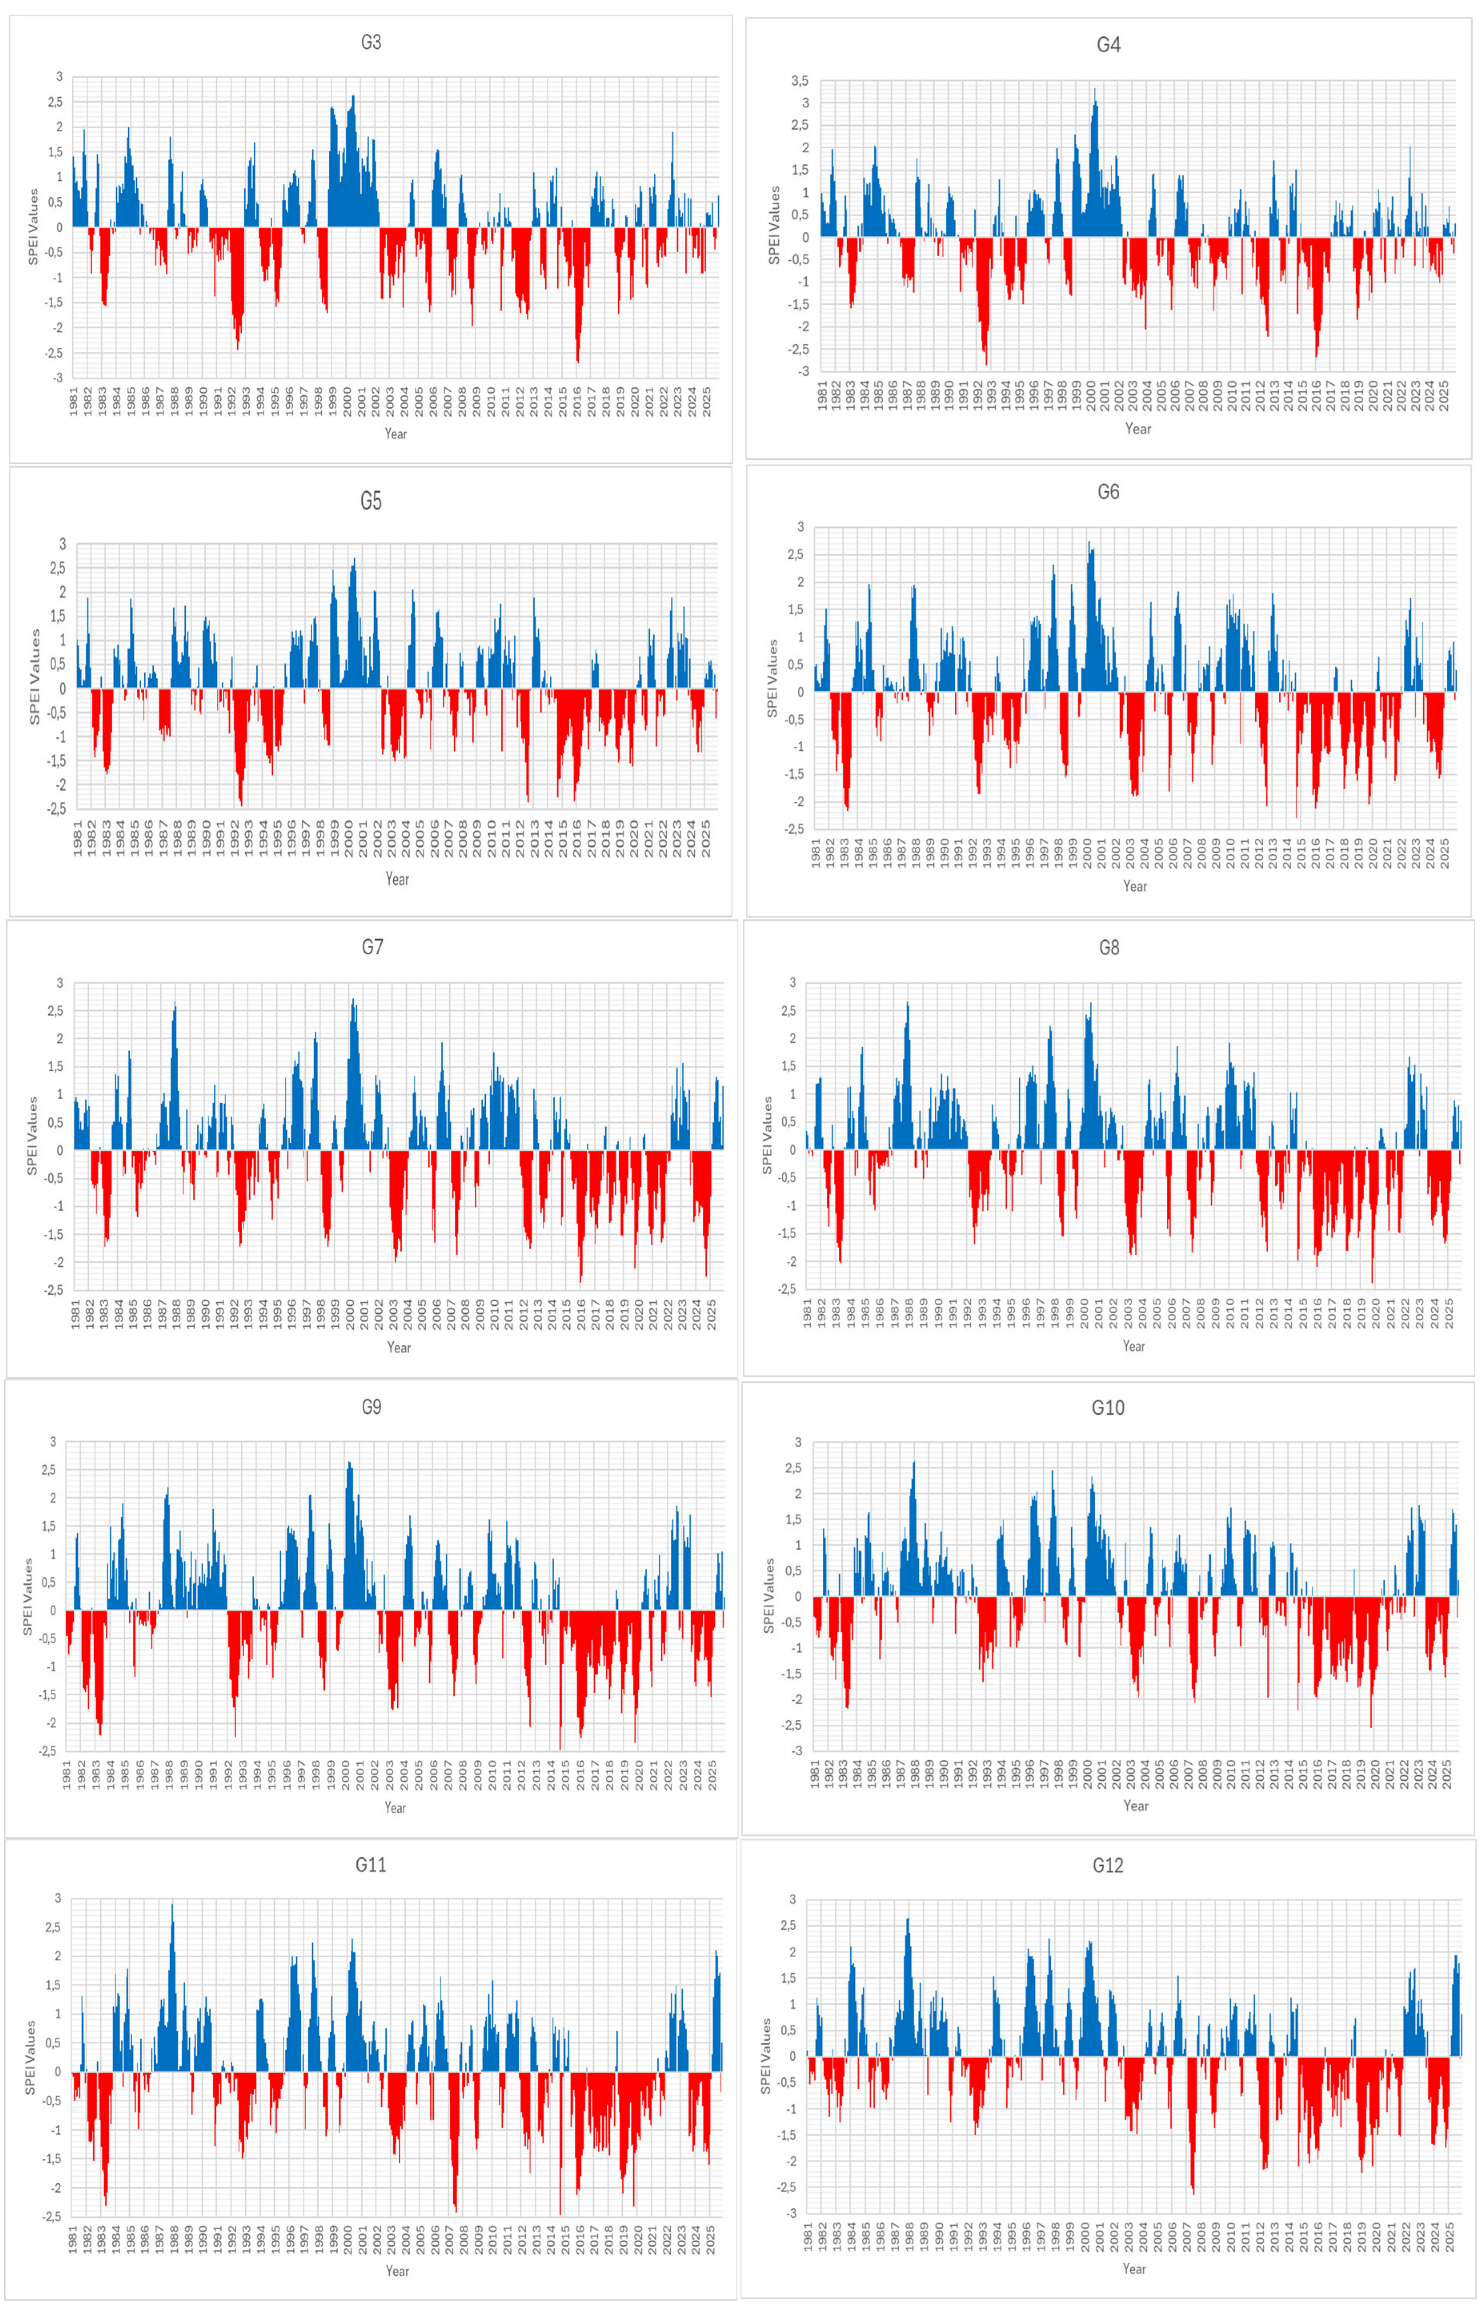
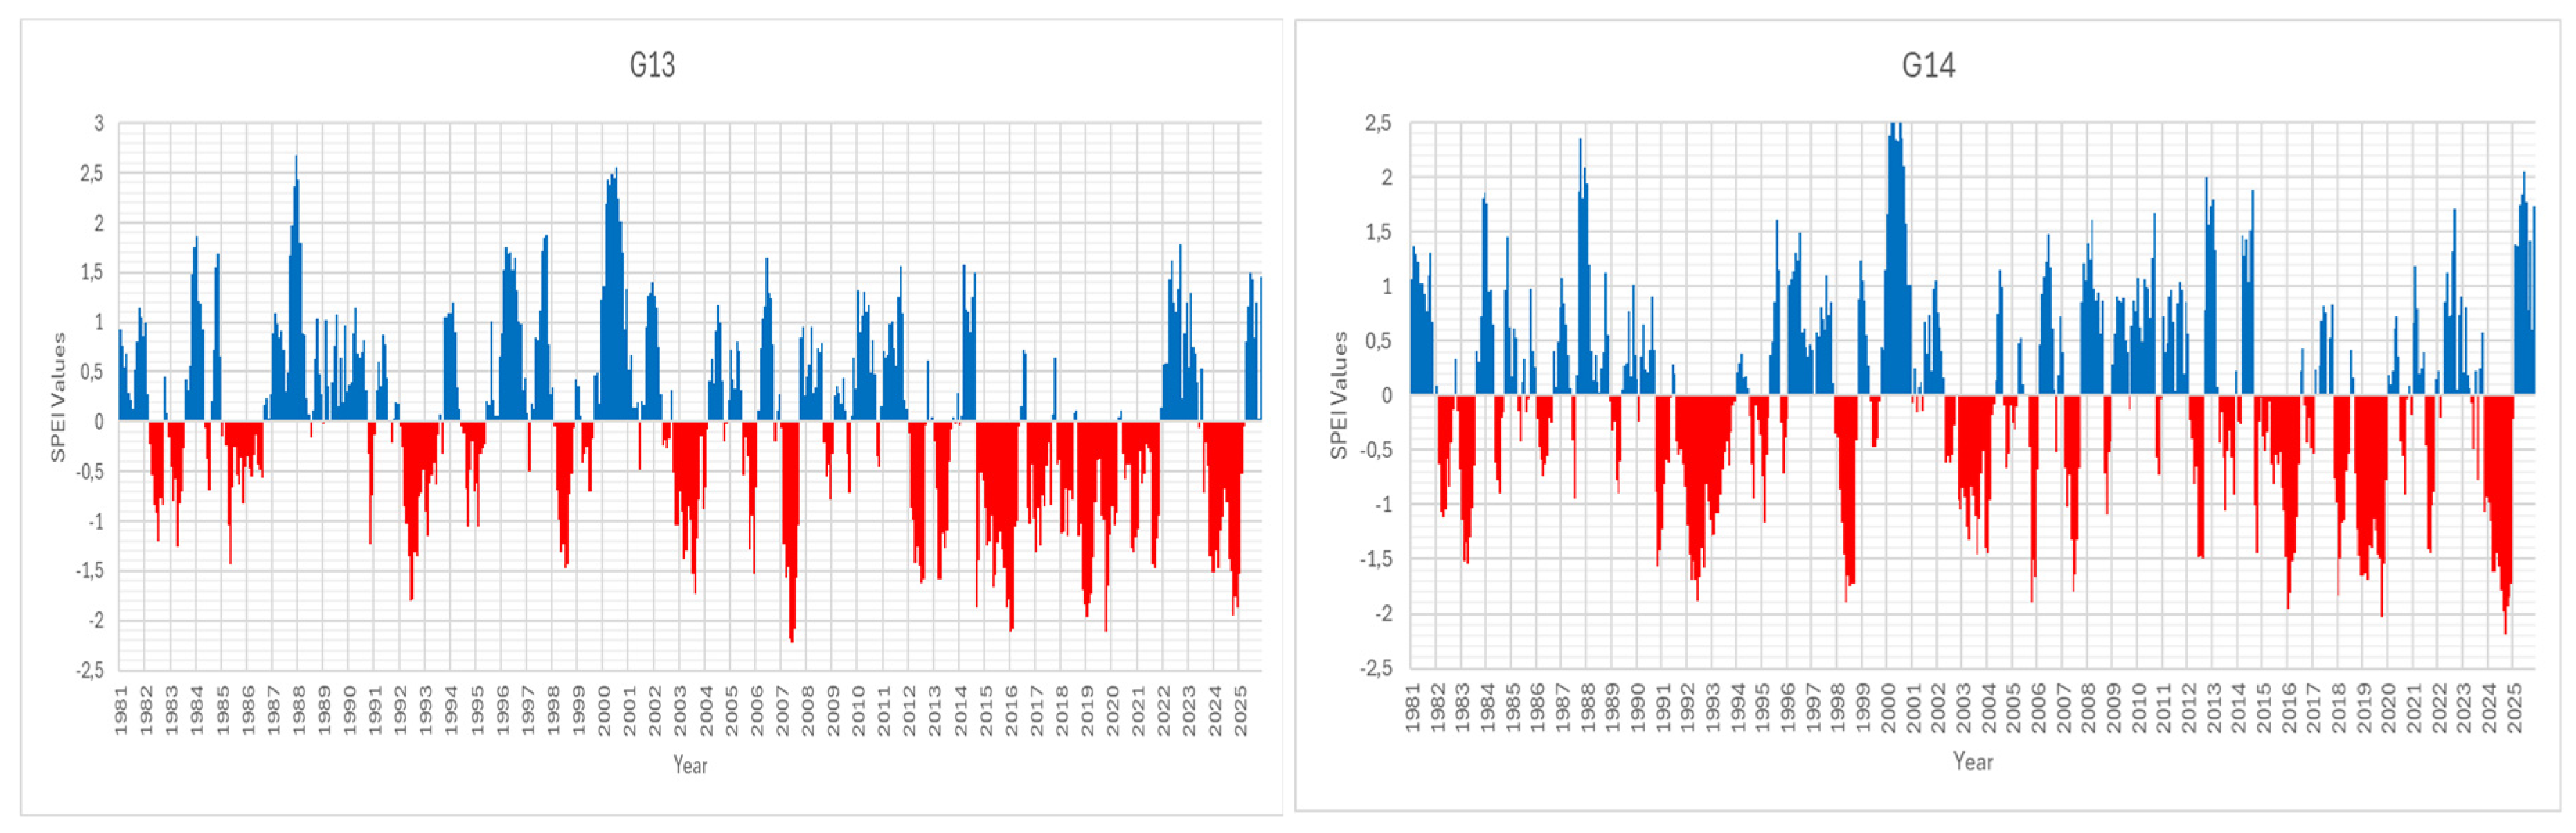
Figure 3.
Spatial distribution of agricultural drought occurrence across Mpumalanga Province: (A) moderate drought, (B) severe drought, (C) extreme drought, and (D) combined drought severities, (Source: Author, 2026).
Figure 3.
Spatial distribution of agricultural drought occurrence across Mpumalanga Province: (A) moderate drought, (B) severe drought, (C) extreme drought, and (D) combined drought severities, (Source: Author, 2026).
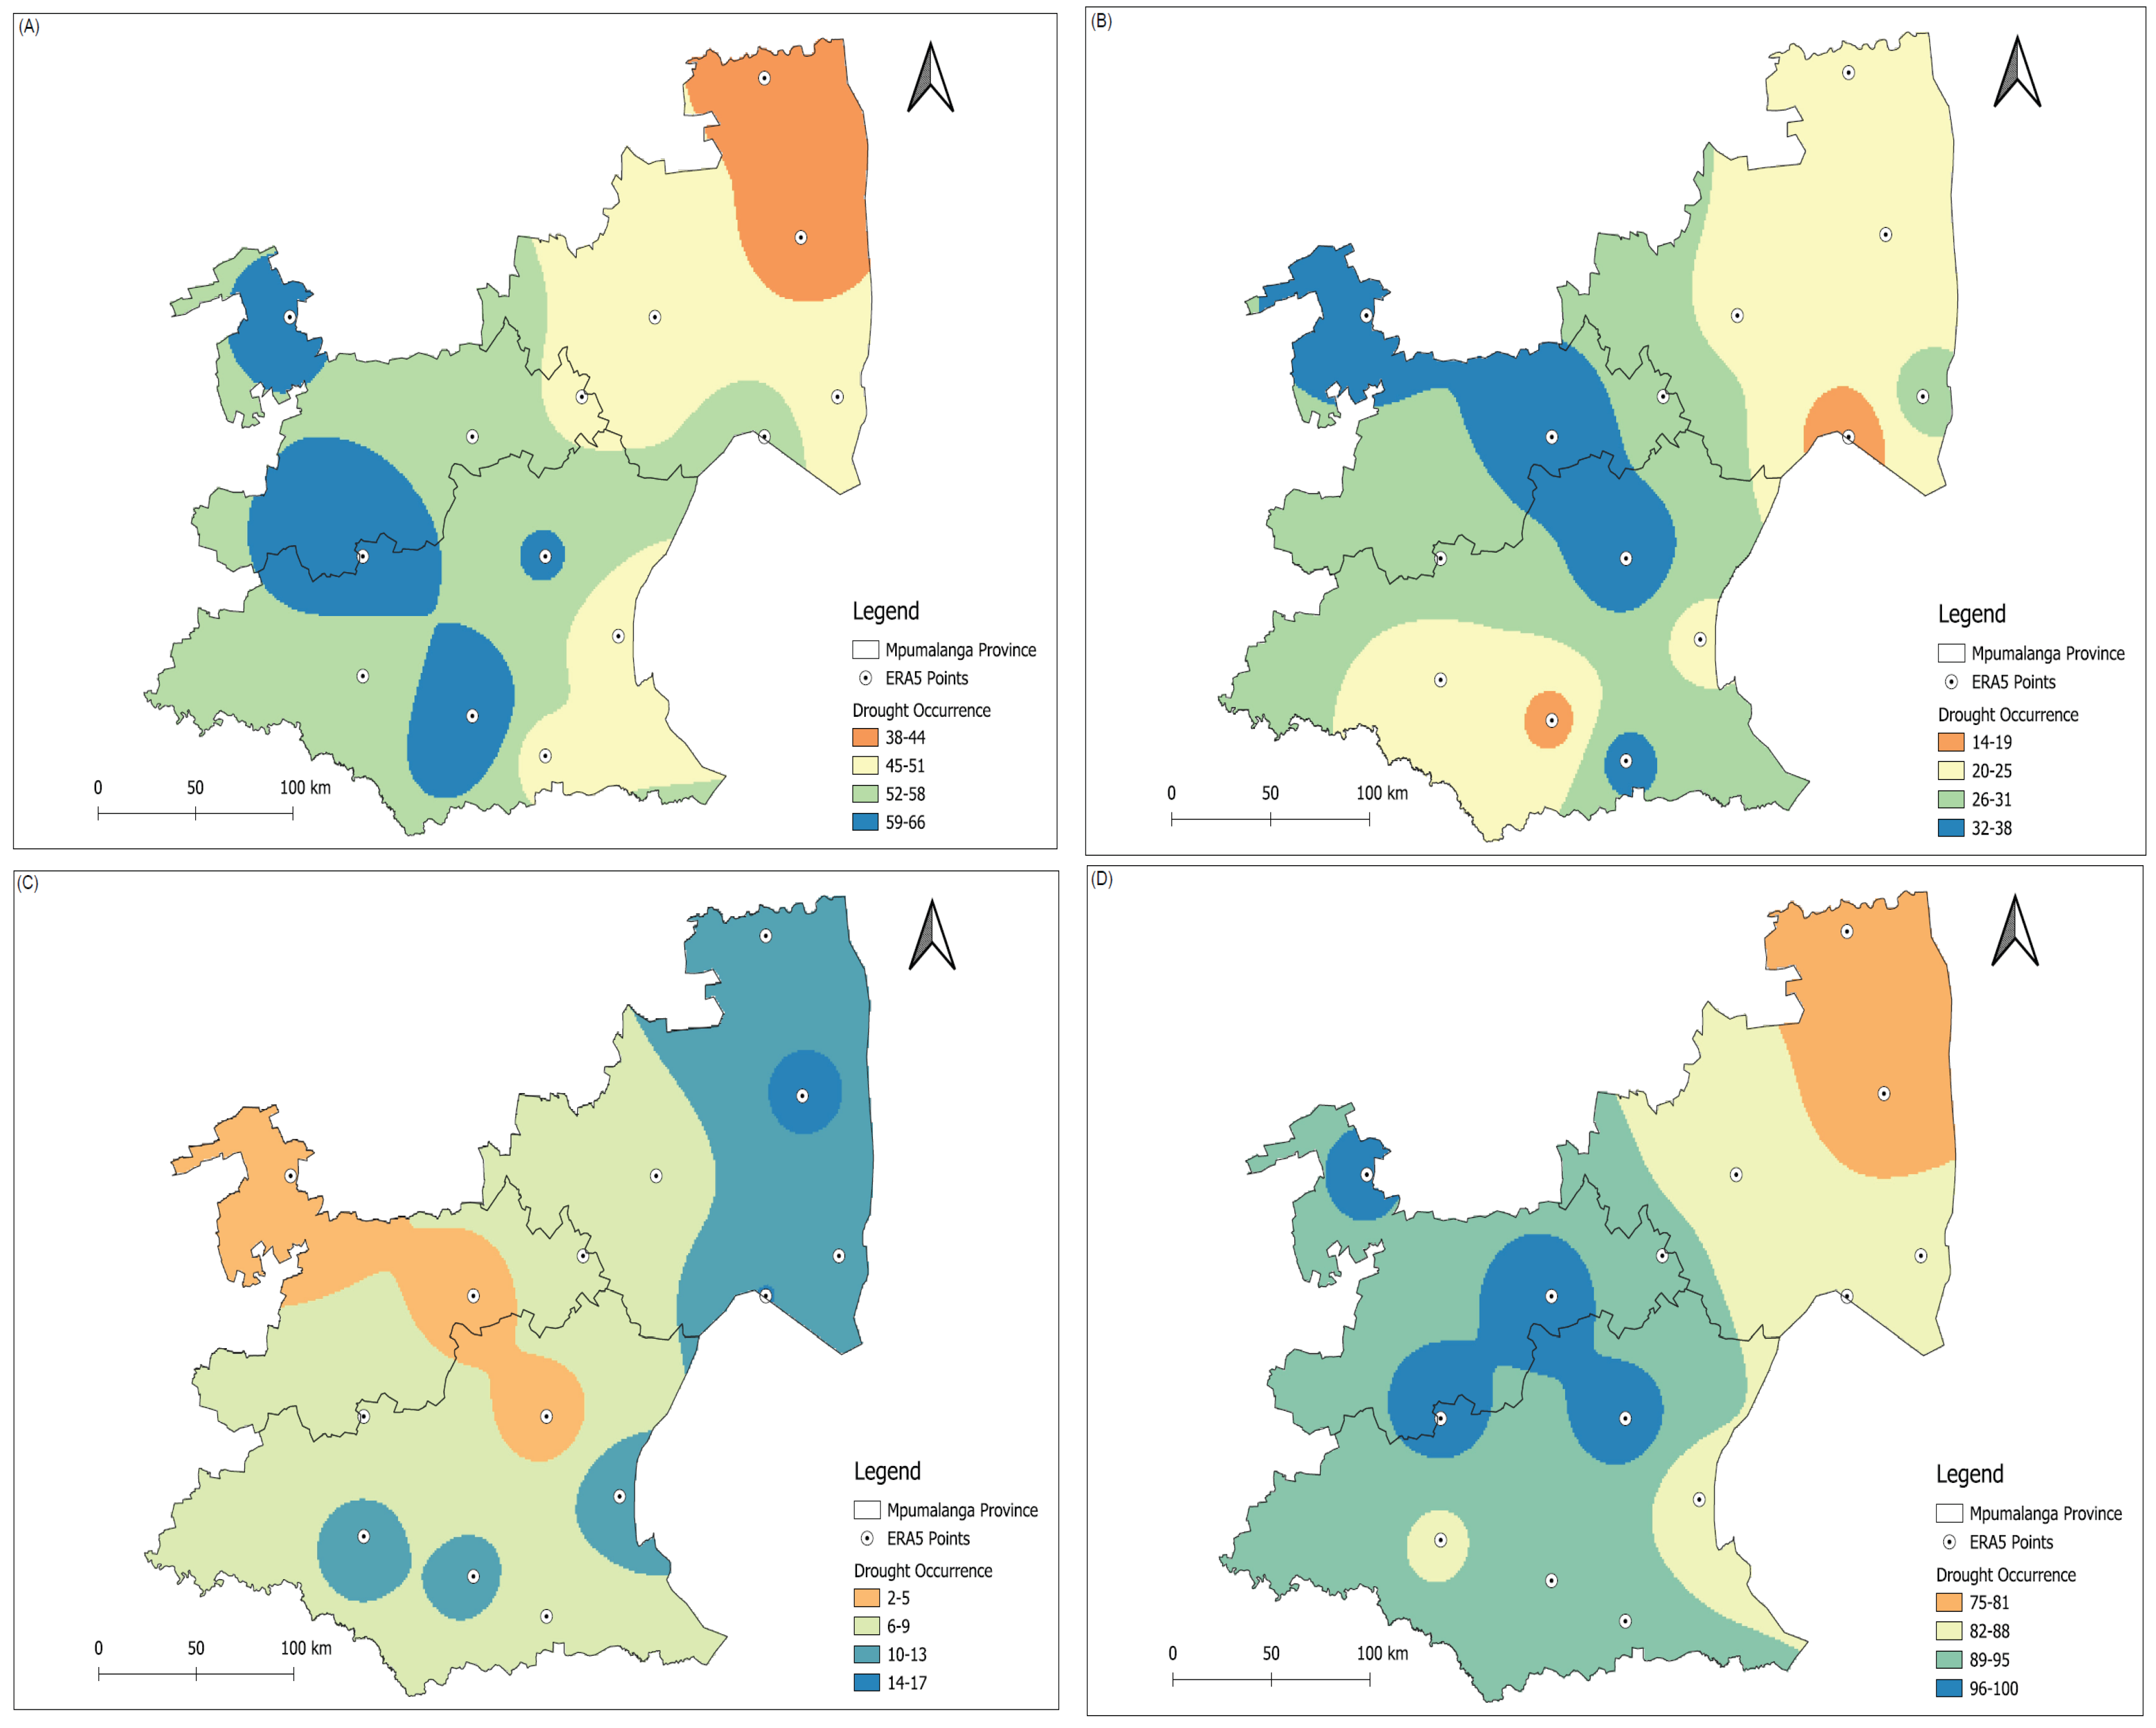

Table 1.
Results of Mann–Kendall’s trend test.
| Stations | Kendall’s Tau | p-Value | Trend |
|---|---|---|---|
| G1 | -0.099 | 0.001 | Decreasing (Significant) |
| G2 | -0.128 | 0.001 | Decreasing (Significant) |
| G3 | -0.099 | 0.001 | Decreasing (Significant) |
| G4 | -0.085 | 0.003 | Decreasing (Significant) |
| G5 | -0.057 | 0.042 | Decreasing (Significant) |
| G6 | -0.117 | 0.001 | Decreasing (Significant) |
| G7 | -0.119 | 0.001 | Decreasing (Significant) |
| G8 | -0.158 | 0.001 | Decreasing (Significant) |
| G9 | -0.108 | 0.001 | Decreasing (Significant) |
| G10 | -0.134 | 0.001 | Decreasing (Significant) |
| G11 | -0.132 | 0.001 | Decreasing (Significant) |
| G12 | -0.166 | 0.002 | Decreasing (Significant) |
| G13 | -0.160 | 0.001 | Decreasing (Significant) |
| G14 | -0.053 | 0.064 | Decreasing (Insignificant) |
Disclaimer/Publisher’s Note: The statements, opinions and data contained in all publications are solely those of the individual author(s) and contributor(s) and not of MDPI and/or the editor(s). MDPI and/or the editor(s) disclaim responsibility for any injury to people or property resulting from any ideas, methods, instructions or products referred to in the content. |
© 2026 by the authors. Licensee MDPI, Basel, Switzerland. This article is an open access article distributed under the terms and conditions of the Creative Commons Attribution (CC BY) license.
Copyright: This open access article is published under a Creative Commons CC BY 4.0 license, which permit the free download, distribution, and reuse, provided that the author and preprint are cited in any reuse.