Submitted:
28 May 2026
Posted:
29 May 2026
You are already at the latest version
Abstract
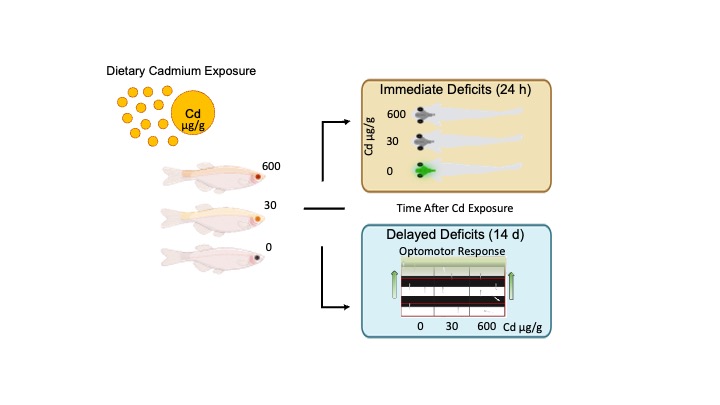
Cadmium (Cd) is a global toxic pollutant and a major foodborne hazard. Its widespread use in industrial processes, including its presence in fertilizers, combined with natural environmental occurrence, has led to persistent contamination of food and water supplies. Ingested Cd has been associated with visual impairments, but early predictors such as disruptions to nervous system function are elusive largely due to the reliance of in vitro and in vitro assays. Here, we examined the effects of human relevant dietary Cd concentrations (0, 30, and 600 µg/g Cd) on in vivo neuronal calcium (Ca²⁺) activity and visually-guided behavior, as assessed by the optomotor response, across multiple exposure windows. We found that human relevant dietary Cd exposure induced immediate deficits in whole brain neuronal activity that preceded impairments in the optomotor response. While Cd disrupted in vivo neuronal Ca²⁺ activity in zebrafish after a single day of exposure, these effects were transient, with differences across treatments diminishing after two weeks. In contrast, optomotor deficits emerged after two weeks of exposure and were concentration dependent. Notably, while alterations in neuronal Ca²⁺ activity occurred at Cd exposure levels comparable to those in human populations, early-life optomotor deficits were observed only at dietary Cd concentrations at the upper limit of human exposures. Overall, these findings demonstrate that ingested Cd poses significant risks to sensitive systems, including the nervous system, with downstream consequences for visually-guided behavior. This study provides insight into early neurophysiological predictors of dietary Cd–induced neurotoxicity and visual dysfunction.
Keywords:
cadmium
; diet
; calcium
; neuronal activity
; optomotor response
; zebrafish
1. Introduction
Cadmium (Cd) is a known carcinogen, mutagen and immunotoxin that is increasing in the environment [1,2,3]. Cd is found in nearly everything we eat, drink and breathe. Diet is the leading source of Cd exposure in the general population (non-occupational and nonsmoking) due to Cd’s near ubiquitous presence in food [2,4,5]. Dietary Cd intake estimates in Europe are 10–30 μg/kg/d [6], with increased risk of consumption with certain foods such as shellfish and rice [7,8,9]. Individuals consuming some seafood were found to have a daily fecal excretion of Cd up to 580 μg, more than 10 times the provisional tolerated weekly intake. Cd accumulation in ocular [10], nervous [11,12], and reproductive [13,14] tissues suggests that Cd exposure is a significant threat to vision, cognition, and development. Increased accumulation of Cd with age, indicates Cd exposure is chronic. Once accumulated, Cd has a biological half-life that can reach decades [15,16]. Nearly ubiquitous presence of Cd in food and ocular tissue highlights the need to test for dietary Cd-induced visuo-behavior disorders [17,18,19,20].
Elevated Cd exposure in humans is linked to deficits in visual acuity and night blindness. Human adult ocular tissue has nearly ubiquitous accumulation of Cd [18,21,22]. Epidemiological and animal studies link some neuro-cognitive disorders with visual impairments (e.g., visuomotor impairments, visual memory deficits – Autism Spectrum Disorders) [23,24,25,26]. Diet is a possible pathway for ocular Cd, as rodents fed human dietary levels of Cd for 7wks showed Cd in the eye [27]. Human ocular studies show that retina Cd levels are 20-fold higher than brain Cd levels [21,22]. An effective assay to test the effects of contaminants on visually-guided behavior is the Optomotor Response (OMR) [28]. The OMR is where the animal moves in the direction of whole-field visual motion to stabilize its position relative to the visual world. The OMR is observed in animals ranging from invertebrates such as cephalopods [29,30] and flies [31] to vertebrates such as zebrafish [32,33], mice [34], and humans [35].
Cadmium intoxication can lead to widespread changes in the central and peripheral nervous system [12,36,37]. Cadmium uptake in adults is minimal and is a greater threat to children and younger animals due to differences in BBB integrity [38]. Rodents that ingested Cd showed deficits in spontaneous and evoked visual electrocortigrams and behavior [39]. Visually-guided behavior may be disrupted by Cd-induced alterations in Ca2+ activity. Alterations in cytosolic Ca2+ can affect the regulation of many neuronal functions [40,41]. Neuronal excitation causes a transient increase in intracellular Ca2+, which in turn mediates a neuronal response. The increase in intracellular Ca2+ is dependent on voltage-dependent channels. Cd inhibits all of the known pathways of cellular Ca2+ influx, and competes with Ca2+ at the voltage-dependent Ca2+ channels [11,42,43]. In some instances, Cd may elevate intracellular Ca2+. For example, disassociated mesencephalic trigeminal neurons of the adult rats exposed to Cd showed elevated concentration of cytoplasmic and nuclear Ca2+ [44]. Examining the relationship between neuronal Ca2+activity and behavior can help us better understand dietary Cd-induced behavioral alterations.
Zebrafish serve as a well-established model to understand how contaminants affect neuro-behavior in the lab [45,46,47,48]. Field-based studies of zebrafish help strengthen ethological relevance of experiments [49,50,51]. Zebrafish like humans rely heavily on vision to navigate their environment [45,52,53]. The visual system in vertebrates is conserved with OMR serving as a translational assay to assess visual acuity [28,54,55]. Cellular differentiation and cellular migration during development, and the Ca2+ signaling activities of zebrafish eyes, brain and stomach, closely mirror patterns observed in mammals, making them valuable for studying physiological and molecular mechanisms underlying toxicant exposures [45,48,56,57]. Zebrafish biomedical toolkit enables the use of mutant and transgenic models to assess neurophysiology including Ca2+ activity in intact animals. Mutant zebrafish, nacre(mitf)w2/w2, lacking melanocytes with the transgene Tg[elavl3:GCaMP5g] are optically clear and are equipped with a genetically encoded calcium indicator that enables to the intracellular visualization of Ca2+ as a proxy for neuronal activity in vivo [58,59].
The goal of the study is to examine neurophysiological changes that may predict dietary Cd-induced visuomotor deficits. This was achieved by assessing the optomotor response and spontaneous Ca2+ activity in vivo in zebrafish fed diets salted with human-relevant concentration of Cd for various days. We hypothesized that dietary Cd would trigger optomotor deficits and these deficits would be preceded by alterations in neuronal activity. We predict that deficits in OMR resulting from dietary Cd exposure will become more pronounced with longer exposure durations and will vary according to dietary Cd concentration.
2. Method
2.1. Zebrafish Care and Maintenance
Adult and larval zebrafish were obtained from lines maintained in the University of Georgia Zebrafish Facility following standard procedures. Nacre(mitf)w2/w2 were originally obtained from the Zebrafish International Research Center (ZIRC). Fish transgenic for Tg[elavl3:GCaMP5g] were obtained from Dr. Ahrens [58,59]. All adult fish were maintained in Aquatic Habitats (Apopka, FL) multi-rack system. Habitat water consisted of reverse osmosis filtered/sterilized water to which sodium bicarbonate and other salts (Instant Ocean, Aquarium Systems, Inc., Mentor, OH, USA) were added to maintain water quality under standard husbandry conditions (Table S1).
2.2. Diet Creation
Diets targeting nominal concentrations of 0, 30 and 600 µg/g Cd were prepared via top coating for three diet granule sizes obtained from Skretting (Stabanger, Norway): GEMMA Micro 75 (50–100 µm pellet size). All diets consisted of 59% protein, 14% oil, and 14% ash. To make each treatment, 40 g of diet was thinly spread in a circular mixing bowl lined with saran wrap. Cadmium Chloride (CdCl2) stock solution was diluted into 24 mL of 70% ethanol inside of 50 mL polypropylene tube (VWR; Cat: 12-565-270) to achieve the appropriate mass for each target nominal concentration. The solution was pipetted onto the diet until the surface was evenly damp, and the diet was mixed thoroughly with a plastic spatula, allowed to dry, and respread across the bowl. This process was repeated until the contents of the bottle were depleted, at which point the polypropylene tube was rinsed thrice with 2 mL of ethanol and rinsate was pipetted onto the diet. Following complete application, the diet was allowed to dry for 6 h and vortexed. The Cd-contaminated diet was thoroughly mixed to ensure homogeneity, distributed into 50 mL polypropylene tubes (Sigma Aldrich; SKU: CLS352070) and stored at 4 °C. The control diet was prepared using the same method, but with only 70% ethanol. Duplicates or triplicates samples of each diet were collected and stored at −20 °C until analytical verification of Cd concentration using Inductively Coupled Plasma Optical Emission Spectroscopy (ICP-OES; see Sections S1–S3). Average measured concentrations in replicate (n = 2-3) diet samples varied from 81-85% of nominal (Table 1) with control diets having Cd levels below the limit of detection (LOD).
2.3. Dietary Exposure
At 14 dpf, the juvenile zebrafish were transferred to tanks with 2.8 L capacity equipped with modified plastic breeder frames (Popetop UPC: 784911901709). The breeder frames were lined with white nylon and spandex blended kneehighs (On The Go Hosiery UPC: 784716506222) at densities of up to 40 fish per breeder frame and put onto an isolated intermittent flow system to facilitate the dietary exposure. Fish were fed the control or Cd-contaminated diets from 14 to 29 dpf, a total of 1, 2, or 14 days (Figure 1A). The amount of food administered was scaled with the number of fish in the breeder frames such that breeder frames with 10-20 fish received an average 11 mg of food and those with 30-40 fish received an average of 22 mg or an average of 0.55-1.1 mg of food per fish three times per day to facilitate normal feeding behavior. Owing to the small size of the fish and feeding behavior during the juvenile life stage, it was not possible to quantify the amount of food consumed. Additionally, water inputs were scheduled within 15–30 min after each feeding to remove uneaten food and circulate water. Tanks received 3-4 water inputs of 2.8 – 5.6 L of system water per input to reach a total of 3–4 tank exchanges per day during the dietary exposure period. Detritus and food debris was removed from tanks daily via siphoning, and water quality (i.e., temperature, pH, conductivity, ammonia, nitrate, and nitrite levels) was monitored daily.
2.4. Genotypes Used for Calcium Imaging and Optomotor Assays
To circumvent pigmentation interfering with calcium imaging, we reduced pigmentation in the fish using genetics. Nacre(mitf)w2/w2, Tg[elavl3:GCaMP5g] juveniles were used as controls for experiments in which neural activity was perturbed using Cd. As a control for the potential effects of nacre(mitf)w2/w2, others have imaged larvae harboring Tg[elavl3:GCaMP5g] but otherwise wild-type after exposure to pharmacological depigmentation agent, PTU, were imaged [58,60,61]. They found no difference in calcium activity between mitf+/+, Tg[elavl3:GCaMP5g] larvae reared in 0.003% PTU and nacre(mitf)w2/w2, Tg[elavl3:GCaMP5g] [62,63]. They did find differences between PTU treated and wild-type (mitf)+/+ and nacre(mitf)w2/w2 in eye size [64], impaired retinal light adaptation [65]), optomotor deficits, and reduced mobility [62], suggesting PTU induced toxicity. Reliable OMR responses are observed in nacre(mitf)w2/w2 fish [66,67,68].
2.5. Calcium Imaging
Calcium imaging was performed on a Zeiss Axio Imager D2 with a 10X objective equipped with a digital camera (AxioCam HSm, Zeiss). Transgenic zebrafish juveniles at 15, 17, and 29 dpf were washed three times in system water and then immobilized with 125 µM of alpha-bungarotoxin (Figure 1B). The fish were then mounted in 1.5% low-melting agarose prepared with system water matching facility conditions in a slide with a bridge coverslip (Figure 1D; method adapted from [69]. Each fish was imaged at approximately the same horizontal plane referenced from the dorsal surface of the optic tectum or hind brain continuously for 30 to 60 minutes with short intermittent breaks for health assessments and perfusion with system water to maintain physiological conditions and to address motion if observed (Figure 1E,F). Images were collected at 1 frame per second or 1 Hz.
2.6. Image Analysis
For calcium image analysis, we scored instances where the fish displayed large-amplitude calcium transients characterized by a rapid, coordinated increase in fluorescence across the hindbrain and optic tectum, followed by a return to baseline. These events were consistent with propagating calcium waves. If a fish exhibited at least one such calcium wave during the imaging period, it was scored as exhibiting a calcium wave (1). If no such large-amplitude fluorescence events were observed during the imaging period, the fish was scored as not exhibiting a calcium wave (0).
2.7. Optomotor Response (OMR) Assay
The OMR assays were performed by washing fish three times with system water to remove any unbound Cd (Figure 1B). We then transferred up to 10 juveniles into each transparent arena channel containing about 0.5-1.0 cm of system water (19.4 x 6.7 x 2.5 cm) Container Store, SKU: 10072023). The shallow water ensured that fish were in a similar plane and limited movement in the z-plane. The arena was located on top of a horizontal screen (Spectre) where the fish were shown a movie (Figure 1C). The monitor was used with the following settings: 80 backlight, 50 brightness, 50 contrast, and a lux range of 74-96. We modified the script of [32] to present a movie with a 330 s acclimation period with a white screen followed by a stimulus consisting of a high-contrast black and white moving grating (cycle length: 2.3 cm; drift speed: 4600 cm/s) for 45 s, which was repeated twice in opposite directions with a 30 s non-moving gray screen in between. While the stimulus was in motion the number of unique fish in each section of the channel was recorded during the first 20 s. We scored the response to the second stimulus presentation as the first stimulus presentation startled the fish. Juvenile fish with typical vision swim in the direction of the moving grating towards the end of the channel. A positive OMR response was recorded as the number of unique fish in the furthest quadrat (or 33% of the channel) in the direction of the moving grating, and other behavior was recorded as no response.
2.8. Statistical Analysis
We used Pearson’s Chi-Squared tests to compare fish exposed to different Cd diets to identify differences in the exhibition of calcium waves for each age. We fit the chi-squared models using the “chisq.test” functions in the stats package, respectively. To assess the effects of Cd diets for different exposure periods on the optomotor response, we fit the logistic regression using “glm” function in the stats package. For general linear models that reached statistical significance, we followed up with Tukey post-hoc test using “emmeans” and “pairs” functions on the log odds in the emmeans package [70]. Our alpha level was 0.05. We used R for all statistical tests [71].
3. Results
3.1. Deficits in Neuronal Calcium Activity are Observed After a Single Day of Dietary Cd
Juvenile fish were exposed to 0, 30, or 600 µg/g Cd beginning at 14 dpf and imaged at 15, 17, and 29 dpf (Figure 2). Calcium waves were defined as large-amplitude fluorescence events spanning the hindbrain and optic tectum. Dietary Cd exposure had concentration and time-dependent effects on calcium activity. Calcium waves occurred in either a hindbrain-to-tectum (H-O) or tectum-to-hindbrain (O-H) direction (Figure 2A,B). At 15 dpf (1 day of exposure), 4/7 control fish exhibited calcium waves, whereas no calcium wave events were observed in fish exposed to 30 µg/g (0/6) or 600 µg/g Cd (0/5) (Figure 2C). This difference in the proportion of fish exhibiting calcium waves among treatments was significant (X2 (2, N = 18) = 8.08, p = 0.02). At 17 dpf (2 days of exposure), calcium wave activity remained reduced in Cd-treated groups, with 2/5 control fish, 1/5 fish exposed to 30 µg/g Cd, and 0/5 fish exposed to 600 µg/g Cd exhibiting calcium waves. Differences among treatments at this time point were not statistically significant (X2 (2, N = 15) = 2.5, p = 0.29). At 29 dpf (14 days of exposure), calcium waves were observed in all treatment groups, with 3/7 control fish, 2/7 fish exposed to 30 µg/g Cd, and 2/7 fish exposed to 600 µg/g Cd exhibiting calcium waves. There were no significant differences in the proportion of fish exhibiting calcium waves among treatments at this time point (X2 (2, N = 21) = 0.43, p = 0.81). Across all ages, control fish exhibited calcium waves more frequently than Cd-treated fish (Figure 2C), resulting in a significant overall treatment (X2 (2, N = 54) = 7.13, p = 0.03). These results indicate an early suppression of calcium wave activity following Cd exposure, followed by partial recovery over time.
3.2. OMR Deficits Emerge After Two Weeks of Dietary Cd
Dietary Cd exposure had exposure length/age and concentration-dependent effects on the optomotor response (Figure 3). A single day of dietary Cd did not affect the OMR in fish fed 30 µg/g Cd with 55% of fish displaying OMR, while the 600 µg/g Cd fed fish showed a 9% reduction in OMR, compared to 58% in the control group. The probability of fish fed 30 µg/g Cd displaying OMR was not significantly affected (B= -0.13, z = -0.29, p = 0.77, Exp (B) = 0.88, 95% CI [0.37, 2.10]). There was a trend for the odds of 600 µg/g fish to display OMR to decrease by 0.39 or have 32% lower probability of exhibiting OMR than control diet fed fish (B = -0.75, z = -1.72, p = 0.09, Exp (B) = 0.47, 95% CI [0.20, 1.10]). After two days of Cd exposure, the 30 µg/g Cd fed fish increased their OMR by 20%, whereas the 0 and 600 µg/g Cd groups maintained similar levels of response. This difference in proportions of OMR by Cd diet at 17 dpf (or 2-days of exposure) did not reach statistical significance for 30 µg/g Cd fish (B = 0.88, z = 1.56, p = 0.12, Exp (B) = 2.40, 95% CI [0.81, 7.47]) or 600 µg/g Cd fish (B = -0.29, z = -0.54, p = 0.59, Exp (B) = 0.75, 95% CI [0.26, 2.14]). After two weeks of dietary exposure, 78% of control fed fish displayed OMR, whereas 4% and 27% fewer 30 and 600 µg/g Cd fed showed OMR, respectively. When comparing fish fed Cd, 23% fewer fish exposed to 600 µg/g Cd than did 30 µg/g Cd group displayed OMR. The probability of 600 µg/g Cd fed fish displaying OMR is 35% lower than control fish. We observed that the odds that 600 µg/g Cd fed fish display OMR decreases by 2.21 (B= -1.24, z = -2.65, p < 0.01, Exp (B) = 0.29, 95% CI [0.11, 0.71]). There was a trend for 600 µg/g fish to display fewer OMR than 30 µg/g fed fish (z = 2.01, p = .11, Tukey). The likelihood of OMR expression was not affected by a two-week exposure to 30 µg/g Cd diet (B = -0.23, z = -0.45, p = 0.66, Exp (B) = 0.79, 95% CI [0.29, 2.22]).
4. Discussion
We found that deficits in the occurrence of spontaneous Ca2+ activity preceded behavioral deficits. After a single day of dietary Cd, there was a reduction in the occurrence of large-amplitude calcium events. After two weeks of dietary Cd, spontaneous large-amplitude Ca2+ activity increased, approaching levels observed in control fish, with lower dietary exposures approaching control levels faster than higher exposures. After two weeks of dietary Cd, deficits in the OMR began to emerge. The similarity between the control and Cd fed fish in spontaneous Ca2+ activity after two weeks of exposure suggests the likelihood of detecting calcium waves may partially recover. However, the progressive deficit in OMR suggests that while large-scale calcium activity patterns may appear to normalize, the circuits or other underlying mechanisms may not.
We observed that Cd fed fish exhibited fewer Ca2+ events after a single day of exposure to diets with an average daily intake of Cd and high levels of Cd, with partial recovery in calcium occurrence over longer exposure durations. This result suggests that Cd absorbed gastrointestinally poses neurotoxic effects. This finding is striking given that the gastrointestinal absorption of Cd is suggested to be 3-7% in humans and ~2% in rodents [3,72,73]. Similarly, mice with the genetically encoded Ca2+ indicator GCaMP6 exposed to 3 mg/L Cd daily through their drinking water for 70 days showed disrupted Ca2+ transients of hippocampal neurons while imaged during an associative learning task [74]. While studies that examine the effects of dietary Cd on Ca2+ activity in vivo are sparse, greater mechanistic insights stem from ex vivo and in vitro studies. The effects of dietary Cd on Ca2+ in the intestine of chickens reveals that Cd competes with Ca2+, as there is a decrease in calcium biding proteins and calcium absorption in chickens fed 3, 10 and 100 mg/day Cd diets, for 3wks (Fullmer et al. 1980). While short-term (< 24h) exposures to Cd can elevate intracellular Ca2+, longer-term exposures to Cd can deplete intracellular Ca2+.
In this study, calcium waves represent large-scale, coordinated calcium activity patterns; however, their occurrence may reflect neuronal activity and indicator properties under Cd exposure. Given that Cd may compete with Ca2+ for calcium binding proteins such as calmodulin and activate similar conformational changes, we cannot rule out that Cd rather than Ca2+ is activating GCaMP5 [75,76,77]. Thus, different mechanisms may be leading to the observed calcium signals over the course of the exposure. That is, Cd may deplete intracellular Ca2+ initially inhibiting calcium wave occurrences and then bind to GCaMP5 leading to detectable calcium signals after longer exposures. Cd competing with Ca2+ for calcium binding proteins is a prevalent issue with the use of Ca2+ indicators in the presence of Cd. To overcome this challenge, a technique with a combination of two indicators with varying affinity for Ca2+ and Cd is used for in vitro studies [78,79]. While this technique is not feasible in vivo Ca2+ imaging studies. Using an approach with a dual combination of genetically encoded zinc sensors that have an affinity for Cd and genetically encoded calcium sensors with a higher affinity for Ca2+ is a possibility [80,81]. Therefore, caution is warranted in interpreting calcium wave occurrence solely as a direct measure of neuronal activity in the presence of Cd. To further interrogate this possibility future studies should examine if the circuit is intact when presented with a visually-evoked stimulus as can be done with pERK/MAPK mapping followed by LA-ICP-MS or autoradiography to localize Cd and Ca2+.
Optomotor deficits are observed after two-weeks of exposure to 600 µg/g but not 30 µg/g Cd diets. The time course and concentration for an effect of dietary Cd on the optomotor response is longer and higher than for waterborne exposures, as deficits are observed after a single exposure to 1 µg/L Cd for 17 h in adult zebrafish [33] and a 66-h exposure to 0.5 µg/L Cd in larval zebrafish [82]. This suggests that Cd exposure through water and dietary routes may have different mechanisms of action. The accumulation time course for Cd also varies by exposure route and organ with dietary Cd increasing weekly and waterborne Cd showing more gradual accumulation in rainbow trout, Cd accumulated at similar rates independent of exposure route in rats [83]. Organs also showed exposure route specific accumulation patterns with some organs (e.g. kidney) showing negligible accumulation of Cd after a week of waterborne exposure and significant accumulation after a week of dietary exposure [84]. Similarly, trout exposed to 3 and 10 µg/L Cd for 1h, 2h, 3h, 10 days, and 30 days showed that Cd had penetrated their blood and reached equilibrium after 3h while other organs continued to accumulate Cd [85]. The divergence between early changes in calcium wave occurrence and later behavioral deficits suggests that disruptions in large-scale neuronal dynamics may precede measurable functional impairment. This raises the possibility that compensatory mechanisms temporarily restore global activity patterns while underlying circuit integrity remains altered. Future studies should test whether waterborne Cd directly penetrates and affects the eyes and whether dietary Cd is absorbed through the gastrointestinal tract [86] and subsequently impacts neural circuits involved in visual processing.
Although we report novel in vivo evidence that dietary Cd exposure alters Ca2+ activity, our study is limited to the measurement of spontaneous neuronal activity. Assessing stimulus-evoked calcium responses could further clarify circuit-level deficits, particularly those related to visual sensory pathways. While we evaluated optomotor responses at a single spatial frequency, examining a broader range of spatial frequencies would better resolve age- and concentration-dependent changes in visual acuity. Integrating measures of whole-body and tissue-specific Cd burden and localization with neuronal activity and visual function assays would improve understanding of the temporal progression, specificity, and underlying mechanisms of Cd toxicity.
5. Conclusions
In summary, the goal of the study was to examine neurophysiological changes that may predict human-relevant dietary Cd-induced visuomotor deficits. Our results show that exposure to Cd at human-relevant levels immediately alters whole-brain activity that precede measurable impairments in the optomotor response. Although dietary Cd exposure disrupted in vivo neuronal Ca²⁺ activity in zebrafish after a single day, these differences were transient, suggesting that more refined, circuit-level analyses are required to detect persistent dysfunction. Once ingested Cd poses significant threats to sensitive systems including the nervous system with cascading effects on visually-guided behavior. Identifying early neurophysiological predictors of long-term behavioral impairments is therefore critical for defining mechanisms of Cd neurotoxicity and for informing early intervention and prevention strategies for environmentally induced neurobehavioral disorders.
Supplementary Materials
The following supporting information can be downloaded at the website of this paper posted on Preprints.org, Section S1. Instrument Analysis by ICP-OES, and Extraction Method for Diet; Section S2. Quantification and Quality Control; Section S3. Accuracy (recovery %), precision (relative standard deviation %), and limits of detection (LOD) and quantification (LOQ) for Cd in the diet matrices; Section S3. Accuracy (recovery %), precision (relative standard deviation %), and limits of detection (LOD) and quantification (LOQ) for Cd in the diet matrices.
Acknowledgments
The authors thank Jalen Gordon, Julia Dallman, Yang Liu, Yongkai Chen, Peter Kner and members of the Shelton for comments on earlier versions of this work. This work was supported by the National Institutes of Health National Institute of Environmental Health Sciences R00ES030398 and R00ES030398-04S1 (Principal Investigator: Shelton), VA-BLRD MERIT Award I01BX006593 (Principal Investigator: Lombard), and State of Florida appropriation (Principal Investigator: Kobetz) to the University of Miami (UM) Sylvester Comprehensive Cancer Center and the National Cancer Institute of the National Institutes of Health under Award Number P30CA240139.
Institutional Review Board Statement
All experimental procedures were conducted in accordance with National Institutes of Health guidelines for use of zebrafish in research under protocols approved and overseen by the University of Georgia Institutional Animal Care and Use Committee AUP# A2021 01-006-Y3-A2 on 2-18-2021.
Conflicts of Interest
The authors declare no conflict of interest.
Data Availability
The data will be accessible through DryRad.
References
- Anetor, J. I. Rising Environmental Cadmium Levels in Developing Countries: Threat to Genome Stability and Health. Niger. J. Physiol. Sci. 2012, 27(2), 103–115. [Google Scholar] [CrossRef]
- Järup, L.; Akesson, A. Current Status of Cadmium as an Environmental Health Problem. Toxicol. Appl. Pharmacol. 2009, 238(3), 201–208. [Google Scholar] [CrossRef]
- Nordberg, G. F.; Nogawa, K.; Nordberg, M. Cadmium. In Handbook on the Toxicology of Metals (Fourth Edition); Academic Press: San Diego, 2015; pp. 667–716. [Google Scholar] [CrossRef]
- Agency for Toxic Substances and Disease Registry. Substance Priority List, 2022. Available online: https://www.atsdr.cdc.gov/spl/index.html (accessed on 2024-03-05).
- Satarug, S. How Adequate Are the Guidelines for Dietary and Workplace Exposure to Cadmium? Toxics 2026, 14(5), 408. [Google Scholar] [CrossRef]
- Nasreddine, L.; Parent-Massin, D. Food Contamination by Metals and Pesticides in the European Union. Should We Worry? Toxicol. Lett. 2002, 127(1), 29–41. [Google Scholar] [CrossRef]
- McKenzie-Parnell, J. M.; Kjellstrom, T. E.; Sharma, R. P.; Robinson, M. F. Unusually High Intake and Fecal Output of Cadmium, and Fecal Output of Other Trace Elements in New Zealand Adults Consuming Dredge Oysters. Environ. Res. 1988, 46(1), 1–14. [Google Scholar] [CrossRef] [PubMed]
- Panel, E. C. Scientific Opinion on Cadmium in Food. EFSA J. 2009, 7(10), 980. [Google Scholar]
- Satarug, S.; Moore, M. R. Adverse Health Effects of Chronic Exposure to Low-Level Cadmium in Foodstuffs and Cigarette Smoke. Environ. Health Perspect. 2004, 112(10), 1099. [Google Scholar] [CrossRef]
- Wills, N. K.; Ramanujam, V. M. S.; Chang, J.; Kalariya, N.; Lewis, J. R.; Weng, T.-X.; van Kuijk, F. J. G. M. Cadmium Accumulation in the Human Retina: Effects of Age, Gender, and Cellular Toxicity. Exp. Eye Res. 2008, 86(1), 41–51. [Google Scholar] [CrossRef] [PubMed]
- Méndez-Armenta, M.; Ríos, C. Cadmium Neurotoxicity. Environ. Toxicol. Pharmacol. 2007, 23(3), 350–358. [Google Scholar] [CrossRef]
- Wang, B.; Du, Y. Cadmium and Its Neurotoxic Effects. Oxidative Med. Cell. Longev. 2013. [Google Scholar] [CrossRef] [PubMed]
- Bhardwaj, J. K.; Panchal, H.; Saraf, P. Cadmium as a Testicular Toxicant: A Review. J. Appl. Toxicol. 2021, 41(1), 105–117. [Google Scholar] [CrossRef]
- Varga, B.; Zsolnai, B.; Paksy, K.; Náray, M.; Ungváry, Gy. Age Dependent Accumulation of Cadmium in the Human Ovary. Reprod. Toxicol. 1993, 7(3), 225–228. [Google Scholar] [CrossRef]
- Genchi, G.; Sinicropi, M. S.; Lauria, G.; Carocci, A.; Catalano, A. The Effects of Cadmium Toxicity. Int. J. Environ. Res. Public Health 2020, 17(11), 3782. [Google Scholar] [CrossRef]
- Suwazono, Y.; Kido, T.; Nakagawa, H.; Nishijo, M.; Honda, R.; Kobayashi, E.; Dochi, M.; Nogawa, K. Biological Half-Life of Cadmium in the Urine of Inhabitants after Cessation of Cadmium Exposure. Biomarkers 2009, 14(2), 77–81. [Google Scholar] [CrossRef]
- Chenjin, Z. Exposure Assessments of Cadmium and Lead with Age-Related Eye Disease: A Systematic Review and Meta-Analysis. J. Trace Elem. Med. Biol. 2025, 89, 127631. [Google Scholar] [CrossRef] [PubMed]
- Ebrahimi, M.; Ebrahimi, M.; Vergroesen, J. E.; Aschner, M.; Sillanpää, M. Environmental Exposures to Cadmium and Lead as Potential Causes of Eye Diseases. J. Trace Elem. Med. Biol. 2024, 82, 127358. [Google Scholar] [CrossRef] [PubMed]
- Igwe, A. N.; Callwood, K. A.; Shelton, D. S. Restoring Landscapes and Communities: Insights from Critical, Urban, and Plant Ecology. Environ. Sci. Ecotechnology 2025, 100601. [Google Scholar] [CrossRef] [PubMed]
- Wang, R.; Sang, P.; Guo, Y.; Jin, P.; Cheng, Y.; Yu, H.; Xie, Y.; Yao, W.; Qian, H. Cadmium in Food: Source, Distribution and Removal. Food Chem. 2023, 405, 134666. [Google Scholar] [CrossRef]
- Bush, V. J.; Moyer, T. P.; Batts, K. P.; Parisi, J. E. Essential and Toxic Element Concentrations in Fresh and Formalin-Fixed Human Autopsy Tissues. Clin. Chem. 1995, 41(2), 284–294. [Google Scholar] [CrossRef]
- Erie, J. C.; Butz, J. A.; Good, J. A.; Erie, E. A.; Burritt, M. F.; Cameron, J. D. Heavy Metal Concentrations in Human Eyes. Am. J. Ophthalmol. 2005, 139(5), 888–893. [Google Scholar] [CrossRef]
- Blair, R. J. R.; Frith, U.; Smith, N.; Abell, F.; Cipolotti, L. Fractionation of Visual Memory: Agency Detection and Its Impairment in Autism. Neuropsychologia 2002, 40(1), 108–118. [Google Scholar] [CrossRef]
- Holloway, W. R.; Thor, D. H. Cadmium Exposure in Infancy: Effects on Activity and Social Behaviors of Juvenile Rats. Neurotoxicology Teratol. 1988, 10(2), 135–142. [Google Scholar] [CrossRef]
- Viaene, M. K.; Masschelein, R.; Leenders, J.; De Groof, M.; Swerts, L.; Roels, H. A. Neurobehavioural Effects of Occupational Exposure to Cadmium: A Cross Sectional Epidemiological Study. Occup. Environ. Med. 2000, 57(1), 19–27. [Google Scholar] [CrossRef] [PubMed]
- Vogel, S. A. Gender Differences in Intelligence, Language, Visual-Motor Abilities, and Academic Achievement in Students with Learning Disabilities: A Review of the Literature. J. Learn. Disabil. 1990, 23(1), 44–52. [Google Scholar] [CrossRef] [PubMed]
- Jamall, I. S.; Roque, H. Cadmium-Induced Alterations in Ocular Trace Elements. Biol. Trace Elem. Res. 1989, 23(1), 55–63. [Google Scholar] [CrossRef] [PubMed]
- Simões, P.; Moya-Díaz, J.; Lagnado, L. Quantifying the Link between Retinal Performance and the Optomotor Response. Curr. Biol. 2025, 35(16), 3908–3919.e4. [Google Scholar] [CrossRef]
- Messenger, J. B. Optomotor Responses and Nystagmus in Intact, Blinded and Statocystless Cuttlefish (Sepia Officinalis L.). J. Exp. Biol. 1970, 53, 789–796. [Google Scholar] [CrossRef]
- Pungor, J. R.; Niell, C. M. The Neural Basis of Visual Processing and Behavior in Cephalopods. Curr. Biol. 2023, 33(20), R1106–R1118. [Google Scholar] [CrossRef]
- McCann, G. D.; MacGinitie, G. F. Optomotor Response Studies of Insect Vision. Proc. R. Soc. London. Ser. B. Biol. Sci. 1965, 163(992), 369–401. [Google Scholar] [CrossRef]
- LeFauve, M. K.; Rowe, C. J.; Crowley-Perry, M.; Wiegand, J. L.; Shapiro, A. G.; Connaughton, V. P. Using a Variant of the Optomotor Response as a Visual Defect Detection Assay in Zebrafish. J. Biol. Methods 2021, 8(1), e144. [Google Scholar] [CrossRef]
- Shelton, D. S.; Dinges, Z. M.; Khemka, A.; Sykes, D. J.; Suriyampola, P. S.; Shelton, D. E. P.; Boyd, P.; Kelly, J. R.; Bower, M.; Amro, H.; Glaholt, S. P.; Latta, M. B.; Perkins, H. L.; Shaw, J. R.; Martins, E. P. A Pair of Cadmium-Exposed Zebrafish Affect Social Behavior of the Un-Exposed Majority. Environ. Toxicol. Pharmacol. 2023, 104119. [Google Scholar] [CrossRef]
- Abdeljalil, J.; Hamid, M.; Abdel-Mouttalib, O.; Stéphane, R.; Raymond, R.; Johan, A.; José, S.; Pierre, C.; Serge, P. The Optomotor Response: A Robust First-Line Visual Screening Method for Mice. Vis. Res. 2005, 45(11), 1439–1446. [Google Scholar] [CrossRef]
- Tauber, E. S.; Koffler, S. Optomotor Response in Human Infants to Apparent Motion: Evidence of Innateness. Science 1966, 152(3720), 382–383. [Google Scholar] [CrossRef]
- Arruebarrena, M. A.; Hawe, C. T.; Lee, Y. M.; Branco, R. C. Mechanisms of Cadmium Neurotoxicity. Int. J. Mol. Sci. 2023, 24(23), 16558. [Google Scholar] [CrossRef]
- Midhusha, M. S.; Manjesh, M. A Review of Cadmium-Induced Neurotoxicity in Zebrafish: From Established Ionic Forms to Emerging Cadmium Sulphide Nanoparticles. Toxicol. Res. 2026, 15(2), tfag027. [Google Scholar] [CrossRef]
- Schmitt, G.; Parrott, N.; Prinssen, E.; Barrow, P. The Great Barrier Belief: The Blood–Brain Barrier and Considerations for Juvenile Toxicity Studies. Reprod. Toxicol. 2017, 72, 129–135. [Google Scholar] [CrossRef]
- Papp, A.; Nagymajtényi, L.; Dési, I. A Study on Electrophysiological Effects of Subchronic Cadmium Treatment in Rats. Environ. Toxicol. Pharmacol. 2003, 13(3), 181–186. [Google Scholar] [CrossRef]
- Brini, M.; Calì, T.; Ottolini, D.; Carafoli, E. Neuronal Calcium Signaling: Function and Dysfunction. Cell. Mol. Life Sci. 2014, 71(15), 2787–2814. [Google Scholar] [CrossRef] [PubMed]
- Pikor, D.; Hurła, M.; Słowikowski, B.; Szymanowicz, O.; Poszwa, J.; Banaszek, N.; Drelichowska, A.; Jagodziński, P. P.; Kozubski, W.; Dorszewska, J. Calcium Ions in the Physiology and Pathology of the Central Nervous System. Int. J. Mol. Sci. 2024, 25(23), 13133. [Google Scholar] [CrossRef] [PubMed]
- Usai, C.; Barberis, A.; Moccagatta, L.; Marchetti, C. Pathways of Cadmium Influx in Mammalian Neurons. J. Neurochem. 1999, 72(5), 2154–2161. [Google Scholar] [CrossRef] [PubMed]
- Viarengo, A.; Nicotera, P. Possible Role of Ca2+ in Heavy Metal Cytotoxicity. Comp. Biochem. Physiol. Part C Comp. Pharmacol. 1991, 100(1–2), 81–84. [Google Scholar] [CrossRef]
- Yoshida, S. Re-Evaluation of Acute Neurotoxic Effects of Cd2+ on Mesencephalic Trigeminal Neurons of the Adult Rat. Brain Res. 2001, 892(1), 102–110. [Google Scholar] [CrossRef]
- Baier, H.; Scott, E. K. The Visual Systems of Zebrafish. Annu. Rev. Neurosci. 2024, 47((Volume 47), 255–276. [Google Scholar] [CrossRef]
- Kumar, R.; Dhiman, P.; Singh, D. Zebrafish as a Model Organism to Study Neurotoxicity: A Potential Tool for Neuroprotective Drug Discovery. 2026. [Google Scholar] [CrossRef] [PubMed]
- Lin, W.; Huang, Z.; Zhang, W.; Ren, Y. Investigating the Neurotoxicity of Environmental Pollutants Using Zebrafish as a Model Organism: A Review and Recommendations for Future Work. NeuroToxicology 2023, 94, 235–244. [Google Scholar] [CrossRef] [PubMed]
- Okutsu, J.; Noor, M. I.; Shelton, D. S. Swimming into View: Zebrafish Uncover Targets, Mechanisms, and Therapies for Cadmium Toxicity. Curr. Envir Health Rpt 2025, 12(1), 20. [Google Scholar] [CrossRef] [PubMed]
- Kelly, J. R.; Shelton, S. G.; Daniel, D. K.; Bhat, A.; Mondal, R.; Nipple, F.; Amro, H.; Bower, M. E.; Isaac, G.; McHaney, G.; Martins, E. P.; Shelton, D. S. Wild Zebrafish Sentinels: Biological Monitoring of Site Differences Using Behavior and Morphology. Toxics 2021, 9(7), 165. [Google Scholar] [CrossRef]
- Shelton, D. S.; Shelton, S. G.; Daniel, D. K.; Raja, M.; Bhat, A.; Tanguay, R. L.; Higgs, D. M.; Martins, E. P. Collective Behavior in Wild Zebrafish. Zebrafish 2020, 17(4), 243–252. [Google Scholar] [CrossRef]
- Suriyampola, P. S.; Shelton, D. S.; Shukla, R.; Roy, T.; Bhat, A.; Martins, E. P. Zebrafish Social Behavior in the Wild. Zebrafish 2016, 13(1), 1–8. [Google Scholar] [CrossRef]
- Ekstrom, A. D. Why Vision Is Important to How We Navigate. Hippocampus 2015, 25(6), 731–735. [Google Scholar] [CrossRef]
- Suriyampola, P. S.; Cacéres, J.; Martins, E. P. Effects of Short-Term Turbidity on Sensory Preference and Behaviour of Adult Fish. Anim. Behav. 2018, 146, 105–111. [Google Scholar] [CrossRef]
- Lamb, T. D.; Collin, S. P.; Pugh, E. N. Evolution of the Vertebrate Eye: Opsins, Photoreceptors, Retina and Eye Cup. Nat. Rev. Neurosci. 2007, 8(12), 960–976. [Google Scholar] [CrossRef]
- Vöcking, O.; Macias-Muñoz, A.; Jaeger, S. J.; Oakley, T. H. Deep Diversity: Extensive Variation in the Components of Complex Visual Systems across Animals. Cells 2022, 11(24), 3966. [Google Scholar] [CrossRef]
- Alsop, D.; Wood, C. M. Metal Uptake and Acute Toxicity in Zebrafish: Common Mechanisms across Multiple Metals. Aquat. Toxicol. 2011, 105(3), 385–393. [Google Scholar] [CrossRef]
- Wallace, K. N.; Pack, M. Unique and Conserved Aspects of Gut Development in Zebrafish. Dev. Biol. 2003, 255(1), 12–29. [Google Scholar] [CrossRef] [PubMed]
- Ahrens, M. B.; Huang, K.-H.; Narayan, S.; Mensh, B. D.; Engert, F. Two-Photon Calcium Imaging during Fictive Navigation in Virtual Environments. Front. Neural Circuits 2013, 7. [Google Scholar] [CrossRef] [PubMed]
- Ahrens, M. B.; Orger, M. B.; Robson, D. N.; Li, J. M.; Keller, P. J. Whole-Brain Functional Imaging at Cellular Resolution Using Light-Sheet Microscopy. Nat. Methods 2013, 10(5), 413–420. [Google Scholar] [CrossRef] [PubMed]
- Liu, Y.; Dale, S.; Ball, R.; Vanleuven, A. J.; Sornborger, A.; Lauderdale, J. D.; Kner, P. Imaging Neural Events in Zebrafish Larvae with Linear Structured Illumination Light Sheet Fluorescence Microscopy. Neurophotonics 2019, 6(1). [Google Scholar] [CrossRef]
- Liu, Y.; Liu, B.; Green, J.; Duffy, C.; Song, M.; Lauderdale, J. D.; Kner, P. Volumetric Light Sheet Imaging with Adaptive Optics Correction. Biomed. Opt. Express BOE 2023, 14(4), 1757–1771. [Google Scholar] [CrossRef]
- Antinucci, P.; Hindges, R. A Crystal-Clear Zebrafish for in Vivo Imaging. Sci. Rep. 2016, 6(1), 29490. [Google Scholar] [CrossRef]
- Liu, Y.; Chen, Y.; Duffy, C. R.; VanLeuven, A. J.; Byers, J. B.; Schriever, H. C.; Ball, R. E.; Carpenter, J. M.; Gunderson, C. E.; Filipov, N. M.; Ma, P.; Kner, P. A.; Lauderdale, J. D. Decreased GABA Levels during Development Result in Increased Connectivity in the Larval Zebrafish Tectum. bioRxiv 2024, 2024, 09.11.612511. [Google Scholar] [CrossRef]
- Li, Z.; Ptak, D.; Zhang, L.; Walls, E. K.; Zhong, W.; Leung, Y. F. Phenylthiourea Specifically Reduces Zebrafish Eye Size. PLoS ONE 2012, 7(6), e40132. [Google Scholar] [CrossRef] [PubMed]
- Orger, M. B.; Gahtan, E.; Muto, A.; Page-McCaw, P.; Smear, M. C.; Baier, H. Behavioral Screening Assays in Zebrafish. In Methods in Cell Biology; Academic Press, 2004; Vol. 77, pp. 53–68. [Google Scholar] [CrossRef]
- Jordi, J.; Guggiana-Nilo, D.; Bolton, A. D.; Prabha, S.; Ballotti, K.; Herrera, K.; Rennekamp, A. J.; Peterson, R. T.; Lutz, T. A.; Engert, F. High-Throughput Screening for Selective Appetite Modulators: A Multibehavioral and Translational Drug Discovery Strategy. Sci. Adv. 2018, 4(10), eaav1966. [Google Scholar] [CrossRef] [PubMed]
- Orger, M. B.; Kampff, A. R.; Severi, K. E.; Bollmann, J. H.; Engert, F. Control of Visually Guided Behavior by Distinct Populations of Spinal Projection Neurons. Nat. Neurosci. 2008, 11(3), 327–333. [Google Scholar] [CrossRef]
- Uribe-Arias, A.; Rozenblat, R.; Vinepinsky, E.; Marachlian, E.; Kulkarni, A.; Zada, D.; Privat, M.; Topsakalian, D.; Charpy, S.; Candat, V.; Nourin, S.; Appelbaum, L.; Sumbre, G. Radial Astrocyte Synchronization Modulates the Visual System during Behavioral-State Transitions. Neuron 2023, 111(24), 4040–4057.e6. [Google Scholar] [CrossRef] [PubMed]
- Westerfield, M. The Zebrafish Book; A Guide for the Laboratory Use of Zebrafish (Danio Rerio), 2007. Available online: https://cir.nii.ac.jp/crid/1370283694361132063 (accessed on 2026-04-23).
- Lenth, R.; Singmann, H.; Love, J.; Buerkner, P.; Herve, M. Emmeans: Estimated Marginal Means, Aka Least-Squares Means. R Package Version 2018, 1(1), 3. [Google Scholar]
- R Core Team. R: A Language and Environment for Statistical Computing. 2015. [Google Scholar]
- Foulkes, E. C. Absorption of Cadmium. In Cadmium; Foulkes, E. C., Ed.; Springer Berlin Heidelberg: Berlin, Heidelberg, 1986; Vol. 80, pp. 75–100. [Google Scholar] [CrossRef]
- Nordberg, G. F.; Kjellström, T.; Nordberg, M. Kinetics and Metabolism. In Cadmium and Health; CRC Press, 1985. [Google Scholar]
- Matsushita, M. T.; Xia, Z. Cadmium Inhibits Calcium Activity in Hippocampal CA1 Neurons of Freely Moving Mice. Toxicol. Sci. 2024, 200(1), 199–212. [Google Scholar] [CrossRef]
- Choong, G.; Liu, Y.; Templeton, D. M. Interplay of Calcium and Cadmium in Mediating Cadmium Toxicity. Chem.-Biol. Interact. 2014, 211, 54–65. [Google Scholar] [CrossRef]
- Scott, B. J.; Bradwell, A. R. Identification of the Serum Binding Proteins for Iron, Zinc, Cadmium, Nickel, and Calcium. Clin. Chem. 1983, 29(4), 629–633. [Google Scholar] [CrossRef]
- Washko, P. W.; Cousins, R. J. Role of Dietary Calcium and Calcium Binding Protein in Cadmium Toxicity in Rats. J. Nutr. 1977, 107(5), 920–928. [Google Scholar] [CrossRef]
- Malaiyandi, L. M.; Sharthiya, H.; Barakat, A. N.; Edwards, J. R.; Dineley, K. E. Using FluoZin-3 and Fura-2 to Monitor Acute Accumulation of Free Intracellular Cd2+ in a Pancreatic Beta Cell Line. Biometals 2019, 32(6), 951–964. [Google Scholar] [CrossRef]
- Xu, S.; Pi, H.; Chen, Y.; Zhang, N.; Guo, P.; Lu, Y.; He, M.; Xie, J.; Zhong, M.; Zhang, Y.; Yu, Z.; Zhou, Z. Cadmium Induced Drp1-Dependent Mitochondrial Fragmentation by Disturbing Calcium Homeostasis in Its Hepatotoxicity. Cell Death Dis. 2013, 4(3), e540–e540. [Google Scholar] [CrossRef]
- Jia, H.; Luo, K. Q. Fluorescence Resonance Energy Transfer-Based Sensor Zebrafish for Detecting Toxic Agents with Single-Cell Sensitivity. J. Hazard. Mater. 2021, 408, 124826. [Google Scholar] [CrossRef]
- Liu, C.; Hu, Q.; Jin, L.; Zhu, J.; Tang, W.; Wang, J.; Feng, Y.; Chen, H. Redesign of Calmodulin for Genetically Encoded Zn2+ Sensing with High Dynamic Range. Chem. Biomed. Imaging 2025. [Google Scholar] [CrossRef]
- LeFauve, M. K.; Connaughton, V. P. Developmental Exposure to Heavy Metals Alters Visually-Guided Behaviors in Zebrafish. Curr. Zool. 2017, 63(2), 221–227. [Google Scholar] [CrossRef] [PubMed]
- Asagba, S. O. Comparative Effect of Water and Food-Chain Mediated Cadmium Exposure in Rats. Biometals 2010, 23(6), 961–971. [Google Scholar] [CrossRef] [PubMed]
- Franklin, N. M.; Glover, C. N.; Nicol, J. A.; Wood, C. M. Calcium/Cadmium Interactions at Uptake Surfaces in Rainbow Trout: Waterborne versus Dietary Routes of Exposure. Environ. Toxicol. Chem. 2005, 24(11), 2954–2964. [Google Scholar] [CrossRef]
- Hollis, L.; McGeer, J. C.; McDonald, D. G.; Wood, C. M. Cadmium Accumulation, Gill Cd Binding, Acclimation, and Physiological Effects during Long Term Sublethal Cd Exposure in Rainbow Trout. Aquat. Toxicol. 1999, 46(2), 101–119. [Google Scholar] [CrossRef]
- Bishak, Y. K.; Payahoo, L.; Osatdrahimi, A.; Nourazarian, A. Mechanisms of Cadmium Carcinogenicity in the Gastrointestinal Tract. Asian Pac. J. Cancer Prev. 2015, 16(1), 9–21. [Google Scholar] [CrossRef]
- Hasan, D.; Russo, C. J.; McLaughlin, K. R.; Pirelli, G.; Bionaz, M. Status of Selenium and Other Essential and Toxic Elements in Oregon Grazing Sheep. Animals 2025, 15(12), 1799. [Google Scholar] [CrossRef]
Figure 1.
A) Exposure regime of the zebrafish to 0, 30, 600 µg/g Cd diets for 1, 2, or 14 days beginning at 14 dpf. B) After exposure the fish were washed three times in system water and then prepped for the optomotor response or calcium imaging assays. C) Optomotor response was assessed with a 30s stimulus after a 300 s acclimation and a 30 s pre-stimulus period. Fish were presented different stimuli on a monitor below their transparent arenas. During the acclimation period fish were uniformly distributed. During the 20 s grating stimulus presentation, the number of fish entering the target zone were counted. D) Calcium imaging was done after exposure to α-Bungarotoxin to induce paralysis prior to embedding the fish in agarose with a 10X objective to monitor whole brain activity for 30-60 min. E) Schematic of the brain regions of the zebrafish. F) Representative image of a 17dpf nacre(mitf)w2/w2, Tg[elavl3:GCaMP5g] zebrafish.

Figure 2.
A) Representative images of the hindbrain (H) and optic tectum (O) of 15 dpf zebrafish exposed to 0, 30, and 600 µg/g Cd, shown across four consecutive time points using a 10X objective. Control fish (0 µg/g Cd) exhibit a calcium wave, visible as a large-amplitude increase in fluorescence spanning the hindbrain and optic tectum, whereas fish exposed to 30 and 600 µg/g Cd do not display such events. B) Representative image sequences from a 0 µg/g Cd control fish at 17 dpf showing calcium waves propagating from the hindbrain to the optic tectum (H-O) and from the optic tectum to the hindbrain (O-H). C) Proportion of fish exhibiting calcium waves at 15, 17, and 29 dpf. At 15 dpf, calcium waves are observed in control fish but not in Cd-treated fish. At 17 dpf, calcium waves are observed in a subset of fish across groups. By 29 dpf, calcium waves are observed in all treatment groups. Green bar heights and insets indicate the proportion of fish exhibiting at least one calcium wave during the imaging period.

Figure 3.
Two weeks of Cd exposure lead to attenuated OMR responses in 600, but not 30 µg/g Cd fed fish. A single day of Cd diet (or 15 dpf) did not affect the OMR response of 30 and 600 µg/g Cd fed fish. Two days of Cd diets (or 17 dpf) did not significantly affect the odds of exhibiting OMR. Two weeks of Cd diets (or at 29 dpf), led to deficits in the display of OMR in 600 µg/g Cd fed fish, but not 30 µg/g Cd fed fish. The proportion of fish exhibiting OMR is shown in each bar of the figure.


Table 1.
Analytical Validation of Cd Concentration in Diet.
| Diet Granule Size (micron) | Nominal Concentration (µg/g) | Mean Concentration + SD (µg/g) |
Cd Recovery (%) |
|---|---|---|---|
| 75 | 0 | < LOD | < LOD |
| 30 | 24.3 + 6.75 | 81 | |
| 600 | 502.6 + 19.76 | 84 | |
| 150 | 0 | < LOD | < LOD |
| 30 | 25.4 + 2.23 | 85 | |
| 600 | 509.5 + 17.82 | 85 | |
| 300 | 0 | < LOD | < LOD |
| 30 | 24.97 + 2.37 | 83 | |
| 600 | 501.1 + 17.30 | 84 |
Disclaimer/Publisher’s Note: The statements, opinions and data contained in all publications are solely those of the individual author(s) and contributor(s) and not of MDPI and/or the editor(s). MDPI and/or the editor(s) disclaim responsibility for any injury to people or property resulting from any ideas, methods, instructions or products referred to in the content. |
© 2026 by the authors. Licensee MDPI, Basel, Switzerland. This article is an open access article distributed under the terms and conditions of the Creative Commons Attribution (CC BY) license (http://creativecommons.org/licenses/by/4.0/).
Copyright: This open access article is published under a Creative Commons CC BY 4.0 license, which permit the free download, distribution, and reuse, provided that the author and preprint are cited in any reuse.


