

Submitted:
26 May 2026
Posted:
28 May 2026
You are already at the latest version
Abstract
To study the mechanism of high-altitude geological disastes, the shear process, dilatancy, stress axis rotation, and shear modulus of colluvial coarse-grained soil under different factors were investigated by experiments, and these factor sensitivity and mechanisms were analyzed. The results show that the increasing water content and fine particle content significantly reducing the strai-hardening characteristic, but dry density and normal stress reinforce this effect. Under the shear stress, the samples exhibit significant non-uniform shear dilatancy. Increasing water content, fine particle content, and normal stress enhances shear contraction at the sample rear while suppressing shear dilation at the front. However, dry density has the opposite effect. The stress axis rotation follows a non-linear growth pattern initially, transitioning to linear growth. The growth rate and final rotation angle increase monotonically with water content, fine particle content, and normal stress, but decrease with increasing dry density. Furthermore, the shear modulus decreases exponentially with increasing water content but increases exponentially with dry density, fine particle content, and normal stress. Finally, normal stress is the most sensitive factor, followed by dry density and fine particle content, and lastly, water content. These findings provide theoretical reference for the scientific prevention of high-altitude disasters.
Keywords:
high-altitude mountains
; coarse-grained soil
; non-uniform dilatancy
; shear modulus
; rotation of stress axis
; influencing factors
1. Introduction
The Sichuan-Xizang Railway is a national key project that traverses the southeastern mountainous region of the Qinghai-Xizang Plateau. The areas along the route are characterized by variable climate, rugged terrain, complex geology, and frequent natural disasters [1−3]. Under intense weathering, coarse-grained soils in the accumulation layers are widely distributed in the high-altitude mountainous regions. These soils exhibit significant particle size variation, with a mixture of coarse and fine particles, loose structure, and poor stability, making them a major material for geological hazards such as landslides and debris flows along the Sichuan-Xizang Railway traffic corridor [4−7]. Understanding the shear deformation characteristics and sensitivity of influencing factors of these coarse-grained soils in the accumulation layers is crucial for ensuring the safe construction and operation of the Sichuan-Xizang Railway and for scientifically preventing and controlling regional mountain disasters. Therefore, it is essential to conduct in-depth research on this subject.
The stress-strain relationship and shear dilation deformation of coarse-grained soils are key aspects in studying the deformation characteristics of these soils. Scholars have conducted extensive research on these deformation features and their influencing factors through various shear tests [8,9]. Through direct shear tests, it’s discovered a clear stress-shear dilation relationship in coarse-grained soils during the shear process, with differing stress-shear dilation evolution patterns observed before and after the peak [10]. It is proposed that shear band deformations in large-scale tests exhibit stronger heterogeneity, which affects the overall stress-strain response of the soil. The shear stress-shear displacement curve of coarse-grained soils was found that can be divided into three stages: initial growth, peak, and critical steady state [11]. In the post-peak stage, the shear stress gradually stabilizes with displacement, reflecting the stable deformation process after particle structure rearrangement. Regarding the effects of different gradients, water content, density, and mineral composition, These direct shear tests, found that the shear stress-displacement curve of calcareous gravel soils under different conditions showed a strain-hardening type, accompanied by significant shear dilation deformation.[12] Similarly, Wen et al. [13] confirmed a similar pattern through shear tests on cobble-gravel soils from the Qinghai-Xizang Plateau. The test results show that particle fragmentation and structural reorganization during shear lead to volumetric dilation and shear contraction of the sample, and the sample exhibits typical characteristics of dilation under low-pressure and contraction under high pressure. Regarding the influence of particle gradation and soil structure, it is found that well-graded coarse-grained soils exhibited more pronounced shear dilation behavior and more notable stress-displacement nonlinearity, while poorly graded soils showed relatively weaker shear dilation [14]. Zhang et al. [15] proposed that the shear characteristics of gravel soils under different filling conditions exhibit significant differences, finding that the stress-strain curve of the sample displayed strain-hardening characteristics, with a certain degree of shear dilation deformation occurring during shear. In fact, the influence of particle gradation is achieved through the arrangement structure formed by different contents of coarse and fine particles. Existing studies generally agree that the internal skeleton structure formed by coarse particles and the filling effect of fine particles are key factors controlling the deformation characteristics of coarse-fine mixed soils[16,17]. In this regard, several scholars have conducted experimental studies on factors such as coarse particle content and fine particle content. Regarding the influence of coarse particle content,through experiments that, under the same confining pressure conditions, as the coarse particle content increases, the soil exhibits more significant shear dilation behavior[18]. Based on medium-scale shear tests, Li et al. [19] pointed out that the coarse particle content significantly influences the shear deformation characteristics of the shear zone soil, with samples often showing more pronounced shear dilation behavior when the coarse particle content is high. Through direct shear tests on geogrid-reinforced coarse-grained soil, Kim and Ha [20] found that larger particle sizes enhance the interlocking effect between the soil and the geogrid, thereby altering the shear deformation characteristics and improving shear resistance. According to direct shear tests on fine gravel-rubber mixed materials, when the particle size ratio increases, the interlocking effect between particles is enhanced, causing the material to exhibit more pronounced shear dilation during shear [21]. Regarding the effect of fine particle content, Demir and Cabalar[22] conducted shear tests on sand-low plasticity silt mixtures and investigated its influence on the shear behavior of coarse-grained soils. It is found that as fine particle content increases, the stress-strain response of the mixed soil weakens, and the shear modulus decreases. Additionally, shear deformation transitions from initial shear dilation under low fine particle content to sustained shear contraction under high fine particle content. Meanwhile, due to the scale differences between the test equipment and the original particles of coarse-grained soils, methods are often employed to treat oversized particles in the research process to meet the particle gradation requirements for the experimental scale. In this regard, Motahari-Tabari and Shooshpasha [23] proposed a method to adjust the gradation of coarse-grained soils to enable shear testing in small-scale direct shear tests. The experimental results showed that the adjusted coarse-grained soils exhibited reduced shear stress-displacement response and peak shear dilation deformation in the small shear box tests. It is further pointed out that the shear strength obtained by using the equivalent substitution method to deal with oversized particles in coarse-grained soils is usually higher than the shear strength obtained by using the similar gradation method, and with the increase of water content, the size effect becomes significantly more pronounced[24].
In addition, stress conditions and water content are also key factors determining the shear deformation characteristics of coarse-grained soils, which have garnered significant attention from scholars [25−27]. Regarding the effect of stress conditions, Regarding the influence of stress conditions, the stress-strain characteristics of coarse-grained materials under different water contents, particle gradations, and normal stresses were systematically analyzed through experiments[28]. Shi et al. [29] studied the effect of the intermediate principal stress ratio on the deformation behavior of coarse-grained soils through shear tests. As the principal stress ratio increased, the intermediate principal strain gradually transitioned from compression to expansion, and the soil’s stress-strain relationship and volumetric deformation characteristics exhibited significant deformation anisotropy. Regarding the effect of water content, Regarding the impact of water content, the shear behavior of soil-rock mixtures under water immersion conditions was studied through direct shear tests, and it was found that the soaking environment can alter their stress-displacement relationship and shear deformation characteristics.[30]. By improving the in-situ direct shear test, Wang et al. [31] pointed out that, under saturated conditions, the stress-displacement curve of coarse-grained soils increases more gradually, with shear deformation exhibiting enhanced ductility, indicating that water content significantly affects particle contact relationships and shear deformation mechanisms. In addition, improvement measures and experimental methods can significantly affect the shear response of coarse-grained soils. The shear behavior of coarse-grained soil reinforced with geogrid was studied using direct shear tests, and it was found that the reinforced structure can change its stress-strain relationship and shear dilation characteristics, thereby leading to a more stable deformation development process during shearing.[32]. Through direct shear tests, the interface stress and displacement change periodically, with a significant phase difference[33]. In other words, different shear rates significantly affect the shear response characteristics and deformation patterns of the interface. In evaluating the shear deformation characteristics of coarse- grained soils, the shear modulus is also one of the most commonly used indicators. Liu et al. [34] experimental studies the effect of particle size distribution on the shear modulus G of coarse-grained soils. The results demonstrate that Cu and D50 have pronounced but opposite effects on G. Based on experimental studies on the small-strain shear modulus of sand, a unified characterization model was used to describe the variation of shear modulus under different stress states[35]. In order to further reveal the intrinsic mechanism of shear deformation in coarse-grained soils, the motion of particles is divided into fine particle motion and coarse particle motion, and the fundamental reasons for shear deformation in coarse-grained soils under different gradations are explained[36]. Then, Bagherzadeh-Khalkhali and Mirghasemi [37] studied the particle contact force chains and local deformation development process, investigating the particle rearrangement and shear band formation that accompany shear in coarse-grained soils. In summary, the factors affecting the shear deformation characteristics of coarse-grained soils are diverse, and the influence patterns and magnitudes of each factor vary. To determine the extent of influence of different factors, the grey relational analysis is commonly used to analyze the sensitivity of factors influencing the shear deformation characteristics of coarse-grained soils. This method has significant advantages in capturing the nonlinear and complex relationships between these variables [38].
However, current research on the shear deformation properties of coarse-grained soils primarily focuses on coarse-grained fill materials such as embankments and dams, with limited studies on coarse-grained soils in high-altitude mountainous accumulation layers, especially those examining the influence of multiple factors and their sensitivities. Meanwhile, direct shear tests, as the primary method for studying the mechanical properties of coarse-grained soils, have insufficient attention given to factors such as changes in shear surface dimensions, normal stress axis rotation, uneven stress distribution on the shear surface, and heterogeneous shear dilation deformation, which require further investigation. In view of this, for the problem of slope failure in the accumulation layers along the Sichuan-Xizang Railway in high-altitude mountainous areas, improved direct shear test equipment and modified calculation formulas are used to conduct shear deformation tests under varying initial water content, dry density, fine particle content, and normal stress conditions. This study analyzes the heterogeneous deformation characteristics of the soil under shear, including shear stress, shear strain, and normal strain at the front and rear ends. The study explores the shear modulus and normal stress axis rotation behavior under the influence of multiple factors and, using the grey relational theory, reveals the sensitivity of the influencing factors on shear deformation. This research provides scientific reference for the construction of the Sichuan-Xizang Railway and the prevention and control of disasters in high-altitude mountainous areas.
2. Test Materials and Methods
2.1. Physical Properties of Specimens
The samples were taken from the slope of the residual accumulation layer in the Xinduqiao area along the Sichuan-Xizang Railway (H=3640m), as shown in Figure 1. The samples consist of a mixture of coarse and fine particles, with poor particle roundness, mostly angular to sub-angular in shape. The soil structure is loose, and its stability is poor. Based on the oven-drying and natural water immersion methods, the natural water content (w0) of the sample was found to be 10.1%, and the saturated water content(wsat) was 14.6%. Using the compaction method, funnel method, and graduated cylinder method, the optimum water content (w0) was determined to be 11.27%, with the maximum dry density (ρdmax) of 2.1 g/cm3 and the minimum dry density (ρdmin) of 1.4 g/cm3. Through sieve analysis and laser particle size analysis, it was found that the sample was composed of 90.82% coarse particles and 9.18% fine particles, with a maximum particle size of 40 mm. The gravel fraction (40 mm ≥ d > 2 mm) accounted for 21.12%, the sand fraction (2 mm ≥ d > 0.075 mm) accounted for 69.70%, the silt fraction (0.075 mm ≥ d > 0.005 mm) accounted for 7.0%, and the clay fraction (0.005 mm≥d) accounted for 2.18%. Due to the size limitations of the experimental equipment, the maximum allowable particle size for the sample was 5 mm. Therefore, an equal-volume replacement method was used to treat the oversized particles in the original sample. The grain-size distribution curves of the original sample and test samples after processing the oversized particles are shown in Figure 2.
2.2. Test Scheme and Methods
The experiment selects initial water content, dry density, fine particle content, and normal stress as key factors to study the shear deformation characteristics and sensitivity of the coarse-fine particle mixed soil under the influence of different factors. To account for the water content state of the soil at different seasons and depths of the slope, four water content levels (w=10%, 12%, 14%, and 18%) were selected based on the hydrological properties of the sample. To investigate the compaction state of the soil at different burial depths, four dry densities (ρd=1.35, 1.50, 1.65, and 1.80 g/cm3) were determined, in accordance with the density characteristics of the samples. Considering the particle size distribution characteristics of the soil at different heights and layers of the high-altitude slope, the fine particle content (θ) was set to 11%, 14%, 17%, and 20%, as shown in Figure 3. To account for the stress state characteristics of the deep parts of the slope, four levels of normal stress (σ = 50, 100, 200, and 300 kPa) were selected for the experiment. Based on the rapid instability characteristics of the high-altitude accumulation layer slopes, a shear rate of 0.8 mm/min was chosen for the strain-controlled direct shear tests under multi-factor conditions. During the experiment, to investigate the issue of non-uniform shear dilation deformation caused by uneven stress distribution on the shear surface in direct shear tests, the DSJ-4 direct shear apparatus was modified. Deformation sensors were added at the front and rear ends of the sample in the shear direction, enabling the observation of normal deformation at different positions of the sample during the entire shear process.
3. Non-Uniform Shear Deformation of Specimens Under Multiple Factors
3.1. Revised Calculation Formula of Shear Stress
In direct shear tests, the real shear surface continuously undergoes a dynamic reduction process. However, the traditional shear stress calculation formula assumes the shear surface area to be constant, which leads to calculated shear stress values that are often smaller than the actual values, thus failing to accurately reflect the true ability of the sample to resist shear failure, as shown in Figure 4.
To address this issue, based on the characteristic of strain-controlled direct shear tests, where shear displacement increases at a constant rate, the relationship between the real shear surface area (Si) and shear time (t) can be derived as follows:
where Si denotes the actual shear plane area of the specimen, mm2; S0 represents the initial shear plane area of the specimen, mm2; r is the radius of the initial shear plane, mm; θ denotes the angle of the maximum chord length on the actual shear surface; v is the shear rate, mm/s; and t represents the shear time, s.
Substituting equation (1) into the shear stress calculation formula, the corrected real shear stress τᵢ of the sample can be expressed as:
where τᵢ denotes the real shear stress of the sample, kPa; C represents the calibration coefficient of the load cell, N/0.01 mm; R is the reading of the load cell, 0.01 mm.
3.2. Relationship Between Revised Shear Stress and Strain of Specimens
The modified shear stress-shear strain (τ-εh) relationship curves for the coarse-fine particle mixed soil samples under different initial water content (w), dry density (ρd), fine particle content (θ), and normal stress (σ) conditions are shown in Figure 5. As shown in Figure 5a, at the same shear strain, the modified shear stress of the sample is always higher than the unmodified shear stress. Furthermore, the shear stress-shear strain relationship curves of the samples under the experimental conditions all exhibit strain-hardening behavior. The entire shear deformation process can be divided into three stages: ①When the shear strain (ε) increases from 0% to 1.0%–2.0%, the shear stress of the sample shows a rapid linear increase. ②After that, the shear stress increases non-linearly with the shear strain. ③When the shear strain reaches 13%–15%, the shear stress of the sample gradually tends to stabilize. However, there are significant differences in the influence patterns of different factors on the shear stress-shear strain relationship curves of the sample.
For the effect of initial water content (Figure 5b), it is found that under a lower water content (w=10%), the shear stress required for the sample to reach 15% shear strain is 221.04 kPa. However, at a higher water content (w=16%), only 179.56 kPa is required, representing a reduction of 18.8%. As shown, with increasing water content, the shear stress corresponding to the same shear strain decreases, indicating that higher water content reduces the sample’s resistance to shear deformation. This suggests that the initial water content has a monotonically weakening effect on the strain-hardening shear stress–shear strain relationship of the sample. This occurs because, as pore water increases, the water film on the particle surfaces thickens, the clay effect of fine particles becomes more pronounced, and the matrix suction decreases significantly, resulting in a lower external force required for shear deformation. From Figure 5c, it can be observed that the higher the dry density (ρd), the steeper the slope of the shear stress–shear strain relationship curve and the higher the shear stress values. For example, the stable shear stress of the sample is 180.0 kPa at a lower dry density (ρd=1.35 g/cm3), but it increases by 18.2% when the dry density reaches 1.80 g/cm3. This indicates that dry density has a monotonically strengthening effect on the shear deformation hardening of the sample. This is because, as dry density increases, the particle arrangement becomes more compact, the pores become smaller, and the inter-particle interlocking force becomes stronger, resulting in greater resistance to shear deformation.
The influence of fine particle content (θ) on the shear stress-strain relationship of the sample follows a similar pattern to that of initial water content (w), showing a weakening effect on the sample’s strain-hardening deformation (Figure 5d). That is, as the fine particle content increases, both the slope of the curve and the stable shear stress decrease, although the reduction is less significant than that caused by water content. When the fine particle content (θ) is 11%, the stable shear stress (τf) of the sample is 201.53 kPa. However, when θ=20%, the stable shear stress decreases to 180.27 kPa, a reduction of 10.5%. This is because, as the fine particles (such as silt and clay) increase, they gradually envelop the coarse particles and fill the larger pores, reducing the interlocking effect of the coarse particles, weakening the skeletal structure of the sample, and thereby decreasing the resistance to shear deformation under the same external shear stress. For the effect of normal stress (Figure 5e), the shear stress-shear strain relationship curve of the sample follows a similar trend to that observed with dry density, but the reinforcing effect of normal stress is more pronounced. For example, when the normal stress increases from 50 kPa to 300 kPa, the stable shear stress of the sample increases from 83.14 kPa to 278.74 kPa, an increase of 235.3%. This is because the increased normal stress enhances the shear stress state of the sample, making the particle arrangement more compact, and thus the sample needs to overcome additional external stress when undergoing shear deformation.
3.3. Relationship Between Normal Strain and Shear Strain of Specimens
The normal strain-shear strain (εv-εh) relationship curves for the coarse-fine particle mixed soil samples under different conditions are shown in Figure 6. As observed, with the increase in shear strain, the normal strain at the front end of the shear surface initially decreases slowly to a negative value, and then increases linearly to a positive value, indicating that the deformation at the front end of the sample starts with slight shear contraction followed by significant shear dilation. On the other hand, the normal strain at the rear end of the shear surface remains negative and decreases linearly, indicating continuous shear contraction at the rear end of the sample. This shows that the coarse-fine particle mixed soil exhibits significant heterogeneous shear dilation deformation characteristics overall (Figure 7). The reason for this behavior can be attributed to the following: before the experiment, the applied normal stress significantly reduced the particle voids in the sample, creating a certain compact arrangement structure. In the initial stage of the experiment, under the coupling effect of normal stress and shear stress, the particles inside the sample move, rotate, and adjust to form a denser structure, with the entire sample exhibiting shear contraction deformation. Subsequently, as the lower shear box advances forward, the actual shear surface continuously decreases, and the particles in the lower part of the upper shear box are pushed to the front of the upper shear box, causing the front end to experience volumetric expansion deformation due to the increase in soil particles, while the rear end experiences volumetric contraction deformation due to the decrease in particles (Figure 8).
For the effect of water content (Figure 6a), it is found that when the water content increases from 10% to 16%, the minimum normal strain (εv) at the front end of the sample in the negative region decreased from −0.39% to −0.63%. The shear strain corresponding to the point where normal strain equals zero increased from 9.71% to 15.86%, and subsequently, the normal strain in the positive region gradually decreased. However, the normal strain at the rear end of the sample accelerated its reduction in the negative region with the increase in water content, as reflected by the slope of the curve decreasing from −0.264 to −0.59. It can be seen that the increased water content enhanced the shear contraction deformation at the front end of the sample in the early stage of the experiment and shortened its duration, while it weakened the shear dilation deformation at the later stage and slowed its growth. This is because, when the water content is low, the sample does not reach a compact structure. The increase in pore water reduces the resistance to particle movement, facilitating a denser particle arrangement, which macroscopically results in an increased shear contraction deformation. From Figure 6b, it is observed that the effect of dry density on the sample’s heterogeneous shear deformation is opposite to that of water content. As the dry density increases, it weakens the shear contraction deformation at the front end of the sample in the early stage of the experiment and enhances the shear dilation deformation at the later stage. Simultaneously, the larger the dry density, the greater the slope of the normal strain-shear strain relationship curve at the rear end of the sample, increasing from −0.632 to −0.139. This indicates that dry density has an inhibitory effect on shear contraction deformation at the rear end of the sample. This is because, with an increase in dry density, the particle arrangement becomes more compact, and the pore size reduces, leading to a decrease in the volume compression of the sample during shear. Subsequently, under the action of shear stress, particle movement, rolling, and other motions alter the original dense structure, enhancing the shear dilation deformation of the sample.
However, the effect of fine particle content (θ) on the heterogeneous shear deformation of the sample (Figure 6c) differs from that of other factors. With the increase in fine particle content, the shear contraction deformation at the front end of the sample in the early stage of the experiment continuously decreases, while the shear dilation deformation at the rear end of the sample in the later stage gradually increases. This is because the increased fine particles fill the larger pores inside the sample, leading to a reduction in the sample’s compressible volume. However, with higher fine particle content, the normal strain at the rear end of the sample decreases more significantly with increasing shear strain. This is due to the increased fine particles enhancing the bonding between the sample’s particles, causing more particles to be squeezed from the shear band’s rear end to the front, which is reflected as an increased shear contraction deformation at the rear end of the sample. From Figure 6d, it can be seen that the effect of normal stress (σ) on the shear deformation of the sample follows a pattern similar to that of water content. Both show that an increased normal stress enhances the shear contraction deformation at the front end of the sample in the early stage of the experiment and the shear contraction deformation at the rear end throughout the experiment, while weakening the shear dilation deformation at the front end in the later stage of the experiment. However, the underlying principle of the influence of normal stress differs entirely from that of water content. Normal stress affects the sample by altering the stress environment, causing the particles to move toward a denser structure, which results in reduced pore volume and increased shear contraction deformation.
4. Rotation Characteristics of Principal Stress Axis of Specimens Under Multiple Factors
Based on the normal strain-shear strain relationship characteristics of coarse-fine particle mixed soil (Figure 6), it is observed that under shear stress, the coarse-fine particle mixed soil exhibits significant heterogeneous shear dilation deformation (Figure 7), which causes the normal stress axis to rotate (Figure 8), influenced by various factors. To evaluate the normal stress axis rotation characteristics under the experimental conditions, the normal stress axis rotation angle (α) is introduced (Figure 9), with the rotation angle corresponding to 15% shear strain (when strain-hardening deformation occurs) being considered as the final normal stress axis rotation angle. This rotation angle can be calculated using the following formula:
where α denotes the rotation angle of the normal stress axis; ∆sf represents the normal deformation at the front end of the sample in the shear direction; ∆sr is the normal deformation at the rear end of the sample in the shear direction; and L represents the distance between the normal deformation measurement points at the front and rear ends of the sample in the shear direction.
4.1. Effect of Water Content on Rotation of Principal Stress Axis
The relationship curves between the normal stress axis rotation angle and shear strain (α-εh) for the sample under different water content conditions, along with the final stress axis rotation angle (αf), are shown in Figure 10.
As shown in Figure 10a, during the entire shear process, the rotation angle of the normal stress axis (α) increases monotonically with the shear strain (εh). However, there is always a critical point, and based on this, the α-εh relationship curve can be divided into two stages: in the first stage, α increases non-linearly, while in the second stage, α increases linearly and accelerates. Taking the sample with a water content of 10% in Figure 10a as an example, the critical point of the normal stress axis rotation angle occurs at point A, where the corresponding rotation angle α is 2.88° and the shear strain is 9.7%, which coincides with the shear strain at the point where the normal strain at the front end of the sample changes from negative to zero. This characteristic is also observed in other samples in Figure 10a. In fact, the growth pattern of the normal stress axis rotation angle in the first stage (OA) is primarily caused by the nonlinear shear contraction deformation at the front end of the sample during the early shear stage (represented by the blue curve in Figure 6a). Meanwhile, the linear variation of the rotation angle in the second stage (AQ) is due to the coupling effect of the linear shear dilation at the front end of the sample during the late shear stage and the continuous linear shear contraction deformation at the rear end.
Furthermore, with the increase in water content, both the normal stress axis rotation angle corresponding to the critical point of the α-εh relationship curve (Figure 10a) and the final rotation angle(Figure 10b) continuously increase. Specifically, the former increases from 2.88° to 11.16°, and the latter increases from 7.37° to 10.83°, indicating that the increased water content significantly enhances the degree of rotation of the normal stress axis during the direct shear process.
4.2. Effect of Dry Density on Rotation of Principal Stress Axis
The relationship curves between the normal stress axis rotation angle and shear strain (α-εh) and the variation of the final stress axis rotation angle (αf) with dry density (ρd) are shown in Figure 11.
As shown in Figure 11a, with an increase in dry density (ρd), the slope of the normal stress axis rotation angle-shear strain (α-εh) curve of the sample becomes lower. Furthermore,the rotation angle(α) corresponding to the critical point in the first stage is 10.46° when the dry density is low (ρd=1.35 g/cm3), with the corresponding shear strain (εh) being 13.59% (point A in Figure 11a). However, as the dry density increases to 1.65 g/cm3, the rotation angle (α) at the critical point decreases to 5.11°, with the corresponding shear strain decreasing to 9.06% (point C in Figure 11a). The final normal stress axis rotation angle of the sample also decreases from 11.89° to 5.75% as dry density increases, showing a reduction of 51.64%, as shown in Figure 11b. It can be observed that dry density weakens both the rotation speed and the rotation magnitude of the normal stress axis during the direct shear test, which is the opposite of the effect of water content. The mechanism by which dry density affects the rotation of the normal stress axis is the same as its effect on shear dilation deformation.
4.3. Effect of Fine-Particle Content on Rotation of Principal Stress Axis
The relationship curves between the normal stress axis rotation angle and shear strain (α-εh) for the sample under different fine particle contents (θ) and the variation of the final stress axis rotation angle (αf) are shown in Figure12.
The effect of fine particle content (θ) on the rotation angle of the normal stress axis differs from that of water content and dry density. As shown in Figure 12a, with an increase in fine particle content, the slope of both the first and second stages of the normal stress axis rotation angle-shear strain (α-εh) relationship curve becomes steeper. When the fine particle content is low (θ = 11%), the rotation angle (α) at the critical point is 5.85°, with the corresponding shear strain (εh) being 16.18% (point A in Figure 12a). As the dry density increases, the rotation angle at the critical point increases, while the corresponding shear strain decreases continuously (from point A to point D in Figure 12a). In addition, the final normal stress axis rotation angle increases from 5.69° to 11.61% with increasing dry density, showing a 104.14% increase, as shown in Figure 12b. It can be seen that the increase in fine particle content significantly enhances both the rotation magnitude and speed of the normal stress axis.
4.4. Effect of Normal Stress on Rotation of Principal Stress Axis
The variation of the normal stress axis rotation angle (α) and the final stress axis rotation angle (αf) of the sample under different normal stress conditions is shown in Figure 13. As shown in Figure 13a, the effect of normal stress on the normal stress axis rotation angle-shear strain (α-εh) relationship curve is similar to that of water content. The rotation angle and shear strain at the critical point of the curve both increase with increasing normal stress, indicating that the slope and range of the curve in the first stage also increase. Meanwhile, when the normal stress increases from 50 kPa to 200 kPa, the second stage of the α-εh relationship curve in Figure 13a tends to coincide, and the change in the stable rotation angle in Figure 13b is minimal, increasing only from 8.80° to 8.86°. Only when the normal stress increases from 200 kPa to 300 kPa does the stable rotation angle significantly increase, with a 32% rise. Overall, normal stress has a reinforcing effect on both the rotation speed and magnitude of the normal stress axis during the direct shear test, especially under higher normal stress conditions. The mechanism of this effect is essentially consistent with the mechanism affecting the shear contraction deformation of the sample.
5. Variation of Shear Modulus of Specimens and Sensitivity of Its Influencing Factors
5.1. Influencing of Factors on Shear Modulus of Specimens
Shear modulus (G) is an important indicator of a material’s ability to resist shear deformation. Here, it is taken as the slope of the initial straight line segment of the sample’s shear stress-shear strain relationship curve (Figure 5).
The variation of the shear modulus of the coarse-fine particle mixed soil sample under different experimental factors is shown in Figure 14. For the effect of water content, taking the case of normal stress σ=50 kPa in Figure 14a as an example, it is observed that the shear modulus of the sample is 4.05 MPa at a low water content (w=10%), and it decreases to 1.15 MPa as the water content increases to 16%, representing a decrease of 71.6%. It can be seen that the shear modulus of the sample decreases significantly with the increase in initial water content (w), which is due to the increased water content that thickens the water film on the sample particles, reduces the capillary suction between fine particles, and lowers the resistance to particle movement, thereby rapidly weakening the sample’s ability to resist shear deformation. Moreover, as the normal stress increases, the reduction in shear modulus with increasing water content becomes less significant, indicating that normal stress weakens the effect of water content.
As shown in Figure 14b, dry density has a monotonically reinforcing effect on the shear modulus of the sample, with the shear modulus ranging from 0.94 to 3.12 MPa at a low dry density (ρd=1.35 g/cm3), and increasing to 3.82 to 7 MPa at a higher dry density (ρd=1.80 g/cm3), representing an increase of 1.24 to 3.08 times. This is because as dry density increases, the number of particles per unit volume increases, the particles are more tightly packed, and the inter-particle interlocking of coarse particles becomes stronger, which results in greater resistance to shear deformation and a higher ability to resist deformation. Moreover, as normal stress increases, the increase in shear modulus with dry density becomes less significant, indicating that normal stress weakens the reinforcing effect of dry density.
For the effect of fine particle content(Figure 14c), it is observed that the shear modulus of the sample always increases non-linearly with the increase in fine particle content, first slowly and then more rapidly. When the fine particle content is low (θ=11%), the shear modulus of the sample is between 1.56 and 5.93 MPa. In contrast, when the fine particle content is high (θ= 20%), the shear modulus increases by 18.4% to 80%. Additionally, the higher the normal stress, the lower the rate of increase in shear modulus. This is because the increased fine particles improve the particle gradation, making the arrangement more compact, thus enhancing the pore structure of the coarse particle skeleton; at the same time, the increased cohesion between particles from the fine particles strengthens the bond between coarse and fine particles, forming a dense structure with a higher ability to resist shear deformation. As shown in Figure 14d, compared to the lower normal stress (σ=50 kPa), the shear modulus of the sample at higher normal stress (σ=300 kPa) increased by 85.7% to 169.7%. It can be seen that the effect of normal stress on the shear modulus of the sample is similar to that of dry density and fine particle content, both showing a monotonically reinforcing effect. However, the mechanisms of these effects are entirely different. In this case, normal stress increases the stress state of the particles, causing more resistance to particle movement during shear deformation.
Furthermore, based on the variation of the shear modulus of the sample under different influencing factors (Figure 14), it was found that the quantitative relationship between the shear modulus and each factor can be represented by the following exponential mathematical model:
where G denotes shear modulus, the dependent variable; x represents independent variable, representing different experimental factors; η, λ, β is model parameters.
To validate the applicability of this theoretical model, the experimental values and calculated values of the shear modulus of the sample under different initial water content (w), dry density (ρd), fine particle content (θ), and normal stress (σ) conditions were compared, as shown in Figure 14 and Table 1.
It can be seen that the correlation coefficient (R) between the calculated values of the exponential model and the experimental values ranges from 0.959 to 0.999, with an average value of 0.993. This indicates that the prediction model has good applicability for predicting the shear modulus of coarse-fine particle mixed soil under different factor conditions. This model will provide a theoretical basis for the prevention and control of geological disasters in the accumulation layers of the central and western mountainous regions of China, slope stability analysis, and safety evaluation of coarse-grained soil embankment engineering.
5.2. Sensitivity Analysis of Influence Factors Based on Grey Correlation Theory
Grey relational analysis is an important branch of grey system theory. Its basic idea is to analyze and determine the degree of influence between factors (sequences) or the contribution of several sub-factors (sub-sequences) to the main factor (parent sequence) based on the similarity in the geometric shape of the curves of each factor (sequence). The analysis process for the degree of association between factors is as follows:
Let there be a reference sequence X0={x0(k), k=1, 2, … , n} and a comparison sequence Xi={xi(k), k=1,2, ... , n}. The degree of association ξi(k) between X0 and Xi at the k-th point can be expressed by equation (1):
Where ∆i(k) denotes the absolute difference at the k-th time between X0 and Xi, i.e., )=|X0(k)-Xi(k)|; ρ represents the resolution coefficient; minimink∆i(k) is the minimum difference at the k-th point; and maximaxk∆i(k) denotes the maximum difference at the k-th point.
The degree of association γi of the comparison sequence to the reference sequence is determined by the following formula, and the sensitivity of each factor is determined based on the ranking of the degree of association:
Where γi denotes the degree of association between the comparison sequence and the reference sequence.
Based on equations (5) to (6), the variation of the correlation coefficient ξi(k) and the degree of association γi between the shear modulus of the sample under different normal stress conditions and factors such as water content, dry density, and fine particle content is shown in Figure 15 and Figure 16. As shown in Figure 15, the correlation coefficients ξi(k) between the shear modulus of the sample and dry density (ρd), water content (w), fine particle content (θ), and normal stress (σ) range from 0.544 to 0.997, 0.502 to 0.999, 0.512 to 0.999, and 0.561 to 0.998, respectively. The corresponding degrees of association γi are 0.710, 0.648, 0.677, and 0.729. It can be seen that the degrees of association γi between the shear modulus of the sample and each factor are all greater than 0.60, indicating that these experimental factors significantly influence the shear modulus of coarse-fine particle mixed soil.
Based on the values of the degree of association, the most sensitive factor influencing the shear modulus of the sample is normal stress, followed by dry density, then fine particle content, and the least sensitive factor is water content. The reason for this is determined by the combined effect of the structural characteristics of the coarse-fine particle mixed soil and the influence mechanisms of each factor. Normal stress directly controls the particle stress state throughout the shear process. Increasing normal stress enhances the inter-particle contact force and increases the stiffness of the contact points, thus having the most significant effect on the shear modulus. Dry density determines the number and arrangement of particles in the sample. An increase in dry density means the particles are more tightly packed, with more contact points, which increases the resistance to shear deformation due to stronger inter-particle interlocking, thus having a noticeable effect on the shear modulus. Fine particle content determines the particle gradation of the sample, affecting the filling of pores and the type of particle arrangement, which in turn influences the ability to resist shear deformation. However, the effect of fine particle content typically becomes significant only when a certain threshold is reached, and it is not as direct as the effect of normal stress and dry density. In comparison, the shear modulus of the sample is less sensitive to water content. This is because coarse-grained soils have high permeability, allowing pore water to easily drain out, and under drained conditions, the effect of water content on effective stress is minimal. Unless the soil contains a large amount of fine particles and is in an unsaturated state, water content changes may slightly affect the modulus through capillary action or lubrication effects, but overall, the impact is weak. Although the samples in this study consist of a mixture of coarse and fine particles, the maximum fine particle content is 20%, which is still relatively low compared to coarse particles. Therefore, the sensitivity of the shear modulus to water content is the weakest.
6. Conclusion
(1) Under the influence of different factors, the modified shear stress-shear strain relationship of coarse-fine particle mixed soil consistently exhibits a three-stage strain-hardening behavior. Increasing the initial water content and fine particle content significantly reduces the curve slope and the stable shear stress at the end, weakening the hardening deformation characteristics. However, dry density and normal stress both have a reinforcing effect on the sample’s hardening deformation characteristics, with normal stress having the most significant impact.
(2) Under the coupling effect of normal stress and shear stress, the sample exhibits significant heterogeneous shear deformation, with the front end experiencing small shear contraction followed by significant shear dilation, while the rear end of the sample consistently undergoes linear shear contraction. Increasing the water content, fine particle content, and normal stress significantly enhances the shear contraction deformation at the rear end of the sample and suppresses the shear dilation deformation at the front end. However, the effect of dry density follows the opposite trend compared to these factors.
(3) The variation process of the normal stress axis rotation angle under shear can be divided into two stages: nonlinear growth and linear growth. This is caused by the heterogeneous shear dilation deformation of the sample. Increased water content, fine particle content, and normal stress all monotonically enhance both the growth rate and the final rotation angle of the normal stress axis. However, dry density has a weakening effect on the rotation characteristics of the normal stress axis.
(4) The shear modulus of the sample exhibits a nonlinear decay with increasing water content, while it increases with the rise in dry density, fine particle content, and normal stress. An exponential function can effectively represent the quantitative relationship between the shear modulus and these factors. Based on grey relational theory, the sensitivity of the influencing factors on the shear deformation characteristics of the sample has been determined. Normal stress is the most sensitive factor, followed by dry density and fine particle content, with water content being the least sensitive. The impact mechanisms of the different factors have also been revealed.
Author Contributions
Conceptualization, Yonglong Qu; methodology, Gengshe Yang; validation, Yonglong Qu and Xinglong Wang; formal analysis, Yanhu Mu; investigation, Yonglong Qu; data curation, Xinglong Wang; writing—original draft preparation, Xinglong Wang; writing—review and editing, Yonglong Qu; supervision, Tengfei Han and Mengyuan Zhang; project administration, Yonglong Qu and Lizhen Wu; funding acquisition, Yonglong Qu. All authors have read and agreed to the published version of the manuscript.
Funding
This research was funded by the National Natural Science Foundation of China, grant number 42301155; the Key Research and Development Project of Science and Technology Department of Shaanxi Province, grant number 2025SF-YBXM-163. No external funding from private entities was received.
Data Availability Statement
Data is available upon request from corresponding author.
Conflicts of Interest
The authors declare that there is no conflict of interest in this paper.
References
- Cui, P.; Ge, Y.-G.; Li, S.-J.; Li, Z.-H.; Xu, X.-W.; Zhou, G. G.; Chen, H.-Y.; Wang, H.; L, Y.; Zhou, L.-B.; Yi, S.-J.; Wu, C.-H.; Guo, j.; Wang, Q.; Lan, H.-X.; Ding, M.-T.; Ren, J.-J.; Zeng, L.; Jiang, Y.-J.; Wng, Y. Scientific challenges in disaster risk reduction for the Sichuan–Tibet Railway. Eng. Geol. 2022, 309, 106837. [Google Scholar] [CrossRef]
- Lu, C.-F.; Cai, C.-X. Challenges and countermeasures for construction safety during the Sichuan-Tibet Railway Project. Engineering-Prc 2019, 5(5), 833–838. [Google Scholar] [CrossRef]
- Li, W.-W.; Chen, Y.; Zhan, X.-J.; Lv, G.-D.; Huang, X.-W. An experimental study on the densification mechanism of coarse-grained landslide deposits from Southeastern Tibet under dynamic compaction. Soil. Dyn. Earthq. Eng. 2026, 202, 110023. [Google Scholar] [CrossRef]
- Qu, Y.-L.; Ni, W.-K.; Niu, F.-J.; Mu, Y.-H.; Chen, G.-L.; Luo, J. Mechanical and electrical properties of coarse-grained soil affected by cyclic freeze-thaw in high cold regions. J. Cent. South. Univ. 2020, 27(3), 853–866. [Google Scholar] [CrossRef]
- Zhang, C.-L.; Miao, S.-S.; Su, L.-J. Seismic behaviour of granular slope under railway embankment in large-scale shaking table test. Eng. Geol. 2022, 305, 106714. [Google Scholar] [CrossRef]
- Li, Z.; Zhou, P. Research progress of coarse-grained slip zone soil in China. Nat. Hazards. 2023, 118(1), 1–29. [Google Scholar] [CrossRef]
- Liu, X.; Zou, D.; Liu, J.; Zhou, C.; Zheng, B. Experimental study to evaluate the effect of particle size on the small strain shear modulus of coarse-grained soils. Measurement 2020, 163, 107954. [Google Scholar] [CrossRef]
- Chen, Y.-H.; Zhang, L.; Chen, Z.-F.; Liu, Z.-S.; Luo, B.; Ding, X.-H.; Xu, L.-R.; Deng, Z.-X.-; Lu, Z.-Q. Analysis of triaxial shear properties of mudstone coarse-grained soils considering penetrating erosion effects. Transp. Geotech. 2025, 50, 101469. [Google Scholar] [CrossRef]
- Yu, Q.; Ren, Z.; Liu, J.; Fang, J.; Na, T. Physico-mechanical properties of coarse-grained soil with unevenly distributed fine soil in cold regions. Transp. Geotech. 2025, 101783. [Google Scholar] [CrossRef]
- Dołżyk; Szypcio, K. Direct shear test for coarse granular soil. Int. J. Civ. Eng. 2019, 17(12), 1871–1878. [Google Scholar] [CrossRef]
- Schmidt, S.; Herle, I. Heterogeneous and scale-dependent behaviour of an initially dense sand specimen in triaxial compression: S. Schmidt, I. Herle. Granular. Matter. 2025, 27(1), 24. [Google Scholar] [CrossRef]
- Wang, X.-Z.; Wang, X.; Jin, Z.-C.; Meng, Q.-S.; Zhu, C.-Q.; Wang, R. Shear characteristics of calcareous gravelly soil. B. Eng. Geol. Environ. 2017, 76(2), 561–573. [Google Scholar] [CrossRef]
- Wen, T.; Jia, W.; Quan, Z.; Guo, W.; Wang, Y.; Chen, N. Shear behavior of gravel-block soil of the Qinghai-Tibet plateau based on large-scale direct shear test and numerical simulation. B. Eng. Geol. Environ. 2025, 84(6), 294. [Google Scholar] [CrossRef]
- Chen, X.; Jia, Y.; Zhang, J. Stress-strain response and dilation of geogrid-reinforced coarse-grained soils in large-scale direct shear tests. Geotech. Test. J. 2018, 41(3), 601–610. [Google Scholar] [CrossRef]
- Zhang, H.; Luo, Y.; Yuan, S.; Zhou, Y.; Zhou, Q.; Zeng, F.; Feng, W. Shear characteristics of gravel soil with different fillers. Front. Mater. 2022, 9, 962372. [Google Scholar] [CrossRef]
- Li, Y. Effects of particle shape and size distribution on the shear strength behavior of composite soils. B. Eng. Geolenviron. 2013, 72(3), 371–381. [Google Scholar] [CrossRef]
- Dai, B.; Yang, J.; Luo, X. A numerical analysis of the shear behavior of granular soil with fines. Particuology 2015, 21, 160–172. [Google Scholar] [CrossRef]
- Du, J.; Xiong, Z.; Shen, X.; Li, C. Experimental Study on the Effect of Coarse Grain Content on the Dilatancy and Particle Breakage Characteristics of Coarse-Grained Soils. Geofluids. 2023, 2023(1), 2307881. [Google Scholar] [CrossRef]
- Li, Z.; Liu, Z.; Zhou, P.; Zheng, J. Meso-level and macro-level mechanical properties of slip zone soil with varying coarse grain contents. B. Eng. Geol. Environ. 2023, 82(4), 149. [Google Scholar] [CrossRef]
- Kim, D.; Ha, S. Effects of particle size on the shear behavior of coarse grained soils reinforced with geogrid. Materials 2014, 7(2), 963–979. [Google Scholar] [CrossRef]
- Sun, Q.; Hou, S.; Cao, X.; Tsang, H. H. Direct shear tests on the effects of displacement rate and particle size ratio on the shear behavior of fine gravel-rubber mixtures. Constr. Build. Mater. 2025, 476, 141263. [Google Scholar] [CrossRef]
- Demir, S.; Cabalar, A. F. Undrained triaxial compression testing of sand-low plastic silt mixtures. Transp. Geotech. 2025, 50, 101482. [Google Scholar] [CrossRef]
- MotahariTabari, S.; Shooshpasha, I. Evaluation of coarse-grained mechanical properties using small direct shear test. Int. J. Geotech. Eng. 2021, 15(6), 667–679. [Google Scholar] [CrossRef]
- Feng, M.; Song, Y.; Xue, H.; Cui, J. Shear Strength of Coarse-Grained Soil: Effects of Scaling Methods and Moisture Content with In Situ Comparison. Applied. Sci. 2025, 15(9), 5101. [Google Scholar] [CrossRef]
- Li, Z.; Zhou, P. Research progress of coarse-grained slip zone soil in China. Nat. Hazards. 2023, 118(1), 1–29. [Google Scholar] [CrossRef]
- Huang, M.; Yao, Y.; Yin, Z.; Liu, E.; Lei, H. An overview on elementary mechanical behaviors, constitutive modeling and failure criterion of soils. Tumu Gongcheng Xuebao/China Civ. Eng. Journal. 2016, 49(7), 9–35. [Google Scholar]
- Wang, Y.; Pan, J.; Zhang, H.; Zhou, S.; Xu, H. Study on the strength and deformation characteristics of coarse-grained soil under end-restraint and end-free (microfriction) conditions. Appl. Sci. 2023, 13(20), 11521. [Google Scholar] [CrossRef]
- Sadeghian, M. H.; Sadeghi, M.; Fakhimi, A. Particle breakage, deformation and shear strength of conglomerate rock fill material: a case study of Masjed Soleyman Dam cracking and settlement. B. Eng. Geol. Environ. 2024, 83(12), 506. [Google Scholar] [CrossRef]
- Shi, W. C.; Zhu, J. G.; Chiu, C. F.; Liu, H. L. Strength and deformation behaviour of coarse-grained soil by true triaxial tests. J. Cent. South. Univ. T. 2010, 17(5), 1095–1102. [Google Scholar] [CrossRef]
- Liang, S.; Xiao, X.; Feng, D. Study on large-scale direct shear test on soil–rock mixture in an immersion state under water. Int. J. Geomech. 2023, 23(2), 04022294. [Google Scholar] [CrossRef]
- Wang, Z.; Qi, C.; Zhang, Z.; Huang, R.; Guo, C.; Dong, L.; Zheng, R. Improved in-situ direct shear test of rock mass structural plane and its application to stability analysis of bedding slope. Case. Stud. Constr. Mat. 2025, 23, e04976. [Google Scholar] [CrossRef]
- Chen, X.; Jia, Y.; Zhang, J. Stress-strain response and dilation of geogrid-reinforced coarse-grained soils in large-scale direct shear tests. Geotech. Test. J. 2018, 41(3), 601–610. [Google Scholar] [CrossRef]
- Fei-yu, L. I. U.; Chen, Z. H. U.; Jun, W. A. N. G. Influences of shear rate and loading frequency on shear behavior of geogrid-soil interfaces. Yantu Gongcheng Xuebao/Chinese J. Geotech. Eng. 2022, 43(5), 832–840. [Google Scholar]
- Liu, X.; Zou, D.; Liu, J.; Zheng, B. Predicting the small strain shear modulus of coarse-grained soils. Soil. Dyn. Earthq.Eng. 2021, 141, 106468. [Google Scholar] [CrossRef]
- Chen, Y.; Yang, J. Small-strain shear modulus of quartz sands under anisotropic stress conditions. J. Geotech. Geoenviron. 2024, 150(5), 04024033. [Google Scholar] [CrossRef]
- Meng, F.; Zhang, J. S.; Chen, X. B.; Wang, Q. Y. Deformation characteristics of coarse-grained soil with various gradations. J. Cent. South. Univ. 2014, 21(6), 2469–2476. [Google Scholar] [CrossRef]
- Bagherzadeh-Khalkhali, A.; Mirghasemi, A. A. Numerical and experimental direct shear tests for coarse-grained soils. Particuology 2009, 7(1), 83–91. [Google Scholar] [CrossRef]
- Wu, H.; Wu, Y.; Liao, H.; Zhu, J. Stability of 3D Tunnel Faces in Inclined Layered Soils Under Steady-State Unsaturated Seepage Based on Grey Relational Analysis. Appl. Sci. 2025, 15(5), 2453. [Google Scholar] [CrossRef]
Figure 1.
Study Area and Sample Collection.
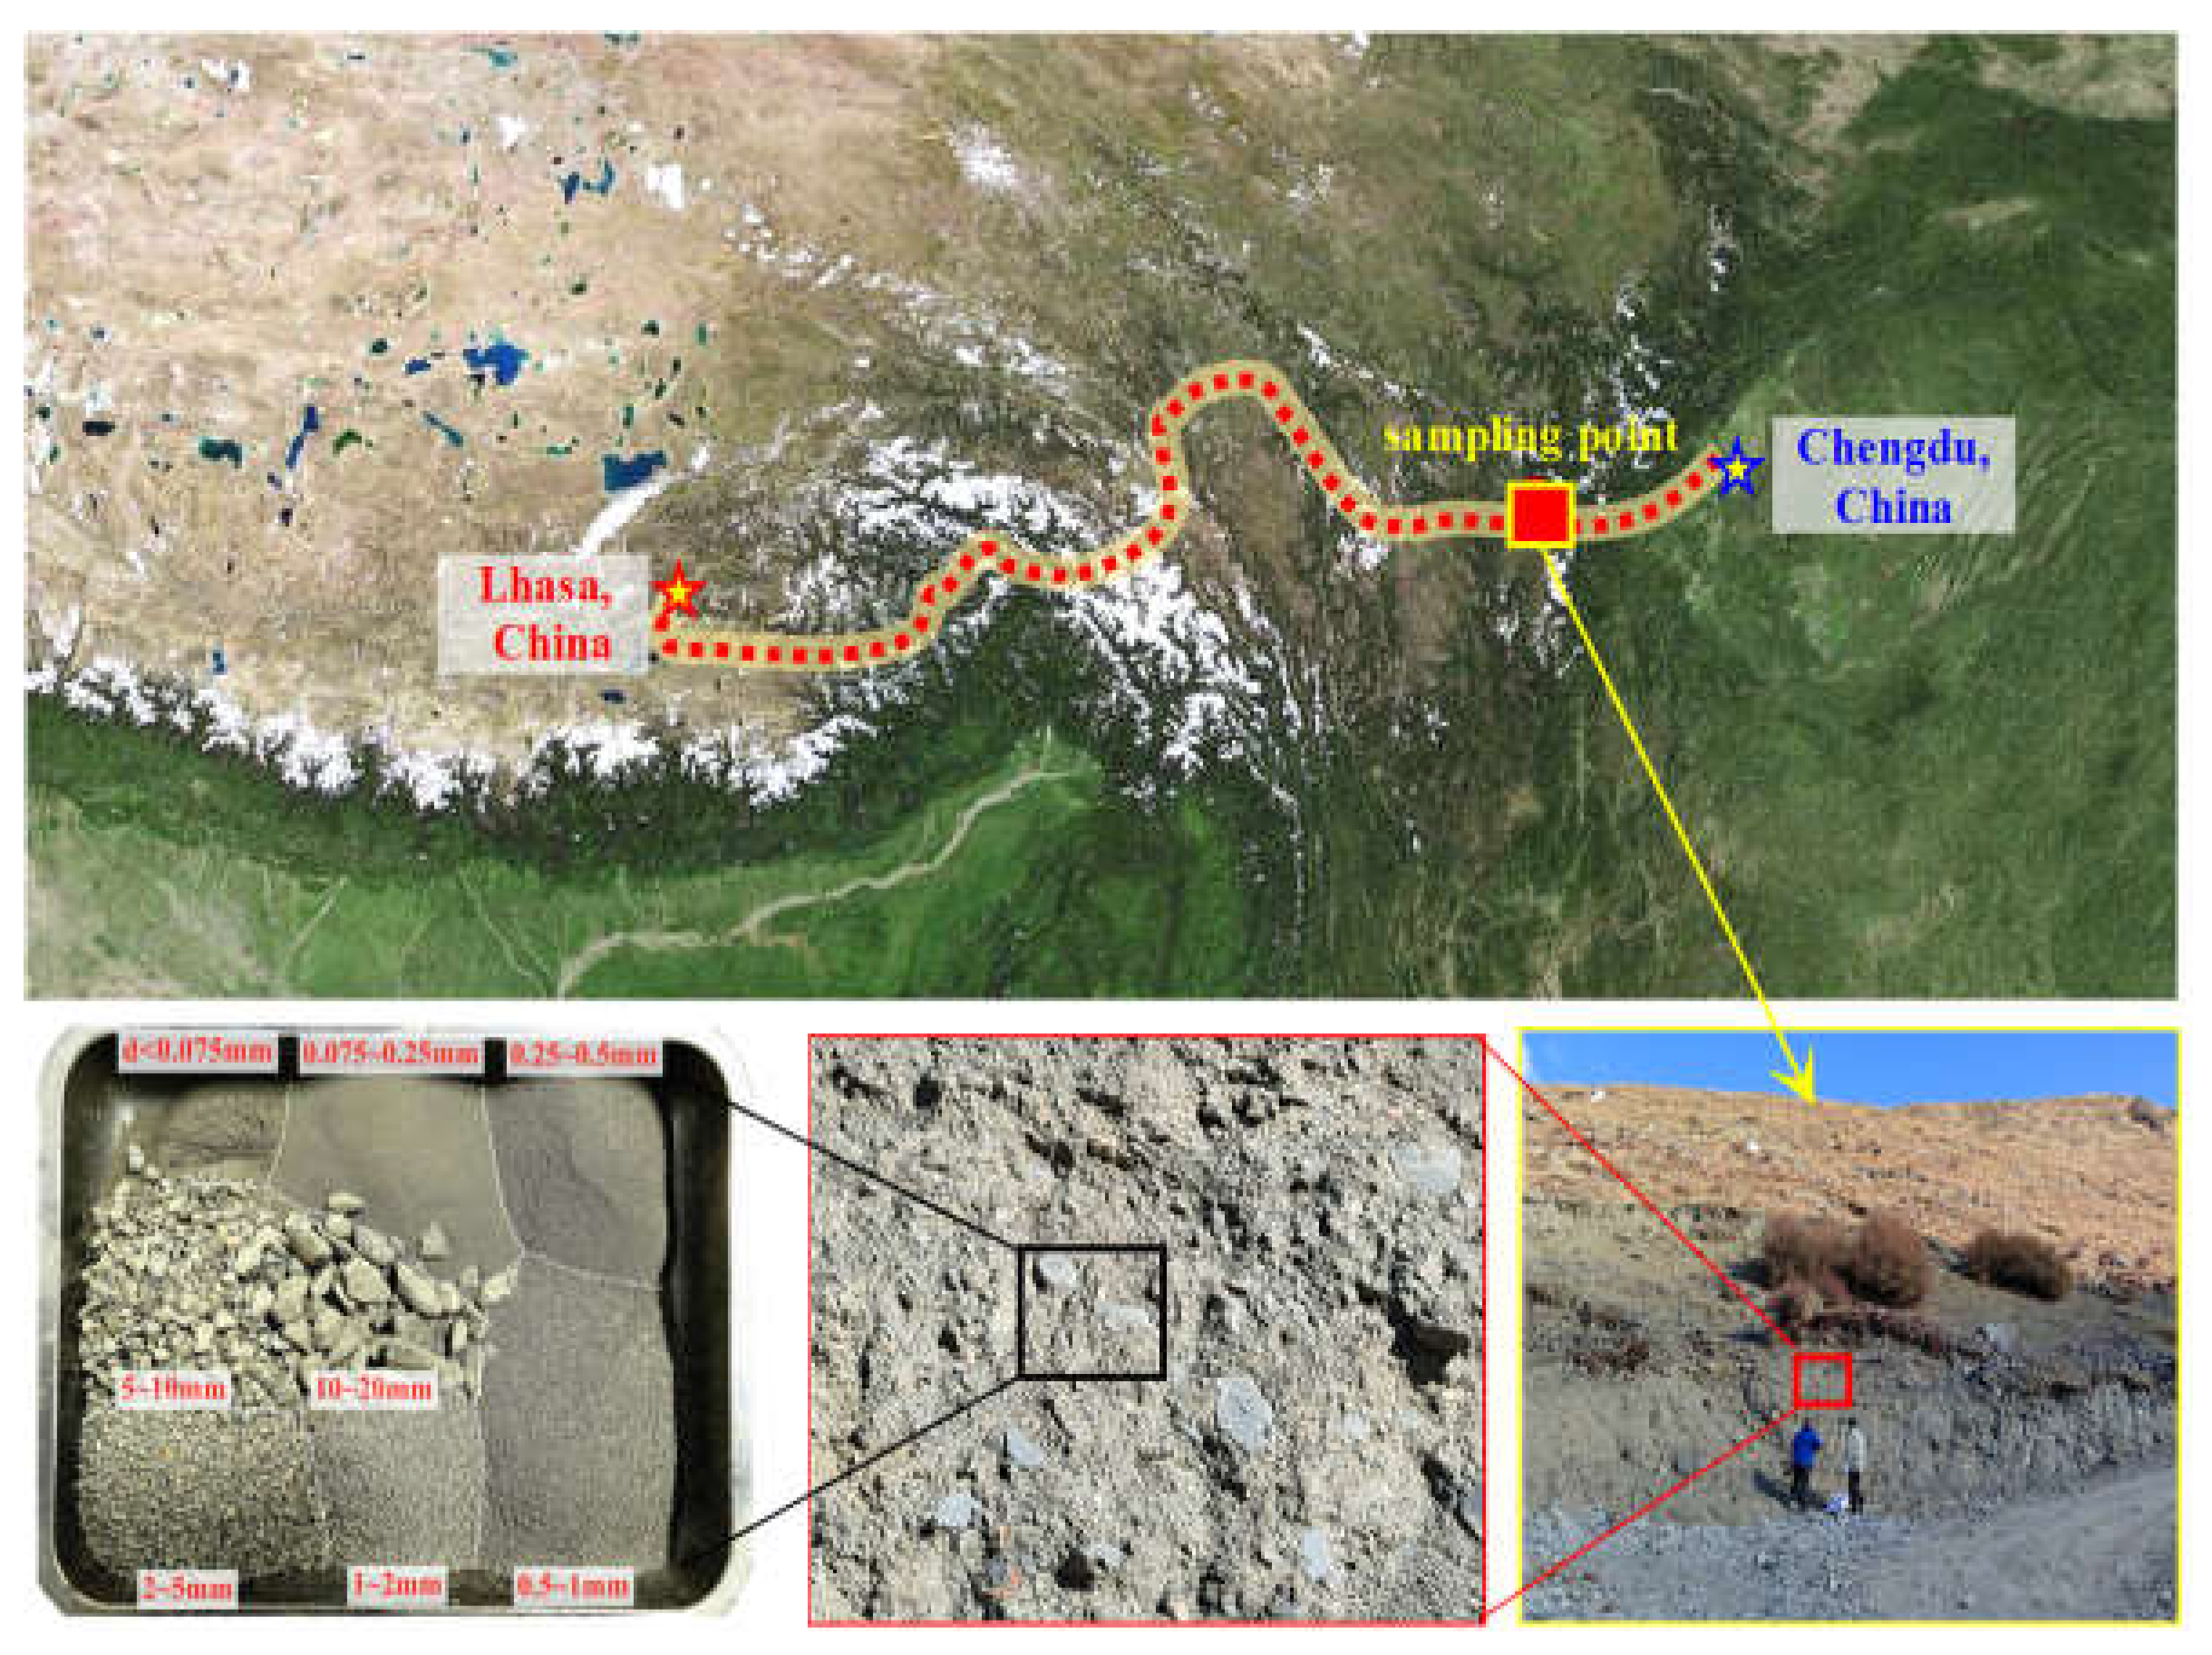
Figure 2.
Grain-size Distribution Curves of Samples Before and After Treatment of Oversized Particles.
Figure 2.
Grain-size Distribution Curves of Samples Before and After Treatment of Oversized Particles.
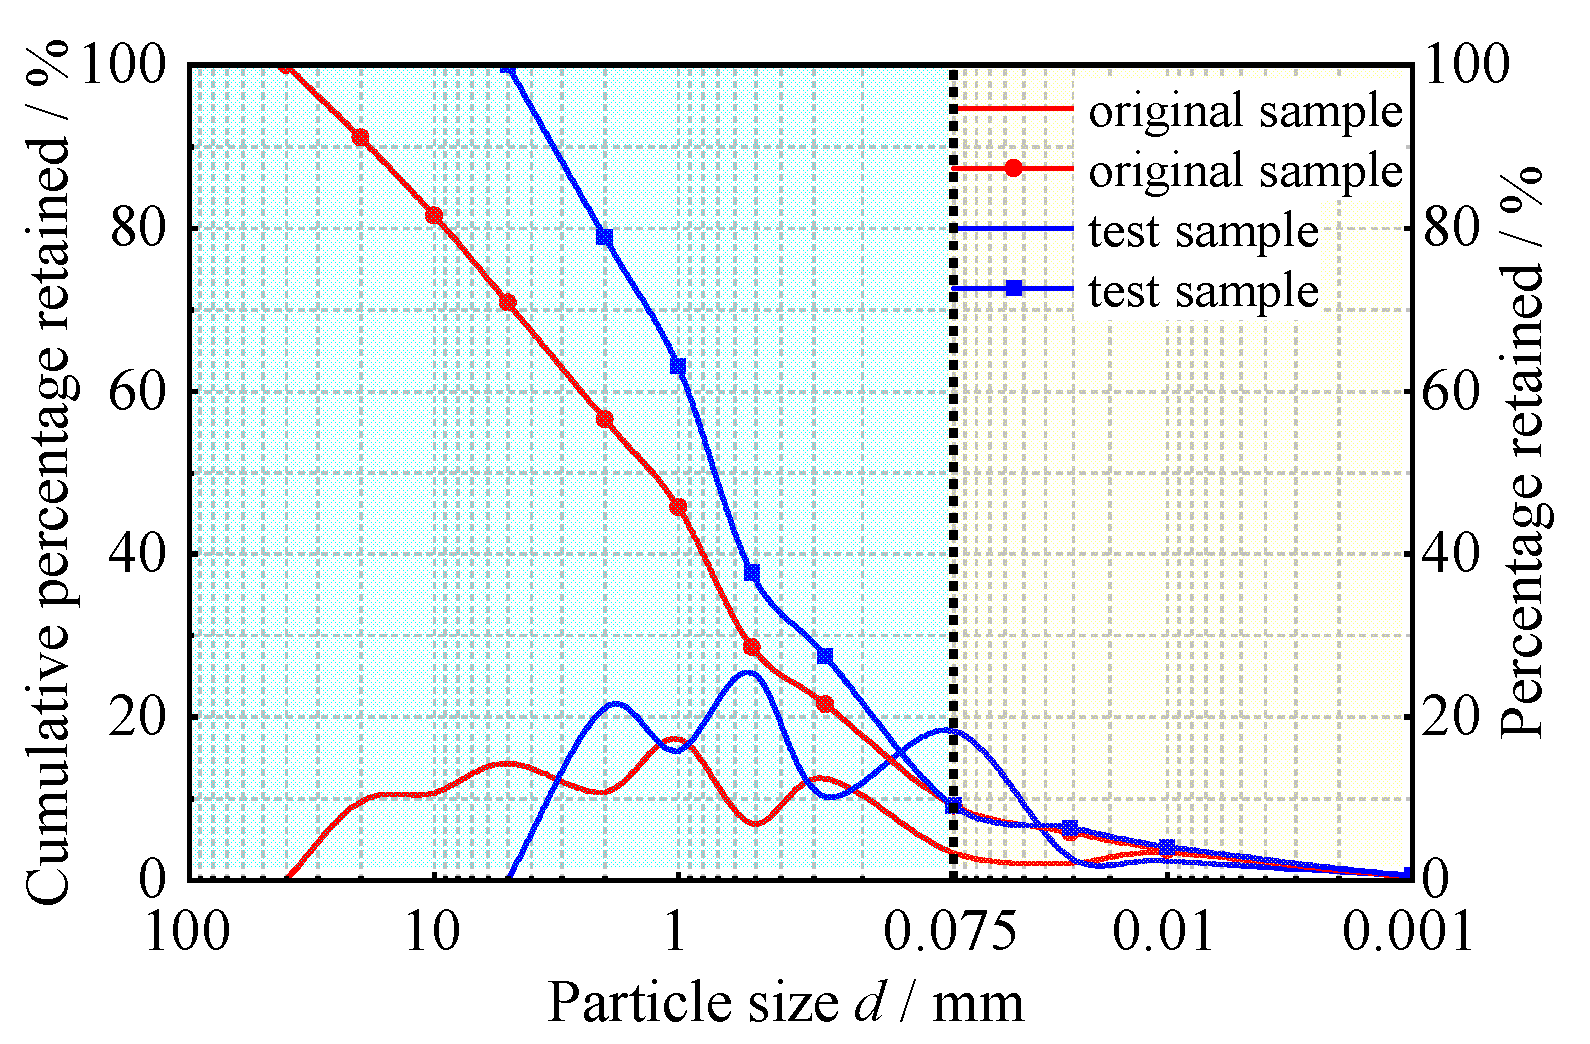
Figure 3.
Particle Gradation Curves of Samples at Different Fine Particle Contents.
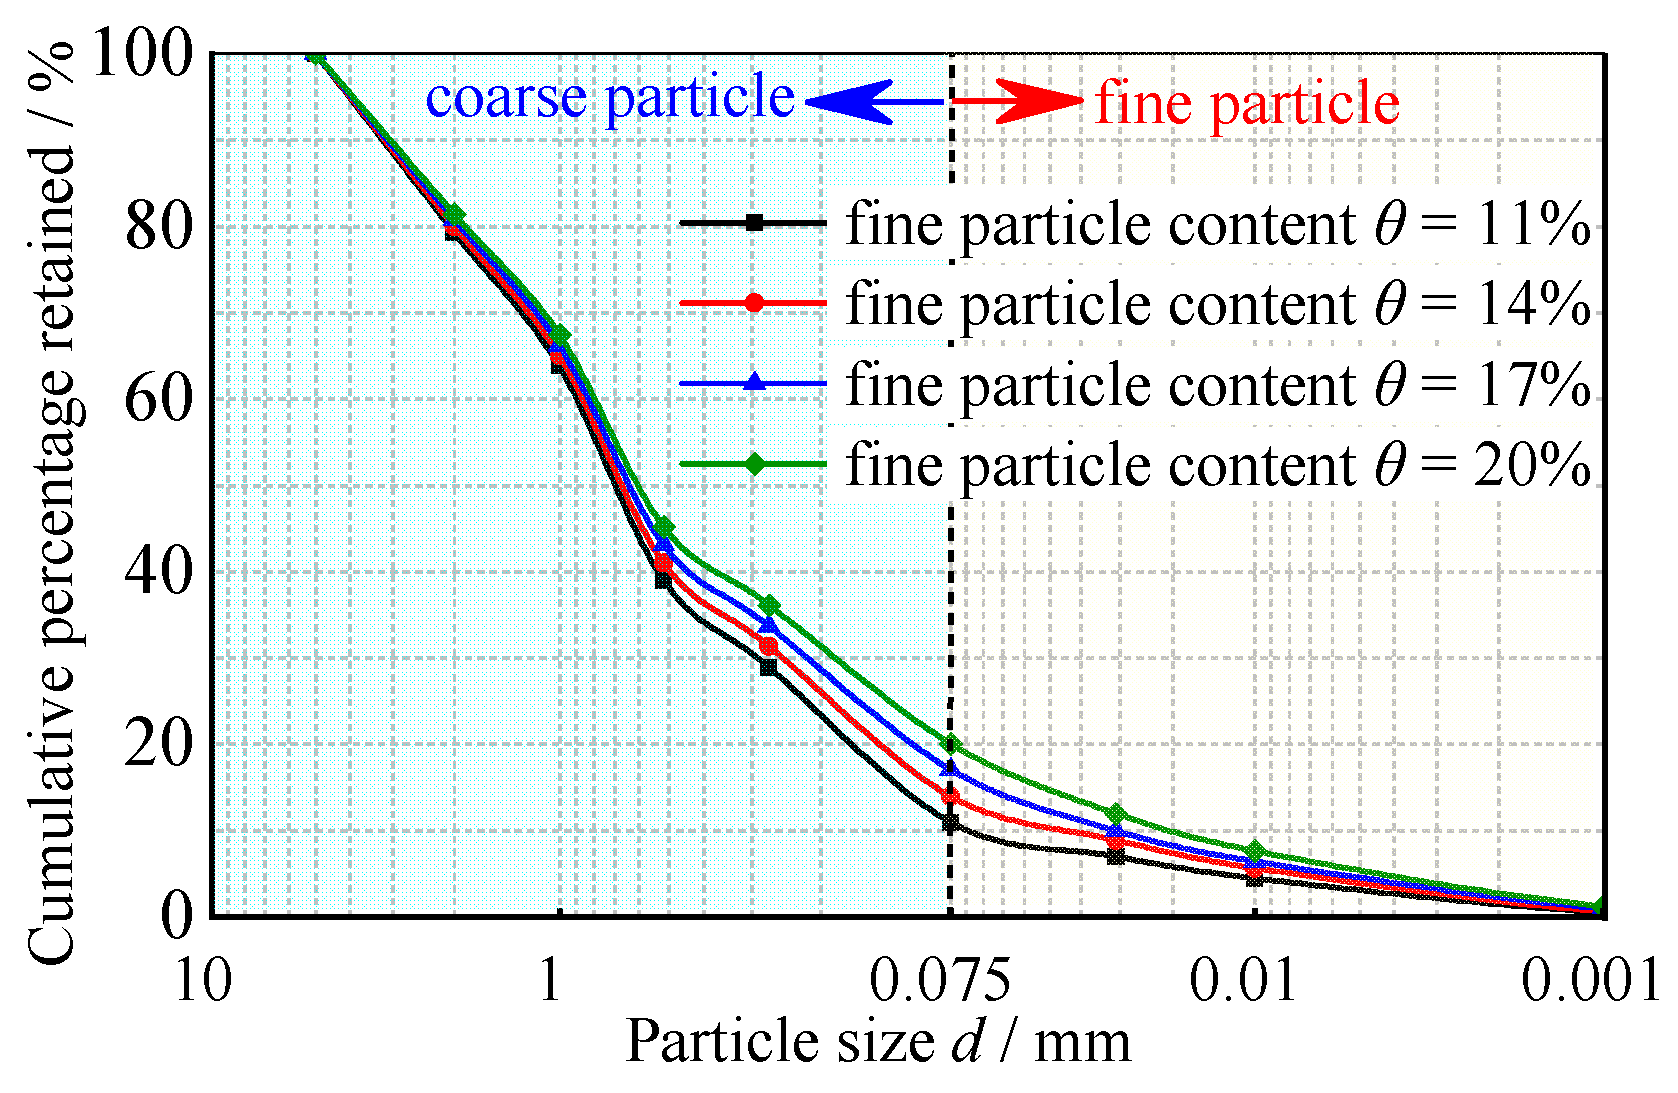
Figure 4.
Variation of Real Shear Surface Area in Direct Shear Test.
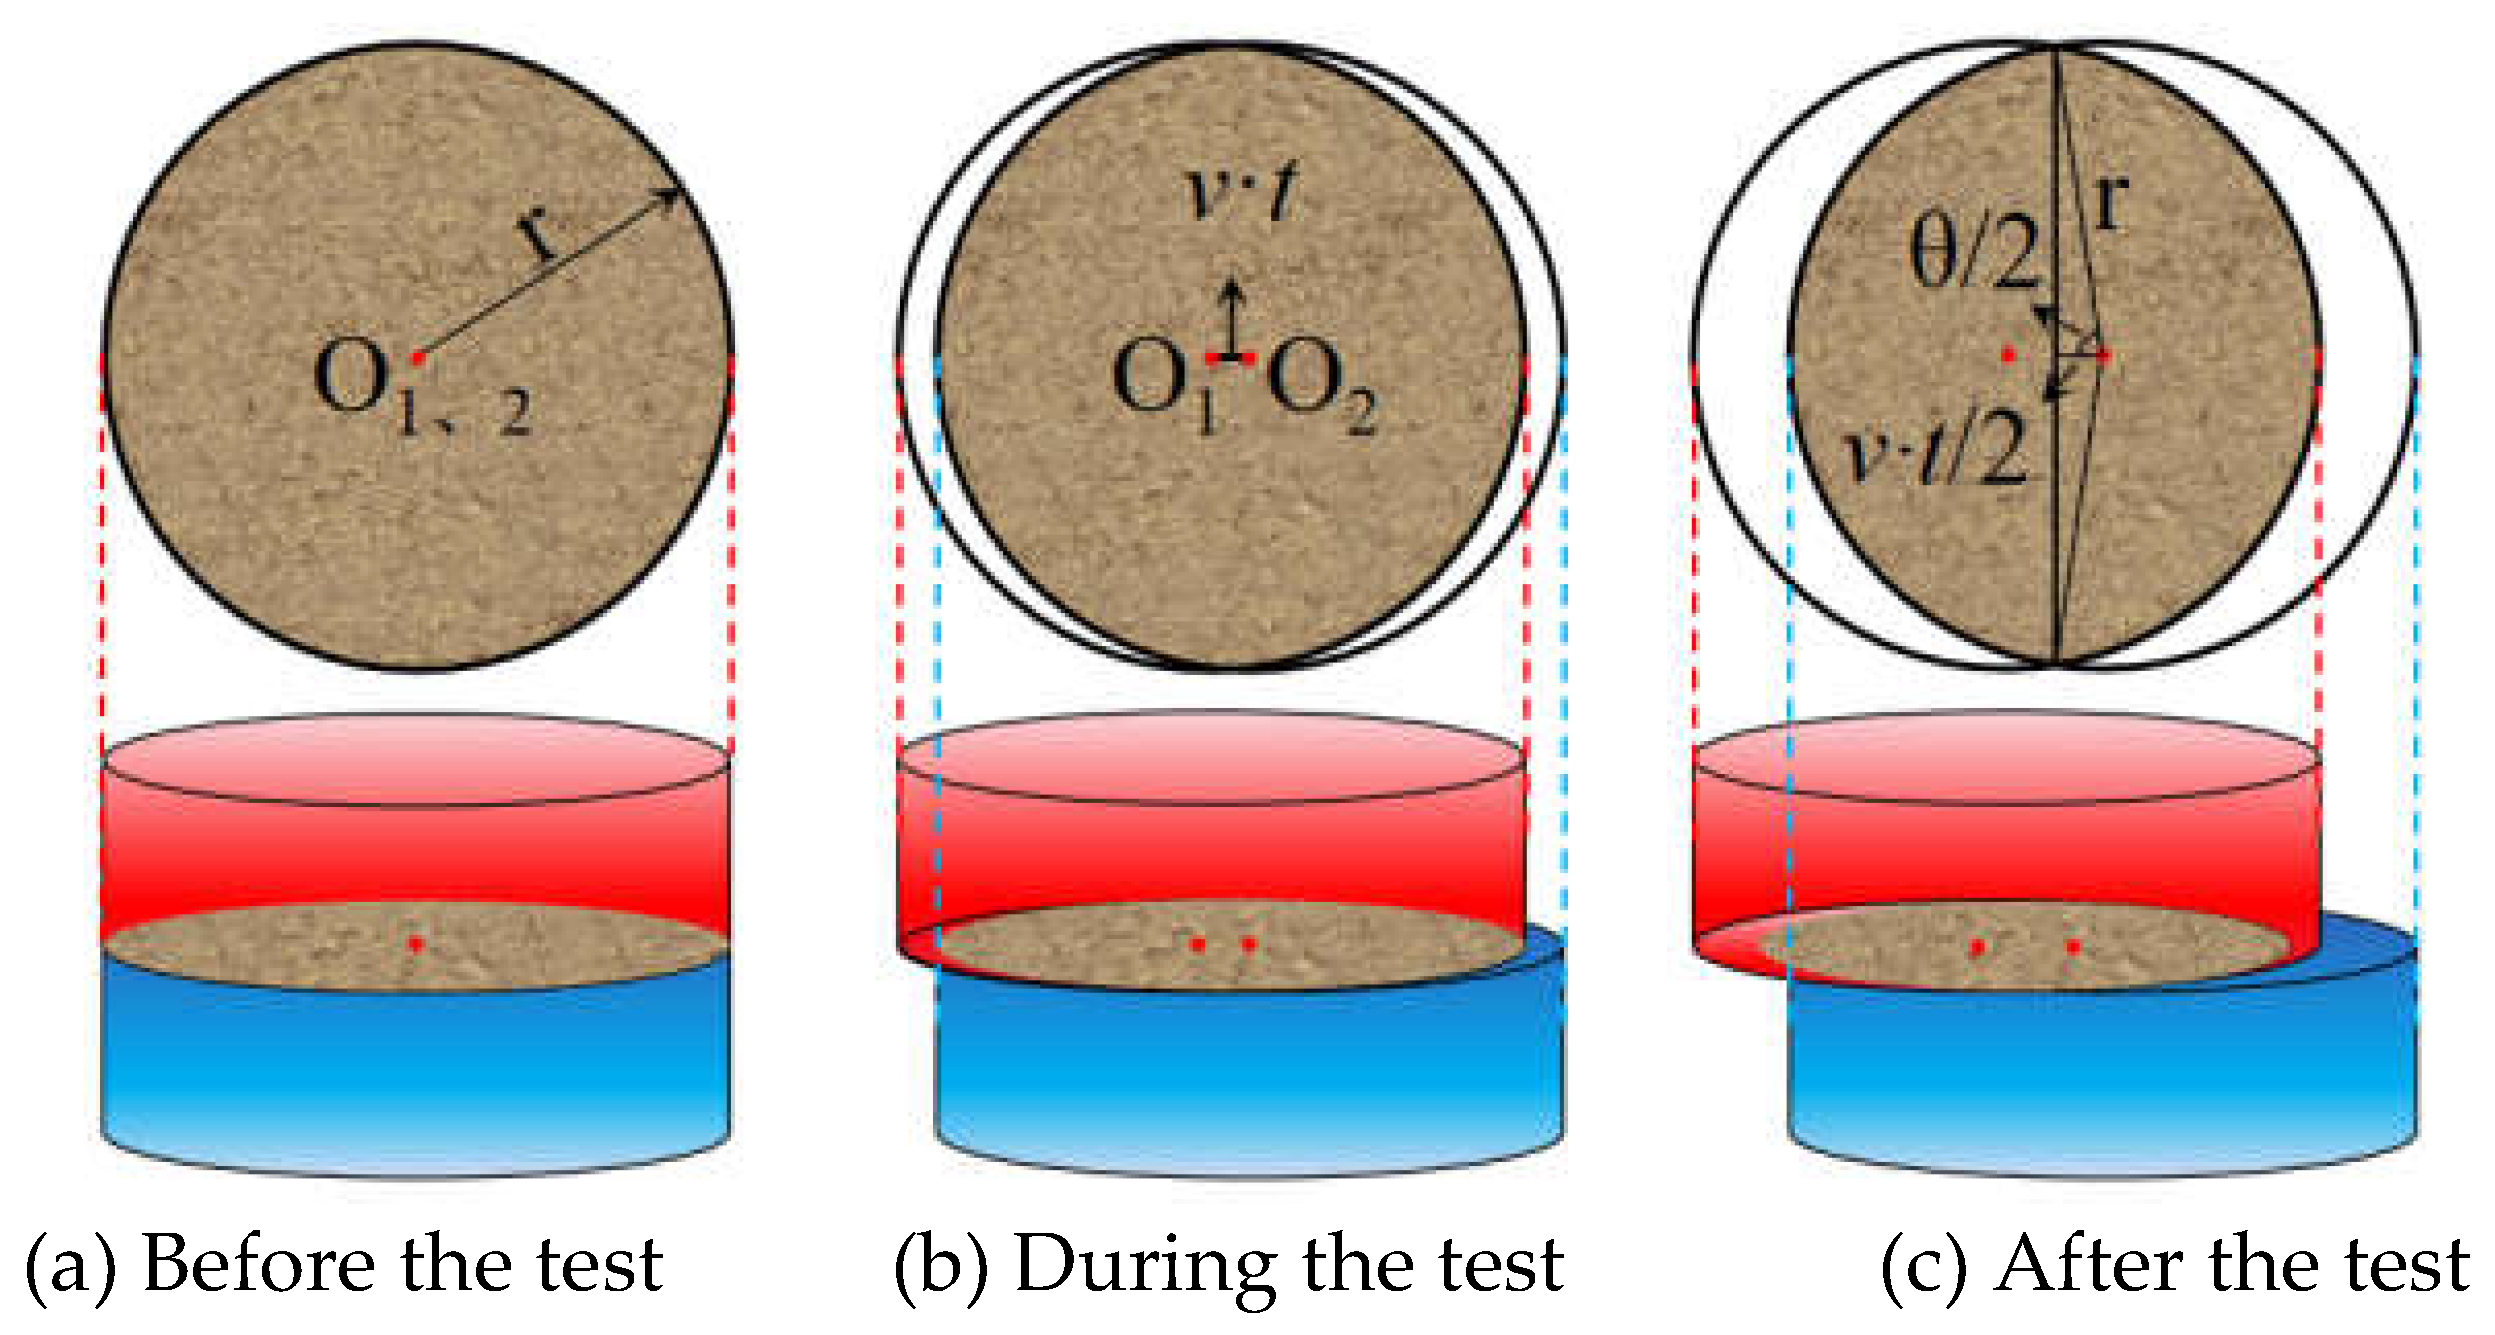
Figure 5.
Shear Stress-Shear Strain Relationship Curves of the Sample under Different Factors.
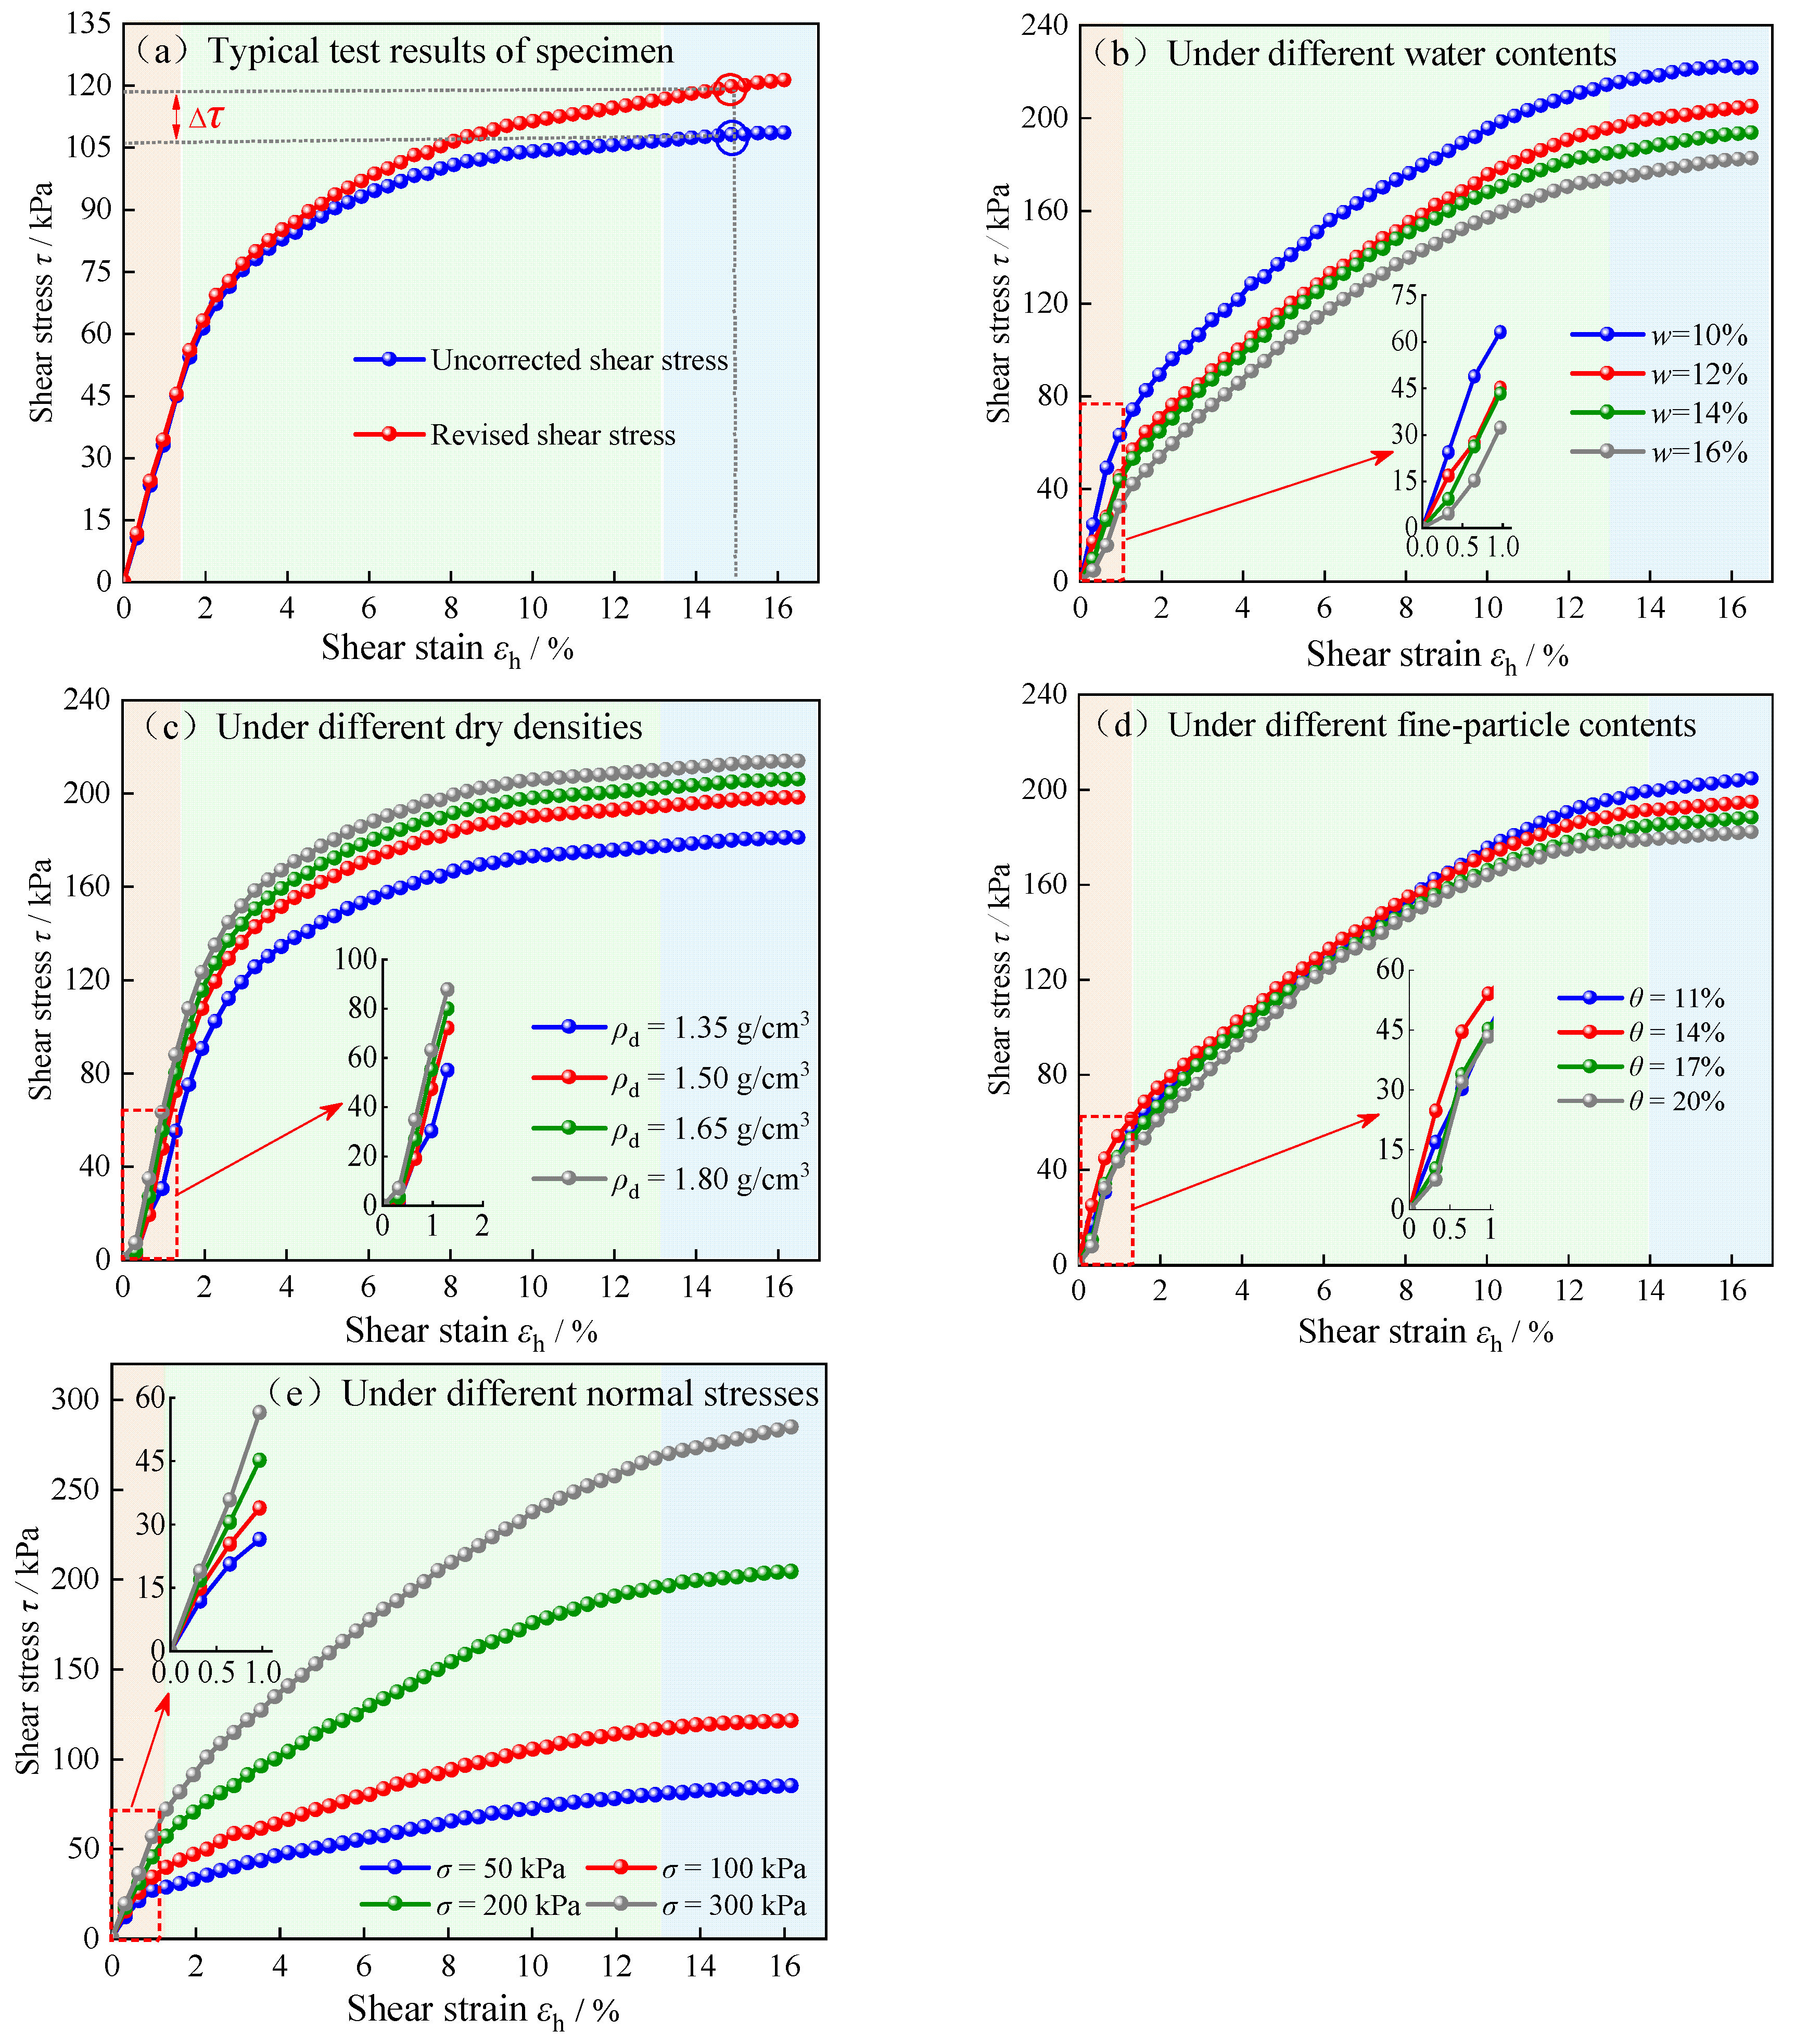
Figure 6.
Normal Strain-Shear Strain Relationship Curve of the Sample.
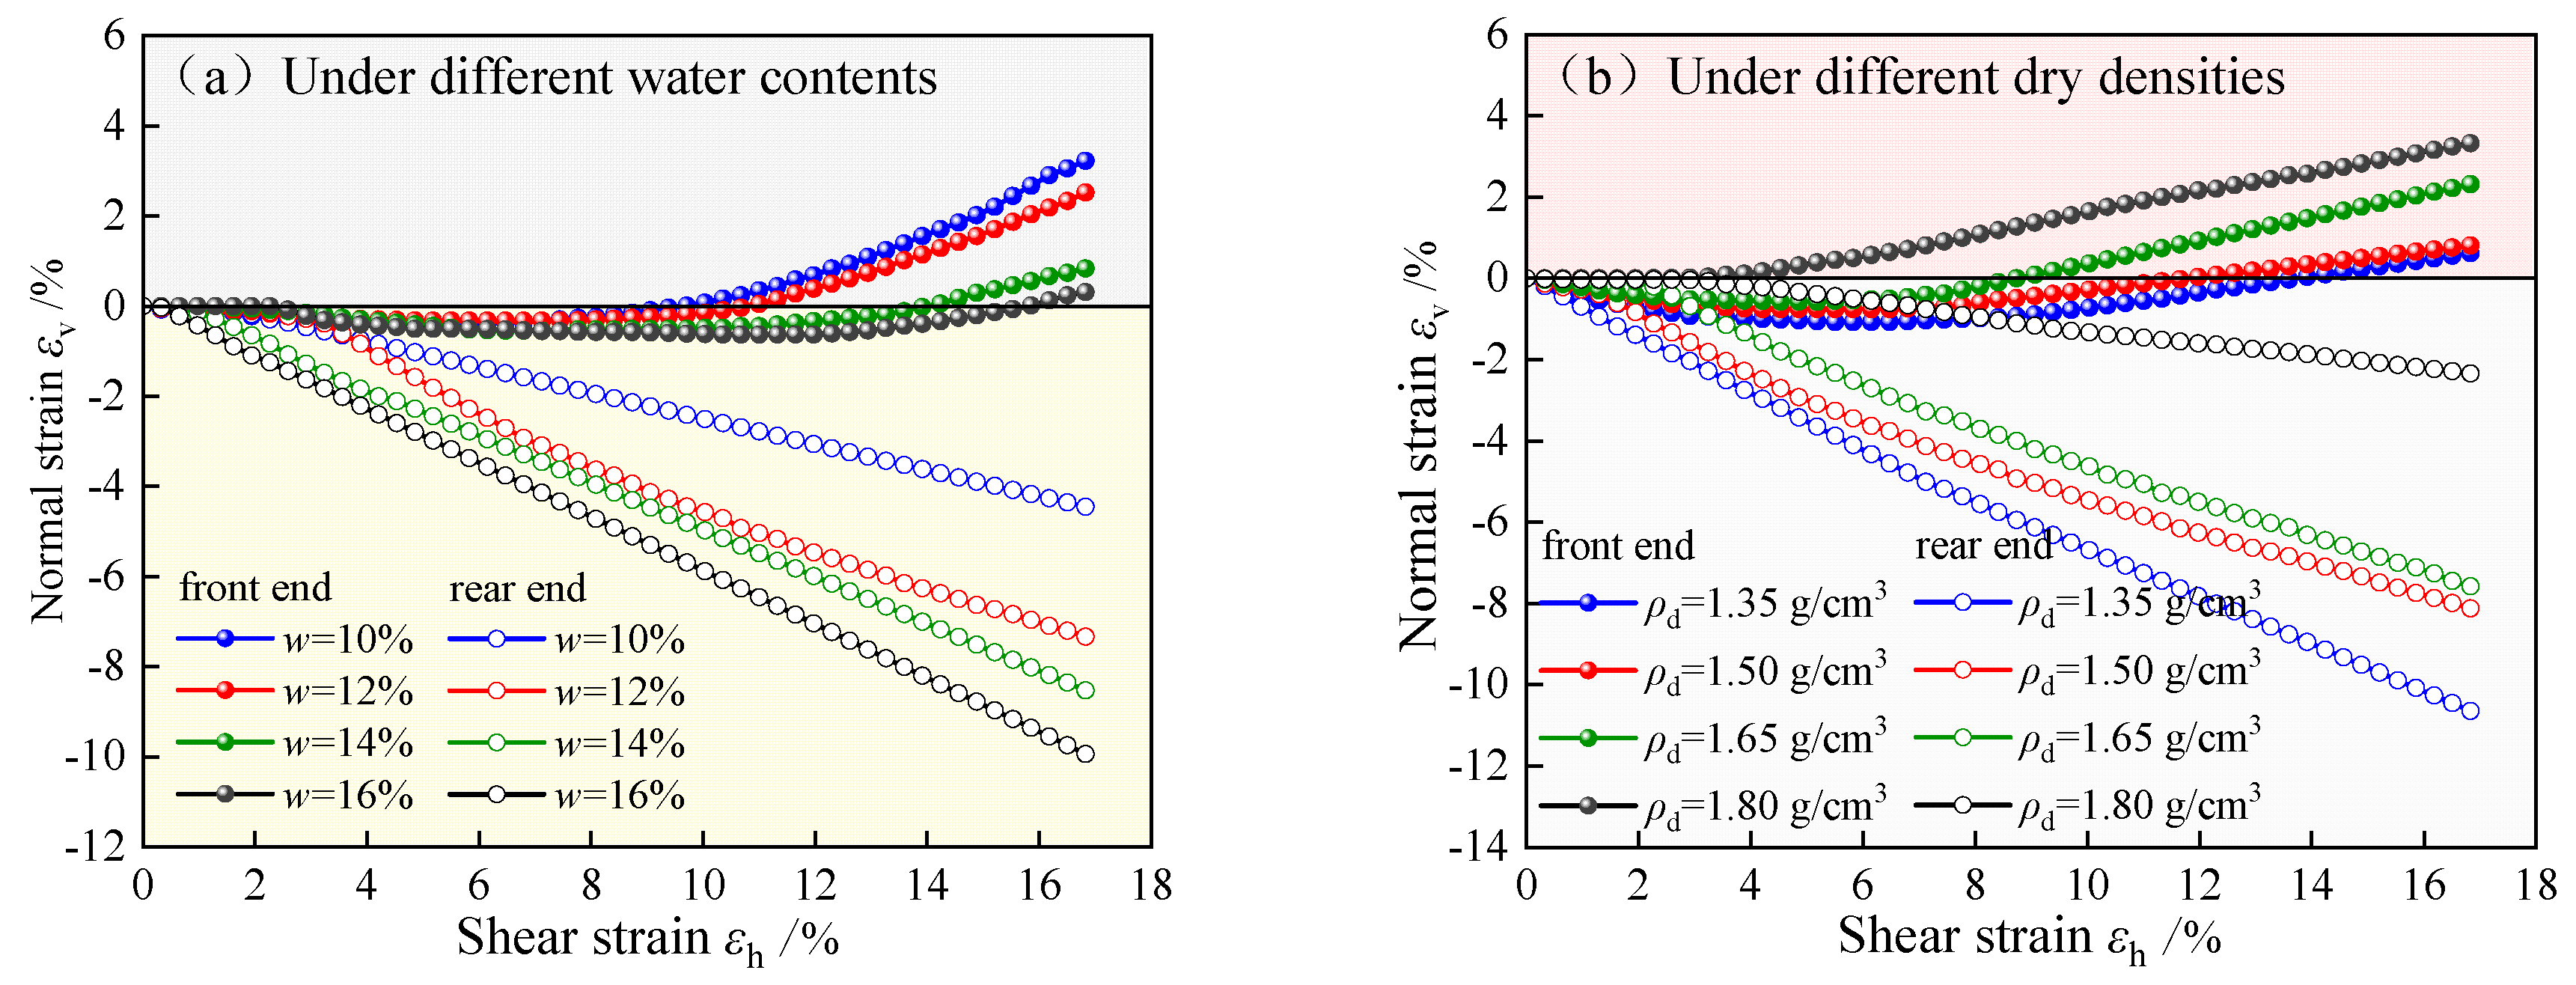
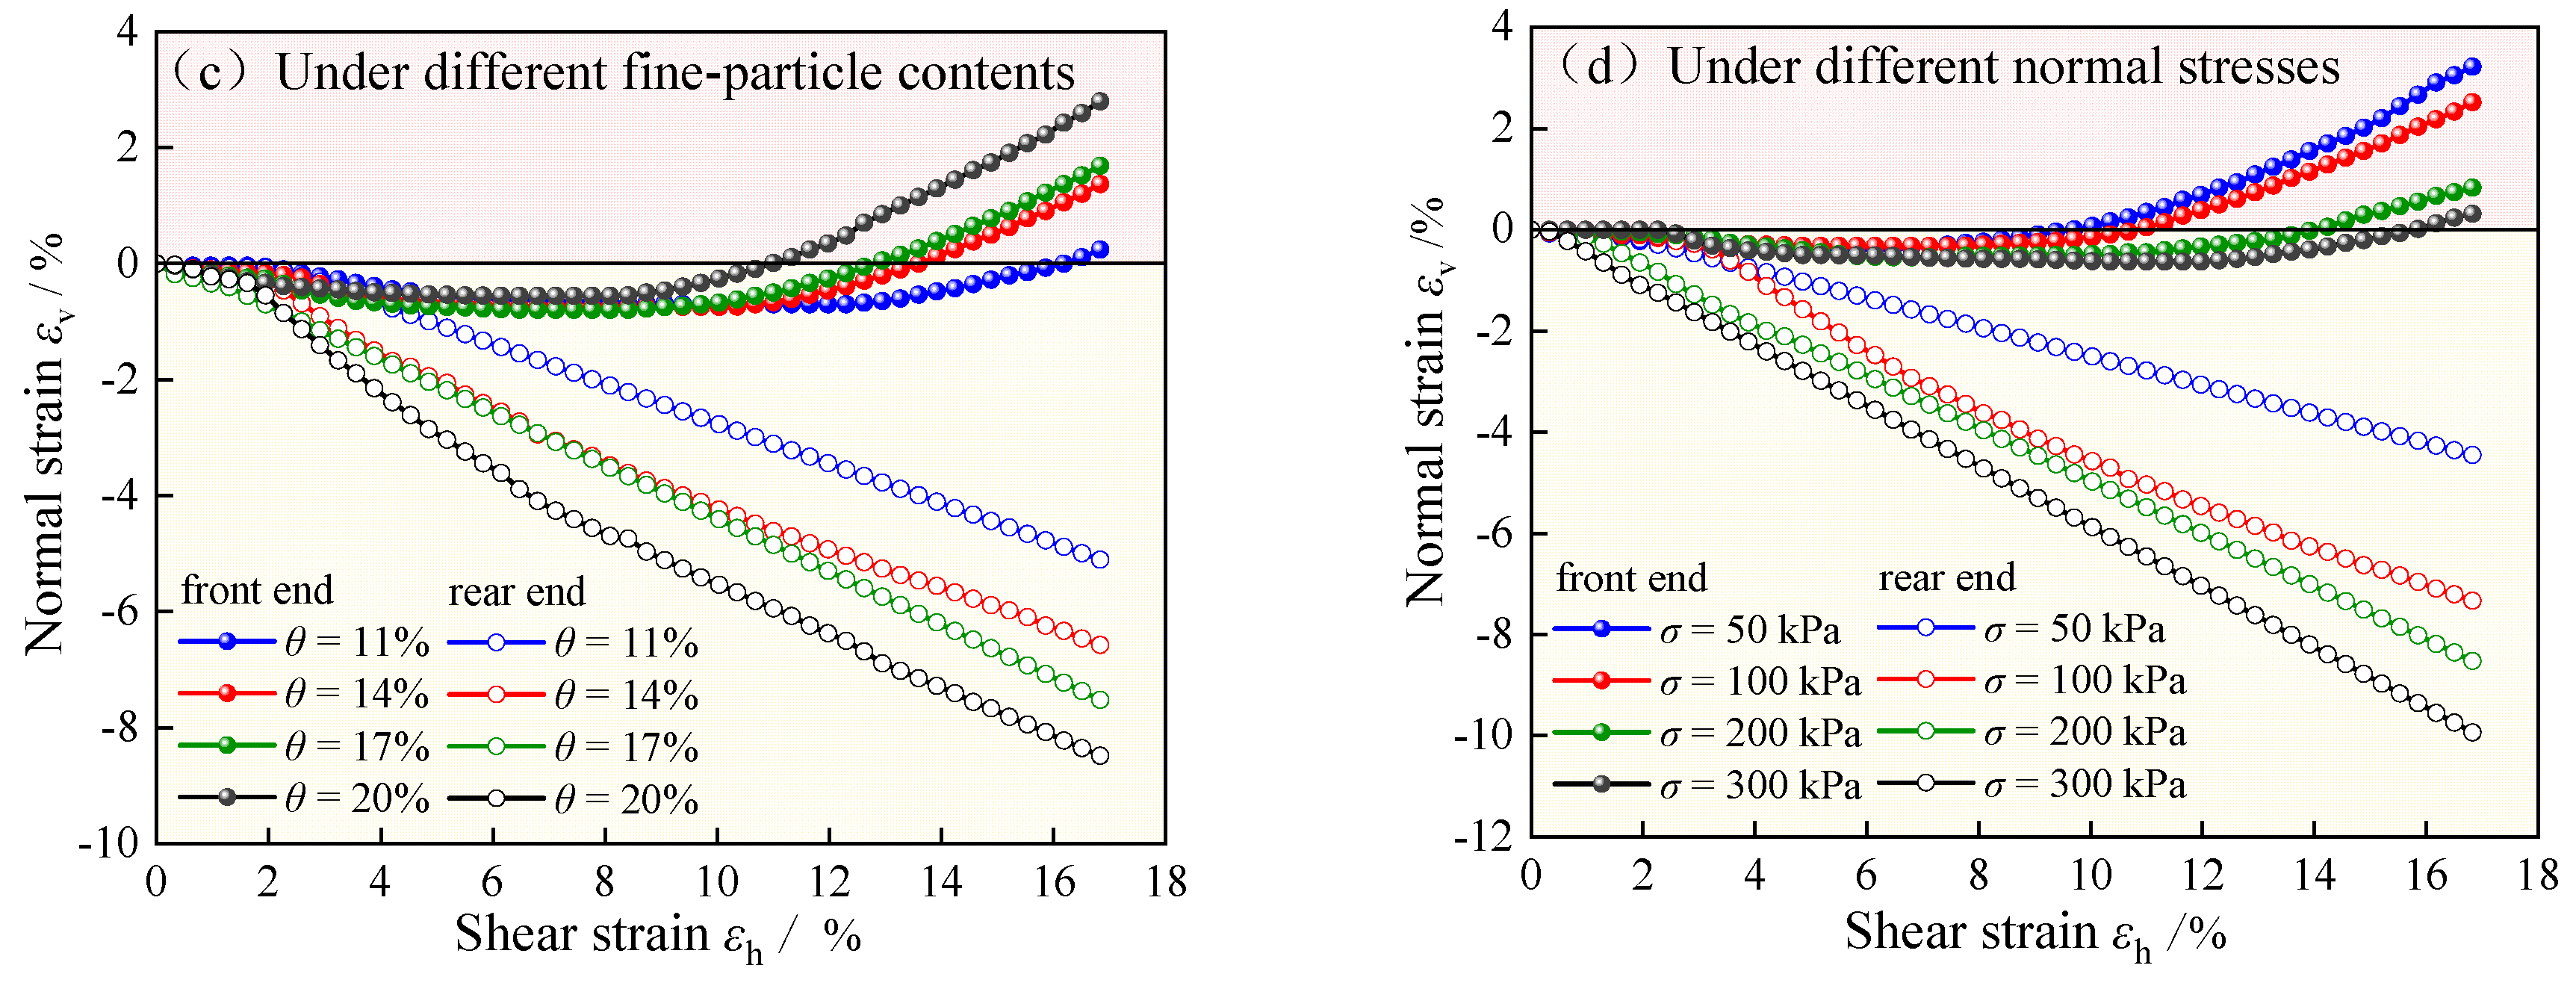
Figure 7.
Experimental Results of Heterogeneous Shear Dilation Deformation of the Sample.
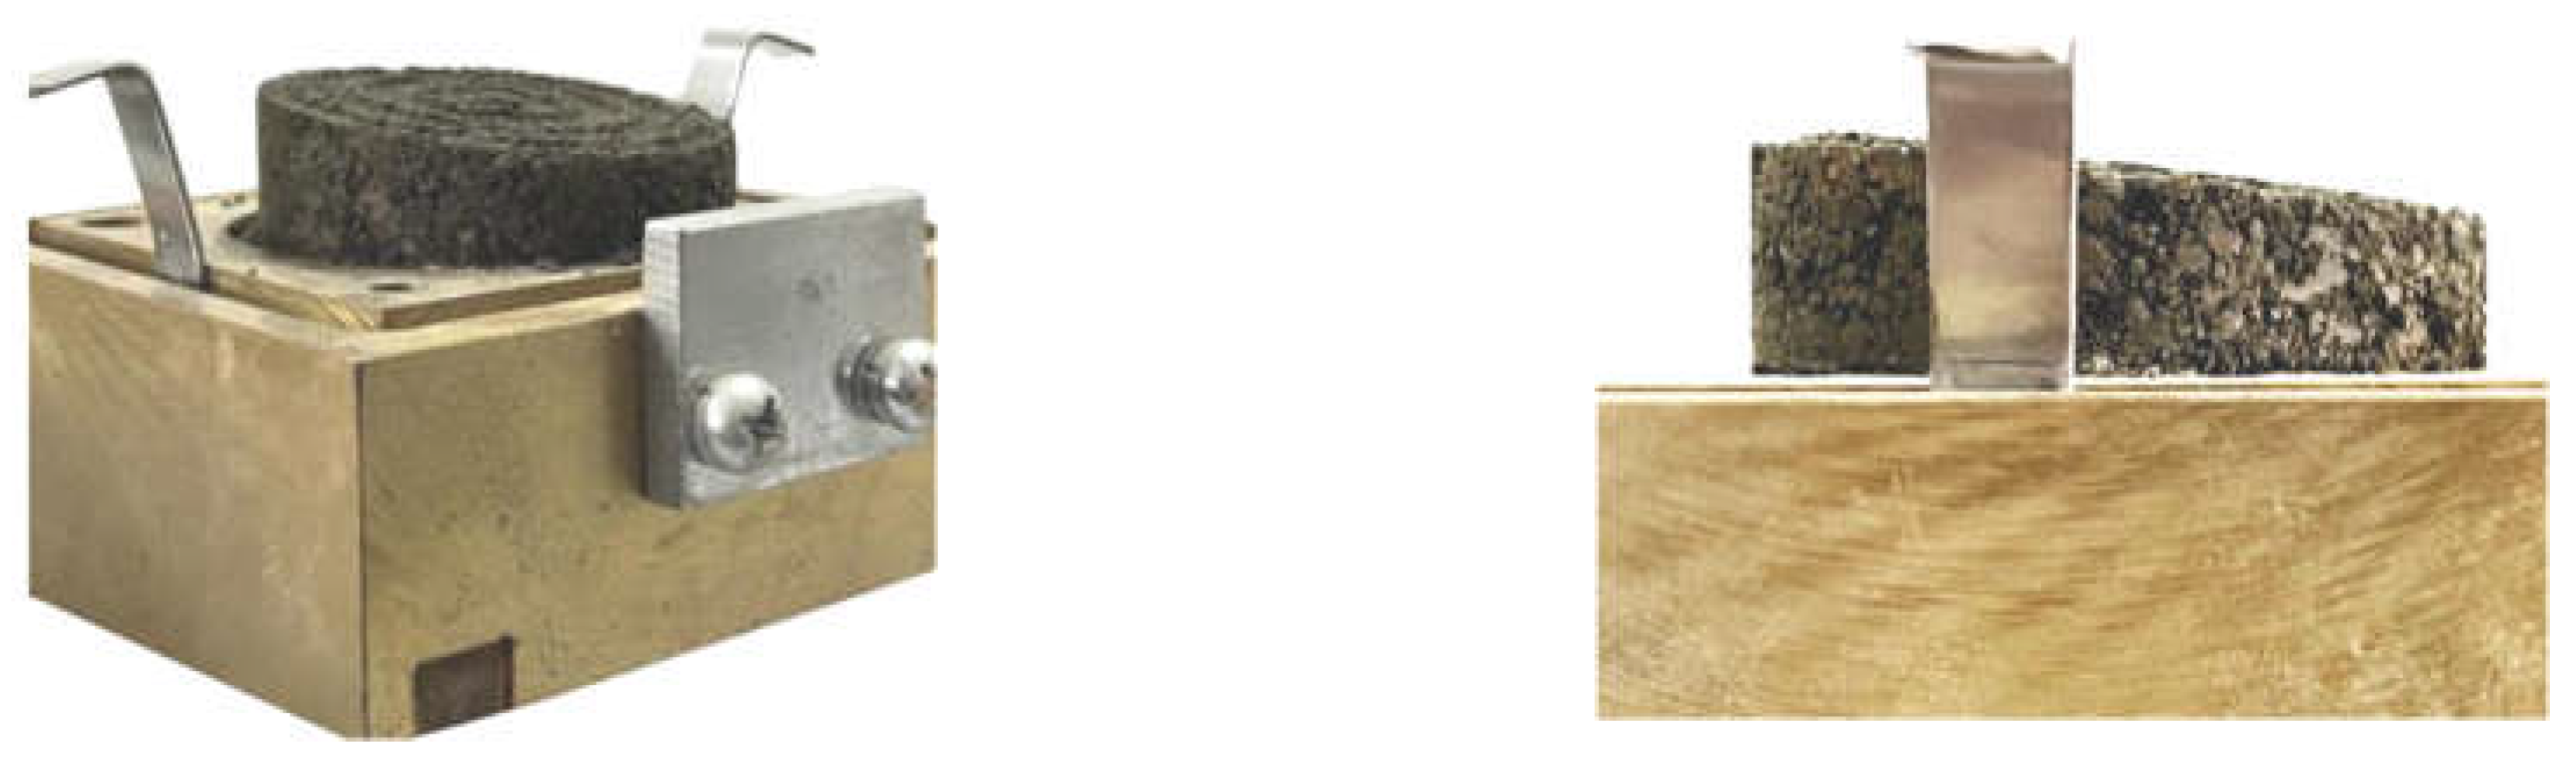
Figure 8.
Schematic of the Heterogeneous Shear Dilation Deformation of the Sample.
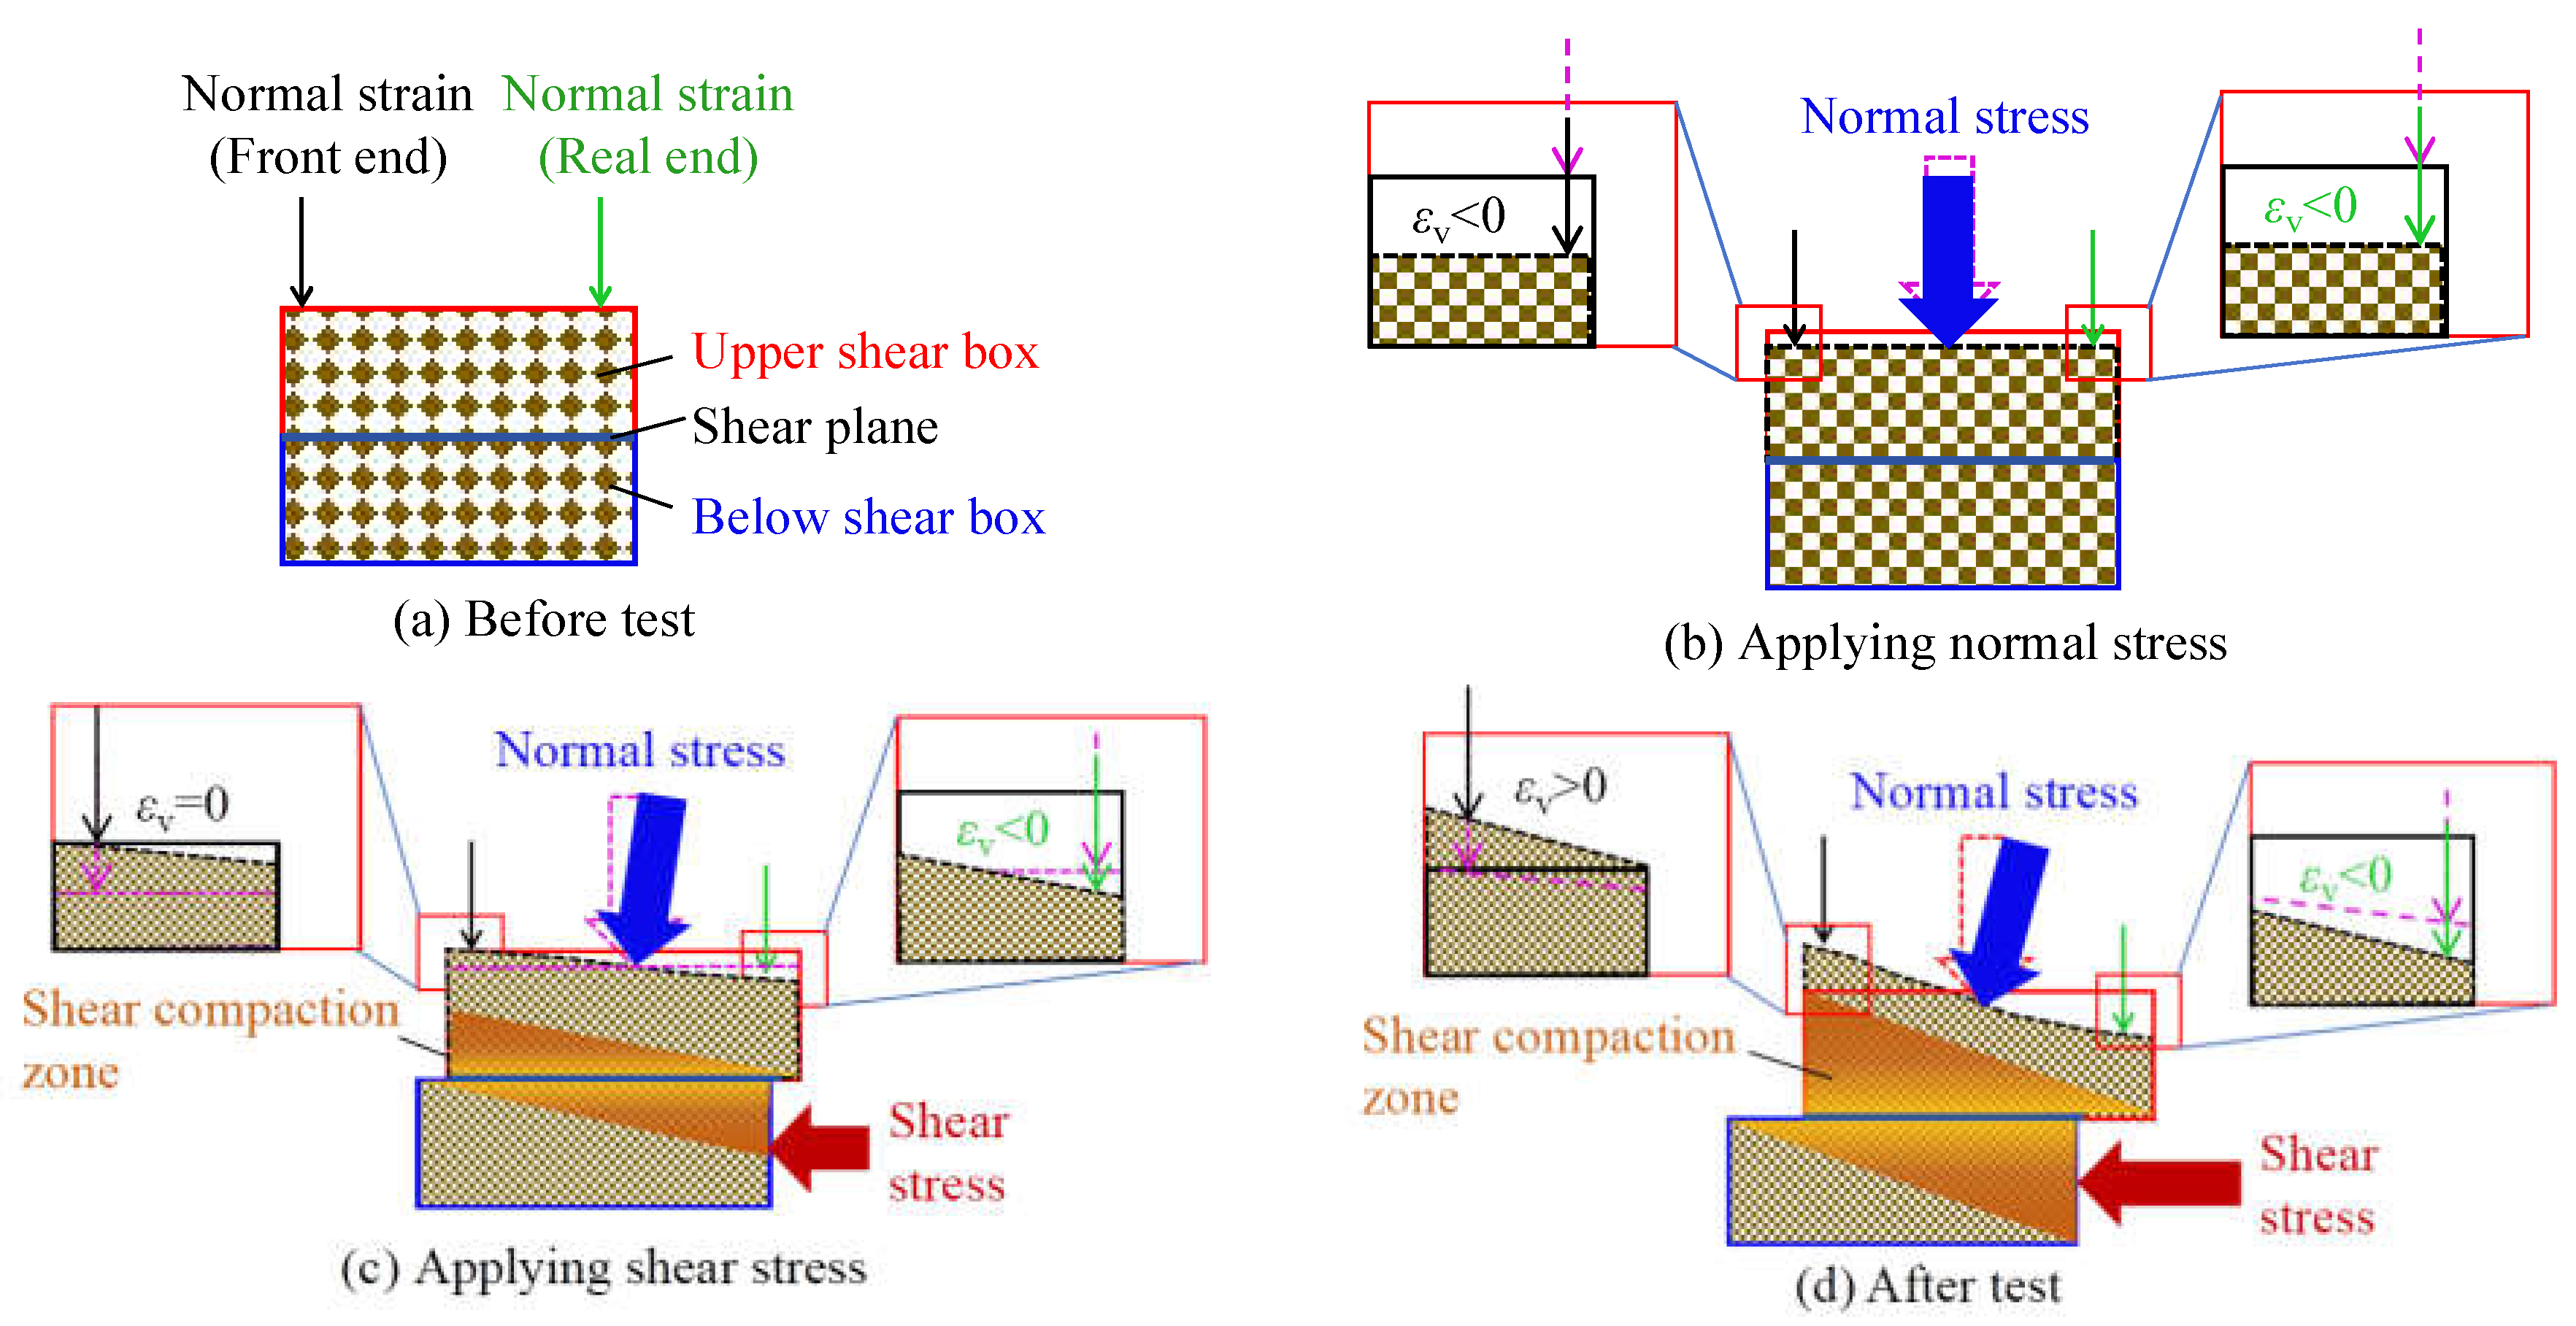
Figure 9.
Schematic Diagram of Normal Stress Axis Rotation Angle.
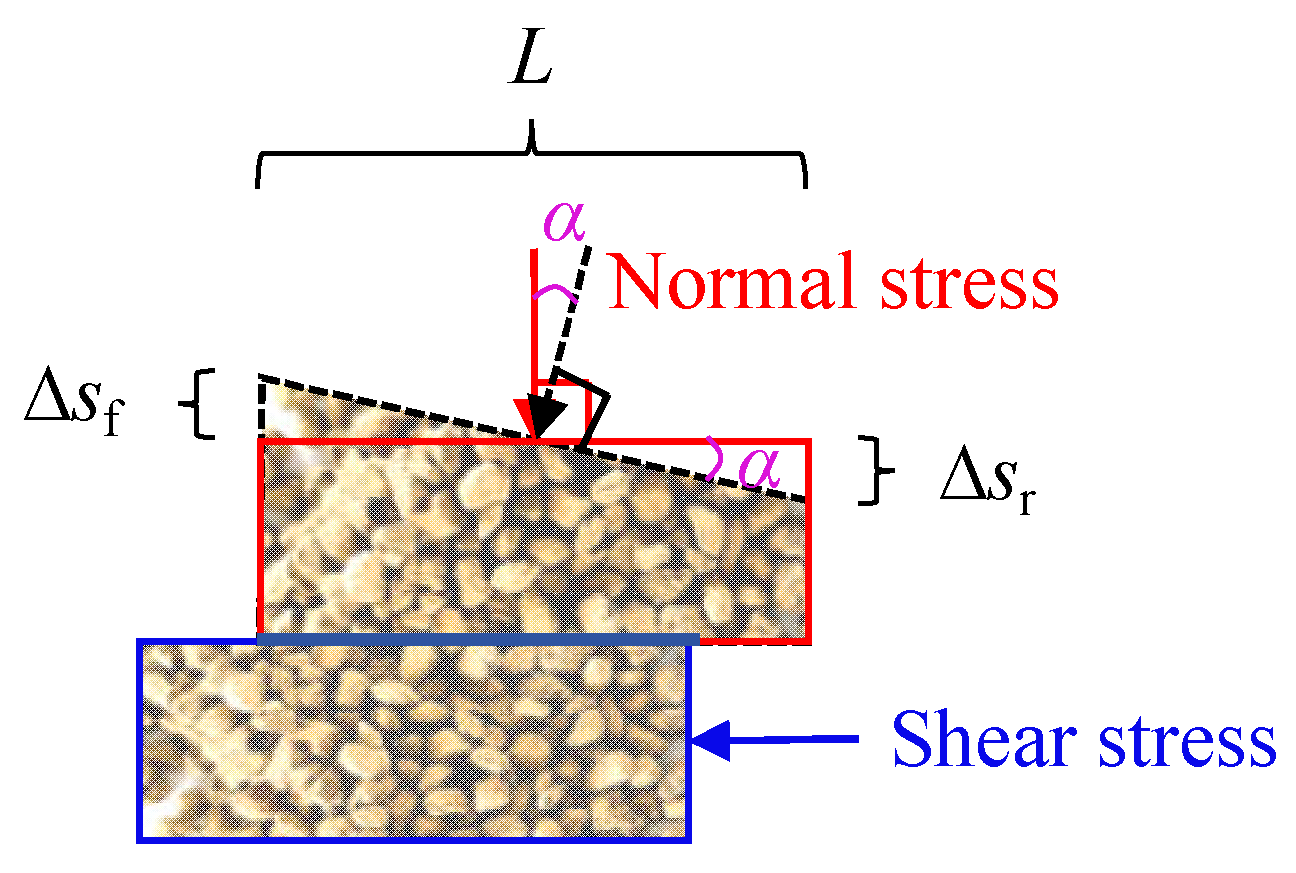
Figure 10.
Normal Stress Axis Rotation of the Sample under Different Initial Water Contents.
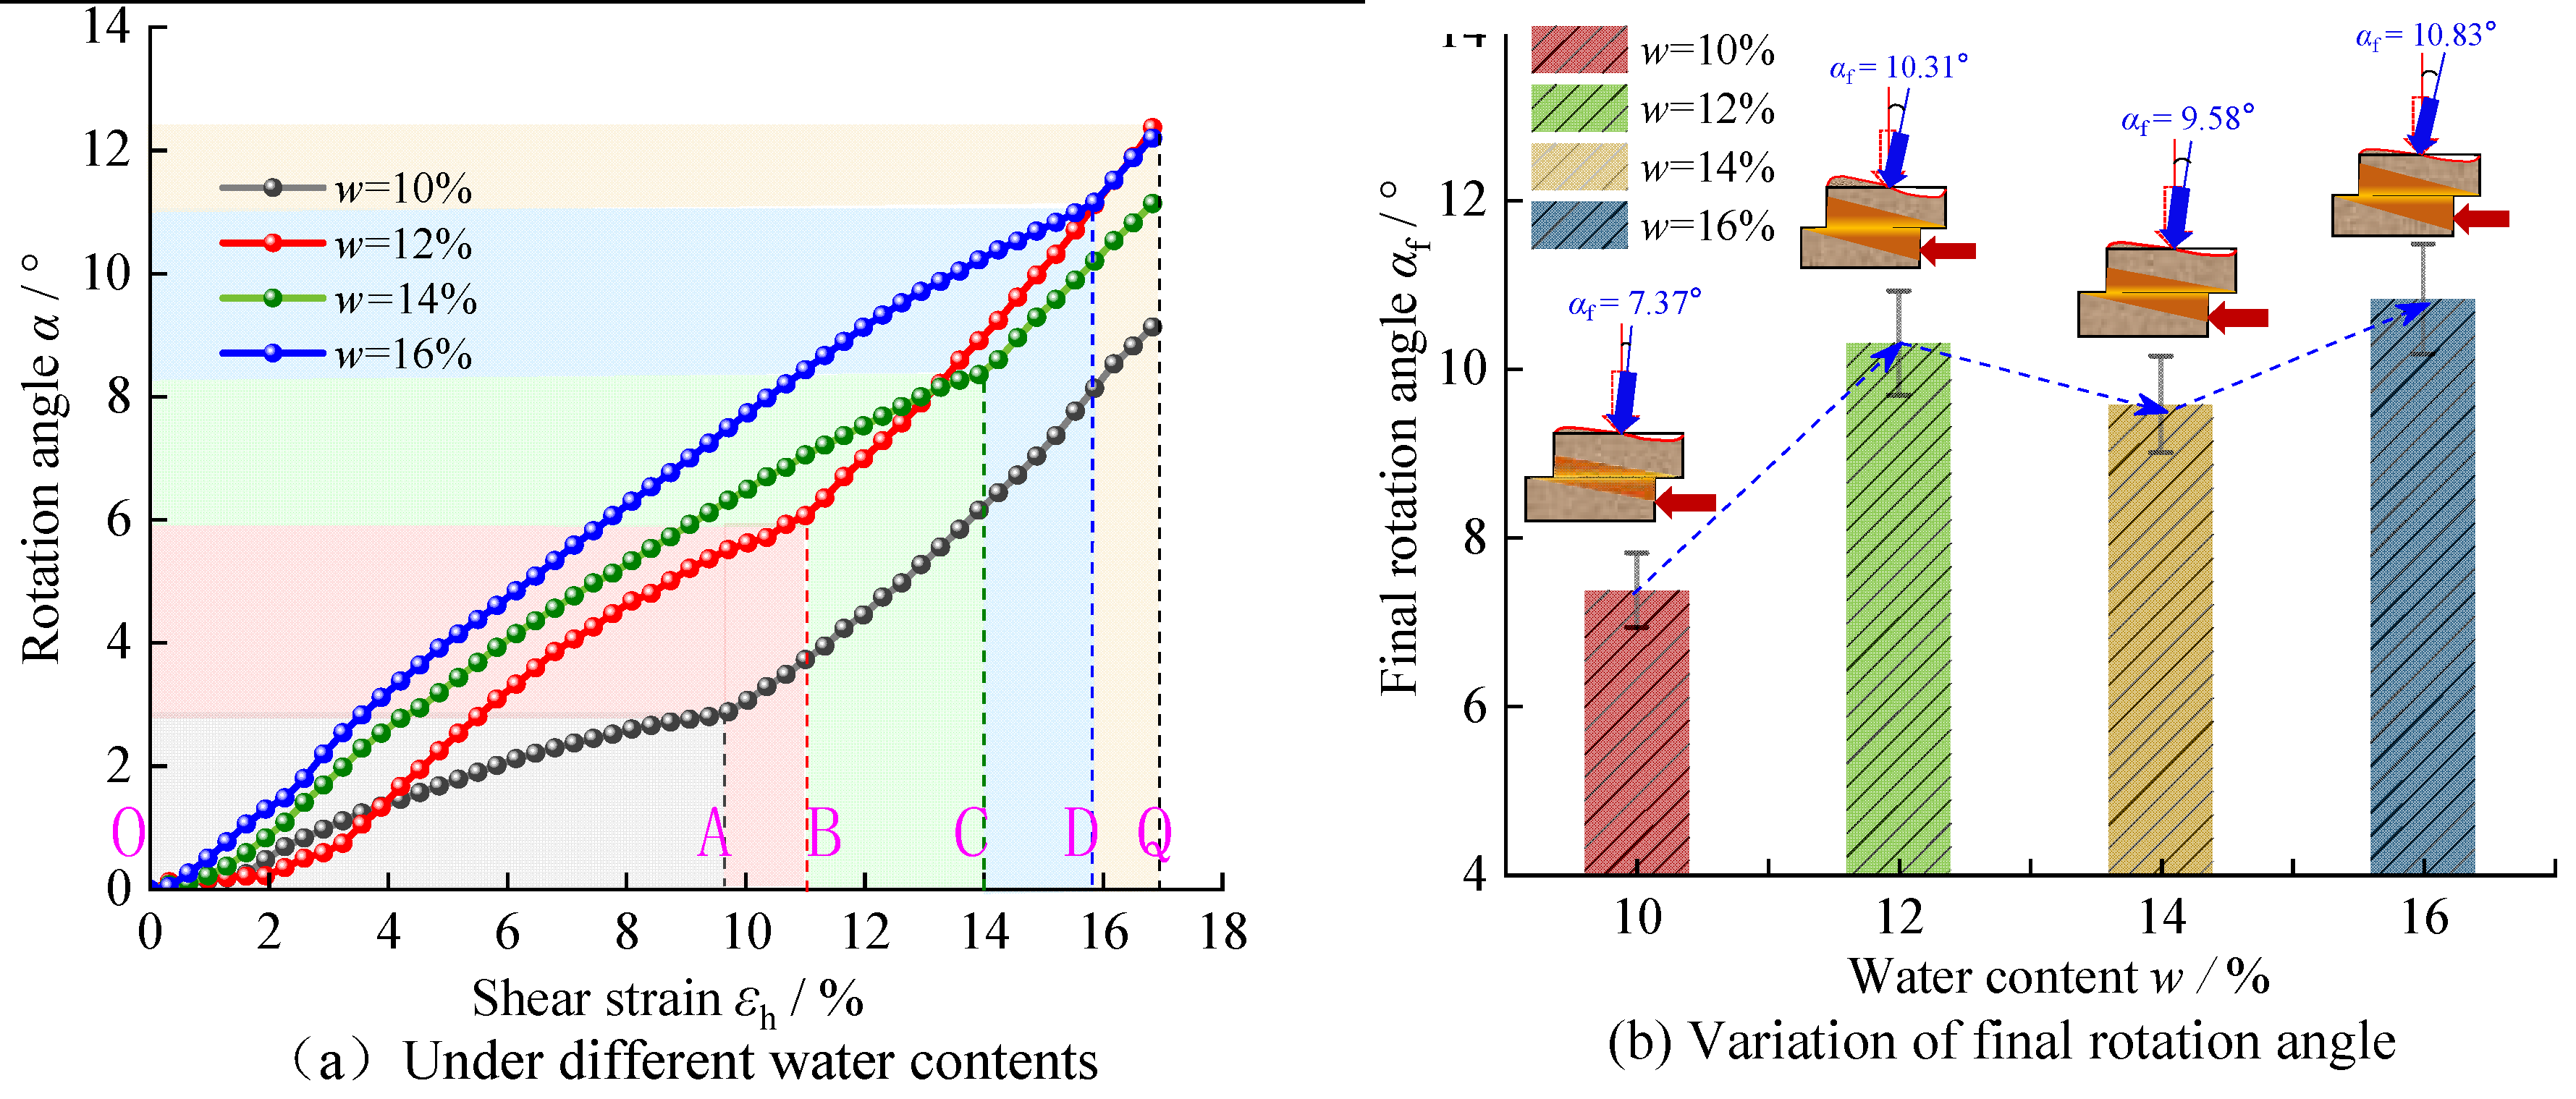
Figure 11.
Normal Stress Axis Rotation of the Sample under Different Dry Densities.
Figure 12.
Normal Stress Axis Rotation of the Sample under Different Fine Particle Contents.
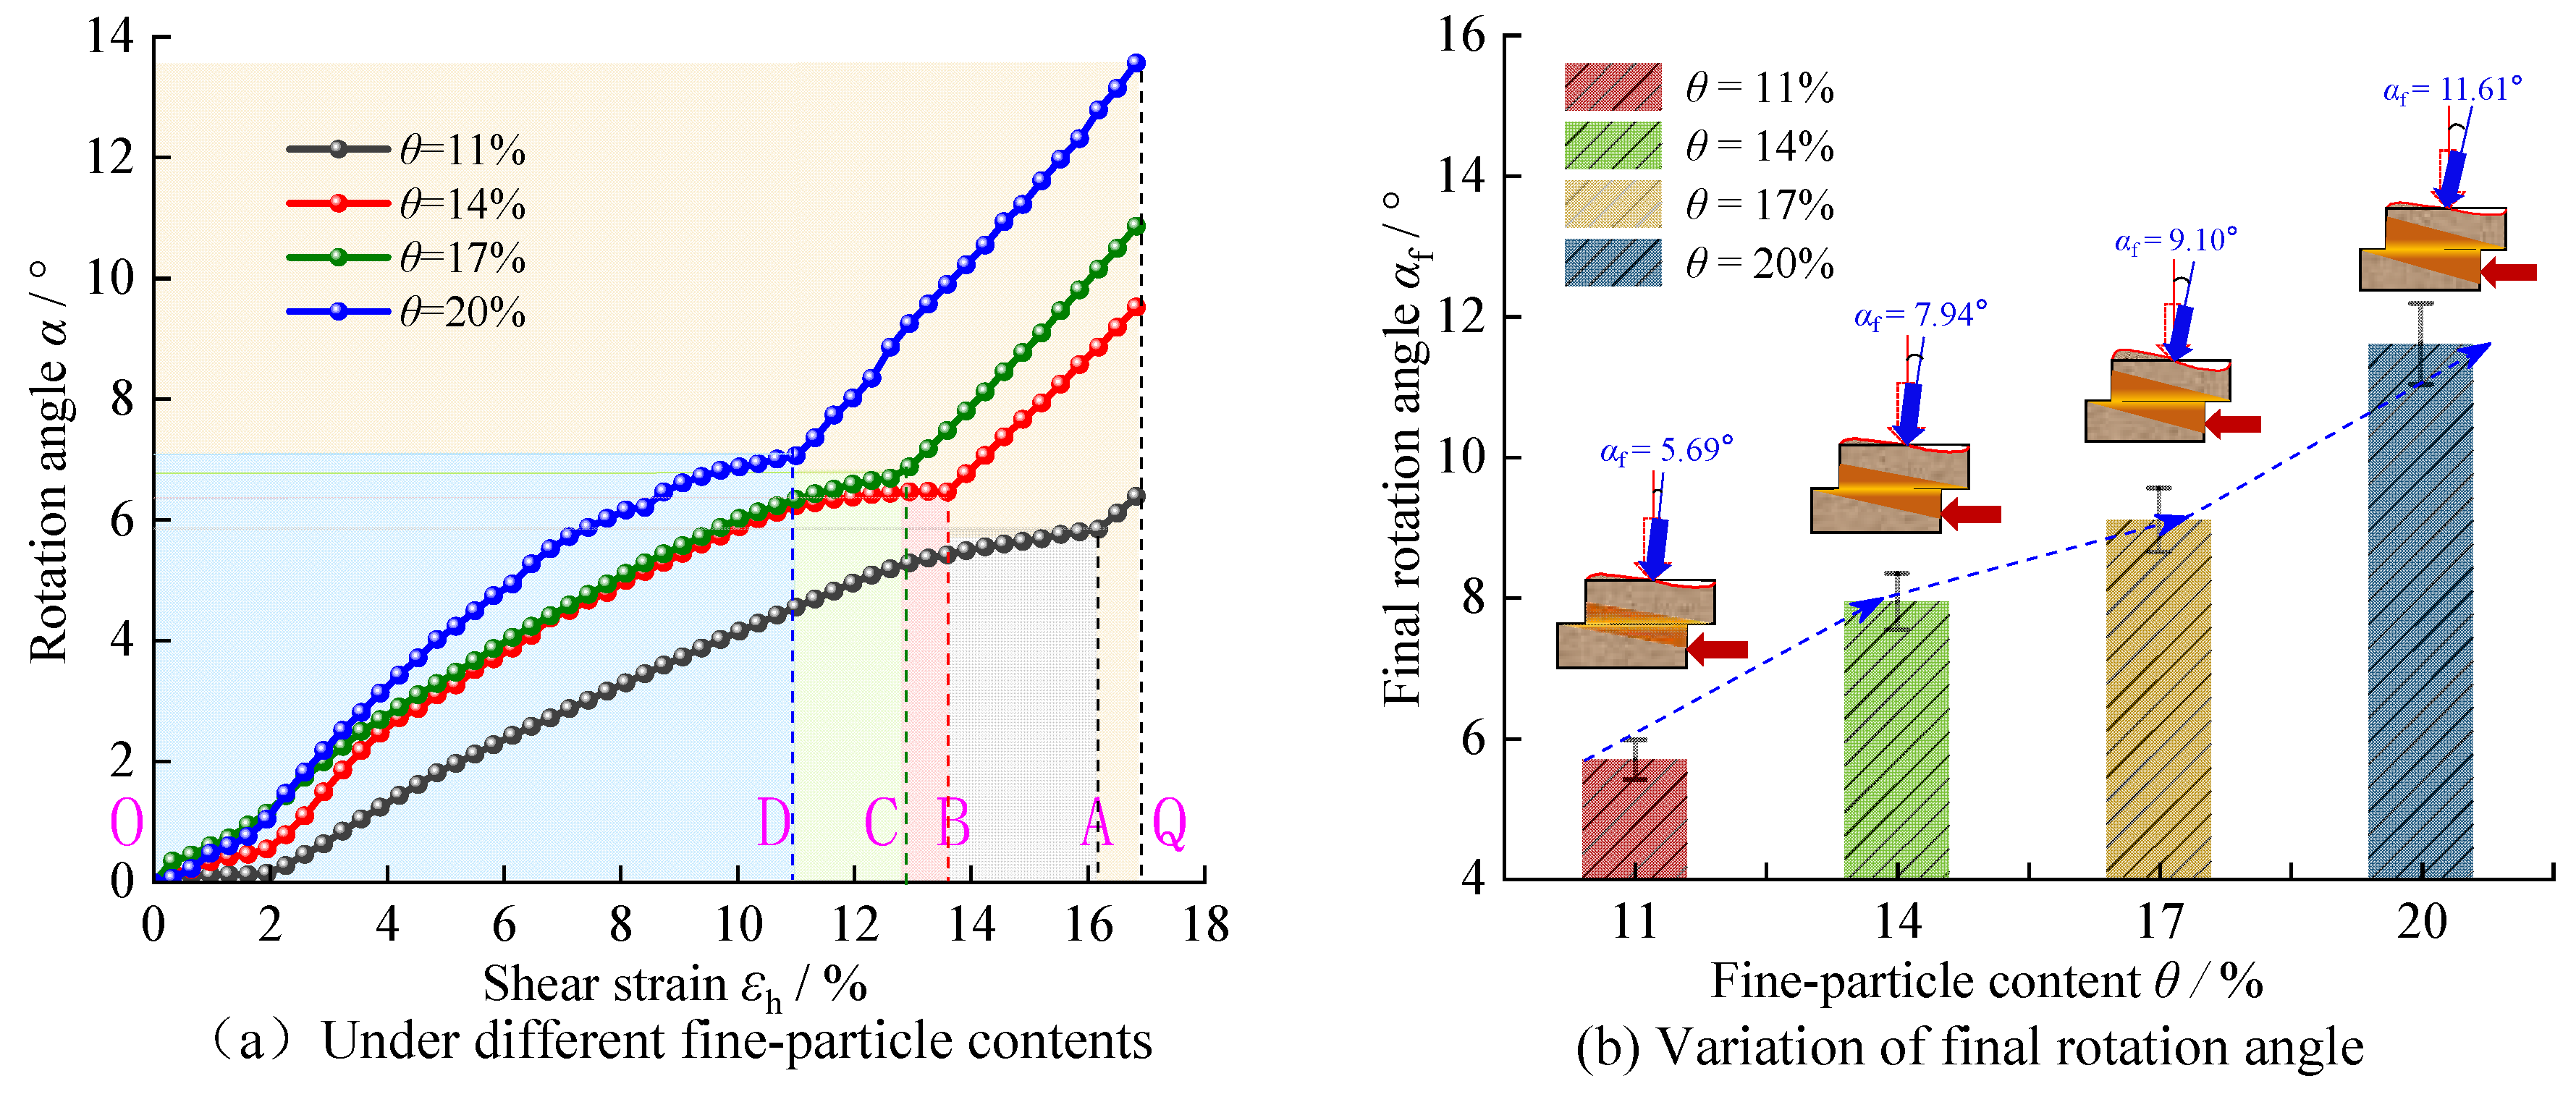
Figure 13.
Normal Stress Axis Rotation of the Sample under Different Normal Stresses.
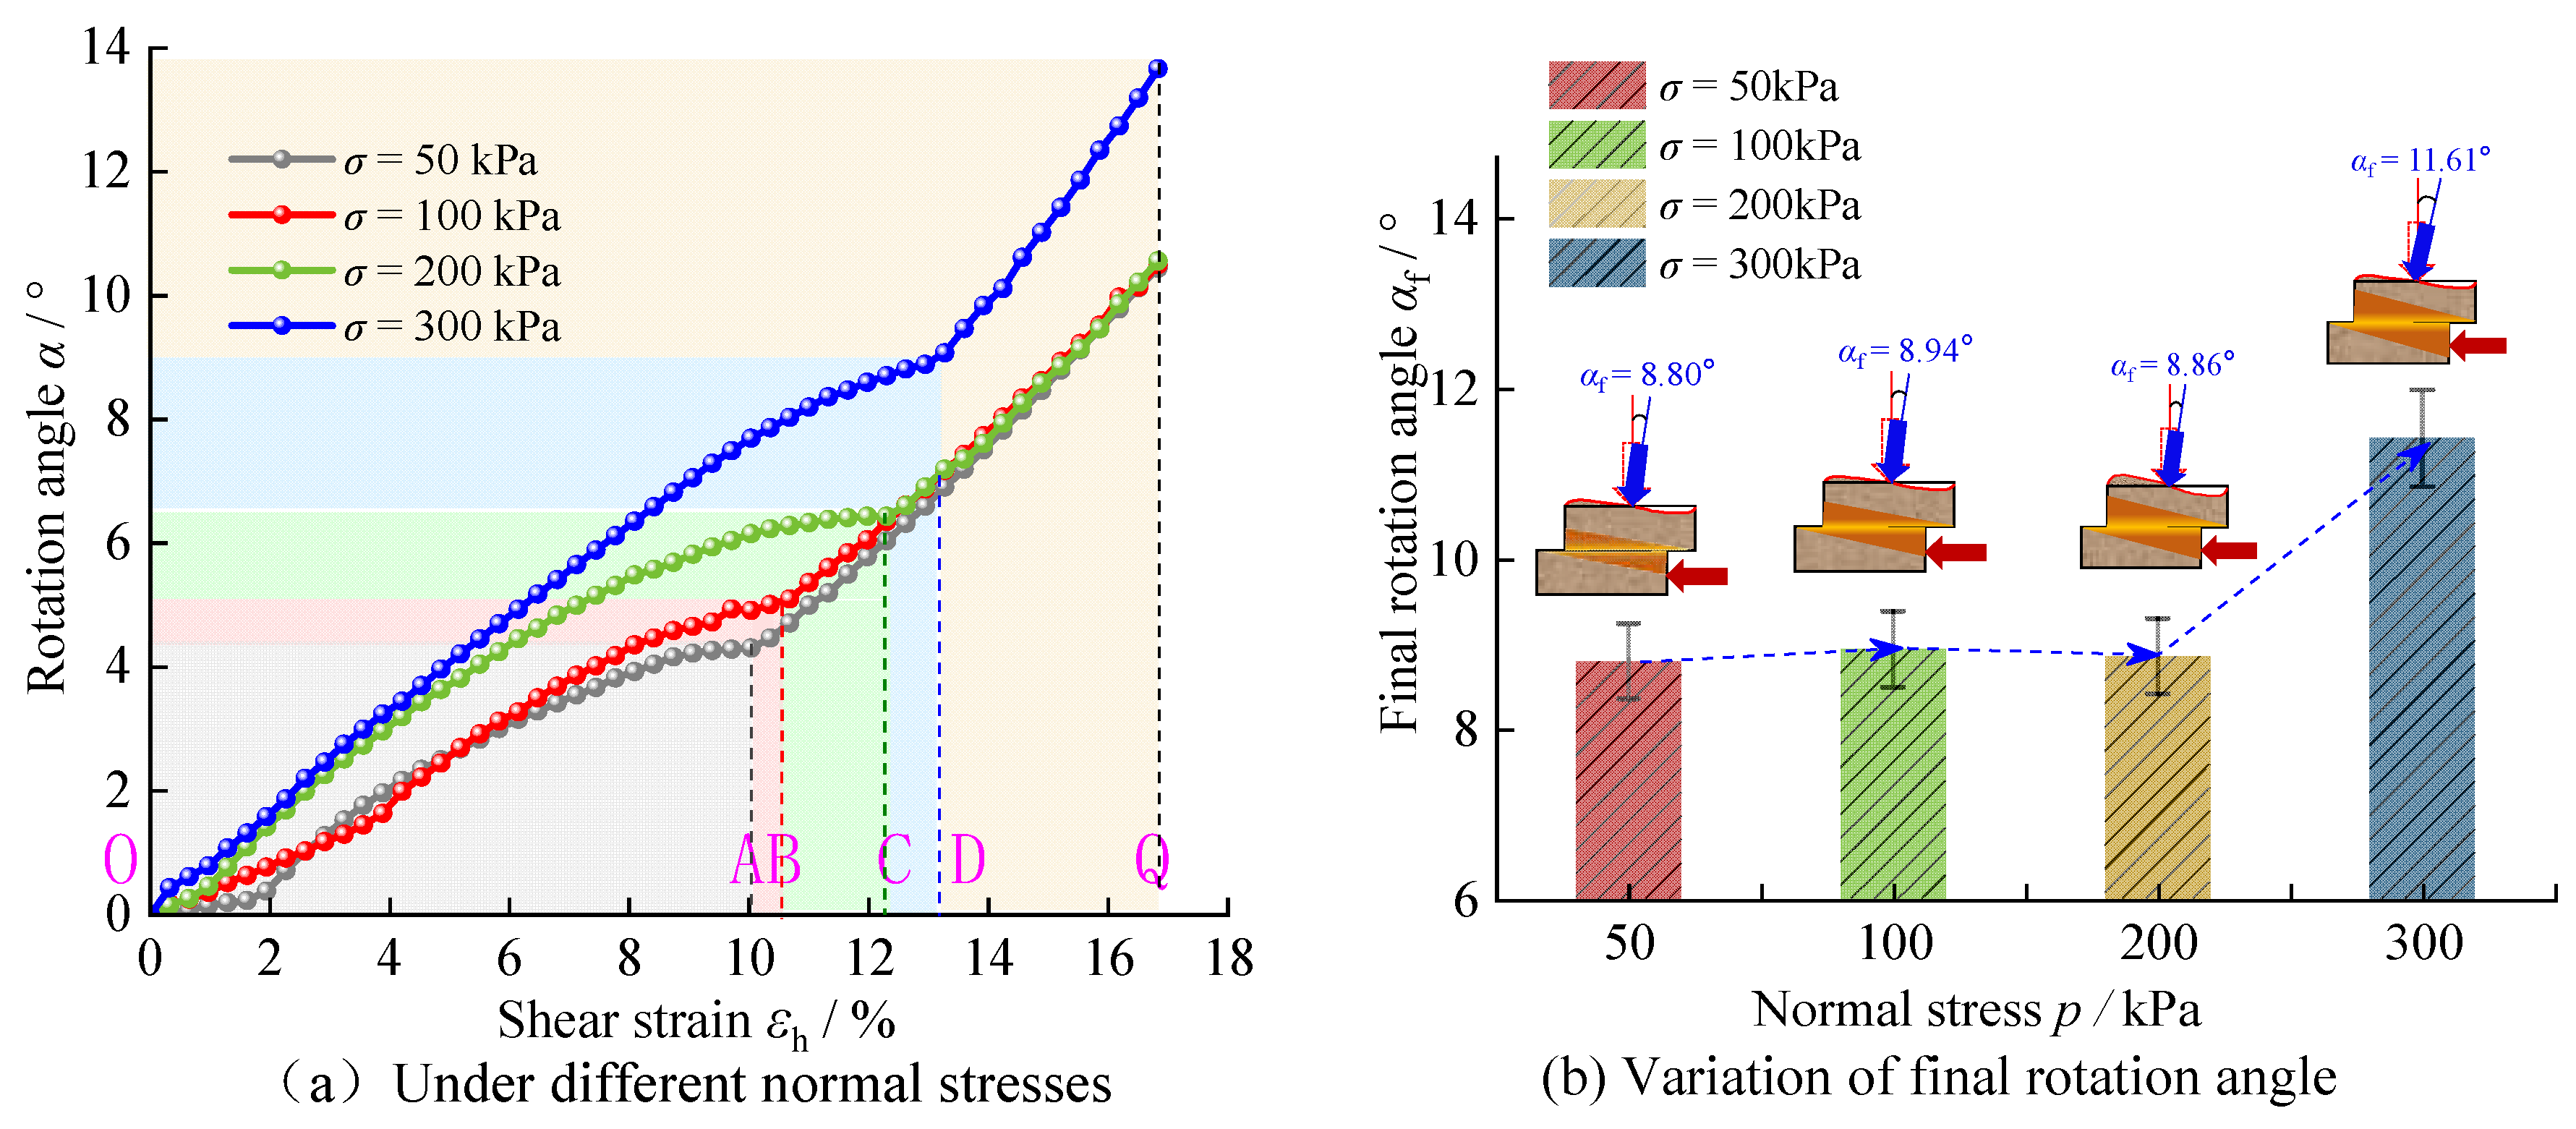
Figure 14.
Relationship Curves between Shear Modulus of the Sample and Various Experimental Factors.
Figure 14.
Relationship Curves between Shear Modulus of the Sample and Various Experimental Factors.
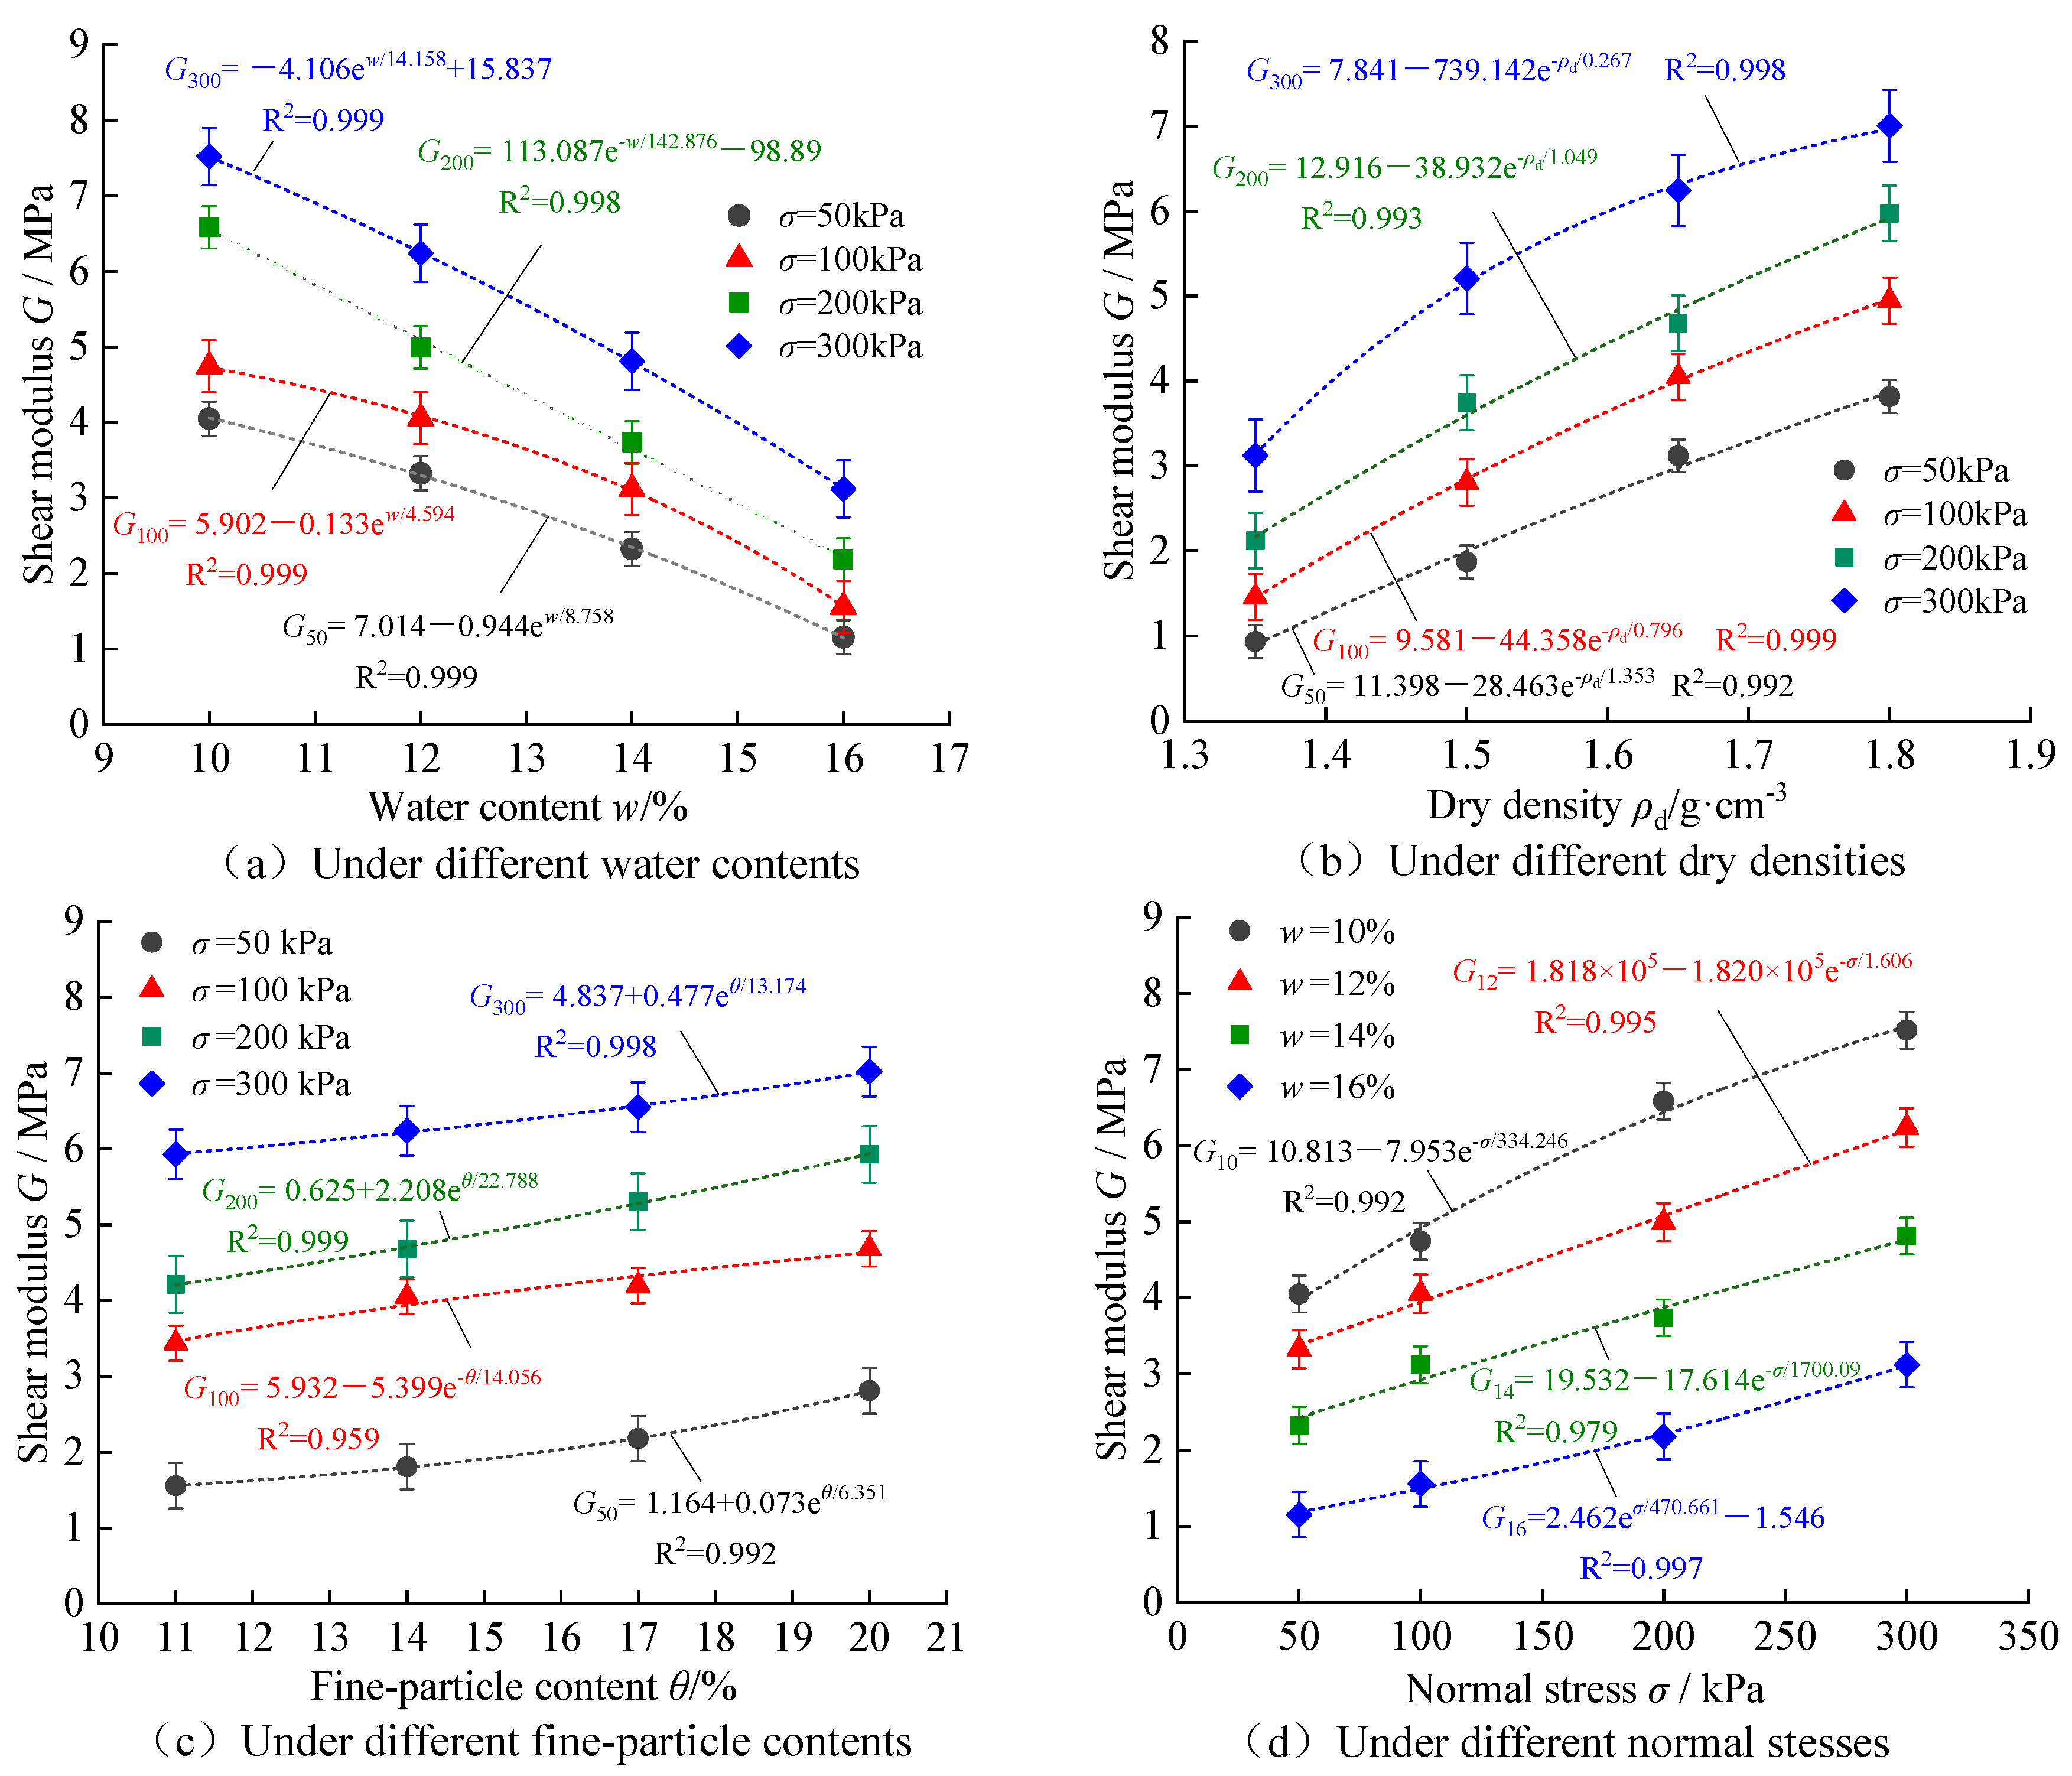
Figure 15.
Grey Relational Coefficients between Shear Modulus of the Sample and Various Factors.
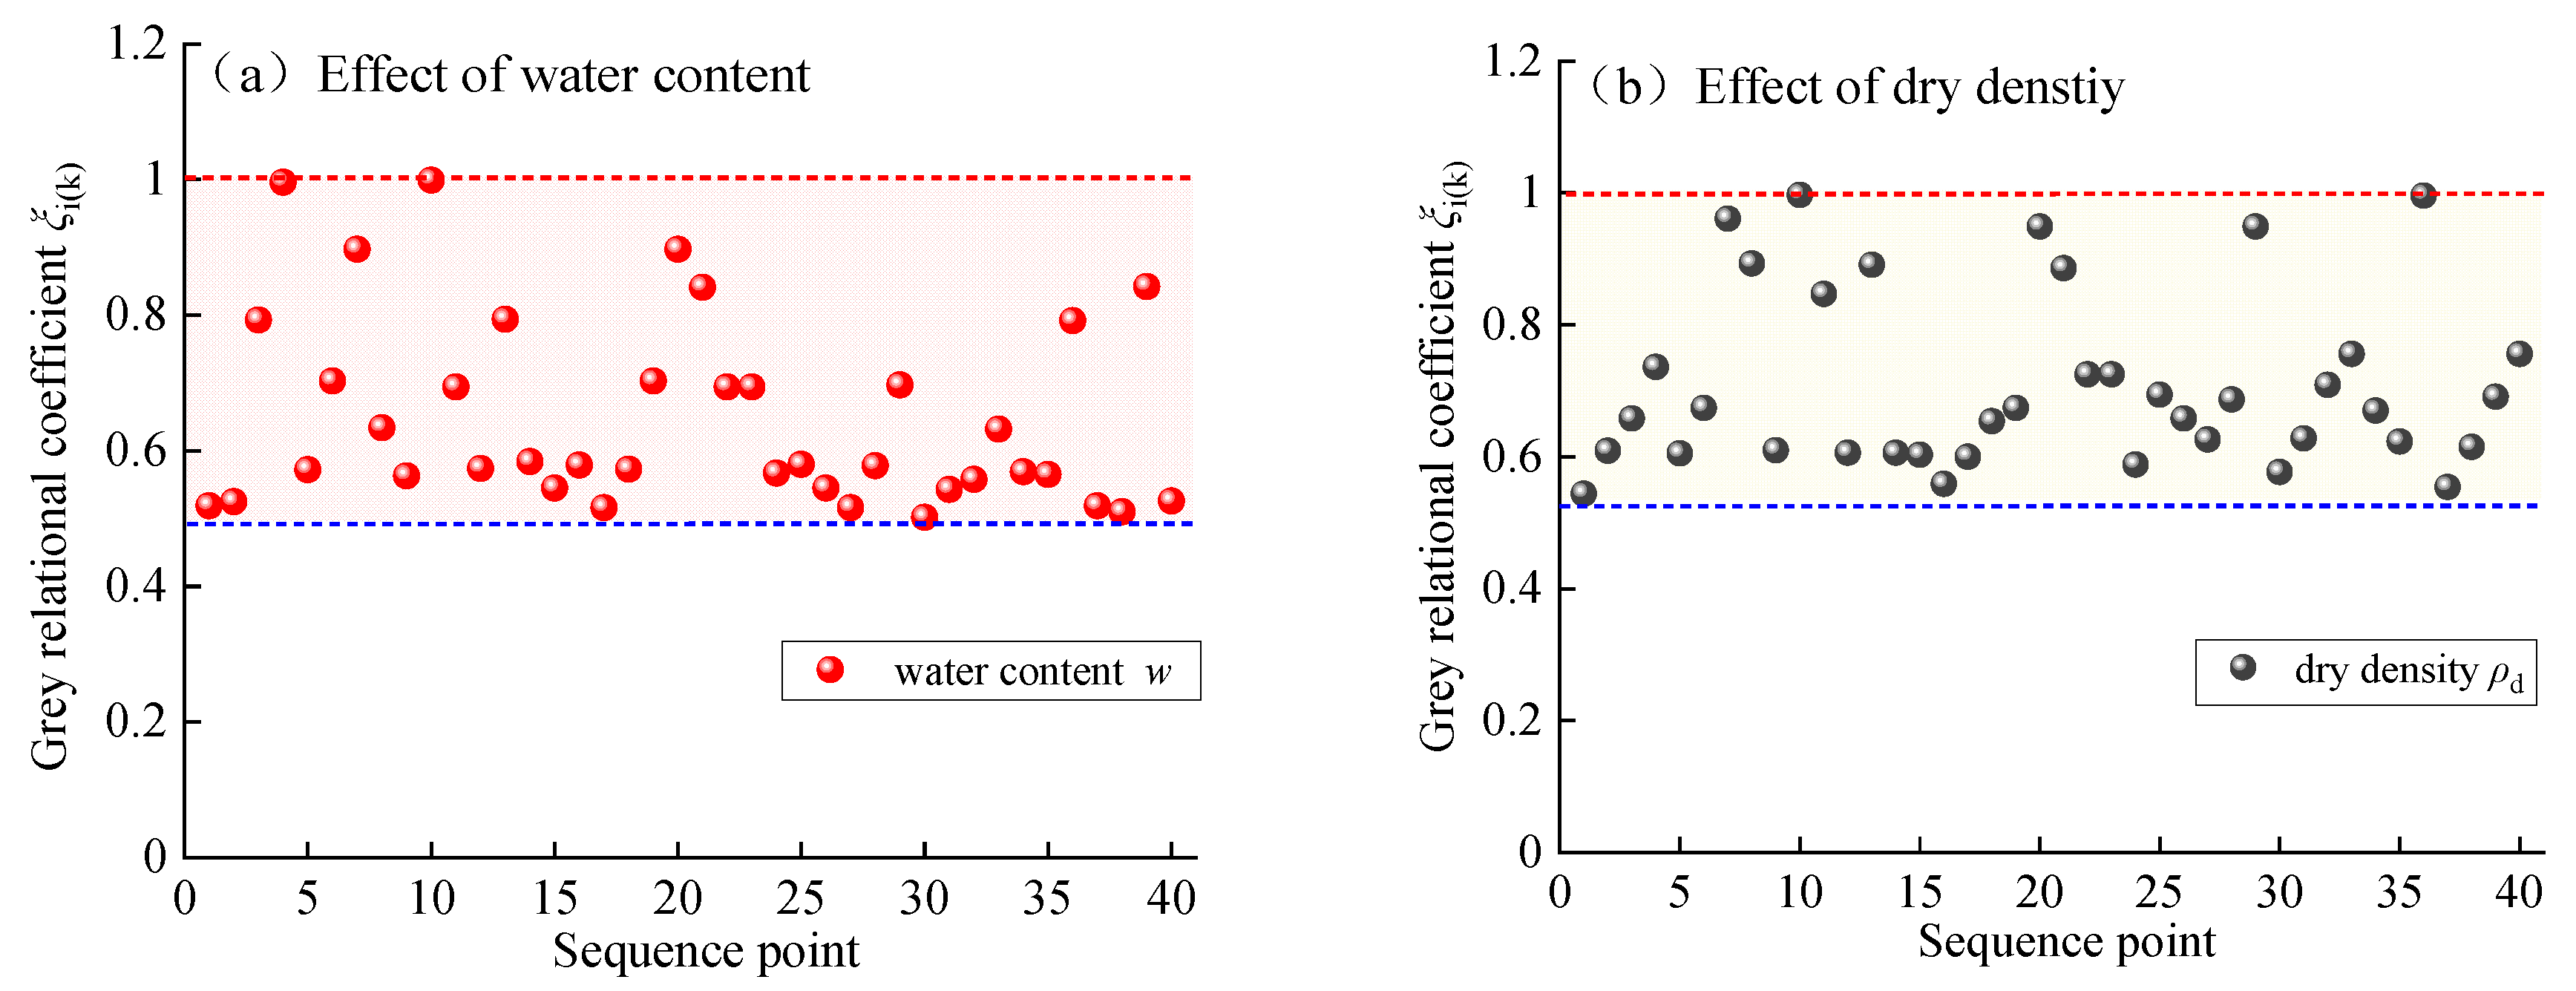
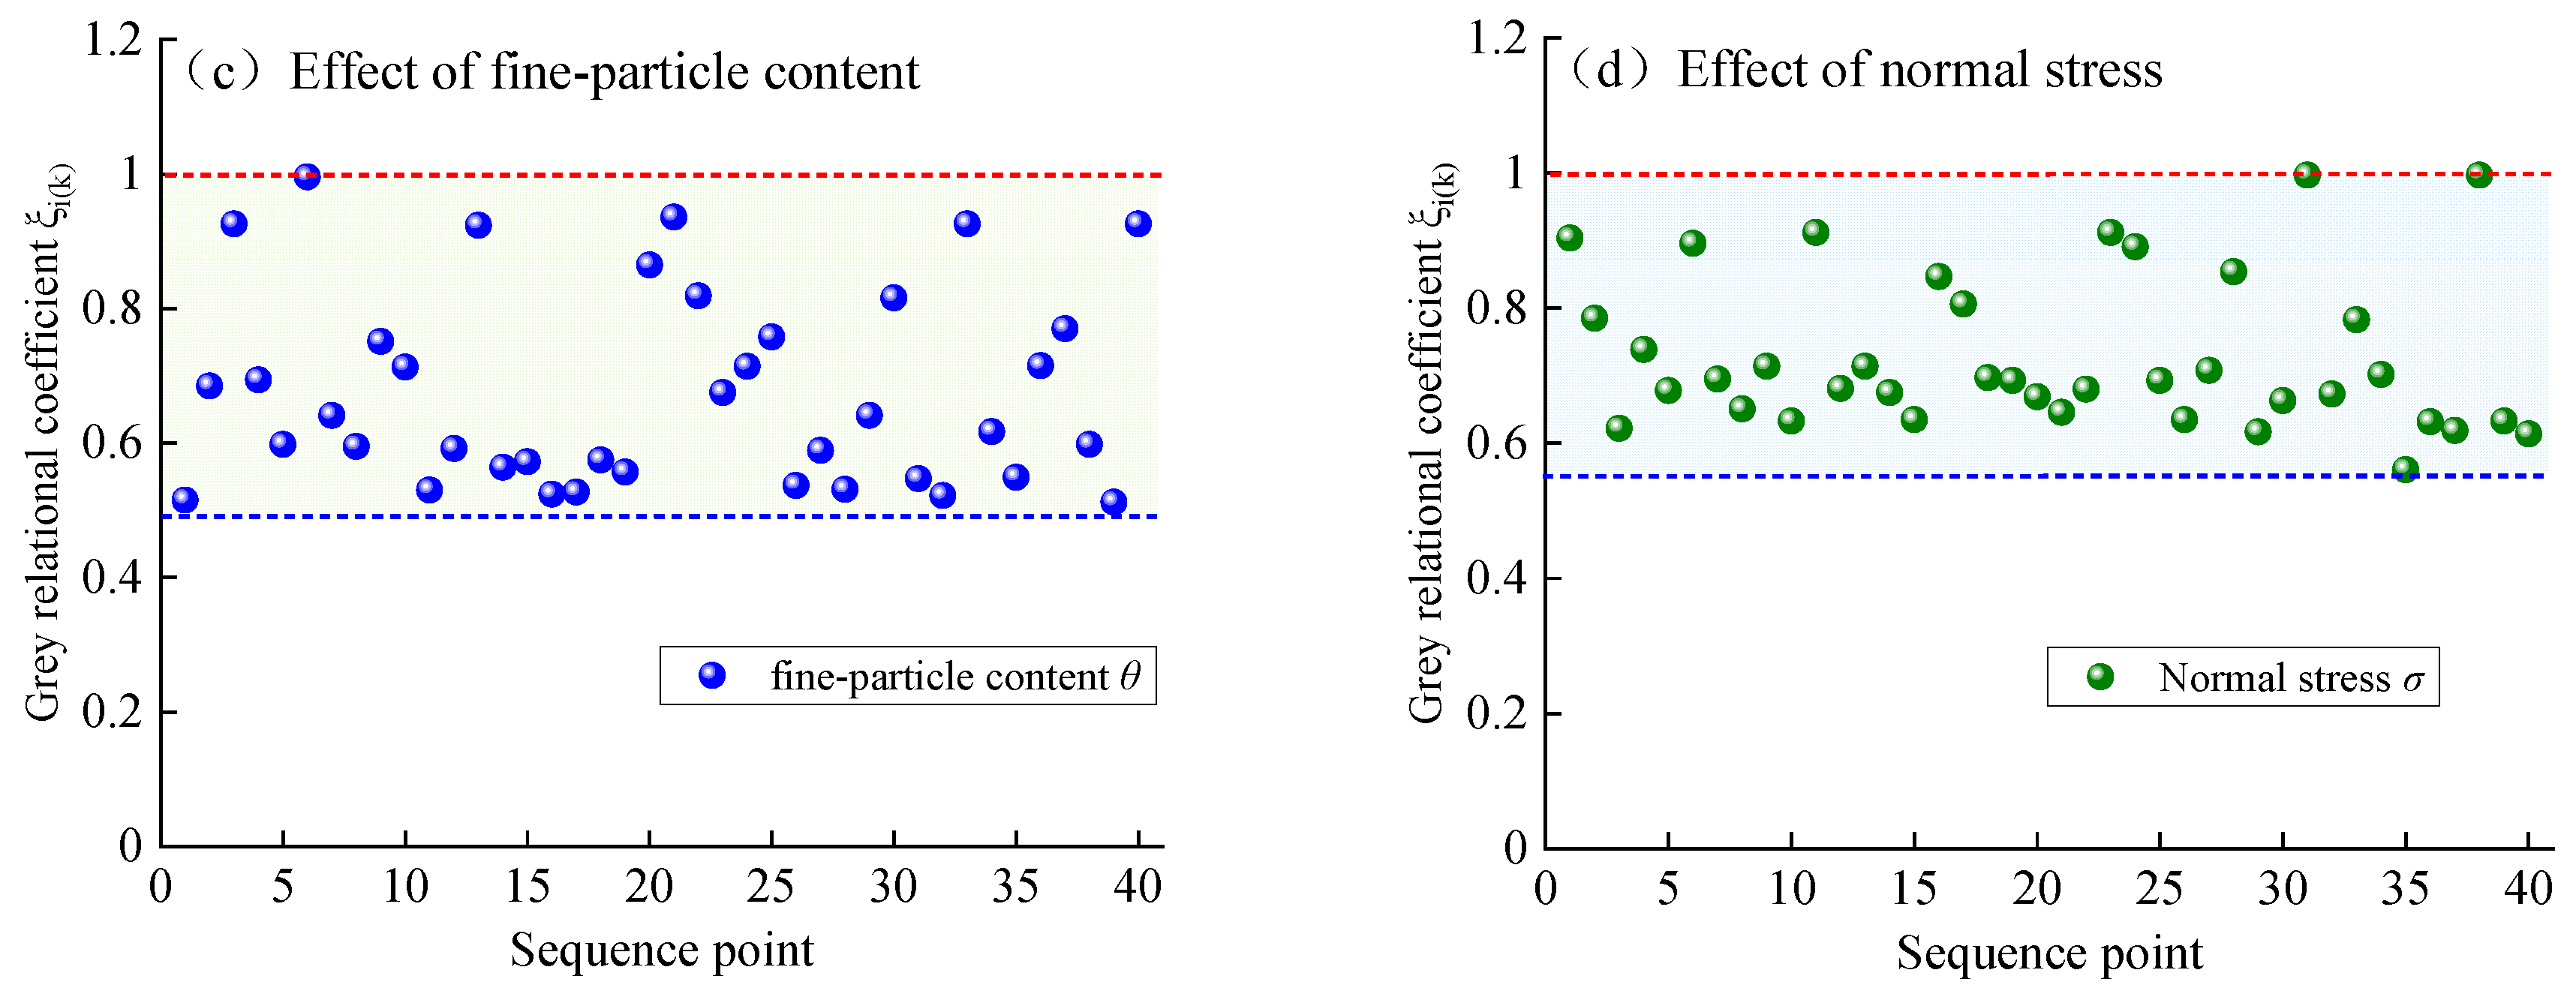
Figure 16.
Grey Relational Degree between Shear Modulus of the Sample and Various Factors.
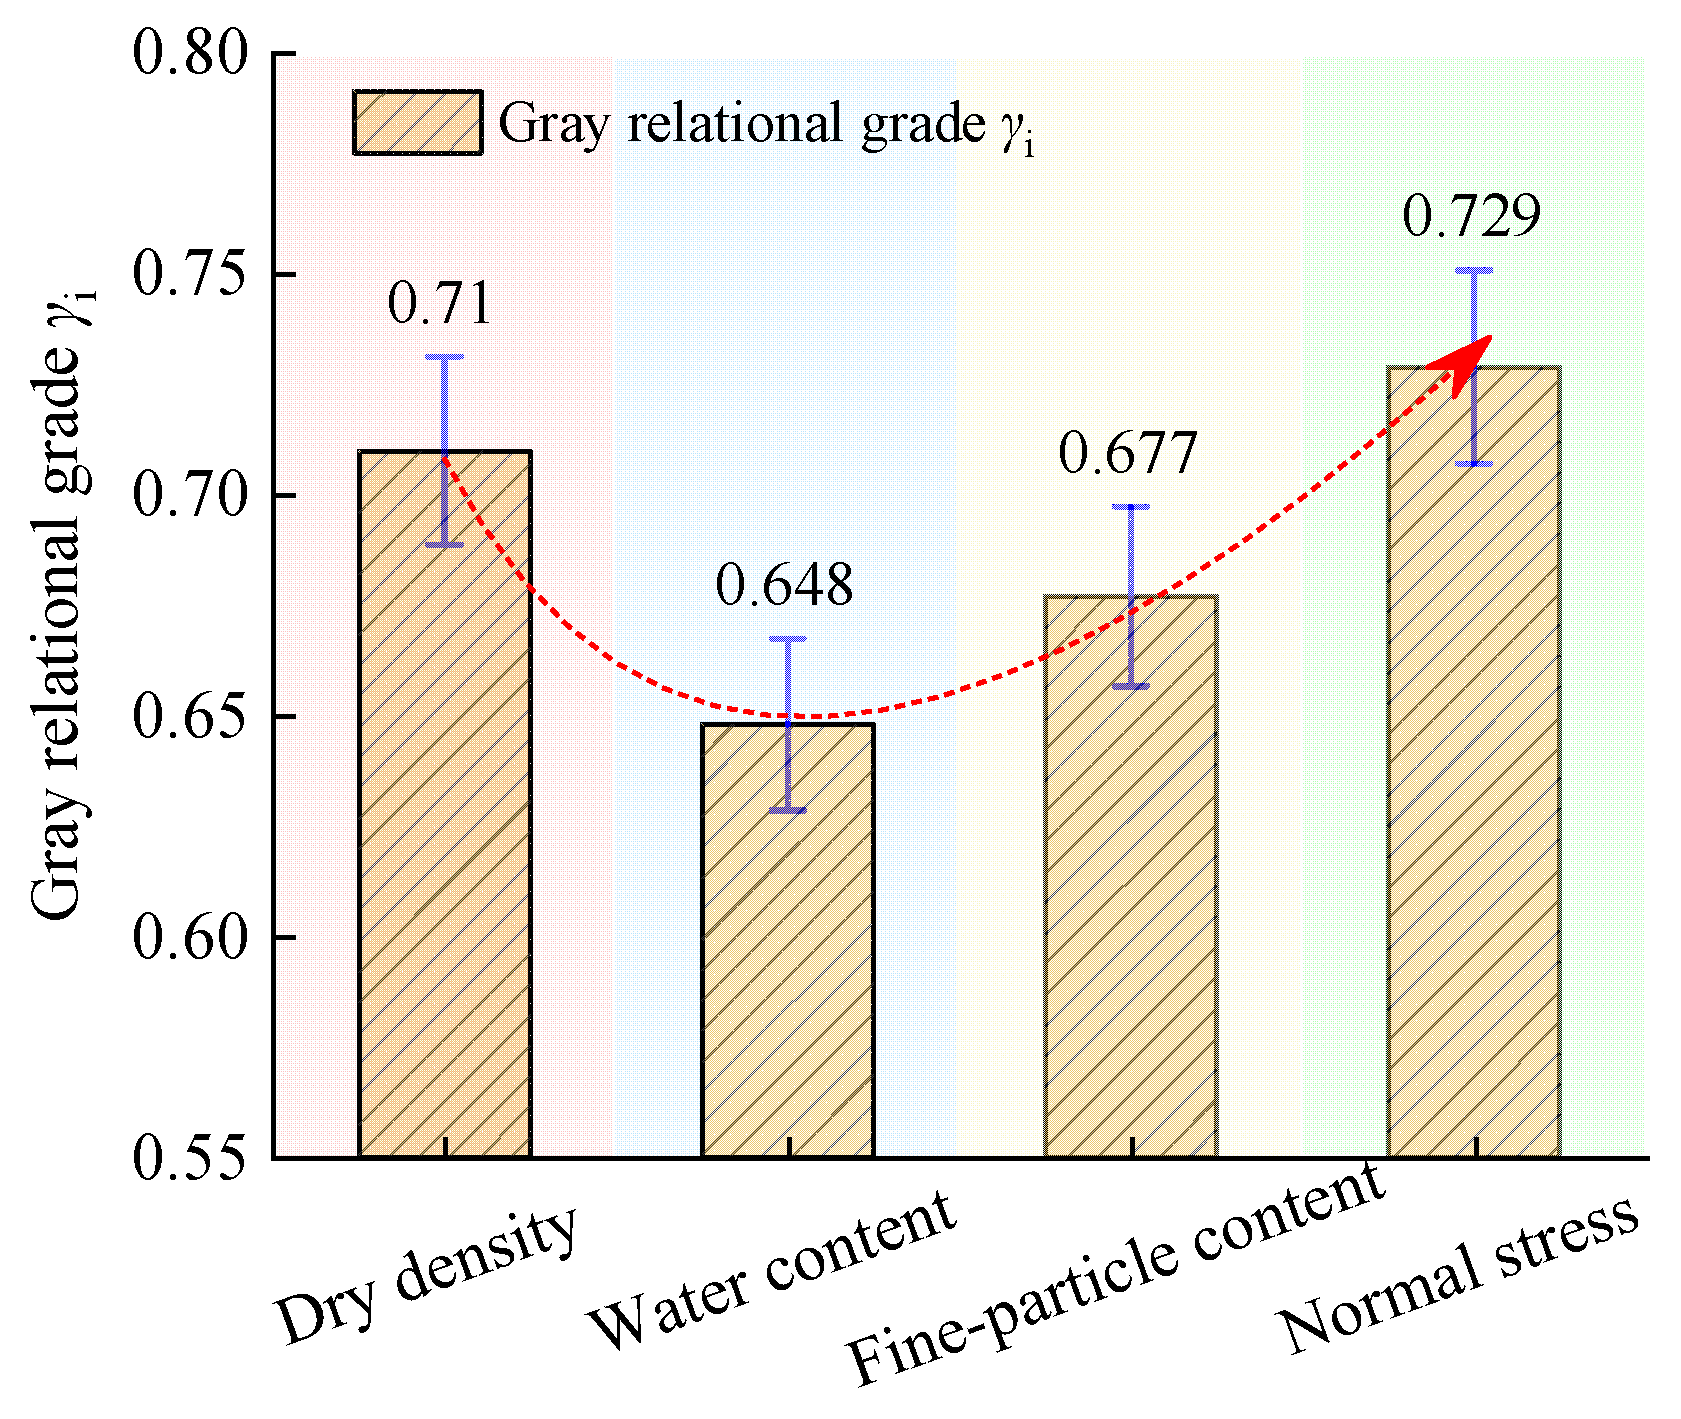

Table 1.
Model Prediction Results.
| Serial Number | Sample Conditions | Model Parameters | Correlation coefficient | ||
| η | λ | β | R | ||
| 1 | Under different water content | 7.014 | −0.944 | 8.758 | 0.999 |
| 2 | 5.902 | −0.133 | 4.594 | 0.999 | |
| 3 | −98.890 | 113.087 | −142.876 | 0.998 | |
| 4 | 15.837 | −4.106 | 14.158 | 0.999 | |
| 5 | Under different dry density | 11.398 | −28.463 | −1.353 | 0.992 |
| 6 | 9.581 | −44.358 | −0.796 | 0.999 | |
| 7 | 12.916 | −38.932 | −1.049 | 0.993 | |
| 8 | 7.841 | −739.142 | −0.267 | 0.998 | |
| 9 | Under different fine-particle content | 1.164 | 0.073 | 6.351 | 0.992 |
| 10 | 5.932 | −5.399 | −14.056 | 0.959 | |
| 11 | 0.625 | 2.208 | 22.788 | 0.999 | |
| 12 | 4.837 | 0.477 | 13.174 | 0.998 | |
| 13 | Under different normal stress | 1.818 | −1.82×10⁵ | −1.606 | 0.995 |
| 14 | 10.813 | −7.953 | −334.246 | 0.992 | |
| 15 | 19.532 | −17.614 | −1700.09 | 0.979 | |
| 16 | −1.546 | 2.462 | 470.661 | 0.997 | |
Disclaimer/Publisher’s Note: The statements, opinions and data contained in all publications are solely those of the individual author(s) and contributor(s) and not of MDPI and/or the editor(s). MDPI and/or the editor(s) disclaim responsibility for any injury to people or property resulting from any ideas, methods, instructions or products referred to in the content. |
© 2026 by the authors. Licensee MDPI, Basel, Switzerland. This article is an open access article distributed under the terms and conditions of the Creative Commons Attribution (CC BY) license (http://creativecommons.org/licenses/by/4.0/).
Copyright: This open access article is published under a Creative Commons CC BY 4.0 license, which permit the free download, distribution, and reuse, provided that the author and preprint are cited in any reuse.


