
Submitted:
27 May 2026
Posted:
27 May 2026
You are already at the latest version
Abstract
The rapid digitization of the real estate and architectural design industries has created a high demand for automated tools capable of parsing 2D raster floor plans. Traditional manual measurement and visual inspection are not only time-consuming but also highly susceptible to human error. In this paper, we propose a comprehensive, end-to-end deep learning framework designed to automatically extract rich semantic information from unstructured 2D floor plan images and provide professional design guidance via Large Language Models (LLMs). Our integrated pipeline employs the state-of-the-art YOLOv8 object detection model to accurately localize and classify 18 distinct architectural symbols and furniture items (e.g., doors, windows, beds, cupboards). Simultaneously, a U-Net architecture with a ResNet34 encoder is utilized for the precise semantic segmentation of structural elements, specifically walls and interior room spaces. To translate pixel-level predictions into actionable real-world metrics, we introduce a robust area calculation algorithm based on user-defined reference scale calibration. Furthermore, to bridge the gap between raw geometric data and actionable architectural intelligence, we introduce an LLM-driven evaluation module utilizing a local Ollama deployment and a Retrieval-Augmented Generation (RAG) pipeline to assess design compliance and quality. To overcome the scarcity of annotated architectural datasets, we implement a systematic data augmentation strategy, expanding a core dataset of 101 manually annotated floor plans to 303 varied instances, thereby significantly enhancing model generalization. Experimental results indicate that our YOLOv8-based detection module achieves a mean Average Precision (mAP50) of 92.3%, while the U-Net segmentation module achieves a mean Intersection over Union (mIoU) of 95.71%. Furthermore, the integrated system is deployed as a user-friendly, interactive web application, acting as an intelligent architectural assistant and demonstrating its practical viability and high efficiency for real-world engineering and architectural applications.
Keywords:
floor plan analysis
; deep learning
; Large Language Models
; RAG
; design guidance
; YOLOv8
; U-Net
; object detection
; semantic segmentation
; area calculation
; computer vision
1. Introduction
In the fields of architecture, engineering, construction (AEC), and real estate, the 2D floor plan remains the primary medium for communicating spatial layouts and structural designs. These diagrams encode critical geometric and semantic information, including the dimensions of rooms, the thickness of load-bearing walls, and the arrangement of furniture and fixtures. With the increasing adoption of Building Information Modeling (BIM) and Virtual Reality (VR) property tours, there is a pressing need to digitize legacy raster floor plans (e.g., JPEGs, PNGs, PDFs) into structured, machine-readable formats. However, the automated extraction of semantic entities from these unstructured images presents a formidable computer vision challenge due to the extreme variability in drawing styles, noise, and the dense, overlapping nature of architectural symbols.
Historically, the automated understanding of floor plans relied heavily on traditional image processing and heuristic rule-based methods. Techniques such as edge detection, Hough transforms, and morphological operations were employed to detect straight lines and infer wall structures [1]. While these methods proved effective on standardized, high-quality CAD-generated images, they often failed catastrophically when applied to hand-drawn sketches or scanned documents containing noise, artifacts, and non-standard symbols.
The advent of Convolutional Neural Networks (CNNs) has fundamentally transformed the landscape of document image analysis. Deep learning models have demonstrated unprecedented capability in extracting high-level semantic features from complex visual data. Modern object detection algorithms, such as the You Only Look Once (YOLO) series [2], offer real-time, highly accurate localization of discrete objects. Concurrently, Fully Convolutional Networks (FCNs) like U-Net [3] have set new benchmarks for pixel-level semantic segmentation. Despite these advancements, most existing research in floor plan analysis tends to isolate these tasks—focusing solely on either symbol detection or room segmentation—without integrating them into a cohesive system capable of extracting actionable physical metrics, such as real-world room areas.
To address these gaps, this paper proposes a fully automated, LLM-integrated floor plan analysis system. Our framework seamlessly combines object detection, semantic segmentation, geometric calculation, and intelligent design guidance into a unified pipeline, accessible via a user-friendly web interface.
The primary contributions of this work are summarized as follows:
- 1.
- We design and implement a robust hybrid pipeline that leverages YOLOv8 for the precise detection of 18 distinct furniture and architectural classes, and a ResNet34-backed U-Net for the semantic segmentation of walls and room regions.
- 2.
- We propose an efficient data augmentation and labeling workflow. By applying geometric transformations (horizontal flipping and 90-degree rotations) to both raw images and their corresponding label coordinates (bounding boxes and polygons), we expand a manually annotated dataset of 101 images into a diverse dataset of 303 images, significantly reducing manual labor while preventing model overfitting.
- 3.
- We develop a practical area calculation algorithm that bridges the gap between pixel-level segmentation masks and real-world physical dimensions through interactive scale calibration.
- 4.
- We pioneer the integration of a local LLM (via Ollama) augmented with a Vector Database (RAG pipeline) to ingest the structured output of the vision models and generate professional, regulation-compliant architectural design guidance.
- 5.
- We deploy the integrated models into an interactive, Streamlit-based web application, providing end-users with an intuitive platform to upload images, visualize analysis results, and download comprehensive statistical reports alongside LLM-generated design guidance.
The remainder of this paper is organized as follows: Section 2 reviews related work in floor plan analysis, deep learning, and LLMs in architecture. Section 3 details the proposed methodology, including dataset preparation, network architectures, the area calculation algorithm, and the RAG pipeline. Section 4 presents the experimental setup, quantitative results, and qualitative evaluations of the LLM. Section 5 discusses the implications and limitations of our system, and Section 6 concludes the paper with directions for future research.
2. Related Work
2.1. Traditional Floor Plan Analysis
Early research in floor plan understanding focused on vectorization and symbol recognition using low-level image processing. Macé et al. proposed a system relying on Hough transforms to detect parallel lines representing walls, followed by rule-based template matching to identify doors and windows. Similarly, Ahmed et al. utilized morphological operations to separate text from graphics, extracting wall segments through connected component analysis. While these heuristic approaches are computationally inexpensive, their reliance on rigid, predefined rules makes them highly sensitive to variations in line thickness, drawing conventions, and image quality [1].
2.2. Deep Learning for Architectural Symbol Detection
The transition to deep learning has significantly improved the robustness of symbol detection in floor plans. Region-based CNNs, such as Faster R-CNN [4], were among the first to be adapted for this task, demonstrating high accuracy but suffering from slow inference speeds. To address this, single-stage detectors like the YOLO family [2] gained popularity. Recent iterations, such as YOLOv5 and YOLOv8, feature anchor-free detection heads and advanced loss functions (e.g., CIoU), making them highly adept at detecting small, densely packed objects of varying aspect ratios—a common characteristic of architectural symbols like chairs, sinks, and doors.
2.3. Semantic Segmentation of Floor Plans
Beyond discrete object detection, extracting the topological structure of a building requires pixel-level semantic segmentation. DeepLabv3+ [5], which utilizes Atrous Spatial Pyramid Pooling (ASPP), has been widely employed to capture multi-scale contextual information in floor plans. However, U-Net [3], originally designed for biomedical image segmentation, has proven exceptionally effective for floor plans due to scales due to its symmetric encoder-decoder structure and skip connections, which perfectly preserve the fine, high-resolution details of thin structures like walls. The introduction of large-scale public datasets, such as CubiCasa5K [6] and RPLAN, has further catalyzed research, enabling models to generalize across diverse architectural styles.
2.4. Large Language Models in Architectural Design
The rapid evolution of Large Language Models (LLMs) has opened new avenues for automated reasoning in specialized domains. While models like GPT-4 possess vast general knowledge, their application in the AEC industry is often hindered by strict data privacy requirements and a lack of grounding in specific local building codes. Recent studies have explored using Retrieval-Augmented Generation (RAG) to mitigate LLM hallucinations by providing models with external, verified context. In the context of floor plans, however, there is a notable scarcity of frameworks that seamlessly bridge the visual extraction of spatial data with the natural language reasoning capabilities of LLMs to provide end-to-end design guidance.
3. Methodology
Our proposed system is composed of four interconnected modules: (1) an object detection module for localizing furniture and fixtures, (2) a semantic segmentation module for extracting walls and room boundaries, (3) a geometric calculation module for determining real-world areas, and (4) an LLM-driven design guidance module. The overall system architecture is depicted in Figure 1.
3.1. Dataset Preparation and Augmentation Strategy
The primary bottleneck in applying supervised deep learning to specialized domains is the acquisition of high-quality, pixel-level annotated data. For this study, we curated a primary dataset of 101 high-resolution raster floor plan images.
To prepare the data for the dual tasks, we employed a rigorous two-step annotation process:
- Detection Labels: We utilized LabelImg to manually draw bounding boxes for 18 distinct classes (e.g., door, window, bed, dining table, sofa, TV, cupboard, toilet, washbasin, washing machine, air condition). These were saved in the standard YOLO text format.
- Segmentation Labels: We utilized LabelMe to meticulously draw polygons outlining two primary classes: wall and room. These polygon annotations (saved as JSON files) were subsequently converted into categorical 2D segmentation masks using a custom Python script.
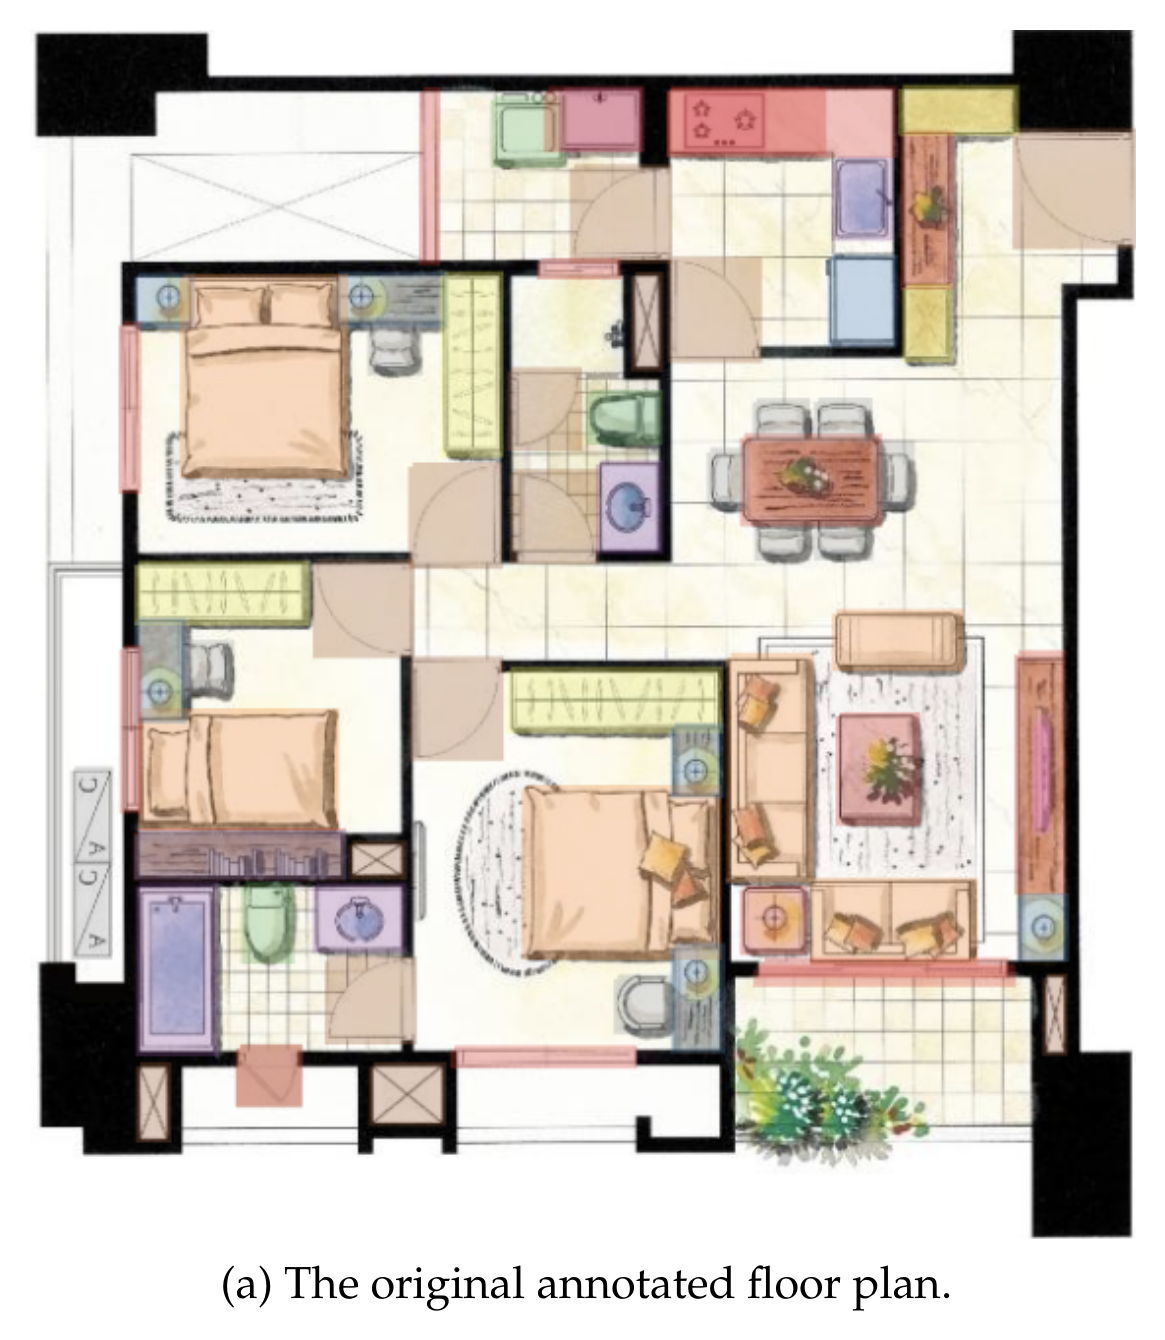
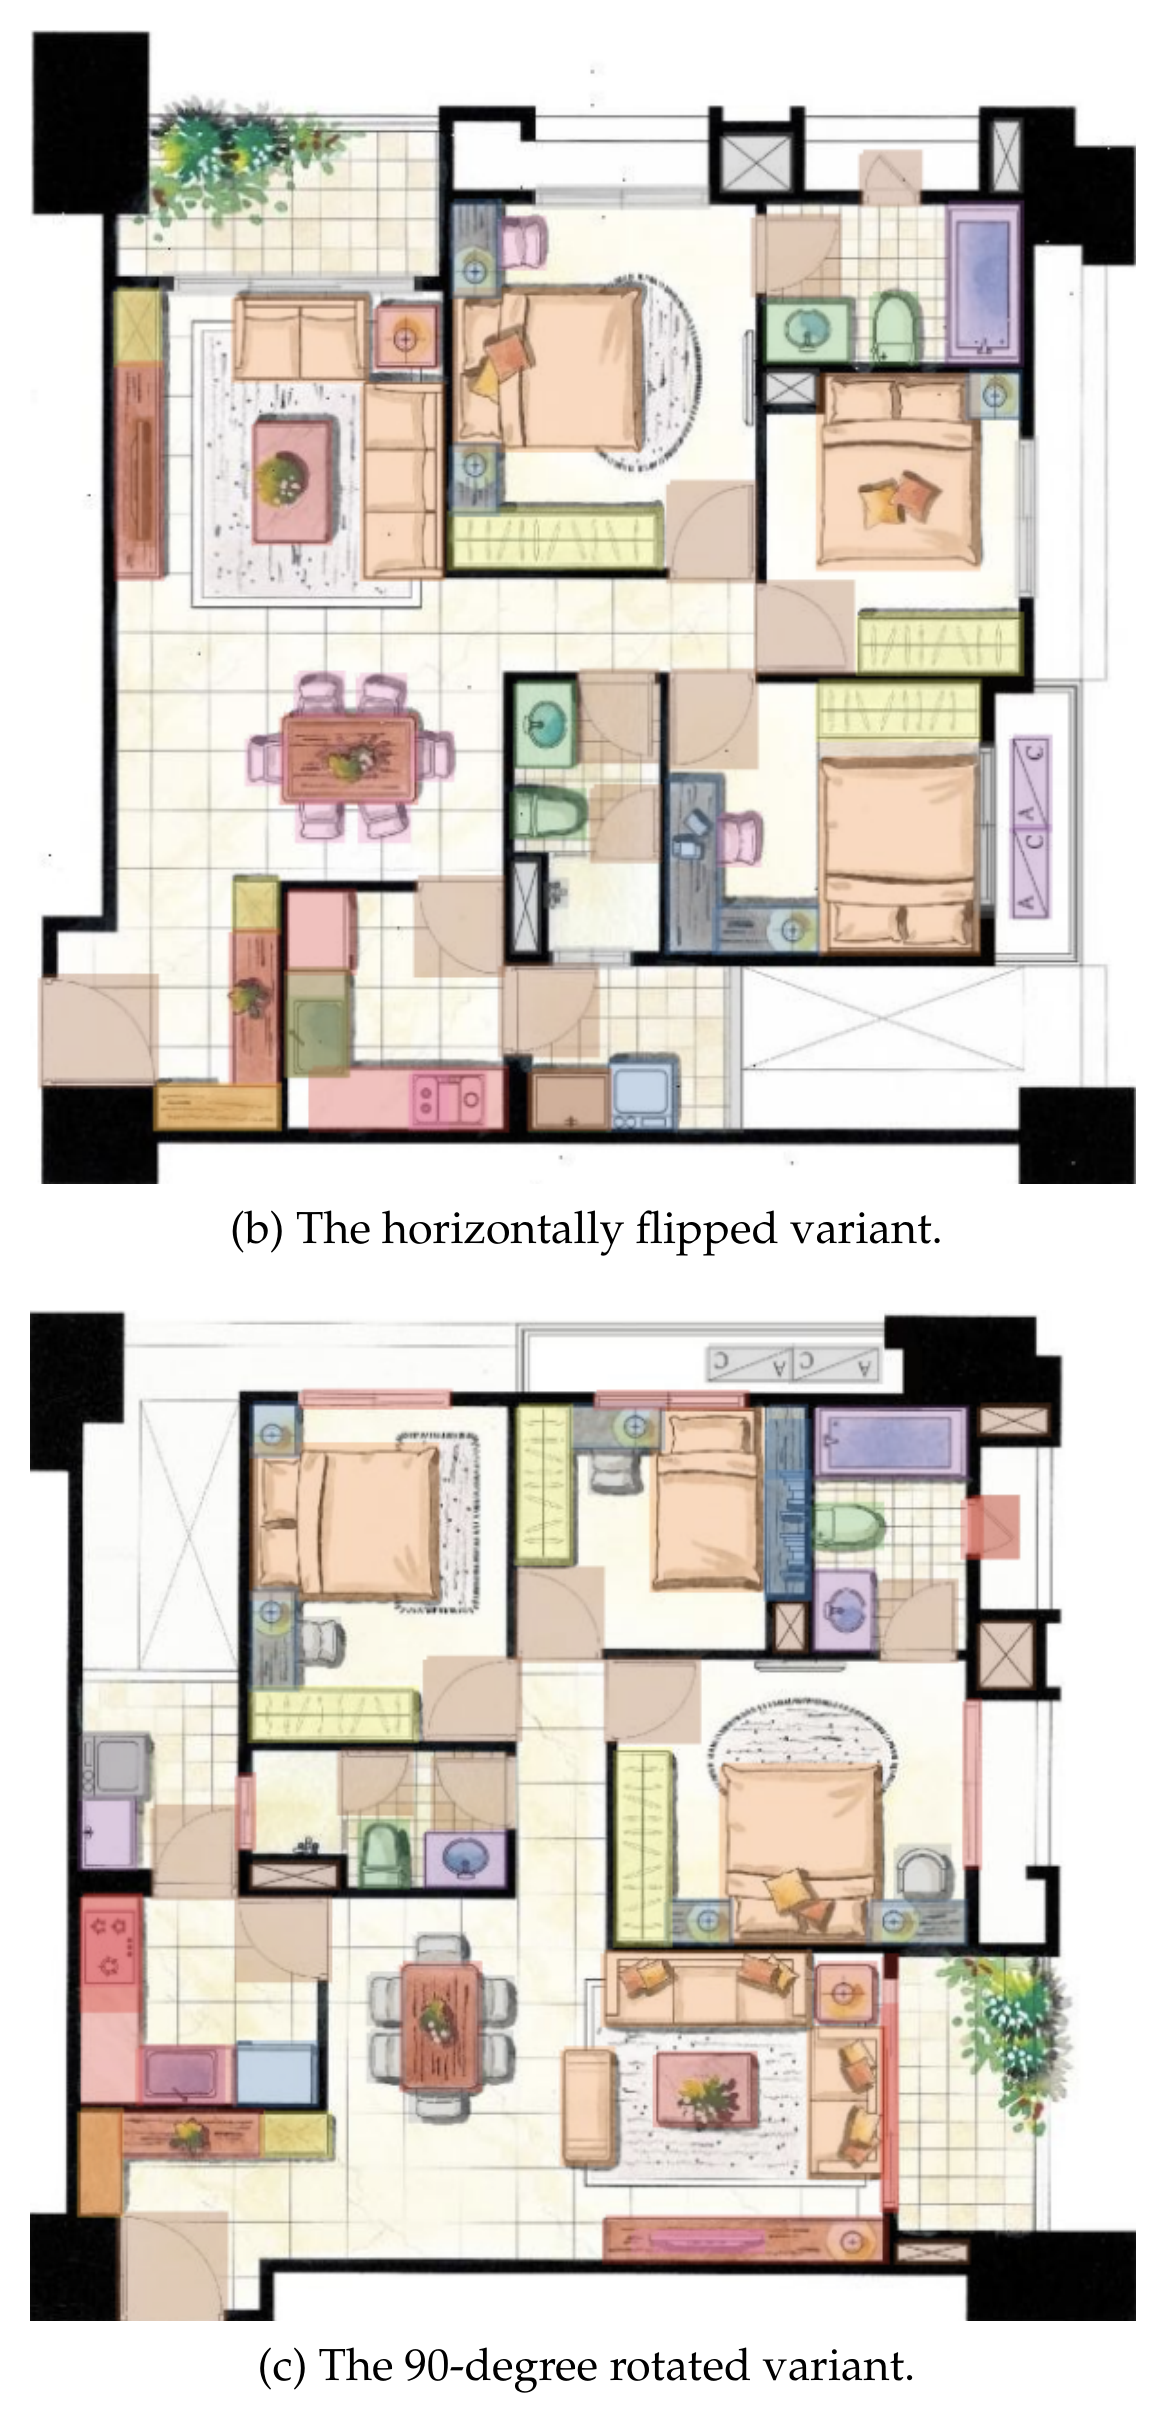
To mitigate the risk of overfitting on this limited dataset and to improve the spatial invariance of the models, we implemented an automated data augmentation pipeline. For every original image, we generated two augmented variants: one via horizontal axial symmetry (flipping) and another via a 90-degree counter-clockwise rotation. Crucially, we applied corresponding coordinate transformation matrices to both the YOLO bounding boxes and the LabelMe polygons, ensuring perfect alignment between the augmented images and their labels. This deterministic expansion scaled our dataset from 101 to 303 strictly valid training samples.
Figure 2.
Visualization of the data augmentation strategy with perfectly aligned annotations.
3.2. Furniture and Fixture Detection Module
For the detection of architectural symbols, we selected the YOLOv8-nano model due to its optimal balance of speed and accuracy. YOLOv8 utilizes a modified CSPDarknet backbone and a decoupled, anchor-free detection head. By eliminating anchor boxes, the model avoids complex intersection-over-union (IoU) matching heuristics during training, significantly accelerating convergence for objects with extreme aspect ratios (e.g., long windows, thin doors).
The loss function for the YOLOv8 module is a combination of Distribution Focal Loss (DFL) and Complete IoU (CIoU) loss for bounding box regression, alongside Binary Cross-Entropy (BCE) for class probability prediction. This ensures highly precise localization even in cluttered rooms.
3.3. Room and Wall Segmentation Module
To extract the continuous structural topology of the floor plans, we framed wall and room extraction as a pixel-level semantic segmentation task. We employed a U-Net architecture, replacing its standard convolutional encoder with a pre-trained ResNet34 backbone. The ResNet34 encoder, pre-trained on ImageNet, provides robust feature extraction capabilities and accelerates convergence, while the U-Net decoder, utilizing transposed convolutions and skip connections, reconstructs the spatial resolution necessary for delineating thin wall boundaries.
A significant challenge in floor plan segmentation is class imbalance; background pixels vastly outnumber wall pixels. To address this, we employed a combined loss function during training, aggregating standard Cross-Entropy Loss (CELoss) and Dice Loss. The Dice Loss specifically optimizes the Intersection over Union, forcing the network to prioritize the minority classes (walls).
3.4. Real-World Area Calculation Algorithm
While deep learning models operate in the pixel domain, practical engineering applications require real-world physical metrics (e.g., square meters). Because standard raster images lack embedded spatial metadata, we designed a user-interactive calibration module.
The user is prompted to draw a reference line across a known feature in the image (such as a standard 0.9-meter door width) or input a known scale factor. The system calculates the Euclidean distance in pixels () of this reference line. Given the actual physical length (), the system calculates a universal Scale Factor ():
Subsequently, the system processes the U-Net predicted mask, isolating the room class. Connected Component Labeling (CCL) via OpenCV is applied to distinguish individual rooms. The physical area of the i-th room () is then calculated by counting the number of pixels belonging to that component () and applying the squared Scale Factor:
3.5. LLM-Integrated Design Guidance and RAG Pipeline
The core innovation of this framework is the translation of extracted spatial data into actionable architectural advice. This is achieved through a locally deployed LLM infrastructure designed to ensure data privacy and domain specificity.
3.5.1. Local Deployment via Ollama
To securely process sensitive floor plan data, we leverage Ollama to deploy open-source LLMs (e.g., Qwen2.5 or Llama 3) entirely locally. The structured outputs from the vision modules—including room areas, furniture counts, and spatial relationships—are serialized into a JSON format and passed to the LLM via prompt engineering. The LLM is tasked with analyzing the layout’s rationality, functionality, and flow.
3.5.2. Retrieval-Augmented Generation (RAG)
To ensure the LLM’s recommendations adhere to professional architectural standards, we implement a RAG pipeline. A local vector database (e.g., ChromaDB) is populated with embedded architectural rules, residential design codes, and ergonomic guidelines. When the system processes a floor plan (e.g., detecting a 7-square-meter double bedroom), it queries the vector database for relevant regulations. The retrieved context is then injected into the LLM’s prompt, effectively grounding its generated response in verified architectural knowledge rather than relying solely on parametric memory.
3.5.3. Model Fine-Tuning for Domain Expertise
To further enhance the LLM’s performance, the framework supports continuous learning. By logging the structured geometric data alongside expertly vetted architectural evaluation reports into a relational database, we dynamically construct an instruction-tuning dataset. This dataset can be periodically used to fine-tune the LLM utilizing Low-Rank Adaptation (LoRA), progressively tailoring the model’s tone and expertise to specialized architectural evaluation tasks.
4. Experiments and Results
4.1. Experimental Setup
Both models were developed using the PyTorch framework. The dataset of 303 augmented images was randomly partitioned into a training set (80%), a validation set (10%), and a test set (10%).
The YOLOv8 detection model was trained for 100 epochs using the SGD optimizer with an initial learning rate of 0.01 and a batch size of 8. The U-Net segmentation model was trained for 100 epochs using the AdamW optimizer with an initial learning rate of 0.001. A ReduceLROnPlateau learning rate scheduler was utilized to decay the learning rate by a factor of 0.5 if the validation loss did not improve for 10 consecutive epochs. Early stopping was implemented to prevent overfitting.
4.2. Object Detection Performance
The YOLOv8 model demonstrated exceptional accuracy in identifying architectural symbols. Evaluated on the validation set, the model achieved an overall mean Average Precision (mAP50) of 92.3%.
As detailed in Table 1, prominent and distinct items such as beds, bathtubs, and air conditioners achieved near-perfect recognition rates (mAP50 > 99%). Other common items like chairs and wardrobes also showed excellent performance (mAP50 > 98%). Classes with high variability or small sizes, such as TVs and windows, exhibited comparatively lower precision but remained viable for general identification.
4.3. Semantic Segmentation Performance
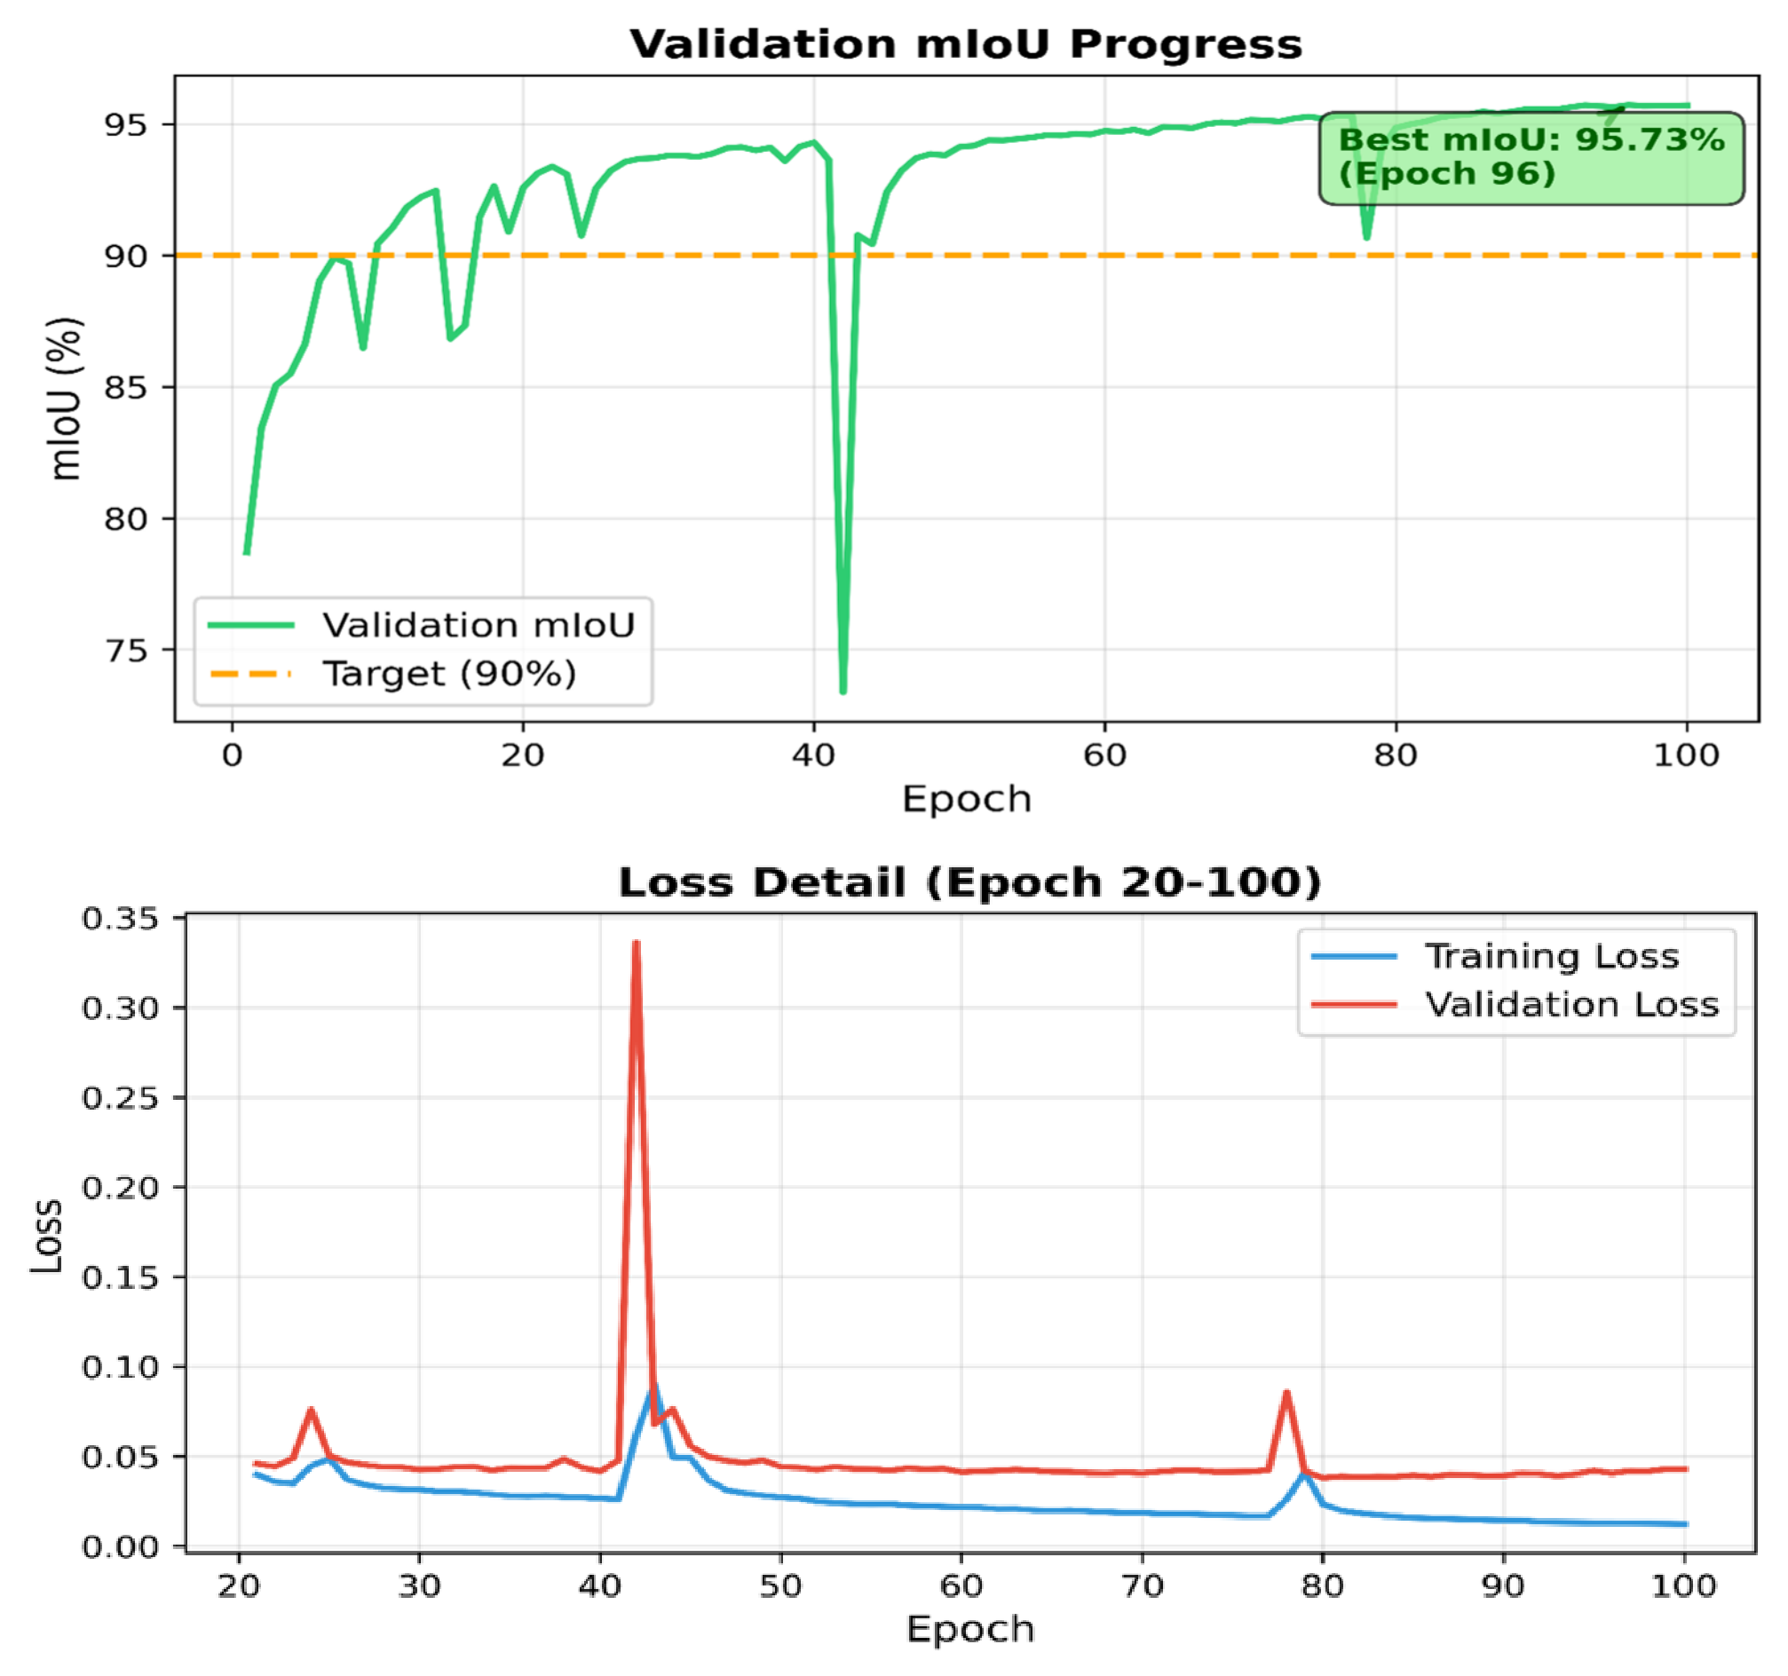
The ResNet34 U-Net model successfully captured the spatial topology of the floor plans. During training, the combined loss converged smoothly from 0.4979 down to 0.0124. The model achieved an outstanding overall mean Intersection over Union (mIoU) of 95.71% on the validation set.
Figure 3.
Training and validation loss convergence over 100 epochs.
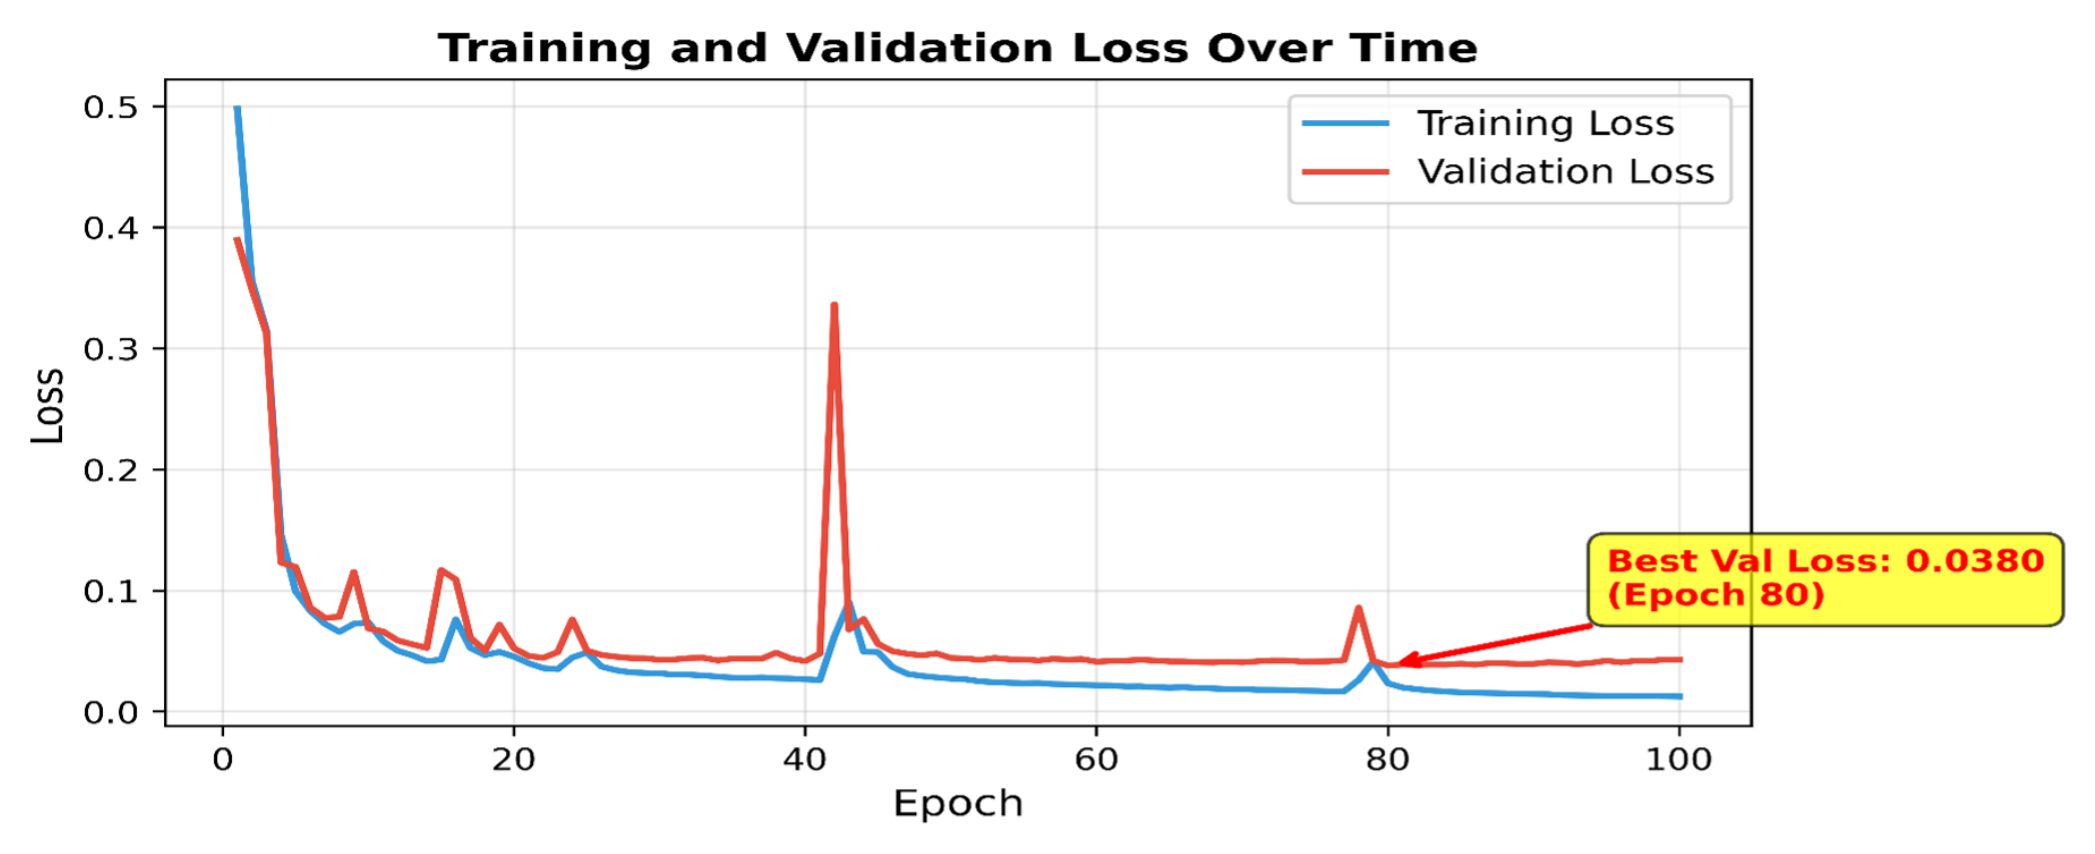
Figure 4.
mIoU progression (top) and Loss Detail(bottom) for the U-Net segmentation model over 100 epochs.
Figure 4.
mIoU progression (top) and Loss Detail(bottom) for the U-Net segmentation model over 100 epochs.
The model proved highly adept at delineating the boundaries of rooms, even in complex layouts with varying wall thicknesses, effectively suppressing background noise.
4.4. Evaluation of LLM Design Guidance
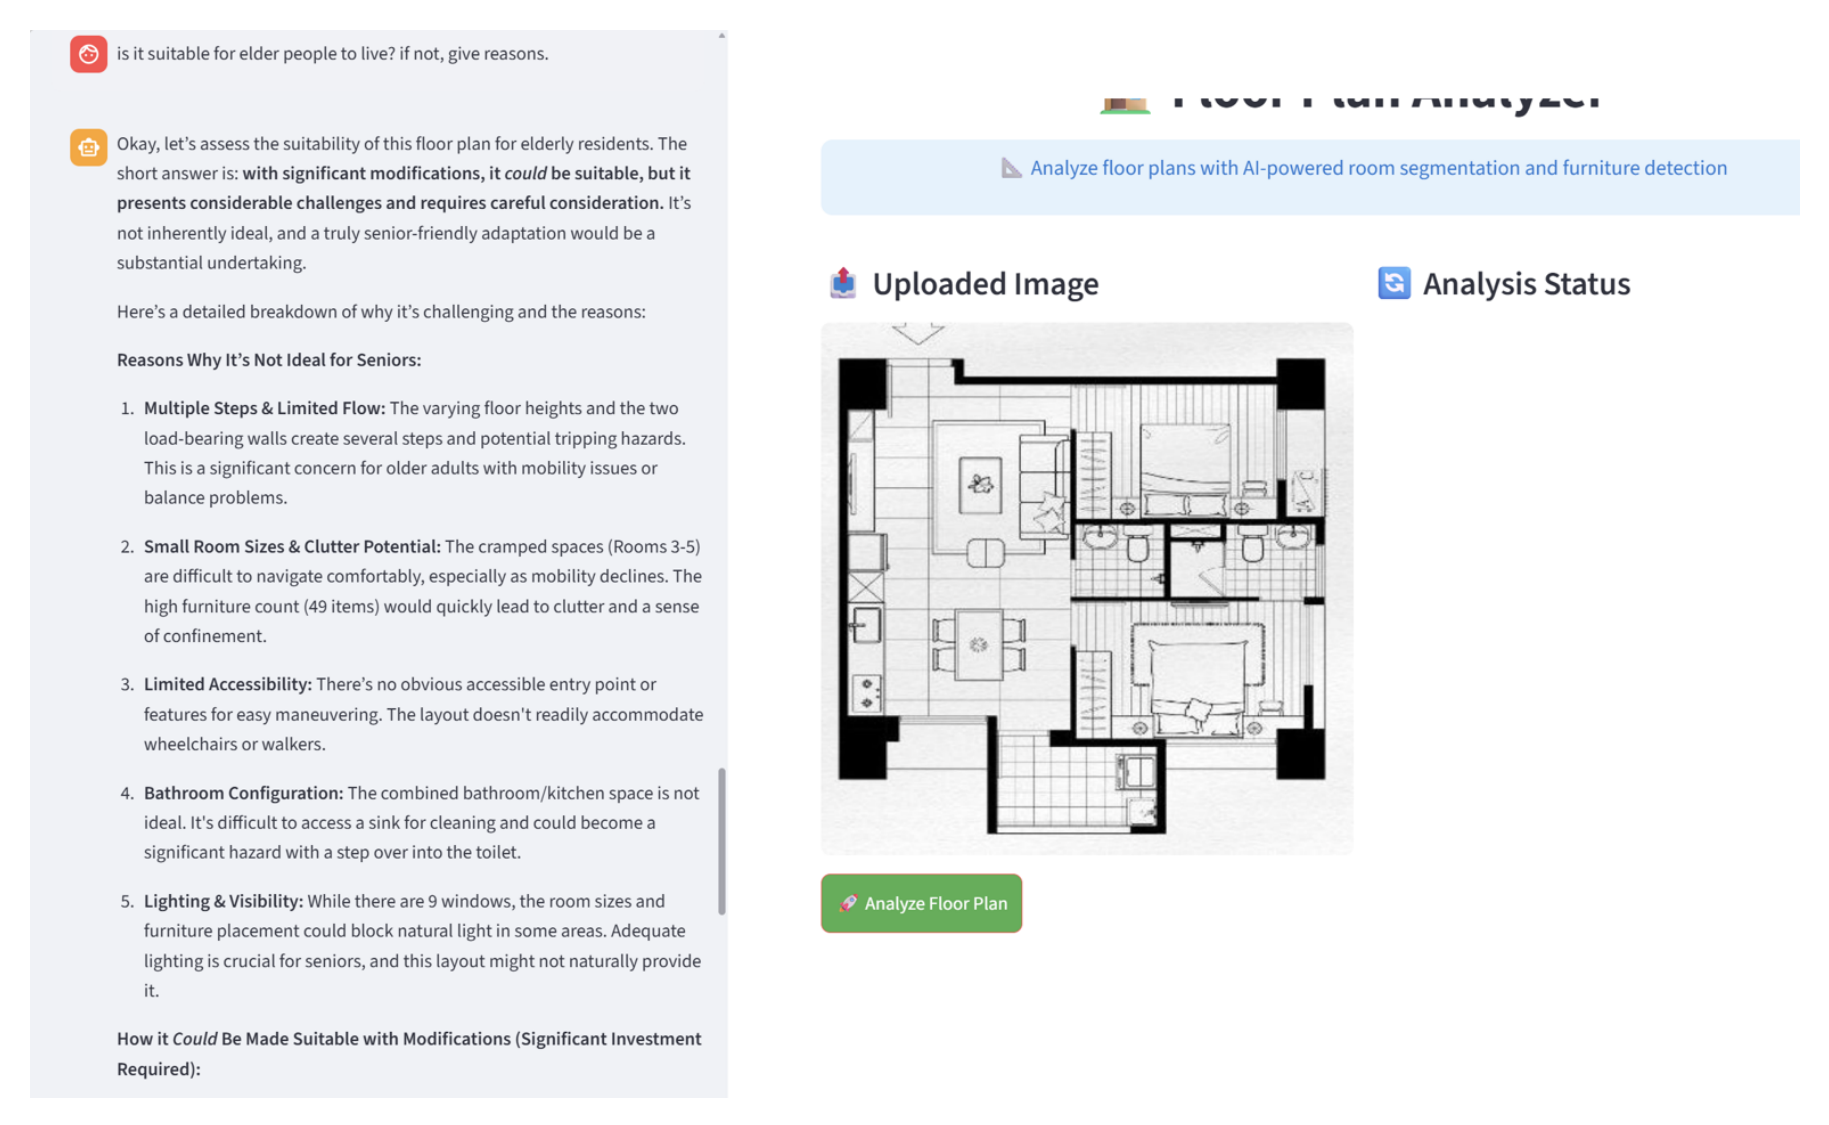
The integration of the LLM significantly expanded the system’s capabilities. During qualitative testing via the Streamlit web application, the structured data (e.g., "Room 1: 85 sqm total, Bedroom: 7 sqm") was parsed by the local Qwen-based LLM. Augmented by the RAG pipeline, the LLM successfully identified compliance issues—such as flagging the 7 sqm bedroom against the retrieved 9 sqm standard for double occupancy—and offered practical redesign suggestions, such as optimizing wardrobe placement or reconsidering room boundaries. This demonstrated the system’s capacity to act as an intelligent co-designer rather than a mere metric calculator.
4.5. System Integration and Qualitative Evaluation
To validate the practical utility of the proposed algorithms, the trained weights and LLM API were integrated into a custom Streamlit web application. Figure 7 showcases the system’s output on an unseen test image.
Figure 5.
Qualitative results from the integrated web application. The system seamlessly overlays YOLOv8 detection bounding boxes.
Figure 5.
Qualitative results from the integrated web application. The system seamlessly overlays YOLOv8 detection bounding boxes.
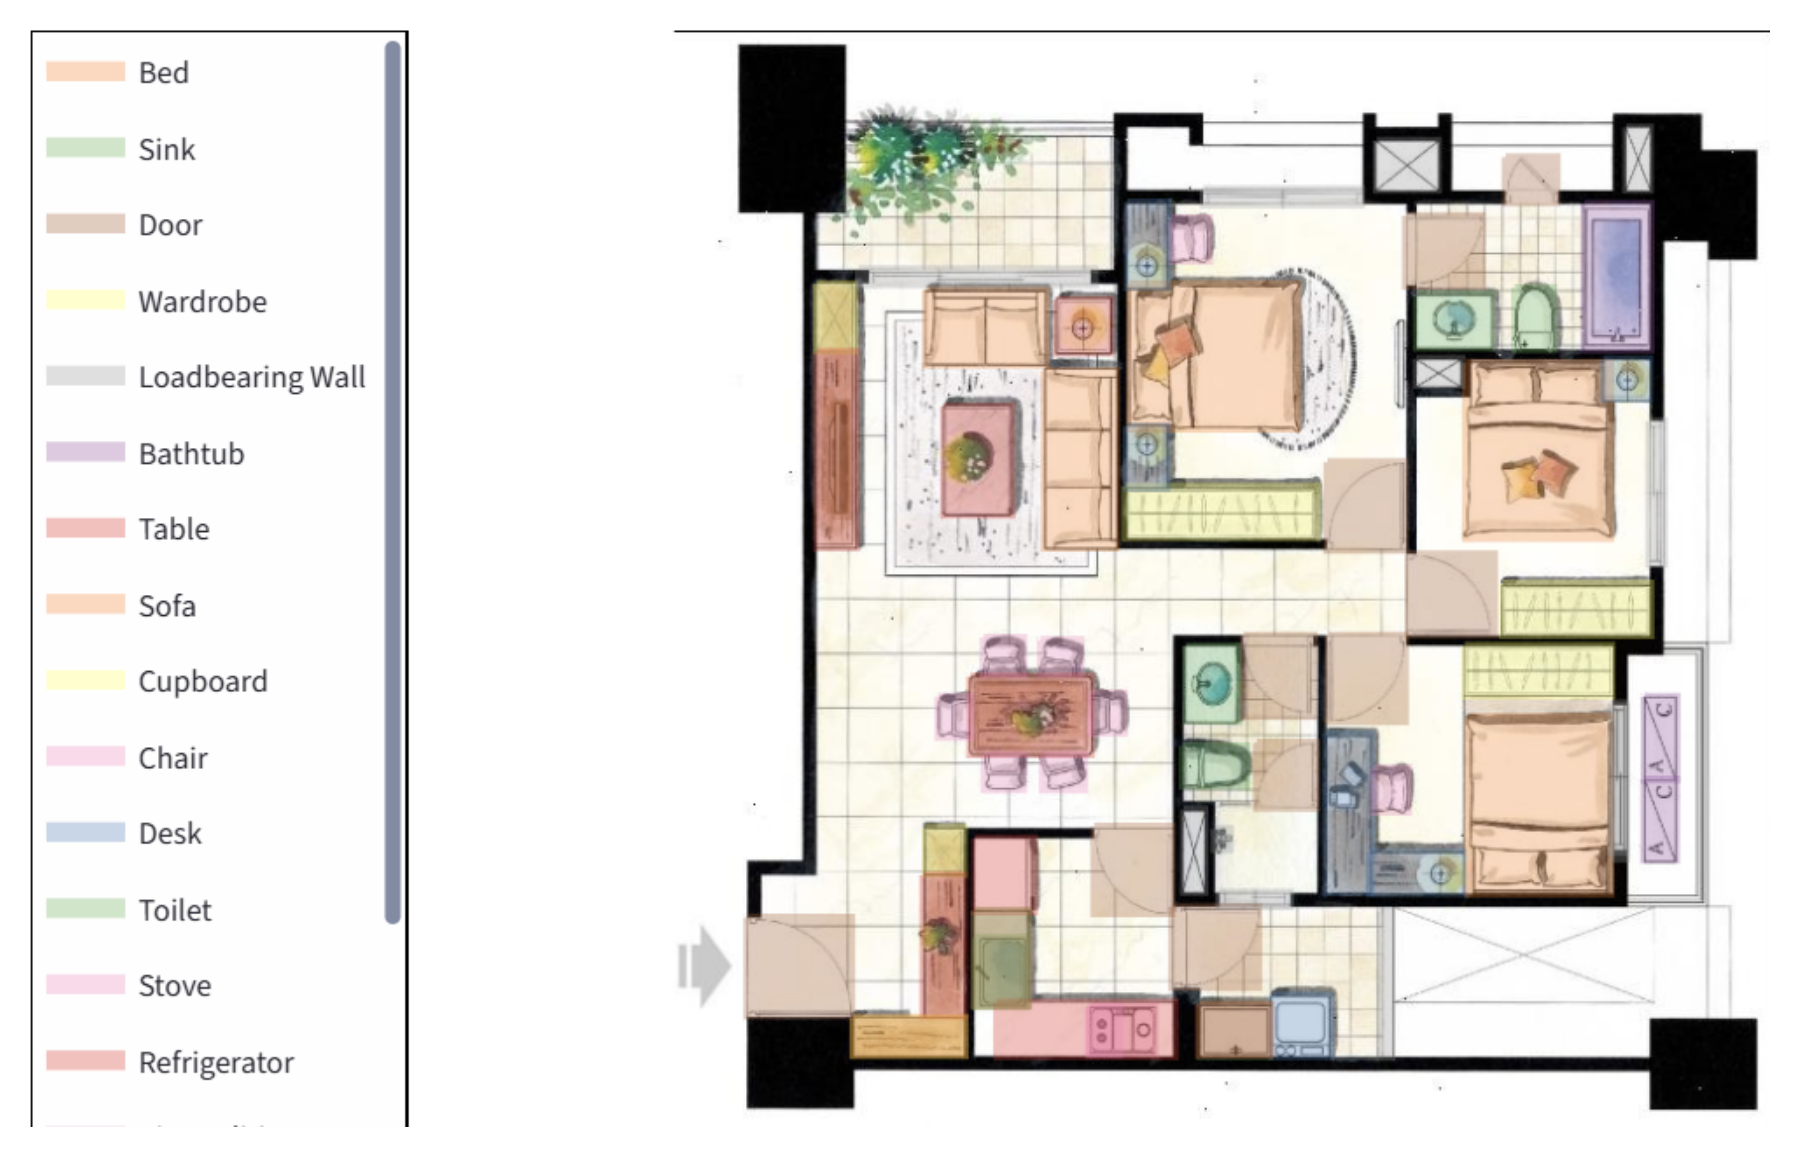
Figure 6.
U-Net segmentation masks (Green: Room, Gray: Wall), automatically generates an area calculation report alongside furniture statistics.
Figure 6.
U-Net segmentation masks (Green: Room, Gray: Wall), automatically generates an area calculation report alongside furniture statistics.
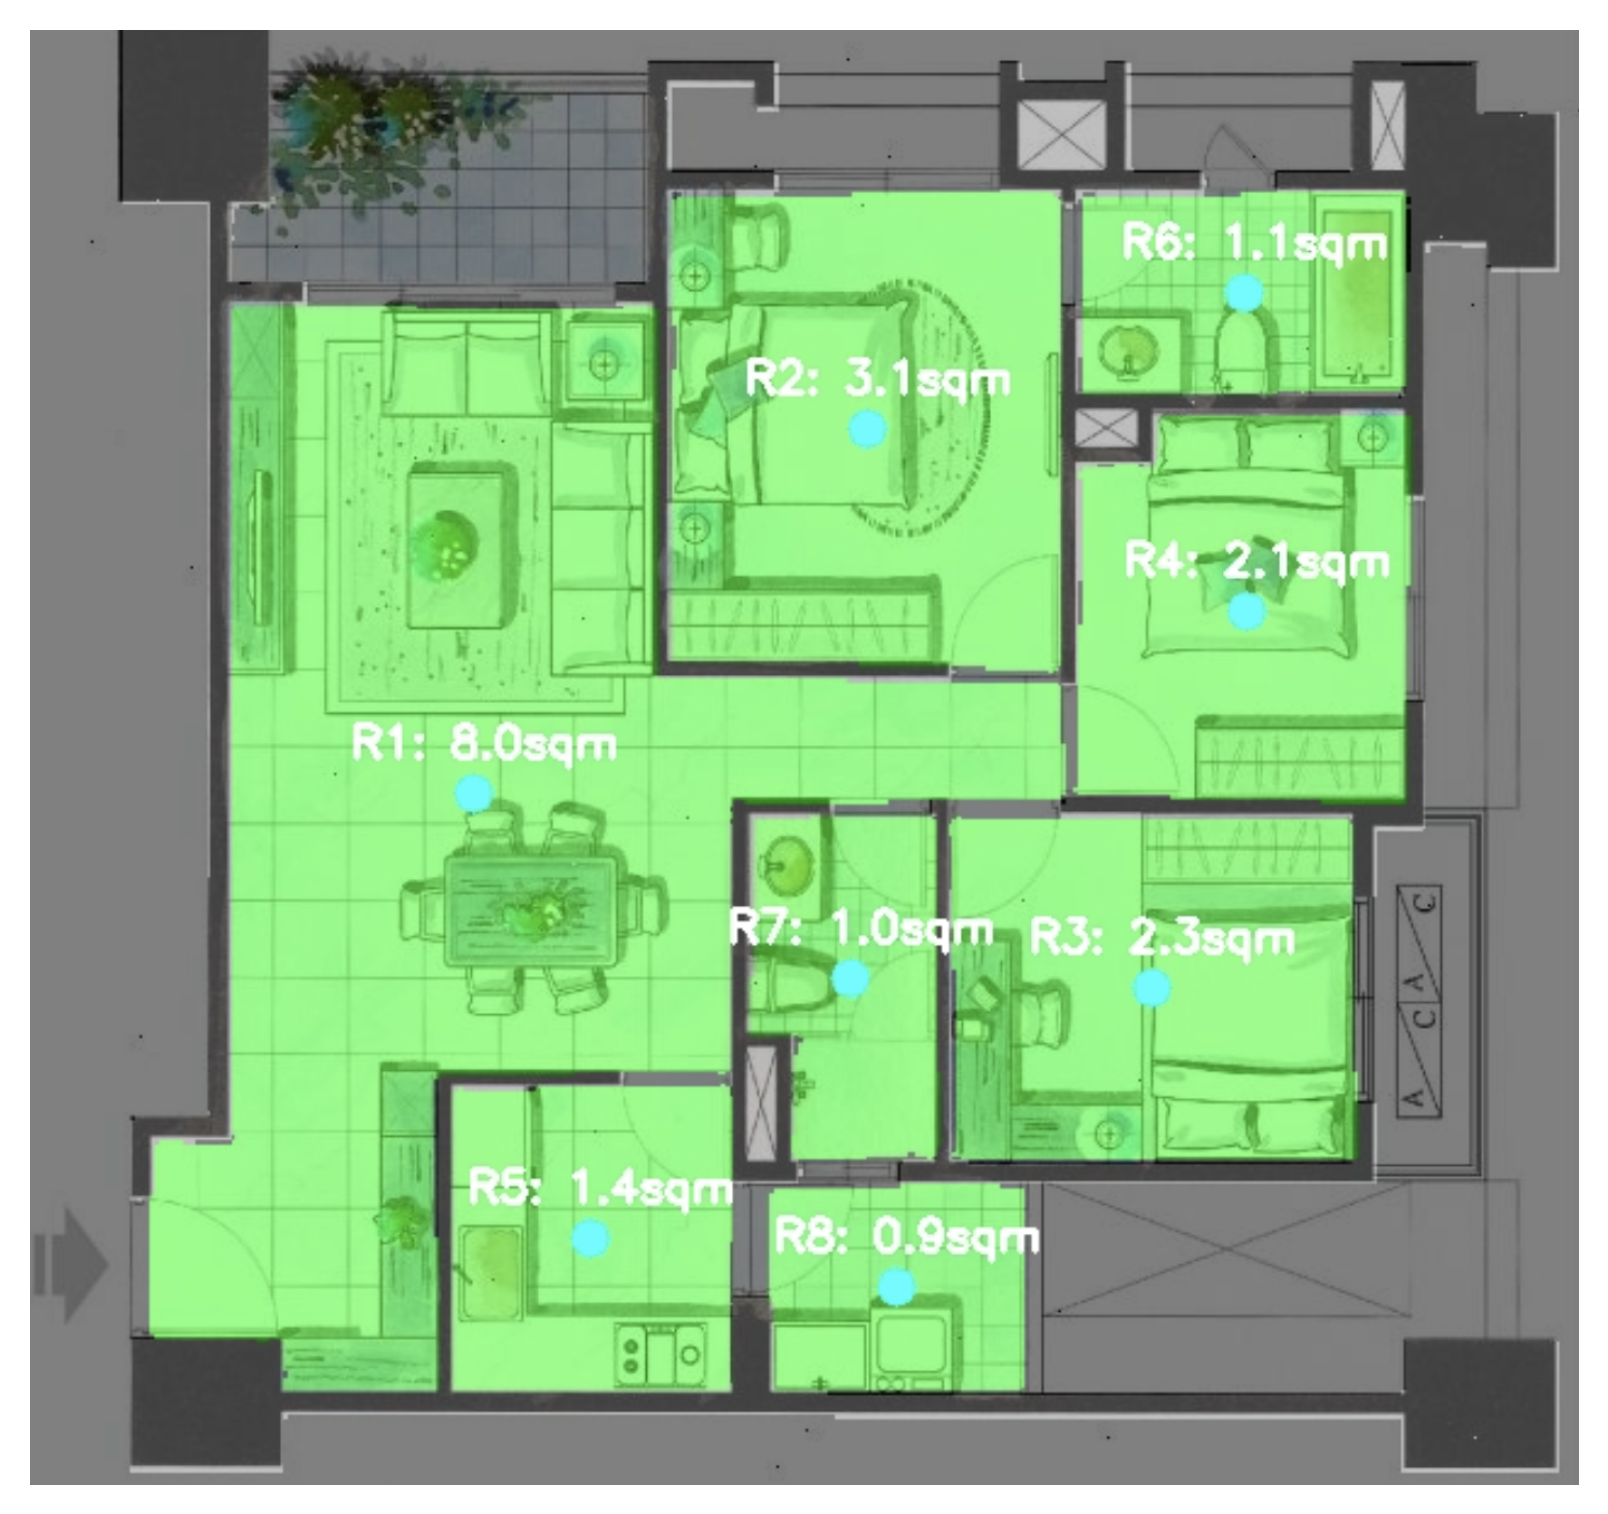
Figure 7.
LLM-driven architectural guidance powered by Ollama API.
The visual results confirm that the segmentation masks perfectly align with the structural walls, and the detected furniture correctly populates the identified rooms. By calibrating the scale using a known door width, the system calculated the total area of a sample apartment to be 85.4 square meters. When compared against the original architectural blueprint’s ground truth of 86.1 square meters, the system demonstrated a margin of error of merely 0.81%, well within acceptable limits for real estate and preliminary design applications.
5. Discussion
The results demonstrate the efficacy of utilizing a hybrid deep-learning pipeline for complex document image analysis. By decoupling the tasks—using YOLOv8 for sparse object detection and U-Net for dense pixel classification—the system maximizes the strengths of each architecture without suffering from the computational overhead and training instability often associated with single-network multi-task learning models.
Furthermore, our data augmentation strategy validates that massive manual annotation is not strictly necessary for specialized domains. Strategic geometric transformations that preserve the physical logic of the images (i.e., 90-degree rotations preserve orthogonal wall structures) are highly effective in training robust models from small seed datasets.
The introduction of the RAG pipeline and LLM integration effectively solves the hallucination problem commonly associated with LLMs in specialized domains, ensuring that all design guidance is anchored in real-world building codes.
A current limitation of the system is its reliance on manual scale calibration (drawing a reference line) to calculate real-world areas. If an image contains no recognizable reference objects of standard size, absolute area calculation is impossible, though relative room ratios can still be extracted.
6. Conclusion and Future Work
This paper introduced a fully automated, end-to-end framework for the intelligent analysis and evaluation of 2D floor plans. By integrating YOLOv8 and ResNet34-U-Net, the system successfully extracts both discrete architectural symbols and continuous room topologies with high precision. Coupled with a novel area calculation algorithm, an intuitive web interface, and advanced reasoning capabilities of a locally deployed, RAG-augmented LLM, the proposed solution significantly streamlines the digitization process for real estate and architectural planning. The system not only extracts geometric estimates but also provides interactive, regulation-compliant design guidance.
Future research will focus on completely eliminating the need for manual scale calibration. We plan to integrate Optical Character Recognition (OCR) modules to automatically read printed scale bars or dimension text directly from the floor plan images. Additionally, we intend to expand the pipeline’s capabilities to automatically generate 3D Building Information Models (BIM) from the 2D predictions, paving the way for instantaneous Virtual Reality property generation.
References
- Macedo, C.; et al. A survey on floor plan understanding in document image analysis. Pattern Recognit. Lett. 2015. [Google Scholar]
- Redmon, J.; Divvala, S.; Girshick, R.; Farhadi, A. You only look once: Unified, real-time object detection. In Proceedings of the Proceedings of the IEEE conference on computer vision and pattern recognition, 2016; pp. 779–788. [Google Scholar]
- Ronneberger, O.; Fischer, P.; Brox, T. U-net: Convolutional networks for biomedical image segmentation. In Proceedings of the International Conference on Medical image computing and computer-assisted intervention, 2015; Springer; pp. 234–241. [Google Scholar]
- Ren, S.; He, K.; Girshick, R.; Sun, J. Faster r-cnn: Towards real-time object detection with region proposal networks. Adv. Neural Inf. Process. Syst. 2015, 28. [Google Scholar] [CrossRef] [PubMed]
- Chen, L.C.; Papandreou, G.; Kokkinos, I.; Murphy, K.; Yuille, A.L. Deeplab: Semantic image segmentation with deep convolutional nets, atrous convolution, and fully connected crfs. IEEE Trans. Pattern Anal. Mach. Intell. 2017, 40, 834–848. [Google Scholar] [CrossRef]
- Kalervo, A.; Ylioinas, J.; Häikiö, M.; Karacan, A.; Kannala, J. CubiCasa5K: A Dataset and an Improved Multi-Task Model for Floorplan Image Analysis. In Proceedings of the Scandinavian Conference on Image Analysis, 2019; Springer; pp. 28–40. [Google Scholar]
- Nawari, N.O. Building Information Modeling: Automated Code Checking and Compliance Processes; CRC Press: Boca Raton, 2018. [Google Scholar] [CrossRef]
- Hjelseth, E. Foundations for BIM-based model checking systems: transforming regulations into computable rules in BIM-based model checking systems. PhD thesis, Norwegian University of Life Sciences, Ås, 2019. Accessed: Aug. 08, 2023.
- Taneja, S.; Akinci, B.; Garrett, J.H.; Soibelman, L. Algorithms for automated generation of navigation models from building information models to support indoor map-matching. Autom. Constr. 2016, 61, 24–41. [Google Scholar] [CrossRef]
- Zhu, J.; et al. Semantics-based connectivity graph for indoor pathfinding powered by IFC-Graph. Autom. Constr. 2025, 171, 106019. [Google Scholar] [CrossRef]
- Leitfaden Ingenieurmethoden des Brandschutzes. Technischer Bericht vfdb TB 04-01; Technical report. überarbeitete und ergänzte Auflage. 2020.
- Kuligowski, E.; Peacock, R.; Hoskins, B. A Review of Building Evacuation Models, 2nd Edition. National Institute of Standards and Technology, Technical Report NIST TN. Gaithersburg, MD, 2010. [Google Scholar]
- Zhang, Y.; Chai, Z.; Lykotrafitis, G. Deep reinforcement learning with a particle dynamics environment applied to emergency evacuation of a room with obstacles. Phys. A Stat. Mech. Its Appl. 2021, 571, 125845. [Google Scholar] [CrossRef]
- Jabi, W.; Chatzivasileiadi, A.; Wardhana, N.; Lannon, S.; Aish, R. The synergy of non-manifold topology and reinforcement learning for fire egress. In Proceedings of the Proceedings of eCAADe SIGraDi 2019, 2019; pp. 85–96. [Google Scholar] [CrossRef]
- Sharma, J.; Andersen, P.A.; Granmo, O.C.; Goodwin, M. Deep Q-Learning With Q-Matrix Transfer Learning for Novel Fire Evacuation Environment. IEEE Trans. Syst. Man. Cybern. Syst. 2021, 51, 7363–7381. [Google Scholar] [CrossRef]
- Wharton, A. Simulation and investigation of multi-agent reinforcement learning for building evacuation scenarios; Technical report; St Catherine’s College, 2009. [Google Scholar]
- Yao, Z.; Zhang, G.; Lu, D.; Liu, H. Data-driven crowd evacuation: A reinforcement learning method. Neurocomputing 2019, 366, 314–327. [Google Scholar] [CrossRef]
- Zhang, D.; et al. Deep reinforcement learning and 3D physical environments applied to crowd evacuation in congested scenarios. Int. J. Digit. Earth 2023, 16, 691–714. [Google Scholar] [CrossRef]
- Martinez-Gil, F.; Lozano, M.; Fernández, F. Emergent behaviors and scalability for multi-agent reinforcement learning-based pedestrian models. Simul. Model. Pract. Theory 2017, 74, 117–133. [Google Scholar] [CrossRef]
- Bauministerkonferenz. Musterbauordnung - MBO (Fassung November 2002), zuletzt geändert durch Beschluss der Bauministerkonferenz vom 22./23.09.2022, 2002. Accessed: Dec. 10, 2023.
- Kumar, S.S.; Cheng, J.C.P. A BIM-based automated site layout planning framework for congested construction sites. Autom. Constr. 2015, 59, 24–37. [Google Scholar] [CrossRef]
- Abotaleb, I.; Nassar, K.; Hosny, O. Layout optimization of construction site facilities with dynamic freeform geometric representations. Autom. Constr. 2016, 66, 15–28. [Google Scholar] [CrossRef]
- Boguslawski, P.; Mahdjoubi, L.; Zverovich, V.; Fadli, F. Automated construction of variable density navigable networks in a 3D indoor environment for emergency response. Autom. Constr. 2016, 72, 115–128. [Google Scholar] [CrossRef]
- Teo, T.A.; Cho, K.H. BIM-oriented indoor network model for indoor and outdoor combined route planning. Adv. Eng. Inform. 2016, 30, 268–282. [Google Scholar] [CrossRef]
- Sutton, R.S.; Barto, A.G. Reinforcement learning: an introduction . In Adaptive computation and machine learning series, second ed.; The MIT Press: Cambridge, Massachusetts, 2018. [Google Scholar]
- Kwiatkowski, A. Simulating crowds with reinforcement learning. PhD thesis, Institut Polytechnique de Paris, 2023. [Google Scholar]
- Schulman, J.; Wolski, F.; Dhariwal, P.; Radford, A.; Klimov, O. Proximal Policy Optimization Algorithms. arXiv 2017, arXiv:1707.06347. [Google Scholar] [CrossRef]
- Bahamid, A.; Ibrahim, A.M.; Shafie, A.A. Crowd evacuation with human-level intelligence via neuro-symbolic approach. Adv. Eng. Inform. 2024, 60, 102356. [Google Scholar] [CrossRef]
- Hodge, V.J.; Hawkins, R.; Alexander, R. Deep reinforcement learning for drone navigation using sensor data. Neural Comput. Appl. 2021, 33, 2015–2033. [Google Scholar] [CrossRef]
- Kuo, P.H.; Yang, W.C.; Hsu, P.W.; Chen, K.L. Intelligent proximal-policy-optimization-based decision-making system for humanoid robots. Adv. Eng. Inform. 2023, 56, 102009. [Google Scholar] [CrossRef]
- Sinpan, N.; Sasithong, P.; Chaudhary, S.; Poomrittigul, S.; Leelawat, N.; Wuttisittikulkij, J. Simulative Investigations of Crowd Evacuation by Incorporating Reinforcement Learning Scheme. In Proceedings of the Proceedings of the 6th International Conference on Algorithms, Computing and Systems, Greece, 2022; pp. 1–5. [Google Scholar]
- Ruying, L.; Wanjing, W.; Burcin, B.G.; Gale, M.L. Enhancing Building Safety Design for Active Shooter Incidents: Exploration of Building Exit Parameters using Reinforcement Learning-Based Simulations. In Proceedings of the Proceedings of the 31st International Workshop on Intelligent Computing in Engineering, Vigo, Spain, 2024; pp. 569–579. Accessed: Jan. 30, 2025.
- Kim, M.; Ham, Y.; Koo, C.; Kim, T.W. Simulating travel paths of construction site workers via deep reinforcement learning considering their spatial cognition and wayfinding behavior. Automation in Construction 2023, 147, 104715. [Google Scholar] [CrossRef]
Figure 1.
Overall architecture of the proposed LLM-integrated floor plan analysis system. The pipeline integrates YOLOv8 for object detection, U-Net for semantic segmentation, an interactive scale calibration module for real-world area calculation, and an Ollama-based LLM utilizing RAG to provide architectural design guidance.
Figure 1.
Overall architecture of the proposed LLM-integrated floor plan analysis system. The pipeline integrates YOLOv8 for object detection, U-Net for semantic segmentation, an interactive scale calibration module for real-world area calculation, and an Ollama-based LLM utilizing RAG to provide architectural design guidance.
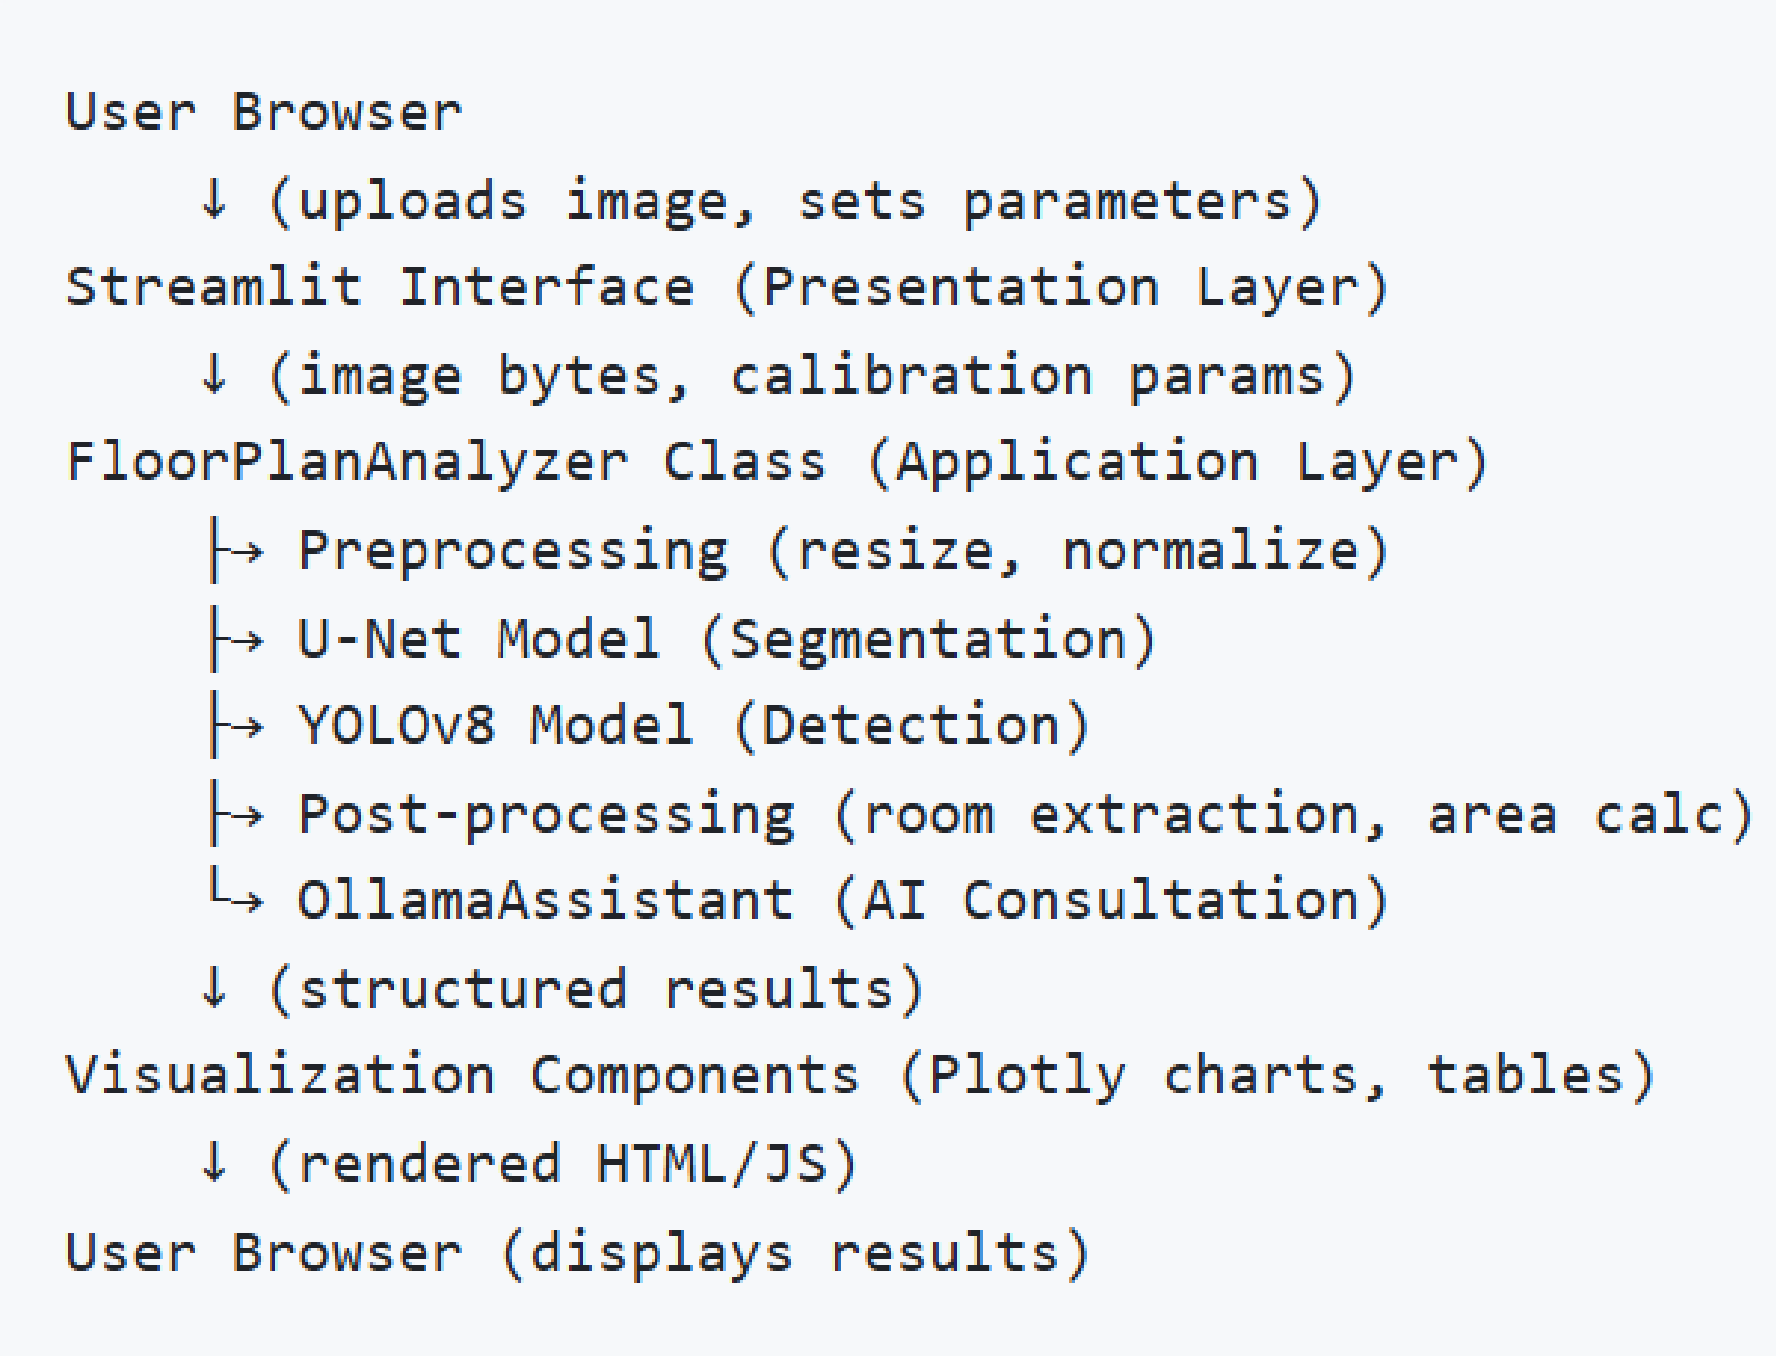

Table 1.
YOLOv8 Object Detection Performance by Class
| Class | Precision | Recall | mAP50 (%) |
|---|---|---|---|
| Door | 0.970 | 0.734 | 78.8 |
| Window | 0.757 | 0.642 | 72.1 |
| Table | 0.834 | 0.911 | 93.0 |
| Chair | 0.982 | 0.974 | 98.5 |
| Bed | 0.979 | 1.000 | 99.4 |
| Sofa | 0.915 | 0.966 | 94.9 |
| Toilet | 0.978 | 0.936 | 97.9 |
| Sink | 0.917 | 0.932 | 94.9 |
| Bathtub | 0.988 | 1.000 | 99.5 |
| Stove | 0.947 | 0.913 | 97.0 |
| Refrigerator | 0.948 | 0.946 | 95.8 |
| Wardrobe | 0.940 | 0.999 | 98.3 |
| TV | 0.887 | 0.362 | 57.4 |
| Desk | 0.898 | 0.938 | 97.1 |
| Washing Machine | 0.891 | 0.909 | 94.9 |
| Load-bearing Wall | 0.940 | 0.970 | 97.2 |
| Air Condition | 0.975 | 1.000 | 99.4 |
| Cupboard | 0.910 | 0.870 | 94.5 |
| Overall | 0.925 | 0.889 | 92.3 |
Disclaimer/Publisher’s Note: The statements, opinions and data contained in all publications are solely those of the individual author(s) and contributor(s) and not of MDPI and/or the editor(s). MDPI and/or the editor(s) disclaim responsibility for any injury to people or property resulting from any ideas, methods, instructions or products referred to in the content. |
© 2026 by the authors. Licensee MDPI, Basel, Switzerland. This article is an open access article distributed under the terms and conditions of the Creative Commons Attribution (CC BY) license.
Copyright: This open access article is published under a Creative Commons CC BY 4.0 license, which permit the free download, distribution, and reuse, provided that the author and preprint are cited in any reuse.


