
Submitted:
26 May 2026
Posted:
27 May 2026
You are already at the latest version
Abstract
Tuberculosis (TB) remains a persistent global health challenge, particularly in resource-constrained and remote regions where healthcare access is limited. Despite being both curable and preventable, TB continues to cause significant morbidity and mortality, emphasizing the urgent need for early detection and large-scale screening of at-risk populations. In recent years, artificial intelligence (AI), and more specifically deep learning, has emerged as a transformative tool for automating medical image analysis and supporting clinical decision-making. However, the reliability, robustness, and security of these AI solutions are critical concerns, as their vulnerability to adversarial attacks poses serious risks in safety-critical healthcare environments. This study systematically investigates the adversarial robustness of deep learning models for TB screening using chest X-ray images. A diverse set of convolutional and transformer-based architectures is evaluated under a range of white-box and black-box adversarial attack scenarios. Experimental results reveal that both model families exhibit significant performance degradation when subjected to adversarial perturbations. Our findings also suggest that leveraging a feature-encoder–based defense framework can significantly improve each model’s capability to handle adversarial attacks. This approach allows the model to maintain high diagnostic accuracy on unperturbed images while abstaining from unreliable predictions on potentially adversarial samples.
Keywords:
tuberculosis
; disease screening
; adversarial attack
; computer vision
; radiology
1. Introduction
Tuberculosis (TB) remains a prevalent and persistent disease worldwide, where regions with limited medical resources are more susceptible to widespread and higher mortality [1,2,3]. TB is a preventable and curable disease, yet in 2022, it was the second deadliest infectious disease globally, surpassed only by COVID-19 [4]. The risk of developing active TB disease is highest within the first two years after infection and then declines significantly [5], with some individuals even clearing the infection entirely [6]. While TB is treatable—about 85% of infections can be cured with a six-month antibiotic course [1]—the untreated disease carries a high mortality rate of approximately 50% [7]. These statistics underscore the urgent need for timely, accurate, and accessible TB screening, particularly in low-resource environments.
Recent advancements in artificial intelligence (AI) have transformed many aspects of healthcare, offering unprecedented capabilities in disease detection, treatment planning, and patient management [8]. Among various AI subfields, computer vision has become particularly prominent due to its critical role in medical imaging modalities such as computed tomography (CT), magnetic resonance imaging (MRI), X-ray, and ultrasound, all of which provide essential visual information for disease diagnostics [9]. Additionally, camera-based applications such as colonoscopy and endoscopy would also benefit from computer vision systems, indicating the broad and growing influence of this technology in medical practice [10].
Within medical imaging, classification and segmentation represent two cornerstone tasks. Classification models, often based on convolutional neural networks (CNNs) or transformer architectures, have demonstrated remarkable performance by detecting subtle patterns and pathological features in images [11,12] that may be imperceptible to the human eye, leading to enhancing diagnostic efficiency and accuracy, potentially supporting clinicians in early disease detection and risk stratification. Segmentation, on the other hand, plays a critical role in delineating anatomical structures and pathological regions, facilitating applications such as digital twin construction, surgical simulation, and treatment planning [13]. Deep learning models can achieve pixel-level precision in identifying tissue boundaries, enabling the creation of anatomically accurate digital representations of patients [14].
Despite their promise, AI-enabled solutions remain vulnerable to security threats, which pose significant challenges to the reliability and safety of medical AI. Adversarial attacks introduce subtle, often imperceptible alterations to input data that can mislead models into making incorrect or even dangerous predictions [15]. In medical imaging, even minor perturbations can drastically alter diagnostic outcomes, potentially resulting in misdiagnosis, delayed treatment, or unnecessary medical interventions. As AI becomes increasingly embedded in clinical workflows, these vulnerabilities not only threaten patient outcomes but also undermine trust in AI-driven diagnostic solutions. The complexity and variability of medical images further amplify these risks, as adversarial perturbations can obscure critical diagnostic features [16] or exploit weaknesses in model generalization. Ensuring the robustness of AI systems against such attacks is therefore essential for their safe and ethical deployment in real-world healthcare settings.
In this paper, we contribute to the growing body of research on secure and trustworthy medical AI by investigating defence mechanisms designed to enhance the robustness of deep learning models for TB screening. Specifically, we evaluate the effectiveness of approchaes such as the Multivariate Gaussian Model (MGM) [17] and adversarial training [18] in mitigating both single-step and multi-step attacks under white-box and black-box threat scenarios. Through comprehensive experimentation, we demonstrate the detrimental impact of adversarial perturbations on unprotected models, highlighting the urgent need for defensive strategies in clinical AI applications. By fortifying the robustness and security of AI-based diagnostic tools, our work aims to support the reliable and equitable deployment of TB screening technologies, especially in underserved regions, thereby advancing global health equity and resilience.
The remainder of this paper is organized as follows. Section 2 provides an overview of the related work and the foundational concepts. Section 3 describes the data, model architectures, and methodologies employed in this study. Section 4 presents the experimental findings and performance evaluations. Section 5 interprets the implications of our findings, highlighting the importance of robustness and security. Finally, the last section outlines the limitations of this study and proposes directions for future research.
2. Background and Related Work
Recent research has demonstrated that medical imaging models are highly vulnerable to adversarial perturbations across a wide range of modalities, including computed tomography (CT), magnetic resonance imaging (MRI), chest X-ray (CXR), ultrasound, and digital pathology. Comprehensive reviews have shown that most adversarial pipelines in medical AI utilize gradient-based techniques such as Fast Gradient Sign Method (FGSM), Basic Iterative Method (BIM), Projected Gradient Descent (PGD), and Momentum Iterative Method (MIM), which consistently degrade the performance of classification, segmentation, and detection models even under minimal perturbation budgets [16]. More advanced attack paradigms have emerged in recent years, introducing task-aware and modality-specific strategies such as reconstruction-space perturbations for MRI, intensity-based transformations for CT, and patch-level attacks for high-resolution pathology images [19]. Furthermore, the growing prevalence of black-box transfer attacks, which exploit surrogate models to mislead clinical decision-support systems, underscores the pressing real-world risks adversarial threats pose to automated screening and triage workflows [19].
In parallel, defensive research in medical imaging has evolved to counter increasingly sophisticated attack algorithms. Modern defences are typically categorized into adversarial training, purification-based methods, feature-level regularization, and statistical detection approaches [19]. Although adversarial training remains the most widely adopted defence mechanism, its limitations—such as reduced accuracy on clean images and limited generalization to unseen attacks—restrict its suitability for safety-critical clinical applications. Emerging defences have introduced innovative strategies, including diffusion-based purification [20], denoising reconstruction modules [21], anatomical priors for enforcing structural consistency [15], and likelihood-based feature modelling to identify adversarial deviations in learned embedding spaces [17]. Recent studies also highlight the growing promise of architecture-agnostic statistical detectors and distribution-aware defences, which can be integrated with pretrained medical AI models while maintaining favourable robustness–accuracy trade-offs [19]. Collectively, these advances signify a notable shift toward detection-oriented and model-agnostic defence paradigms, guiding the direction for clinically deployable and trustworthy AI systems in medical imaging [19].
One of the most widely studied defence strategies against adversarial attacks is adversarial training [18,22]. This method involves incorporating adversarially perturbed samples into the training process to improve the model’s resilience and ability to recognize malicious distortions. By repeatedly exposing the network to adversarial variations during learning, the model learns more stable decision boundaries and becomes better equipped to mitigate the influence of noise perturbations. Aversarial training has demonstrated strong defensive performance in conventional computer vision tasks [23]. However, it presents notable challenges when applied to medical imaging [18], where data characteristics differ significantly from natural images. The medical domain is characterized by complex high-dimensional data, subtle anatomical and pathological variations, and limited availability of labelled samples. Medical images often contain fine-grained diagnostic details that can be distorted by perturbations, making it difficult for adversarially trained models to generalize without sacrificing diagnostic sensitivity [18].
To address these limitations, alternative defence frameworks such as Multivariate Gaussian Model (MGM) [17] have been explored. MGM operates by modelling the distribution of high-dimensional feature representations extracted from clean training images using a multivariate Gaussian defined by a mean vector and covariance matrix. The Mahalanobis distance is then used to calculate the log probability of a test sample, distinguishing between adversarial and clean inputs based on their distance from the learned distribution. This probabilistic approach enables the detection of anomalous or perturbed samples without requiring model retraining. A major advantage of MGM lies in its adaptability—it can be applied post hoc to existing networks, regardless of their architecture, making it a practical and efficient solution for medical AI systems [17]. The growing vulnerability of medical imaging models to adversarial perturbations calls for robust defence strategies to provide complementary mechanisms for improving reliability in clinical AI systems, balancing robustness with diagnostic accuracy.
3. Data and Methodology
This section outlines the datasets, preprocessing steps, model architectures, and experimental procedures employed to evaluate the robustness of TB screening models against adversarial attacks, as well as the implementation of defence mechanisms designed to enhance their resilience and diagnostic reliability. Figure 1 shows the high-level overview of the analyses.
3.1. Data
3.1.1. Data Collection
This study utilizes two distinct sets of datasets: (1) a highly imbalanced composite dataset aggregated from multiple open-source CXR collections (see Table 1), and (2) a moderately imbalanced dataset (see Table 2). The highly imbalanced dataset integrates six publicly available TB CXR datasets and one COVID-19 CXR dataset, namely, the Montgomery dataset [22], the Shenzhen dataset [22], Rahman’s combined CXR dataset (TB Radio) [24], a drug-resistant TB dataset (TB Portals) [25], an 11K bounding box TB dataset (TBX11k) [26], and the COVIDx-CXR-v4 dataset [27]. These sources were selected for their comprehensive coverage of tuberculosis manifestations and their widespread use in medical imaging research. The inclusion of the COVID-19 dataset broadens the diversity of visual features and expands the sample size, facilitating more rigorous and targeted adversarial attack evaluations.
The moderately imbalanced dataset used in this study was derived from the work of Patel et al. [2], comprising a curated collection of labelled and unlabelled CXR images. In total, the dataset includes 10,288 CXR scans, distributed across three diagnostic categories: 3,906 normal cases, 2,141 TB images, and 4,241 COVID-19 images. This dataset provides a more balanced representation and serves as a valuable benchmark for evaluating model performance under conditions of moderate class imbalance. The detailed image distribution is presented in Table 2.
3.1.2. Data Split and Preparation
Prior to merging, each dataset was partitioned into training, validation, and testing subsets using an 80:10:10 split ratio, ensuring consistent evaluation protocols while accommodating the distinct preprocessing requirements of individual datasets. Standard preprocessing procedures were applied, including image normalization to standard distribution, lung segmentation to isolate the pulmonary region and remove non-diagnostic areas, padding the masked image into the same aspect ratio, resizing each image to pixels, and histogram equalization to enhance contrast and colour consistency. To further improve model generalization and mimic realistic variations in clinical imaging, a range of data augmentation techniques was employed. These included Gaussian blur and additive noise, horizontal flipping, random rotations between 0∘ and 15∘, random translations in horizontal and vertical direction for less than 15% of its original dimensions, and colour jitter to simulate common radiographic artifacts. However, extreme augmentations such as random cropping were deliberately excluded, as they risk removing critical pathological regions necessary for accurate TB detection.
Following preprocessing, all subsets were combined into a unified imbalanced dataset comprising 7,706 normal, 2,943 TB-affected, and 65,681 COVID-affected CXR images. This distribution results in a class ratio of approximately 1:0.4:8.5, reflecting an epidemiological scenario. The other moderately imbalanced dataset comprises 3,906 healthy, 2,141 TB-affected, and 4,241 COVID-19 chest X-ray images, for a total of 10,288 samples. Several measures were implemented to mitigate the effects of an imbalanced class distribution, as described in the next section. The resulting datasets provide a diverse and comprehensive collection of CXR images, serving as a representative foundation for developing and evaluating the robustness of AI-based TB screening models under adversarial conditions. Their composition allows for the assessment of model performance across heterogeneous image sources and pathologies, supporting the development and validation of the defence mechanisms aimed at fortifying medical AI systems against adversarial threats.
3.2. Methodology
3.2.1. Lung Segmentation
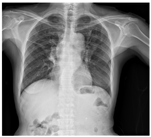
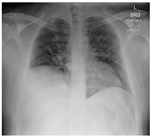
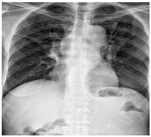
The aggregated dataset comprises CXR images from multiple sources, each acquired under varying imaging conditions such as contrast, exposure, orientation, and resolution. These variations can introduce inconsistencies that may hinder model performance and generalization. To ensure uniformity and preserve diagnostically relevant features for disease detection, a segmentation pipeline was implemented. Specifically, we used Unet [28] to generate binary lung masks, effectively delineating the pulmonary regions from surrounding anatomical non-diagnostic structures. Each CXR image was then cropped to the lung region with a controlled margin of padding (10 pixels on each side) to maintain contextual anatomical information that may contribute to diagnostic accuracy. This segmentation process also mostly removes irrelevant background elements, e.g., text labels, markers, and extraneous artifacts that appear in the image corners frequently, while focusing the model’s attention on regions most indicative of disease pathology. Moreover, the refined lung-focused inputs improve interpretability and support the development of robust adversarial defence mechanisms by ensuring that attacks and defences operate on clinically meaningful visual content. Representative examples of this segmentation step are shown in Table 3, where original CXR images are compared with their corresponding segmented outputs across Normal, TB, and COVID-19 cases. The segmentation results display consistent localization of pulmonary regions and effective removal of non-diagnostic background elements. This standardization reduces inter-sample variability while preserving key anatomical structures.
3.2.2. Model Training
(1) Convolutional and Attention-based Networks: Three CNN models, i.e., ResNet50 [29], DenseNet121 [30], and MobileNet v3 [31], and two attention-based models, i.e., ViT Base [32], and DeiT [33], were initially pretrained on the ImageNet dataset and were fine-tuned on our dataset over 50 epochs. The weights for the ImageNet were loaded into the models first, then the initial layers, other than the last three layers, were frozen to preserve the low-level features such as edges and local regions. All models were trained on a single NVIDIA RTX A6000 with a batch size of 256, and CPU worker threads were set to 8 to maximize the speed of training. Mix precision was used to optimize training speed and memory usage as well. To effectively manage the inherent class imbalance in the dataset and reduce overfitting, focal loss with class weights was employed alongside the Adam optimizer with a learning rate of 0.001, which included weight decay of 0.01. Additional gradient clipping with a max value of 1.0 was applied to prevent exploding gradients due to overfitting as well. The selection of CNN and attention-based baselines was based on their simplicity and common application across the machine learning domain, along with their effectiveness in handling complex image classification tasks [14]. These architectures are particularly well-suited for medical image analysis, where capturing intricate features is crucial for accurate diagnosis.
(2) Self-Supervised Self-Train Learning: Self-supervised learning (SSL) leverages the intrinsic structure of unlabeled data to learn robust, semantically meaningful feature representations without extensive manual annotation. Instead of relying on explicit ground-truth labels, SSL defines auxiliary learning objectives or enforces consistency constraints across multiple augmented views of the same input. Through this process, the model learns transferable representations that can later be fine-tuned for downstream tasks [34]. This paradigm has gained significant traction in medical imaging, where curated and expertly labelled datasets are often scarce, costly, and time-intensive to produce.
In this study, the distillation for self-supervision and self-train learning (DISTL) framework [35], which effectively leverages limited labelled data alongside extensive unlabeled samples, was also included among the evaluated models under adversarial conditions. The architecture integrates a self-distillation with no labels (DINO) head [36] for representation learning with a classification head for TB detection. Within this framework, first, a teacher model trained on a small labelled subset produces pseudo-labels for a large collection of unlabeled samples. These pseudo-labelled data are then used to train a student model, enabling it to learn from both labelled and pseudo-labelled examples and thereby enhance its generalization capability. To ensure stable convergence and prevent training collapse, the teacher’s parameters are updated using an exponential moving average (EMA) of the student’s weights [2]. For the purposes of this study, the original binary classification configuration was extended to a multiclass setting by replacing the final classification layer with an appropriately dimensioned output head, while preserving the training procedure described in [2].
The principal strength of this architecture lies in its ability to efficiently utilize large-scale unlabeled data while maintaining strong generalization performance [3]. The vision transformer backbone further enables global contextual modelling across lung regions through self-attention mechanisms, facilitating the detection of diffuse and spatially distributed pathological patterns [2]. Importantly, the reduced dependence on extensively annotated datasets makes such models particularly attractive for deployment in real-world medical settings. As self-supervised approaches continue to mature, they represent an emerging class of architectures warranting systematic evaluation in safety-critical domains such as medical diagnosis.
3.2.3. Adversarial Attack Generation and Configuration
After training the baseline models, adversarial images were generated to evaluate the robustness of the TB screening solution under both white-box and black-box threat scenarios. These two attack categories differ in the level of information accessible to the adversary, providing a comprehensive assessment of model vulnerability across varying degrees of exposure.
- White-box attacks: In this setting, the attacker has complete access to the model’s architecture, weights, and gradients [18]. This allows direct computation of perturbations that maximize prediction errors by exploiting internal model parameters.
- Black-box attacks: In contrast, the attacker has no knowledge of the target model’s internal structure or parameters [18]. To simulate this scenario, a separate CNN architecture, i.e., DenseNet121 [30], was employed to generate adversarial samples. These samples were then transferred to the target model to evaluate its susceptibility to cross-model perturbations.
Four established adversarial attack algorithms were implemented to simulate different perturbation strategies:
- Fast Gradient Sign Method (FGSM) [37], a single-step gradient-based attack that introduces small pixel-level perturbations along the gradient’s sign direction.
- Projected Gradient Descent (PGD) [38], a multi-step iterative extension of FGSM that refines perturbations while projecting them within a defined epsilon boundary.
- Basic Iterative Method (BIM) [39], an iterative variant of FGSM that applies repeated small perturbations, enabling more precise adversarial manipulation.
- Momentum Iterative Method (MIM) [39], an improved iterative technique that incorporates momentum in gradient updates, enhancing attack stability and effectiveness.
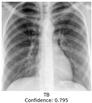
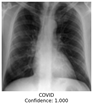
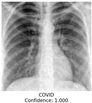
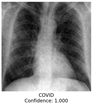
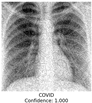
For the white box setting, the perturbation strength (epsilon) was set to 0.02, while for the black box scenario, epsilon was increased to 0.05 to account for reduced transferability. The iterative attacks (PGD, BIM, and MIM) were performed with 20 steps, ensuring sufficient optimization of adversarial perturbations. Epsilon defines the magnitude of pixel-level alteration introduced by the attack and thus directly controls the balance between perceptual similarity and adversarial effectiveness. This controlled generation of adversarial samples enables systematic evaluation of model resilience under diverse attack conditions, revealing how different defence mechanisms perform against both direct and indirect adversarial threats. Table 4 illustrates examples of each attack scenario across all the labels. As seen, both white-box and black-box adversarial attacks lead to a loss of class discrimination.
3.2.4. Defence Mechanisms for Adversarial Robustness
To enhance the robustness of the TB screening models against adversarial perturbations, two complementary defence strategies were implemented:
- Adversarial Training (AT): AT was adopted as a foundational defence mechanism and as a benchmark for evaluating alternative robustness strategies. Using the Adversarial Robustness Toolbox library [40], the model was iteratively trained with a mixture of clean and adversarially perturbed samples. Specifically, adversarial examples constituted 30% of the training data to balance robustness improvements with feature-space stability and prevent excessive drift from clinically relevant image representations. This process ensures the model is continuously exposed to new adversarial examples during training, allowing it to learn more invariant and resilient decision boundaries. By integrating adversarial examples directly into the optimization process, the model becomes better equipped to recognize and mitigate subtle perturbations that could otherwise lead to misclassification. As a result, AT serves as a strong baseline defence [18], improving overall robustness while maintaining diagnostic accuracy across diverse CXR inputs. In this study, two variants of AT are implemented. The first one, employs PGD as the method to generate the adversarial images for training (AT-PGD) [41]. The second variant, Tradeoff-inspired Adversarial Defense via Surrogate-loss minimization (TRADES) [42], introduces a theoretically grounded trade-off between natural accuracy and robustness. TRADES decomposes the objective into a natural classification loss on clean samples and a robustness regularization term that penalizes the divergence between predictions on clean and adversarial inputs, thus it allows more stable optimization and mitigates excessive degradation of clean performance compared to the basic PGD-based AT [42].
- Multivariate Gaussian Model (MGM): To complement AT, an MGM was employed following the methodology outlined in Li et al. [17]. MGM operates as a post hoc detection mechanism that models the distribution of high-level features extracted from the final layer of the CNN. During training, these features are fitted to a Gaussian distribution characterized by a mean vector and covariance matrix. At inference time, MGM computes the log-likelihood or Mahalanobis distance of each input’s feature vector relative to the learned distribution. Samples that deviate significantly from the distribution of clean images are flagged as potential adversarial inputs. By thresholding the log-likelihood score, the model can selectively ignore or reject inputs suspected of being adversarial, thereby reducing the risk of incorrect predictions.
To integrate MGM with transformer-based backbones such as DINO, we extracted fixed-dimensional, L2-normalized embeddings from the backbone network rather than from task-specific classification heads. The backbone was wrapped to provide a single embedding from the DINO block or a pooled token representation, ensuring that only pure feature representations were used for Gaussian modelling. For general attention-based architectures, e.g., vision transformer (ViT) [32] and data-efficient image transformers (DeiT), global average pooling of spatial features followed by L2 normalization was applied to produce consistent embeddings. This approach yields a uniform feature representation across architectures, enabling reliable MGM fitting and scoring based on Mahalanobis distance without requiring model retraining. It also enhances feature stability and improves the compatibility of MGM with transformer-style models. Collectively, these two defence mechanisms, i.e., AT and MGM, offer a robust, flexible defence framework capable of mitigating adversarial risks in TB screening systems while maintaining clinical interpretability and scalability.
4. Results
4.1. Effect of Region-of-Interest Isolation
Figure 2 depicts the F1 score and loss curves across training, validation, and test datasets for the ResNet50 model trained both with and without lung segmentation on the highly imbalanced dataset. The results indicate that applying lung segmentation markedly improves model performance and stability. Specifically, the segmented model achieves higher F1 scores across all dataset splits, reflecting better precision–recall balance and enhanced generalization to unseen samples. Correspondingly, the loss curves generally show faster convergence and lower final loss values compared to the unsegmented model, suggesting that segmentation effectively reduces irrelevant background noise and enables the network to focus on diagnostically meaningful pulmonary features.
The confusion matrices presented in Figure 3 illustrate the effect of lung segmentation on class-wise prediction performance across healthy, TB, and COVID-19 categories. For the segmented model, correct predictions are strongly concentrated along the diagonal, indicating high classification fidelity. Specifically, the model accurately identifies 1151 healthy, 423 TB, and 2109 COVID-19 cases, with only minor misclassifications; 6 healthy samples were predicted as TB and 3 as COVID-19, while 11 TB cases were incorrectly labelled as healthy. By contrast, the non-segmented model exhibits a noticeably higher degree of cross-class confusion. The number of healthy samples misclassified as COVID-19 increased sharply from 3 to 41, and TB samples mislabeled as COVID-19 rose from 6 to 19, suggesting that the lack of segmentation introduces spurious correlations between global image features and disease patterns. Although COVID-19 detection remains relatively strong in both settings, segmentation substantially reduces false positives and false negatives for the healthy and TB classes, leading to more reliable diagnostic separation. These results demonstrate that segmentation enhances the model’s focus on disease-relevant lung regions, effectively suppressing background noise and non-diagnostic features. Overall, the segmented model demonstrated clearer class boundaries and fewer off-diagonal errors, consistent with the improved F1 scores and loss reductions observed during training and validation (see Figure 2).
4.2. Pre-Attack Performace Analysis
This section presents the baseline multiclass classification performance of all backbone models before the application of adversarial attacks. The results summarize each model’s accuracy, F1 score, and Area Under the Receiver Operating Characteristic Curve (AUC-ROC), establishing their initial predictive capabilities on both the highly unbalanced and moderately unbalanced datasets. These metrics serve as benchmarks for subsequent evaluation of adversarial robustness and defence effectiveness across different architectures.
As shown in Table 5, all backbone models demonstrated strong baseline classification performance on the highly unbalanced test set, achieving accuracies above 0.96 and AUC-ROC values exceeding 0.99. DISTL model delivered the highest overall accuracy (0.988) and F1 score (0.992), reflecting its ability to effectively leverage both labelled and unlabeled data through self-supervised representation learning. The MobileNet architecture attained the highest AUC-ROC (0.999), indicating exceptional discriminative capability and robustness to class imbalance. Traditional convolutional backbones such as DenseNet121 and ResNet50 also performed competitively, achieving accuracies of 0.976 and 0.967, respectively, with AUC-ROC values reaching 0.998. These results confirm the reliability of CNN-based models in capturing fine-grained spatial features relevant to tuberculosis detection. Meanwhile, transformer-based architectures, i.e., DeiT and ViT, achieved accuracies of 0.982 and 0.962, and AUC-ROC values of 0.997 and 0.995, respectively. Although slightly trailing CNNs in raw accuracy, their strong AUC-ROC scores demonstrate effective global contextual modelling across lung regions, enabling consistent performance even under severe class imbalance.
Performance on the moderately unbalanced dataset (see Table 6) reveals more nuanced differences among architectures. Here, the overall accuracy and F1 scores slightly decreased compared to the highly unbalanced dataset, reflecting different characteristics in the highly and moderately unbalanced datasets. Nevertheless, the moderately unbalanced dataset yields more balanced class sensitivity and greater diagnostic reliability, since the elevated performance on the highly unbalanced dataset can largely be attributed to bias toward the majority class and a lack of equitable representation among minority categories. DeiT achieved the highest accuracy (0.952) and AUC-ROC (0.995), followed closely by ResNet50 (0.949) and MobileNet (0.943), demonstrating that transformer-based and CNN-based architectures can perform comparably under moderately unbalanced conditions. The DISTL model recorded slightly lower metrics (accuracy=0.936, F1=0.936, AUC-ROC=0.989), which is expected given its self-supervised pretraining approach that prioritizes feature generalization over supervised optimization. Nevertheless, its competitive performance suggests that self-supervised representations may remain valuable for downstream TB classification tasks. Overall, the baseline results confirm that all tested architectures are highly proficient in detecting TB from CXR images. The strong AUC-ROC values across both datasets indicate reliable discrimination between positive and negative cases. These findings establish a solid foundation for subsequent experiments, where the same models are subjected to adversarial perturbations to assess how their robustness and generalization hold under attack.
4.3. Comparative Analysis of Model Robustness to Adversarial Perturbations
This section presents the classification performance of all models when subjected to four adversarial attack types—FGSM, PGD, BIM, and MIM—under both white-box and black-box conditions, without any defensive mechanisms applied. The results reveal substantial degradation in model performance across all architectures, underscoring the susceptibility of deep neural networks to adversarial perturbations in medical imaging tasks.
On the highly unbalanced dataset, all models experienced pronounced performance drops (see Table 7) compared to their clean baselines (Table 5). DenseNet121 exhibited moderate resilience, maintaining F1 scores between 0.42 and 0.47 under white-box attacks and slightly higher under black-box conditions. This may suggest that CNNs, while not inherently robust, retain some stability due to their localized feature extraction and inductive biases. In contrast, transformer-based models (ViT Base and DeiT) showed severe degradation, particularly under FGSM and PGD attacks, with F1 scores falling as low as 0.07 and accuracy dropping below 0.25. These results indicate that self-attention mechanisms, which rely on global context, might be more easily disrupted by pixel-level perturbations that distort fine spatial relationships. Interestingly, the MobileNet architecture demonstrated consistent but relatively low performance across attack types, suggesting that lightweight models may also trade robustness for computational efficiency. A comparison between white-box and black-box attacks revealed that transfer-based (especially DeiT) black-box attacks generally cause slightly less damage, with small improvements in F1 and AUC values across most models. This aligns with expectations, as black-box perturbations are crafted using surrogate networks and may not perfectly align with the target model’s decision boundaries. Nonetheless, the persistence of high vulnerability even under black-box conditions highlights the practical threat that adversarial examples pose in real-world screening and triage settings, where attackers may not have full model access.
On the moderately unbalanced dataset (see Table 8), similar patterns emerged but with some notable variations. The ResNet50 and ViT Base architectures demonstrated comparatively stronger performance under certain attack types, with F1 scores reaching 0.697 (ResNet50, BIM white-box) and 0.631 (ViT Base, BIM black-box). This may suggest that a slightly more balanced class distribution can marginally improve model robustness by preventing bias toward dominant classes and stabilizing feature representation. However, the overall decline in AUC values indicates significant disruption of the models’ discriminative capacity. MobileNet showed steady but moderate performance. The DISTL model, despite leveraging self-supervised learning, performed inconsistently, achieving relatively high resilience under MIM and PGD attacks but poor results under FGSM, suggesting that its learned representations are not yet optimized for adversarial robustness.
Collectively, these findings confirm that none of the evaluated architectures maintain acceptable diagnostic performance under adversarial pressure, with F1 scores and accuracies often collapsing by over 50% relative to clean baselines. The results emphasize the inherent fragility of deep learning models in medical imaging when exposed to even minor input perturbations and highlight the need for explicit defence mechanisms. Moreover, the consistent vulnerability across both white-box and black-box scenarios demonstrates that adversarial robustness cannot be assumed from high clean-data accuracy alone, a critical insight for deploying AI systems in safety-critical healthcare applications.
4.4. Comparative Evaluation of Defence Mechanisms
Table 9 presents a comparative evaluation of the robustness of three defence strategies, i.e., MGM, AT-PGD, and TRADES, under both white-box and black-box attack scenarios on the unbalanced dataset, using a ResNet50 backbone. Across all four white-box attacks (FGSM, PGD, BIM, and MIM), the MGM defence consistently achieved outstanding robustness, with F1 score, accuracy, and AUC values all reaching 0.969, 0.969, and 0.998, respectively. Remarkably, the same level of performance was maintained under black-box conditions, suggesting that MGM provides architecture-independent protection and effectively mitigates adversarial perturbations regardless of attack type or source model. In contrast, both AT-PGD and TRADES exhibited lower robustness across attack settings. Under white-box conditions, AT-PGD reported F1 scores between 0.370 and 0.385, accuracy ranging from 0.389 to 0.405, and AUC values between 0.459 and 0.505, reflecting limited resistance to direct attacks. Under black-box scenarios, AT-PGD showed only marginal improvement, with F1 scores between 0.378 and 0.396, accuracy from 0.418 to 0.428, and AUC values between 0.430 and 0.487. Similarly, TRADES achieved white-box F1 scores between 0.399 and 0.423, accuracy ranging from 0.390 to 0.422, and AUC values between 0.467 and 0.507, while its black-box performance remained modest, with F1 scores ranging from 0.410 to 0.440, accuracy between 0.427 and 0.450, and AUC values from 0.436 to 0.507. These findings demonstrate that the MGM defence markedly outperforms adversarial training-based approaches in both attack settings. Its consistent stability across all metrics highlights its potential as a lightweight defence mechanism capable of preserving diagnostic accuracy under adversarial perturbations, a critical property for reliable and secure deployment of AI-based tuberculosis screening systems.
Table 10 summarizes the robustness performance of the MGM defence across six backbone architectures, ResNet50, DenseNet121, MobileNet, ViT Base, DeiT, and DISTL, evaluated on the unbalanced dataset under both white-box and black-box adversarial attack conditions. For each combination of model and attack type (FGSM, PGD, BIM, and MIM), three key evaluation metrics are reported: F1-score, AUC, and accuracy. These metrics are presented separately for white-box and black-box scenarios, enabling direct comparison of model robustness when the adversary possesses full internal knowledge of the target model versus limited external access. The table demonstrates that MGM consistently preserves high performance across architectures and attack types, with minimal deviation between white-box and black-box settings, indicating strong generalization and attack invariance. Models such as DenseNet121 and ResNet50 achieved near-perfect robustness (AUC , F1 ), while transformer-based architectures (ViT Base and DeiT) and the self-supervised DISTL model also maintained high diagnostic reliability under adversarial conditions. These results highlight MGM’s effectiveness as a universal defence mechanism, capable of sustaining diagnostic accuracy and minimizing classification errors even in the presence of adversarial perturbations.
Table 11 presents the performance of MGM defence across multiple backbone architectures on the moderately imbalanced dataset. In this configuration, the class distributions are much more balanced compared to the highly unbalanced dataset to assess whether dataset imbalance influences adversarial robustness and overall diagnostic reliability. The table reports results under both white-box and black-box adversarial attack settings (FGSM, PGD, BIM, and MIM), with three evaluation metrics (F1 score, AUC, and accuracy), summarized for each model–attack combination. All backbone models maintained high performance under adversarial conditions, with F1 scores ranging from 0.946 to 0.969 and AUC values between 0.990 and 0.998. The minimal performance variation across white-box and black-box attacks highlights MGM’s consistent resilience and attack invariance, even when trained on a balanced data distribution. These findings confirm that while absolute performance values are slightly lower in some cases than those obtained on the unbalanced dataset, the balanced configuration yields improved class sensitivity and fairness, reducing the influence of majority-class bias. Overall, MGM continues to provide robust protection against adversarial perturbations across all tested architectures, demonstrating its effectiveness as a generalizable defence strategy for medical image classification tasks under varying data distributions.
5. Discussion
5.1. Impact of Lung Segmentation on Model Performance
Incorporating a lung segmentation step that crops each image to the lung region substantially improved the classification performance. As reported in Table 5 and Table 6, all models exhibited strong baseline performance, particularly on the highly unbalanced dataset. On the moderately unbalanced dataset, segmentation continued to yield consistent gains. The confusion matrices in Figure 3 highlight these improvements, showing reduced misclassification across all classes, particularly between healthy and TB categories. Fewer off-diagonal errors indicate improved class separation and enhanced generalization. Overall, segmentation provided a more stable foundation for subsequent robustness evaluations by emphasizing diagnostically relevant lung features.
5.2. Vulnerability of Models to Adversarial Perturbations
All architectures exhibited pronounced vulnerability to adversarial attacks when no defence mechanisms were applied. Adversarial perturbations are often imperceptible, yet as shown in Table 4, they caused severe misclassification, for instance, a TB image being predicted as healthy with 100% confidence. Such behaviour is particularly alarming in medical contexts, where diagnostic reliability is critical. Across both white-box and black-box settings, models experienced substantial degradation. On the highly unbalanced dataset, convolutional backbones dropped to F1 scores between 0.37 and 0.42, with corresponding AUC values around 0.50. Transformer-based models achieved slightly higher robustness (F1 up to 0.43), while DISTL exhibited moderate stability (F1 0.35–0.45). These results may suggest that attention mechanisms provide only marginal resilience and that class imbalance may amplify vulnerability by skewing decision boundaries toward dominant categories. For the moderately balanced dataset, degradation patterns were similar, though less severe. Convolutional models reached F1 scores between 0.35 and 0.46, and transformers achieved F1 scores between 0.46 and 0.52, confirming that balancing mitigates bias but does not eliminate susceptibility. Multi-step attacks such as PGD, BIM, and MIM consistently induced greater degradation than FGSM, reflecting their iterative optimization process that better exploits model weaknesses.
5.3. Comparative Evaluation of Defence Strategies
To address these vulnerabilities, three defence mechanisms were evaluated: AT-PGD, TRADES, and MGM. Adversarial training approaches provided limited protection. AT-PGD achieved F1 scores between 0.37 and 0.39, with AUC values between 0.43 and 0.50, while TRADES offered marginal improvement (F1 ≈0.40–0.42, AUC ≈0.50). Both approaches suffered from the well-documented trade-off between robustness and clean-image accuracy, as adversarial training tends to overfit to specific perturbation types and diminish general diagnostic performance [43]. In contrast, the MGM defence demonstrated substantial resilience. On the highly unbalanced dataset, MGM achieved an average F1 score of over 0.96 and AUC-ROC approaching 1.0, maintaining near-identical performance under both white-box and black-box attacks. ResNet50, for example, retained F1=0.969 and AUC=0.998 under PGD and MIM, while DenseNet121 achieved F1=0.984 and AUC=0.999. These results represent a recovery of over 60–70% of the performance lost under attack. Although some architectures, such as MobileNet, regained less (F1 ≈0.77 under BIM), the overall trend confirmed that MGM prevents catastrophic collapse in adversarial settings. Importantly, MGM operates outside the training loop, filtering inputs based on probabilistic feature distributions rather than gradient manipulation, making it computationally efficient and easy to integrate into existing diagnostic pipelines. Performance on the more balanced dataset mirrored that of the unbalanced configuration, with deviations below three percentage points across F1, and AUC metrics. ResNet50 maintained identical robustness (F1=0.969, AUC=0.998, ACC=0.969 under PGD), confirming that class rebalancing had a negligible influence when MGM was applied. Furthermore, architectures that initially exhibited lower resilience, e.g., DeiT, which recorded F1=0.876 and AUC=0.919 under BIM on the unbalanced dataset, regained stability in the more balanced configuration, exceeding F1=0.900 across all attacks. This consistency across datasets demonstrates MGM’s invariance to class distribution shifts, a crucial property given that class imbalance is inherent in medical datasets due to the rarity of certain conditions. MGM also generalized effectively to non-convolutional architectures. The DISTL model, despite its self-supervised transformer design, achieved F1=0.864, AUC=0.954, and ACC=0.857 under PGD and BIM attacks, recovering approximately 40–50% of lost performance relative to undefended baselines.
5.4. Mechanistic Insights into MGM’s Stability
The near-identical results across different attacks and datasets can be attributed to the evaluation mechanism of the MGM framework. MGM filters inputs based on their likelihood under a modelled Gaussian feature distribution, allowing only clean or high-confidence samples to proceed to classification. Consequently, performance metrics reflect this subset of images that pass the filter, leading to convergence across attack types. This behaviour indicates not insensitivity to perturbations, but rather the stability of the probabilistic filtering process, which effectively rejects adversarially corrupted samples before inference.
5.5. Implications for Medical AI Deployment
Across all architectures and attack types, MGM restored an average of 68.3% of lost performance, effectively closing the gap between clean and adversarial conditions while maintaining diagnostic-level accuracy. Its training-independent design minimizes computational overhead, making it highly practical for real-world medical imaging systems where model retraining may be infeasible. By combining high fidelity and computational efficiency, MGM represents a promising defence paradigm for safety-critical medical AI applications. Future work may extend this approach to other imaging modalities and explore hybrid frameworks that integrate probabilistic filtering with active adversarial adaptation to further enhance robustness and transparency.
6. Conclusions and Limitaions
This study systematically evaluated the impact of adversarial attacks on deep learning models for TB screening and assessed the effectiveness of defence mechanisms. The results demonstrate that while current AI models achieve high diagnostic accuracy under clean conditions, their performance can degrade drastically when exposed to adversarial perturbations. Such vulnerabilities pose significant risks to clinical reliability, especially in resource-limited regions where AI-assisted screening has the potential to improve access to diagnostic services and reduce the burden on healthcare systems.
The introduction of the MGM defence framework proved highly effective in restoring diagnostic performance under both white-box and black-box attack scenarios. MGM achieved strong robustness, architecture generalization, and computational efficiency, making it well-suited for real-world medical imaging applications. Our findings highlight that robust, interpretable, and lightweight defence mechanisms are essential to ensure trustworthy deployment of AI systems in critical healthcare environments.
Several limitations must be acknowledged. First, the evaluation was conducted on a specific set of chest X-ray datasets, which may not fully capture the diversity of global populations, imaging equipment, and clinical conditions. Differences in acquisition protocols, disease prevalence, and demographic variability could influence model behaviour and robustness. Second, while MGM demonstrated strong resilience to the attacks tested, the study did not explore adaptive adversaries or domain-specific black-box scenarios that may arise in real-world clinical settings. Third, the analysis focused primarily on classification tasks; extending evaluation to multi-modal imaging would provide a more comprehensive understanding of adversarial vulnerabilities across diagnostic modalities. Future work will therefore focus on expanding robustness evaluation across larger and more heterogeneous datasets, representing diverse populations and imaging systems. Collaborative research with healthcare institutions will also be pursued to assess operational feasibility and clinical trustworthiness in deployment scenarios.
Ultimately, this study underscores the critical importance of adversarial robustness as a prerequisite for safe and reliable medical AI. By developing scalable and transparent defence strategies, future diagnostic models can achieve not only high performance but also the resilience and interpretability necessary for ethical and dependable clinical decision support.
Author Contributions
Conceptualization, A.E. and A.W.; methodology, W.L. and A.E.; validation, W.L., A.W. and A.E.; formal analysis, W.L.; investigation, W.L. and A.E.; resources, A.E. and A.W.; data curation, W.L.; writing—original draft preparation, W.L. and A.E.; writing—review and editing, W.L., A.W. and A.E.; visualization, W.L.; supervision, A.E.; funding acquisition, A.W. and A.E. All authors have read and agreed to the published version of the manuscript.
Funding
This research was funded by the New Beginnings program of the National Research Council of Canada.
Institutional Review Board Statement
Not applicable. The data used in this study were obtained from publicly available sources and were not collected by the authors; therefore, no direct interaction with human participants occurred. Details about the data sources and collection procedures are provided in Section 3.1.
Informed Consent Statement
Not applicable. Informed consent was not required for this study, as the analysis used previously collected data from publicly available sources and did not involve direct interaction with human participants. Details about the datasets are provided in Section 3.1.
Data Availability Statement
All datasets used in this study are publicly available. Please refer to Section 3.1. for more details.
Conflicts of Interest
The authors declare no conflicts of interest.
References
- Wong, A.; Lee, J.R.H.; Rahmat-Khah, H.; Sabri, A.; Alaref, A.; Liu, H. TB-Net: a tailored, self-attention deep convolutional neural network design for detection of tuberculosis cases from chest X-ray images. Frontiers in Artificial Intelligence 2022, 5. [CrossRef]
- Patel, N.; Wong, A.; Ebadi, A. Empowering Tuberculosis Screening with Explainable Self-Supervised Deep Neural Networks. In Proceedings of the 2024 IEEE International Conference on Machine Learning and Applications (ICMLA). IEEE, 2024, pp. 794–797.
- Patel, N.; Wong, A.; Ebadi, A. An Explainable Hybrid AI Framework for Enhanced Tuberculosis and Symptom Detection. arXiv 2025. arXiv:2510.18819. [CrossRef]
- Organization, W.H. Global Tuberculosis Report 2023. World Health Organization, ISBN 978-92-4-008385-1 2023.
- Nations, U. Sustainable Development Goals. New York: United Nations, Available at https://sdgs.un.org/ 2022.
- Emery, J.C.; Richards, A.S.; Dale, K.D.; McQuaid, C.F.; White, R.G.; Denholm, J.T.; Houben, R.M. Self-clearance of Mycobacterium tuberculosis infection: implications for lifetime risk and population at-risk of tuberculosis disease. Proceedings of the Royal Society B, vol. 288, pp. 20201635 2021. [CrossRef]
- Tiemersma, E.W.; van der Werf, M.J.; Borgdorff, M.W.; Williams, B.G.; Nagelkerke, N.J. Natural history of tuberculosis: duration and fatality of untreated pulmonary tuberculosis in HIV negative patients: a systematic review. PloS one, vol. 6, pp. e17601 2011. [CrossRef] [PubMed]
- Balakrishna, S.; Solanki, V.K. A comprehensive review on ai-driven healthcare transformation. Ingeniería Solidaria 2024, 20. [CrossRef]
- Esteva, A.; Chou, K.; Yeung, S.; Naik, N.; Madani, A.; Mottaghi, A.; Liu, Y.; Topol, E.; Dean, J.; Socher, R. Deep learning-enabled medical computer vision. NPJ digital medicine 2021, 4. [CrossRef] [PubMed]
- Tavanapong, W.; Oh, J.; Riegler, M.A.; Khaleel, M.; Mittal, B.; De Groen, P.C. Artificial intelligence for colonoscopy: past, present, and future. IEEE journal of biomedical and health informatics 2022, 26. [CrossRef]
- Yadav, S.S.; Jadhav, S.M. Deep convolutional neural network based medical image classification for disease diagnosis. Journal of Big data 2019, 6. [CrossRef]
- Shamshad, F.; Khan, S.; Zamir, S.W.; Khan, M.H.; Hayat, M.; Khan, F.S.; Fu, H. Transformers in medical imaging: A survey. Medical Image Analysis 2023, 88, 102802. [CrossRef]
- Kumar, R.R.; Priyadarshi, R. Denoising and segmentation in medical image analysis: A comprehensive review on machine learning and deep learning approaches. Multimedia Tools and Applications 2025, 84, 10817–10875. [CrossRef]
- Yao, W.; Bai, J.; Liao, W.; Chen, Y.; Liu, M.; Xie, Y. From cnn to transformer: A review of medical image segmentation models. Journal of Imaging Informatics in Medicine 2024. [CrossRef]
- Finlayson, S.G.; Bowers, J.D.; Ito, J.; Zittrain, J.L.; Beam, A.L.; Kohane, I.S. Adversarial attacks on medical machine learning. Science 2019, 363. [CrossRef]
- Dong, J.; Chen, J.; Xie, X.; Lai, J.; Chen, H. Adversarial attack and defense for medical image analysis: Methods and applications. arXiv 2023. arXiv:2303.14133.
- Li, X.; Zhu, D. Robust detection of adversarial attacks on medical images. In Proceedings of the 2020 IEEE 17th International Symposium on Biomedical Imaging (ISBI). IEEE, 2020.
- Bai, T.; Luo, J.; Zhao, J.; Wen, B.; Wang, Q. Recent advances in adversarial training for adversarial robustness. arXiv 2021. arXiv:2102.01356. [CrossRef]
- Dong, J.; Chen, J.; Xie, X.; Lai, J.; Chen, H. Survey on adversarial attack and defense for medical image analysis: Methods and challenges. ACM Computing Surveys 2024, 57, 1–38. [CrossRef]
- Nie, W.; Guo, B.; Huang, Y.; Xiao, C.; Vahdat, A.; Anandkumar, A. Diffusion Models for Adversarial Purification. In Proceedings of the International Conference on Machine Learning (ICML), 2022.
- Meng, D.; Chen, H. MagNet: A Two-Pronged Defense against Adversarial Examples. In Proceedings of the ACM Conference on Computer and Communications Security (CCS), 2017, pp. 135–147.
- Jaeger, S.; Candemir, S.; Antani, S.; Wáng, Y.X.; Lu, P.X.; Thoma, G. Two public chest X-ray datasets for computer-aided screening of pulmonary diseases. Quantitative Imaging in Medicine and Surgery 2014, 4, 475–477. [CrossRef]
- Krizhevsky, A.; Hinton, G.; et al. Learning multiple layers of features from tiny images 2009.
- Rahman, T.; Rahman, M.M.; Zubair, S.; Islam, K.M.R.; Karim, A. Reliable Tuberculosis Detection Using Chest X-Ray With Deep Learning, Segmentation and Visualization. IEEE Access 2020, 8. [CrossRef]
- Portals, N.T. TB Portals. https://tbportals.niaid.nih.gov. Accessed: Aug. 23, 2025.
- Liu, Y.; Wu, Y.H.; Zhang, S.C.; Liu, L.; Wu, M.; Cheng, M.M. Revisiting computer-aided tuberculosis diagnosis. IEEE transactions on pattern analysis and machine intelligence 2023, 46, 2316–2332. [CrossRef] [PubMed]
- Wang, L.; Lin, Z.Q.; Wong, A. COVID-Net: a tailored deep convolutional neural network design for detection of COVID-19 cases from chest X-ray images. Scientific Reports 2020, 10, 19549. [CrossRef]
- Ronneberger, O.; Fischer, P.; Brox, T. U-Net: Convolutional Networks for Biomedical Image Segmentation, 2015. [CrossRef]
- He, K.; Zhang, X.; Ren, S.; Sun, J. Deep residual learning for image recognition. In Proceedings of the Proceedings of the IEEE conference on computer vision and pattern recognition, 2016.
- Huang, G.; Liu, Z.; Van Der Maaten, L.; Weinberger, K.Q. Densely connected convolutional networks. In Proceedings of the Proceedings of the IEEE conference on computer vision and pattern recognition, 2017.
- Howard, A.; Sandler, M.; Chu, G.; Chen, L.C.; Chen, B.; Tan, M.; Wang, W.; Zhu, Y.; Pang, R.; Vasudevan, V.; et al. Searching for MobileNetV3. In Proceedings of the Proceedings of the IEEE/CVF International Conference on Computer Vision (ICCV), 2019, pp. 1314–1324.
- Dosovitskiy, A.; Beyer, L.; Kolesnikov, A.; Weissenborn, D.; Zhai, X.; Unterthiner, T.; Dehghani, M.; Minderer, M.; Heigold, G.; Gelly, S.; et al. An Image is Worth 16x16 Words: Transformers for Image Recognition at Scale. In Proceedings of the International Conference on Learning Representations (ICLR), 2021.
- Touvron, H.; Cord, M.; Douze, M.; Massa, F.; Sablayrolles, A.; Jégou, H. Training Data-Efficient Image Transformers and Distillation through Attention. In Proceedings of the International Conference on Machine Learning (ICML), 2021, pp. 10347–10357.
- Caron, M.; Touvron, H.; Misra, I.; Jégou, H.; Mairal, J.; Bojanowski, P.; Joulin, A. Emerging Properties in Self-Supervised Vision Transformers, 2021, [arXiv:cs.CV/2104.14294].
- Park, S.; Kim, G.; Oh, Y.; Seo, J.B.; Lee, S.M.; Kim, J.H.; Moon, S.; Lim, J.K.; Park, C.M.; Ye, J.C. Self-evolving vision transformer for chest X-ray diagnosis through knowledge distillation. Nature communications 2022, 13, 3848. [CrossRef] [PubMed]
- Caron, M.; Touvron, H.; Misra, I.; Jégou, H.; Mairal, J.; Bojanowski, P.; Joulin, A. Emerging properties in self-supervised vision transformers. In Proceedings of the Proceedings of the IEEE/CVF international conference on computer vision, 2021, pp. 9650–9660.
- Goodfellow, I.J.; Shlens, J.; Szegedy, C. Explaining and harnessing adversarial examples. arXiv preprint arXiv:1412.6572 2014.
- Mądry, A.; Makelov, A.; Schmidt, L.; Tsipras, D.; Vladu, A. Towards deep learning models resistant to adversarial attacks. stat 2017, 1050.
- Dong, Y.; Liao, F.; Pang, T.; Su, H.; Zhu, J.; Hu, X.; Li, J. Boosting adversarial attacks with momentum. In Proceedings of the Proceedings of the IEEE conference on computer vision and pattern recognition, 2018.
- Nicolae, M.I.; Sinn, M.; Tran, M.N.; Buesser, B.; Rawat, A.; Wistuba, M.; Zantedeschi, V.; Baracaldo, N.; Chen, B.; Ludwig, H.; et al. Adversarial Robustness Toolbox v1.0.0, 2019. [CrossRef]
- Madry, A.; Makelov, A.; Schmidt, L.; Tsipras, D.; Vladu, A. Towards Deep Learning Models Resistant to Adversarial Attacks. In Proceedings of the International Conference on Learning Representations (ICLR), 2018.
- Zhang, H.; Yu, Y.; Jiao, J.; Xing, E.P.; El Ghaoui, L.; Jordan, M.I. Theoretically Principled Trade-off between Robustness and Accuracy. In Proceedings of the International Conference on Machine Learning (ICML), 2019, pp. 7472–7482.
- Han, T.; Nebelung, S.; Pedersoli, F.; Zimmermann, M.; Schulze-Hagen, M.; Ho, M.; Haarburger, C.; Kiessling, F.; Kuhl, C.; Schulz, V.; et al. Advancing diagnostic performance and clinical usability of neural networks via adversarial training and dual batch normalization. Nature communications 2021, 12, 4315. [CrossRef]
Figure 1.
Overview of the analysis for fortifying TB screening models against adversarial attacks. The diagram begins with data acquisition and preprocessing of chest X-ray images, followed by model training and evaluation under both clean and adversarial conditions. It also highlights the integration of defence mechanisms. The final stage presents the comparative performance assessment.
Figure 1.
Overview of the analysis for fortifying TB screening models against adversarial attacks. The diagram begins with data acquisition and preprocessing of chest X-ray images, followed by model training and evaluation under both clean and adversarial conditions. It also highlights the integration of defence mechanisms. The final stage presents the comparative performance assessment.
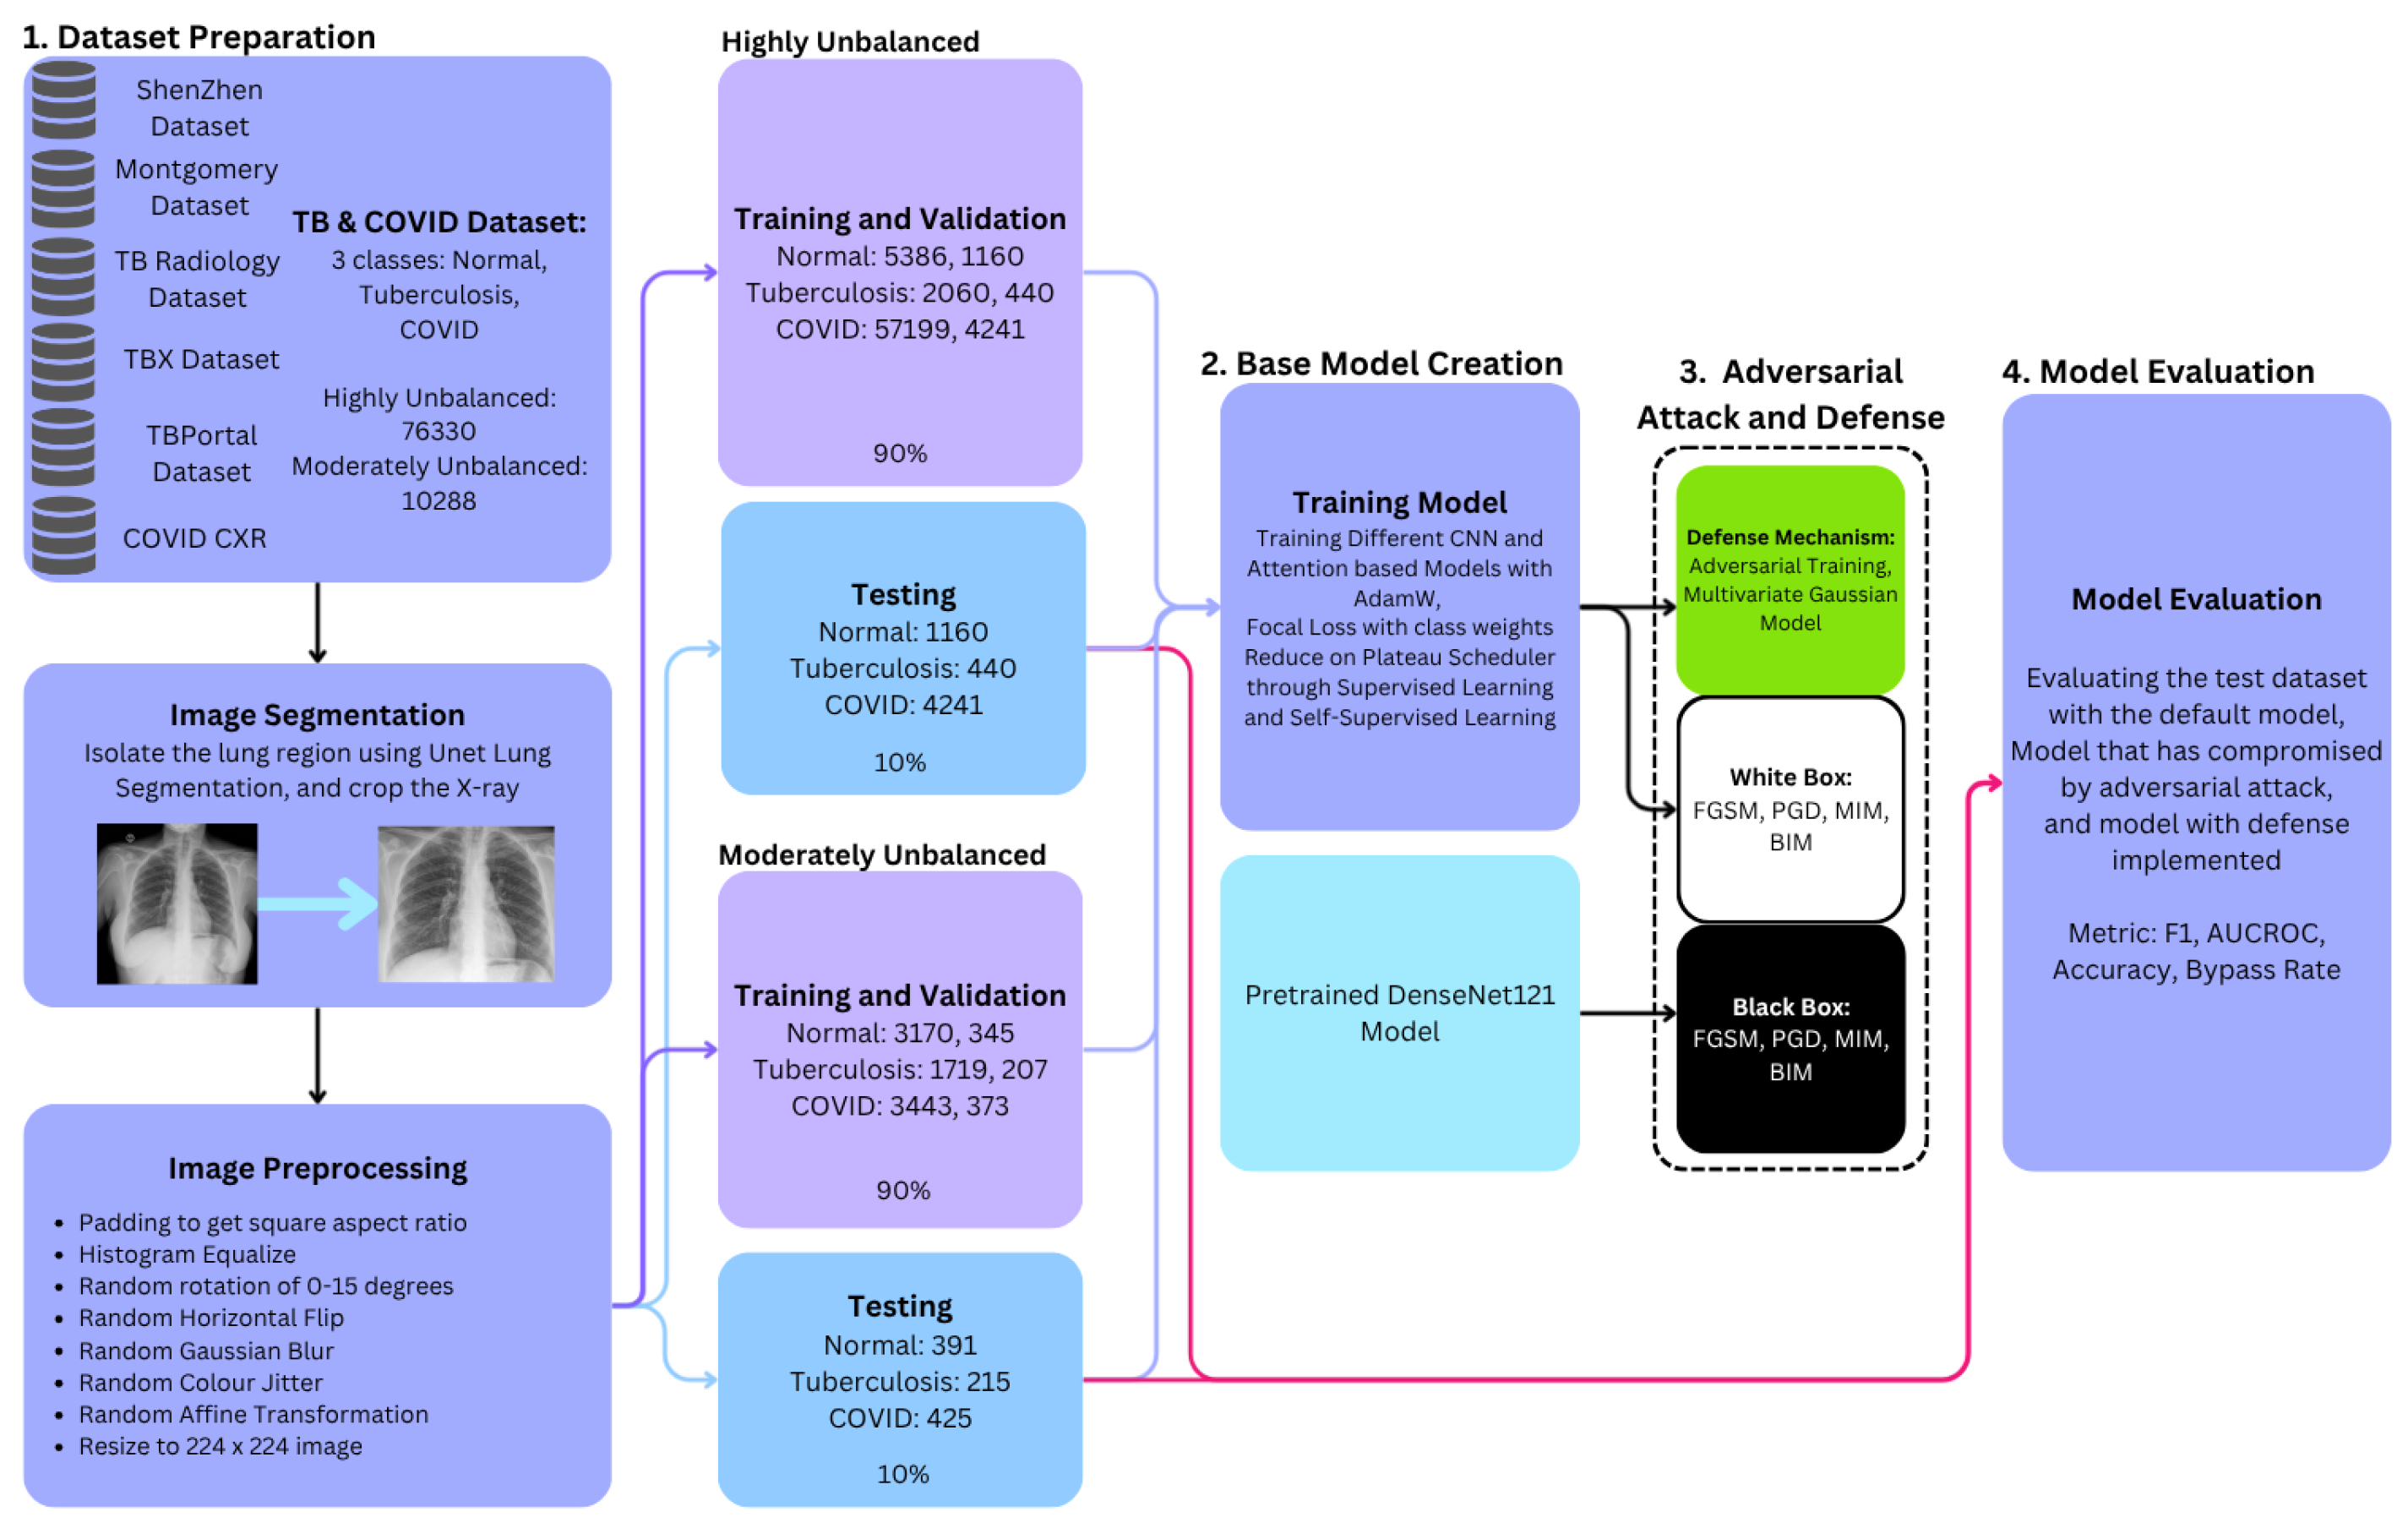
Figure 2.
Comparison of the ResNet50 model’s performance with and without lung segmentation during model training, presenting the F1 score and loss curves for training, validation, and testing datasets.
Figure 2.
Comparison of the ResNet50 model’s performance with and without lung segmentation during model training, presenting the F1 score and loss curves for training, validation, and testing datasets.
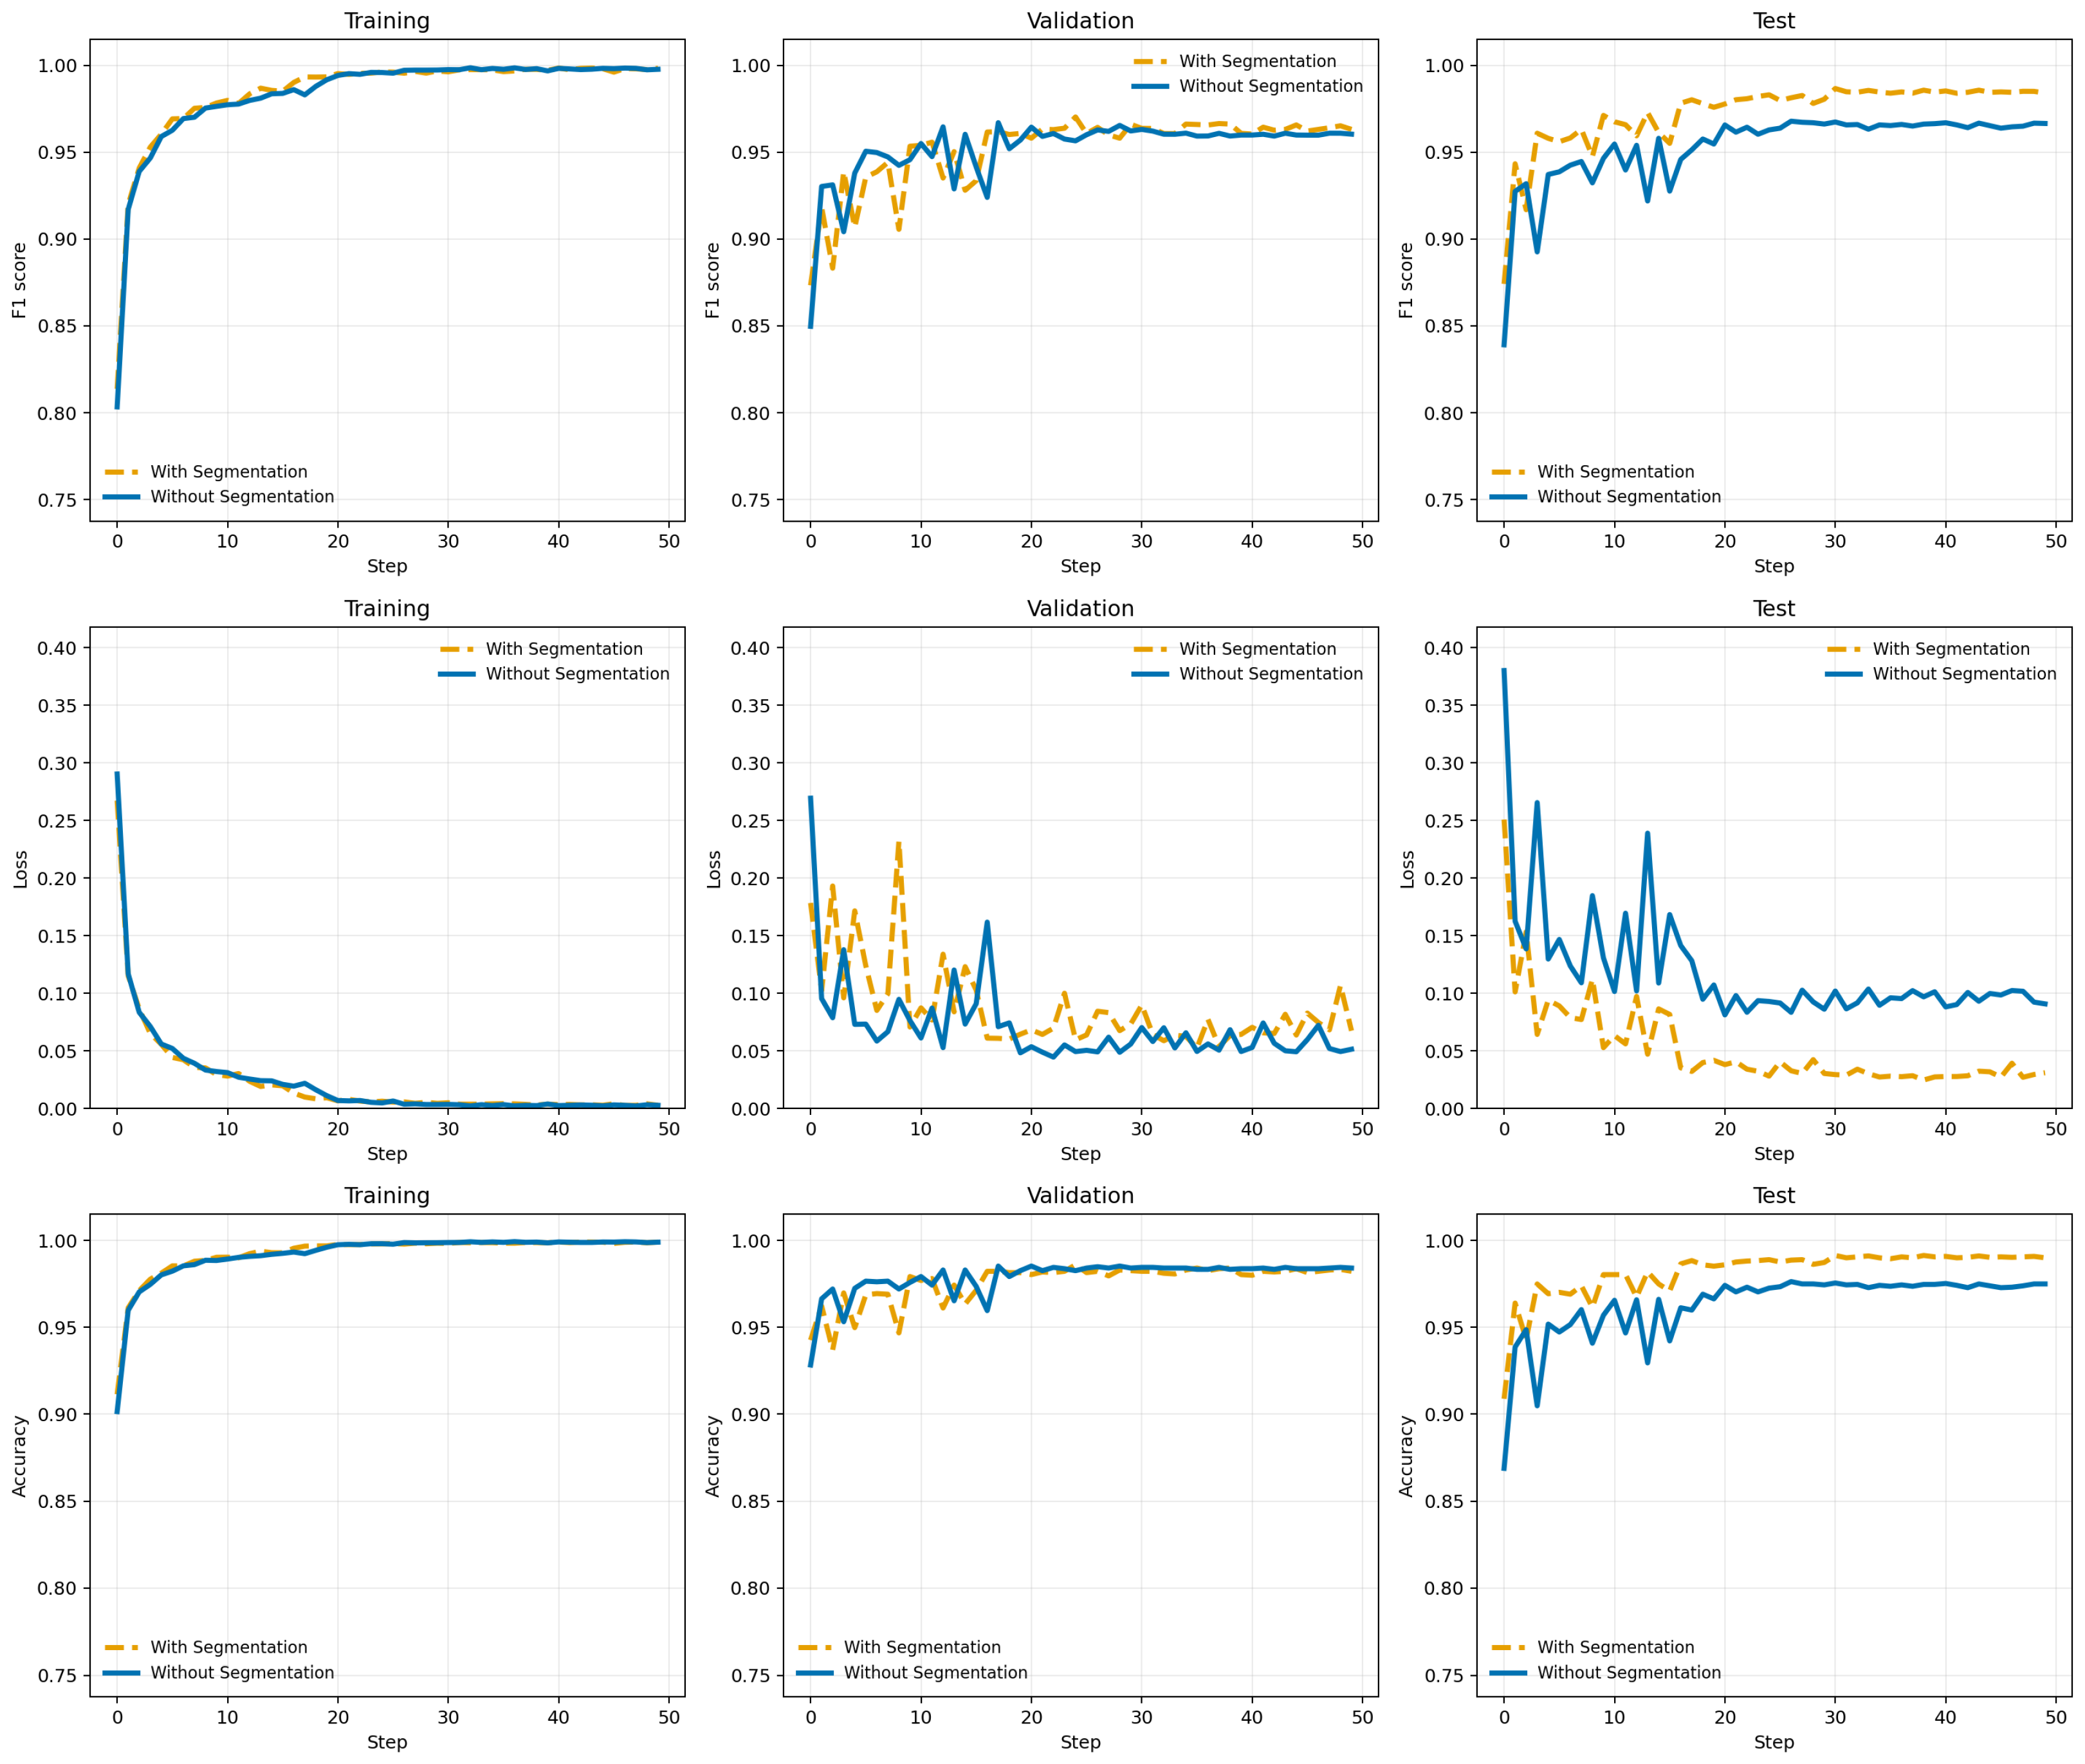
Figure 3.
Confusion matrices on the highly imbalanced test dataset using the ResNet50 model: a) model trained without lung segmentation, b) model trained with lung segmentation.
Figure 3.
Confusion matrices on the highly imbalanced test dataset using the ResNet50 model: a) model trained without lung segmentation, b) model trained with lung segmentation.
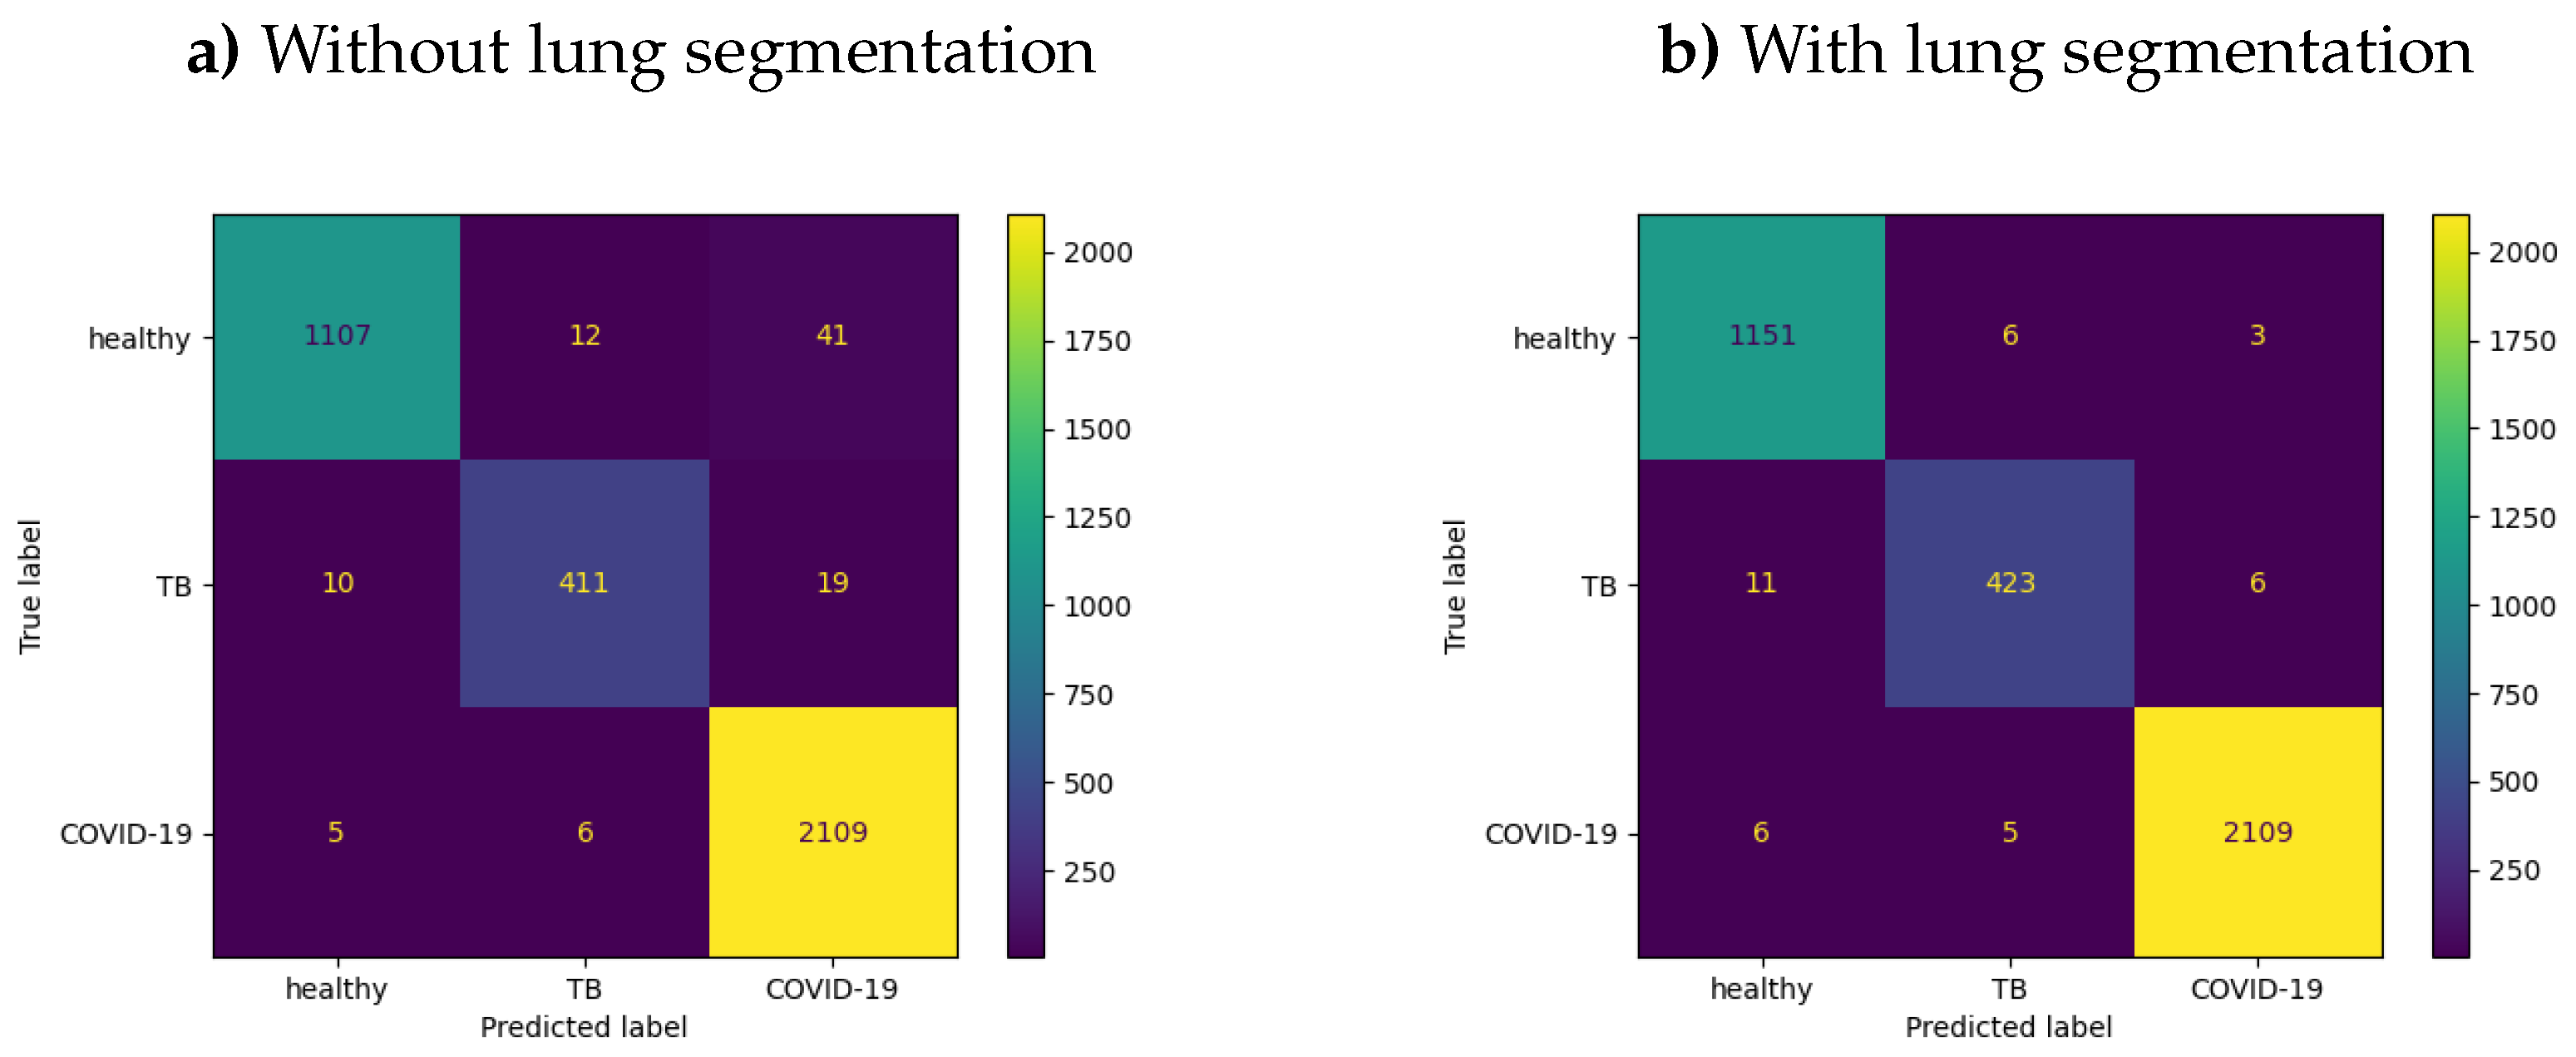

Table 1.
Class distribution of highly imbalanced chest X-ray datasets.
| Dataset | Total | Healthy | TB | COVID-19 |
|---|---|---|---|---|
| Shenzhen | 662 | 326 | 336 | 0 |
| Montgomery | 138 | 80 | 58 | 0 |
| TB Radio | 4200 | 3500 | 700 | 0 |
| TB Portals | 1049 | 0 | 1049 | 0 |
| TBX11K | 4600 | 3800 | 800 | 0 |
| COVIDx-CXR Train | 61440 | 0 | 0 | 61440 |
| Total | 76330 | 7706 | 2943 | 61440 |
Table 2.
Class distribution of moderately imbalanced chest X-ray datasets.
| Dataset | Total | Healthy | TB | COVID-19 |
|---|---|---|---|---|
| CXR Train Unlabeled | 8332 | 3170 | 1719 | 3443 |
| CXR Train Labeled | 925 | 345 | 207 | 373 |
| CXR Test | 1031 | 391 | 215 | 425 |
| Total | 10288 | 3906 | 2141 | 4241 |
Table 3.
Representative examples of original chest X-ray images and corresponding segmented outputs.
Table 3.
Representative examples of original chest X-ray images and corresponding segmented outputs.
| Normal | TB | COVID-19 | |
|---|---|---|---|
| Clean |  |
 |
 |
| Segmented | 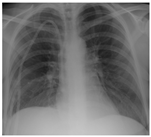 |
 |
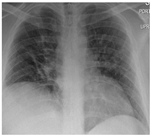 |
Table 4.
Representative examples of clean chest X-ray images and their corresponding adversarially perturbed counterparts generated under white-box and black-box attack scenarios.
Table 4.
Representative examples of clean chest X-ray images and their corresponding adversarially perturbed counterparts generated under white-box and black-box attack scenarios.
| Normal | TB | COVID-19 | |
|---|---|---|---|
| Clean | 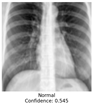 |
 |
 |
| White-box attack | 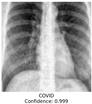 |
 |
 |
| Black-box attack | 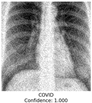 |
 |
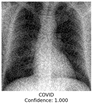 |
Table 5.
Baseline three-class classification performance of various backbone models on the highly unbalanced test set (n = 2024) before the introduction of adversarial attacks.
Table 5.
Baseline three-class classification performance of various backbone models on the highly unbalanced test set (n = 2024) before the introduction of adversarial attacks.
| Model | Accuracy | F1 Score | AUC-ROC |
|---|---|---|---|
| DenseNet121 | 0.976 | 0.976 | 0.998 |
| ViT Base | 0.962 | 0.962 | 0.995 |
| ResNet50 | 0.967 | 0.967 | 0.998 |
| MobileNet | 0.985 | 0.985 | 0.999 |
| DeiT | 0.982 | 0.982 | 0.997 |
| DISTL | 0.988 | 0.992 | 0.998 |
Table 6.
Baseline three-class classification performance of various backbone models on the moderately unbalanced test set (n = 1031) before the introduction of adversarial attacks.
Table 6.
Baseline three-class classification performance of various backbone models on the moderately unbalanced test set (n = 1031) before the introduction of adversarial attacks.
| Model | Accuracy | F1 Score | AUC-ROC |
|---|---|---|---|
| DenseNet121 | 0.938 | 0.938 | 0.993 |
| ViT Base | 0.942 | 0.942 | 0.994 |
| ResNet50 | 0.949 | 0.949 | 0.994 |
| MobileNet | 0.943 | 0.943 | 0.993 |
| DeiT | 0.952 | 0.952 | 0.995 |
| DISTL | 0.936 | 0.936 | 0.989 |
Table 7.
Classification performance of models on the highly unbalanced dataset under various adversarial attacks and without any defence mechanisms applied.
Table 7.
Classification performance of models on the highly unbalanced dataset under various adversarial attacks and without any defence mechanisms applied.
| Model | Attack | White-Box | Black-Box | ||||
|---|---|---|---|---|---|---|---|
| F1 | AUC | ACC | F1 | AUC | ACC | ||
| ResNet50 | FGSM | 0.393 | 0.471 | 0.539 | 0.393 | 0.474 | 0.535 |
| PGD | 0.475 | 0.498 | 0.472 | 0.413 | 0.488 | 0.535 | |
| BIM | 0.479 | 0.494 | 0.472 | 0.458 | 0.512 | 0.535 | |
| MIM | 0.477 | 0.499 | 0.473 | 0.399 | 0.484 | 0.540 | |
| DenseNet121 | FGSM | 0.468 | 0.479 | 0.497 | 0.503 | 0.499 | 0.537 |
| PGD | 0.439 | 0.499 | 0.413 | 0.487 | 0.508 | 0.552 | |
| BIM | 0.419 | 0.490 | 0.396 | 0.437 | 0.508 | 0.414 | |
| MIM | 0.437 | 0.501 | 0.403 | 0.483 | 0.501 | 0.554 | |
| MobileNet | FGSM | 0.403 | 0.470 | 0.383 | 0.412 | 0.472 | 0.392 |
| PGD | 0.385 | 0.452 | 0.367 | 0.403 | 0.455 | 0.381 | |
| BIM | 0.379 | 0.444 | 0.360 | 0.397 | 0.447 | 0.373 | |
| MIM | 0.381 | 0.451 | 0.363 | 0.401 | 0.450 | 0.377 | |
| ViT Base | FGSM | 0.067 | 0.512 | 0.037 | 0.041 | 0.502 | 0.022 |
| PGD | 0.195 | 0.494 | 0.124 | 0.083 | 0.503 | 0.049 | |
| BIM | 0.331 | 0.507 | 0.253 | 0.412 | 0.506 | 0.359 | |
| MIM | 0.207 | 0.496 | 0.131 | 0.069 | 0.507 | 0.040 | |
| DeiT | FGSM | 0.280 | 0.505 | 0.210 | 0.315 | 0.509 | 0.240 |
| PGD | 0.262 | 0.497 | 0.191 | 0.298 | 0.501 | 0.222 | |
| BIM | 0.301 | 0.503 | 0.230 | 0.334 | 0.506 | 0.258 | |
| MIM | 0.271 | 0.498 | 0.200 | 0.306 | 0.503 | 0.232 | |
| DISTL | FGSM | 0.268 | 0.505 | 0.359 | 0.244 | 0.496 | 0.317 |
| PGD | 0.294 | 0.499 | 0.298 | 0.243 | 0.491 | 0.320 | |
| BIM | 0.346 | 0.499 | 0.380 | 0.392 | 0.498 | 0.392 | |
| MIM | 0.311 | 0.504 | 0.305 | 0.253 | 0.492 | 0.347 | |
Table 8.
Classification performance of models on the moderately unbalanced dataset under various adversarial attacks and without any defence mechanisms applied.
Table 8.
Classification performance of models on the moderately unbalanced dataset under various adversarial attacks and without any defence mechanisms applied.
| Model | Attack | White-Box | Black-Box | ||||
|---|---|---|---|---|---|---|---|
| F1 | AUC | ACC | F1 | AUC | ACC | ||
| ResNet50 | BIM | 0.697 | 0.499 | 0.535 | 0.738 | 0.464 | 0.585 |
| FGSM | 0.010 | 0.485 | 0.005 | 0.030 | 0.457 | 0.009 | |
| MIM | 0.379 | 0.480 | 0.234 | 0.034 | 0.478 | 0.017 | |
| PGD | 0.346 | 0.503 | 0.210 | 0.002 | 0.529 | 0.001 | |
| DenseNet121 | BIM | 0.191 | 0.512 | 0.106 | 0.527 | 0.531 | 0.358 |
| FGSM | 0.085 | 0.514 | 0.045 | 0.137 | 0.520 | 0.074 | |
| MIM | 0.142 | 0.476 | 0.077 | 0.112 | 0.491 | 0.059 | |
| PGD | 0.190 | 0.532 | 0.105 | 0.119 | 0.503 | 0.063 | |
| MobileNet | BIM | 0.451 | 0.465 | 0.451 | 0.451 | 0.476 | 0.451 |
| FGSM | 0.466 | 0.522 | 0.466 | 0.466 | 0.511 | 0.466 | |
| MIM | 0.453 | 0.472 | 0.453 | 0.453 | 0.488 | 0.453 | |
| PGD | 0.454 | 0.481 | 0.454 | 0.454 | 0.474 | 0.454 | |
| ViT Base | BIM | 0.515 | 0.463 | 0.347 | 0.631 | 0.471 | 0.461 |
| FGSM | 0.513 | 0.535 | 0.345 | 0.598 | 0.494 | 0.427 | |
| MIM | 0.469 | 0.478 | 0.306 | 0.571 | 0.486 | 0.400 | |
| PGD | 0.460 | 0.491 | 0.299 | 0.582 | 0.477 | 0.410 | |
| DeiT | BIM | 0.462 | 0.472 | 0.462 | 0.462 | 0.475 | 0.462 |
| FGSM | 0.471 | 0.551 | 0.471 | 0.471 | 0.525 | 0.471 | |
| MIM | 0.465 | 0.481 | 0.465 | 0.465 | 0.487 | 0.465 | |
| PGD | 0.466 | 0.493 | 0.466 | 0.466 | 0.479 | 0.466 | |
| DISTL | BIM | 0.131 | 0.468 | 0.070 | 0.359 | 0.475 | 0.219 |
| FGSM | 0.098 | 0.549 | 0.051 | 0.122 | 0.532 | 0.065 | |
| MIM | 0.349 | 0.479 | 0.211 | 0.120 | 0.488 | 0.064 | |
| PGD | 0.357 | 0.493 | 0.217 | 0.180 | 0.481 | 0.099 | |
Table 9.
Comparative performance of MGM, AT-PGD, and TRADES on the unbalanced dataset using the ResNet50 backbone.
Table 9.
Comparative performance of MGM, AT-PGD, and TRADES on the unbalanced dataset using the ResNet50 backbone.
| Defence | Attack | White-Box | Black-Box | |||||
|---|---|---|---|---|---|---|---|---|
| F1 | AUC | ACC | F1 | AUC | ACC | |||
| MGM* | FGSM | 0.969 | 0.998 | 0.969 | 0.969 | 0.998 | 0.969 | |
| PGD | 0.969 | 0.998 | 0.969 | 0.969 | 0.998 | 0.969 | ||
| BIM | 0.969 | 0.998 | 0.969 | 0.969 | 0.998 | 0.969 | ||
| MIM | 0.969 | 0.998 | 0.969 | 0.969 | 0.998 | 0.969 | ||
| AT-PGD | FGSM | 0.385 | 0.459 | 0.405 | 0.396 | 0.487 | 0.428 | |
| PGD | 0.374 | 0.505 | 0.396 | 0.379 | 0.430 | 0.425 | ||
| BIM | 0.371 | 0.504 | 0.391 | 0.387 | 0.438 | 0.425 | ||
| MIM | 0.370 | 0.501 | 0.389 | 0.378 | 0.452 | 0.418 | ||
| TRADES | FGSM | 0.399 | 0.467 | 0.390 | 0.410 | 0.448 | 0.450 | |
| PGD | 0.413 | 0.507 | 0.411 | 0.411 | 0.436 | 0.444 | ||
| BIM | 0.417 | 0.503 | 0.414 | 0.421 | 0.477 | 0.427 | ||
| MIM | 0.423 | 0.504 | 0.422 | 0.440 | 0.507 | 0.434 | ||
* This defence mechanism is highlighted in bold to indicate its superior performance across all evaluated categories.
Table 10.
Performance of the MGM defence across multiple backbone architectures on the highly imbalanced dataset.
Table 10.
Performance of the MGM defence across multiple backbone architectures on the highly imbalanced dataset.
| Model | Attack | White-Box | Black-Box | ||||
|---|---|---|---|---|---|---|---|
| F1 | AUC | ACC | F1 | AUC | ACC | ||
| ResNet50 | FGSM | 0.969 | 0.998 | 0.969 | 0.969 | 0.998 | 0.969 |
| PGD | 0.969 | 0.998 | 0.969 | 0.969 | 0.998 | 0.969 | |
| BIM | 0.969 | 0.998 | 0.969 | 0.969 | 0.998 | 0.969 | |
| MIM | 0.969 | 0.998 | 0.969 | 0.969 | 0.998 | 0.969 | |
| DenseNet121* | FGSM | 0.984 | 0.999 | 0.985 | 0.984 | 0.999 | 0.985 |
| PGD | 0.984 | 0.999 | 0.985 | 0.984 | 0.999 | 0.985 | |
| BIM | 0.980 | 0.997 | 0.981 | 0.980 | 0.997 | 0.981 | |
| MIM | 0.984 | 0.999 | 0.985 | 0.984 | 0.999 | 0.985 | |
| MobileNet | FGSM† | 0.994 | 1.000 | 0.994 | 0.994 | 1.000 | 0.994 |
| PGD | 0.918 | 0.994 | 0.916 | 0.918 | 0.994 | 0.916 | |
| BIM | 0.770 | 0.937 | 0.760 | 0.770 | 0.937 | 0.760 | |
| MIM | 0.782 | 0.953 | 0.772 | 0.782 | 0.953 | 0.772 | |
| ViT Base | FGSM | 0.964 | 0.994 | 0.964 | 0.964 | 0.994 | 0.964 |
| PGD | 0.964 | 0.994 | 0.964 | 0.964 | 0.994 | 0.964 | |
| BIM | 0.824 | 0.877 | 0.811 | 0.824 | 0.877 | 0.811 | |
| MIM | 0.964 | 0.994 | 0.964 | 0.964 | 0.994 | 0.964 | |
| DeiT | FGSM | 0.903 | 0.944 | 0.894 | 0.903 | 0.944 | 0.894 |
| PGD | 0.908 | 0.946 | 0.901 | 0.908 | 0.946 | 0.901 | |
| BIM | 0.876 | 0.919 | 0.864 | 0.876 | 0.919 | 0.864 | |
| MIM | 0.908 | 0.946 | 0.900 | 0.908 | 0.946 | 0.900 | |
| DISTL | FGSM | 0.953 | 0.990 | 0.983 | 0.957 | 0.990 | 0.988 |
| PGD | 0.945 | 0.987 | 0.982 | 0.951 | 0.987 | 0.983 | |
| BIM | 0.927 | 0.936 | 0.975 | 0.932 | 0.936 | 0.980 | |
| MIM | 0.951 | 0.987 | 0.983 | 0.951 | 0.987 | 0.985 | |
* Model that performed the best overall.
† Best performance from one scenario.
Table 11.
Performance of MGM defence across multiple backbone architectures on a more balanced dataset.
Table 11.
Performance of MGM defence across multiple backbone architectures on a more balanced dataset.
| Model | Attack | White-Box | Black-Box | ||||
|---|---|---|---|---|---|---|---|
| F1 | AUC | ACC | F1 | AUC | ACC | ||
| ResNet50* | FGSM | 0.969 | 0.998 | 0.969 | 0.969 | 0.998 | 0.969 |
| PGD | 0.969 | 0.998 | 0.969 | 0.969 | 0.998 | 0.969 | |
| BIM | 0.969 | 0.998 | 0.969 | 0.969 | 0.998 | 0.969 | |
| MIM | 0.969 | 0.998 | 0.969 | 0.969 | 0.998 | 0.969 | |
| DenseNet121 | FGSM | 0.966 | 0.996 | 0.966 | 0.966 | 0.996 | 0.966 |
| PGD | 0.966 | 0.996 | 0.966 | 0.966 | 0.996 | 0.966 | |
| BIM | 0.966 | 0.996 | 0.966 | 0.966 | 0.996 | 0.966 | |
| MIM | 0.966 | 0.996 | 0.966 | 0.966 | 0.996 | 0.966 | |
| MobileNet | FGSM | 0.962 | 0.995 | 0.962 | 0.962 | 0.995 | 0.962 |
| PGD | 0.962 | 0.995 | 0.962 | 0.962 | 0.995 | 0.962 | |
| BIM | 0.962 | 0.995 | 0.962 | 0.962 | 0.995 | 0.962 | |
| MIM | 0.962 | 0.995 | 0.962 | 0.962 | 0.995 | 0.962 | |
| ViT Base | FGSM | 0.954 | 0.992 | 0.954 | 0.954 | 0.992 | 0.954 |
| PGD | 0.954 | 0.992 | 0.954 | 0.954 | 0.992 | 0.954 | |
| BIM | 0.954 | 0.992 | 0.954 | 0.954 | 0.992 | 0.954 | |
| MIM | 0.954 | 0.992 | 0.954 | 0.954 | 0.992 | 0.954 | |
| DeiT | FGSM | 0.946 | 0.990 | 0.946 | 0.946 | 0.990 | 0.946 |
| PGD | 0.946 | 0.990 | 0.946 | 0.946 | 0.990 | 0.946 | |
| BIM | 0.946 | 0.990 | 0.946 | 0.946 | 0.990 | 0.946 | |
| MIM | 0.946 | 0.990 | 0.946 | 0.946 | 0.990 | 0.946 | |
| DISTL | FGSM | 0.958 | 0.993 | 0.958 | 0.958 | 0.993 | 0.958 |
| PGD | 0.958 | 0.993 | 0.958 | 0.958 | 0.993 | 0.958 | |
| BIM | 0.958 | 0.993 | 0.958 | 0.958 | 0.993 | 0.958 | |
| MIM | 0.958 | 0.993 | 0.958 | 0.958 | 0.993 | 0.958 | |
* Model that performed the best overall.
Disclaimer/Publisher’s Note: The statements, opinions and data contained in all publications are solely those of the individual author(s) and contributor(s) and not of MDPI and/or the editor(s). MDPI and/or the editor(s) disclaim responsibility for any injury to people or property resulting from any ideas, methods, instructions or products referred to in the content. |
© 2026 by the authors. Licensee MDPI, Basel, Switzerland. This article is an open access article distributed under the terms and conditions of the Creative Commons Attribution (CC BY) license (http://creativecommons.org/licenses/by/4.0/).
Copyright: This open access article is published under a Creative Commons CC BY 4.0 license, which permit the free download, distribution, and reuse, provided that the author and preprint are cited in any reuse.


