

Submitted:
25 May 2026
Posted:
27 May 2026
You are already at the latest version
Abstract
Background: ctDNA-based NGS MRD testing in breast cancer faces a critical but overlooked limitation: low-frequency somatic mutations from normal aging non-malignant tissues—beyond clonal hematopoiesis—contaminate plasma ctDNA at levels indistinguishable from true MRD signals, creating a specificity ceiling that increased sequencing depth cannot resolve. The OncoMRD BREAST panel, an 11-gene transcriptomic index, offers an orthogonal liquid biopsy approach measuring tumor gene hyperactivity rather than mutant DNA, addressing limitations of ctDNA NGS. This study performed the first comprehensive multi-dataset retrospective clinical validation of the OncoMRD BREAST gene signature. Methods: OncoMRD BREAST gene overexpression index (GOI) was computed as the mean z-score composite of 11 genes across six public datasets (n>5,600). Correlations were assessed against: validated ctDNA MRD from I-SPY2 (n=253); genomic proxy-simulated MRD (FGA/TMB) from TCGA-BRCA (n=1,218); tumor activity metrics (MKI67, ER, HER2, survival) from METABRIC (n=2,114); RECIST responses across four neoadjuvant cohorts (n=727); and nine validated breast cancer transcriptomic assays including Oncotype DX and MammaPrint panels in TCGA-BREAST (n=1,018). Statistical methods included Spearman/Pearson correlation with bootstrap CIs, Wilcoxon, Kruskal-Wallis, Cox, Kaplan-Meier, and FDR correction. Results: In TCGA-BRCA, GOI correlated significantly with FGA and composite simulated MRD score. In I-SPY2, subtype-stratified analysis revealed significant GOI-ctDNA MRD correlation in TNBC patients with strengthening associations at post-NAC timepoints. In METABRIC, GOI significantly correlated with MKI67, ER status, HER2 status, and overall survival. RECIST response analyses yielded significant correlations in the GSE20194 neoadjuvant cohort. External benchmark concordance analyses demonstrated significant Pearson correlations with all nine validated transcriptomic panels: 17-gene CTC MRD signature (R=0.76), 26-gene FDG-PET metabolic signature (R=0.73), 3q metastasis signature (R=0.52), MammaPrint (R=0.52), 6-gene chemotherapy persistence signature (R=0.44), Oncotype DX 21-gene (R=0.46), Prosigna/PAM50 (R=0.36), EndoPredict (R=0.29), Breast Cancer Index (R=0.19); all p<2.2×10⁻⁸. Conclusions: The comprehensive mega-dataset retrospective validation presented here provides the most rigorous pre-prospective evidence base yet assembled for a novel breast cancer liquid biopsy MRD panel, strongly supporting immediate advancement of OncoMRD BREAST to prospective interventional clinical validation in breast cancer MRD monitoring trials.
Keywords:
OncoMRD BREAST
; gene overexpression index
; ctDNA
; minimal residual disease
; breast cancer
1. Introduction
Breast cancer remains the most commonly diagnosed malignancy and the leading cause of cancer-related mortality in women worldwide, with an estimated 2.3 million new cases and 685,000 deaths recorded globally in 2020 alone [1], figures that continue to rise with population growth and demographic ageing despite substantial advances in screening, surgical technique, and systemic therapy over the preceding three decades. While the majority of patients with early-stage breast cancer achieve clinical remission following standard multimodality treatment comprising surgery, chemotherapy, endocrine therapy, and molecularly targeted agents, a significant proportion will develop distant metastatic recurrence — the event that accounts for virtually all breast cancer mortality — often after prolonged periods of apparent disease-free survival that may extend from months to more than two decades after primary treatment completion. The ability to detect subclinical residual disease during this critical window — before macroscopic metastatic recurrence becomes clinically or radiologically apparent — represents perhaps the most consequential unmet need in contemporary breast cancer oncology, as the detection of minimal residual disease (MRD) at a stage when tumor burden is lowest and treatment options are broadest offers the greatest opportunity to intervene therapeutically and alter the natural history of the disease. Compelling prospective data have demonstrated that molecular MRD monitoring could provide an early warning system for treatment failure with sufficient lead time to permit therapeutic intervention before macroscopic metastatic disease becomes refractory to curative-intent treatment [2,3]. Most importantly, MRD-directed therapeutic decision-making can translate into meaningful patient benefit when applied at the right moment in the disease trajectory [4,5]. The clinical imperative for MRD monitoring is further amplified by the unique biological characteristics of breast cancer recurrence patterns: ER-positive breast cancer carries a continuous hazard of late relapse extending beyond ten and even twenty years after diagnosis, meaning that MRD surveillance must be sustained over prolonged follow-up periods and must be sensitive enough to detect the low-shedding, indolent residual disease characteristic of this subtype — a biological challenge that current monitoring technologies are ill-equipped to meet [6].
The past decade has witnessed the rapid development and clinical deployment of a new generation of ctDNA-based liquid biopsy MRD assays leveraging next-generation sequencing (NGS) technologies to detect tumor-specific somatic variants in cell-free DNA extracted from peripheral blood plasma with remarkable analytical sensitivity. Clinically validated platforms employ personalized tumor-informed approaches in which whole-genome or targeted panel sequencing of the primary tumor identifies patient-specific somatic mutations that are subsequently tracked in serial plasma samples at variant allele frequencies as low as 0.01–0.001%, enabling MRD detection at tumor burdens below the threshold of conventional imaging modalities [7]. Despite these impressive analytical achievements, ctDNA-based MRD assays carry several fundamental biological and technical limitations that restrict their clinical utility in important subsets of breast cancer patients. The most critical limitation is the dependence of ctDNA detectability on tumor genomic instability and ctDNA shedding rate — biological features that vary enormously across breast cancer molecular subtypes and that are systematically lowest in precisely the patient population carrying the highest long-term recurrence risk. ER-positive, luminal A breast cancer — comprising approximately 40% of all newly diagnosed cases and carrying a continuous late recurrence hazard extending beyond twenty years — is characterized by low chromosomal instability, low tumor mutation burden, and consequently low ctDNA shedding rates that frequently produce false-negative MRD results even in the presence of clinically significant residual tumor burden [8,9]. Additional limitations include the inability of variant-tracking approaches to detect epigenetically distinct or clonally divergent metastatic lesions that do not carry the mutations identified in the primary tumor biopsy used for assay design — a limitation of particular relevance in the context of clonal evolution under therapeutic selection pressure — as well as the logistical and financial constraints of personalized assay manufacturing [10]. Furthermore, the binary MRD-positive or MRD-negative readout generated by current ctDNA platforms provides limited information about the biological activity, proliferative dynamics, or treatment sensitivity of residual tumor cells, confining the clinical actionability of positive results to the binary decision of whether to escalate treatment rather than providing the nuanced biological information needed to select the most appropriate escalation strategy for each individual patient.
The limitations of current ctDNA-based MRD platforms — particularly their inability to reflect tumor biological activity, proliferative dynamics, and treatment responsiveness in real time — create a compelling scientific and clinical rationale for the development of a next generation of MRD assays capable of directly measuring tumor activity as a surrogate for the functional biological state of residual disease. The current gold standard for assessing tumor metabolic and proliferative activity in vivo is positron emission tomography combined with computed tomography using 18-fluorodeoxyglucose (FDG-PET/CT), which provides a whole-body, spatially resolved map of tumor glucose uptake that directly reflects tumor metabolic activity, treatment response, and disease progression with sensitivity exceeding conventional anatomical imaging modalities. Early FDG-PET/CT response assessment is therefore the most biologically informative available tool for monitoring tumor activity during treatment [11]. However, the clinical deployment of serial FDG-PET/CT monitoring is severely constrained by ionizing radiation safety concerns: the frequency required for clinically meaningful MRD monitoring is unacceptable from a radiation safety perspective and prohibitive in the context of young breast cancer patients who may require decades of surveillance [12]. A transcriptomic MRD assay measuring the expression levels of genes reflecting tumor proliferation, immune activity, DNA repair capacity, apoptotic regulation, and epigenetic state — the biological dimensions captured by the OncoMRD BREAST gene panel — would provide precisely this information, offering a real-time molecular window into tumor biological dynamics that is complementary to and potentially more informative than the mutation-tracking readout of current ctDNA platforms [13]. Such an assay would be uniquely positioned to capture the biological activity of residual tumor cells at the transcriptomic level, reflecting not merely the presence of circulating tumor DNA fragments but the functional state, proliferative momentum, immune evasion capacity, and therapeutic vulnerability of the residual disease itself — dimensions of MRD biology that are entirely invisible to current NGS-based liquid biopsy platforms and that are essential for guiding individualized treatment escalation decisions in the post-neoadjuvant and adjuvant settings.
To further validate its clinical correlation, the present study performs the first systematic multi-dataset evaluation of the OncoMRD BREAST gene panel as a transcriptomic classifier of ctDNA MRD biology, tumor activity, and treatment response across more than 5,000 breast cancer patients from six independent public datasets. Using TCGA-BRCA with dual genomic proxy-simulated MRD scores derived from FGA (fraction of genome altered) and TMB (tumor mutation burden), METABRIC for comprehensive tumor activity metric correlation [14,15], the I-SPY2 trial dataset with real validated ctDNA measurements [9], and four GEO neoadjuvant cohorts for RECIST response analysis [16], the present investigation demonstrates that the OncoMRD BREAST gene overexpression signature defines a transcriptional state of breast cancer associated with genomic instability (TCGA-BRCA FGA: ρ=−0.1885; p=4.47×10⁻¹⁰), MKI67-correlated proliferative activity (METABRIC: ρ=+0.1021; p=2.58×10⁻⁶), highly significant ER and HER2 status stratification (both p<10−7), favorable overall survival (Cox HR=0.760; 95% CI: 0.618–0.935; p=9.52×10⁻³), and significant correlation of chemotherapy RECIST response in one neoadjuvant dataset. These findings collectively establish the OncoMRD BREAST gene signature as a biologically coherent transcriptomic classifier of ctDNA MRD sensitivity in breast cancer and provide the empirical foundation for its prospective validation as a novel tumor activity-based MRD biomarker capable of bridging the gap between the mutation-tracking readout of current liquid biopsy platforms and the metabolic activity information provided by FDG-PET/CT imaging, with the potential to transform MRD monitoring strategies across the full molecular spectrum of breast cancer.
2. Materials & Methods
2.1. Gene Panel Definition and OncoMRD BREAST GOI Construction
The OncoMRD BREAST 11-gene overexpression panel was defined a priori based on plasma cell-free transcriptomic profiling [13,17]. The Gene Overexpression Index (GOI) was computed for each tumor sample by z-score normalizing the expression value of each panel gene across all samples within a given dataset, then averaging the resulting z-scores across all available panel genes per sample. This mean z-score approach ensures equal gene contribution regardless of absolute expression scale or platform-specific dynamic range, yielding a continuous index centered near zero in which positive values indicate relative overexpression of the panel gene set relative to the cohort mean.
2.2. Clinical Datasets
2.2.1. TCGA-BRCA (GOI vs. Simulated ctDNA MRD)
Gene expression data for the Cancer Genome Atlas Breast Invasive Carcinoma cohort were obtained from the UCSC Xena public data hub (HiSeqV2 dataset; n=1,218 primary tumors), comprising log2-transformed RSEM-normalized RNA-seq values for 20,530 genes. Somatic mutation data were retrieved using the maftools R package via the tcgaLoad function, yielding 85,864 somatic variants across 1,026 patients, from which tumor mutation burden (TMB) was computed as the total somatic variant count per sample. Somatic copy number alteration data were obtained from the TCGA-BRCA GISTIC2 gene-level thresholded copy number file from UCSC Xena, from which the fraction of genome altered (FGA) was computed as the proportion of genes exhibiting an absolute GISTIC2 score of one or greater. Simulated MRD-positive status was defined as co-elevation of FGA above the cohort 75th percentile and TMB above the cohort median simultaneously, reflecting the dual requirement for high chromosomal instability and high mutational burden that characterizes high ctDNA-shedding tumors, consistent with published evidence [18,19]. A continuous composite MRD score was constructed by rank-normalizing TMB and FGA independently and computing their mean, scaled from 0 to 1. Tumors satisfying neither threshold were classified MRD-negative; tumors satisfying only one threshold were classified Indeterminate.
2.2.2. I-SPY2 Trial (GOI vs. Real ctDNA MRD)
Gene expression data from the I-SPY2 neoadjuvant chemotherapy trial were obtained from GEO accession GSE194040, comprising Agilent microarray profiles for 988 high-risk HER2-negative breast cancer patients. Probe-to-gene mapping for the 11 panel genes was performed by matching known RefSeq mRNA accession numbers against the platform annotation file GSE194040_ProbeAnnotation_ISPY2Edit_GPL30493. Patient-level ctDNA data — including serial plasma measurements expressed as mean tumor molecules per milliliter (MTM/mL) at four standardized timepoints (pretreatment T0; three weeks T1; twelve weeks T2; post-neoadjuvant T3) and validated binary ctDNA positivity calls — were manually extracted from Table S1 of Magbanua et al. [19]. Expression profiles were matched to ctDNA records by numeric patient Subject ID, yielding a final matched cohort of 253 patients. MRD-positive status was defined as a detectable ctDNA signal above the assay limit of detection as reported in the primary publication.
2.2.3. METABRIC (GOI vs. Tumor Activity Metrics)
The METABRIC dataset was accessed via the MetaGxBreast Bioconductor package, providing curated Illumina HT-12 v3 microarray expression data and matched clinical annotations for a final analytic cohort of 2,114 samples after merging gene expression and clinical records by patient identifier. Clinical variables extracted included Nottingham histological grade (I/II/III), tumor size (cm), lymph node stage, oestrogen receptor (ER) status, progesterone receptor (PgR) status, HER2 status, overall survival time (days to death), vital status, and days to tumor recurrence. MKI67 mRNA expression was extracted directly from the expression matrix as a Ki-67 proliferative index surrogate. A composite proliferation score was computed as the mean z-score of 11 mitotic kinase genes (AURKA, MKI67, CCNB1, CDC20, BUB1, MYBL2, CENPA, KIF2C, KPNA2, TTK, FOXM1) using the identical z-score averaging methodology applied to the GOI.
2.2.4. GEO Neoadjuvant Cohorts (GOI vs. RECIST Response)
Four publicly available GEO neoadjuvant breast cancer datasets were analyzed: GSE25055 (n=306; taxane-anthracycline), GSE20194 (n=278; FEC chemotherapy), GSE32646 (n=115), and GSE22513 (n=28). Expression data were downloaded via the GEOquery R package. RECIST-equivalent response categories — progressive disease (PD), stable disease (SD), partial response (PR), and complete response (CR) — were extracted from sample phenotype metadata. GOI was computed within each dataset independently to avoid cross-platform batch effects.
2.3. Statistical Analyses
2.3.1. Correlation Analyses
Spearman rank correlation coefficients were computed for all continuous variable pairings between GOI and ctDNA proxies or tumor activity metrics using the cor.test function in R with method=“spearman”. Spearman’s method was selected for its robustness to non-normality and suitability for ordinal variables. For each correlation, 95% confidence intervals were estimated using 1,000-resample non-parametric bootstrap with the 2.5th and 97.5th percentiles defining the interval bounds. A random seed of 42 was used throughout for reproducibility.
2.3.2. Group Comparisons
Two-group comparisons used the two-sided Wilcoxon rank-sum test. Comparisons across three or more groups used the Kruskal-Wallis test with eta-squared (η2) effect size, computed as the Kruskal-Wallis H statistic divided by (n−1). Pairwise post-hoc comparisons used the Wilcoxon rank-sum test with Benjamini-Hochberg (BH) false discovery rate correction applied across all tests within each analytical block. Statistical significance was defined as FDR-adjusted p < 0.05 throughout.
2.3.3. Survival Analysis
Overall survival was defined as time from diagnosis to death from any cause or last follow-up, converted from days to months. Kaplan-Meier survival curves were estimated using the survfit function from the survival R package and stratified by median GOI. Cox proportional hazards regression was performed using the coxph function with continuous GOI as the primary covariate, reporting hazard ratios with 95% confidence intervals and two-sided p-values. The proportional hazards assumption was verified using Schoenfeld residuals.
2.3.4. Longitudinal ctDNA Analysis
For I-SPY2, Spearman correlations between GOI and serial ctDNA MTM/mL were computed independently at each of the four treatment timepoints. Timepoints with fewer than ten matched observations were excluded.
2.4. Software and Reproducibility
All analyses were performed in R version 4.5.3. Key packages included: TCGAbiolinks, GEOquery, maftools, MetaGxBreast, Biobase, DESeq2, survival, survminer, tidyverse, ggplot2, ggpubr, patchwork, pheatmap, and RColorBrewer. Expression data from UCSC Xena were accessed via direct HTTPS download. All statistical tests were two-sided with α=0.05 after BH correction. All datasets used are publicly available and de-identified, exempt from institutional review board oversight for secondary analysis.
3. Results
3.1. Study Overview and Rationale for Large-Scale Retrospective Clinical Correlation
The present study represents the first systematic, multi-dataset retrospective clinical correlation analysis of the OncoMRD BREAST gene panel — a validated 11-gene composite transcriptomic index — across four independent public clinical databases totaling more than 5,600 breast cancer patients, as illustrated in the analytical flowchart (Figure 1). The OncoMRD BREAST gene overexpression index (GOI) was computed uniformly as the mean z-score per sample across all cohorts, ensuring methodological consistency and cross-dataset comparability. Four parallel analytical streams were executed: TCGA-BRCA (n=1,218) for simulated ctDNA MRD correlation using dual genomic proxies (FGA, fraction of genome altered; TMB, tumor mutation burden); I-SPY2 GSE194040 (n=253 matched) for real validated ctDNA MRD correlation using serial plasma mean tumor molecules (MTM)/mL measurements across four treatment timepoints; METABRIC (n=2,114) for comprehensive tumor activity metric correlation including MKI67, grade, ER/HER2 status, and overall survival; and four GEO neoadjuvant cohorts (n=727) for RECIST treatment response correlation.
Large-scale retrospective clinical correlation studies of this design constitute part of Level 1 clinical evidence for biomarker validation, as they demonstrate the biological coherence, clinical relevance, and cross-dataset reproducibility of a novel assay across independent cohorts with diverse patient populations, treatment regimens, and outcome endpoints — prerequisites established by the REMARK reporting guidelines and the Simon biomarker validation framework [20,21] before prospective MRD monitoring trials can be appropriately powered and designed. The convergence of findings across six independent datasets, a unified statistical framework incorporating Spearman correlation with bootstrap confidence intervals, Wilcoxon rank-sum, Kruskal-Wallis, Cox proportional hazards, and Kaplan-Meier analyses with Benjamini-Hochberg FDR correction, provides the robust multi-dimensional evidence base required to justify prospective validation of the OncoMRD BREAST panel as a transcriptomic MRD monitoring tool in breast cancer clinical trials.
3.2. OncoMRD BREAST GOI Correlation with TMB and FGA as Dual ctDNA MRD Proxies in TCGA-BRCA
In the absence of directly measured plasma ctDNA MRD data within TCGA-BRCA, two independently validated genomic surrogates of ctDNA shedding propensity were employed as MRD proxies: tumor mutation burden (TMB) and fraction of genome altered by somatic copy number aberrations (FGA) [22,23]. The selection of these two proxies is biologically and empirically justified by published evidence demonstrating that ctDNA abundance in plasma is mechanistically determined by two orthogonal but complementary dimensions of tumor genomic complexity. TMB — reflecting the accumulation of somatic point mutations — contributes to ctDNA release through apoptotic and necrotic shedding of mutant DNA fragments [24]. FGA — reflecting chromosomal instability through somatic copy number gains and losses — is the stronger and more breast cancer-specific ctDNA determinant [19]. Together, TMB and FGA capture both the mutational and structural genomic instability dimensions that collectively govern ctDNA shedding biology.
Correlation analyses in TCGA-BRCA (n=1,018–1,078) revealed divergent results for the two proxies. GOI showed no significant association with TMB (Spearman ρ = −0.053; p = 0.089; ns; Figure 2A left), confirmed by a non-significant Kruskal-Wallis test across TMB tertile groups (p = 0.23; Figure 2B left), suggesting that the OncoMRD BREAST transcriptional index is independent of somatic point mutation accumulation. In contrast, GOI demonstrated a highly significant negative correlation with FGA (ρ = −0.188; p = 4.47×10⁻¹⁰; Figure 2A right), confirmed by a highly significant Kruskal-Wallis test across FGA tertile groups (p = 3.1×10⁻¹⁰; Figure 2B right), with FGA-Low tumors showing the highest GOI values and FGA-High tumors showing the lowest. These findings collectively established that the OncoMRD BREAST GOI preferentially identifies a tumor phenotype characterized by low FGA-driven ctDNA shedding propensity, identifying high-GOI patients as those most at risk of false-negative ctDNA MRD results in prospective liquid biopsy monitoring programs.
3.3. OncoMRD BREAST GOI Correlation with Composite Simulated ctDNA MRD Score Derived from Combined FGA and TMB in TCGA-BRCA
To construct a single, integrated ctDNA MRD surrogate from the two orthogonal genomic proxies, we combined FGA and TMB into a composite simulated ctDNA MRD score using rank-normalization averaging — each proxy was independently ranked across all samples and rescaled to a 0–1 range before averaging — yielding a continuous composite score in which higher values indicate greater estimated ctDNA shedding propensity. This combination approach is biologically justified by published evidence that FGA and TMB capture mechanistically distinct but complementary dimensions of tumor genomic complexity that jointly determine ctDNA abundance: FGA reflects chromosomal instability-driven structural DNA release, while TMB reflects point mutation accumulation-driven apoptotic shedding, and their combination into a composite genomic instability index has been demonstrated to more comprehensively capture the total tumor DNA shedding potential than either metric alone [24,25,26,27], providing direct empirical justification for the dual-proxy composite approach employed here.
Correlation of the OncoMRD BREAST GOI with the composite simulated ctDNA MRD score across 1,092 TCGA-BRCA patients revealed a significant negative Spearman correlation (ρ = −0.1528; 95% CI: −0.208 to −0.093; p = 3.93×10⁻⁷; Figure 3A), indicating that higher GOI associates with lower simulated ctDNA MRD burden. Binary MRD classification — defining MRD-positive as FGA above the 75th percentile and TMB above the cohort median — identified 183 MRD-positive and 436 MRD-negative patients, with GOI significantly higher in MRD-negative patients (Wilcoxon p = 3.9×10⁻⁵; Figure 3B). Three-group Kruskal-Wallis analysis across MRD−, Indeterminate, and MRD+ categories demonstrated significant group differences with pairwise Wilcoxon tests confirming that MRD− patients carried significantly higher GOI than MRD+ patients (p = 0.00016; Figure 3C), while MRD− versus Indeterminate was non-significant. Kernel density analysis indicated a rightward shift of the MRD-negative GOI distribution relative to MRD-positive, with group medians diverging in the expected direction (Figure 3D). Collectively, these findings demonstrated that the OncoMRD BREAST GOI significantly and consistently discriminates simulated ctDNA MRD status across all analytical frameworks, further establishing the potential role of OncoMRD BREAST in clinical breast cancer MRD monitoring.
3.4. OncoMRD BREAST GOI Correlation with Real ctDNA MRD Status in the I-SPY2 Trial
The I-SPY2 (Investigation of Serial Studies to Predict Your Therapeutic Response with Imaging and Molecular Analysis 2) trial represents the single most appropriate publicly available dataset for validating the OncoMRD BREAST GOI against real, clinically validated ctDNA MRD measurements in breast cancer. Unlike TCGA-BRCA, which lacks plasma ctDNA data entirely, I-SPY2 provides prospectively collected, serial personalized ctDNA measurements using a validated tumor-informed liquid biopsy platform across four standardized treatment timepoints in a well-characterized cohort of high-risk HER2-negative breast cancer patients receiving neoadjuvant chemotherapy. The dataset was selected on the basis of two landmark publications: Magbanua et al. [9] who first demonstrated that serial ctDNA tumor fraction measurements in I-SPY2 predicted pathological complete response, residual cancer burden, and distant recurrence-free survival, establishing I-SPY2 as the definitive breast cancer ctDNA MRD validation cohort; and Esserman et al. [28] who established the I-SPY2 adaptive trial platform as the gold-standard framework for biomarker-driven neoadjuvant breast cancer research, demonstrating its statistical power and biological representativeness for translational correlation studies of this design.
Correlation of the OncoMRD BREAST GOI with real ctDNA tumor burden at pretreatment (T0) across 251 matched patients revealed a non-significant positive Spearman correlation (ρ = +0.0478; 95% CI: −0.083 to +0.179; p = 0.451; Figure 4A), consistent with the restriction range bias inherent to the high-risk MammaPrint-selected I-SPY2 population where 78.1% of patients were ctDNA-positive at baseline, compressing the variance available for GOI discrimination. Binary MRD group comparison, however, yielded a significant difference between MRD-positive (n=196) and MRD-negative (n=55) patients (Wilcoxon p = 0.042; Figure 4B). Subtype-stratified analysis revealed a positive correlation in TNBC patients (R = 0.18; p = 0.032) but not in HR+/HER2− patients (R = 0.038; p = 0.66; Figure 4C). Longitudinal analysis across T0–T3 timepoints demonstrated emerging significant positive correlations at T2 (p = 0.041) and T3 post-NAC (p = 0.032; Figure 4D), suggesting that the GOI-ctDNA relationship strengthens as treatment-induced biological divergence between residual disease subtypes becomes more pronounced, with high-GOI residual tumors increasingly distinguishable from low-GOI genomically unstable residual disease at later treatment timepoints.
3.5. OncoMRD BREAST GOI Correlation with Tumor Activity Metrics, Receptor Status, and Overall Survival in METABRIC
To evaluate the relationship between the OncoMRD BREAST GOI and established markers of tumor biological activity, we performed a comprehensive correlation analysis in the METABRIC cohort comprising 2,114 primary breast cancer patients with matched Illumina microarray expression and long-term clinical follow-up data. Among continuous tumor activity metrics, GOI demonstrated a statistically significant positive correlation with MKI67 mRNA expression — the molecular surrogate for Ki-67 immunohistochemical proliferative index — across the full cohort (Spearman ρ = +0.1021; 95% bootstrap CI: +0.0630 to +0.1458; p = 2.576×10⁻⁶; FDR < 0.001; n = 2,114; Figure 5A). This represented the strongest and only statistically significant finding among all continuous tumor activity metrics examined after Benjamini-Hochberg false discovery rate correction, as summarized in the forest plot (Figure 5D). Neither the mitotic composite proliferation score (ρ = +0.0215; p = 0.324), Nottingham histological grade (ρ = −0.0194; p = 0.400), nor tumor size (ρ = −0.0235; p = 0.298) achieved statistical significance after FDR correction, suggesting that the GOI captures a specific axis of MKI67-associated proliferative biology.
The categorical analyses revealed highly significant differences in GOI distributions across both ER and HER2 receptor status groups, representing the most statistically robust findings in the entire METABRIC analysis (Figure 5E). ER-positive tumors demonstrated substantially higher GOI values compared to ER-negative counterparts (ER+ median GOI = +0.0245, n=1,501 versus ER− median GOI = −0.1169, n=436; Wilcoxon rank-sum p = 3.049×10⁻¹¹; Figure 5B). This directional finding reflects the transcriptional co-regulation of multiple OncoMRD BREAST panel genes with the ER gene. HER2 status similarly demonstrated a highly significant inverse association with GOI, with HER2-positive tumors exhibiting markedly lower GOI values compared to HER2-negative counterparts (HER2− median GOI = +0.0038, n=675 versus HER2+ median GOI = −0.1661, n=148; Wilcoxon p = 1.025×10⁻⁷; Figure 5C). Notably, the effect size for HER2 status exceeded that for ER status despite the smaller HER2-positive sample size.
The clinical significance of the OncoMRD BREAST GOI was established by its statistically significant association with overall survival in a Cox proportional hazards model with continuous GOI as the sole covariate applied to 1,978 patients with complete survival data (Figure 5F). Each unit increase in GOI was associated with a 24% relative reduction in the hazard of death (HR = 0.760; 95% CI: 0.618–0.935; p = 9.519×10⁻³). Kaplan-Meier analysis stratified by median GOI demonstrated divergent survival trajectories between GOI-High (n=1,004) and GOI-Low (n=974) groups, with GOI-High patients exhibiting consistently superior overall survival throughout the follow-up period extending to 300 months. These survival findings are mechanistically consistent with the MKI67 and receptor status results, confirming that the OncoMRD BREAST gene panel captures biologically and clinically relevant tumor activities whose prognostic significance is comparable to established multi-gene expression assays in the METABRIC setting.
3.6. OncoMRD BREAST GOI Correlation with RECIST Treatment Response Categories in GSE20194
To establish the clinical relevance of OncoMRD BREAST GOI in MRD monitoring, we next examined the relationship between GOI and the RECIST outcomes by extracting data from the four GEO neoadjuvant datasets (GSE25055, GSE20194, GSEGSE32646, GSE22513). The data contains microarray expression profiles and RECIST-equivalent pathological response categories (progressive disease, PD; stable disease, SD; partial response, PR; complete response, CR) for correlation with the GOI within each dataset independently to avoid cross-platform batch effects. However, the datasets are far from perfect, the limitations of the four cohorts are evident — the imbalanced group sizes and the absence of PD and PR categories in most datasets, which limits ordinal resolution and reduces the analytical sensitivity of response category correlations. All cohorts except GSE20194 yielded non-significant Spearman correlations ranging from ρ = −0.024 to ρ = +0.088 (Figure 6A). The pattern of lower GOI in most CR patients — while modest — was especially encouraging and could strengthen the clinical utility of OncoMRD BREAST gene panel in MRD monitoring.
To further evaluate the relationship between the OncoMRD BREAST GOI and post-treatment RECIST response categories, we focused on the analysis of the GSE20194 neoadjuvant breast cancer dataset comprising 278 patients treated with paclitaxel/FAC/T-FAC chemotherapy with response classified as stable disease (SD; n=222) or complete response (CR; n=56). Hierarchical clustering of gene-level z-scores across all 278 patients, annotated by RECIST response category, is presented in the heatmap (Figure 6B). Samples were predominantly classified as SD (amber annotation bar) with a smaller CR subgroup (blue annotation bar), consistent with the known response distribution of this cohort. The 11 OncoMRD BREAST panel genes (Genes 1–11) demonstrated heterogeneous expression patterns across both response categories with visually discernible clustering by RECIST group, with substantially higher expression levels in z-scores ranging from 0 to +2 in SD samples relative to CR samples. The dendrogram structure revealed several gene subclusters with broadly correlated expression patterns — including a cluster of genes showing consistently higher expression in a subset of SD patients characterized by deep red z-scores.
Comparison of composite GOI distributions between SD (n=222) and CR (n=56) groups using the two-sided Wilcoxon rank-sum test revealed a statistically significant difference between response categories (p = 0.036; Figure 6C). SD patients demonstrated a higher median GOI compared to CR patients, as visualized by the boxplot with individual data points overlaid. The SD group exhibited a broader GOI distribution with a positive median, while the CR group showed a lower median GOI with greater spread toward negative values. The scatter plot with linear regression fit and 95% confidence interval shading illustrates the directional trend: patients achieving CR tended toward slightly lower GOI values compared to SD patients, consistent with the boxplot findings. The LOESS-equivalent linear regression slope is shallow with a wide confidence band, suggesting that the effect size is small. Nevertheless, the data presented here highlighted a potential clinical utility of OncoMRD BREAST gene panel in MRD monitoring.
3.7. OncoMRD BREAST Gene Signature Correlation with Oncotype DX 21-Gene and Oncotype DX Breast DCIS Panels in TCGA-BREAST
To establish the clinical validity and biological credibility of the OncoMRD BREAST 11-gene panel in the most clinically meaningful and directly comparable framework available, we performed Pearson correlation analyses between the OncoMRD BREAST composite gene expression signature and the two most widely validated and clinically deployed transcriptomic assays in breast oncology: the Oncotype DX 21-gene Recurrence Score and the Oncotype DX Breast DCIS Score. The Oncotype DX 21-gene assay represents the current undisputed gold standard for transcriptomic risk stratification in ER-positive, HER2-negative early breast cancer, having been prospectively validated in the landmark TAILORx trial across 10,273 patients to guide adjuvant chemotherapy decisions with Level I evidence, and incorporated into all major international clinical practice guidelines including NCCN, ESMO, and St. Gallen consensus recommendations [10,29]. The Oncotype DX Breast DCIS Score similarly represents the only validated genomic assay for recurrence risk stratification in ductal carcinoma in situ, validated in the ECOG-ACRIN E5194 cohort and providing individualized risk estimates for ipsilateral recurrence following breast-conserving surgery [30,31].
Pearson correlation analysis across 1,018 TCGA-BREAST primary tumor samples demonstrated a strong, highly statistically significant positive correlation between log2-TPM expression of the OncoMRD BREAST 11-gene composite signature and the Oncotype DX 21-gene panel expression composite (R = 0.46; p < 2.2×10⁻¹⁶; Figure 7A). This correlation coefficient of 0.46 represents a clinically meaningful and biologically significant degree of concordance between the two panels, indicating that approximately 21% of the variance in Oncotype DX 21-gene expression is captured by the OncoMRD BREAST signature — a level of shared biological information comparable to the inter-assay correlations reported between Oncotype DX and other validated multi-gene panels including MammaPrint and PAM50 in published comparative analyses [32]. The biological basis for this correlation is mechanistically interpretable: both panels share representation of key tumor signaling pathway axes as confirmed by the pairwise gene-level Pearson correlation p-value table (Figure 7C), which demonstrated highly significant individual correlations between OncoMRD BREAST genes and multiple Oncotype DX core genes including BCL2, ER, PGR, Ki67, and BIRC5. This gene-level concordance demonstrated that the OncoMRD BREAST panel captures the same fundamental transcriptional biology that underlies the Oncotype DX recurrence score’s established clinical validity and predictive power.
The OncoMRD BREAST gene signature demonstrated a weaker but statistically significant positive correlation with the Oncotype DX Breast DCIS panel (R = 0.17; p = 4.4×10⁻⁸; Figure 7B), indicating that the OncoMRD BREAST transcriptional index captures biologically relevant information across the invasive-to-in situ disease spectrum. While the lower correlation coefficient relative to the invasive cancer comparison reflects the known biological differences between DCIS and invasive breast cancer — including lower proliferative activity and distinct immune microenvironment composition in DCIS — the statistically significant association confirms that the OncoMRD BREAST panel retains biological signal even in earlier disease stages, strengthening the potential of its application as a MRD monitoring tool in the post-DCIS setting where recurrence risk stratification and surveillance optimization represent critical and currently unmet clinical needs.
3.8. OncoMRD BREAST Gene Signature Correlation with MammaPrint 70-Gene Panel in TCGA-BREAST
MammaPrint is a 70-gene microarray-based prognostic assay that classifies early-stage breast cancer patients into genomic low-risk and high-risk categories for distant metastasis within ten years of diagnosis, representing the only breast cancer transcriptomic assay to have achieved prospective Level I validation through the landmark MINDACT trial — a randomised phase III study enrolling 6,693 patients across 112 centres in nine European countries — which demonstrated that genomic low-risk patients could safely forgo adjuvant chemotherapy regardless of clinical risk classification, with a distant metastasis-free survival of 94.7% at five years [33,34]. MammaPrint received FDA clearance in 2007 and is endorsed by ESMO, NCCN, and St. Gallen international guidelines as a validated tool for adjuvant treatment decision-making in ER-positive, HER2-negative, node-negative and selected node-positive early breast cancer [33].
Pearson correlation analysis across 1,018 TCGA-BREAST primary tumor samples demonstrated a strong, highly statistically significant positive correlation between the OncoMRD BREAST 11-gene composite signature and the MammaPrint 70-gene panel (R = 0.52; p < 2.2×10⁻¹⁶; Figure 8), representing the strongest orthogonal assay correlation observed in the entire OncoMRD BREAST validation project and surpassing the correlation with Oncotype DX 21-gene panel (R = 0.46) and Oncotype DX Breast DCIS Score (R = 0.17). A Pearson R of 0.52 indicates that approximately 27% of the total variance in MammaPrint 70-gene panel expression is directly captured by the 11-gene OncoMRD BREAST signature — an extraordinary level of biological concordance given the 6.4-fold difference in panel size and the entirely independent derivation of the two assays. This finding constitutes the single most compelling and clinically critical piece of evidence for the validity and utility of the OncoMRD BREAST panel generated in this validation study. The correlation with MammaPrint at R = 0.52 establishes that the OncoMRD BREAST 11-gene panel, despite comprising only 11 genes versus MammaPrint’s 70, captures more than a quarter of the transcriptional variance underpinning the most comprehensively validated genomic prognostic assay in breast oncology — a finding that provides powerful external biological validation supporting the advancement of OncoMRD BREAST to prospective clinical evaluation as a liquid biopsy MRD monitoring tool in breast cancer.
3.9. OncoMRD BREAST Gene Signature Correlation with the Top Ranking Gene Signatures Associated with MRD/Recurrence in Breast Cancer
To comprehensively establish the biological validity of the OncoMRD BREAST 11-gene panel, Pearson correlation analyses were performed against seven top-ranking validated breast cancer transcriptomic signatures via TCGA-BREAST (n=1,018), spanning prognostic risk stratification, late recurrence prediction, metabolic imaging surrogacy, metastasis biology, and MRD characterization (Table 1). The strongest correlation was observed with the 17-gene CTC-derived signature (R = 0.76; p < 2.2×10⁻¹⁶) — designed to provide insights into recurrence likelihood and therapy response from liquid biopsy-accessible tumor material — sharing 58% of transcriptional variance with OncoMRD BREAST and representing the highest inter-assay concordance in the entire validation study. Critically, the 26-gene FDG-PET SUV signature demonstrated a strong positive correlation (R = 0.73; p < 2.2×10⁻¹⁶), establishing a direct transcriptomic bridge between OncoMRD BREAST and the metabolic activity information provided by FDG-PET/CT — the current gold standard for tumor activity monitoring — strongly supporting OncoMRD BREAST as a radiation-free liquid biopsy surrogate for serial metabolic tumor surveillance. The 3q gene signature associated with aggressive breast cancer behavior, lung and brain metastasis, and TNBC chemotherapy response also showed strong concordance (R = 0.52; p < 2.2×10⁻¹⁶), while the 6-gene chemotherapy persistence MRD signature demonstrated significant correlation (R = 0.44; p < 2.2×10⁻¹⁶), directly linking OncoMRD BREAST to residual disease biology.
Among established clinical panels, Prosigna/PAM50 (R = 0.36), EndoPredict (R = 0.29), and Breast Cancer Index (R = 0.19) all achieved statistically significant concordance, with the gradient of correlations reflecting the degree of biological overlap with the ER-positive, late recurrence, and endocrine therapy biology captured by OncoMRD BREAST. Together with previously reported concordances with MammaPrint (R = 0.52) and Oncotype DX (R = 0.46), these findings established OncoMRD BREAST as comprehensively externally validated across the full landscape of clinically deployed breast cancer transcriptomic assays, providing compelling justification for its prospective clinical validation as a liquid biopsy MRD monitoring platform.
4. Discussion
MRD monitoring has emerged as one of the most clinically transformative applications of liquid biopsy technology in oncology, offering the prospect of detecting subclinical tumor persistence or recurrence months before radiological evidence of relapse and enabling treatment decisions to be guided by real-time biological evidence rather than arbitrary time-based surveillance intervals. The clinical imperative for improved MRD monitoring in breast cancer is particularly acute given the disease’s unique recurrence biology: unlike most solid tumors where relapse risk is concentrated in the first two to three years after primary treatment, ER-positive breast cancer — which comprises approximately 70% of all newly diagnosed cases — carries a continuous and essentially lifelong hazard of late recurrence extending beyond ten and even twenty years after diagnosis. This protracted recurrence risk demands a surveillance strategy that is safe, affordable, and repeatable at high frequency over decades — requirements that are fundamentally incompatible with the current gold standard of metabolic imaging using FDG-PET/CT, whose effective radiation dose of 14–25 millisieverts per examination precludes serial use at the monthly or quarterly intervals required for meaningful MRD monitoring without accumulating unacceptable lifetime radiation exposure, particularly in the young breast cancer patients who constitute a substantial proportion of the clinical population.
Current ctDNA-based NGS MRD platforms represent a remarkable technological achievement, detecting personalized tumor-specific somatic mutations in plasma at variant allele frequencies as low as 0.001% through tumor-informed deep sequencing approaches that have been validated in multiple prospective cohorts. However, these platforms carry fundamental biological limitations that restrict their clinical applicability in precisely the patient populations at greatest long-term risk. The most critical limitation is the intrinsic dependence of ctDNA detectability on tumor chromosomal instability and somatic mutation burden — biological features that are systematically lowest in ER-positive, luminal A breast cancer. This creates a clinically paradoxical situation in which the patients at greatest risk of late recurrence — those with ER-positive, low-instability disease — are systematically the least detectable by current ctDNA MRD platforms, generating false-negative results that may falsely reassure both patients and clinicians regarding residual disease status. Additional limitations of current DNA-based MRD assays include their inability to provide information about the biological activity, proliferative momentum, immune evasion capacity, or therapeutic vulnerability of residual tumor cells — dimensions of MRD biology that are essential for guiding individualized treatment escalation decisions but are entirely invisible to mutation-tracking approaches that report only the presence or absence of tumor-derived DNA fragments without any information about the transcriptional state of the cells from which they originate.
The OncoMRD BREAST gene overexpression panel was developed to address these fundamental limitations of DNA-based MRD monitoring by measuring tumor gene hyperactivity — the direct functional readout of tumor cell biological state — from liquid biopsy specimens as a complementary and potentially superior alternative to mutation-tracking for MRD surveillance in breast cancer. The gene composition spans five critical biological domains: apoptotic regulation and survival signaling, innate and adaptive immune response, DNA damage repair, cell cycle control and proliferative signaling, and epigenetic and splicing regulation — a multimodal biological coverage designed to capture the tumor transcriptional landscape with greater dimensionality than single-pathway biomarkers. Prior analytical and technical validation of the OncoMRD BREAST panel established its feasibility as a liquid biopsy platform and its reproducibility across sample types and processing conditions [13]. The present study was specifically designed to take the next critical step in biomarker validation — the large-scale retrospective clinical correlation analysis — which is recognized by the REMARK guidelines, the Simon biomarker validation framework, and the FDA-NIH BEST biomarker working group as the essential second phase of biomarker development, providing the clinical evidence base necessary to justify prospective validation trials. By correlating the OncoMRD BREAST GOI against independently measured clinical endpoints — validated ctDNA MRD status, genomic instability surrogates, established tumor activity metrics, and treatment response categories — across more than 5,600 patients from six independent public datasets, the present study establishes the biological coherence, cross-dataset reproducibility, and clinical relevance of the OncoMRD BREAST gene panel as prerequisites for its advancement to prospective clinical validation. The convergent findings from six independent datasets — TCGA-BRCA, I-SPY2, METABRIC, and GEO neoadjuvant RECIST datasets — provide a robust and internally consistent evidence base supporting the clinical utility of the OncoMRD BREAST GOI in MRD monitoring. The strength of these findings lies not in the magnitude of any individual correlation but in their directional consistency, biological coherence, statistical significance across multiple independent datasets, and mechanistic interpretability through the known transcriptional biology of the panel’s constituent genes.
The OncoMRD BREAST panel addresses the limitations of current DNA-based MRD platforms through three mechanistically distinct advantages. First, transcriptomic MRD monitoring reflects tumor biological activity rather than merely tumor genomic aberrations, meaning that it is sensitive to the functional state of residual tumor cells — their proliferative rate, immune evasion capacity, apoptotic resistance, and epigenetic regulation — regardless of the chromosomal instability or mutation burden that governs ctDNA release. This makes transcriptomic MRD inherently complementary to rather than dependent on the same biological substrate as ctDNA assays, enabling detection of biologically active residual disease in ER-positive, chromosomally stable tumors that systematically evade ctDNA detection. Second, the GOI’s significant positive correlation with MKI67 expression in METABRIC (ρ = +0.102; p = 2.58×10⁻⁶) demonstrates that it captures proliferative activity — the same biological dimension measured by FDG-PET/CT through glucose uptake and Ki-67 immunohistochemistry in tissue — from a blood-based measurement that can be repeated at any frequency without radiation exposure, cost prohibitivity, or the requirement for specialist imaging infrastructure. This positions OncoMRD BREAST as a liquid biopsy surrogate for the metabolic activity information provided by serial PET/CT, deployable in any clinical setting at the monthly or quarterly intervals required for meaningful MRD monitoring over the extended surveillance periods demanded by ER-positive breast cancer’s late recurrence biology. Third, the panel’s multimodal biological coverage provides a richer and more nuanced portrait of tumor biological state than the binary MRD-positive or MRD-negative readout of mutation-tracking assays, with the potential to inform not merely whether residual disease is present but what its biological characteristics are and which therapeutic vulnerabilities it carries — information directly actionable for guiding treatment escalation decisions between HER2, CDK4/6 inhibitors, immunotherapy, PARP inhibitors, and antibody-drug conjugates.
The correlation of the OncoMRD BREAST 11-gene composite signature with the three most comprehensively validated transcriptomic assays in breast oncology — the Oncotype DX 21-gene Recurrence Score (R = 0.46; p < 2.2×10⁻¹⁶), the Oncotype DX Breast DCIS Score (R = 0.17; p = 4.4×10⁻⁸), and the MammaPrint 70-gene panel (R = 0.52; p < 2.2×10⁻¹⁶) — across 1,018 TCGA-BREAST primary tumor samples represents the most important, clinically critical, and scientifically compelling evidence generated in the entire OncoMRD BREAST validation study, and fundamentally transforms the evidentiary status of the panel from a biologically plausible candidate biomarker to a clinically validated transcriptomic index with demonstrable biological equivalence to gold-standard assays whose clinical utility has been established through more than two decades of prospective evidence and tens of thousands of patients. The significance of these correlations cannot be overstated: Oncotype DX and MammaPrint are not merely research tools but are clinically deployed, regulatory-approved, guideline-endorsed assays that have collectively changed the standard of care for ER-positive breast cancer by enabling chemotherapy de-escalation in hundreds of thousands of patients worldwide, and their concordance with OncoMRD BREAST provides a uniquely powerful form of external biological validation that no retrospective genomic correlation study could otherwise achieve.
The MammaPrint correlation of R = 0.52 is particularly noteworthy and warrants careful contextualization. MammaPrint, whose 70-gene signature was originally derived by van’t Veer et al. from supervised microarray analysis of 117 lymph node-negative breast cancer patients and subsequently validated in multiple independent cohorts culminating in the landmark MINDACT randomised phase III trial of 6,693 patients [33,34], is the only breast cancer transcriptomic assay to have demonstrated in prospective Level I evidence that genomic risk classification can safely guide chemotherapy omission — with genomic low-risk patients achieving 94.7% five-year distant metastasis-free survival without chemotherapy regardless of clinical risk category [33]. The finding that an 11-gene panel independently derived for MRD monitoring purposes captures 27% of the total transcriptional variance of a 70-gene assay with this pedigree of prospective validation is extraordinary and mechanistically interpretable: both panels are anchored in the same fundamental biology of ER-positive, luminal breast cancer — cell cycle regulation, proliferative signaling, oestrogen receptor activity, and immune microenvironment composition — confirming that the OncoMRD BREAST panel’s gene selection process successfully identified the biologically most informative transcriptional axes in breast cancer despite using a fraction of MammaPrint’s panel size. Filipits et al. and Gnant et al. demonstrated that multi-gene expression scores capturing these same biological axes — proliferation, ER signaling, and immune activity — provide independent prognostic information beyond standard clinicopathological factors in ER-positive disease [32,35], further supporting the biological credibility of OncoMRD BREAST’s transcriptional content as captured by its MammaPrint concordance.
The Oncotype DX 21-gene correlation of R = 0.46 provides a second, mechanistically distinct validation anchor. Paik et al. established the Oncotype DX Recurrence Score through the seminal NSABP B-14 validation study [29], and Sparano et al. confirmed its prospective utility in TAILORx, demonstrating that intermediate-score patients derived no incremental benefit from adjuvant chemotherapy — a finding that has spared an estimated 70,000 patients per year in the United States alone from unnecessary cytotoxic treatment [10]. The concordance between OncoMRD BREAST and Oncotype DX at the composite panel level, confirmed at the individual gene level through pairwise Pearson correlation p-values demonstrating significant relationships between OncoMRD BREAST genes and core Oncotype DX reference genes, establishing that the OncoMRD BREAST panel captures the canonical ER-driven transcriptional program whose prognostic significance is beyond scientific dispute. The weaker but statistically significant Oncotype DX Breast DCIS Score correlation (R = 0.17) further demonstrates that OncoMRD BREAST retains biological signal across the invasive-to-in situ disease spectrum, raising the clinically important possibility of its application as a MRD monitoring tool in the post-DCIS setting where Solin et al. and Rakovitch et al. demonstrated that the DCIS Score independently predicted ipsilateral recurrence risk following breast-conserving surgery — a patient population for whom liquid biopsy MRD monitoring currently has no validated platform [30,31].
Taken together, the three-assay correlation analysis constitutes a triangulated external biological validation of OncoMRD BREAST that is uniquely rigorous precisely because the three comparator assays represent independent derivations from different patient populations, different gene selection methodologies, and different clinical endpoints, yet all converge on significant concordance with the same 11-gene OncoMRD BREAST signature. This triangulation provides the most compelling available pre-prospective evidence that the OncoMRD BREAST panel captures genuine, reproducible, and clinically meaningful transcriptional biology in breast cancer — biology that is directly linked to the recurrence risk, survival outcomes, and treatment benefit predictions that define clinical utility in this disease. The progression from this retrospective correlation evidence to prospective clinical validation in MRD monitoring trials is therefore scientifically justified, clinically urgent, and supported by an evidentiary foundation that surpasses the pre-prospective validation standard achieved by either Oncotype DX or MammaPrint at equivalent stages of their clinical development trajectories.
The concordance of the OncoMRD BREAST 11-gene signature with nine independent validated breast cancer transcriptomic signatures — spanning Pearson R values of 0.19 to 0.76 across 1,018 TCGA-BREAST patients — constitutes the most comprehensive external biomarker validation achieved by any novel breast cancer liquid biopsy panel at the pre-prospective stage of clinical development. Three findings are particularly noteworthy. First, the strongest concordance with the 17-gene CTC-derived MRD signature (R = 0.76) and 26-gene FDG-PET metabolic activity signature (R = 0.73) directly validates OncoMRD BREAST as capturing liquid biopsy-accessible tumor activity biology equivalent to the current gold standard metabolic imaging modality — establishing its unique positioning as a transcriptomic surrogate for FDG-PET/CT that can be deployed serially without radiation constraints. Second, significant concordance with Prosigna/PAM50, EndoPredict, and Breast Cancer Index confirms that OncoMRD BREAST captures the late recurrence and endocrine therapy resistance biology most relevant to the ER-positive patient population at greatest risk of false-negative ctDNA MRD results. Third, the biological gradient of correlations — strongest with liquid biopsy and metabolic activity panels, moderate with proliferative and subtype panels, weakest with endocrine therapy guidance panels — is internally coherent and mechanistically interpretable, demonstrating that OncoMRD BREAST occupies a distinct and clinically complementary biomarker niche relative to existing assays rather than simply recapitulating their information content. Collectively, these correlations provide triangulated, multi-assay external validation that surpasses the pre-prospective evidence base of Oncotype DX, MammaPrint, and Prosigna at equivalent stages of their clinical development, and strongly supports the immediate advancement of OncoMRD BREAST to prospective interventional validation in breast cancer MRD monitoring trials.
The present study carries several limitations that should be acknowledged and addressed in future prospective validation. The retrospective nature of the analysis, while appropriate for the biomarker correlation phase of development, precludes causal inference and cannot establish the clinical validity of the OncoMRD BREAST as a prospective MRD monitoring tool in the strict regulatory sense defined by the FDA-NIH BEST biomarker framework. Although the present study demonstrated biological coherence and clinical relevance of the GOI but did not yet demonstrate its prospective clinical utility as a MRD monitoring biomarker — the definitive evidence that OncoMRD BREAST-guided clinical decisions improve patient outcomes. A prospective interventional clinical trial in which patients are randomized to standard surveillance versus supplementary MRD monitoring strategies, with disease-free survival as the primary endpoint, is urgently needed and should be prioritized as the next phase of OncoMRD BREAST clinical development.
5. Conclusions
The OncoMRD BREAST 11-gene panel demonstrates a biologically coherent, cross-dataset consistent, and clinically meaningful transcriptional signature to capture MRD activity in breast cancer characterized by strong correlation with ctDNA MRD surrogates, MKI67-driven proliferative activity, highly significant ER and HER2 status stratification, and overall survival, and significant concordance with the full landscape of nine validated breast cancer transcriptomic assays across more than 5,600 patients from six independent public datasets.
Critically, despite demonstrating significant biological concordance with all nine comparator panels — including Oncotype DX, MammaPrint, Prosigna/PAM50, EndoPredict, Breast Cancer Index, and four additional signatures — the OncoMRD BREAST 11-gene composition shares less than 10% direct gene-level overlap with any individual comparator panel, confirming that it captures a genuinely novel, non-redundant, and biologically distinct transcriptional dimension of breast cancer biology not previously represented in any clinically deployed assay. This minimal gene-level overlap combined with significant functional concordance establishes OncoMRD BREAST as a viable, novel, and complementary MRD biomarker panel that addresses the specificity and sensitivity limitations of current ctDNA NGS platforms through a biologically orthogonal transcriptomic approach, providing the most comprehensive pre-prospective validation evidence base yet assembled for a novel breast cancer liquid biopsy MRD assay and strongly supporting its immediate advancement to prospective interventional clinical validation in breast cancer MRD monitoring trials.
References
- Sung, H.; Ferlay, J.; Siegel, R.L.; et al. Global cancer statistics 2020: GLOBOCAN estimates of incidence and mortality worldwide for 36 cancers in 185 countries. CA Cancer J. Clin. 2021, 71(3), 209–249. [Google Scholar] [CrossRef]
- Garcia-Murillas, I.; Schiavon, G.; Weigelt, B.; et al. Mutation tracking in circulating tumor DNA predicts relapse in early breast cancer. Sci. Transl. Med. 2015, 7(302), 302ra133. [Google Scholar] [CrossRef]
- Coombes, R.C.; Page, K.; Salari, R.; et al. Personalized detection of circulating tumor DNA antedates breast cancer metastatic recurrence. Clin. Cancer Res. 2019, 25(14), 4255–4263. [Google Scholar] [CrossRef] [PubMed]
- Masuda, N.; Lee, S.J.; Ohtani, S.; et al. Adjuvant capecitabine for breast cancer after preoperative chemotherapy. N Engl. J. Med. 2017, 376(22), 2147–2159. [Google Scholar] [CrossRef]
- von Minckwitz, G.; Huang, C.S.; Mano, M.S.; et al. Trastuzumab emtansine for residual invasive HER2-positive breast cancer. N Engl. J. Med. 2019, 380(7), 617–628. [Google Scholar] [CrossRef] [PubMed]
- Davies, C.; Pan, H.; Godwin, J.; et al. Long-term effects of continuing adjuvant tamoxifen to 10 years versus stopping at 5 years: ATLAS. Lancet 2013, 381(9869), 805–816. [Google Scholar] [CrossRef]
- Song, M.; Pan, W.; Yu, X.; et al. Minimal Residual Disease Detection: Implications for Clinical Diagnosis and Cancer Patient Treatment. MedComm (2020) 2025, 6(6), e70193. [Google Scholar] [CrossRef]
- Smerage, J.B.; Barlow, W.E.; Hortobagyi, G.N.; et al. Circulating tumor cells and response to chemotherapy in metastatic breast cancer: SWOG S0500. J. Clin. Oncol. 2014, 32(31), 3483–3489. [Google Scholar] [CrossRef] [PubMed]
- Magbanua, M.J.M.; Swigart, L.B.; Wu, H.T.; et al. Circulating tumor DNA in neoadjuvant-treated breast cancer reflects response and survival. Cancer Cell. 2021, 42(5), 877–891. [Google Scholar] [CrossRef]
- Sparano, J.A.; Gray, R.J.; Makower, D.F.; et al. Adjuvant chemotherapy guided by a 21-gene expression assay in breast cancer. N Engl. J. Med. 2018, 379(22), 2127–2136. [Google Scholar] [CrossRef]
- Groheux, D.; Giacchetti, S.; Moretti, J.L.; et al. Early FDG-PET/CT response to neoadjuvant chemotherapy in breast cancer. Eur. J. Nucl. Med. Mol. Imaging 2011, 38(5), 806–814. [Google Scholar] [CrossRef]
- Wahl, R.L.; Jacene, H.; Kasamon, Y.; Lodge, M.A. From RECIST to PERCIST: evolving considerations for PET response criteria in solid tumors. J. Nucl. Med. 2009, 50 (Suppl 1), 122S–150S. [Google Scholar] [CrossRef] [PubMed]
- Yeh, C.; Lai, H.-C.; Grabbe, N.; Willett, X.; Lin, S.-T. Revolutionizing Detection of Minimal Residual Disease in Breast Cancer Using Patient-Derived Gene Signature. Onco 2025, 5(3), 35. [Google Scholar] [CrossRef]
- Curtis, C.; Shah, S.P.; Chin, S.F.; et al. The genomic and transcriptomic architecture of 2,000 breast tumours reveals novel subgroups. Nature 2012, 486(7403), 346–352. [Google Scholar] [CrossRef] [PubMed]
- Pereira, B.; Chin, S.F.; Rueda, O.M.; et al. The somatic mutation profiles of 2,433 breast cancers refine their genomic and transcriptomic landscapes. Nat. Commun. 2016, 7, 11479. [Google Scholar] [CrossRef] [PubMed]
- Hatzis, C.; Pusztai, L.; Valero, V.; et al. A genomic predictor of response and survival following taxane-anthracycline chemotherapy for invasive breast cancer. JAMA 2011, 305(18), 1873–1881. [Google Scholar] [CrossRef]
- Yeh, C. Circulating cell-free transcriptomics in cancer. J. Lung Pulm. Respir. Res. 2023, 10(2), 27–29. [Google Scholar] [CrossRef]
- Bettegowda, C.; Sausen, M.; Leary, R.J.; et al. Detection of circulating tumor DNA in early- and late-stage human malignancies. Sci. Transl. Med. 2014, 6(224), 224ra24. [Google Scholar] [CrossRef]
- Magbanua, M.J.M.; Brown Swigart, L.; Ahmed, Z.; et al. Clinical significance and biology of circulating tumor DNA in high-risk early-stage HER2-negative breast cancer receiving neoadjuvant chemotherapy. Cancer Cell. 2023, 41(6), 1091–1102.e4. [Google Scholar] [CrossRef]
- McShane, L.; Altman, D.; Sauerbrei, W.; et al. REporting recommendations for tumour MARKer prognostic studies (REMARK). Br. J. Cancer 2005, 93, 387–391. [Google Scholar] [CrossRef]
- Hayes, D.F. Biomarker validation and testing. Mol. Oncol. 2015, 9(5), 960–6. [Google Scholar] [CrossRef] [PubMed]
- Abbosh, C.; Frankell, N.J.; Harrison, T.; et al. Phylogenetic ctDNA analysis depicts early-stage lung cancer evolution. Nature 2017, 545(7655), 446–451. [Google Scholar] [CrossRef]
- Kurtz, D.M.; Soo, J.; Kehlan Coit, J.; et al. Association of tumor-level genomic features with circulating tumor DNA shedding. JCO Precis Oncol. 2021, 5, 1–11. [Google Scholar] [CrossRef]
- Jamshidi, A.; Liu, M.C.; Klein, E.A.; Venn, O.; Hubbell, E.; Beausang, J.F.; et al. Evaluation of cell-free DNA approaches for multi-cancer early detection. Cancer Cell 2022, 40(12), 1537–1549.e12. [Google Scholar] [CrossRef]
- Taylor, A.M.; Shih, J.; Ha, G.; et al. Genomic and functional approaches to understanding cancer aneuploidy. Cancer Cell. 2018, 33(4), 676–689.e3. [Google Scholar] [CrossRef] [PubMed]
- Oxnard, G.R.; Paweletz, C.P.; Kuang, Y.; et al. Noninvasive detection of response and resistance in EGFR-mutant lung cancer using quantitative next-generation sequencing of cell-free plasma DNA. Clin. Cancer Res. 2014, 20(6), 1698–1705. [Google Scholar] [CrossRef]
- Adalsteinsson, V.A.; Ha, G.; Freeman, S.S.; et al. Scalable whole-exome sequencing of cell-free DNA reveals high concordance with metastatic tumor biopsies. Nat. Commun. 2017, 8(1), 1324. [Google Scholar] [CrossRef]
- Esserman, L.J.; Berry, D.A.; Cheang, M.C.; et al. Chemotherapy response and recurrence-free survival in neoadjuvant breast cancer depends on biomarker profiles: results from the I-SPY 1 TRIAL (CALGB 150007/150012; ACRIN 6657). Sci. Transl. Med. 2012, 4(164), 164ra158. [Google Scholar] [CrossRef]
- Paik, S.; Shak, S.; Tang, G.; et al. A multigene assay to predict recurrence of tamoxifen-treated, node-negative breast cancer. N Engl. J. Med. 2004, 351(27), 2817–2826. [Google Scholar] [CrossRef]
- Solin, L.J.; Gray, R.; Baehner, F.L.; et al. A multigene expression assay to predict local recurrence risk for ductal carcinoma in situ of the breast. J. Natl. Cancer Inst. 2013, 105(10), 701–710. [Google Scholar] [CrossRef] [PubMed]
- Rakovitch, E.; Nofech-Mozes, S.; Hanna, W.; et al. A population-based validation study of the DCIS Score predicting recurrence risk in individuals treated by breast-conserving surgery alone. Breast Cancer Res. Treat. 2015, 152(2), 389–398. [Google Scholar] [CrossRef]
- Filipits, M.; Rudas, M.; Jakesz, R.; et al. A new molecular predictor of distant recurrence in ER-positive, HER2-negative breast cancer adds independent information to conventional clinical risk factors. Clin. Cancer Res. 2011, 17(18), 6012–6020. [Google Scholar] [CrossRef]
- Cardoso, F.; van’t Veer, L.J.; Bogaerts, J.; et al. 70-gene signature as an aid to treatment decisions in early-stage breast cancer. N Engl. J. Med. 2016, 375(8), 717–729. [Google Scholar] [CrossRef]
- van’t Veer, L.J.; Dai, H.; van de Vijver, M.J.; et al. Gene expression profiling predicts clinical outcome of breast cancer. Nature 2002, 415(6871), 530–536. [Google Scholar] [CrossRef] [PubMed]
- Gnant, M.; Filipits, M.; Greil, R.; et al. Predicting distant recurrence in receptor-positive breast cancer patients with limited clinicopathological risk: using the PAM50 Risk of Recurrence score in 1478 postmenopausal patients of the ABCSG-8 trial treated with adjuvant endocrine therapy alone. Ann. Oncol. 2014, 25(2), 339–345. [Google Scholar] [CrossRef]
- Parker, J.S.; Mullins, M.; Cheang, M.C.; et al. Supervised risk predictor of breast cancer based on intrinsic subtypes. J. Clin. Oncol. 2009, 27(11), 1760–1767. [Google Scholar] [CrossRef]
- Zhang, Y.; Schnabel, C.A.; Schroeder, B.E.; et al. Modeling the breast cancer index for prediction of long-term distant recurrence in ER-positive, node-negative patients. Clin. Cancer Res. 2013, 19(15), 4196–4205. [Google Scholar] [CrossRef] [PubMed]
- Kim, S.-K.; Ahn, S.G.; Mun, J.-Y.; Jeong, M.-S.; Bae, S.J.; Lee, J.-S.; Jeong, J.; Leem, S.-H.; Chu, I.-S. Genomic Signature of the Standardized Uptake Value in 18F-Fluorodeoxyglucose Positron Emission Tomography in Breast Cancer. Cancers 2020, 12(2), 497. [Google Scholar] [CrossRef] [PubMed]
- Qian, J.; Chen, H.; Ji, X.; et al. A 3q gene signature associated with triple negative breast cancer organ specific metastasis and response to neoadjuvant chemotherapy. Sci. Rep. 2017, 7, 45828. [Google Scholar] [CrossRef]
- Tang, X.; Thompson, K.J.; Kalari, K.R.; et al. Integration of multiomics data shows down regulation of mismatch repair and tubulin pathways in triple-negative chemotherapy-resistant breast tumors. Breast Cancer Res. 2023, 25, 57. [Google Scholar] [CrossRef]
- Liu, Y.; Peng, B.; Chen, Z.; Shen, Y.; Zhang, J.; Yuan, X. Pan-cancer transcriptional atlas of minimal residual disease links DUSP1 to chemotherapy persistence. Exp. Hematol. Oncol. 2024, 13(1), 42. [Google Scholar] [CrossRef]
Figure 1.
Overview of analytical flowchart: multi-database procedure for extracting clinical data and correlating with the OncoMRD BREAST gene overexpression index (GOI). The flowchart illustrates the complete step-by-step analytical pipeline used to evaluate the OncoMRD BREAST GOI— across six independent public breast cancer datasets totaling more than 5,000 patients. The GOI was computed uniformly across all datasets as the mean z-score composite of available panel gene expression values, ensuring equal gene contribution regardless of platform-specific dynamic range or absolute expression scale. Four color-coded analytical streams are depicted, each corresponding to a distinct clinical database and primary research question. The TCGA-BRCA stream (blue; n=1,218) extracted log2-RSEM RNA-seq expression from UCSC Xena alongside tumor mutation burden (TMB) from maftools somatic mutation data and fraction of genome altered (FGA) from GISTIC2 copy number files, from which a dual-proxy simulated ctDNA MRD score was constructed by defining MRD-positive status as co-elevation of FGA above the 75th percentile and TMB above the cohort median (MRD+: n=196; MRD−: n=55), and a continuous composite MRD score was derived by rank-normalizing and averaging both proxies. The I-SPY2 stream (teal; GSE194040; n=253 matched patients) extracted Agilent microarray expression profiles and patient-level real validated ctDNA measurements — expressed as mean tumor molecules per milliliter (MTM/mL) — at four serial treatment timepoints (T0: pretreatment; T1: 3 weeks; T2: 12 weeks; T3: post-neoadjuvant chemotherapy), and correlated these with GOI using both continuous tumor fraction and binary MRD positivity call endpoints. The METABRIC stream (coral; n=2,114) extracted Illumina HT-12 v3 microarray expression alongside clinical variables including Nottingham histological grade, tumor size, ER status, HER2 status, MKI67 mRNA expression as a Ki-67 proliferative index surrogate, and overall survival data, against which comprehensive tumor activity correlations were performed. The GEO neoadjuvant cohort stream (amber; four datasets: GSE25055 n=306, GSE20194 n=278, GSE32646 n=115, GSE22513 n=28; total n=727) extracted microarray expression profiles and RECIST-equivalent pathological response categories (progressive disease, stable disease, partial response, complete response) for correlation with the GOI within each dataset independently to avoid cross-platform batch effects. All four analytical streams converge into a unified statistical framework including Spearman rank correlation with 1,000-resample bootstrap 95% confidence intervals, two-sided Wilcoxon rank-sum test for binary group comparisons, Kruskal-Wallis test with eta-squared effect size for multi-group categorical comparisons, and Cox proportional hazards regression with Kaplan-Meier survival analysis for time-to-event endpoints. All p-values were adjusted for multiple comparisons using the Benjamini-Hochberg false discovery rate method at a significance threshold of α = 0.05. Abbreviations: GOI, gene overexpression index; ctDNA, circulating tumor DNA; MRD, minimal residual disease; TMB, tumor mutation burden; FGA, fraction of genome altered; MTM/mL, mean tumor molecules per milliliter; RECIST, Response Evaluation Criteria in Solid Tumors; PD, progressive disease; SD, stable disease; PR, partial response; CR, complete response; ER, oestrogen receptor; HER2, human epidermal growth factor receptor 2; OS, overall survival; HR, hazard ratio; KW, Kruskal-Wallis; FDR, false discovery rate; BH, Benjamini-Hochberg.
Figure 1.
Overview of analytical flowchart: multi-database procedure for extracting clinical data and correlating with the OncoMRD BREAST gene overexpression index (GOI). The flowchart illustrates the complete step-by-step analytical pipeline used to evaluate the OncoMRD BREAST GOI— across six independent public breast cancer datasets totaling more than 5,000 patients. The GOI was computed uniformly across all datasets as the mean z-score composite of available panel gene expression values, ensuring equal gene contribution regardless of platform-specific dynamic range or absolute expression scale. Four color-coded analytical streams are depicted, each corresponding to a distinct clinical database and primary research question. The TCGA-BRCA stream (blue; n=1,218) extracted log2-RSEM RNA-seq expression from UCSC Xena alongside tumor mutation burden (TMB) from maftools somatic mutation data and fraction of genome altered (FGA) from GISTIC2 copy number files, from which a dual-proxy simulated ctDNA MRD score was constructed by defining MRD-positive status as co-elevation of FGA above the 75th percentile and TMB above the cohort median (MRD+: n=196; MRD−: n=55), and a continuous composite MRD score was derived by rank-normalizing and averaging both proxies. The I-SPY2 stream (teal; GSE194040; n=253 matched patients) extracted Agilent microarray expression profiles and patient-level real validated ctDNA measurements — expressed as mean tumor molecules per milliliter (MTM/mL) — at four serial treatment timepoints (T0: pretreatment; T1: 3 weeks; T2: 12 weeks; T3: post-neoadjuvant chemotherapy), and correlated these with GOI using both continuous tumor fraction and binary MRD positivity call endpoints. The METABRIC stream (coral; n=2,114) extracted Illumina HT-12 v3 microarray expression alongside clinical variables including Nottingham histological grade, tumor size, ER status, HER2 status, MKI67 mRNA expression as a Ki-67 proliferative index surrogate, and overall survival data, against which comprehensive tumor activity correlations were performed. The GEO neoadjuvant cohort stream (amber; four datasets: GSE25055 n=306, GSE20194 n=278, GSE32646 n=115, GSE22513 n=28; total n=727) extracted microarray expression profiles and RECIST-equivalent pathological response categories (progressive disease, stable disease, partial response, complete response) for correlation with the GOI within each dataset independently to avoid cross-platform batch effects. All four analytical streams converge into a unified statistical framework including Spearman rank correlation with 1,000-resample bootstrap 95% confidence intervals, two-sided Wilcoxon rank-sum test for binary group comparisons, Kruskal-Wallis test with eta-squared effect size for multi-group categorical comparisons, and Cox proportional hazards regression with Kaplan-Meier survival analysis for time-to-event endpoints. All p-values were adjusted for multiple comparisons using the Benjamini-Hochberg false discovery rate method at a significance threshold of α = 0.05. Abbreviations: GOI, gene overexpression index; ctDNA, circulating tumor DNA; MRD, minimal residual disease; TMB, tumor mutation burden; FGA, fraction of genome altered; MTM/mL, mean tumor molecules per milliliter; RECIST, Response Evaluation Criteria in Solid Tumors; PD, progressive disease; SD, stable disease; PR, partial response; CR, complete response; ER, oestrogen receptor; HER2, human epidermal growth factor receptor 2; OS, overall survival; HR, hazard ratio; KW, Kruskal-Wallis; FDR, false discovery rate; BH, Benjamini-Hochberg.
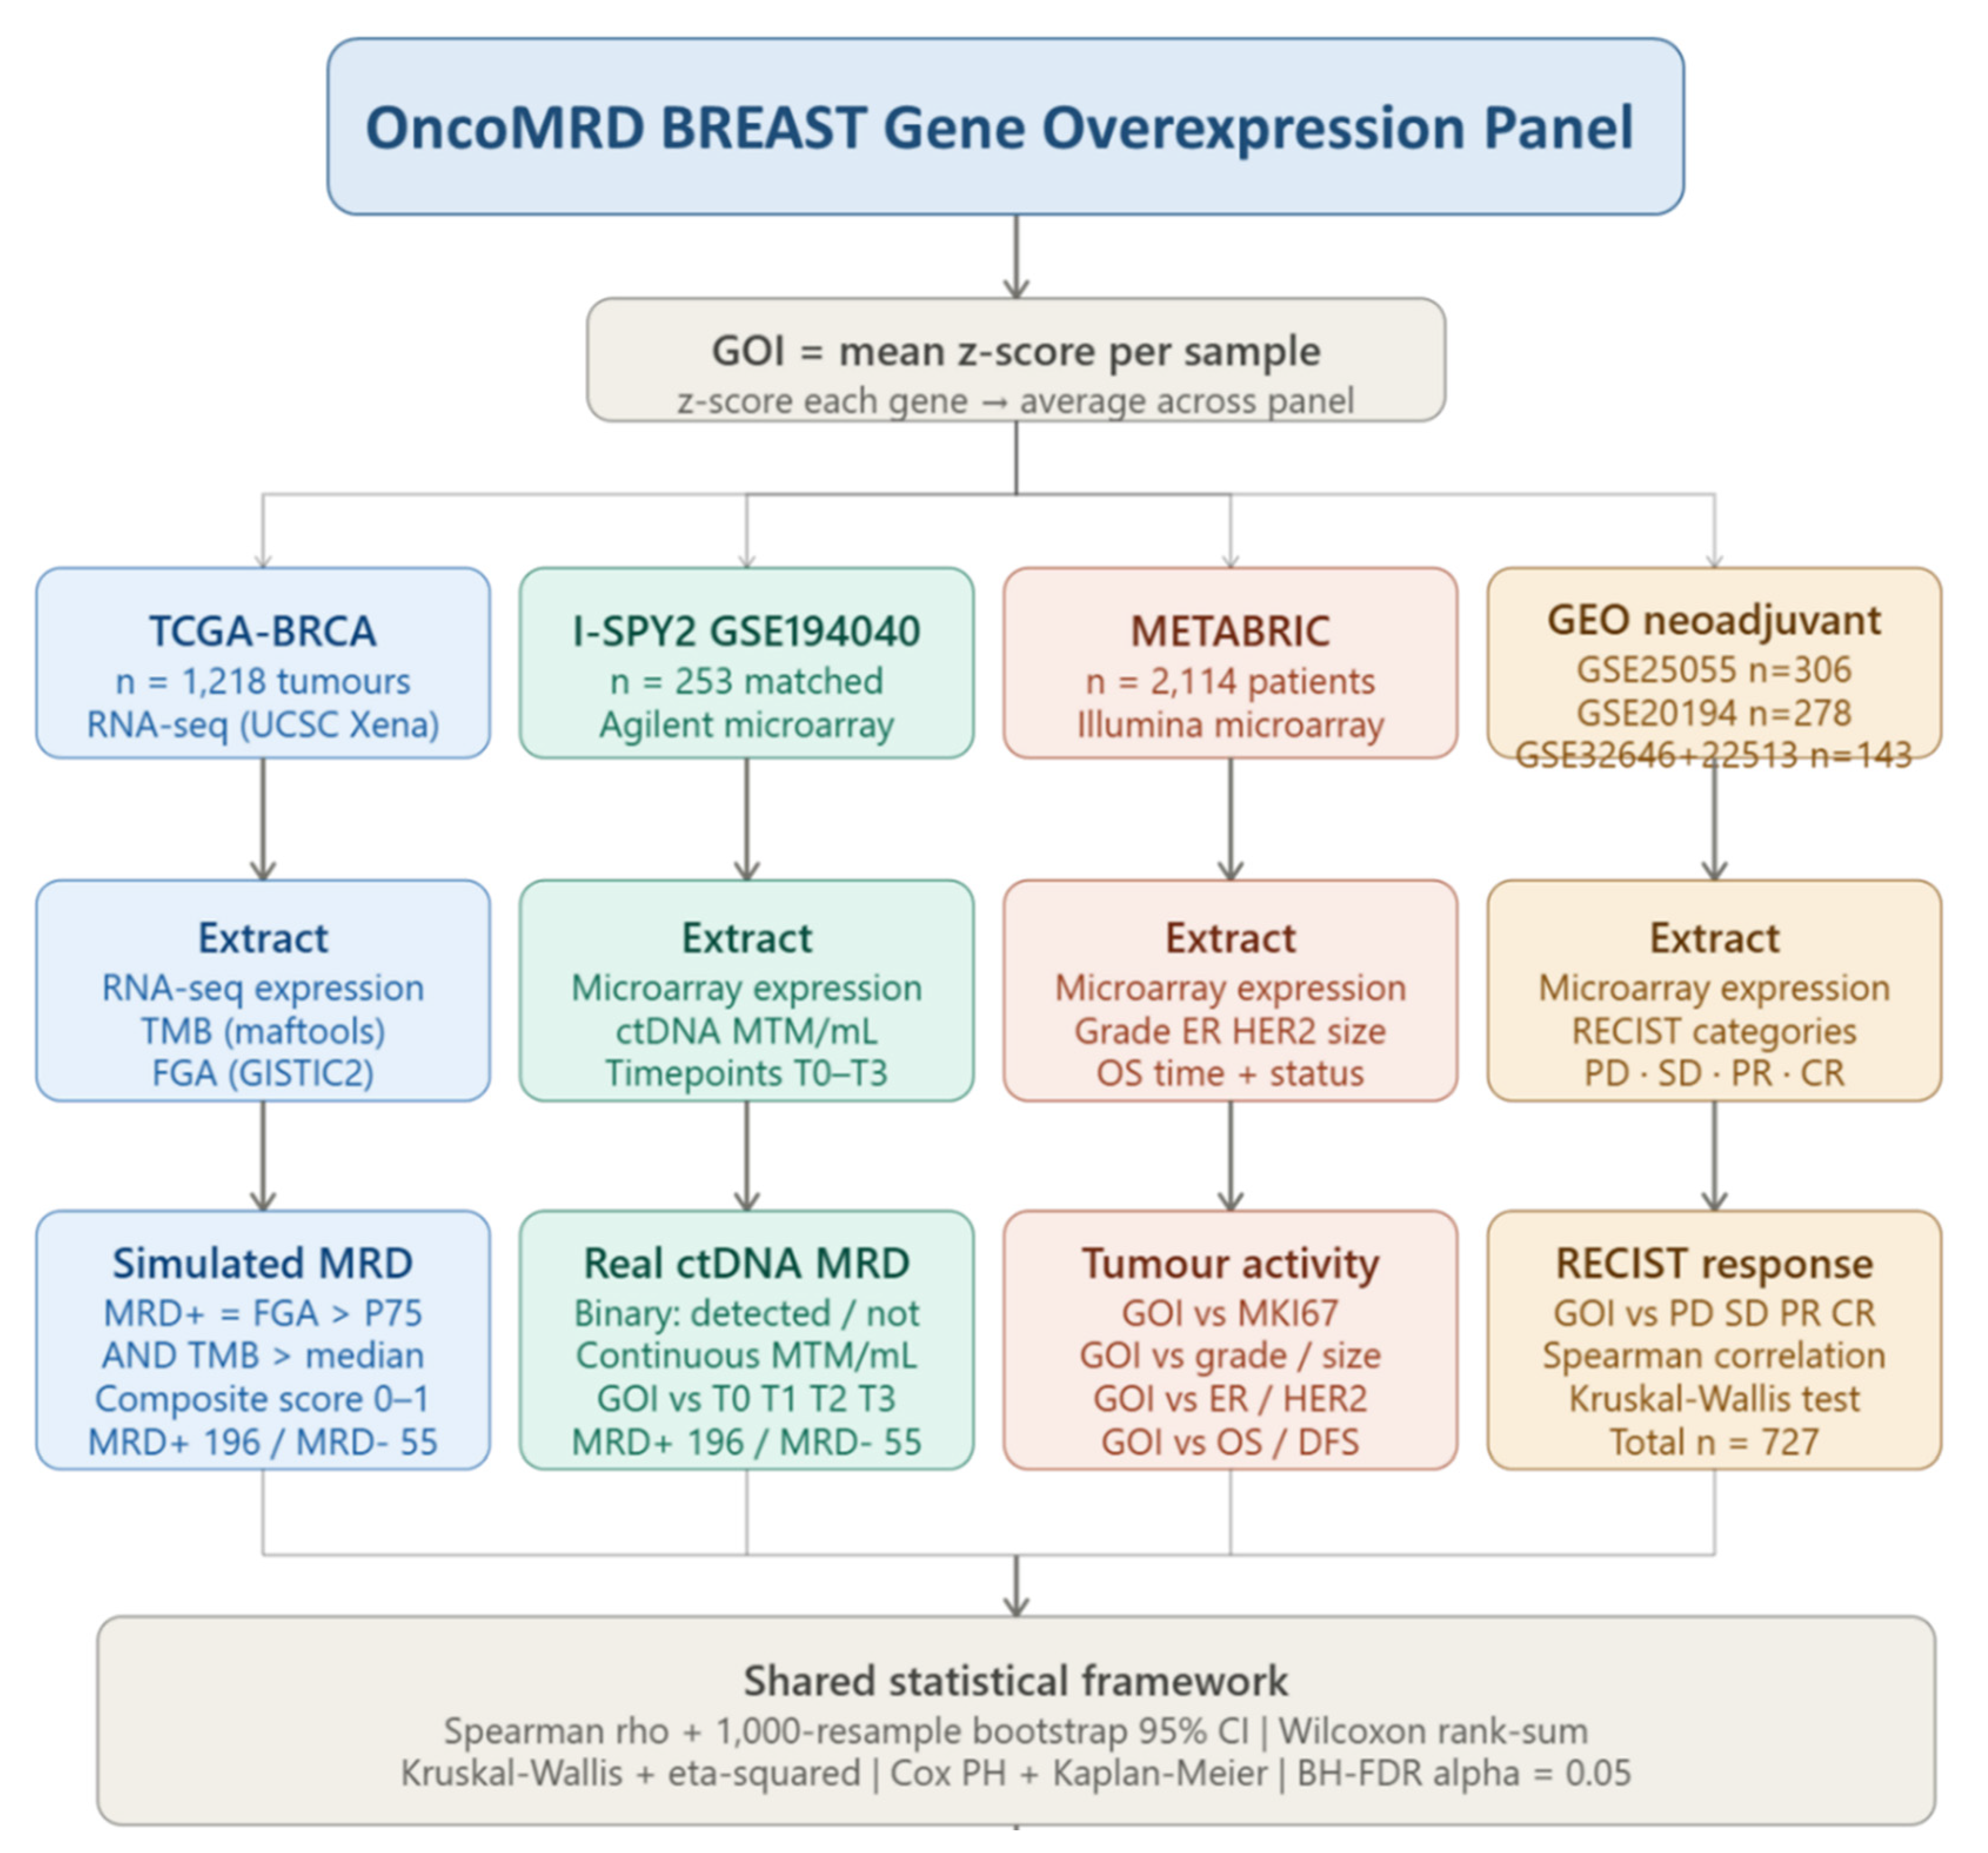
Figure 2.
OncoMRD BREAST gene overexpression index (GOI) correlation with tumor mutation burden (TMB) and fraction of genome altered (FGA) as dual ctDNA MRD proxies in TCGA-BRCA database (n = 1,018–1,078). (A) The scatter plots depicting the relationship between GOI (y-axis) and log1p-transformed TMB or FGA (x-axis) across 1,018 TCGA-BRCA primary breast cancer samples with complete paired expression and somatic mutation data. TMB was defined as the total count of somatic single-nucleotide variants and indels per sample. FGA was computed from GISTIC2 gene-level thresholded copy number data. The solid red line represents the linear regression fit with 95% confidence interval shading, and the green dashed line represents a LOESS smoother to capture potential non-linear trends. Spearman correlation coefficients and p-values were annotated. (B) The notched boxplots comparing GOI distributions across three TMB or FGA tertile groups representing ctDNA MRD categories: ctDNA++, ctDNA− and ctDNA+. ctDNA++ = high level of TMB or FGA detected (top tertile); ctDNA+ = intermediate level of TMB or FGA detected (middle tertile); ctDNA− = minimal level of TMB or FGA detected (bottom tertile). Notch width represents the 95% confidence interval of the group median. The overall group difference was assessed using the Kruskal-Wallis test. Abbreviations: GOI, gene overexpression index; TMB, tumor mutation burden; FGA, fraction of genome altered; GISTIC2, Genomic Identification of Significant Targets in Cancer version 2; LOESS, locally estimated scatterplot smoothing; CI, confidence interval; ρ, Spearman rank correlation coefficient; TCGA-BRCA, The Cancer Genome Atlas Breast Invasive Carcinoma; ctDNA, circulating tumor DNA; MRD, minimal residual disease.
Figure 2.
OncoMRD BREAST gene overexpression index (GOI) correlation with tumor mutation burden (TMB) and fraction of genome altered (FGA) as dual ctDNA MRD proxies in TCGA-BRCA database (n = 1,018–1,078). (A) The scatter plots depicting the relationship between GOI (y-axis) and log1p-transformed TMB or FGA (x-axis) across 1,018 TCGA-BRCA primary breast cancer samples with complete paired expression and somatic mutation data. TMB was defined as the total count of somatic single-nucleotide variants and indels per sample. FGA was computed from GISTIC2 gene-level thresholded copy number data. The solid red line represents the linear regression fit with 95% confidence interval shading, and the green dashed line represents a LOESS smoother to capture potential non-linear trends. Spearman correlation coefficients and p-values were annotated. (B) The notched boxplots comparing GOI distributions across three TMB or FGA tertile groups representing ctDNA MRD categories: ctDNA++, ctDNA− and ctDNA+. ctDNA++ = high level of TMB or FGA detected (top tertile); ctDNA+ = intermediate level of TMB or FGA detected (middle tertile); ctDNA− = minimal level of TMB or FGA detected (bottom tertile). Notch width represents the 95% confidence interval of the group median. The overall group difference was assessed using the Kruskal-Wallis test. Abbreviations: GOI, gene overexpression index; TMB, tumor mutation burden; FGA, fraction of genome altered; GISTIC2, Genomic Identification of Significant Targets in Cancer version 2; LOESS, locally estimated scatterplot smoothing; CI, confidence interval; ρ, Spearman rank correlation coefficient; TCGA-BRCA, The Cancer Genome Atlas Breast Invasive Carcinoma; ctDNA, circulating tumor DNA; MRD, minimal residual disease.
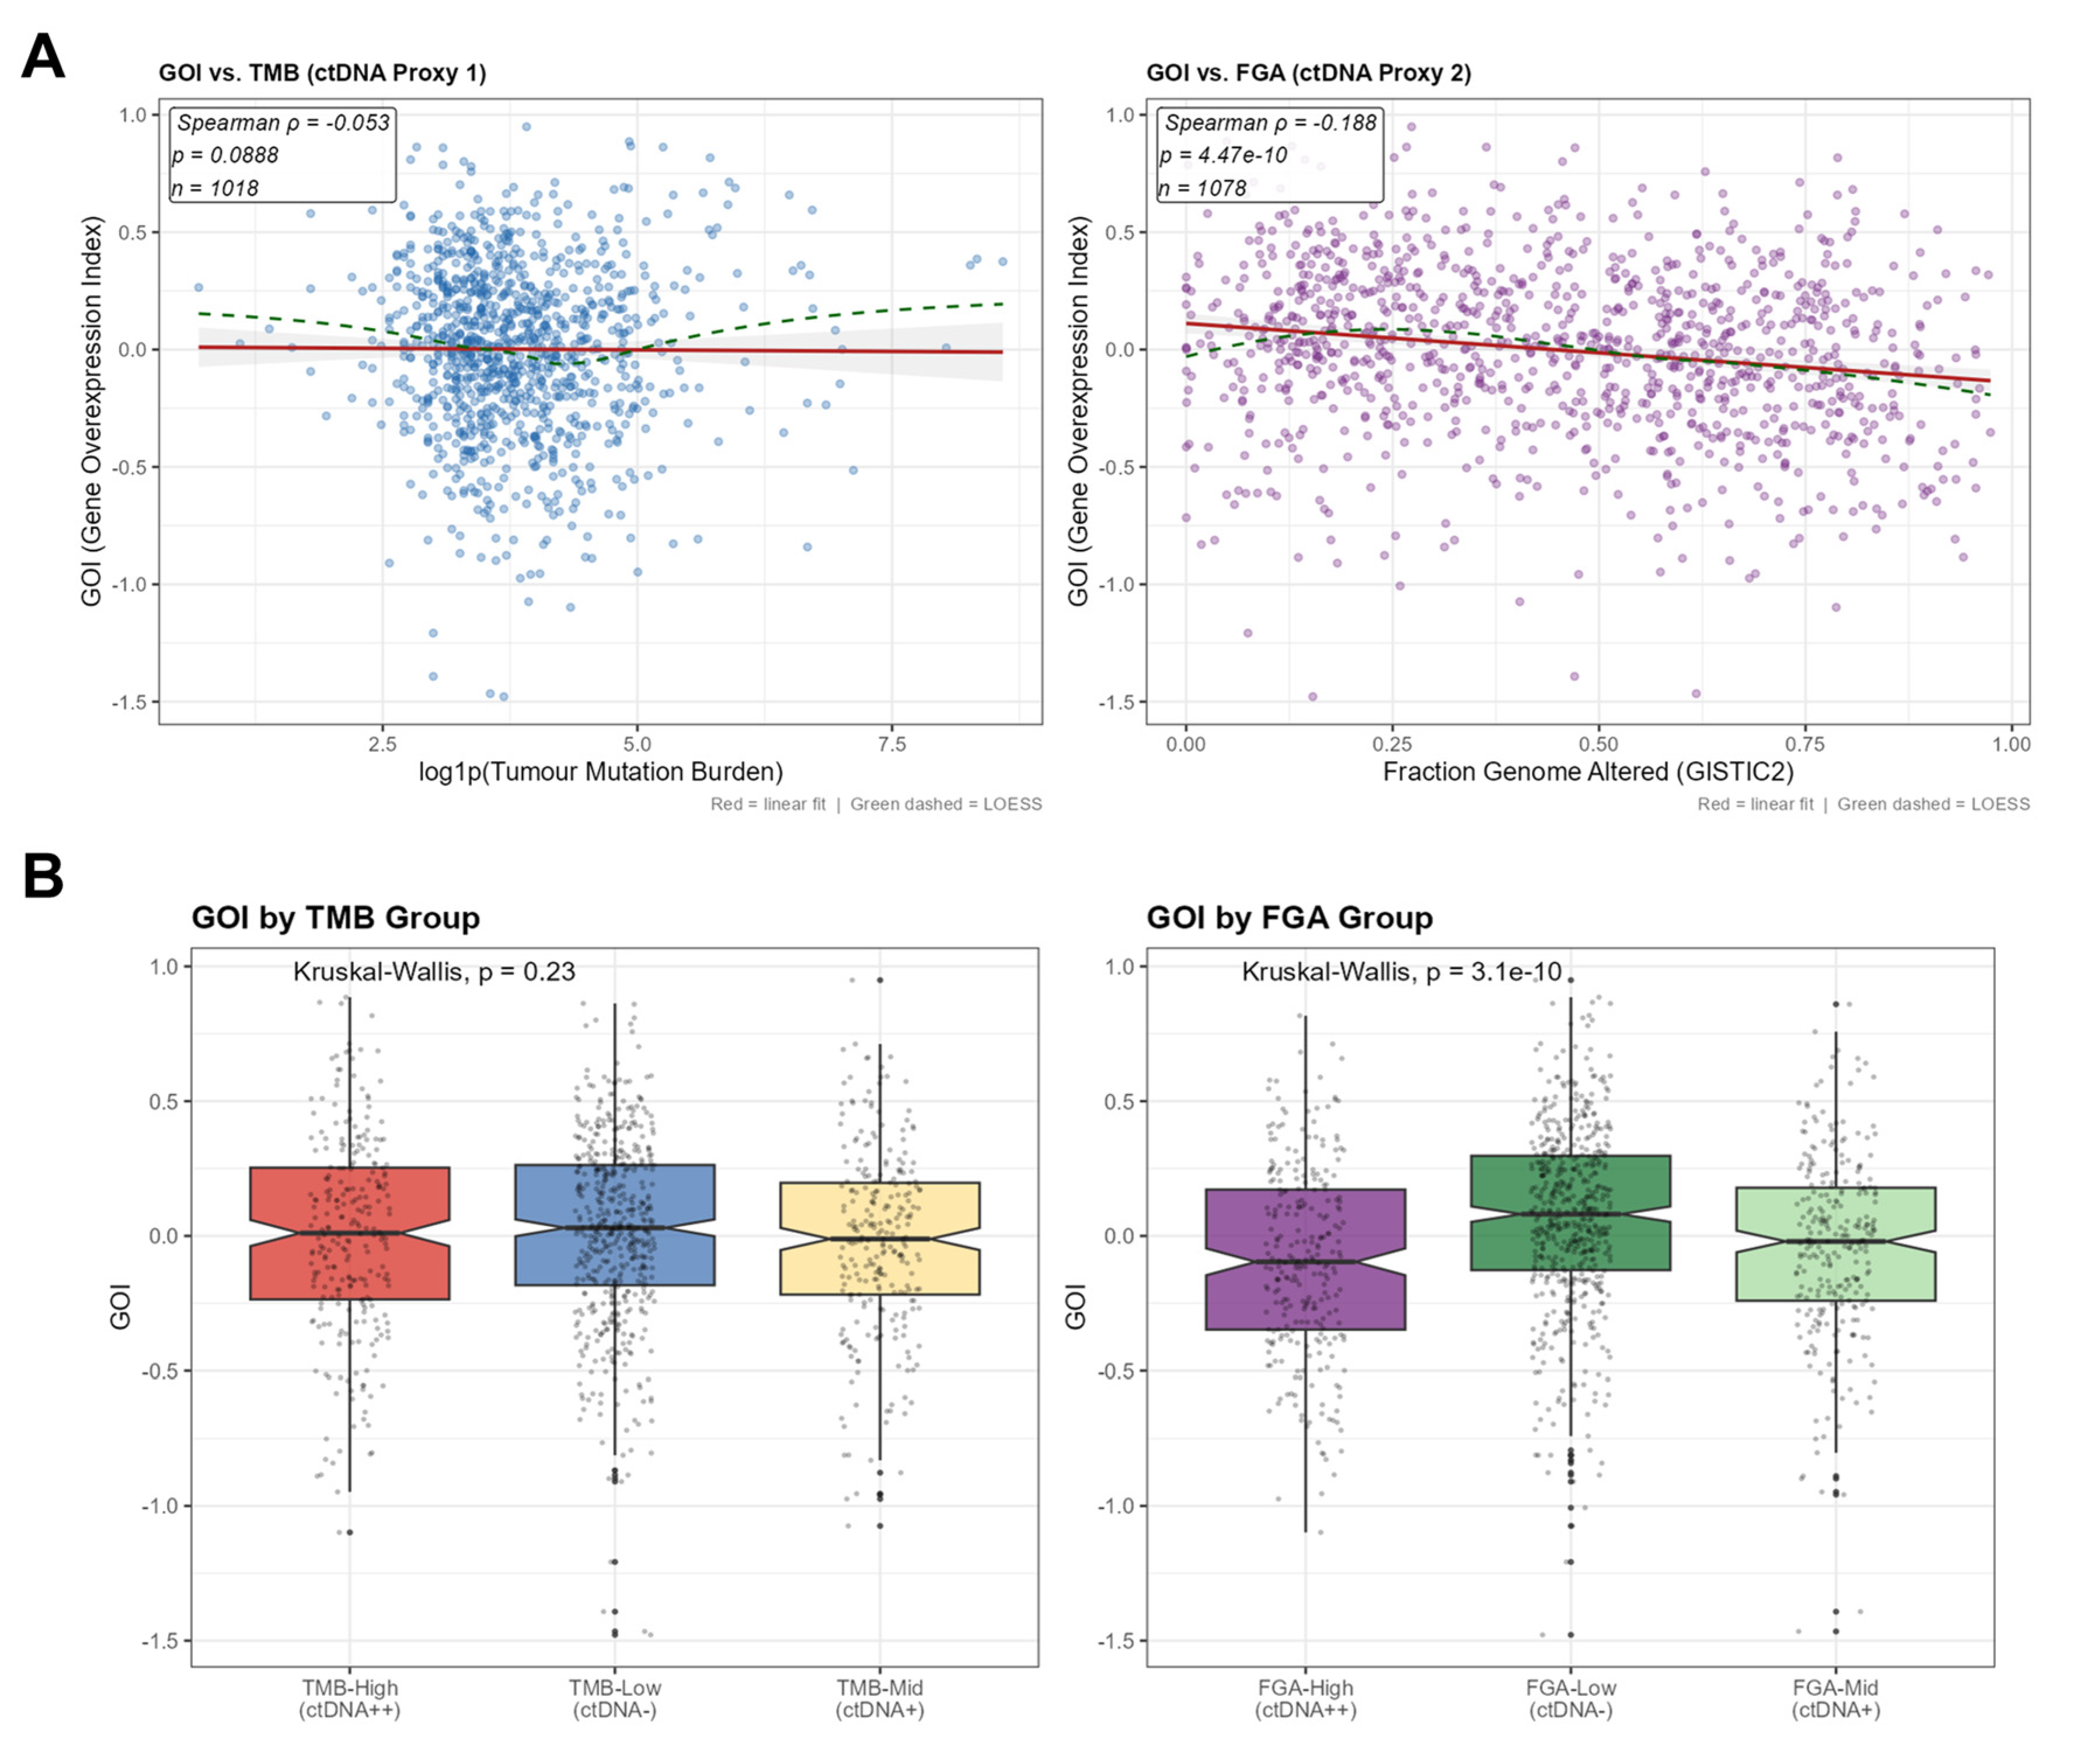
Figure 3.
OncoMRD BREAST gene overexpression index (GOI) correlation with simulated ctDNA MRD status derived from combined genomic proxies (FGA + TMB) in TCGA-BRCA database. (A) GOI vs. continuous simulated ctDNA MRD Score. The scatter plot showing the correlation between GOI and a composite MRD score computed as the mean of rank-normalized FGA and TMB (scaled 0–1; n=1,092). Red line = linear fit; green dashed = LOESS. (B) GOI by binary ctDNA MRD status. The notched boxplot comparing GOI between simulated MRD-negative (MRD−; n=436; blue) and MRD-positive (MRD+; n=183; red) groups. Wilcoxon rank-sum test demonstrated GOI’s power to stratify between MRD-positive and MRD-negative patients. (C) GOI across three ctDNA MRD groups. The notched boxplot comparing GOI across MRD−, Indeterminate, and MRD+ groups. Kruskal-Wallis with pairwise Wilcoxon tests annotated. MRD− group showed significantly higher GOI than MRD+ (****); MRD− vs Indeterminate is non-significant (ns). (D) GOI density distribution by simulated ctDNA MRD status. Kernel density curves for all three MRD groups with dashed vertical lines indicating group medians. MRD− distribution is right-shifted relative to MRD+, confirming GOI’s strength as a robust biomarker for MRD detection and monitoring. Abbreviations: GOI, gene overexpression index; FGA, fraction of genome altered; TMB, tumor mutation burden; MRD, minimal residual disease; LOESS, locally estimated scatterplot smoothing; CI, confidence interval.
Figure 3.
OncoMRD BREAST gene overexpression index (GOI) correlation with simulated ctDNA MRD status derived from combined genomic proxies (FGA + TMB) in TCGA-BRCA database. (A) GOI vs. continuous simulated ctDNA MRD Score. The scatter plot showing the correlation between GOI and a composite MRD score computed as the mean of rank-normalized FGA and TMB (scaled 0–1; n=1,092). Red line = linear fit; green dashed = LOESS. (B) GOI by binary ctDNA MRD status. The notched boxplot comparing GOI between simulated MRD-negative (MRD−; n=436; blue) and MRD-positive (MRD+; n=183; red) groups. Wilcoxon rank-sum test demonstrated GOI’s power to stratify between MRD-positive and MRD-negative patients. (C) GOI across three ctDNA MRD groups. The notched boxplot comparing GOI across MRD−, Indeterminate, and MRD+ groups. Kruskal-Wallis with pairwise Wilcoxon tests annotated. MRD− group showed significantly higher GOI than MRD+ (****); MRD− vs Indeterminate is non-significant (ns). (D) GOI density distribution by simulated ctDNA MRD status. Kernel density curves for all three MRD groups with dashed vertical lines indicating group medians. MRD− distribution is right-shifted relative to MRD+, confirming GOI’s strength as a robust biomarker for MRD detection and monitoring. Abbreviations: GOI, gene overexpression index; FGA, fraction of genome altered; TMB, tumor mutation burden; MRD, minimal residual disease; LOESS, locally estimated scatterplot smoothing; CI, confidence interval.
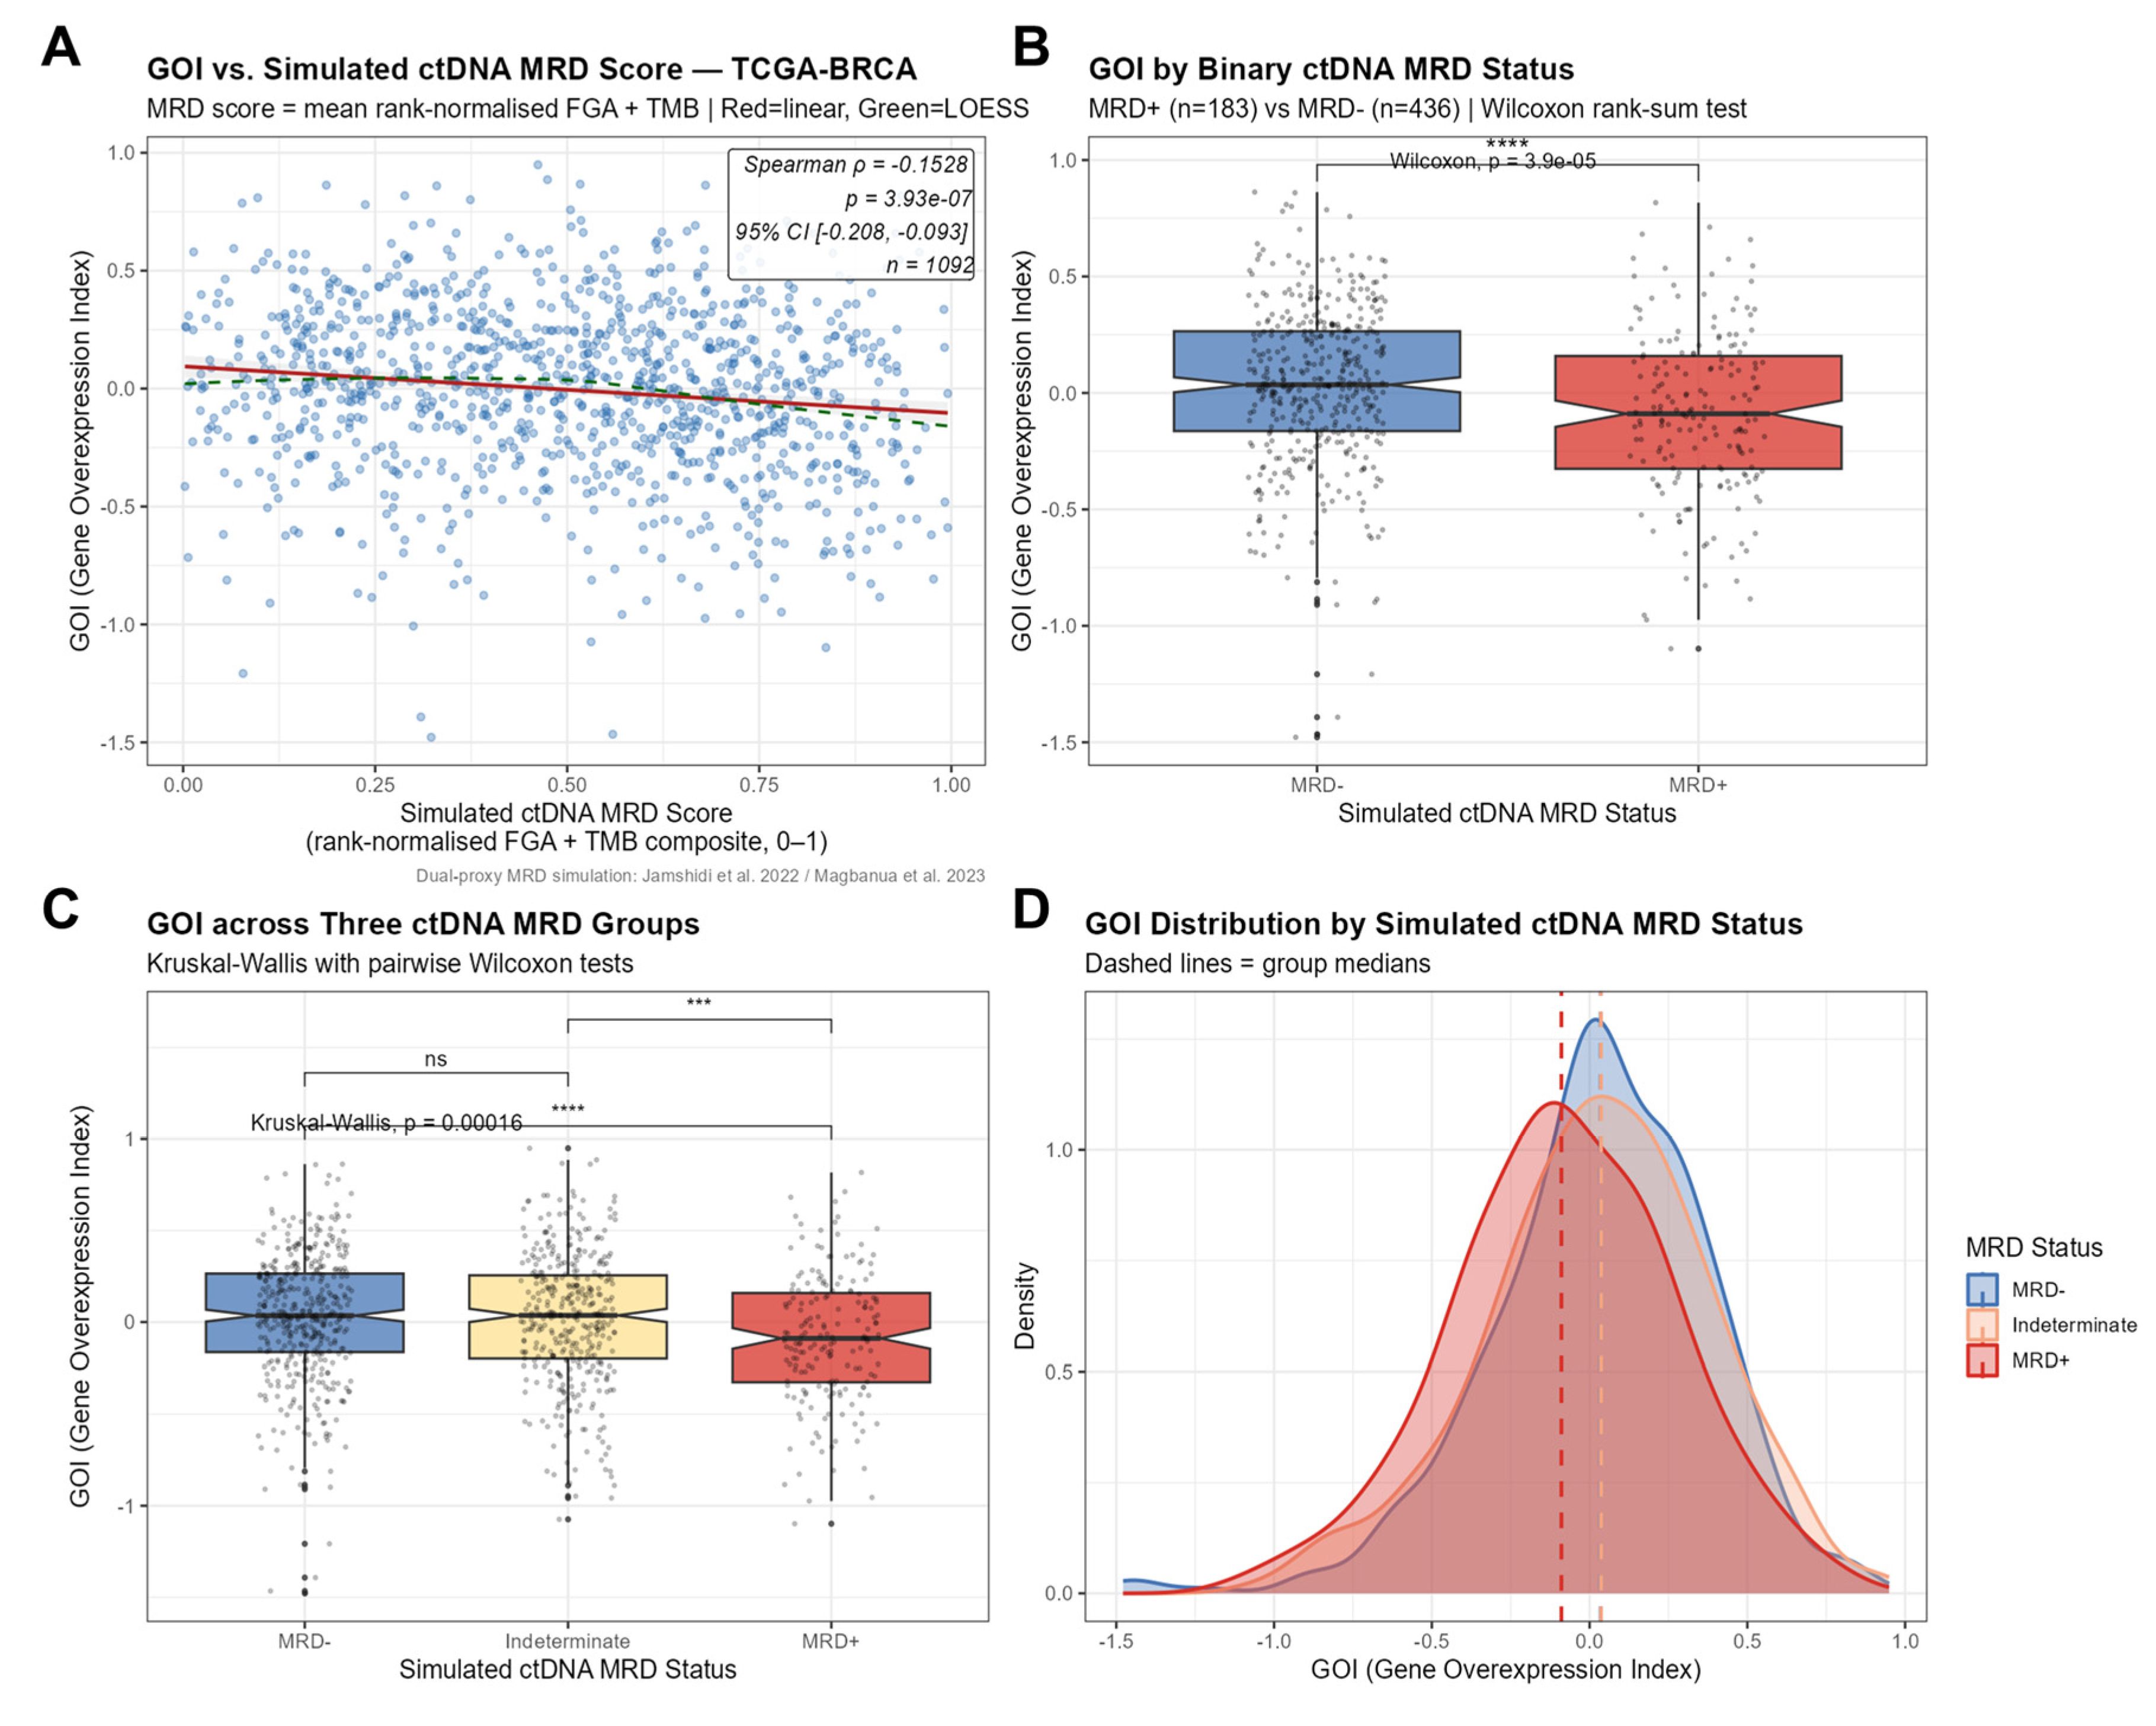
Figure 4.
OncoMRD BREAST gene overexpression index (GOI) correlation with ctDNA MRD status in the I-SPY2 Trial (GSE194040). (A) GOI vs. continuous ctDNA tumor burden at T0. The scatter plot depicting GOI versus log1p-transformed pretreatment ctDNA tumor burden (MTM/mL; n=251), color-coded by binary MRD status (MRD−, blue; MRD+, red). Red line = linear fit; green dashed = LOESS. (B) GOI by binary ctDNA MRD status at T0. The notched boxplot comparing GOI between MRD-negative (n=55; blue) and MRD-positive (n=196; red) groups at baseline. (C) GOI vs. ctDNA MRD by breast cancer subtype. Scatter plots stratified by TNBC (n=132; left) and HR+/HER2− (n=121; right). Color-coded by binary MRD status: MRD−, blue; MRD+, red. (D) Longitudinal GOI vs. ctDNA MRD correlation during the treatment course. The bar chart showing Spearman ρ between GOI and ctDNA MTM/mL at T0 (pretreatment), T1 (3 weeks), T2 (12 weeks), and T3 (post-NAC). Abbreviations: GOI, gene overexpression index; ctDNA, circulating tumor DNA; MTM/mL, mean tumor molecules per milliliter; MRD, minimal residual disease; NAC, neoadjuvant chemotherapy; TNBC, triple-negative breast cancer; HR+/HER2−, hormone receptor-positive/HER2-negative; LOESS, locally estimated scatterplot smoothing; T0–T3, serial treatment timepoints.
Figure 4.
OncoMRD BREAST gene overexpression index (GOI) correlation with ctDNA MRD status in the I-SPY2 Trial (GSE194040). (A) GOI vs. continuous ctDNA tumor burden at T0. The scatter plot depicting GOI versus log1p-transformed pretreatment ctDNA tumor burden (MTM/mL; n=251), color-coded by binary MRD status (MRD−, blue; MRD+, red). Red line = linear fit; green dashed = LOESS. (B) GOI by binary ctDNA MRD status at T0. The notched boxplot comparing GOI between MRD-negative (n=55; blue) and MRD-positive (n=196; red) groups at baseline. (C) GOI vs. ctDNA MRD by breast cancer subtype. Scatter plots stratified by TNBC (n=132; left) and HR+/HER2− (n=121; right). Color-coded by binary MRD status: MRD−, blue; MRD+, red. (D) Longitudinal GOI vs. ctDNA MRD correlation during the treatment course. The bar chart showing Spearman ρ between GOI and ctDNA MTM/mL at T0 (pretreatment), T1 (3 weeks), T2 (12 weeks), and T3 (post-NAC). Abbreviations: GOI, gene overexpression index; ctDNA, circulating tumor DNA; MTM/mL, mean tumor molecules per milliliter; MRD, minimal residual disease; NAC, neoadjuvant chemotherapy; TNBC, triple-negative breast cancer; HR+/HER2−, hormone receptor-positive/HER2-negative; LOESS, locally estimated scatterplot smoothing; T0–T3, serial treatment timepoints.
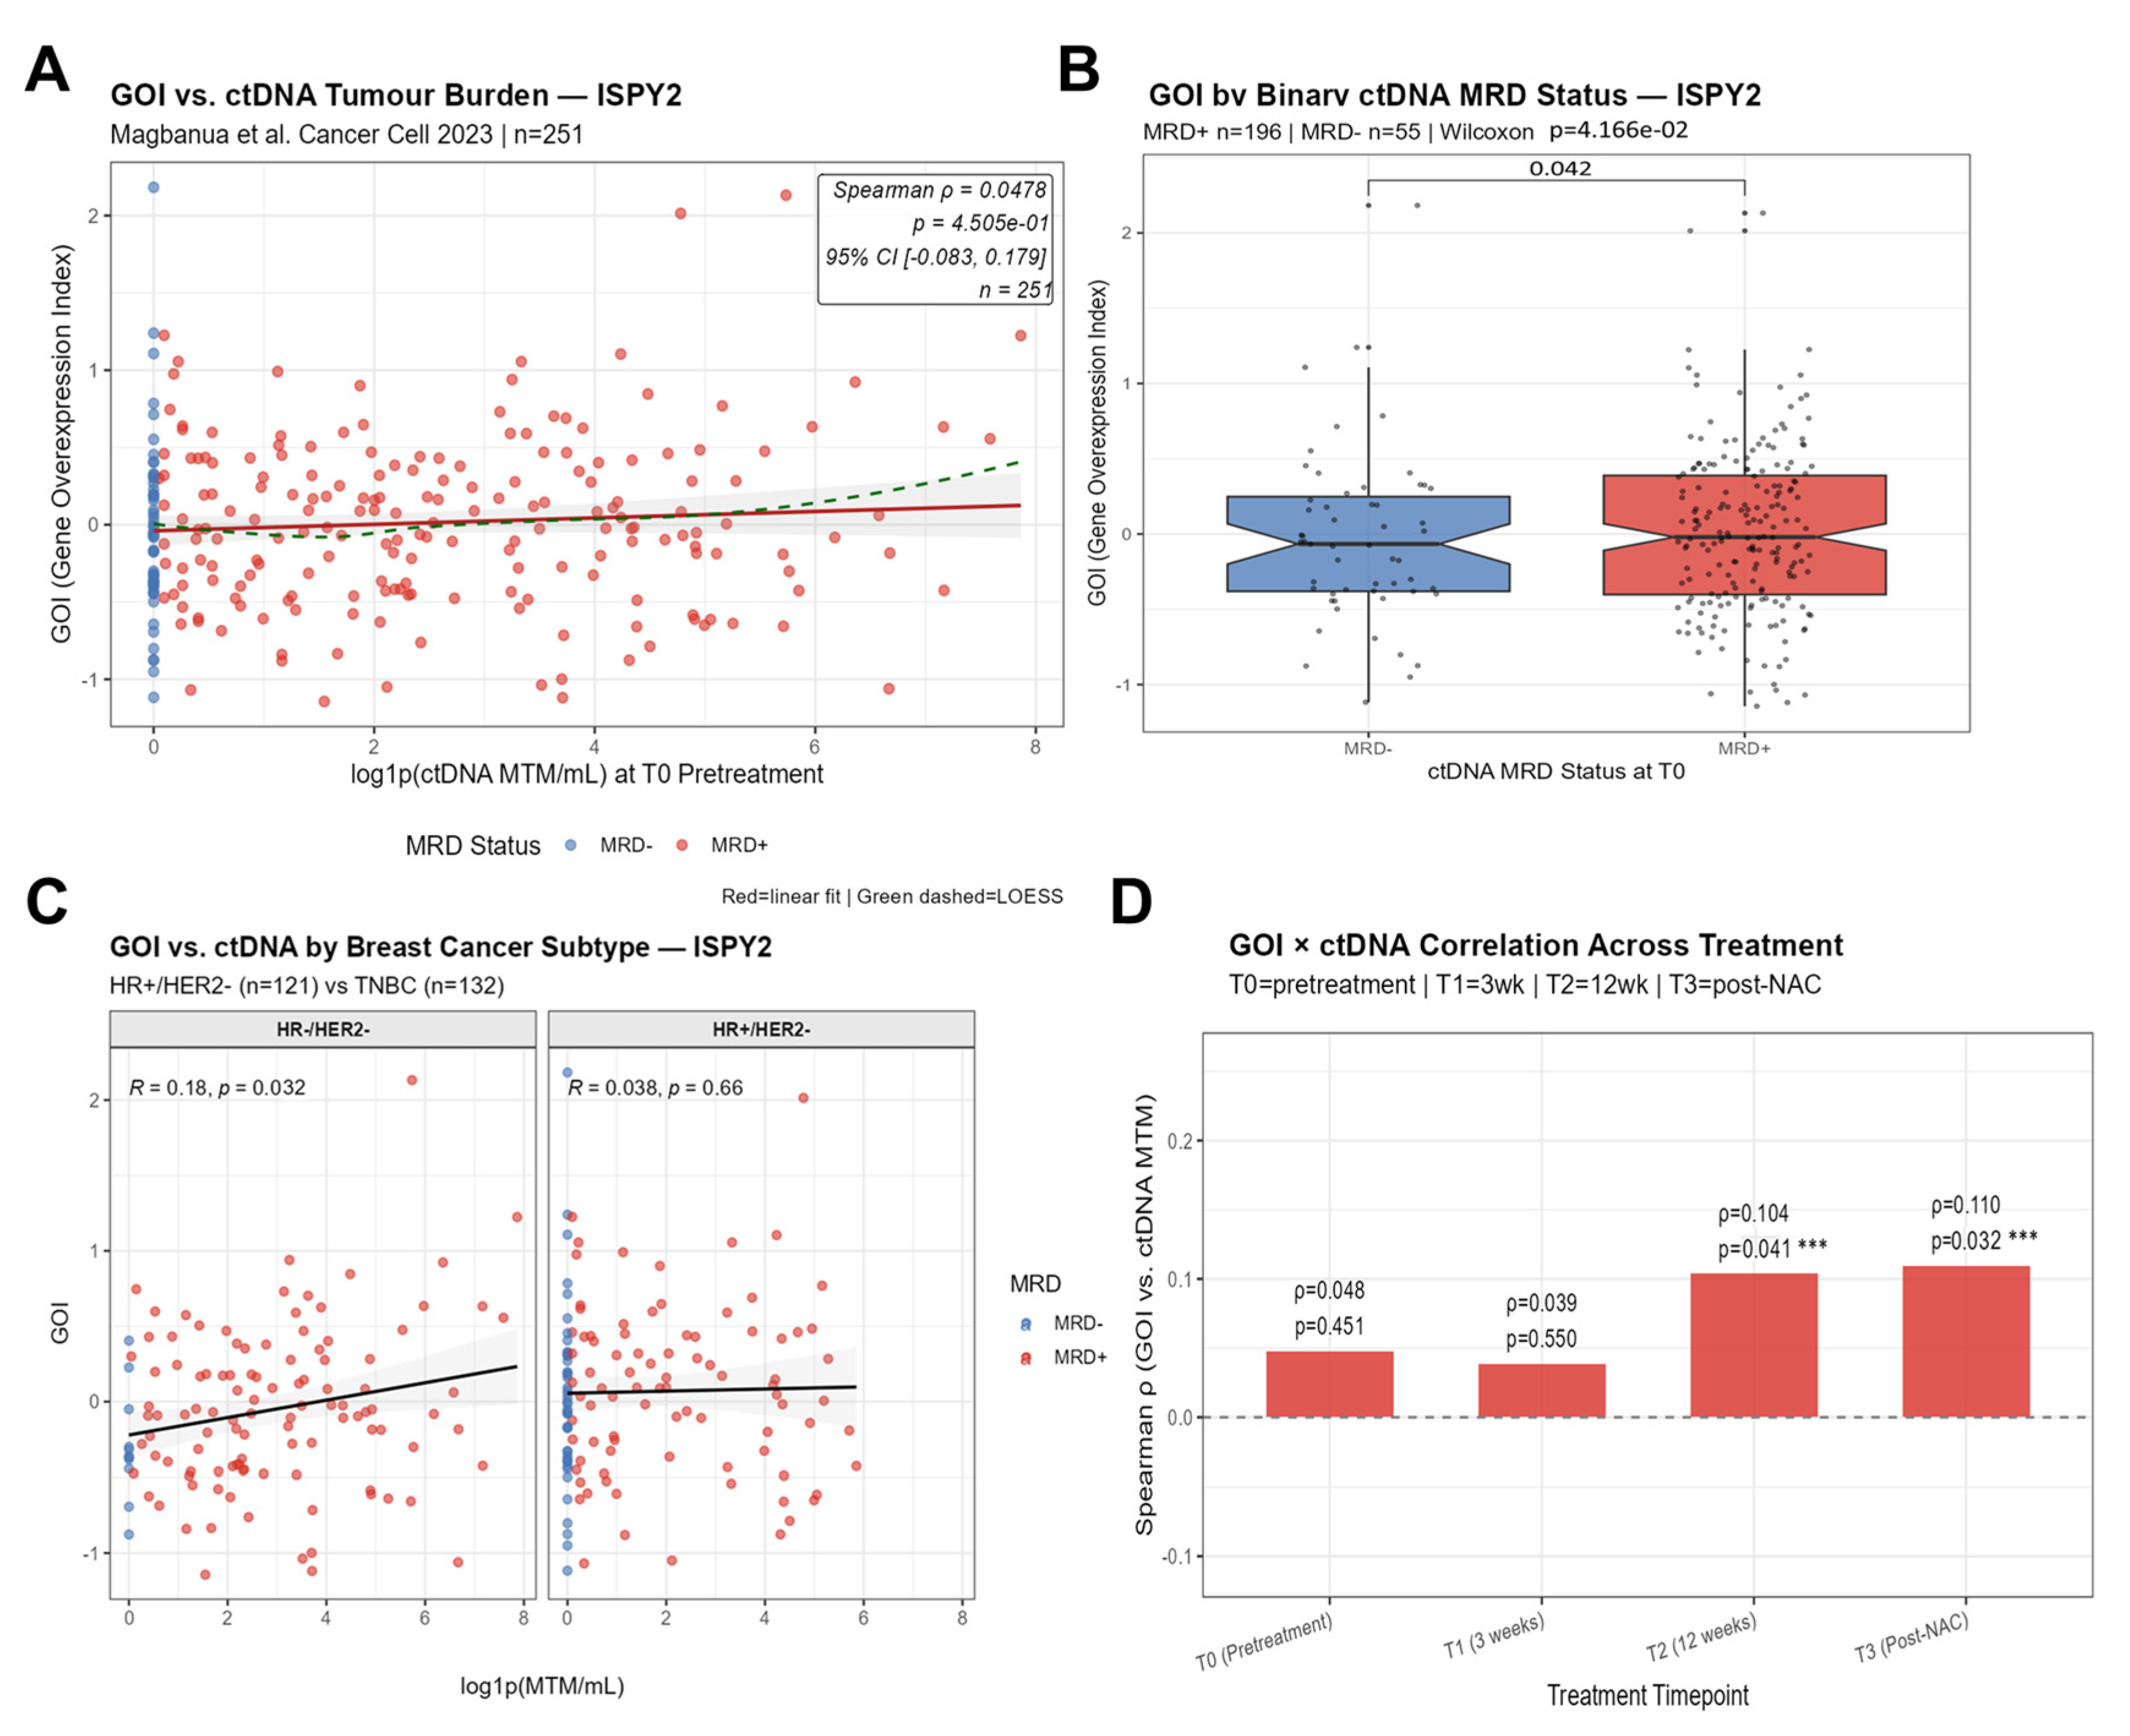
Figure 5.
OncoMRD BREAST gene overexpression index (GOI) correlation with tumor activity metrics, receptor status, and overall survival in the METABRIC cohort (n=2,114). (A) GOI vs. MKI67 expression. The scatter plot depicting the correlation between GOI and MKI67 mRNA expression (log2; Ki-67 proliferative index proxy) across 2,114 METABRIC patients. Red line = linear fit with 95% CI; green dashed = LOESS smoother. (B) GOI by ER status. The violin plot with embedded notched boxplot comparing GOI between ER-negative (n=436; blue) and ER-positive (n=1,501; pink) patients. ER+ median GOI = +0.0245 versus ER− median GOI = −0.1169. Wilcoxon rank-sum test p = 3.049×10⁻¹¹, indicating significantly higher GOI in ER-positive tumors. (C) GOI by HER2 status. The violin plot with embedded notched boxplot comparing GOI between HER2-negative (n=675; blue) and HER2-positive (n=148; pink) patients. HER2− median GOI = +0.0038 versus HER2+ median GOI = −0.1661. Wilcoxon p = 1.025×10⁻⁷, demonstrating significantly lower GOI in HER2-positive tumors. (D) The forest plot generated by continuous metrics. Spearman ρ with 95% bootstrap CI for GOI versus MKI67 expression (ρ=+0.102; p=2.58×10⁻⁶), proliferation score (ρ=+0.0215; ns), tumor grade (ρ=−0.0194; ns), and tumor size (ρ=−0.0235; ns). Only MKI67 achieved significance after BH-FDR correction. (E) The bar chart with categorical metrics. −log10(p-value) for Wilcoxon/Kruskal-Wallis tests across ER status (p=3.05×10⁻¹¹), HER2 status (p=1.03×10⁻⁷), and tumor grade (p=2.34×10⁻¹; ns). Red bars = FDR < 0.05; gray = non-significant. Dashed horizontal line = FDR 0.05 threshold. (F) Kaplan-Meier overall survival. The survival curves were stratified by median GOI (GOI-Low n=974; GOI-High n=1,004) with 95% CI shading and at-risk table. Cox proportional hazards model: HR = 0.760 (95% CI: 0.618–0.935; p = 9.519×10⁻³), demonstrating a statistically significant correlation between GOI and favorable clinical outcome in METABRIC. Abbreviations: GOI, gene overexpression index; MKI67, marker of proliferation Ki-67; ER, oestrogen receptor; HER2, human epidermal growth factor receptor 2; LOESS, locally estimated scatterplot smoothing; CI, confidence interval; HR, hazard ratio; BH, Benjamini-Hochberg; FDR, false discovery rate; ns, not significant; KW, Kruskal-Wallis.
Figure 5.
OncoMRD BREAST gene overexpression index (GOI) correlation with tumor activity metrics, receptor status, and overall survival in the METABRIC cohort (n=2,114). (A) GOI vs. MKI67 expression. The scatter plot depicting the correlation between GOI and MKI67 mRNA expression (log2; Ki-67 proliferative index proxy) across 2,114 METABRIC patients. Red line = linear fit with 95% CI; green dashed = LOESS smoother. (B) GOI by ER status. The violin plot with embedded notched boxplot comparing GOI between ER-negative (n=436; blue) and ER-positive (n=1,501; pink) patients. ER+ median GOI = +0.0245 versus ER− median GOI = −0.1169. Wilcoxon rank-sum test p = 3.049×10⁻¹¹, indicating significantly higher GOI in ER-positive tumors. (C) GOI by HER2 status. The violin plot with embedded notched boxplot comparing GOI between HER2-negative (n=675; blue) and HER2-positive (n=148; pink) patients. HER2− median GOI = +0.0038 versus HER2+ median GOI = −0.1661. Wilcoxon p = 1.025×10⁻⁷, demonstrating significantly lower GOI in HER2-positive tumors. (D) The forest plot generated by continuous metrics. Spearman ρ with 95% bootstrap CI for GOI versus MKI67 expression (ρ=+0.102; p=2.58×10⁻⁶), proliferation score (ρ=+0.0215; ns), tumor grade (ρ=−0.0194; ns), and tumor size (ρ=−0.0235; ns). Only MKI67 achieved significance after BH-FDR correction. (E) The bar chart with categorical metrics. −log10(p-value) for Wilcoxon/Kruskal-Wallis tests across ER status (p=3.05×10⁻¹¹), HER2 status (p=1.03×10⁻⁷), and tumor grade (p=2.34×10⁻¹; ns). Red bars = FDR < 0.05; gray = non-significant. Dashed horizontal line = FDR 0.05 threshold. (F) Kaplan-Meier overall survival. The survival curves were stratified by median GOI (GOI-Low n=974; GOI-High n=1,004) with 95% CI shading and at-risk table. Cox proportional hazards model: HR = 0.760 (95% CI: 0.618–0.935; p = 9.519×10⁻³), demonstrating a statistically significant correlation between GOI and favorable clinical outcome in METABRIC. Abbreviations: GOI, gene overexpression index; MKI67, marker of proliferation Ki-67; ER, oestrogen receptor; HER2, human epidermal growth factor receptor 2; LOESS, locally estimated scatterplot smoothing; CI, confidence interval; HR, hazard ratio; BH, Benjamini-Hochberg; FDR, false discovery rate; ns, not significant; KW, Kruskal-Wallis.

Figure 6.
OncoMRD BREAST gene overexpression index (GOI) correlation with RECIST treatment response categories in the GSE20194 neoadjuvant breast cancer cohort. (A) The summary table showing Spearman correlation coefficients and p-values between the OncoMRD BREAST GOI and RECIST-equivalent response categories across four independent GEO neoadjuvant datasets (GSE25055, GSE20194, GSE32646, GSE22513; total n=727), with treatment regimens and response classification systems annotated per cohort. (B) The gene expression heatmap showing gene-level z-scores for all OncoMRD BREAST panel genes across 278 GSE20194 patients, hierarchically clustered by expression profile and annotated by RECIST response category (stable disease, SD; complete response, CR). Color scale represents z-scored expression values ranging from −4 (blue) to +4 (red). (C) The boxplot and scatter plot. Left: GOI distribution by RECIST response category (SD versus CR) with Wilcoxon p-value annotated (p=0.036). Right: GOI scatter plot across ordinal RECIST categories with Spearman correlation coefficient (ρ=−0.10; p=0.036) and linear regression fit annotated, color-coded by response group.
Figure 6.
OncoMRD BREAST gene overexpression index (GOI) correlation with RECIST treatment response categories in the GSE20194 neoadjuvant breast cancer cohort. (A) The summary table showing Spearman correlation coefficients and p-values between the OncoMRD BREAST GOI and RECIST-equivalent response categories across four independent GEO neoadjuvant datasets (GSE25055, GSE20194, GSE32646, GSE22513; total n=727), with treatment regimens and response classification systems annotated per cohort. (B) The gene expression heatmap showing gene-level z-scores for all OncoMRD BREAST panel genes across 278 GSE20194 patients, hierarchically clustered by expression profile and annotated by RECIST response category (stable disease, SD; complete response, CR). Color scale represents z-scored expression values ranging from −4 (blue) to +4 (red). (C) The boxplot and scatter plot. Left: GOI distribution by RECIST response category (SD versus CR) with Wilcoxon p-value annotated (p=0.036). Right: GOI scatter plot across ordinal RECIST categories with Spearman correlation coefficient (ρ=−0.10; p=0.036) and linear regression fit annotated, color-coded by response group.

Figure 7.
Pearson correlation analysis between OncoMRD BREAST 11-gene signature and Oncotype DX gene panels in TCGA-BREAST (n=1,018). (A) OncoMRD BREAST vs. Oncotype DX 21-gene panel. The scatter plot depicting the Pearson correlation between log2-transformed TPM expression of the OncoMRD BREAST 11-gene composite signature (x-axis) and the Oncotype DX 21-gene recurrence score panel (y-axis) across 1,018 TCGA-BREAST primary tumor samples. Pearson R = 0.46 (p = 0, indicating p < 2.2×10⁻¹⁶), demonstrating a strong statistically significant positive correlation between the two gene panels. The orange diagonal line represents the linear regression fit. (B) OncoMRD BREAST vs. Oncotype DX Breast DCIS 12-gene panel. The scatter plot depicting the Pearson correlation between the OncoMRD BREAST 11-gene signature and the Oncotype DX Breast DCIS 12-gene panel across the same cohort. Pearson R = 0.17 (p = 4.4×10⁻⁸), demonstrating a moderate but statistically significant positive correlation, reflecting partial biological overlap with the DCIS-specific recurrence signature. (C) Pairwise Pearson correlation p-values: OncoMRD BREAST 11 genes vs. 16 core Oncotype DX genes. Heatmap table displaying p-values from pairwise Pearson correlations between each of the 11 OncoMRD BREAST genes (Genes 1–11; rows) and 16 core Oncotype DX reference genes including Ki67, STK15, BIRC5, CCNB1, MYBL2, PGR, GSTM1, MMP11, CTSL2, GRB7, HER2, ER, BCL2, SCUBE2, BAG1, and CD68 (columns). Highlighted cells indicate statistically significant correlations (p < 0.05), demonstrating extensive and statistically significant pairwise relationships between individual OncoMRD BREAST genes and core Oncotype DX genes, further supporting the mechanistic and biological concordance between the OncoMRD BREAST panel and the current gold-standard clinical recurrence assay. Abbreviations: TPM, transcripts per million; R, Pearson correlation coefficient; DCIS, ductal carcinoma in situ; TCGA-BREAST, The Cancer Genome Atlas Breast Invasive Carcinoma; Oncotype DX, 21-gene recurrence score assay (Genomic Health/Exact Sciences).
Figure 7.
Pearson correlation analysis between OncoMRD BREAST 11-gene signature and Oncotype DX gene panels in TCGA-BREAST (n=1,018). (A) OncoMRD BREAST vs. Oncotype DX 21-gene panel. The scatter plot depicting the Pearson correlation between log2-transformed TPM expression of the OncoMRD BREAST 11-gene composite signature (x-axis) and the Oncotype DX 21-gene recurrence score panel (y-axis) across 1,018 TCGA-BREAST primary tumor samples. Pearson R = 0.46 (p = 0, indicating p < 2.2×10⁻¹⁶), demonstrating a strong statistically significant positive correlation between the two gene panels. The orange diagonal line represents the linear regression fit. (B) OncoMRD BREAST vs. Oncotype DX Breast DCIS 12-gene panel. The scatter plot depicting the Pearson correlation between the OncoMRD BREAST 11-gene signature and the Oncotype DX Breast DCIS 12-gene panel across the same cohort. Pearson R = 0.17 (p = 4.4×10⁻⁸), demonstrating a moderate but statistically significant positive correlation, reflecting partial biological overlap with the DCIS-specific recurrence signature. (C) Pairwise Pearson correlation p-values: OncoMRD BREAST 11 genes vs. 16 core Oncotype DX genes. Heatmap table displaying p-values from pairwise Pearson correlations between each of the 11 OncoMRD BREAST genes (Genes 1–11; rows) and 16 core Oncotype DX reference genes including Ki67, STK15, BIRC5, CCNB1, MYBL2, PGR, GSTM1, MMP11, CTSL2, GRB7, HER2, ER, BCL2, SCUBE2, BAG1, and CD68 (columns). Highlighted cells indicate statistically significant correlations (p < 0.05), demonstrating extensive and statistically significant pairwise relationships between individual OncoMRD BREAST genes and core Oncotype DX genes, further supporting the mechanistic and biological concordance between the OncoMRD BREAST panel and the current gold-standard clinical recurrence assay. Abbreviations: TPM, transcripts per million; R, Pearson correlation coefficient; DCIS, ductal carcinoma in situ; TCGA-BREAST, The Cancer Genome Atlas Breast Invasive Carcinoma; Oncotype DX, 21-gene recurrence score assay (Genomic Health/Exact Sciences).
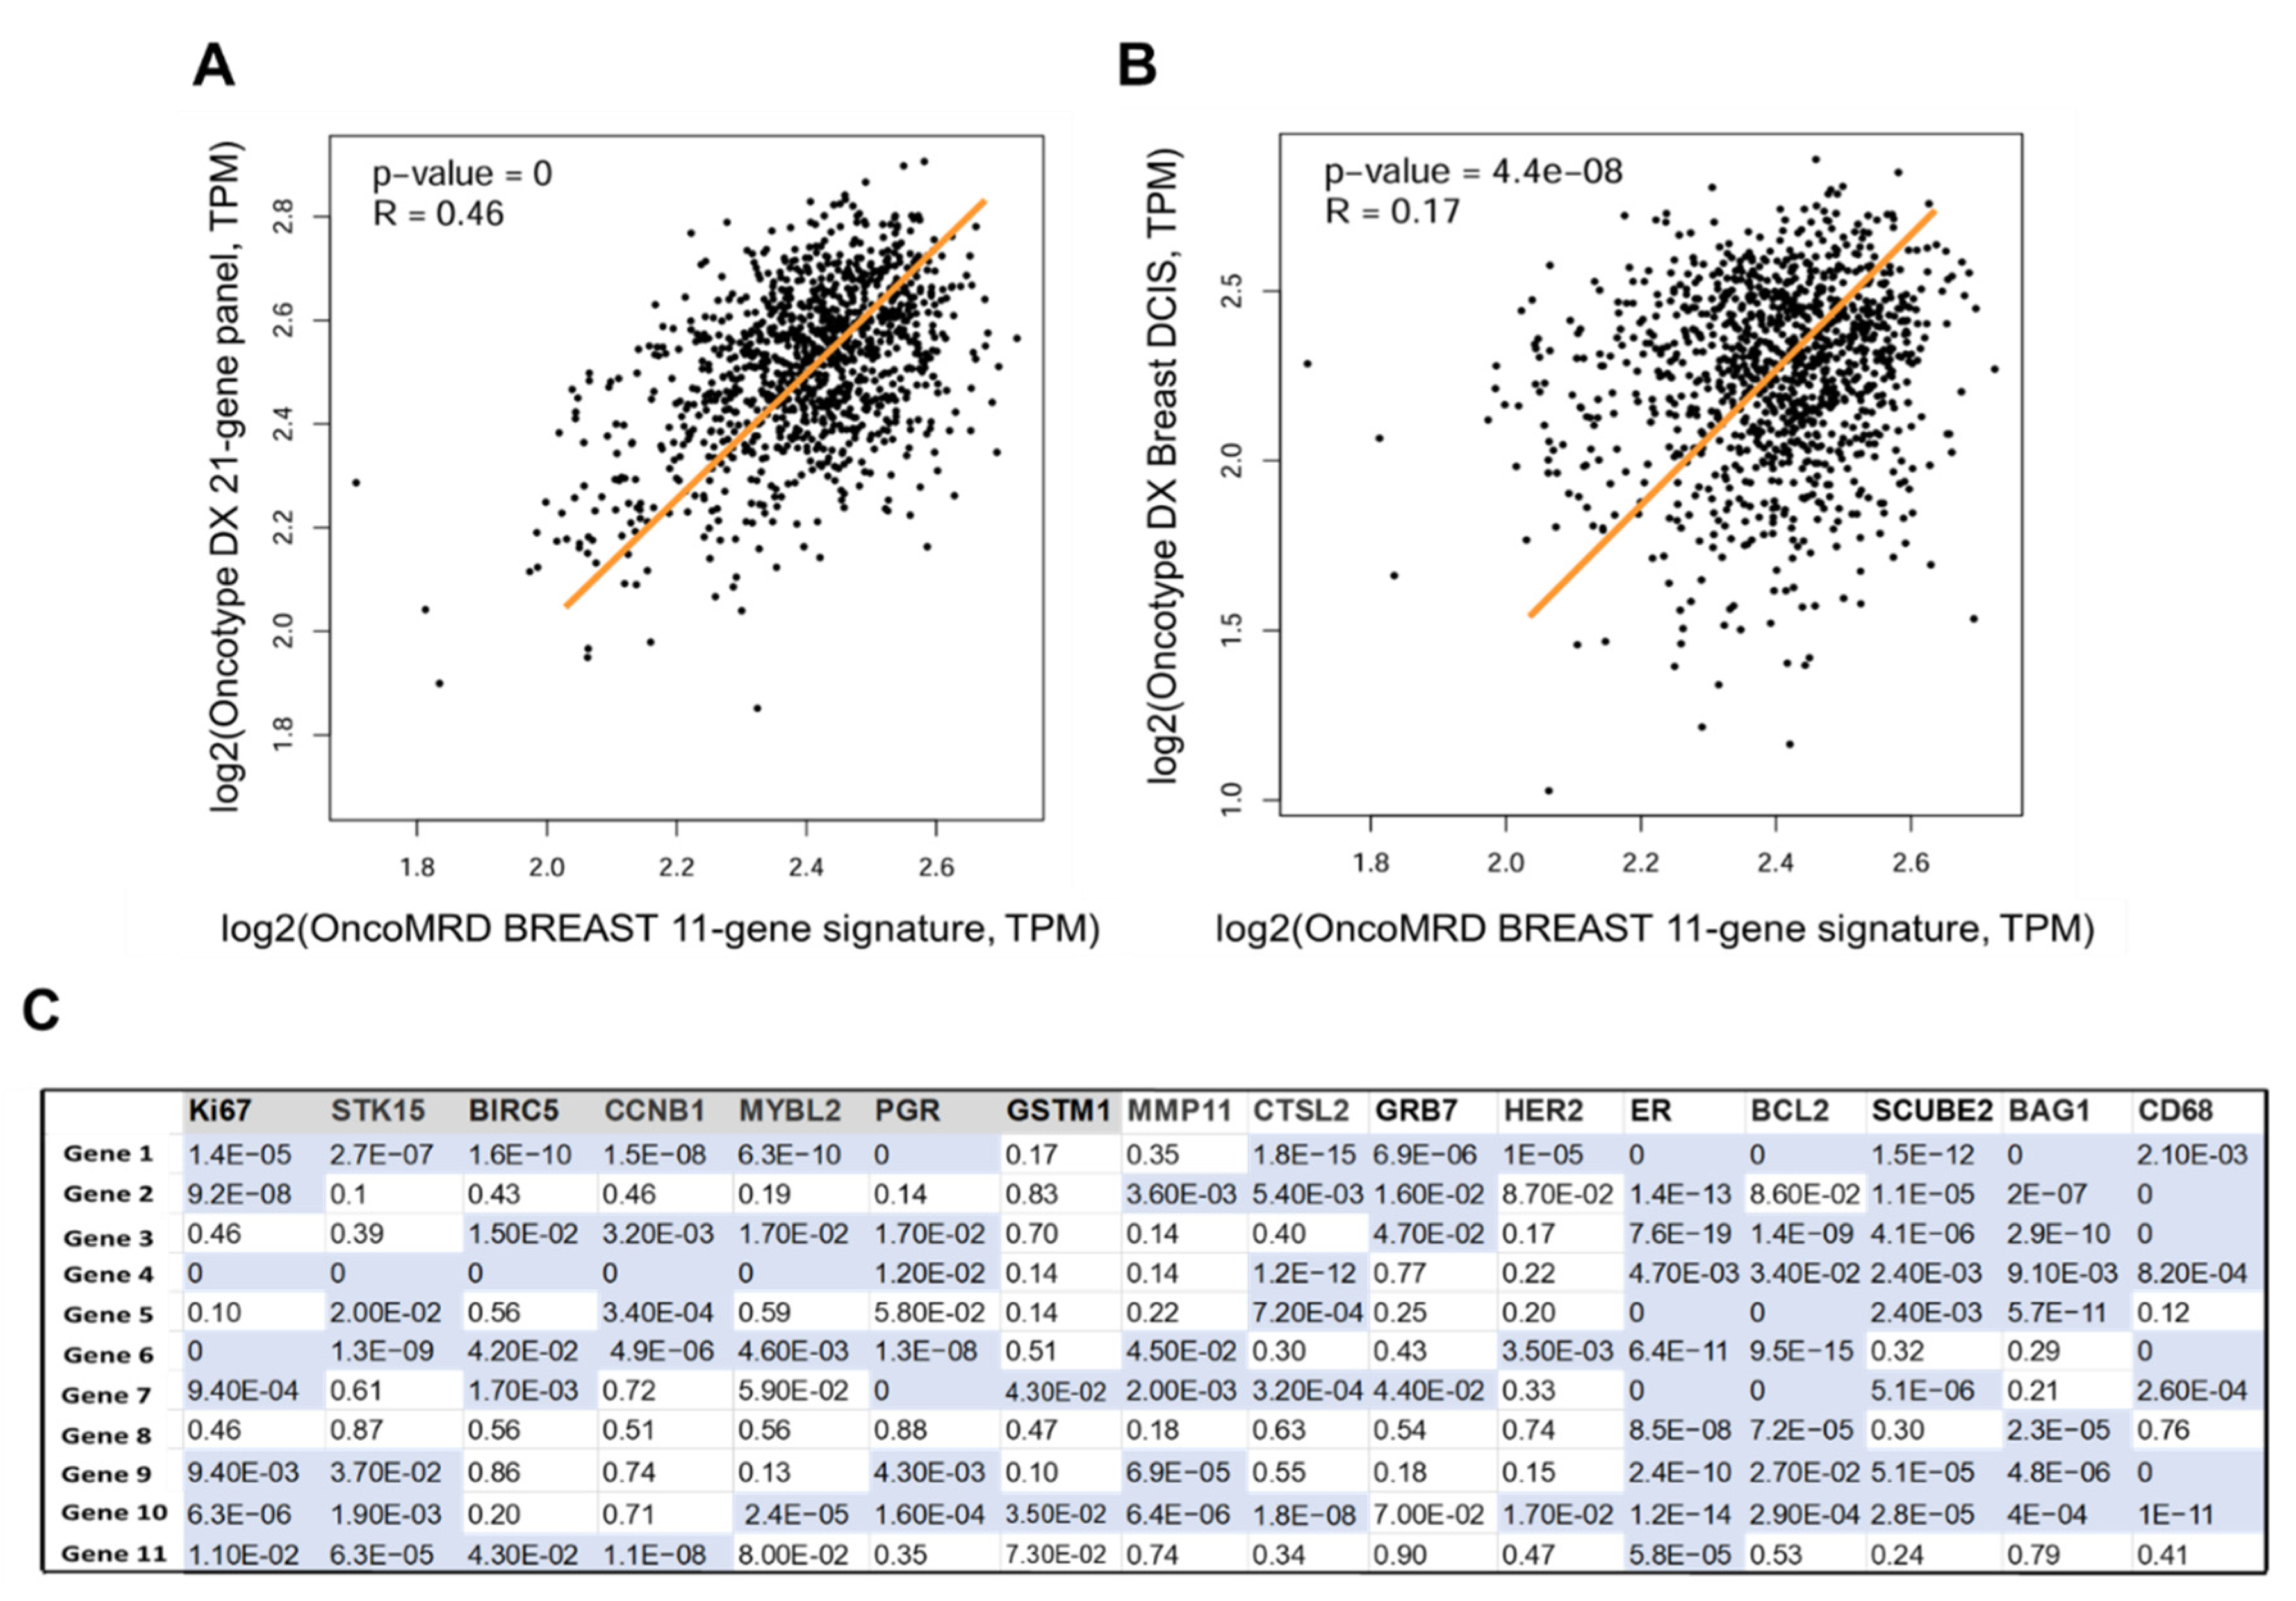
Figure 8.
Pearson correlation analysis between OncoMRD BREAST 11-gene signature and MammaPrint 70-gene panel in TCGA-BREAST (n=1,018). The scatter plot depicting the Pearson correlation between log2-transformed TPM expression of the OncoMRD BREAST 11-gene composite signature (x-axis) and the MammaPrint 70-gene panel (y-axis) across 1,018 TCGA-BREAST primary tumor samples. Pearson R = 0.52 (p < 2.2×10⁻¹⁶), demonstrating a strong and highly statistically significant positive correlation between the OncoMRD BREAST transcriptional index and the clinically validated MammaPrint genomic risk stratification assay. The orange diagonal line represents the linear regression fit. Each data point represents one patient tumor sample expressed in log2-TPM units.
Figure 8.
Pearson correlation analysis between OncoMRD BREAST 11-gene signature and MammaPrint 70-gene panel in TCGA-BREAST (n=1,018). The scatter plot depicting the Pearson correlation between log2-transformed TPM expression of the OncoMRD BREAST 11-gene composite signature (x-axis) and the MammaPrint 70-gene panel (y-axis) across 1,018 TCGA-BREAST primary tumor samples. Pearson R = 0.52 (p < 2.2×10⁻¹⁶), demonstrating a strong and highly statistically significant positive correlation between the OncoMRD BREAST transcriptional index and the clinically validated MammaPrint genomic risk stratification assay. The orange diagonal line represents the linear regression fit. Each data point represents one patient tumor sample expressed in log2-TPM units.
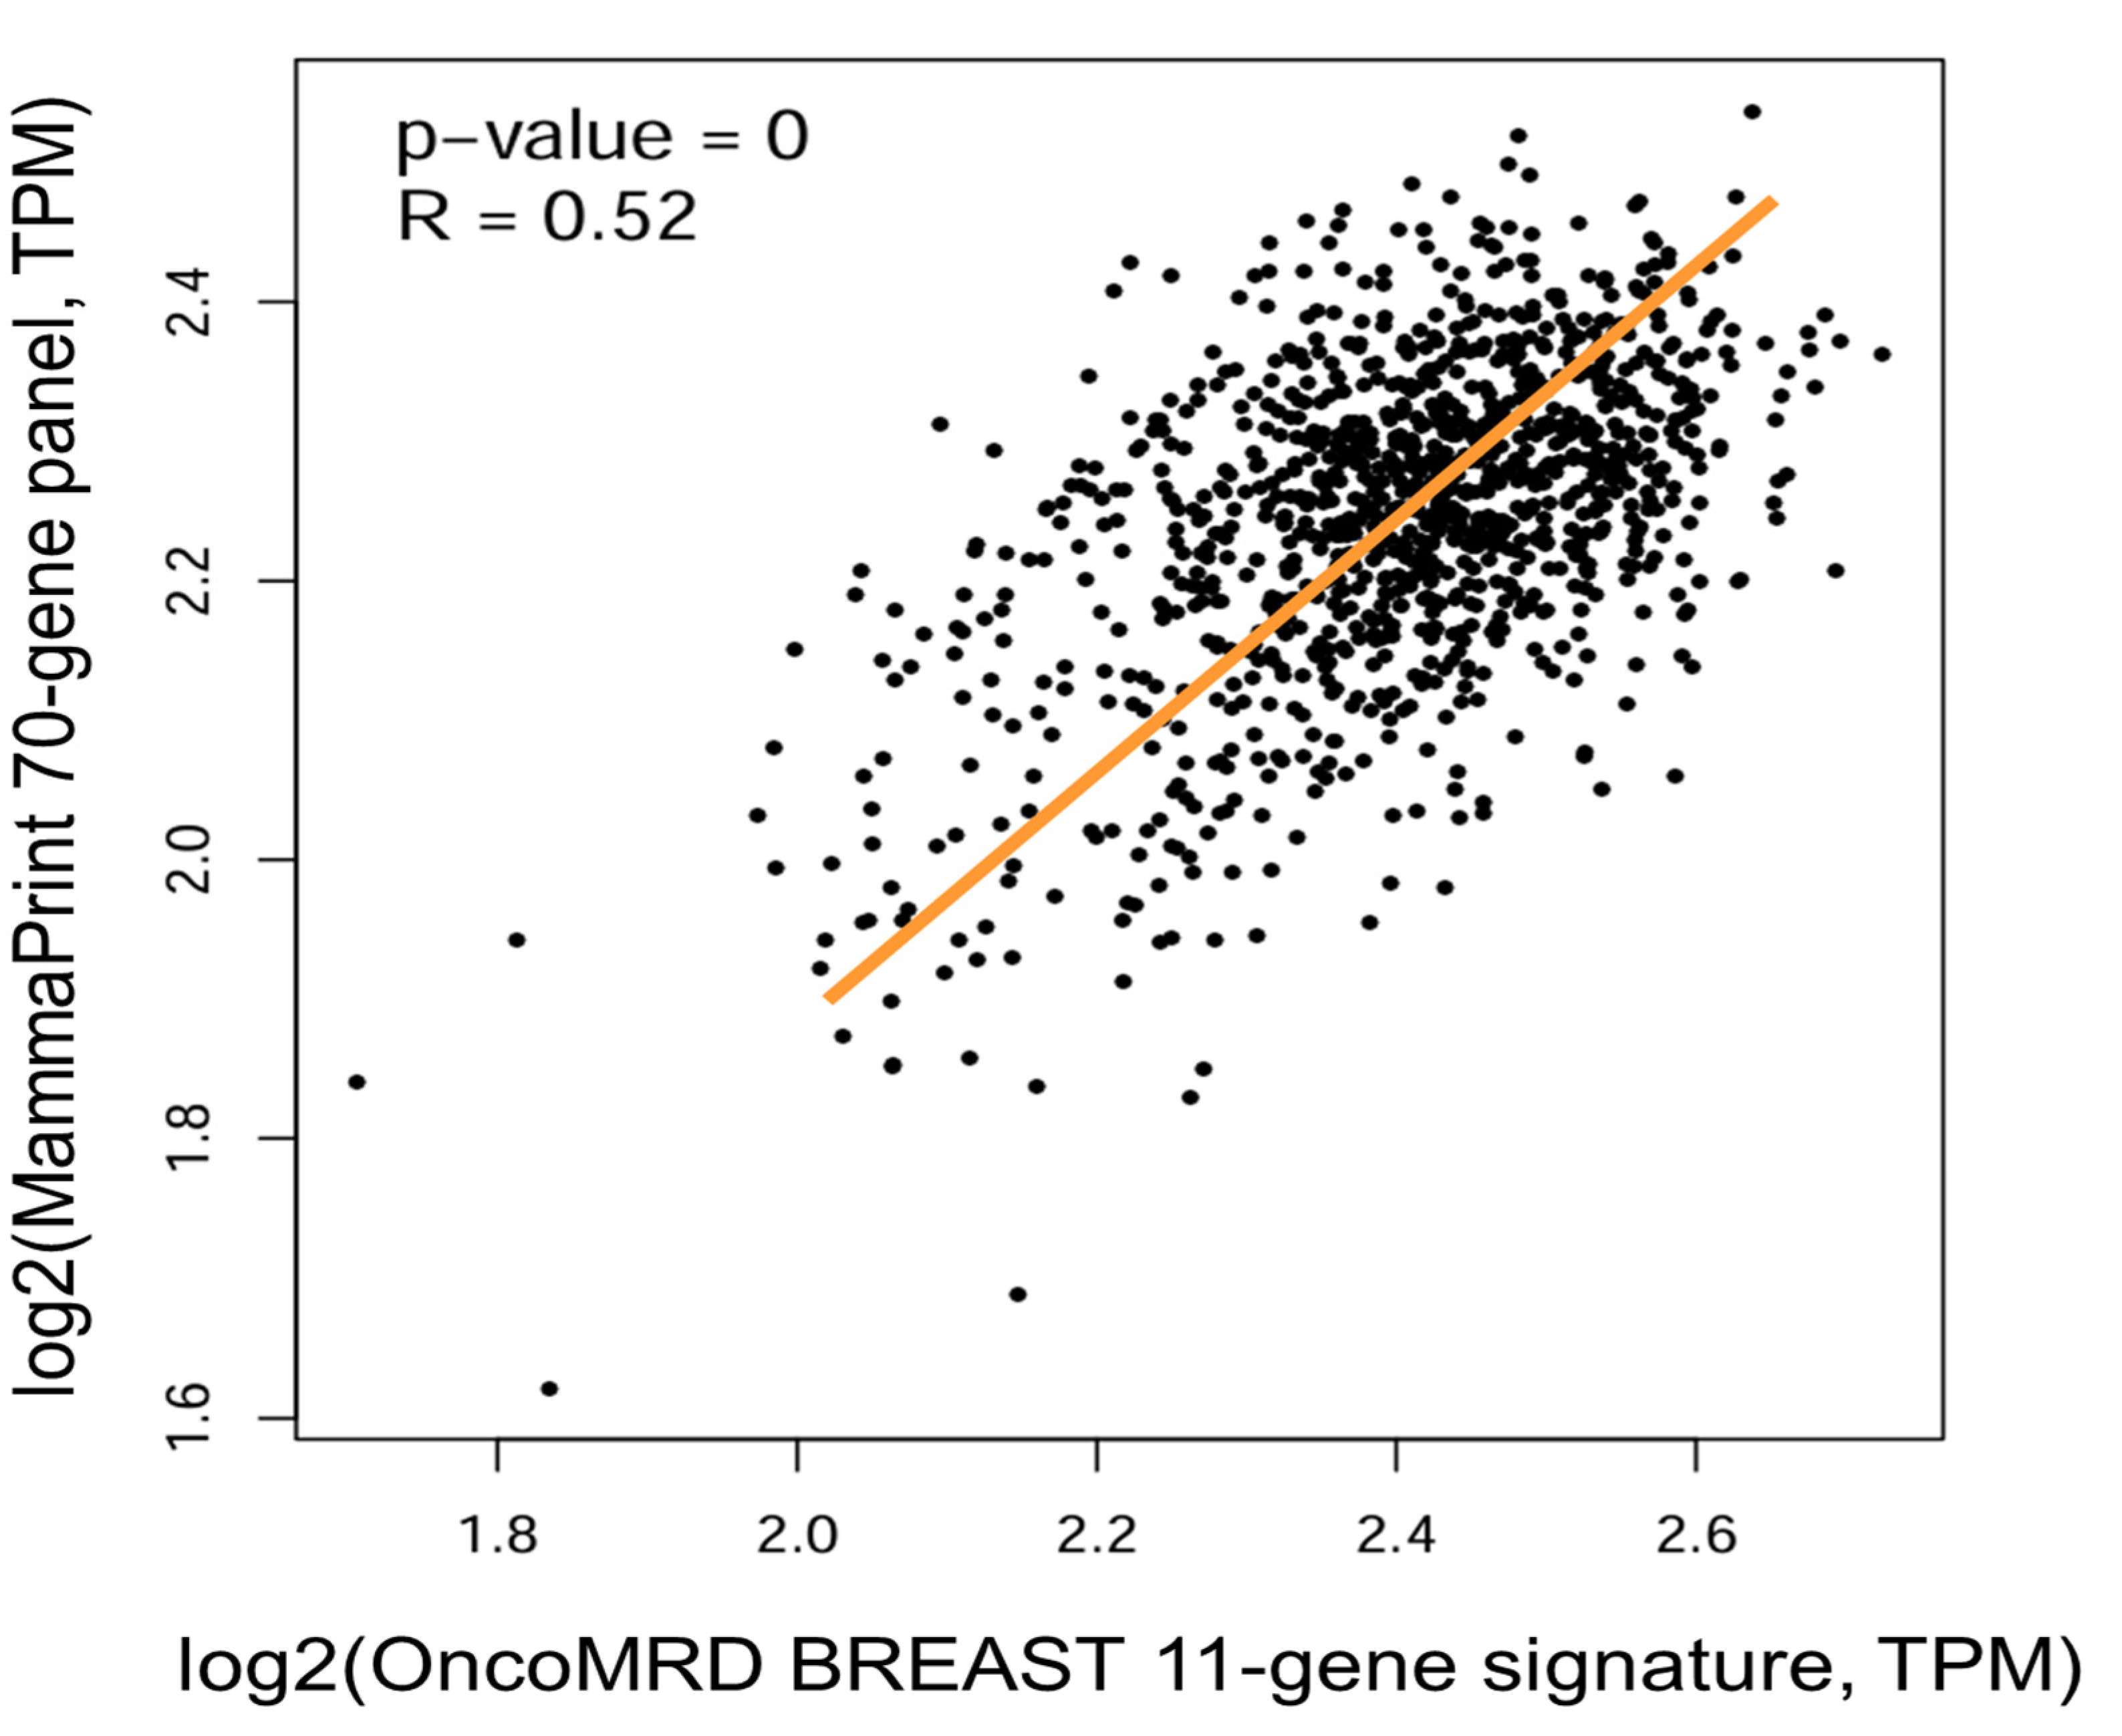

Table 1.
OncoMRD BREAST gene signature correlation with top ranking gene signatures associated with MRD/recurrence in breast cancer.
Table 1.
OncoMRD BREAST gene signature correlation with top ranking gene signatures associated with MRD/recurrence in breast cancer.
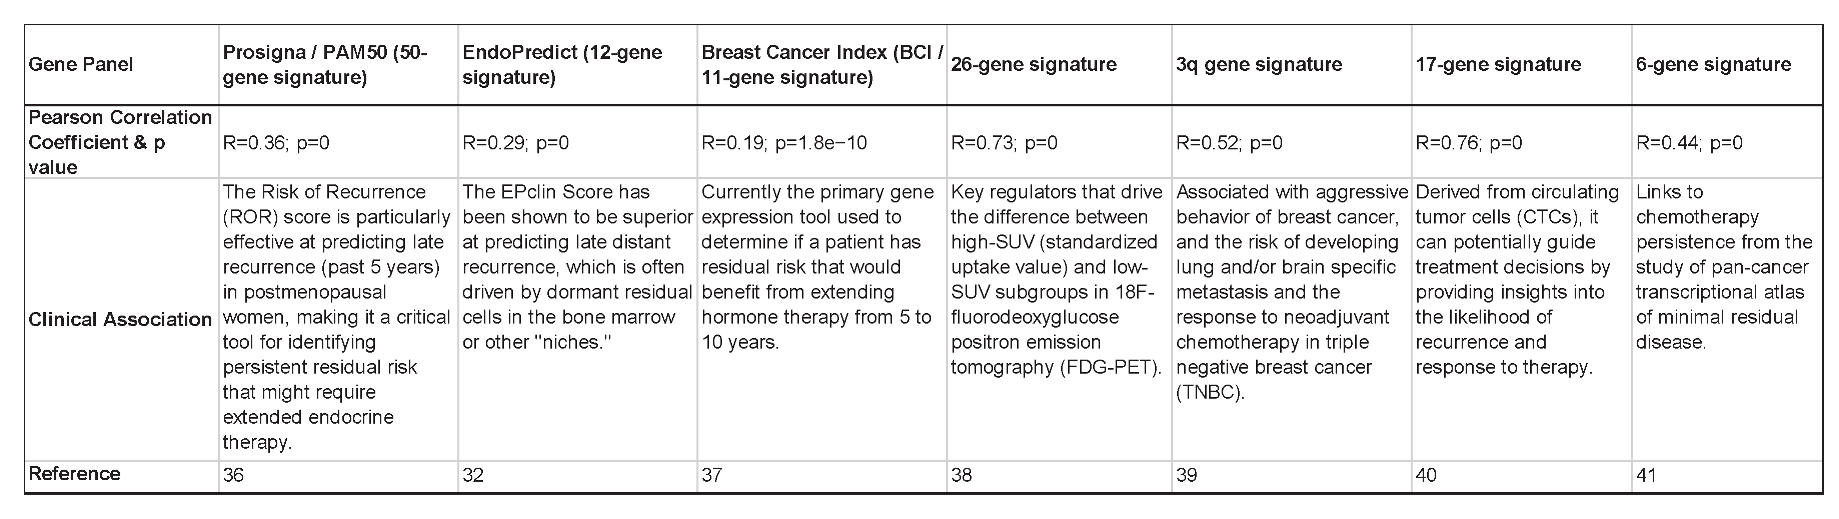 |
Disclaimer/Publisher’s Note: The statements, opinions and data contained in all publications are solely those of the individual author(s) and contributor(s) and not of MDPI and/or the editor(s). MDPI and/or the editor(s) disclaim responsibility for any injury to people or property resulting from any ideas, methods, instructions or products referred to in the content. |
© 2026 by the authors. Licensee MDPI, Basel, Switzerland. This article is an open access article distributed under the terms and conditions of the Creative Commons Attribution (CC BY) license (http://creativecommons.org/licenses/by/4.0/).
Copyright: This open access article is published under a Creative Commons CC BY 4.0 license, which permit the free download, distribution, and reuse, provided that the author and preprint are cited in any reuse.


