Submitted:
22 May 2026
Posted:
26 May 2026
You are already at the latest version
Abstract
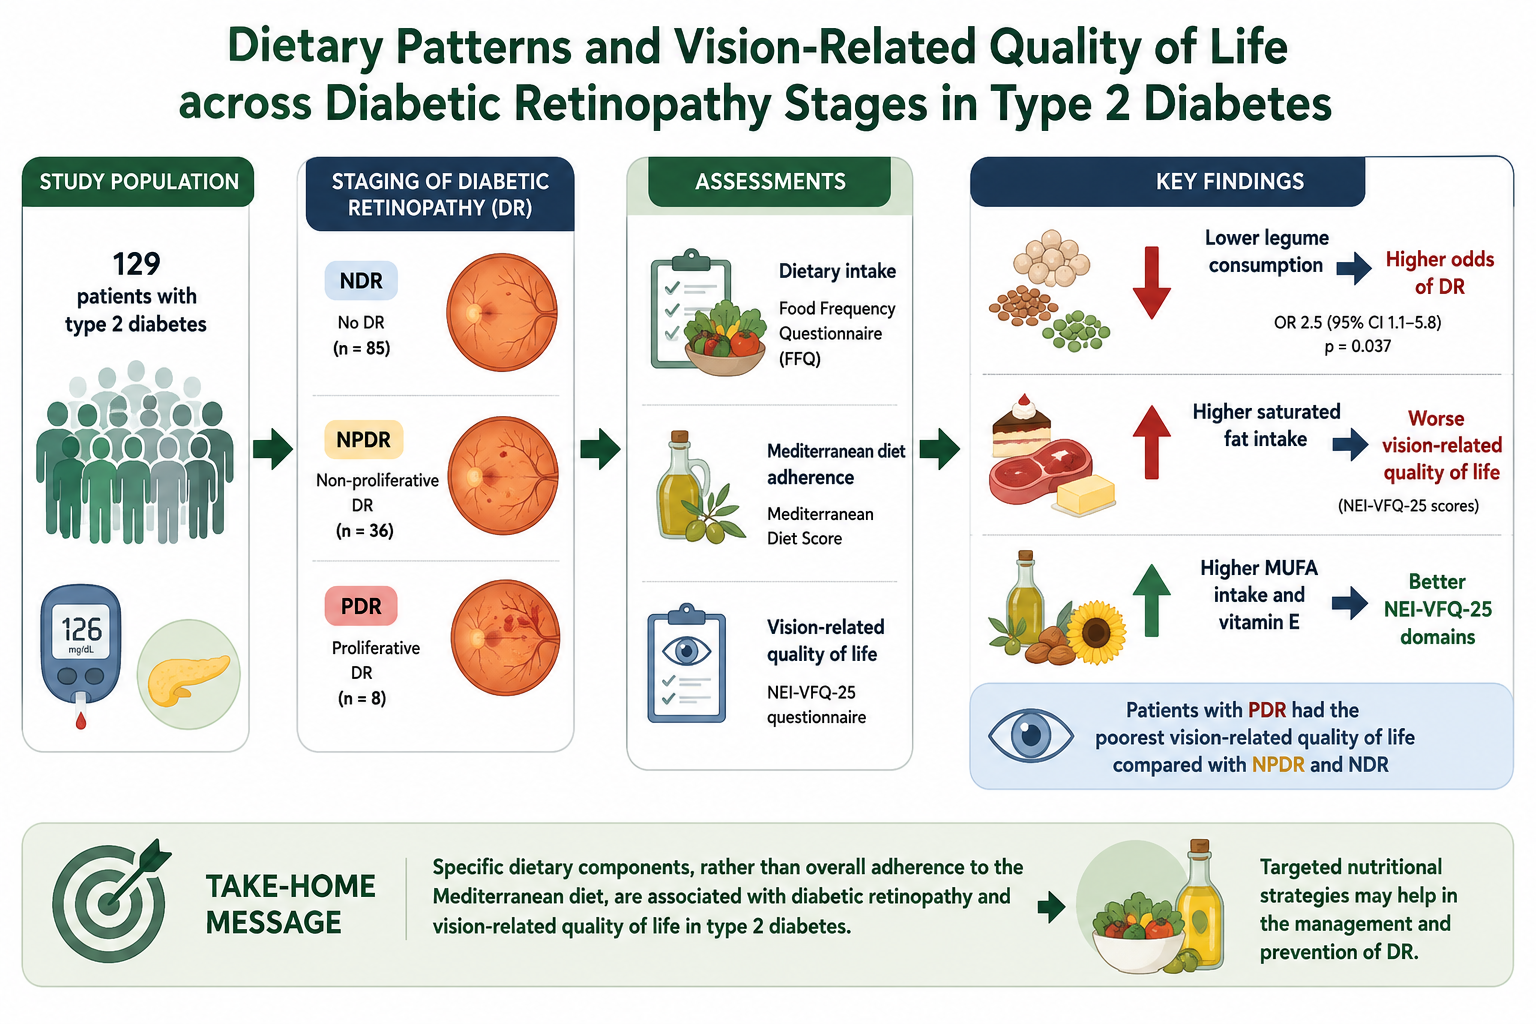
Background/Objectives: Diabetic retinopathy (DR) is a major microvascular complication of type 2 diabetes (T2D) and a leading cause of visual impairment. While traditional risk factors contribute to DR development, the role of dietary habits and their association with vision-related quality of life remains unclear. This study investigated the relationship between dietary intake, DR, and vision-related quality of life in subjects with T2D. Methods: In this cross-sectional study, 129 subjects with T2D were classified as no DR (NDR; n = 85), non-proliferative DR (NPDR; n = 36), or proliferative DR (PDR; n = 8). Dietary intake was assessed using a food frequency questionnaire, Mediterranean diet (MD) adherence by the MD Score, and vision-related quality of life by the NEI-VFQ-25. Multivariable logistic regression identified factors associated with DR. Results: DR was present in 34.1% of participants. Subjects with DR had longer diabetes duration than those without DR (18 vs. 16 years, p < 0.01), with 12% higher odds of DR per additional year. Overall MD adherence did not differ between groups; however, lower legume consumption was independently associated with higher odds of DR (OR 2.5, 95% CI 1.1–5.8, p = 0.037). PDR was associated with poorer vision-related quality of life. Higher saturated fat intake correlated with worse questionnaire scores, whereas monounsaturated fatty acids and vitamin E showed positive associations. Conclusions: Specific dietary components, rather than overall MD adherence, were associated with DR and vision-related quality of life, supporting targeted nutritional strategies in DR management.
Keywords:
type 2 diabetes
; diabetic retinopathy
; dietary intake
; Mediterranean diet
; legumes
; vision-related quality of life
; NEI-VFQ
; nutritional factors
1. Introduction
Diabetes mellitus (DM) represents a major global public health challenge, with a continuously increasing prevalence and a substantial clinical and socio-economic burden [1]. Type 2 diabetes mellitus (T2D), accounting for more than 90% of all diabetes cases, is the main contributor to diabetes-related morbidity and mortality through the development of chronic vascular complications [2,3].
Diabetic retinopathy (DR) is one of the most frequent and disabling microvascular complications of diabetes and remains a leading cause of vision impairment among working-age adults. Currently, the prevalence of DR ranges from 25% to 40% in T2D, the lifetime risk of developing DR exceeds 50% in individuals with T2D, and its prevalence is expected to further increase in parallel with the global diabetes epidemic [4,5,6,7]. Because DR may remain clinically silent until advanced stages, early identification of individuals at higher risk and effective preventive strategies are essential to reduce vision loss and its related impact on quality of life.
Chronic hyperglycaemia and diabetes duration are the strongest established risk factors for the development and progression of DR [8,9,10]. However, glycaemic exposure alone explains only a limited proportion of the inter-individual variability in DR risk. Other cardiometabolic factors, including hypertension, dyslipidaemia, obesity, coexisting metabolic disorders and comorbidities, further contribute to retinal damage, yet together they account for less than 10–15% of the overall risk of DR [9,11,12,13,14].
Genetic susceptibility has been shown to influence the development and severity of DR, as supported by familial clustering, twin studies, and ethnic differences in disease prevalence [15,16,17]. More recently, epigenetic mechanisms have been proposed as potential mediators linking environmental exposures and metabolic control to retinal damage [18,19,20,21]. However, while these biological pathways provide a plausible framework for understanding DR heterogeneity, their clinical relevance and translational applicability remain under investigation. These observations suggest that additional modifiable determinants may influence susceptibility to DR and its clinical course.
Lifestyle factors, particularly dietary habits and physical activity, have emerged as potential modulators of diabetes-related complications [22,23,24,25]. Healthy dietary patterns are associated with improved glycaemic control, reduced oxidative stress, and attenuation of chronic low-grade inflammation, all of which are key mechanisms involved in DR pathophysiology [26,27,28]. Among dietary models, the Mediterranean diet (MD) has received considerable attention due to its well-documented cardiometabolic benefits. Characterised by high intake of fruits, vegetables, whole grains, legumes, olive oil, and fish, and low consumption of saturated fats and red meat, the MD has been associated with reduced risk of obesity, T2D, and cardiovascular disease .
Growing evidence suggests that adherence to the MD may also confer protection against the onset and progression of DR [29]. Observational studies and randomised controlled trials have reported a lower incidence of retinopathy and slower disease progression in individuals with higher adherence to MD compared with low-fat or Western dietary patterns [30,31]. The proposed mechanisms include improved metabolic control, enhanced antioxidant capacity, reduced oxidative stress, and favourable effects on endothelial function and retinal microcirculation [32,33,34,35]. Nevertheless, the available evidence remains heterogeneous, and the relationship between dietary patterns and DR has not been fully elucidated.
Given the high prevalence of DR, its impact on visual function and quality of life, and the limited proportion of risk explained by traditional factors, identifying modifiable lifestyle determinants represents a key clinical priority.
Therefore, the aim of this study was to investigate the association between dietary habits, with a particular focus on adherence to the Mediterranean diet, and the presence and severity of DR in individuals with T2D. In addition, the impact of DR on quality of life was evaluated.
2. Subjects and Methods
2.1. Study Design
This cross-sectional study enrolled 129 Caucasian subjects affected by T2D, recruited during routine outpatient visits at the Diabetes Centre of the Garibaldi-Nesima Medical Centre (Catania, Italy) between January and July 2021. Eligible participants were aged over 40 years, had a diabetes duration of at least 15 years, and glycated haemoglobin (HbA1c) values between 7.0% and 9.5% at the time of recruitment. Exclusion criteria included ocular diseases other than DR, immune system disorders, active malignancies, and systemic therapies in the three months preceding enrolment. The diagnosis of T2D was established according to the American Diabetes Association criteria [2].
The study was conducted in accordance with the Declaration of Helsinki. All participants provided written informed consent prior to enrolment, and the study protocol was approved by the Institutional Ethics Committee of Catania 2 (protocol number 601/CECT2).
2.2. Subjects’ Data Collection
At recruitment visit, clinical data were collected, including medical history, diabetes duration, current anti-hyperglycaemic treatment, diabetes-related microvascular and macrovascular complications, and comorbidities. Sociodemographic and lifestyle information was obtained by trained epidemiologists using a structured questionnaire. Educational level was classified as low (≤8 years of schooling) or high (>8 years). Employment status was categorised as employed or unemployed (including students and housewives), and smoking status as smoker or non-smoker (including former smokers).
Anthropometric measurements included body weight, height, body mass index (BMI), and waist circumference (WC). BMI was calculated as weight in kilograms divided by height in meters squared and classified as normal weight (18.5–24.9 kg/m²), overweight (25.0–29.9 kg/m²), or obese (≥30.0 kg/m²) [36]. Waist circumference was measured at the iliac crest and considered abnormal when >88 cm in women and >102 cm in men, according to the National Cholesterol Education Program Adult Treatment Panel III criteria [36]. Systolic and diastolic blood pressure were measured using standardised procedures.
Laboratory parameters included HbA1c, total cholesterol, high-density lipoprotein (HDL) cholesterol, triglycerides, low-density lipoprotein cholesterol (LDL) (calculated using the Friedewald formula when triglycerides were <400 mg/dL [37]), aspartate aminotransferase (AST), alanine aminotransferase (ALT), and serum creatinine. Estimated glomerular filtration rate (eGFR) was calculated using the Chronic Kidney Disease Epidemiology Collaboration equation [38]. Urinary albumin-to-creatinine ratio (UACR) was assessed on a random spot urine sample, and albuminuria was classified according to ADA criteria . Chronic kidney disease staging was defined based on eGFR and albuminuria categories.
2.3. Ocular Assessment
2.3.1. Instrumental Examinations
Based on retinal findings, participants were classified into three groups: subjects without diabetic retinopathy (NDR), subjects with non-proliferative diabetic retinopathy (NPDR), and subjects with proliferative diabetic retinopathy (PDR). All participants underwent a comprehensive ophthalmological examination, including assessment of visual acuity, intraocular pressure, retinal fundus photography, fluorescein angiography, and optical coherence tomography. Retinal images were independently and blindly evaluated by two experienced ophthalmologists and classified according to the International Clinical Disease Severity Scale for Diabetic Retinopathy [39,40].
2.3.2. National Eye Institute Visual Function Questionnaire (NEI-VFQ 25)
To assess the vision-related quality of life (VRQoL) we used the 25-item National Eye Institute Visual Function Questionnaire (NEI-VFQ) [41,42]. The VFQ-25 takes approximately 10 minutes to administer to subjects and consists of a base set of 25 vision-targeted questions representing 11 vision-related constructs, plus an additional single-item general health-rating question. The VFQ-25 generates the following vision-targeted subscales: global vision rating, difficulty with near vision activities, difficulty with distance vision activities, limitations in social functioning due to vision, role limitations due to vision, dependency on others due to vision, mental health symptoms due to vision, driving difficulties, limitations with peripheral and colour vision, and ocular pain. In addition, the VFQ-25 contains an extra question about the general health rating.
To calculate the VFQ-25 score, we recoded the original values from the survey according to specific scoring rules so that a high score represents better visual functioning. Each item was converted to a 0 to 100 scale, in order that the scores represent the achieved percentage of the total possible score (e.g., a score of 50 represents 50% of the highest possible score). Thus, items within each sub-scale were averaged together to create the 12 sub-scale scores. To calculate the overall composite score for the VFQ-25, we averaged the vision-targeted subscale scores, excluding the general health-rating question.
2.4. Dietary Assessment
Dietary intake was recorded by using a 95-item semi-quantitative Food Frequency Questionnaire (FFQ), which refers to the previous month dietary habits, adapted from a 46-item FFQ validated for the assessment of folate intake in Italian women of childbearing age [43]. During the interview, subjects were invited to indicate their consumption frequency (stratified into 12 categories from “almost never” to “two or more times a day”) and meal size (low, medium or large), indicating the medium size by describing the standard weight or volume measures usually consumed in the Italian population, while small and large sizes were half a medium meal size or 1.5 times or more larger than a medium meal, respectively. Moreover, a photograph atlas was used to estimate the amount of each food and to minimize inaccuracies. Food intakes were estimated by multiplying the consumption frequency by the daily portion size of each food group adjusted for total energy intake using the residual method [44].
Mediterranean Diet Score
The adherence to MD was investigated by using the MD Score (MDS), which refers to the ideal or poor consumption of nine food categories: fruits and nuts, vegetables, legumes, cereals, lipids, fish, dairy products, meat products, alcohol and unsaturated to saturated lipids ratio [45,46]. For vegetables, legumes, fruits and nuts, cereals, fish and unsaturated to saturated lipids ratio, subjects whose consumption was below or equal to the median value of the population were assigned the value of 0, otherwise the value of 1. For dairy and meat products, subjects whose consumption was below the median were assigned a value of 1, otherwise the value of 0. To subjects consuming 5 to 25 g of alcohol per day, a value of 1 was assigned. Finally, MDS ranged from 0 (non-adherence) to 9 (perfect adherence). The adherence was further categorized as follows: low (MDS: 0–3), medium (MDS: 4–6), or high adherence (MDS: 7–9) [47].
2.5. Statistical Analysis
Continuous variables were tested for normality using the Shapiro–Wilk test and are presented as median and interquartile range (IQR). Comparisons between two groups were performed using the Mann–Whitney U test, while comparisons across more than two groups were conducted using the Kruskal–Wallis test. Categorical variables are expressed as frequencies and percentages and were compared using the chi-square or Fisher’s exact test, as appropriate.
Spearman’s rank correlation analysis was used to evaluate the association between clinical, dietary variables, and NEI-VFQ domain scores. Given the exploratory nature of correlation analyses, the possibility of type I error cannot be excluded.
Multivariable logistic regression models were constructed to identify independent dietary factors associated with DR, adjusting for age, sex, diabetes duration, BMI, WC, lipid profile, and blood pressure. Dietary variables included in the models were selected based on the results of the bivariate analysis. Results are reported as adjusted odds ratios (ORs) with 95% confidence intervals (CIs).
A two-sided p value <0.05 was considered statistically significant. Statistical analyses were performed using IBM SPSS software (version 21.0).
Sample Size Calculation
The sample size was calculated based on the primary study endpoint, assuming a mean difference of 2 points in the Mediterranean Diet Score between groups, a standard deviation of 5, an alpha level of 0.05, and a statistical power of 80%. Under these assumptions, a minimum of 98 subjects (32 with DR and 64 without DR) was required.
3. Results
3.1. Overall Study Population
One hundred twenty-nine participants with T2D were enrolled between January and July 2021, including 65 men (50.4%) and 64 women (49.6%). The main clinical and demographic characteristics of the study population are reported in Table 1.
The median age at enrolment was 70 years (IQR 65–74), while the median age at T2D diagnosis was 53 years (IQR 46–58), corresponding to a median diabetes duration of 17 years (IQR 14–19). Only approximately one-tenth of participants had a normal body weight, whereas the majority were classified as overweight (41.9%) or obese (45.0%). An above-normal WC was observed in 80.6% of the study population (Table 1).
The median HbA1c level was 8% (IQR 7–8). Overall, 41.9% of subjects were treated with insulin, generally in combination with other oral or injectable glucose-lowering agents. In addition, lipid-lowering therapy was used by 76.7% of participants, antihypertensive drugs by 82.2%, and antiplatelet agents by 71.2% (Table 1).
At ophthalmological evaluation, DR was detected in 44 of 129 subjects (34.1%). Among these, the majority (n=36) had NPDR, while eight subjects were diagnosed with PDR (Table 2). A high prevalence of chronic kidney disease (CKD) was observed (75.2%), with most participants presenting mild to moderate disease, corresponding to stage 2 (44.2%) or stage 3 (24.8%). No subjects had kidney failure requiring kidney replacement therapy (stage 5). Evidence of impaired tubular kidney function, indicated by micro- or macro-albuminuria, was found in 18.6% and 0.8% of subjects, respectively (Table 1).
Regarding chronic macrovascular complications, 21 of 129 participants (16.3%) reported a history of coronary ischemic disease. Additionally, 10 subjects (7.8%) had experienced either a stroke or critical lower limb ischemia requiring revascularization procedures (Table 1).
3.2. Groups with and Without Diabetic Retinopathy
3.2.1. Demographic, Clinical and Biochemical Characteristics
The main characteristics of the study groups stratified by retinal status are reported in Table 2. No significant differences were observed between subjects with and without DR in terms of age, sex distribution, age at diabetes diagnosis, glycaemic control, or socio-demographic variables, including educational level, employment status, and smoking habits.
However, subjects with DR showed a significantly longer duration of diabetes compared with those without DR (18 vs. 16 years, p<0.01). This association remained significant at multivariable analysis (OR 1.12 per year increase). When stratifying according to DR severity, no significant difference in diabetes duration was observed between NPDR and PDR.
A non-significant trend toward higher BMI was observed in subjects with PDR compared to NPDR and NDR (31.3 vs. 27.4 vs. 30.0 kg/m², p=0.09). A similar pattern was found for WC, with higher values in the PDR group, although not reaching statistical significance (Table 2).
Regarding lipid profile, no differences were observed between NDR and DR groups. However, when considering DR severity, HDL cholesterol levels were significantly lower in subjects with PDR compared to NPDR and NDR (p=0.01), while total cholesterol and LDL cholesterol showed significant differences across groups, with lower LDL levels in PDR compared to NPDR (p=0.03).
Blood pressure, triglycerides, liver enzymes, and renal function parameters did not differ significantly between groups (Table 2).
With respect to pharmacological treatment, insulin therapy was significantly more frequent in subjects with DR compared to those without DR (52.3% vs. 34.1%, p=0.04), with a similar trend observed across DR severity groups (Table 2). The use of other glucose-lowering agents, including GLP-1 receptor agonists and SGLT2 inhibitors, as well as lipid-lowering, antihypertensive, and antiplatelet therapies, did not differ significantly between groups.
3.2.2. Vision-Related Quality of Life
The scores of the NEI-VFQ questionnaire according to retinal status are reported in Table 3. No significant differences were observed between subjects with and without DR in the overall composite score or in most subscales. However, when stratified by DR severity, significant differences emerged. Subjects with PDR showed significantly lower composite scores compared to NPDR and NDR (p=0.04), indicating a worse vision-related quality of life (Table 3).
In addition, several specific domains were significantly impaired in subjects with PDR. In particular, general vision was reduced compared to the other groups (p=0.02), and a similar pattern was observed for mental health (p=0.01) and ocular pain (p<0.01). Functional domains were also affected, with lower scores in near activities (p=0.02), distance activities (p<0.05), and driving (p=0.01) (Table 3).
Overall, these findings indicate that the negative impact of DR on vision-related quality of life becomes clinically relevant primarily in its advanced stages, with a broad involvement of both visual function and psychosocial domains.
3.2.3. Dietary Intake and Mediterranean Diet Adherence
Dietary variables according to retinal status are presented in Table 4. Overall, most dietary components did not differ significantly between subjects with and without DR, including total energy intake, macronutrient distribution, and MDS. However, a significantly lower intake of legumes was observed in subjects with DR compared to those without DR (p=0.03) (Table 4).
When stratifying by DR severity, additional differences emerged. In particular, subjects with PDR showed a higher intake of total fats compared to those with NPDR (p=0.03). At the same time, micronutrient intake differed across groups, with significantly lower levels of vitamin A and vitamin E observed in PDR compared to NPDR (p=0.04 for both comparisons).
No other significant differences were observed for the remaining dietary variables, and adherence to the Mediterranean diet, as assessed by the MDS, was comparable across all groups (Table 4).
3.2.4. Association Between Legume Consumption and Diabetic Retinopathy
Logistic regression models evaluating the association between legume consumption and DR are reported in Table 5. Low legume consumption was consistently associated with higher odds of DR across all models. In the model adjusted for age and sex, subjects with lower legume intake showed more than a twofold increased risk of DR (OR 2.2, 95% CI 1.0–4.8, p=0.042). This association remained stable after further adjustment for diabetes duration (OR 2.2, 95% CI 1.0–4.8, p=0.043) and was even slightly strengthened in the fully adjusted model, which additionally included BMI, WC, cholesterol levels, and blood pressure (OR 2.5, 95% CI 1.1–5.8, p=0.037). Overall, these findings suggest that low legume consumption is independently associated with the presence of DR, regardless of major clinical and metabolic confounders.
3.2.5. Correlation Analyses
As shown in Figure 1, only a limited number of significant correlations were observed between clinical characteristics and NEI-VFQ domain scores. HbA1c was negatively associated with the composite score (r = -0.387) and general vision (r = -0.304). BMI was negatively correlated with general health (r = -0.305). HDL cholesterol was positively associated with general vision (r = 0.302), peripheral vision (r = 0.332), and social functioning (r = 0.323). A positive correlation was also found between AST and general health (r = 0.306).
In contrast, dietary variables showed a more consistent pattern of association with vision-related quality of life (Figure 2). Higher intakes of meat, daily energy, carbohydrates, total fats, and saturated fats were generally associated with lower questionnaire scores. The strongest inverse correlations were observed for meat intake with the composite score (r = -0.436) and general vision (r = -0.373), for daily caloric intake with the composite score (r = -0.374) and general vision (r = -0.475), for total fat intake with the composite score (r = -0.426), general vision (r = -0.470), and near activities (r = -0.397), and for saturated fat intake with the composite score (r = -0.452) and general vision (r = -0.428). By contrast, monounsaturated fatty acids were positively correlated with several questionnaire domains, including the composite score (r = 0.518) and general vision (r = 0.490), with a similar although weaker pattern for polyunsaturated fats. Vitamin E also showed consistently positive correlations across multiple domains, including the composite score (r = 0.485) and general vision (r = 0.474). Legume intake was positively associated with ocular pain (r = 0.344).
4. Discussion
The present study investigated the relationship between dietary habits, DR severity, and vision-related quality of life in a cohort of subjects with type 2 diabetes. The main findings of our analysis can be summarised as follows: first, diabetes duration was confirmed as a major determinant of DR; second, more advanced stages of retinopathy were associated with a significant impairment in vision-related quality of life; third, specific dietary components, rather than overall adherence to MD, were associated with DR and its severity, with a particular role emerging for legume consumption.
Consistent with previous evidence, we confirmed the well-established role of diabetes duration as a key risk factor for DR. In our cohort, subjects with DR had a significantly longer duration of diabetes compared to those without DR, with a 12% increased risk of DR for each additional year of disease. These findings are in line with large longitudinal studies, such as the EDIC study, which reported a progressive increase in DR prevalence with disease duration, with less than 10% of subjects remaining free from DR after three decades of follow-up [48]. Similarly, predictive models have consistently identified diabetes duration as one of the strongest determinants of DR risk [49]. Nevertheless, it is noteworthy that DR may already be present at the time of diabetes diagnosis in a substantial proportion of individuals, as highlighted by a meta-analysis reporting a prevalence of approximately 15% at onset in European populations, suggesting that additional modifiable factors may contribute to the development and progression of retinal damage [50].
Among these factors, obesity and metabolic alterations have been proposed as potential contributors to DR. In our study, although BMI did not differ significantly between subjects with and without DR, a trend toward higher BMI was observed in subjects with PDR, suggesting a possible role of adiposity excess in more advanced stages of retinal disease. The relationship between obesity and DR remains controversial, with previous studies reporting conflicting results, ranging from positive associations mediated by hypertension, dyslipidaemia, oxidative stress, and vascular endothelial growth factor (VEGF) [23,51,52] to null or even inverse relationships [51,53,54]. This heterogeneity may reflect differences in study design, population characteristics, and metabolic profiles, as well as the potential influence of factors such as insulin resistance and endogenous insulin secretion.
In addition to adiposity, lipid profile may also influence the course of DR, although available evidence remains inconsistent. In our cohort, no significant differences were observed in total cholesterol, LDL cholesterol, or triglycerides between subjects with and without DR. However, when stratifying by disease severity, subjects with PDR showed significantly lower HDL cholesterol levels compared to those with NPDR and no DR. The role of HDL cholesterol in DR is not fully understood. While some studies have reported no association between lipid levels and DR [55], others have suggested a complex or even paradoxical relationship, including a potential U-shaped association between HDL levels and DR risk [56,57]. These findings indicate that lipid metabolism may play a nuanced role in retinal microvascular damage, warranting further investigation.
Pharmacological treatment patterns also differed according to DR severity. In particular, insulin therapy was more frequently observed in subjects with advanced DR, with the highest prevalence in PDR. This observation is consistent with previous registry studies reporting an increased prevalence and progression of DR among insulin-treated subjects [58,59]. However, insulin therapy is more likely to represent a marker of disease severity and longer disease duration rather than a direct causal factor. Several mechanisms have been proposed, including the potential impact of rapid glycaemic improvement on retinal microcirculation and the interaction between insulin and VEGF pathways [60]. Similarly, the lower use of metformin in subjects with DR observed in our cohort may suggest a potential protective role of this drug, possibly mediated by its anti-inflammatory, anti-oxidant, and anti-angiogenic properties, although causal relationships cannot be inferred from cross-sectional data [61,62,63].
The evaluation of vision-related quality of life represents a relevant and often underexplored aspect of DR. In our study, while no significant differences were observed between subjects with and without DR overall, a clear deterioration in quality of life emerged in subjects with more advanced stages of DR. In particular, subjects with PDR showed lower scores in multiple domains of the NEI-VFQ, including mental health, ocular pain, near and distance activities, and driving ability, highlighting the substantial burden of advanced retinal disease on daily functioning. These findings are consistent with previous studies demonstrating a progressive impairment in quality of life with increasing DR severity [64,65,66]. The inclusion of patient-reported outcomes in the assessment of DR may therefore provide a more comprehensive evaluation of disease burden and should be considered in both clinical practice and research settings.
A central aspect of our study was the investigation of dietary habits and their association with DR. Although no differences were observed in overall adherence to MD, specific dietary components showed significant associations with DR. In particular, legume consumption emerged as an independent factor associated with the presence of DR, with a more than twofold increased risk of DR in subjects with lower intake. At present, the literature does not provide strong direct evidence that legume consumption per se prevents, delays, or treats diabetic retinopathy (DR). Most of the evidence is either indirect—through the effects of legumes on upstream DR risk factors such as glycaemic control and blood pressure, or based on overall dietary patterns in which legumes are one component rather than the isolated exposure. A beneficial role for legumes remains biologically plausible. DR is driven by chronic hyperglycaemia, blood pressure elevation, oxidative stress, inflammation, endothelial dysfunction, and advanced glycation-related damage [29,67,68]. Legumes are typically low-glycaemic-index, rich in dietary fibre and resistant starch, and can improve overall carbohydrate quality. In a randomized trial in type 2 diabetes, replacing part of the diet with legumes as part of a low-glycaemic-index eating pattern improved HbA1c and blood pressure [69]. This matters because better glycaemic control and tighter blood pressure control are well-established ways to reduce the development or progression of diabetic microvascular complications, including retinopathy [70]. More broadly, the cardiometabolic literature supports legumes as part of dietary patterns associated with better metabolic health. Reviews and meta-analyses on carbohydrate quality and pulse intake suggest benefits for glycaemic regulation, satiety, and cardiovascular risk factors [71,72]. Prospective data from PREDIMED also suggest that higher legume intake is associated with a lower risk of developing type 2 diabetes, which strengthens the case for legumes in diabetes prevention and management, although again this is not retina-specific [29,67,68,73]In addition to legumes, our findings suggest that qualitative aspects of dietary fat intake may be relevant in the context of DR. Correlation analyses showed that higher intake of total and saturated fats was associated with worse vision-related quality of life, whereas monounsaturated fatty acids were positively associated with several NEI-VFQ domains. These observations are consistent with the known anti-inflammatory and antioxidant properties of monounsaturated fats, particularly those derived from olive oil, a hallmark of the Mediterranean diet. Furthermore, lower intake of antioxidant vitamins, such as vitamins A and E, observed in subjects with more advanced DR, may contribute to increased oxidative stress and retinal damage, given the key role of these micronutrients in maintaining retinal integrity and function [8,9,21].
Taken together, these findings support the hypothesis that specific dietary components, rather than overall dietary scores, may be associated with DR and its clinical consequences. However, several limitations should be acknowledged. First, the cross-sectional design does not allow causal or temporal inferences, and reverse causation cannot be excluded. Second, the study was conducted in a single tertiary centre and included a relatively small sample, particularly in the PDR group, which may have limited statistical power and the robustness of subgroup and multivariable analyses. Third, the highly selected population, consisting of Caucasian subjects with long-standing type 2 diabetes and intermediate HbA1c levels, limits the generalizability of the findings. Fourth, dietary intake was assessed by FFQ over the previous month and may therefore have been affected by recall bias, misclassification, and a limited ability to capture long-term dietary exposure relevant to DR. Fifth, residual confounding from unmeasured variables, such as physical activity, supplement use, socioeconomic factors, and previous ophthalmologic treatments, cannot be excluded. Finally, the exploratory correlation analyses were not adjusted for multiple testing and should therefore be considered hypothesis-generating.
At the same time, this study also has several strengths. First, it combined a detailed ophthalmologic characterization of DR with the assessment of vision-related quality of life, thereby providing both clinical and patient-reported perspectives on disease burden. In particular, retinal status was established through a comprehensive ophthalmologic evaluation and independently assessed by two experienced ophthalmologists, increasing the reliability of DR classification. Second, the study explored dietary habits not only in terms of overall adherence to the Mediterranean diet, but also by examining specific food groups and nutrient components, allowing the identification of potentially relevant associations that may not be captured by global dietary scores alone. Third, the inclusion of the NEI-VFQ-25 added a clinically meaningful dimension by linking dietary factors and DR severity to patients’ perceived visual functioning and daily life. Fourth, the analysis accounted for several major clinical and metabolic confounders, including age, sex, diabetes duration, adiposity measures, lipid profile, and blood pressure. Finally, the relatively homogeneous study population reduced some sources of clinical heterogeneity and allowed a more focused evaluation of dietary correlates of DR in subjects with long-standing type 2 diabetes.
From a clinical perspective, our findings suggest that dietary habits may represent a relevant and potentially modifiable factor in the broader management of DR. In particular, the observation that specific dietary components, rather than overall adherence to the Mediterranean diet, were associated with both DR and vision-related quality of life supports the need to move beyond global dietary scores and to explore the contribution of individual food groups and nutrients in greater detail. Although the cross-sectional nature of the study does not allow causal inferences, these results are consistent with the hypothesis that nutritional factors may influence retinal health through their effects on glycaemic control, oxidative stress, inflammation, and vascular function. In this context, dietary strategies emphasizing low-glycaemic-index foods, fibre-rich foods, unsaturated fats, and antioxidant-rich nutrients may offer a feasible, low-cost, and complementary approach within the multifactorial care of individuals with T2D. Importantly, the observed impairment in vision-related quality of life among subjects with more advanced DR further highlights the clinical relevance of identifying modifiable factors that may help reduce disease burden not only in anatomical terms, but also in everyday functioning and patient well-being. Larger prospective studies and targeted interventional trials are now warranted to confirm these associations, clarify their direction and magnitude, and determine whether specific nutritional interventions may contribute to the prevention or slower progression of diabetic retinopathy.
Author Contributions
Conceptualization, Ag.Mi., An.Mau., M.B., L.F., L.S., and A.A.; methodology, Ag.Mi., An.Mau., M.B., L.F., L.S., and A.A.; software, Ag.Mi., An.Mau., and RMS; validation, Ag.Mi., An.Mau.; formal analysis, Ag.Mi. and An.Mau.; investigation, Ag.Mi., An.Mau., and R.M.S.; resources, Ag.Mi., An.Mau., and R.M.S.; data curation, Ag.Mi., An.Mau., and RMS; writing—original draft preparation, Ag.Mi., and An.Mau..; writing—review and editing, Ag.Mi., An.Mau., M.B., R.M.S., D.R., An.Mar., L.F., L.S., and A.A.; visualization, Ag.Mi., An.Mau., M.B., R.M.S., D.R., An.Mar., L.F., L.S., and A.A.; supervision, Ag.Mi., An.Mau., M.B., R.M.S., L.F., L.S., and A.A.; project administration, Ag.Mi., An.Mau., M.B., R.M.S., L.F., L.S., and A.A.; funding acquisition, M.B., and A.A.. All authors have read and agreed to the published version of the manuscript.
Funding
This work is part of the PhD research program (Clinical and Translational Biomedicine, University of Catania) of Agostino Milluzzo, funded by MIUR—Research and Innovation Plan 2014–2020.
Institutional Review Board Statement
The study was conducted in accordance with the Declaration of Helsinki, and approved by the Ethics Committee of Catania 2 (protocol number 601/CECT2) on 7 October 2020.
Informed Consent Statement
All participants provided written informed consent prior to enrolment.
Data Availability Statement
Data used to support the findings of this study are available from the corresponding author upon request.
Acknowledgments
none.
Conflicts of Interest
The authors declare no conflict of interest.
References
- Sun, H.; Saeedi, P.; Karuranga, S.; Pinkepank, M.; Ogurtsova, K.; Duncan, B.B.; Stein, C.; Basit, A.; Chan, J.C.N.; Mbanya, J.C.; et al. IDF Diabetes Atlas: Global, Regional and Country-Level Diabetes Prevalence Estimates for 2021 and Projections for 2045. Diabetes Res. Clin. Pract. 2022, 183, 109119. [Google Scholar] [CrossRef]
- Classification and Diagnosis of Diabetes: Standards of Medical Care in Diabetes—2022. Diabetes Care 2022, 45, S17–S38. [CrossRef]
- Monami, M.; Cignarelli, A.; Pinto, S.; D’onofrio, L.; Milluzzo, A.; Miccoli, R.; Penno, G.; Mannucci, E. Alpha-Tocopherol and Contrast-Induced Nephropathy: A Meta-Analysis of Randomized Controlled Trials. Int. J. Vitam. Nutr. Res. 2021, 91. [Google Scholar] [CrossRef]
- Wong, T.Y.; Cheung, C.M.G.; Larsen, M.; Sharma, S.; Simó, R. Diabetic Retinopathy. Nat. Rev. Dis. Prim. 2016, 2, 16012. [Google Scholar] [CrossRef]
- Knudsen, L.L.; Lervang, H.-H.; Lundbye-Christensen, S.; Gorst-Rasmussen, A. The North Jutland County Diabetic Retinopathy Study: Population Characteristics. Br. J. Ophthalmol. 2006, 90, 1404–1409. [Google Scholar] [CrossRef]
- Giuffrè, G.; Lodato, G.; Dardanoni, G. Prevalence and Risk Factors of Diabetic Retinopathy in Adult and Elderly Subjects: The Casteldaccia Eye Study. Graefe’s Arch. Clin. Exp. Ophthalmol. 2004, 242, 535–540. [Google Scholar] [CrossRef] [PubMed]
- Resnikoff, S.; Keys, T. Future Trends in Global Blindness. Indian J. Ophthalmol. 2012, 60, 387. [Google Scholar] [CrossRef] [PubMed]
- Jampol, L.M.; Glassman, A.R.; Sun, J. Evaluation and Care of Patients with Diabetic Retinopathy. N. Engl. J. Med. 2020, 382, 1629–1637. [Google Scholar] [CrossRef] [PubMed]
- Antonetti, D.A.; Klein, R.; Gardner, T.W. Diabetic Retinopathy. N. Engl. J. Med. 2012, 366, 1227–1239. [Google Scholar] [CrossRef]
- Sabanayagam, C.; Yip, W.; Ting, D.S.W.; Tan, G.; Wong, T.Y. Ten Emerging Trends in the Epidemiology of Diabetic Retinopathy. Ophthalmic Epidemiol. 2016, 23, 209–222. [Google Scholar] [CrossRef]
- MILLUZZO, A.; BARCHITTA, M.; MAUGERI, A.; AGODI, A.; SCIACCA, L. Body Mass Index Is Related to Short Term Retinal Worsening in Type 2 Diabetes Patients Treated with Anticancer Drugs. Minerva Endocrinol. 2022. [Google Scholar] [CrossRef]
- Tumminia, A.; Milluzzo, A.; Carrubba, N.; Vinciguerra, F.; Baratta, R.; Frittitta, L. Excessive Generalized and Visceral Adiposity Is Associated with a Higher Prevalence of Diabetic Retinopathy in Caucasian Patients with Type 2 Diabetes. Nutr. Metab. Cardiovasc. Dis. 2024, 34, 763–770. [Google Scholar] [CrossRef]
- Milluzzo, A.; Manuella, L.; Frittitta, L.; Sciacca, L. Cancer Drugs and Diabetic Retinopathy: A Dangerous, Underestimated Association. Metab. Target Organ Damage 2024, 4. [Google Scholar] [CrossRef]
- Milluzzo, A.; Tumminia, A.; Vella, V.; Gianì, F.; Manzella, L.; Frittitta, L.; Belfiore, A.; Vigneri, R.; Sciacca, L. Short-Term Adverse Effects of Anticancer Drugs in Patients with Type 2 Diabetes. J. Chemother. 2019, 31. [Google Scholar] [CrossRef] [PubMed]
- Bhatwadekar, A.D.; Shughoury, A.; Belamkar, A.; Ciulla, T.A. Genetics of Diabetic Retinopathy, a Leading Cause of Irreversible Blindness in the Industrialized World. Genes 2021, 12, 1200. [Google Scholar] [CrossRef]
- Han, J.; Lando, L.; Skowronska-Krawczyk, D.; Chao, D.L. Genetics of Diabetic Retinopathy. Curr. Diab. Rep. 2019, 19, 67. [Google Scholar] [CrossRef]
- Leslie, R.D.G.; Pyke, D.A. Diabetic Retinopathy in Identical Twins. Diabetes 1982, 31, 19–21. [Google Scholar] [CrossRef] [PubMed]
- Khullar, M.; Cheema, B.S.; Raut, S.K. Emerging Evidence of Epigenetic Modifications in Vascular Complication of Diabetes. Front. Endocrinol. . 2017, 8. [Google Scholar] [CrossRef]
- Ling, C.; Groop, L. Epigenetics: A Molecular Link Between Environmental Factors and Type 2 Diabetes. Diabetes 2009, 58, 2718–2725. [Google Scholar] [CrossRef] [PubMed]
- Gilbert, E.R.; Liu, D. Epigenetics: The Missing Link to Understanding β-Cell Dysfunction in the Pathogenesis of Type 2 Diabetes. Epigenetics 2012, 7, 841–852. [Google Scholar] [CrossRef]
- Milluzzo, A.; Maugeri, A.; Barchitta, M.; Sciacca, L.; Agodi, A. Epigenetic Mechanisms in Type 2 Diabetes Retinopathy: A Systematic Review. Int. J. Mol. Sci. 2021, 22. [Google Scholar] [CrossRef]
- Aro, A.; Kauppinen, A.; Summanen, P.; Kivinen, N.; Selander, T.; Kinnunen, K.; Tuomilehto, J.; Keinänen-Kiukaanniemi, S.; Lindström, J.; Uusitupa, M.; et al. Life Style Intervention Improves Retinopathy Status—The Finnish Diabetes Prevention Study. Nutrients 2019, 11, 1691. [Google Scholar] [CrossRef]
- Tyrberg, M.; Nyström, L.; Arnqvist, H.J.; Bolinder, J.; Gudbjörnsdottir, S.; Landin-Olsson, M.; Eriksson, J.W.; Svensson, M.K. Overweight, Hyperglycemia and Tobacco Use Are Modifiable Risk Factors for Onset of Retinopathy 9 and 17 Years after the Diagnosis of Diabetes—A Retrospective Observational Nation-Wide Cohort Study. Diabetes Res. Clin. Pract. 2017, 133, 21–29. [Google Scholar] [CrossRef]
- Bryl, A.; Mrugacz, M.; Falkowski, M.; Zorena, K. The Effect of Diet and Lifestyle on the Course of Diabetic Retinopathy—A Review of the Literature. Nutrients 2022, 14, 1252. [Google Scholar] [CrossRef] [PubMed]
- Milluzzo, A.; Barchitta, M.; Maugeri, A.; Magnano San Lio, R.; Favara, G.; Mazzone, M.G.; Sciacca, L.; Agodi, A. Do Nutrients and Nutraceuticals Play a Role in Diabetic Retinopathy? A Systematic Review. Nutrients 2022, 14, 4430. [Google Scholar] [CrossRef]
- Testa, R.; Bonfigli, A.R.; Prattichizzo, F.; La Sala, L.; De Nigris, V.; Ceriello, A. The “Metabolic Memory” Theory and the Early Treatment of Hyperglycemia in Prevention of Diabetic Complications. Nutrients 2017, 9, 437. [Google Scholar] [CrossRef]
- Shi, C.; Wang, P.; Airen, S.; Brown, C.; Liu, Z.; Townsend, J.H.; Wang, J.; Jiang, H. Nutritional and Medical Food Therapies for Diabetic Retinopathy. Eye Vis. 2020, 7, 33. [Google Scholar] [CrossRef]
- Valle, M.S.; Russo, C.; Malaguarnera, L. Protective Role of Vitamin D against Oxidative Stress in Diabetic Retinopathy. Diabetes. Metab. Res. Rev. 2021, 37. [Google Scholar] [CrossRef] [PubMed]
- Valero-Vello, M.; Peris-Martínez, C.; García-Medina, J.J.; Sanz-González, S.M.; Ramírez, A.I.; Fernández-Albarral, J.A.; Galarreta-Mira, D.; Zanón-Moreno, V.; Casaroli-Marano, R.P.; Pinazo-Duran, M.D. Searching for the Antioxidant, Anti-Inflammatory, and Neuroprotective Potential of Natural Food and Nutritional Supplements for Ocular Health in the Mediterranean Population. Foods 2021, 10, 1231. [Google Scholar] [CrossRef]
- Díaz-López, A.; Babio, N.; Martínez-González, M.A.; Corella, D.; Amor, A.J.; Fitó, M.; Estruch, R.; Arós, F.; Gómez-Gracia, E.; Fiol, M.; et al. Mediterranean Diet, Retinopathy, Nephropathy, and Microvascular Diabetes Complications: A Post Hoc Analysis of a Randomized Trial. Diabetes Care 2015, 38, 2134–2141. [Google Scholar] [CrossRef] [PubMed]
- Huo, R.; Du, T.; Xu, Y.; Xu, W.; Chen, X.; Sun, K.; Yu, X. Effects of Mediterranean-Style Diet on Glycemic Control, Weight Loss and Cardiovascular Risk Factors among Type 2 Diabetes Individuals: A Meta-Analysis. Eur. J. Clin. Nutr. 2015, 69, 1200–1208. [Google Scholar] [CrossRef]
- Sala-Vila, A.; Díaz-López, A.; Valls-Pedret, C.; Cofán, M.; García-Layana, A.; Lamuela-Raventós, R.-M.; Castañer, O.; Zanon-Moreno, V.; Martinez-Gonzalez, M.A.; Toledo, E.; et al. Dietary Marine ω-3 Fatty Acids and Incident Sight-Threatening Retinopathy in Middle-Aged and Older Individuals With Type 2 Diabetes: Prospective Investigation From the PREDIMED Trial. JAMA Ophthalmol. 2016, 134, 1142–1149. [Google Scholar] [CrossRef]
- Tanaka, S.; Yoshimura, Y.; Kawasaki, R.; Kamada, C.; Tanaka, S.; Horikawa, C.; Ohashi, Y.; Araki, A.; Ito, H.; Akanuma, Y.; et al. Fruit Intake and Incident Diabetic Retinopathy with Type 2 Diabetes. Epidemiology 2013, 24, 204–211. [Google Scholar] [CrossRef]
- Millen, A.E.; Klein, R.; Folsom, A.R.; Stevens, J.; Palta, M.; Mares, J.A. Relation between Intake of Vitamins C and E and Risk of Diabetic Retinopathy in the Atherosclerosis Risk in Communities Study. Am. J. Clin. Nutr. 2004, 79, 865–873. [Google Scholar] [CrossRef] [PubMed]
- Millen, A.E.; Sahli, M.W.; Nie, J.; LaMonte, M.J.; Lutsey, P.L.; Klein, B.E.K.; Mares, J.A.; Meyers, K.J.; Andrews, C.A.; Klein, R. Adequate Vitamin D Status Is Associated with the Reduced Odds of Prevalent Diabetic Retinopathy in African Americans and Caucasians. Cardiovasc. Diabetol. 2016, 15, 128. [Google Scholar] [CrossRef] [PubMed]
- Ross, R.; Neeland, I.J.; Yamashita, S.; Shai, I.; Seidell, J.; Magni, P.; Santos, R.D.; Arsenault, B.; Cuevas, A.; Hu, F.B.; et al. Waist Circumference as a Vital Sign in Clinical Practice: A Consensus Statement from the IAS and ICCR Working Group on Visceral Obesity. Nat. Rev. Endocrinol. 2020, 16, 177–189. [Google Scholar] [CrossRef]
- Friedewald, W.T.; Levy, R.I.; Fredrickson, D.S. Estimation of the Concentration of Low-Density Lipoprotein Cholesterol in Plasma, without Use of the Preparative Ultracentrifuge. Clin. Chem. 1972, 18. [Google Scholar] [CrossRef]
- 11. Chronic Kidney Disease and Risk Management: Standards of Medical Care in Diabetes—2022. Diabetes Care 2022, 45, S175–S184. [CrossRef] [PubMed]
- Wilkinson, C.P.; Ferris, F.L.; Klein, R.E.; Lee, P.P.; Agardh, C.D.; Davis, M.; Dills, D.; Kampik, A.; Pararajasegaram, R.; Verdaguer, J.T. Proposed International Clinical Diabetic Retinopathy and Diabetic Macular Edema Disease Severity Scales. Ophthalmology 2003, 110, 1677–1682. [Google Scholar] [CrossRef]
- Wu, L. Classification of Diabetic Retinopathy and Diabetic Macular Edema. World J. Diabetes 2013, 4, 290. [Google Scholar] [CrossRef]
- Nickels, S.; Schuster, A.K.; Singer, S.; Wild, P.S.; Laubert-Reh, D.; Schulz, A.; Finger, R.P.; Michal, M.; Beutel, M.E.; Münzel, T.; et al. The National Eye Institute 25-Item Visual Function Questionnaire (NEI VFQ-25)—Reference Data from the German Population-Based Gutenberg Health Study (GHS). Health Qual. Life Outcomes 2017, 15, 156. [Google Scholar] [CrossRef]
- Mangione, C.M. Development of the 25-List-Item National Eye Institute Visual Function Questionnaire. Arch. Ophthalmol. 2001, 119, 1050. [Google Scholar] [CrossRef]
- Agodi, A.; Barchitta, M.; Valenti, G.; Marzagalli, R.; Frontini, V.; Marchese, A.E. Increase in the Prevalence of the MTHFR 677 TT Polymorphism in Women Born since 1959: Potential Implications for Folate Requirements. Eur. J. Clin. Nutr. 2011, 65, 1302–1308. [Google Scholar] [CrossRef]
- WILLETT, W.; STAMPFER, M.J. TOTAL ENERGY INTAKE: IMPLICATIONS FOR EPIDEMIOLOGIC ANALYSES. Am. J. Epidemiol. 1986, 124, 17–27. [Google Scholar] [CrossRef] [PubMed]
- Trichopoulou, A.; Kouris-Blazos, A.; Wahlqvist, M.L.; Gnardellis, C.; Lagiou, P.; Polychronopoulos, E.; Vassilakou, T.; Lipworth, L.; Trichopoulos, D. Diet and Overall Survival in Elderly People. BMJ 1995, 311, 1457–1460. [Google Scholar] [CrossRef] [PubMed]
- Couto, E.; Boffetta, P.; Lagiou, P.; Ferrari, P.; Buckland, G.; Overvad, K.; Dahm, C.C.; Tjønneland, A.; Olsen, A.; Clavel-Chapelon, F.; et al. Mediterranean Dietary Pattern and Cancer Risk in the EPIC Cohort. Br. J. Cancer 2011, 104, 1493–1499. [Google Scholar] [CrossRef] [PubMed]
- Barchitta, M.; Quattrocchi, A.; Adornetto, V.; Marchese, A.E.; Agodi, A. Tumor Necrosis Factor-Alpha −308 G>A Polymorphism, Adherence to Mediterranean Diet, and Risk of Overweight/Obesity in Young Women. BioMed Res. Int. 2014, 2014, 1–8. [Google Scholar] [CrossRef]
- Effect of Intensive Diabetes Therapy on the Progression of Diabetic Retinopathy in Patients With Type 1 Diabetes: 18 Years of Follow-up in the DCCT/EDIC. Diabetes 2015, 64, 631–642. [CrossRef]
- Wang, Q.; Zeng, N.; Tang, H.; Yang, X.; Yao, Q.; Zhang, L.; Zhang, H.; Zhang, Y.; Nie, X.; Liao, X.; et al. Diabetic Retinopathy Risk Prediction in Patients with Type 2 Diabetes Mellitus Using a Nomogram Model. Front. Endocrinol. . 2022, 13. [Google Scholar] [CrossRef]
- Cai, K.; Liu, Y.; Wang, D. Prevalence of Diabetic Retinopathy in Patients with Newly Diagnosed Type 2 Diabetes: A Systematic Review and Meta-analysis. Diabetes. Metab. Res. Rev. 2022. [Google Scholar] [CrossRef]
- Hammes, H.-P.; Welp, R.; Kempe, H.-P.; Wagner, C.; Siegel, E.; Holl, R.W. Risk Factors for Retinopathy and DME in Type 2 Diabetes—Results from the German/Austrian DPV Database. PLoS ONE 2015, 10, e0132492. [Google Scholar] [CrossRef]
- Zhu, W.; Wu, Y.; Meng, Y.-F.; Xing, Q.; Tao, J.-J.; Lu, J. Association of Obesity and Risk of Diabetic Retinopathy in Diabetes Patients. Medicine 2018, 97, e11807. [Google Scholar] [CrossRef]
- Zhou, Y.; Zhang, Y.; Shi, K.; Wang, C. Body Mass Index and Risk of Diabetic Retinopathy. Medicine 2017, 96, e6754. [Google Scholar] [CrossRef]
- Man, R.E.K.; Sabanayagam, C.; Chiang, P.P.-C.; Li, L.-J.; Noonan, J.E.; Wang, J.J.; Wong, T.Y.; Cheung, G.C.-M.; Tan, G.S.W.; Lamoureux, E.L. Differential Association of Generalized and Abdominal Obesity With Diabetic Retinopathy in Asian Patients With Type 2 Diabetes. JAMA Ophthalmol. 2016, 134, 251. [Google Scholar] [CrossRef]
- Klein, R.; Knudtson, M.D.; Lee, K.E.; Gangnon, R.; Klein, B.E.K. The Wisconsin Epidemiologic Study of Diabetic Retinopathy XXIII: The Twenty-Five-Year Incidence of Macular Edema in Persons with Type 1 Diabetes. Ophthalmology 2009, 116, 497–503. [Google Scholar] [CrossRef]
- Sasso, F.C.; Pafundi, P.C.; Gelso, A.; Bono, V.; Costagliola, C.; Marfella, R.; Sardu, C.; Rinaldi, L.; Galiero, R.; Acierno, C.; et al. High HDL Cholesterol: A Risk Factor for Diabetic Retinopathy? Findings from NO BLIND Study. Diabetes Res. Clin. Pract. 2019, 150, 236–244. [Google Scholar] [CrossRef]
- Madsen, C.M.; Varbo, A.; Nordestgaard, B.G. Extreme High High-Density Lipoprotein Cholesterol Is Paradoxically Associated with High Mortality in Men and Women: Two Prospective Cohort Studies. Eur. Heart J. 2017, 38, 2478–2486. [Google Scholar] [CrossRef]
- Gange, W.S.; Lopez, J.; Xu, B.Y.; Lung, K.; Seabury, S.A.; Toy, B.C. Incidence of Proliferative Diabetic Retinopathy and Other Neovascular Sequelae at 5 Years Following Diagnosis of Type 2 Diabetes. Diabetes Care 2021, 44, 2518–2526. [Google Scholar] [CrossRef] [PubMed]
- Grauslund, J.; Pedersen, F.N.; Andersen, N.; Andresen, J.; Bek, T.; Dinesen, S.; Hajari, J.; Heegaard, S.; Højlund, K.; Laugesen, C.S.; et al. Presence and Development of Diabetic Retinopathy in 153 238 Patients with Type 2 Diabetes in the Danish Registry of Diabetic Retinopathy. Acta Ophthalmol. 2022. [Google Scholar] [CrossRef] [PubMed]
- Yang, N.; Li, M.-X.; Peng, X.-Y. Effects of Intensive Insulin Therapy on the Retinal Microvasculature in Patients with Type 2 Diabetes Mellitus: A Prospective Observational Study. BMC Ophthalmol. 2022, 22, 187. [Google Scholar] [CrossRef] [PubMed]
- Li, Y.; Ryu, C.; Munie, M.; Noorulla, S.; Rana, S.; Edwards, P.; Gao, H.; Qiao, X. Association of Metformin Treatment with Reduced Severity of Diabetic Retinopathy in Type 2 Diabetic Patients. J. Diabetes Res. 2018, 2018, 1–8. [Google Scholar] [CrossRef]
- Fan, Y.-P.; Wu, C.-T.; Lin, J.-L.; Hsiung, C.A.; Liu, H.Y.; Lai, J.-N.; Yang, C.-C. Metformin Treatment Is Associated with a Decreased Risk of Nonproliferative Diabetic Retinopathy in Patients with Type 2 Diabetes Mellitus: A Population-Based Cohort Study. J. Diabetes Res. 2020, 2020, 1–12. [Google Scholar] [CrossRef]
- Amin, S. V.; Khanna, S.; Parvar, S.P.; Shaw, L.T.; Dao, D.; Hariprasad, S.M.; Skondra, D. Metformin and Retinal Diseases in Preclinical and Clinical Studies: Insights and Review of Literature. Exp. Biol. Med. 2022, 247, 317–329. [Google Scholar] [CrossRef]
- Rossi, G.C.M.; Milano, G.; Tinelli, C. The Italian Version of the 25-Item National Eye Institute Visual Function Questionnaire: Translation, Validity, and Reliability. J. Glaucoma 2003, 12, 213–220. [Google Scholar] [CrossRef]
- Trento, M.; Passera, P.; Trevisan, M.; Schellino, F.; Sitia, E.; Albani, S.; Montanaro, M.; Bandello, F.; Scoccianti, L.; Charrier, L.; et al. Quality of Life, Impaired Vision and Social Role in People with Diabetes: A Multicenter Observational Study. Acta Diabetol. 2013, 50, 873–877. [Google Scholar] [CrossRef]
- Pereira, D.M. Quality of Life in People with Diabetic Retinopathy: Indian Study. J. Clin. Diagn. Res. 2017. [Google Scholar] [CrossRef]
- Martín-Peláez, S.; Fito, M.; Castaner, O. Mediterranean Diet Effects on Type 2 Diabetes Prevention, Disease Progression, and Related Mechanisms. A Review. Nutrients 2020, 12, 2236. [Google Scholar] [CrossRef]
- Wong, M.Y.Z.; Man, R.E.K.; Fenwick, E.K.; Gupta, P.; Li, L.-J.; van Dam, R.M.; Chong, M.F.; Lamoureux, E.L. Dietary Intake and Diabetic Retinopathy: A Systematic Review. PLoS ONE 2018, 13, e0186582. [Google Scholar] [CrossRef]
- Jenkins, D.J.A.; Kendall, C.W.C.; Augustin, L.S.A.; Mitchell, S.; Sahye-Pudaruth, S.; Blanco Mejia, S.; Chiavaroli, L.; Mirrahimi, A.; Ireland, C.; Bashyam, B.; et al. Effect of Legumes as Part of a Low Glycemic Index Diet on Glycemic Control and Cardiovascular Risk Factors in Type 2 Diabetes Mellitus. Arch. Intern. Med. 2012, 172, 1653. [Google Scholar] [CrossRef]
- The Effect of Intensive Treatment of Diabetes on the Development and Progression of Long-Term Complications in Insulin-Dependent Diabetes Mellitus. N. Engl. J. Med. 1993, 329, 977–986. [CrossRef]
- Reynolds, A.; Mann, J.; Cummings, J.; Winter, N.; Mete, E.; Te Morenga, L. Carbohydrate Quality and Human Health: A Series of Systematic Reviews and Meta-Analyses. The Lancet 2019, 393, 434–445. [Google Scholar] [CrossRef]
- Mudryj, A.N.; Yu, N.; Aukema, H.M. Nutritional and Health Benefits of Pulses. Appl. Physiol. Nutr. Metab. 2014, 39, 1197–1204. [Google Scholar] [CrossRef]
- Becerra-Tomás, N.; Díaz-López, A.; Rosique-Esteban, N.; Ros, E.; Buil-Cosiales, P.; Corella, D.; Estruch, R.; Fitó, M.; Serra-Majem, L.; Arós, F.; et al. Legume Consumption Is Inversely Associated with Type 2 Diabetes Incidence in Adults: A Prospective Assessment from the PREDIMED Study. Clin. Nutr. 2018, 37, 906–913. [Google Scholar] [CrossRef]
Figure 1.
Correlation matrix between clinical characteristics and NEI-VFQ domain scores. Correlation coefficients with p < 0.05 are shown in bold.
Figure 1.
Correlation matrix between clinical characteristics and NEI-VFQ domain scores. Correlation coefficients with p < 0.05 are shown in bold.

Figure 2.
Correlation matrix between dietary intakes and NEI-VFQ domain scores. Correlation coefficients with p < 0.05 are shown in bold.
Figure 2.
Correlation matrix between dietary intakes and NEI-VFQ domain scores. Correlation coefficients with p < 0.05 are shown in bold.


Table 1.
Demographic, anthropometric, clinical and biochemical characteristics of the 129 recruited subjects.
Table 1.
Demographic, anthropometric, clinical and biochemical characteristics of the 129 recruited subjects.
| Male gender, n (%) | 65 (50.4) |
|---|---|
| Age (years) | 70 (65-74) |
| Duration of diabetes (years) | 17 (14-19) |
| BMI (Kg/m2) | 29.8 (26.3-33.8) |
| BMI classification, n (%) | |
| Normal weight | 17 (13.2) |
| Overweight | 54 (41.9) |
| Obese | 58 (45.0) |
| WC (cm) | 105 (98-115) |
| High WC, n (%) | 104 (80.6) |
| HbA1c (%) | 8 (7-8) |
| Fasting plasma glucose (mg/dL) | 133 (121-158) |
| Creatinine (mg/dL) | 1 (1-1) |
| eGFR (mL/min) | 77.5 (58.4-91.4) |
| Microalbuminuria, n (%) | 24 (18.6) |
| Macroalbuminuria, n (%) | 1 (0.8) |
| Cholesterol total (mg/dL) | 164 (143-182) |
| HDL (mg/dL) | 46 (39-53) |
| LDL (mg/dL) | 90 (70-109) |
| Triglycerides (mg/dL) | 117 (89-151) |
| AST (U/L) | 18 (16-23) |
| ALT (U/L) | 19 (14-28) |
| SBP (mmHg) | 130 (120-145) |
| DBP (mmHg) | 75 (70-80) |
| Insulin treatment, n (%) | 54 (41.9) |
| Long-acting insulin analogues | 54 (41.9) |
| Short-acting insulin analogues | 19 (14.7) |
| Other diabetes drugs, n (%) | |
| Metformin | 111 (86) |
| GLP-1 RA | 59 (45.7) |
| SGLT2-I | 31 (24) |
| GLP-1 RA or SGLT2-I | 81 (62.8) |
| DPP4-I | 13 (10.2) |
| Pioglitazone | 17 (13.2) |
| Acarbose | 3 (2.3) |
| Lipid lowering drugs, n (%) | 99 (76.7) |
| Anti-hypertensive drugs, n (%) | 106 (82.2) |
| Anti-platelets drugs, n (%) | 89 (71.2) |
| DR, n (%) | 44 (34.1) |
| NPDR, n (%) | 36 (27.9) |
| PDR, n (%) | 8 (6.2) |
| Chronic kidney disease, % | 75.2 |
| Chronic kidney disease stage, % | |
| Stage 1 | 5 (3.9) |
| Stage 2 | 57 (44.2) |
| Stage 3 | 32 (24.8) |
| Stage 4 | 3 (2.3) |
| Stage 5 | 0 (0.0) |
| Ischemic heart disease | 21 (16.3) |
| Stroke or lower limb revascularization | 10 (7.8) |
BMI, body mass index; WC, waist circumference; eGFR, estimated glomerular filtration rate; SBP, systolic blood pressure, DBP, diastolic blood pressure; GLP-1 RA, glucagon like peptide 1 receptor agonists; SGLT2-I, sodium glucose transporter-2 inhibitors; DPP4-I, dipeptidyl peptidase-4 inhibitors; DR: diabetic retinopathy, NPDR, non-proliferant diabetic retinopathy; PDR, proliferant diabetic retinopathy.
Table 2.
Demographic, anthropometric, clinical and biochemical characteristics of the 129 recruited subjects subdivided according to retinal status.
Table 2.
Demographic, anthropometric, clinical and biochemical characteristics of the 129 recruited subjects subdivided according to retinal status.
| NDR (N=85) |
DR (N=44) |
NPDR (N=36) |
PDR (N=8) |
p (NDR vs. DR) |
p (NDR vs. NPDR vs. PDR) |
p (NPDR vs. PDR) |
|
|---|---|---|---|---|---|---|---|
| Male gender, n (%) | 38 (44.7) | 27 (61.4) | 26 (63.9) | 4 (50.0) | 0.07 | 0.16 | 0.47 |
| Age (years) | 70 (63.5-74) | 70 (65.3-76) | 71 (66-76) | 70 (64-75) | 0.46 | 0.65 | 0.56 |
| Age at diabetes diagnosis (years) | 53 (47-58) | 53 (45-56) | 54 (45-56) | 51 (40-59) | 0.31 | 0.57 | 0.62 |
| Duration of diabetes (years) | 16 (13-19) | 18 (16-21.8) | 18 (15-22) | 18 (17-21) | <0.01 | <0.01 | 0.78 |
| BMI (Kg/m2) | 30 (26.4-34.3) | 28.1 (25.6-32.7) | 27.4 (26-32) | 31.3 (26-39) | 0.12 | 0.09 | 0.17 |
| BMI classification, n (%) | |||||||
| Normal weight | 10 (11.8) | 7 (15.9) | 6 (16.7) | 1 (12.5) | 0.20 | 0.38 | 0.58 |
| Overweight | 32 (37.6) | 22 (50.0) | 19 (52.8) | 3 (37.5) | |||
| Obese | 43 (50.6) | 15 (34.1) | 11 (30.6) | 4 (50) | |||
| WC (cm) | 105 (97-115) | 107 (101-114.8) | 106 (103-112) | 115 (105-125) | 0.53 | 0.29 | 0.13 |
| High WC, n (%) | 69 (81.2) | 35 (79.5) | 28 (77.8) | 7 (87.5) | 0.82 | 0.80 | 0.54 |
| HbA1c (%) | 7 (7-8) | 8 (7-8) | 8 (7-8) | 8 (7-8) | 0.92 | 0.23 | 0.80 |
| Fasting glucose (mg/dL) | 133 (121-156) | 132 (121-161) | 132 (121-161) | 131 (119-171) | 0.67 | 0.91 | 0.96 |
| Creatinine (mg/dL) | 1 (1-1) | 1 (1-1) | 1 (1-1) | 1 (1-1) | 0.70 | 0.83 | 0.08 |
| GFR (mL/min) | 79.8 (61.5-92) | 74.7 (57-87) | 71.4 (56.8-87) | 82.0 (72-96) | 0.41 | 0.34 | 0.27 |
| Microalbuminuria, n (%) | 15 (17.6) | 9 (20.5) | 6 (16.7) | 3 (37.5) | 0.71 | 0.36 | 0.19 |
| Macroalbuminuria, n (%) | 1 (1.2) | 0 (0.0) | 0 (0.0) | 0 (0.0) | - | - | - |
| Cholesterol total (mg/dL) | 162 (141.3-179) | 166 (144-187) | 169 (153-192) | 145 (120-152) | 0.56 | 0.04 | 0.01 |
| HDL (mg/dL) | 45 (38-52.8) | 49 (41-54) | 50 (43-59) | 40 (33-46) | 0.17 | 0.01 | 0.01 |
| LDL (mg/dL) | 87.5 (66.3-109) | 90 (73-108) | 95 (80-112) | 78 (61-84) | 0.95 | 0.16 | 0.03 |
| Triglycerides (mg/dL) | 123 (89-151) | 110 (84.3-163.5) | 107 (84-164) | 127 (80-163) | 0.56 | 0.80 | 0.89 |
| AST (U/L) | 19 (16-24) | 18 (14-21) | 18 (14-21) | 18 (16-21) | 0.16 | 0.37 | 0.96 |
| ALT (U/L) | 20 (14-29) | 17 (14-24) | 17 (13-24) | 21 (16-33) | 0.19 | 0.26 | 0.31 |
| SBP (mmHg) | 130 (123-145) | 133 (120-144) | 133 (125-144) | 128 (120-144) | 0.91 | 0.83 | 0.58 |
| DBP (mmHg) | 75 (70-80) | 70 (66-80) | 70 (66-80) | 70 (66-78) | 0.10 | 0.20 | 0.54 |
| Insulin treatment, n (%) | 29 (34.1) | 23 (52.3) | 17 (47.2) | 6 (75.0) | 0.04 | 0.03 | 0.20 |
| Long-acting insulin analogues | 29 (34.1) | 23 (52.3) | 17 (47.2) | 6 (75.0) | <0.05 | <0.05 | 0.20 |
| Short-acting insulin analogues | 8 (9.4) | 11 (25.0) | 9 (25.0) | 2 (25.0) | 0.02 | 0.06 | 1.00 |
| Pro-Kg insulin daily dose (U) | |||||||
| Long-acting insulin analogues | 0.26 (0.18-0.38) | 0.27 (0.17-0.37) | 0.24 (0.16-0.30) | 0.4 (0.3-0.5) | 0.96 | 0.07 | 0.02 |
| Short-acting insulin analogues | 0.26 (0.17-0.57) | 0.26 (0.21-0.32) | 0.24 (0.18-0.37) | 0.27 (0.26-NA) | 0.60 | 0.76 | 0.73 |
| Total dose | 0.29 (0.20-0.46) | 0.39 (0.22-0.56) | 0.36 (0.24-0.52) | 0.51 (0.34-0.62) | 0.23 | 0.27 | 0.25 |
| Other diabetes drugs, n (%) | |||||||
| Metformin | 78 (91.8) | 33 (75.0) | 26 (72.2) | 7 (87.5) | <0.01 | 0.02 | 0.37 |
| GLP-1 RA | 38 (44.7) | 21 (47.7) | 16 (44.4) | 5 (62.5) | 0.74 | 0.62 | 0.36 |
| SGLT2-I | 16 (18.8) | 15 (34.1) | 13 (36.1) | 2 (25.0) | 0.054 | 0.13 | 0.55 |
| GLP-1 RA or SGLT2-I | 47 (55.3) | 34 (77.3) | 28 (77.8) | 6 (75.0) | 0.01 | <0.05 | 0.87 |
| DPP4-I | 11 (13.4) | 2 (4.5) | 2 (5.6) | 0 (0.0) | 0.13 | 0.28 | 0.50 |
| Pioglitazone | 11 (12.9) | 6 (13.6) | 6 (16.7) | 0 (0.0) | 0.91 | 0.45 | 0.21 |
| Acarbose | 3 (3.5) | 0 (0.0) | 0 (0.0) | 0 (0.0) | 0.21 | 0.45 | - |
| Lipid lowering drugs, n (%) | 68 (80.0) | 31 (70.5) | 25 (69.4) | 6 (75.0) | 0.22 | 0.45 | 0.76 |
| Anti-hypertensive drugs, n (%) | 72 (84.7) | 34 (77.3) | 28 (77.8) | 6 (75.0) | 0.30 | 0.57 | 0.87 |
| Anti-platelets drugs, n (%) | 56 (69.1) | 33 (75) | 28 (77.8) | 5 (62.5) | 0.49 | 0.54 | 0.37 |
NDR, no diabetic retinopathy; DR: diabetic retinopathy, NPDR, non-proliferant diabetic retinopathy; PDR, proliferant diabetic retinopathy; BMI, body mass index; WC, waist circumference; GFR, glomerular filtration rate; SBP, systolic blood pressure, DBP, diastolic blood pressure; GLP-1 RA, glucagon like peptide 1 receptor agonists; SGLT2-I, sodium glucose transporter-2 inhibitors; DPP4-I, dipeptidyl peptidase-4 inhibitors.
Table 3.
Scores of the National Eye Institute Visual Function Questionnaire in the recruited subjects subdivided according to retinal status.
Table 3.
Scores of the National Eye Institute Visual Function Questionnaire in the recruited subjects subdivided according to retinal status.
| NDR (N=85) |
DR (N=44) |
NPDR (N=36) |
PDR (N=8) |
p (NDR vs. DR) |
p (NDR vs. NPDR vs. PDR) |
p (NPDR vs. PDR) |
|
|---|---|---|---|---|---|---|---|
| COMPOSITE SCORE | 99.1 (95.9-99.5) | 99.1 (97-99) | 99.1 (97.6-99.1) | 94.6 (85.7-98) | 0.47 | 0.04 | 0.01 |
| General health | 70.0 (60-77.5) | 65.0 (60.0-77.5) | 65 (60-75) | 72.5 (60-77.5) | 0.63 | 0.92 | 0.96 |
| General vision | 90.0 (70-95) | 87.5 (75-90) | 90 (82.5-90) | 72.5 (55-85) | 0.35 | 0.07 | 0.02 |
| Mental health | 100 (95-100) | 100 (100-100) | 100 (100-100) | 98 (83-100) | 0.17 | 0.01 | 0.07 |
| Ocular pain | 100 (88-100) | 100 (100-100) | 100 (100-100) | 88 (82-100) | 0.16 | <0.01 | 0.02 |
| Near activities | 100 (100-100) | 100 (100-100) | 100 (100-100) | 96 (63-100) | 0.62 | 0.02 | 0.07 |
| Distance activities | 100 (100-100) | 100 (100-100) | 100 (100-100) | 100 (81-100) | 0.44 | <0.05 | 0.16 |
| Peripheralvision | 100 (100-100) | 100 (100-100) | 100 (100-100) | 100 (88-100) | 0.69 | 0.17 | 0.40 |
| Social functioning | 100 (100-100) | 100 (100-100) | 100 (100-100) | 100 (96-100) | 0.77 | 0.10 | 0.33 |
| Color vision | 100 (100-100) | 100 (100-100) | 100 (100-100) | 100 (100-100) | 0.28 | 0.19 | 0.59 |
| Driving | 100 (100-100) | 100 (100-100) | 100 (100-100) | 96 (67-100) | 0.74 | 0.01 | 0.11 |
| Role difficulties | 100 (100-100) | 100 (100-100) | 100 (100-100) | 100 (100-100) | 0.15 | 0.14 | 0.60 |
| Dependency | 100 (100-100) | 100 (100-100) | 100 (100-100) | 100 (100-100) | 0.44 | 0.42 | 0.67 |
NDR, no diabetic retinopathy; DR: diabetic retinopathy, NPDR, non-proliferant diabetic retinopathy; PDR, proliferant diabetic retinopathy.
Table 4.
Dietary variables by diabetic retinopathy status.
| Variable | NDR (N=85) | DR (N=44) | NPDR (N=36) | PDR (N=8) | p (NDR vs DR) | p (NDR vs NPDR vs PDR) | p (NPDR vs PDR) |
|---|---|---|---|---|---|---|---|
| Cereals (g) | 168.3 (113.5-206.6) | 180.8 (136.7-218.5) | 186.7 (141.9-223.5) | 168.9 (126.8-182.1) | 0.19 | 0.21 | 0.26 |
| Vegetables (g) | 345.7 (226.7-478.2) | 331.0 (258.3-416.1) | 331.0 (251.5-424.0) | 329.0 (263.7-361.9) | 0.60 | 0.76 | 0.62 |
| Fruits (g) | 310.0 (193.3-377.3) | 231.2 (191.2-321.2) | 240.5 (193.6-357.6) | 212.3 (187.5-231.9) | 0.15 | 0.15 | 0.23 |
| Meat (g) | 61.3 (48.0-80.0) | 59.5 (48.5-75.0) | 57.2 (48.5-75.0) | 60.7 (56.2-75.5) | 0.94 | 0.96 | 0.71 |
| Dairy products (g) | 278.7 (103.8-331.7) | 269.2 (98.0-329.0) | 208.5 (88.4-329.0) | 315.8 (247.1-333.9) | 0.96 | 0.69 | 0.50 |
| Fish (g) | 53.9 (26.9-86.9) | 51.4 (34.7-74.2) | 51.4 (39.7-66.4) | 41.9 (25.2-86.1) | 0.60 | 0.84 | 0.73 |
| Legumes (g) | 40.3 (16.7-50.6) | 34.0 (21.8-53.1) | 32.2 (23.5-53.6) | 36.7 (27.6-47.7) | 0.03 | 0.08 | 0.33 |
| Ethanol (g) | 0 (0-0.1) | 0.1 (0-0.1) | 0.1 (0-0.1) | 0.1 (0-0.1) | 0.20 | 0.30 | 0.13 |
| Unsaturated/Saturated fat ratio | 2.42 (1.98-2.74) | 2.30 (1.96-2.93) | 2.26 (1.89-2.80) | 2.71 (2.31-2.93) | 0.54 | 0.19 | 0.14 |
| Daily caloric intake (kcal) | 1756.3 (1539.3-1980.0) | 1732.2 (1523.4-2086.4) | 1756.2 (1586.7-2086.4) | 1601.8 (1477.9-1944.7) | 0.60 | 0.60 | 0.43 |
| Carbohydrates (g) | 152.0 (23.1-879.9) | 141.3 (32.1-1147.6) | 128.9 (27.3-1156.5) | 162.3 (60.0-587.4) | 0.81 | 0.65 | 0.46 |
| Fiber (g) | 25.6 (20.1-32.7) | 25.5 (21.4-35.6) | 26.3 (20.5-32.2) | 25.1 (22.1-28.5) | 0.53 | 0.79 | 0.18 |
| Proteins (g) | 82.4 (34.0-824.0) | 82.8 (25.8-871.0) | 45.7 (27.1-876.2) | 91.3 (40.0-162.5) | 0.54 | 0.59 | 0.80 |
| Total fats (g) | 61.4 (22.0-493.5) | 46.9 (21.5-481.4) | 31.3 (18.5-492.9) | 64.2 (24.6-263.4) | 0.65 | 0.71 | 0.03 |
| Saturated fats (g) | 21.0 (16.5-25.3) | 22.8 (17.2-26.1) | 22.7 (17.9-26.0) | 23.2 (15.4-27.9) | 0.25 | 0.51 | 0.96 |
| Monounsaturated Fatty Acids (g) | 36.1 (32.1-44.3) | 37.7 (27.2-56.9) | 37.4 (24.6-56.1) | 56.3 (35.5-60.6) | 0.46 | 0.25 | 0.20 |
| Polyunsaturated fats (g) | 11.3 (9.4-14.1) | 12.0 (9.9-14.9) | 12.0 (9.6-13.8) | 13.4 (10.4-19.4) | 0.30 | 0.25 | 0.19 |
| Iron (mg) | 10.8 (9.2-12.6) | 10.8 (9.7-13.2) | 11.2 (9.8-13.2) | 9.8 (8.4-10.9) | 0.56 | 0.21 | 0.11 |
| Calcium (mg) | 914.9 (722.0-1100.4) | 941.3 (725.9-1244.5) | 966.0 (736.6-1244.5) | 867.8 (630.6-1125.7) | 0.32 | 0.43 | 0.50 |
| Magnesium (mg) | 297.8 (245.5-339.5) | 299.2 (256.0-329.0) | 303.2 (267.2-342.6) | 293.8 (244.5-310.8) | 0.68 | 0.42 | 0.22 |
| Zinc (mg) | 8.6 (6.6-9.6) | 8.6 (7.2-10.5) | 8.7 (8.0-10.5) | 7.5 (6.0-9.1) | 0.41 | 0.25 | 0.15 |
| Vitamin A (mcg) | 891.9 (579.8-1148.3) | 869.9 (687.4-1096.0) | 889.4 (708.3-1113.1) | 728.4 (505.2-834.9) | 0.93 | 0.14 | 0.04 |
| Vitamin B1 (mg) | 1.23 (1.07-1.46) | 1.29 (1.13-1.47) | 1.28 (1.14-1.47) | 1.29 (0.96-1.43) | 0.37 | 0.50 | 0.50 |
| Vitamin B6 (mg) | 1.68 (1.31-1.91) | 1.62 (1.36-1.85) | 1.63 (1.42-1.88) | 1.40 (1.27-1.63) | 0.68 | 0.28 | 0.08 |
| Vitamin C (mg) | 118.5 (82.3-156.8) | 118.7 (87.8-142.6) | 123.1 (100.7-145.9) | 92.3 (79.3-120.7) | 0.88 | 0.63 | 0.27 |
| Vitamin D (mcg) | 5.1 (2.9-8.6) | 5.0 (4.1-7.6) | 5.1 (4.2-7.6) | 4.5 (1.6-5.9) | 0.70 | 0.60 | 0.30 |
| Vitamin E (mg) | 28.5 (25.0-40.1) | 27.3 (21.4-34.2) | 37.2 (30.2-46.6) | 26.8 (20.0-33.4) | 0.45 | 0.51 | 0.04 |
| β-carotene (µg) | 7303.4 (5430.2-9893.6) | 6094.9 (4560.4-8039.8) | 6199.1 (3560.6-7305.6) | 5484.7 (4019.5-7824.5) | 0.54 | 0.45 | 0.19 |
| MDS | 4 (3-5) | 4 (3-5) | 4 (3-5) | 4 (3-5) | 0.66 | 0.52 | 0.63 |
NDR, no diabetic retinopathy; DR: diabetic retinopathy, NPDR, non-proliferant diabetic retinopathy; PDR, proliferant diabetic retinopathy.
Table 5.
Logistic regression models for the association of low legume consumption and the odds of DR.
Table 5.
Logistic regression models for the association of low legume consumption and the odds of DR.
| Model | Comparison | OR (95%CI) | p-value |
|---|---|---|---|
| Model 1 | Legumes (low vs. high consumption) | 2.2 (1.0-4.8) | 0.042 |
| Model 2 | Legumes (low vs. high consumption) | 2.2 (1.0-4.8) | 0.043 |
| Model 3 | Legumes (low vs. high consumption) | 2.5 (1.1-5.8) | 0.037 |
Model 1: age and gender. Model 2: age, gender, years with diabetes. Model 3: age, gender, years with diabetes, BMI, waist circumference, total cholesterol, systolic and diastolic blood pressures.
Disclaimer/Publisher’s Note: The statements, opinions and data contained in all publications are solely those of the individual author(s) and contributor(s) and not of MDPI and/or the editor(s). MDPI and/or the editor(s) disclaim responsibility for any injury to people or property resulting from any ideas, methods, instructions or products referred to in the content. |
© 2026 by the authors. Licensee MDPI, Basel, Switzerland. This article is an open access article distributed under the terms and conditions of the Creative Commons Attribution (CC BY) license (http://creativecommons.org/licenses/by/4.0/).
Copyright: This open access article is published under a Creative Commons CC BY 4.0 license, which permit the free download, distribution, and reuse, provided that the author and preprint are cited in any reuse.


