

Submitted:
25 May 2026
Posted:
26 May 2026
You are already at the latest version
Abstract
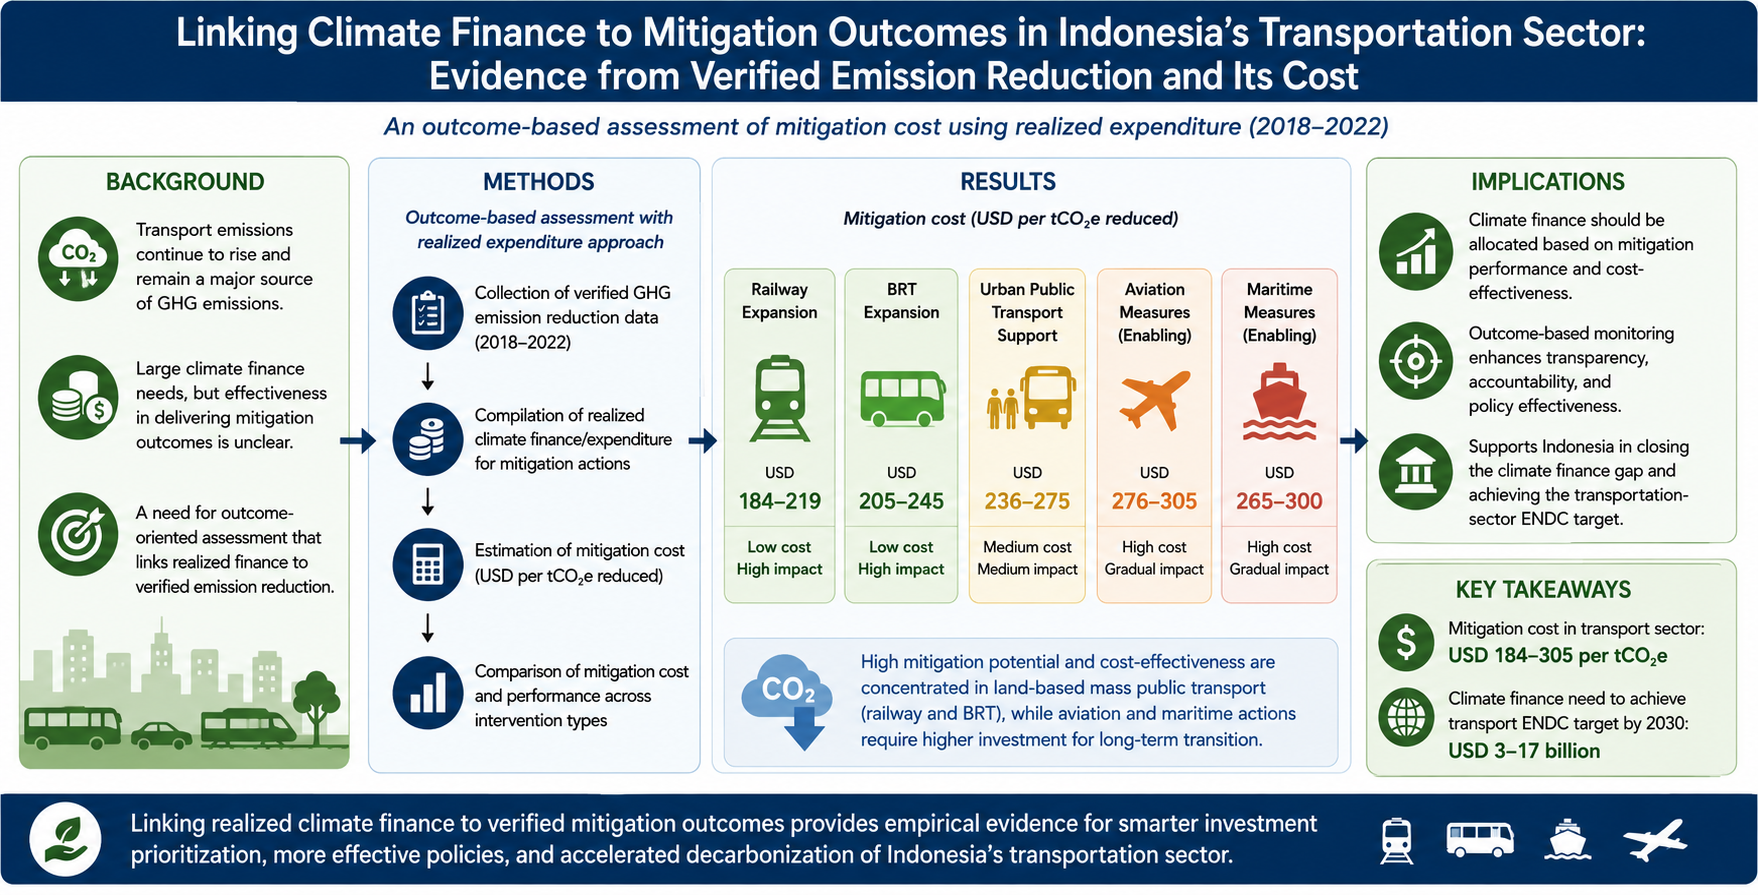
Decarbonizing the transportation sector depends not only on the scale of mitigation programs, but also on whether financing systems are capable of generating measurable emission reductions. In Indonesia, climate finance allocation remains substantially below the level required to achieve the transportation-sector target under the Enhanced Nationally Determined Contribution (ENDC). At the same time, mitigation planning rarely establishes a clear relationship between financial expenditure and verified greenhouse gas (GHG) reduction outcomes, making policy effectiveness difficult to assess. This study examines the relationship between climate finance and mitigation outcomes in Indonesia’s transportation sector using verified emission reduction data and realized mitigation expenditures during 2018–2022. A cost-based assessment approach was applied to estimate the financing required to reduce one ton of CO2e across direct and indirect mitigation actions. The analysis identified 33 mitigation actions categorized under the Avoid–Shift–Improve (ASI) framework and evaluated their contribution to sectoral emission reduction. The results indicate substantial variation in mitigation costs among intervention types. Direct mitigation actions, particularly mass public transportation expansion, generated larger emission reductions at relatively lower costs than enabling or indirect measures. On average, reducing 1 tCO2e in Indonesia’s transportation sector requires approximately USD 184–305 (IDR 3–5 million). Based on the transportation-sector ENDC target, the estimated financing requirement by 2030 ranges from USD 3–17 billion (IDR 42–69 trillion). The findings suggest that climate finance policies should move beyond expenditure-oriented approaches toward financing frameworks that explicitly connect investment allocation with verified mitigation performance.
Keywords:
Avoid–Shift–Improve framework
; climate finance
; climate policy
; GHG emission reduction
; Indonesia
; mitigation cost
; sustainable transport
; transportation decarbonization
1. Introduction
Climate change mitigation is often framed through emission targets and policy commitments, yet implementation ultimately depends on whether countries are able to mobilize adequate financial and institutional support. Regulatory instruments alone rarely produce sustained mitigation outcomes, particularly in sectors characterized by large infrastructure requirements, technological lock-in, and long investment cycles. Transportation illustrates this challenge clearly. Decarbonizing mobility systems requires continuous investment in public transport infrastructure, low-emission technologies, alternative fuels, energy systems, and urban transformation, while also demanding coordination across multiple levels of government and private actors [1,2].
Over the last decade, climate finance has expanded rapidly in both scale and institutional diversity. Green bonds, blended finance facilities, carbon pricing instruments, transition finance schemes, and international climate funds are increasingly incorporated into national mitigation strategies [3]. Despite this expansion, relatively little attention has been given to whether climate expenditures actually correspond to measurable mitigation outcomes. Much of the existing literature concentrates on projected financing needs, investment opportunities, institutional arrangements, or the design of financial instruments. Empirical studies linking realized expenditures with verified greenhouse gas (GHG) emission reductions remain comparatively limited, particularly in sector-specific contexts within developing economies.
This gap creates a practical policy problem. Mitigation targets are frequently presented without a sufficiently transparent explanation of the financial resources required to achieve them. In many cases, climate planning documents provide broad investment estimates but do not establish a measurable relationship between expenditure allocation and mitigation performance. As a result, evaluating the effectiveness of climate finance becomes difficult. Questions regarding which mitigation actions produce the largest emission reductions relative to their costs, which expenditures function primarily as enabling conditions, and how financing priorities should be determined remain insufficiently addressed in current climate policy discussions.
The issue is especially relevant in Indonesia. The country has strengthened its climate commitments through the Enhanced Nationally Determined Contribution (ENDC), while simultaneously facing substantial financing constraints. Available climate-related allocations from the national budget are estimated at approximately IDR 523 trillion [4], whereas the financing requirement for achieving the national mitigation target by 2030 is projected to reach around IDR 4,002 trillion [5,6]. The scale of this gap suggests that public finance alone will not be sufficient. Mobilizing private investment, development finance, local government participation, and non-state actors will be necessary. Yet financing mobilization without a clearer understanding of mitigation effectiveness risks producing fragmented expenditures with limited long-term impact.
The transportation sector provides a particularly relevant case for examining this relationship between finance and mitigation performance. Globally, transport emissions continue to increase alongside urbanization, economic expansion, and rising motorization rates. The sector accounts for a substantial share of global CO₂ emissions and remains strongly dependent on fossil fuel consumption [7,8,9,10]. In Indonesia, transportation has become one of the largest emitting sectors and now occupies a central position in national decarbonization planning. Many mitigation measures within the sector involve costly infrastructure development and relatively long implementation periods, making financing efficiency an increasingly important consideration.
Another complexity lies in the character of transportation mitigation itself. Certain interventions generate immediate emission reductions, such as public transport expansion, vehicle efficiency improvement, or fuel switching. Others function indirectly by creating enabling conditions that support future mitigation pathways. Distinguishing between these two categories is analytically important because enabling measures remain necessary components of long-term decarbonization, even when their short-term mitigation impact is limited. Without this distinction, climate expenditures may be evaluated solely on immediate emission outcomes, potentially overlooking investments required for structural transition.
This study examines the relationship between climate finance and mitigation outcomes in Indonesia’s transportation sector by combining verified emission reduction data with realized mitigation expenditures during 2018–2022. The analysis estimates the financing required to reduce one ton of CO₂e across different categories of mitigation actions under the Avoid–Shift–Improve (ASI) framework. Rather than relying solely on projected investment assumptions, the study uses actual expenditure and verified mitigation data to develop a cost-based assessment of climate finance effectiveness. By linking financial allocation with mitigation performance, the paper seeks to contribute an empirical basis for improving financing prioritization and strengthening outcome-oriented climate finance policy in the transportation sector.
2. Materials and Methods
2.1. Data Sources and Compilation
Data on mitigation actions in Indonesia's transportation sector were systematically compiled from a range of national and international sources, covering the period 2018–2022 [5,6,11,12] where specified (Table 1). The dataset includes both quantitative and qualitative information. Quantitative data consists primarily of verified greenhouse gas (GHG) emission reductions, sectoral activity data, and climate-related financial expenditures, while qualitative materials include policy documents, regulatory frameworks, national planning documents, and international climate references used to contextualize the analysis.
The compilation process integrated information from multiple institutions to reduce dependence on a single reporting source and to improve cross-validation among datasets. Emission reduction data were primarily obtained from Indonesia’s national Monitoring, Reporting, and Verification (MRV) system, Biennial Update Reports (BUR), Biennial Transparency Reports (BTR), transportation-sector inventories, and mitigation action reports issued by sectoral ministries. Financial information included public expenditure allocations, climate budget tagging records, grants, loans, green sukuk instruments, carbon-related financing mechanisms, and sectoral mitigation investments associated with transportation activities [8,17].
2.2. Data Processing and Analysis Procedures
The data analysis followed a structured three-step procedure to systematically evaluating 33 mitigation actions in Indonesia's transportation sector. These actions were categorized under the Avoid–Shift–Improve (ASI) framework, which has been widely applied in sustainable transportation planning to classify mitigation pathways according to their operational characteristics and emission reduction mechanisms. The “Avoid” category refers to interventions intended to reduce unnecessary travel demand or travel distance. “Shift” measures encourage modal transition from higher-emission transport systems toward lower-carbon alternatives, including public transportation and rail systems. “Improve” actions focus on enhancing vehicle efficiency, fuel quality, operational performance, and energy technology in order to reduce emissions per unit of transport activity, as detailed in Table 2.
In addition to the ASI classification, mitigation actions were distinguished according to their relationship with GHG emission reduction outcomes. Direct mitigation actions were defined as measures generating measurable and immediate emission reductions within the reporting period. Indirect mitigation actions were categorized as enabling measures that support future mitigation pathways through institutional preparation, infrastructure readiness, operational improvement, or technological facilitation. This distinction was incorporated because several enabling interventions are necessary preconditions for long-term decarbonization despite producing relatively limited short-term mitigation outcomes. Evaluating all interventions solely through immediate emission reduction performance may therefore underestimate the strategic role of enabling investments.
2.2.1. Data Collection and Verification
The study employed a multi-stage data collection process consisting of desk review, institutional consultation, and technical verification. Initially, mitigation actions and financial records were identified through systematic review of official policy documents, ministerial reports, sectoral planning documents, and national climate reporting systems. Relevant numerical and narrative information was subsequently compiled into analytical worksheets.
Primary verification was then conducted through focus group discussions (FGDs), semi-structured interviews, and institutional consultations involving government agencies, academics, private-sector representatives, and civil society organizations. Participating institutions included the Ministry of Finance, Ministry of Transportation, Ministry of Energy and Mineral Resources, Ministry of Environment and Forestry, Ministry of Industry, and BPDLH, among others. These discussions were used to clarify inconsistencies among datasets, validate expenditure classification, and verify the implementation status of mitigation actions.
Particular attention was directed toward identifying expenditures that genuinely contributed to measurable mitigation outcomes. Several transportation-related investments contained overlapping development objectives, including economic connectivity, infrastructure modernization, and public service improvement. Consequently, distinguishing climate-related expenditure components required iterative verification with technical personnel from relevant institutions.
2.2.2. Content Validity and Analytical Reliability
To improve analytical consistency, the study adopted a content validity approach based on the framework developed by Merino-Soto [14], with modifications suited to climate finance and transportation policy analysis. Content validity is commonly applied to evaluate whether indicators and classifications adequately represent the conceptual dimensions under investigation [15,16]. The validation process consisted of three stages. First, preliminary indicators and mitigation classifications were developed from literature review and policy analysis. Second, expert judgment was conducted through consultations with transport specialists, climate finance experts, policymakers, and academic researchers. The panel evaluated the relevance, completeness, and consistency of mitigation categories, financing variables, and emission reduction indicators. Third, revisions were undertaken to refine classifications and reduce potential interpretation bias.
One of the more challenging aspects involved differentiating enabling actions that genuinely support future mitigation outcomes from expenditures with only marginal relevance to long-term decarbonization pathways. The distinction was not always straightforward because certain infrastructure and institutional investments may generate mitigation benefits only after extended implementation periods.
2.2.3. Analytical Procedures
Data processing and analysis were conducted using Microsoft Excel-based analytical worksheets. Verified emission reduction values were combined with realized mitigation expenditures to estimate the cost required to reduce one ton of CO₂e in Indonesia’s transportation sector. The analytical framework integrated climate budget tagging records, non-tagged climate expenditures associated with transportation mitigation, and verified mitigation outcomes reported through the national MRV system. Cost estimation was performed separately for direct and indirect mitigation actions to avoid overstating the immediate mitigation effectiveness of enabling expenditures.
The resulting estimates were used to assess the relative cost characteristics of different mitigation interventions and to project financing requirements for achieving Indonesia’s transportation-sector ENDC target by 2030. While the analysis provides an empirical basis for linking finance allocation with mitigation outcomes, several limitations remain. Some expenditure data were aggregated across multiple infrastructure objectives, making attribution to climate mitigation partially dependent on institutional interpretation. In addition, indirect mitigation measures may generate emission reductions beyond the observation period considered in this study.
3. Results and Discussion
This study applies a new approach to assess climate finance which differs from most mitigation-cost analyses. Rather than estimating future investment needs through scenario modelling alone, the analysis links realized expenditures with verified greenhouse gas (GHG) emission reduction outcomes generated by mitigation actions implemented during 2018–2022. By combining actual financial allocation and observed mitigation performance, the study attempts to capture how climate finance operates in practice within Indonesia’s transportation sector. The approach also allows a more grounded estimation of mitigation costs per tCO2e, including the distinction between expenditures that produce immediate mitigation outcomes and those functioning primarily as enabling conditions for future decarbonization.
3.1. Emission Reduction in Indonesia’s Transportation Sector
There are 33 GHG mitigation actions (MAs) obtained through the mapping of mitigation actions. These are extracted based on the committed MAs on the official documents, e.q. ENDC, LTS-LCCR, NZE, Ministerial Decree of Transportation No. 8/2022, and the actual MAs beyond the documents that have been implemented and verified. The total emission reduction (ER) during the period of 2018-2022 is 20.4 million tCO2e, with the key MAs contributor in reducing the emissions are: 1) mass rail transportation expansion, 2) mass bus rapid transit (BRT) expansion, and 3) rejuvenating air transportation (Figure 1).
Mass transportation represents the largest contributor to reduce the GHG emissions in the transportation sector. During 2018–2022, rail- and bus-based transport systems accounted for nearly three-quarters of the total emission reductions achieved in the sector. Among all transport modes, railway development contributed the largest share, representing more than 55% of total emission reductions over the study period (Figure 1a).
The mitigation impact is closely associated with the expansion and modernization of urban and intercity rail systems. Several major projects, including the double-track railway network in North Java, single-track railway development in South Java and Sumatra, freight rail improvements, airport rail connections, the Jabodetabek commuter line (KRL), the Yogyakarta–Solo commuter line, MRT, and LRT systems, have accelerated modal shift from private vehicles toward mass public transportation. These measures reflect the “Avoid” and “Shift” components of the ASI framework by reducing travel intensity, limiting dependence on private motorized transport, and encouraging the use of lower-emission transport modes. Over the 2018–2022 period, railway-related mitigation actions generated approximately 2–3 million tCO2e of emission reduction annually, reaching nearly 12 million tCO2e in cumulative reductions, the highest among all transportation modes analysed (Figure 1b).
Road-based public transportation also contributed substantially, particularly through the expansion of Bus Rapid Transit (BRT) systems. The gradual shift of passengers from motorcycles and private cars to public bus services produced an estimated 7 million tCO2e of emission reduction during the same period. Although smaller than the railway contribution, the result indicates that large-scale public transport interventions in urban areas can deliver measurable mitigation outcomes within a relatively short time frame.
By contrast, mitigation actions in the aviation and maritime subsectors produced comparatively lower direct emission reductions (Figure 1b), despite aircraft fleet renewal being among the largest individual mitigation actions identified in the analysis (Figure 1a). It is because the mitigation actions undertaken are mostly on enabling condition activities that have indirect impact on emission reduction (Figure 1c). This pattern reflects the nature of mitigation measures implemented in these subsectors, many of which function primarily as enabling conditions rather than immediate emission reduction interventions. Activities such as operational efficiency improvements, navigation systems, energy management measures, and supporting infrastructure tend to generate mitigation impacts gradually over longer implementation periods.
This pattern reflects the structural characteristics of both subsectors. Operational efficiency measures, navigation systems, alternative fuel preparation, and supporting infrastructure generally require long implementation horizons before measurable emission reductions become fully observable. In other words, many actions in aviation and maritime transport function less as immediate emission reduction instruments and more as preparatory interventions supporting long-term technological transition and sectoral decarbonization. The relatively low short-term mitigation performance therefore should not automatically be interpreted as policy failure, but rather as an indication of different temporal dynamics between infrastructure readiness and realized mitigation outcomes.
3.2. Financing for Transportation Mitigation Actions
Total funding allocated to transportation-sector mitigation actions during 2018–2022 reached approximately IDR 62.4 trillion. Most of the financing originated from the State Budget (APBN), particularly through pure rupiah allocations (RM), indicating the continuing dominance of public expenditure in supporting transportation decarbonization efforts (Figure 2a). Climate Budget Tagging (CBT) consequently becomes an important reference for tracing climate-related expenditure in the sector.
The analysis nevertheless shows that climate-tagged expenditure does not always correspond directly with measurable transportation-sector mitigation outcomes. Some tagged expenditures support broader institutional or enabling activities whose mitigation impacts are indirect or long-term. At the same time, several mitigation-related expenditures capable of producing verified emission reductions are not formally categorized within the climate budget tagging system (Figure 2b).
To address this issue, this study classifies mitigation expenditures into four categories based on their relationship with emission reduction outcomes and climate budget tagging status (Table 3). Category 1 consists of climate-tagged expenditures with direct impacts on transportation-sector emission reduction. Category 2 includes climate-tagged expenditures that provide enabling conditions for future emission reductions. Category 3 refers to expenditures supporting emission reductions in other sectors, while Category 4 captures non-tagged expenditures that nevertheless contribute directly to transportation-sector mitigation. Categories 1, 2, and 4 were calculated in this study, while category 3 is recommended to be calculated for other sectors in future research.
The findings reveal that a substantial proportion of climate-tagged expenditures (more than 90%) were allocated to enabling activities and supporting infrastructure that did not immediately generate measurable emission reductions in the transportation sector (Figure 3). Nevertheless, these indirect actions remain important because they establish institutional, technological, regulatory, and infrastructural conditions necessary for future direct mitigation outcomes. Therefore, the distinction between direct and indirect actions should not be interpreted as a distinction between effective and ineffective expenditures, but rather as a differentiation between immediate and enabling mitigation impacts.
The presence of non-tagged expenditures contributing directly to emission reduction also suggests that existing climate budgeting frameworks may still underestimate the actual scale of mitigation-related investment occurring within the transportation sector. This creates a challenge for evaluating financing effectiveness because mitigation outcomes and budget classifications are not always institutionally aligned.
3.3. Mitigation Cost per tCO2e
The quadrant analysis presented in Figure 4 illustrates substantial variation in mitigation performance across transportation modes and intervention categories. The distribution of actions indicates that mitigation cost and emission reduction outcomes are strongly influenced by the type of infrastructure involved, implementation scale, operational maturity, and whether actions produce direct or enabling impacts.
Land-based transportation, particularly railway and Bus Rapid Transit (BRT) systems, occupies the most favourable position in the matrix. These actions are concentrated in the high-emission-reduction and relatively lower-cost quadrants, indicating that investments in mass public transportation generate comparatively large mitigation benefits per unit of expenditure. The pattern is consistent with the emission reduction profile presented earlier, where railway expansion alone contributed more than half of total verified emission reductions during 2018–2022.
Direct mitigation actions in the railway subsector appear to be the most cost-efficient among all intervention groups. Large-scale modal shift from private vehicles to rail-based transport has produced measurable reductions within a relatively short implementation period. The concentration of railway-related actions in the “high reduction–lower cost” quadrant also reflects the cumulative effect of integrated transport infrastructure development, including commuter rail systems, MRT, LRT, airport rail links, and freight transport improvements. In practice, these investments not only reduce emissions per passenger-kilometre, but also influence travel behaviour and urban mobility patterns over time.
Road-based public transportation shows a slightly different pattern. Although BRT expansion contributes significant emission reductions, the mitigation performance remains more uneven compared to rail systems. This is partly associated with operational variability across cities, differences in ridership levels, and the continued dominance of private motorcycles in urban transport systems. Even so, public bus systems remain among the more effective mitigation measures identified in the study, particularly in densely populated metropolitan areas where modal shift potential is relatively high.
The aviation and maritime subsectors are positioned differently within the quadrant analysis. A larger proportion of actions in these subsectors fall into the higher-cost and lower-direct-reduction categories. This does not necessarily indicate weak mitigation relevance. Many interventions in aviation and maritime transport are still at the enabling stage, involving operational efficiency improvements, supporting infrastructure, navigation systems, alternative fuel preparation, and regulatory measures. Their mitigation contribution tends to emerge gradually and may not yet be fully reflected in short-term verified emission reduction figures. The distinction between direct and enabling actions therefore becomes important when interpreting mitigation cost performance.
In estimating the cost of reducing one ton of CO2e, this study distinguishes between mitigation actions with direct emission reduction impacts and those that primarily function as enabling or supporting measures (Table 4). Direct mitigation actions generate measurable emission reductions within the implementation period, while indirect actions contribute through institutional support, operational improvements, infrastructure readiness, regulatory measures, or technological preparation that facilitate longer-term mitigation outcomes. This distinction is necessary because the relationship between expenditure and measurable emission reduction differs substantially across the two groups of actions.
The direct mitigation actions generated approximately 19.9 million tCO2e of verified emission reductions during 2018–2022, with an estimated mitigation cost of IDR 3.0 million (USD 184) per tCO2e. Indirect mitigation actions, by contrast, produced substantially smaller measurable reductions and higher estimated costs, reaching around IDR 5.0 million (USD 305) per tCO2e. The difference should not be interpreted solely as an indication of inefficiency. Indirect actions which include enabling regulations, supporting infrastructure, robust monitoring, reporting and verification (MRV) systems, and operational efficiency improvements—are critical preconditions for the successful implementation and long-term sustainability of direct mitigation efforts [18,19,20,21,22,23]. Indirect actions frequently support institutional readiness, infrastructure preparation, technological transition, and long-term system transformation that may not produce immediate emission reductions within the observation period.
Indonesia’s ENDC sets a transportation-sector emission reduction target of 13.78 million tCO2e by 2030. Based on the estimated mitigation cost range identified in this study, achieving the target would require approximately IDR 42–69 trillion, equivalent to around USD 3–17 billion in climate finance mobilization.
From a policy perspective, the findings indicate that financing prioritization cannot rely solely on short-term mitigation cost efficiency. Direct mitigation actions, particularly rail and mass public transportation systems, clearly offer strong near-term mitigation returns. Yet some enabling interventions in aviation and maritime transport remain necessary to support longer-term decarbonization pathways. The challenge for climate finance policy therefore lies not in eliminating indirect expenditure, but in distinguishing enabling investments that genuinely strengthen future mitigation capacity from expenditures with limited contribution to long-term emission reduction outcomes.
3.4. Policy Implications
The findings highlight several implications for climate finance transformation in Indonesia’s transportation sector.
First, the financing gap between available climate expenditure and mitigation needs remains substantial. Meeting long-term transportation decarbonization targets will require financing arrangements that extend beyond conventional public budgeting mechanisms. Public finance remains essential, particularly for large-scale infrastructure and early-stage mitigation initiatives, but greater integration with private investment, blended finance, international climate funds, and transition-oriented financial instruments will likely become increasingly necessary.
Second, the distinction between direct and indirect mitigation actions provides a more nuanced basis for evaluating financing effectiveness. Direct interventions generally produce faster and more measurable emission reductions. However, indirect actions should not automatically be categorized as inefficient expenditure. Several enabling measures—including MRV systems, regulatory preparation, supporting infrastructure, operational efficiency mechanisms, and technological readiness programs—constitute necessary preconditions for future direct mitigation impacts. The policy challenge therefore lies in identifying which enabling interventions genuinely strengthen long-term mitigation capacity and which produce only limited strategic value.
Third, the mitigation quadrant analysis offers a practical framework for financing prioritization under constrained fiscal conditions. Actions positioned within the low-cost and high-reduction quadrant, particularly railways and BRT systems, demonstrate comparatively strong mitigation performance and may therefore warrant greater prioritization within national climate investment strategies. By contrast, aviation and maritime interventions often require larger capital investment, longer implementation periods, and higher technological uncertainty. Financing strategies for these subsectors may consequently depend more heavily on blended finance arrangements, international climate support, and innovation-oriented investment mechanisms.
The findings also raise broader questions regarding climate budgeting practices. Existing climate budget tagging systems tend to focus primarily on expenditure classification rather than measurable mitigation performance. As a result, substantial climate expenditure may not correspond directly with verified mitigation outcomes, while several effective mitigation activities remain outside formal climate-budget classifications. Integrating performance-based indicators into climate finance tracking systems could therefore improve transparency and strengthen the linkage between expenditure allocation and mitigation effectiveness.
4. Conclusion
One of the central difficulties in climate finance transformation lies in understanding how financial allocation translates into measurable greenhouse gas mitigation outcomes. Despite the increasing scale of climate-related investment globally, empirical assessments connecting realized expenditure with verified emission reduction remain limited, particularly at the sectoral level and in developing-country contexts.
Using Indonesia’s transportation sector as a case study, this research proposes an outcome-based approach that combines actual mitigation expenditure with verified emission reduction performance to estimate mitigation costs per tCO2e. The analysis indicates that reducing 1 tCO2e in the transportation sector requires approximately USD 184–305, equivalent to around IDR 3–5 million, depending on the characteristics of the intervention and its implementation pathway.
Rail-based transport and Bus Rapid Transit systems demonstrate the strongest short-term mitigation performance relative to expenditure, largely due to their ability to generate substantial modal shift from private vehicles toward lower-emission transport systems. Aviation and maritime interventions, meanwhile, remain more dependent on enabling conditions, technological transition, and longer implementation horizons.
Based on the estimated mitigation cost range, achieving Indonesia’s transportation-sector ENDC target by 2030 would require approximately USD 3–17 billion (IDR 42–69 trillion) in climate finance mobilization. The findings suggest that climate finance policy should move beyond expenditure allocation alone and place greater emphasis on mitigation outcomes, financing effectiveness, and the strategic sequencing of interventions capable of supporting sustained decarbonization over time.
The study nevertheless has several limitations. The analysis relies on verified mitigation outcomes available during 2018–2022, meaning that some enabling interventions with longer-term impacts may not yet be fully reflected in the emission reduction estimates. In addition, the assessment focuses primarily on mitigation performance and does not evaluate co-benefits such as air quality improvement, congestion reduction, economic productivity, or social equity. Future research could expand the framework by incorporating longer observation periods, lifecycle mitigation effects, and broader sustainability indicators across multiple sectors.:
Supplementary Materials
The following supporting information can be downloaded at the website of this paper posted on Preprints.org.
Author Contributions
Conceptualization, A.Y.M. and R.B.; Methodology, A.Y.M., R.B.; Validation, A.Y.M., L.S.; Formal Analysis, A.Y.M.; Investigation, A.Y.M., L.S.; Data Curation, A.Y.M.; Visualization, A.Y.M.; Writing – Original Draft Preparation, A.Y.M.; Writing – Review & Editing, A.Y.M., R.B., M.F., and L.S.; Supervision, R.B.; Project Administration, A.Y.M.; Funding Acquisition, A.Y.M. and R.B. All authors contributed substantially to the interpretation of results and approved the final version of the manuscript.
Funding
This research received no external funding. The APC was funded by the authors.
Institutional Review Board Statement
Ethical review and approval were waived for this study because the research was based on secondary data analysis, policy document review, and non-invasive expert consultations that did not involve sensitive personal data or clinical human experimentation.
Informed Consent Statement
Informed consent was obtained from all participants involved in the focus group discussions and semi-structured interviews conducted as part of the data collection and validation process. Participation was voluntary, and all respondents were informed that the information provided would be used solely for academic research purposes. No personally identifiable information is disclosed in this study.
Data Availability Statement
The data used in this study were compiled from publicly available national and international sources, including reports, statistical databases, policy documents, and monitoring and verification records published by the Ministry of Environment and Forestry of Indonesia, Ministry of Transportation, Ministry of Finance, Statistics Indonesia (BPS), BPDLH, IPCC, and UNFCCC. Processed datasets and analytical worksheets generated during the current study are available from the corresponding author upon reasonable request. Some institutional datasets used in the analysis are subject to administrative access restrictions and therefore are not publicly archived.
Acknowledgments
The authors gratefully acknowledge the support and cooperation of the Ministry of Environment, the Ministry of Transportation, the Ministry of Finance, BPDLH, and other relevant institutions involved in the provision and verification of transportation-sector mitigation and climate finance data used in this study. The authors also appreciate the valuable input provided by experts, policymakers, academics, and civil society representatives during the focus group discussions and technical consultations conducted throughout the research process. During the preparation of this manuscript, the authors used OpenAI ChatGPT for limited language refinement, grammar checking, and editorial assistance. All analytical interpretation, data processing, scientific arguments, and final manuscript revisions were conducted and verified entirely by the authors, who take full responsibility for the content of this publication.
Conflicts of Interest
The authors declare no conflict of interest. The research was conducted independently without commercial or financial relationships that could be construed as a potential conflict of interest. The sponsors had no role in the design of the study; in the collection, analyses, or interpretation of data; in the writing of the manuscript; or in the decision to publish the results.
References
- Intergovernmental Panel on Climate Change (IPCC). 2006 IPCC Guidelines for National Greenhouse Gas Inventories; Institute for Global Environmental Strategies: Hayama, Japan, 2006. [Google Scholar]
- Koakutsu, K.; Tamura, K.; Kuriyama, A.; Ishinabe, N.; Nandakumar, J.; Miyatsuka, A.; Guo, J.; Ninomiya, Y.; Okubo, N. Green economy and domestic carbon governance in Asia. In Greening Governance in Asia-Pacific; Institute for Global Environmental Strategies: Kanagawa, Japan, 2012; pp. 55–84. Available online: http://www.jstor.org/stable/resrep00782.11 (accessed on 12 May 2024).
- United Nations Framework Convention on Climate Change (UNFCCC). Introduction to Climate Finance . Available online: https://unfccc.int/topics/introduction-to-climate-finance (accessed on 12 May 2024).
- Badan Pengelola Dana Lingkungan Hidup (BPDLH). Climate Finance and Environmental Fund Report; BPDLH: Jakarta, Indonesia, 2022. [Google Scholar]
- Government of Indonesia (GoI). Third Biennial Update Report under the United Nations Framework Convention on Climate Change; Ministry of Environment and Forestry: Jakarta, Indonesia, 2021. [Google Scholar]
- Ministry of Environment and Forestry of the Republic of Indonesia. Enhanced Nationally Determined Contribution of Indonesia; Ministry of Environment and Forestry: Jakarta, Indonesia, 2022. [Google Scholar]
- Organisation for Economic Co-operation and Development (OECD). ITF Transport Outlook 2021; International Transport Forum: Paris, France, 2022; Available online: https://www.itf-oecd.org/itf-transport-outlook-2021 (accessed on 12 May 2024).
- Shankar, A. Introduction. In Decarbonising Transport: What Does It Mean for India? Centre for Science and Environment: New Delhi, India, 2023; pp. 9–48. Available online: http://www.jstor.org/stable/resrep48507.3 (accessed on 12 May 2024).
- International Energy Agency (IEA). Tracking Transport 2023 . IEA: Paris, France, 2023. Available online: https://www.iea.org/reports/tracking-transport-2023 (accessed on 12 May 2024).
- Intergovernmental Panel on Climate Change (IPCC). Climate Change 2022: Mitigation of Climate Change; Cambridge University Press: Cambridge, UK, 2022. [Google Scholar]
- Kementerian Lingkungan Hidup dan Kehutanan (KLHK). Laporan Inventarisasi Gas Rumah Kaca (GRK), Monitoring, Pelaporan, dan Verifikasi (MPV) Tahun 2023; KLHK: Jakarta, Indonesia, 2024; Volume 9. [Google Scholar]
- Ministry of Environment and Forestry of the Republic of Indonesia. Long-Term Strategy for Low Carbon and Climate Resilience 2050 (LTS-LCCR 2050); Ministry of Environment and Forestry: Jakarta, Indonesia, 2021. [Google Scholar]
- Ministry of Finance of the Republic of Indonesia. Climate Budget Tagging Report; Ministry of Finance: Jakarta, Indonesia, 2023. [Google Scholar]
- Merino-Soto, C. Aiken’s V coefficient: Differences in content validity judgments. MHSalud 2023, 20, 1–12. [Google Scholar] [CrossRef]
- Polit, D.F.; Beck, C.T. The content validity index: Are you sure you know what’s being reported? Critique and recommendations. Res. Nurs. Health 2006, 29, 489–497. [Google Scholar] [CrossRef] [PubMed]
- Yusoff, M.S.B. ABC of content validation and content validity index calculation. Educ. Med. J. 2019, 11, 49–54. [Google Scholar] [CrossRef]
- Ministry of Transportation of the Republic of Indonesia. Ministerial Decree No. KP 8 of 2022 concerning Transportation Sector Climate Mitigation Actions; Ministry of Transportation: Jakarta, Indonesia, 2022. [Google Scholar]
- Wang, D.; Mei, J. An Advanced Review of Climate Change Mitigation Policies in the United States. Resour. Conserv. Recycl. 2024. [Google Scholar] [CrossRef]
- Wabwile, W.; Ondabu, I. Funding Climate Action: A Systematic Review of Climate Finance Efficiency and Impact. J. Econ. Financ. Manag. Stud. 2025, 8. [Google Scholar] [CrossRef]
- Battiston, S.; Monasterolo, I.; Riahi, K.; Van Ruijven, B. Accounting for Finance Is Key for Climate Mitigation Pathways. Science 2021, 372, 918–920. [Google Scholar] [CrossRef] [PubMed]
- Hoppe, J.; Hinder, B.; Rafaty, R.; Patt, A.; Grubb, M. Three Decades of Climate Mitigation Policy: What Has It Delivered? Annu. Rev. Environ. Resour. 2023. [Google Scholar] [CrossRef]
- Mazzanti, M.; D’Amato, A.; Nicolli, F. Green Technologies and Environmental Policies for Sustainable Development: Testing Direct and Indirect Impacts. J. Clean. Prod. 2021, 127060. [Google Scholar] [CrossRef]
- Nachtigall, D.; Lutz, L.; Rodríguez, M.; D’Arcangelo, F.; Haščič, I.; Kruse, T.; Pizarro, R. The Climate Actions and Policies Measurement Framework: A Database to Monitor and Assess Countries’ Mitigation Action. Environ. Resour. Econ. 2024, 87, 191–217. [Google Scholar] [CrossRef]
Figure 1.
Greenhouse gas emission reduction profile in Indonesia’s transportation sector during 2018–2022. (a) emission reduction by mitigation action category; (b) emission reduction by transportation mode; (c) distribution of direct and indirect mitigation actions. Source: Prepared by the authors.
Figure 1.
Greenhouse gas emission reduction profile in Indonesia’s transportation sector during 2018–2022. (a) emission reduction by mitigation action category; (b) emission reduction by transportation mode; (c) distribution of direct and indirect mitigation actions. Source: Prepared by the authors.
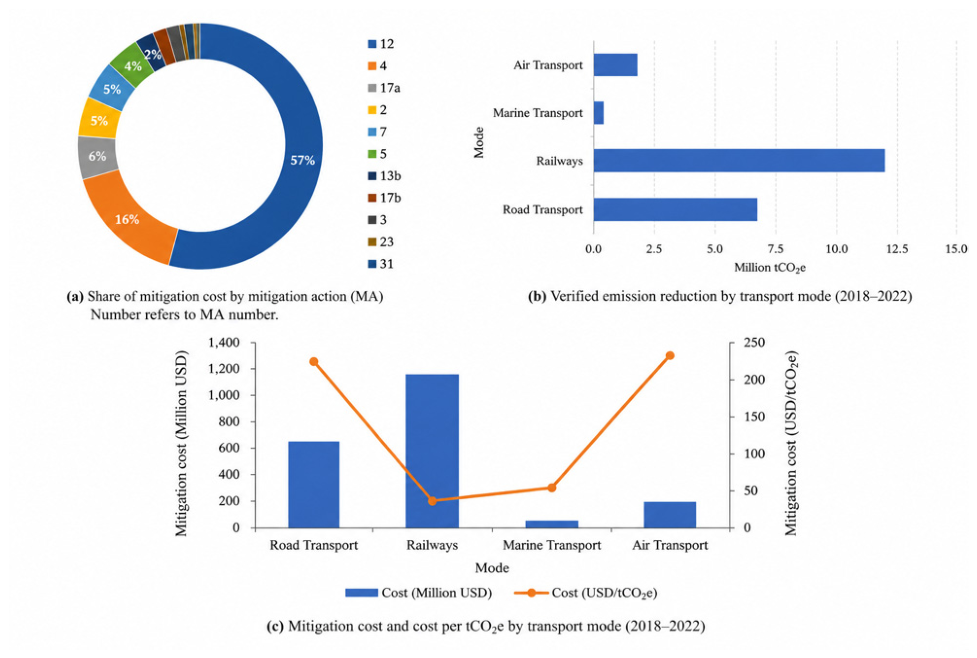
Figure 2.
Climate Finance Allocation and Mitigation Expenditure Structure in Indonesia’s Transportation Sector (2018–2022). (a) composition of climate finance sources for transportation-sector mitigation actions; (b) classification of climate budget tagging and non-tagged mitigation expenditures. Source: Prepared by the authors.
Figure 2.
Climate Finance Allocation and Mitigation Expenditure Structure in Indonesia’s Transportation Sector (2018–2022). (a) composition of climate finance sources for transportation-sector mitigation actions; (b) classification of climate budget tagging and non-tagged mitigation expenditures. Source: Prepared by the authors.
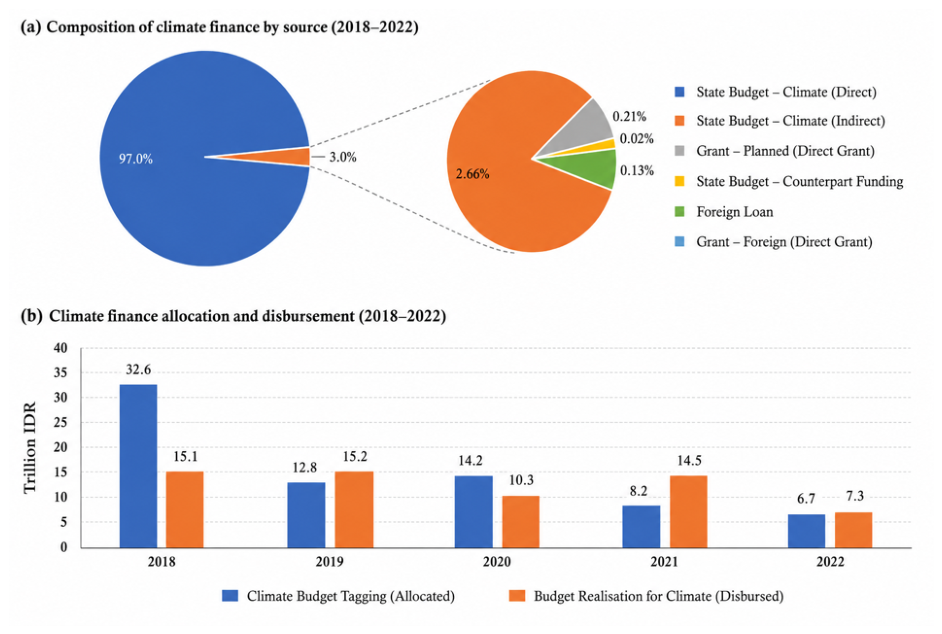
Figure 3.
Allocation of funding between direct and indirect mitigation actions (2018-2022). Source: Authors’ analysis and visualization based on verified mitigation and climate finance data.
Figure 3.
Allocation of funding between direct and indirect mitigation actions (2018-2022). Source: Authors’ analysis and visualization based on verified mitigation and climate finance data.
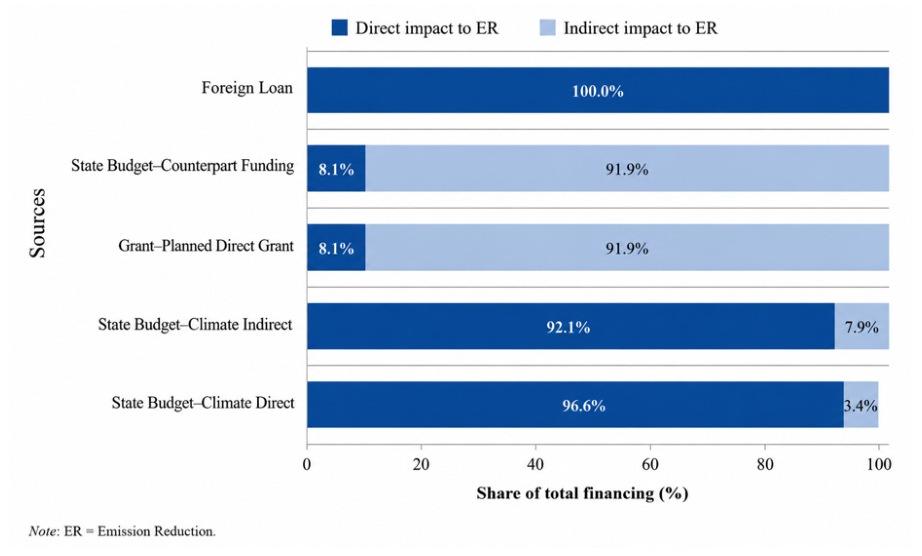
Figure 4.
Quadrant analysis of mitigation actions based on mitigation cost and emission reduction performance in Indonesia’s transportation sector (2018-2022). Source: Authors’ analysis and visualization based on verified mitigation and climate finance data. Notes: Numbers in the bubbles refer to Mitigation Action (MA) numbers as listed in the Table 2. The vertical dashed line represents the median emission reduction, and the horizontal dashed line represents the median mitigation cost.
Figure 4.
Quadrant analysis of mitigation actions based on mitigation cost and emission reduction performance in Indonesia’s transportation sector (2018-2022). Source: Authors’ analysis and visualization based on verified mitigation and climate finance data. Notes: Numbers in the bubbles refer to Mitigation Action (MA) numbers as listed in the Table 2. The vertical dashed line represents the median emission reduction, and the horizontal dashed line represents the median mitigation cost.
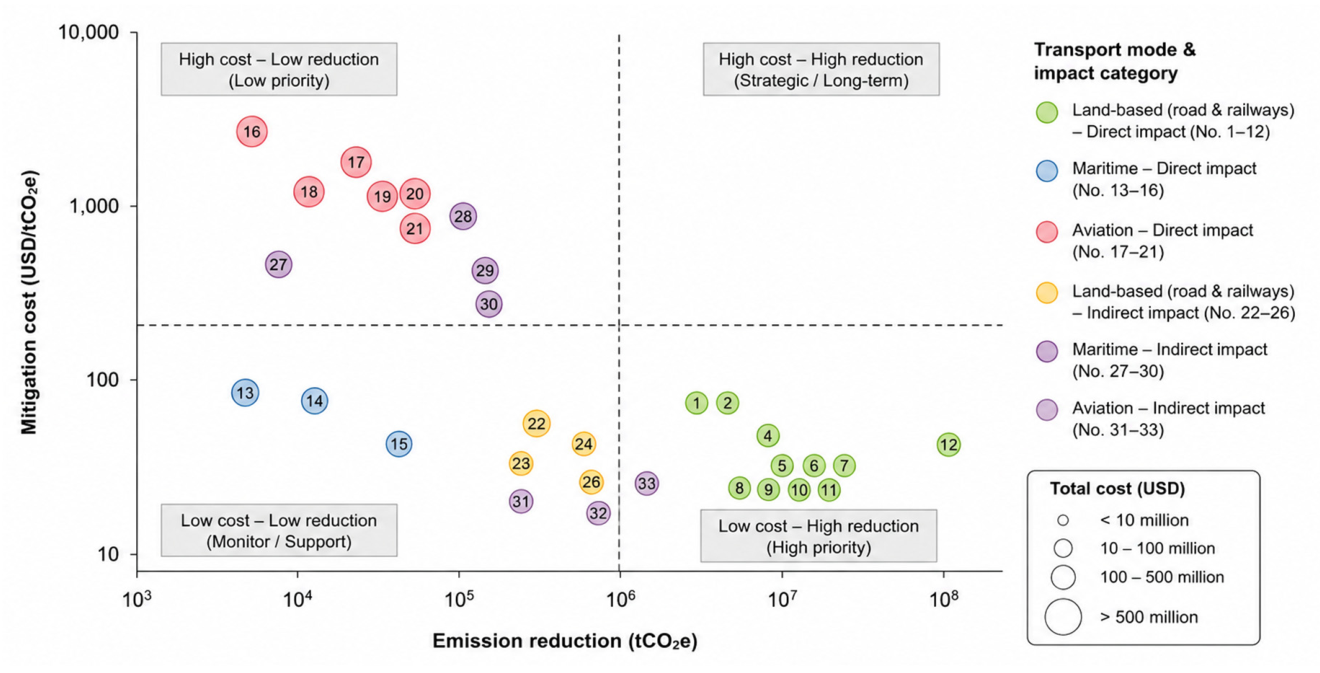

Table 1.
Types and sources of research data.
| No | Data Category | Description | Main Sources |
|---|---|---|---|
| 1 |
Mitigation Action (MA) data on Transportation Sector |
ENDC transportation-sector targets; Minister of Transportation Decree No. 8/2022; BUR and BTR reports; IGRK and MRV transportation data (2018–2022); transportation statistics; LTS-LCCR; NZE scenarios | Ministry of Environment and Forestry (MoEF); Ministry of Transportation (MoT); Ministry of Energy and Mineral Resources (MoEMR); Statistics Indonesia (BPS); UNFCCC |
| 2 | Climate Finance Data | Grants, loans, equity financing, public service agency funds, green bonds, green sukuk, carbon tax, and carbon trading instruments related to transportation mitigation actions | Ministry of Finance (MoF); MoT; MoEMR; BPDLH; BPS |
| 3 | Supporting Policy and Institutional Data | RPJMN, RPJP, RKP, sectoral strategic plans, SDGs documents, climate-related regulations, IPCC reports, and UNFCCC negotiation outcomes | Bappenas; MoT; BPS; IPCC; UNFCCC |
Note: Bappenas (National Development Planning Agency); BPDLH (Environmental Fund Management Agency); BTR (Biennial Transparency Report); BUR (Biennial Update Report); ENDC (Enhanced NDC); IGRK (GHG Inventory); IPCC (Intergovernmental Panel on Climate Change); LTS-LCCR (Long-Term Strategy for Low Carbon and Climate Resilience); MoEF (Ministry of Environment and Forestry); MoEM (Ministry of Energy and Mineral Resources); MoF (Ministry of Finance); MoT (Ministry of Transportation); MRV( Monitoring, Reporting, and Verification; NZE (Net Zero Emissions); Renstra (Stategic trategic Plan); RKP (Annual Government Work Plan); RPJMN (National Mid-Term Development Plan); RPJP (National Long-Term Development Plan); UNFCCC (United Nations Framework Convention on Climate Change). Source: Prepared by the authors. Full source lists available upon request.
Table 2.
Classification of mitigation policy and measures in Indonesia’s transportation sector.
| No | Mitigation Action | ASI Category | Main Implementation Type | Impact |
|---|---|---|---|---|
| 1 | Battery Electric Vehicles (KBLBB) & charging stations | Improve | Infrastructure improvement | D |
| 2 | Fuel switching (RON 88 to 90/92/98+) | Improve | Infrastructure improvement | D |
| 3 | Compressed natural gas (CNG) for public transport | Improve | Infrastructure improvement | D |
| 4 | Mass Bus Rapid Transit expansion (BRT/semi-BRT, BTS) | Shift | Infrastructure improvement | D |
| 5 | Advanced Traffic Control Systems (ATCS); Jabodetabek Non-Motorized Transport (NMT) development | Improve (ATCS) & Shift (NMT) | Infrastructure improvement | D |
| 6 | Transit Oriented Development (TOD) | Avoid & Shift | Infrastructure & spatial planning | D |
| 7 | Long Distance Ferry (LDF) for road-to-sea shift | Shift | Infrastructure improvement | D |
| 8 | Alternative fuels: hydrogen (road); rail alternatives | Improve | Technology and Infrastructure improvement | D |
| 9 | Solar-powered navigation systems (TSDP) | Improve | Renewable Energy and Infrastructure improvement | D |
| 10 | Vehicle efficiency and fleet rejuvenation | Improve | Regulation & infrastructure | D |
| 11 | School/office bus programs | Shift | Behavior intervention | D |
| 12 | Rail mass transit expansion | Shift | Infrastructure improvement | D |
| 13 | Marine vessel efficiency improvements | Improve | Infrastructure improvement | D |
| 13a | Energy Efficiency Design (EED) | Improve | Regulation | D |
| 13b | Vessel modernization | Improve | Infrastructure improvement | D |
| 13c | Ship Energy Efficiency Management Plan (SEEMP) | Improve | Behavior/operation | D |
| 13d | Sea Highway navigation aids | Improve | Infrastructure improvement | D |
| 13e | Short-sea shipping routes | Shift | Infrastructure improvement | D |
| 14 | Anti-fouling hull coatings | Improve | Infrastructure improvement | D |
| 15 | Port operational efficiency (shore power) | Improve | Infrastructure improvement | D |
| 16 | Low-carbon marine fuels; Renewable Energy (RE) | Improve | Infrastructure improvement | D |
| 17 | Air transport management efficiency | Improve | Behavior/operation | D |
| 17a | Aircraft fleet renewal | Improve | Infrastructure improvement | D |
| 17b | Performance Based Navigation (PBN) procedures | Improve | Behavior/operation | D |
| 18 | ICAO biofuel guidelines | Improve | Regulation | D |
| 19 | User Preferred Routes (UPR) | Improve | Behavior/operation | D |
| 20 | Electric Ground Support Equipment (GSE) & airport vehicles | Improve | Infrastructure improvement | D |
| 21 | Biofuels in GSE | Improve | Infrastructure improvement | D |
| 22 | LED street lighting | Improve | Infrastructure improvement | I |
| 23 | Solar street lighting | Improve | Infrastructure improvement | I |
| 24 | Solar power for road/rail infrastructure | Improve | Infrastructure improvement | I |
| 25 | Jabodetabek level crossing planning & monitoring | Improve | Infrastructure improvement | I |
| 26 | Electronic Road Pricing (ERP) | Avoid & Shift | Behavior intervention (price signal) | I |
| 27 | Eco-seaport initiatives | Improve | Infrastructure improvement | I |
| 27a | Onshore Power Supply (OPS) | Improve | Infrastructure improvement | I |
| 27b | Port cargo electrification | Improve | Infrastructure improvement | I |
| 27c | Solar port lighting | Improve | Infrastructure improvement | I |
| 28 | Port Solar power for marine infrastructure | Improve | Infrastructure improvement | I |
| 29 | Vessel Traffic Service (VTS) | Improve | Infrastructure improvement | I |
| 30 | Environmental greening | Improve | Infrastructure improvement | I |
| 31 | Eco airport initiatives | Improve | Infrastructure improvement | I |
| 32 | Airport RE expansion (solar lighting, solar power, efficient fixtures) | Improve | Infrastructure improvement | I |
| 33 | MRV CO₂ & ICAO offsetting | Improve | Regulation & behavior | I |
Notes: Mitigation Actions (MAs) No. 1–12 : land-based transportation measures (road and railway subsectors) with direct impacts on greenhouse gas (GHG) emission reduction; 13-16: maritime transportation measures with direct mitigation impacts; 16-21: aviation mitigation actions with direct impact; 22-26: land based (road and railways) transportation measures with indirect or enabling impacts on emission reduction; 27-30: maritime transportation measures with indirect mitigation impacts; 31-33: aviation mitigation actions with indirect impacts. Source: compiled by the authors based on national mitigation policy documents.
Table 3.
Categorization of Climate Budget Tagging and Mitigation Impacts.
| Impact Classification | Climate Budget Tagged | Non-Tagged Climate Expenditure |
|---|---|---|
| Direct impact on transportation-sector emission reduction | Category 1 | Category 4 |
| Indirect impact functioning as enabling conditions for transportation-sector mitigation | Category 2 | - |
| Indirect impact contributing to mitigation outcomes in other sectors | Category 3 | - |
Table 4.
Estimated mitigation cost per tCO2e in the transportation sector.
| Mitigation Action Group | Verified Emission Reduction (tCO2e) | Estimated Cost (IDR/tCO2e) | Estimated Cost (USD/tCO2e*) |
|---|---|---|---|
| Direct Mitigation Actions (No. 1-21) | 19.893.630,85 | 3.016.067 | 184 |
| Indirect Mitigation Actions (No. 22-33) | 480.490,97 | 4.996.825 | 305 |
*) Exchange rate assumption: USD 1 = IDR 16,400.
Disclaimer/Publisher’s Note: The statements, opinions and data contained in all publications are solely those of the individual author(s) and contributor(s) and not of MDPI and/or the editor(s). MDPI and/or the editor(s) disclaim responsibility for any injury to people or property resulting from any ideas, methods, instructions or products referred to in the content. |
© 2026 by the authors. Licensee MDPI, Basel, Switzerland. This article is an open access article distributed under the terms and conditions of the Creative Commons Attribution (CC BY) license (http://creativecommons.org/licenses/by/4.0/).
Copyright: This open access article is published under a Creative Commons CC BY 4.0 license, which permit the free download, distribution, and reuse, provided that the author and preprint are cited in any reuse.


