

Submitted:
25 May 2026
Posted:
26 May 2026
You are already at the latest version
Abstract
Safety science generally does not rely on classic “threshold values” for physical injury, unlike the field and science of Occupational Hygiene. While such thresholds have been set for chemical, physical, biological, and ergonomic hazards, the psychosocial environment lacks similar analytical rigor. This study examines the concept of psychosocial threshold values or psychosocial exposure limits (PSEL). Utilizing a two-year longitudinal survey (N(2024) = 4912, N(2025) = 3035), stressors were coded as risk threshold (scores >3 on a 1–5 scale) and analyzed via logistic regression to predict work injuries resulting in absence from work. Results indicate that psychosocial factors were associated with significantly higher odds of injury (cross-sectional) after controlling for demographics and risk level. Persistent exposure was associated with higher Odds Ratios for injury in 2025 for an aggressive environment (OR = 2.83, CI 95% 1.75–4.59), organizational hindrances (OR = 1.88, CI 95% 1.21–2.91), and cognitive overload (OR = 1.5, CI 95% 1.14–1.97). Summing the psychosocial factors revealed a 56% increased risk of injury for each additional factor to which the worker was exposed. These findings suggest that organizational stressors can be modeled as predictive risk factors, with a threshold for monitoring and targeted interventions to mitigate future accidents, though further scale refinement for each variable is necessary to improve diagnostic and threshold accuracy.
Keywords:
psychosocial
; stress
; burnout
; work injuries
; overexposure
; limits threshold
1. Introduction
Safety science generally does not rely on classic “threshold limit values,” analogous to airborne concentration limits used for chemical hazards. Safety engineering uses several other concepts, and some safety-related hazards have threshold-type limits, especially when injury probability can be related quantitatively to a physical parameter. Classic Threshold Limit Values (TLVs) [1] or Occupational Exposure Limits (OELs) as well as Exposure Limit Values (ELVs) under European directives have long been used in occupational hygiene to indicate threshold values above which an increased risk of adverse health effects is probable. Such thresholds have served as the gold standard for preventing physical injuries and illnesses by establishing clear, analytical boundaries for exposure to chemical, physical, biological, and ergonomic hazards [1], but while we have become experts at measuring the “tangible” dangers of the shop floor, the psychosocial environment, the invisible atmosphere of stress, and interpersonal dynamics have historically lacked comparable analytical rigor or standardized monitoring.
This study examines the concept of threshold values for psychosocial exposures for analyzing psychosocial stressors. A primary driver for this investigation is the global shift toward standardized psychosocial risk management, most notably crystallized in ISO 45003:2021. This international standard provides guidelines for managing psychological health and safety at work, emphasizing that psychosocial hazards, such as aggressive environments, lack of autonomy, and role ambiguity, are not just “well-being” issues but are directly linked to occupational safety and health (OSH) outcomes. The importance of managing psychological health at work arises from increasing evidence of the last four decades regarding the health results of stress and burnout, such as cardiovascular diseases [2] and mental health [3]; and that stress and burnout are strongly related to working conditions [4]. ISO 45003 underscores that organizations must identify these hazards with the same systematic approach used for physical risks. Studies support this, showing that a high-risk psychosocial safety climate is associated with an increase in the risk of physical workplace injuries [5,6].
Unlike chemical exposures, which have definite measures, such as airborne levels, and can be measured by various technologies and physical sensors, psychosocial stressors are inherently subjective and perceived. What constitutes “overload” for one worker may be perceived differently by another; however, this perception is no less real in its physiological and safety consequences. Subjective overload functions as a pervasive cognitive filter that fundamentally reshapes a worker’s interaction with their environment. When the demands of a role exceed an individual’s mental or cognitive bandwidth, it impairs the brain’s capabilities of recognition, attention, memory, and selection [7]. This saturation forces the brain to shift from deliberate, analytical reasoning to rapid, heuristic-based thinking [8], which often manifests as heightened impulsivity and “inattentional blindness”, a dangerous failure to detect even obvious environmental hazards because the brain lacks the capacity to process them.
As this state of cognitive overload becomes persistent, it triggers a “resource loss spiral” where emotional and mental energy is depleted faster than it can be replenished. This chronic exhaustion creates a self-reinforcing cycle where each subsequent stressor further erodes the individual’s ability to recover, ultimately culminating in occupational burnout, characterized by total emotional bankruptcy and a profound detachment from the critical safety protocols of the job [9].
This study delves into the limits of psychosocial exposure and introduces an exploratory threshold as a framework to model organizational stressors as predictive risk factors for physical injuries. Many organizational psychosocial factors have been studied over the past five decades [10]. Relying on Aronson’s meta-analytic review of work environment, we chose five factors. Four factors that pose cognitive or mental overload without a direct effect on physical health, such as physical overload, shift work, long working hours, and an aggressive work environment [11] to estimate the indirect association of the mental load with the risk of physical injury. The aim of the paper is to suggest a primary scale for assessing when a load becomes an overload and a risk factor for the use of organizational management of psychosocial hazards—assessing, prioritizing, and applying relevant and effective intervention.
2. Materials and Methods
2.1. Participants
A longitudinal biennial survey was completed by participants from a professional panel in December 2024 and again in December 2025. Partial data were used from a wider survey that is aimed at mapping occupational exposures—Physical, chemical, biological, ergonomics, and psychosocial, alongside safety and health outcomes.
The participants of the current study are 2989 full survey responders who worked in both years, 52.3% women, 47.6% men, and 3 (0.1%) chose “prefer other gender description”. Age in 2024 ranged between 18 and 82, M = 41.87 (SD = 12.06). Most industries and occupations are represented, but the sample is not representative of the countrywide workforce.
2.2. Measurements
All scales were translated into Hebrew. A bilingual psychologist compared the translation to the English scale and corrected for inaccuracies. We tested all the scales using Confirmatory Factor Analyses on a pilot with 500 participants. The questionnaire was then translated into Arabic by a professional translator and double-checked for clarity and meaning by two Arabic-speaking OSH professionals. The questionnaire has been used since 2020, and the wording has been slightly changed over the years.
Demographic, occupation, and organizational data collected: Gender, age, education, sector, job, and income.
Five psychosocial factors not directly related to physical hazards, such as heavy loads or awkward working postures, shifts or long working hours, were selected for initial threshold limit estimates: cognitive overload, lack of autonomy, organizational hindrances, work-home conflict, and an aggressive working environment.
Cognitive demands and autonomy were adapted from the Work Design Questionnaire (WDQ) [12]. Cognitive demands were measured by three statements related to time pressure, concentration, and multitasking, such as “My work requires intense concentration” (α = 0.70).
Autonomy: working methods were measured by three statements regarding the tasks, e.g., “The job allows me to make decisions about what methods I use to complete my work”, and decision-making autonomy was assessed via four statements, e.g., “The job gives me a chance to use my personal initiative or judgment in carrying out the work” (α = 0.82). The scale was reversed to capture the lack of autonomy.
Organizational hindrances were measured using four statements addressing bureaucracy, organizational politics, time-wasting in meetings, and lack of clarity in demands, adapted from the organizational hindrances scale [13] (α = 0.74).
An aggressive work environment was measured by five statements that asked about overall hostile behavior, humiliation and contempt, concealment of information, verbal aggression, physical aggression towards equipment, such as slamming doors, and physical violence [11]. The response was on a frequency scale: ‘never happened’, ‘a few times a year’, ‘once a month’, ‘once a week’, and ‘happens almost every day’ (α = 0.88). The index calculated the maximum rank—that is, the maximum frequency with which the respondent experiences any kind of aggression.
Work-Home Conflict is measured by four statements, adapted from [14], two referring to work disruption to the home, for example, “My work requirements interfere with my family and home life”, and two relating to home interference causing disruption to work, for example, “My family life interferes with things at work, such as arriving on time, completing daily tasks, and overtime”. The measure presented high reliability: α = 0.83.
Injury: A list of 11 types of injuries (Contusion or bruise, wound, laceration or cut, musculoskeletal—sprain, strains or inflammation, fracture, burn (thermal, chemical), amputation, dehydration or heatstroke, electric shock or burn, eye injury, respiratory damage. For each option, participants indicate whether it happened in the last year. An additional question asked if the injury required days off and how many (1—None, 2—few hours for treatment, 3—1–3 days, 4—4–6 days (a week), 4—Two weeks, 5—a month, 6—more than a month, 7—not relevant, I was not injured. The latter, for extra reliability check). The injury measure was coded for those who were injured and needed time off (0 = no, 1 = yes).
Risk level of the job: Participants indicated each year the type of job they did from a list of 15 jobs. A cross-tabulation test revealed that injury percentages among participants across job categories ranged from 4.6% to 22.6%. The jobs were categorized into three categories according to the average of injuries in both of the years for the job: 1—Low risk with 10% and less, including professional services such as lawyers, public relations, journalism and media, programming, research and development, accounting and administration, engineering, operation, and logistics; 2—Medium risk with 11–20%, including healthcare, laboratory workers, education and training, sales and customer services, and technicians; 3—High-risk jobs with more than 20% injuries including front-line workers in industry, agriculture and construction, policing, rescue and emergency services and professional drivers.
3. Results
The participants do not represent the exact percentages of the working population in 2024. The sample includes 52% women (more than the working population—48.5%). Familial status: 66.8% married, 23.7% bachelor, 9% divorced, 0.4% widower. Half (50.7%) have children under 18, 32.7% have no children, and 16.6% have all their children over 18. Regarding education, the sample is more educated: 21.7% have a high school diploma, 18.1% have a professional certificate, 39.3% have an academic degree, and 21% have a master’s degree or higher. The sample is overrepresented in higher income groups: Minimum wage 8.9%, up to Median income 24.3%, up to Average 23.8%, above Average 26.5%, twice Average 6.2%, and 10.2% were unwilling to indicate their income.
Demographic and employment factors are presented in Table 1 for descriptive purposes and to assess associations with injury prevalence.
The sample included in each year (2024, 2025, respectively) was 56.6%, 56.8% who worked in low-risk jobs, 37.7%, 35.7% in medium-risk jobs, and 5.6%, 7.7% in high-risk jobs. The percentages of injuries for each level are presented in Table 2 (no statistical test of significance is reported because the levels were categorized by injury percentage).
3.1. Psychosocial Factors
The most reported psychosocial factor was cognitive overload for both years (2024, 2025 respectively) (M = 3.44, SD = 0.83; M = 3.43, SD = 0.83), lack of autonomy (M = 2.41, SD = 0.89; M = 2.43, SD = 0.89), Work-Home conflict (M = 2.24, SD = 0.90; M = 2.22, SD = 0.92), and Organizational hindrances (M = 2.24, SD = 0.80; M = 2.19, SD = 0.80). Aggressive work environment (humiliation, discrimination or exclusion, physical towards equipment or towards the employee) was reported as “never having happened”, the highest percentages (46.2%, 43.5%), rarely (35.5%, 39.8%), about once a month (9.4%, 8.3%), about once a week (4.9%, 4.7%) or few times a week (4%, 3.8%) (M = 1.85, SD = 1.05, M = 1.86, SD = 1.01).
The psychosocial factors were categorized into 4 groups by scoring scale: low (mean 1–1.99), medium (mean 2–2.99), high (mean 3–3.99), and very high (mean 4–5) (see Table 3 for distributions). The categorization aimed for the visualization of injury percentages.
We analyzed the prevalence of injuries across the three levels of job risk and the four levels of psychosocial factor in both years. As shown in Figure 1, each level of psychosocial factor increases the risk for injury, demonstrating a dose-response relationship, but it is inconclusive whether the second level (mean value 2–3) should be the threshold—it is more prominent for high-risk jobs—or if high levels of psychosocial factor (mean value above 3) are the threshold value. For an aggressive working environment, experiencing it at least once a month is associated with an elevated risk for injury, with no further increase for more frequently experiencing an aggressive working environment for high-risk jobs, while low-risk jobs present a “peak” for weekly experiencing.
Based on the trends emerging from the data visualization and the conceptualization of the midpoint of the scale as a threshold above which there is potential overload, we set the threshold at 3 and recoded all psychosocial factors: values 1–3 = 0, and values >3 = 1.
Two logistic regressions were conducted in R 4.3.1, one for each year, to assess the association of the psychosocial factor with injury risk, controlling for gender, age, income, and risk level. The psychosocial factors are set as 0 or 1. As shown in Table 4, Income and education are negatively associated with injury risk, beyond the obvious correlation between income and education and job-level risk. An aggressive work environment presents the highest odds ratio for both years (1.99, 2.34, respectively), Organizational hindrances (1.50, 1.78, respectively), Work-home conflict was significantly associated with injury risk in 2024 (OR = 1.66), Cognitive demands overload only in 2025 (OR = 1.57), and autonomy lost the significant association that it presented when it was analyzed using a chi-square test without controlling for other factors.
We further examined the association of longitudinal exposure among workers who reported high levels of the psychosocial factor in both years with the risk for injury in 2025. In the longitudinal logistic regression, job change was also included as a controlled factor. As presented in Table 5, job change was strongly associated with 74% higher risk for injury. The information on whether the job change was prior, after, or due to injury was not collected.
Increased risk of injury was associated with the long-term presence of psychosocial hazards, indicating a 2.84-fold higher risk of working in a perceived aggressive environment, an 88% increased risk of organizational hindrances, a 50% increased risk of cognitive demands, and a 49% increased risk of work-home conflict (p = 0.06). Perceived lack of autonomy in the job was not significantly associated with the risk of work injury.
A further investigation was conducted regarding a potential cumulative effect of different stressors. The three significant psychosocial variables were summed, excluding the aggressive work environment that had, on its own, a strong association with injury. Of all 2987 participants with data for both years, 46.8% reported no psychosocial factor, 43.4% reported one factor, 8.5% reported two factors, and 1.3% (N = 40) reported all three factors. Each additional psychosocial factor was associated with an average additional 57% risk of injury (see Table 6).
4. Discussion
This paper aims to conceptualize psychosocial variables as threshold indicators, enabling safety and human resources (HR) professionals to measure and prioritize management controls and interventions based on the risk they pose to work injuries.
Associations between psychosocial factors and higher risk of work injuries have been reported in previous studies, including a meta-analytic paper (Nahrgang et al., 2011) and in specific industries such as construction [15]. The current paper focuses on the definition of perceived overload and seeks to identify a psychosocial threshold for stressful working conditions that are associated with a higher risk of work injuries. The analyses revealed that measuring variables on a 1–5 scale and categorizing values above 3 as a risk factor yields significant and meaningful associations with increased odds of injury, even for psychosocial factors that are “only” cognitive and mental overload but are not direct physical hazards. The results suggest that the association is not random and persists over a two-year period.
An aggressive work environment was associated with the highest additional percentages. Moreover, it was measured on a frequency scale and provides direction on the importance of how often the worker must deal with factors that increase his or her stress, rather than just “how much” the factor stresses them. The frequency of dealing with factors that cause stress may affect the risk for injury in two ways: The first is through cognitive overload that distracts the worker, thus may increase the risk of missing hazards and environmental cues, bad decisions, or impulsive behavior [16]. The more frequently it happens, the higher the chance it will meet a hazardous task. The second fold relies on the nature of burnout. Burnout is the result of prolonged stress. Burnt-out workers have less motivation to adhere to safety rules, and they report lower safety behaviors [17]. Facing a stress factor frequently leaves the worker aroused for prolonged periods and at higher risk for occupational burnout.
Another related result is the cumulative effect of different psychosocial factors. Each additional psychosocial factor was associated with more than 50% increased risk for injury. Summing up the psychosocial factors is not just a mathematical or statistical result; it relies on the nature of the resource lost cycles [18] that are both increasing the level of stress and the frequency with which the worker feels stressed out, have less time and opportunity to recover, therefore increasing the risk for occupational burnout [19].
An unhypothesized result was that job changes were associated with a higher risk of work injury. Change or transition in the job or organization can be addressed as a psychosocial risk factor because it may cause stress, or due to the need to learn a new environment, procedures, and hazards [20] . On the other hand, in this research, we cannot conclusively determine whether the job transition occurred after the injury or was even due to it. Therefore, the higher injury rates among workers who changed jobs warrant further investigation.
The focus of this paper was on psychosocial factors that are not directly related to physical overload. When modeling overexposure to shift work, long working hours, awkward posture, prolonged standing, noisy environments, etc., which are known to increase the risk of musculoskeletal injuries and cardiovascular or metabolic illnesses, we need to consider different thresholds and synergistic effects [21,22]. For example, there is a threshold for noise as a risk factor for hearing, while we need to consider noise a psychosocial risk factor for stress in office or open-space working environments.
Limitations
While the findings provide a robust framework for psychosocial risk assessment, several limitations must be acknowledged: the main limitation is that psychosocial factors are inherently subjective and are measured as attitudes, perceptions, and feelings. The injury data were also self-reported, which weakens the conclusion compared to validated external data. Nevertheless, stress and burnout are perceptions and feelings that have a tremendous effect on the body and cognition and are thus relevant for assessment using subjective tools, mainly for management purposes.
A second limitation is the study sample, which is not perfectly representative of the total working population. It is skewed toward higher-income groups and highly educated individuals, populations that are more likely to work in lower-risk jobs and occupations.
5. Conclusions
This study confirms that psychosocial factors are significant, persistent predictors of occupational injuries. By applying the concept of Psychosocial exposure limit, we have demonstrated that organizational stressors can be modeled using threshold values for separate variables and a new cumulative scale that sums psychosocial stress factors.
The results highlight that an aggressive work environment is a potent predictor of injury, nearly tripling the risk when exposure is persistent. Furthermore, the predictive results from measuring the variable on a frequency scale suggest that researchers may benefit from adding the dimension of exposure frequency to the strength of the perceived experience.
Ultimately, these findings support the evidence that safety is not just about the equipment provided and procedures, but also about the environment fostered. Transitioning to a PSEL approach enables organizations to proactively manage the psychosocial environment and reduce risk factors for both physical and mental health.
Author Contributions
Survey development, L.E and A.P; Conceptualization, analysis, and first draft writing, L.E. Review and editing, A.P. Both authors have read and agreed upon the published version of the manuscript.
Funding
This research was funded by the Israel Institute for Occupational Safety and Hygiene.
Institutional Review Board Statement
This study was approved by Israel Institute for Occupational Safety and Hygiene - Institutional Review Board (No. 082023; date of approval: 10 July 2023) and conducted in accordance with ethical guidelines.
Informed Consent Statement
Informed consent was obtained from all the participants.
Data Availability Statement
The data used for the analyses presented in this article are available upon request from the corresponding author.
Conflicts of Interest
The authors declare no conflict of interest.
Abbreviations
The following abbreviations are used in this manuscript:
| TLV | Threshold Limit Values |
| PSEL | Psychosocial Exposure Limits |
| ELV | Exposure Limit Values |
| OR | Odds Ratio |
| OSH | Occupational Safety and Health or Hygiene |
| ACGIH | American Conference of Governmental Industrial Hygienists |
| M | Mean |
| SD | Standard Deviation |
| DF | Degrees of Freedom |
| HR | Human Resources |
References
- American Conference of Governmental Industrial Hygienists (ACGIH). TLVs and BEIs: Based on the Documentation of the Threshold Limit Values for Chemical Substances and Physical Agents & Biological Exposure Indices; ACGIH: Cincinnati, OH, 2026. [Google Scholar]
- John, A.; Bouillon-Minois, J.B.; Bagheri, R.; Pélissier, C.; Charbotel, B.; Llorca, P.M.; et al. The influence of burnout on cardiovascular disease: a systematic review and meta-analysis. Front Psychiatry 2024, 15, 1326745. [Google Scholar] [CrossRef] [PubMed]
- Glandorf, H.L.; Madigan, D.J.; Kavanagh, O.; Mallinson-Howard, S.H. Mental and physical health outcomes of burnout in athletes: a systematic review and meta-analysis. Int. Rev. Sport Exerc Psychol. 2025, 18(1), 372–416. [Google Scholar] [CrossRef]
- Demerouti, E. Burnout: a comprehensive review. Z. Für Arbeitswissenschaft. 2024, 78(4), 492–504. [Google Scholar] [CrossRef]
- Wu, Z.; Wang, Y.; Liu, M. Job stress and burnout among construction professionals: the moderating role of online emotions. Eng. Constr. Archit. Manag 2024, 31(12), 4831–51. [Google Scholar] [CrossRef]
- Zadow, A.J.; Dollard, M.F.; Mclinton, S.S.; Lawrence, P.; Tuckey, M.R. Psychosocial safety climate, emotional exhaustion, and work injuries in healthcare workplaces. Stress Health 2017, 33(5), 558–69. [Google Scholar] [CrossRef] [PubMed]
- Reason, J. Understanding adverse events: human factors. Qual. Saf. Health Care. 1995, 4(2), 80–9. [Google Scholar] [CrossRef] [PubMed]
- Kahneman, D. Thinking, Fast and Slow; Straus and Giroux: New-York, 2011. [Google Scholar]
- Hobfoll, S.E. Conservation of resources: A new attempt at conceptualizing stress. Am. Psychol. 1989, 44(3), 513–24. [Google Scholar] [CrossRef] [PubMed]
- Aronsson, G.; Theorell, T.; Grape, T.; Hammarström, A.; Hogstedt, C.; Marteinsdottir, I.; et al. A systematic review including meta-analysis of work environment and burnout symptoms. BMC Public Heal. 2017, 17(1), 264. [Google Scholar] [CrossRef] [PubMed]
- Einarsen, S.; Hoel, H.; Notelaers, G. Measuring exposure to bullying and harassment at work: Validity, factor structure and psychometric properties of the Negative Acts Questionnaire-Revised. Work Stress. 2009, 23(1), 24–44. [Google Scholar] [CrossRef]
- Morgeson, F.P.; Humphrey, S.E. The Work Design Questionnaire (WDQ): Developing and validating a comprehensive measure for assessing job design and the nature of work. J. Appl. Psychol. 2006, 91(6), 1321–39. [Google Scholar] [CrossRef] [PubMed]
- Cavanaugh, M.A.; Boswell, W.R.; Roehling, M.V.; Boudreau, J.W. An empirical examination of self-reported work stress among U.S. managers. J. Appl. Psychol. 2000, 85(1), 65–74. [Google Scholar] [CrossRef] [PubMed]
- Netemeyer, R.G.; Boles, J.S.; McMurrian, R. Development and validation of work–family conflict and family–work conflict scales. J. Appl. Psychol. 1996, 81(4), 400–10. [Google Scholar] [CrossRef]
- Seo, H.J.; Rhee, S.Y.; Yoon, Y.G. Enhancing Worker Safety Behaviors Through the Job Demands–Resources Approach: Insights from the Korean Construction Sector. Buildings 2025, 15(3), 486. [Google Scholar] [CrossRef]
- Pooladvand, S.; Hasanzadeh, S. Impacts of Stress on Workers’ Risk-Taking Behaviors: Cognitive Tunneling and Impaired Selective Attention. J. Constr. Eng. Manag. 2023, 149(8), 04023060. [Google Scholar] [CrossRef]
- Liu, M.; Liu, L.; Lv, Z.; Ma, F.; Mao, Y.; Liu, Y. Effects of burnout and work engagement in the relationship between self-efficacy and safety behaviours—A chained mediation modelling analysis. J. Adv. Nurs. 2024, 80(4), 1473–83. [Google Scholar] [CrossRef] [PubMed]
- Hobfoll, S.E.; Halbesleben, J.; Neveu, J.P.; Westman, M. Conservation of Resources in the Organizational Context: The Reality of Resources and Their Consequences. Annu Rev. Organ Psychol. Organ Behav. 2018, 5(1), 103–28. [Google Scholar] [CrossRef]
- Egozi, L.; Pardo, A. Demands and Resources: Weighing Interaction Effects on Occupational Burnout. J. Occup. Env. Med. 2023, 65(12), e764–70. [Google Scholar] [CrossRef]
- Wu, W.; Liu, W.; Wu, W.; Xia, Y. Off to a hard start: How job rotation reshapes newcomers’ learning and adjustment process. J. Appl. Psychol. 2026, 111(2), 262–79. [Google Scholar] [CrossRef]
- Bellacov, R.L.; Davis, K.G.; He, C. Evaluating the impact of shift work length and time of day on musculoskeletal disorders among nursing assistants in long-term care. Hum. Factors Healthc. 2025, 7, 100094. [Google Scholar] [CrossRef]
- Schettini, M.A.S.; Passos, R.F.D.N.; Koike, B.D.V. Shift Work and Metabolic Syndrome Updates: A Systematic Review. Sleep Sci. 2023, 16(02), 237–47. [Google Scholar] [CrossRef]
Figure 1.
Percentages of injuries by level of psychosocial factor across levels of job risk for five factors .
Figure 1.
Percentages of injuries by level of psychosocial factor across levels of job risk for five factors .
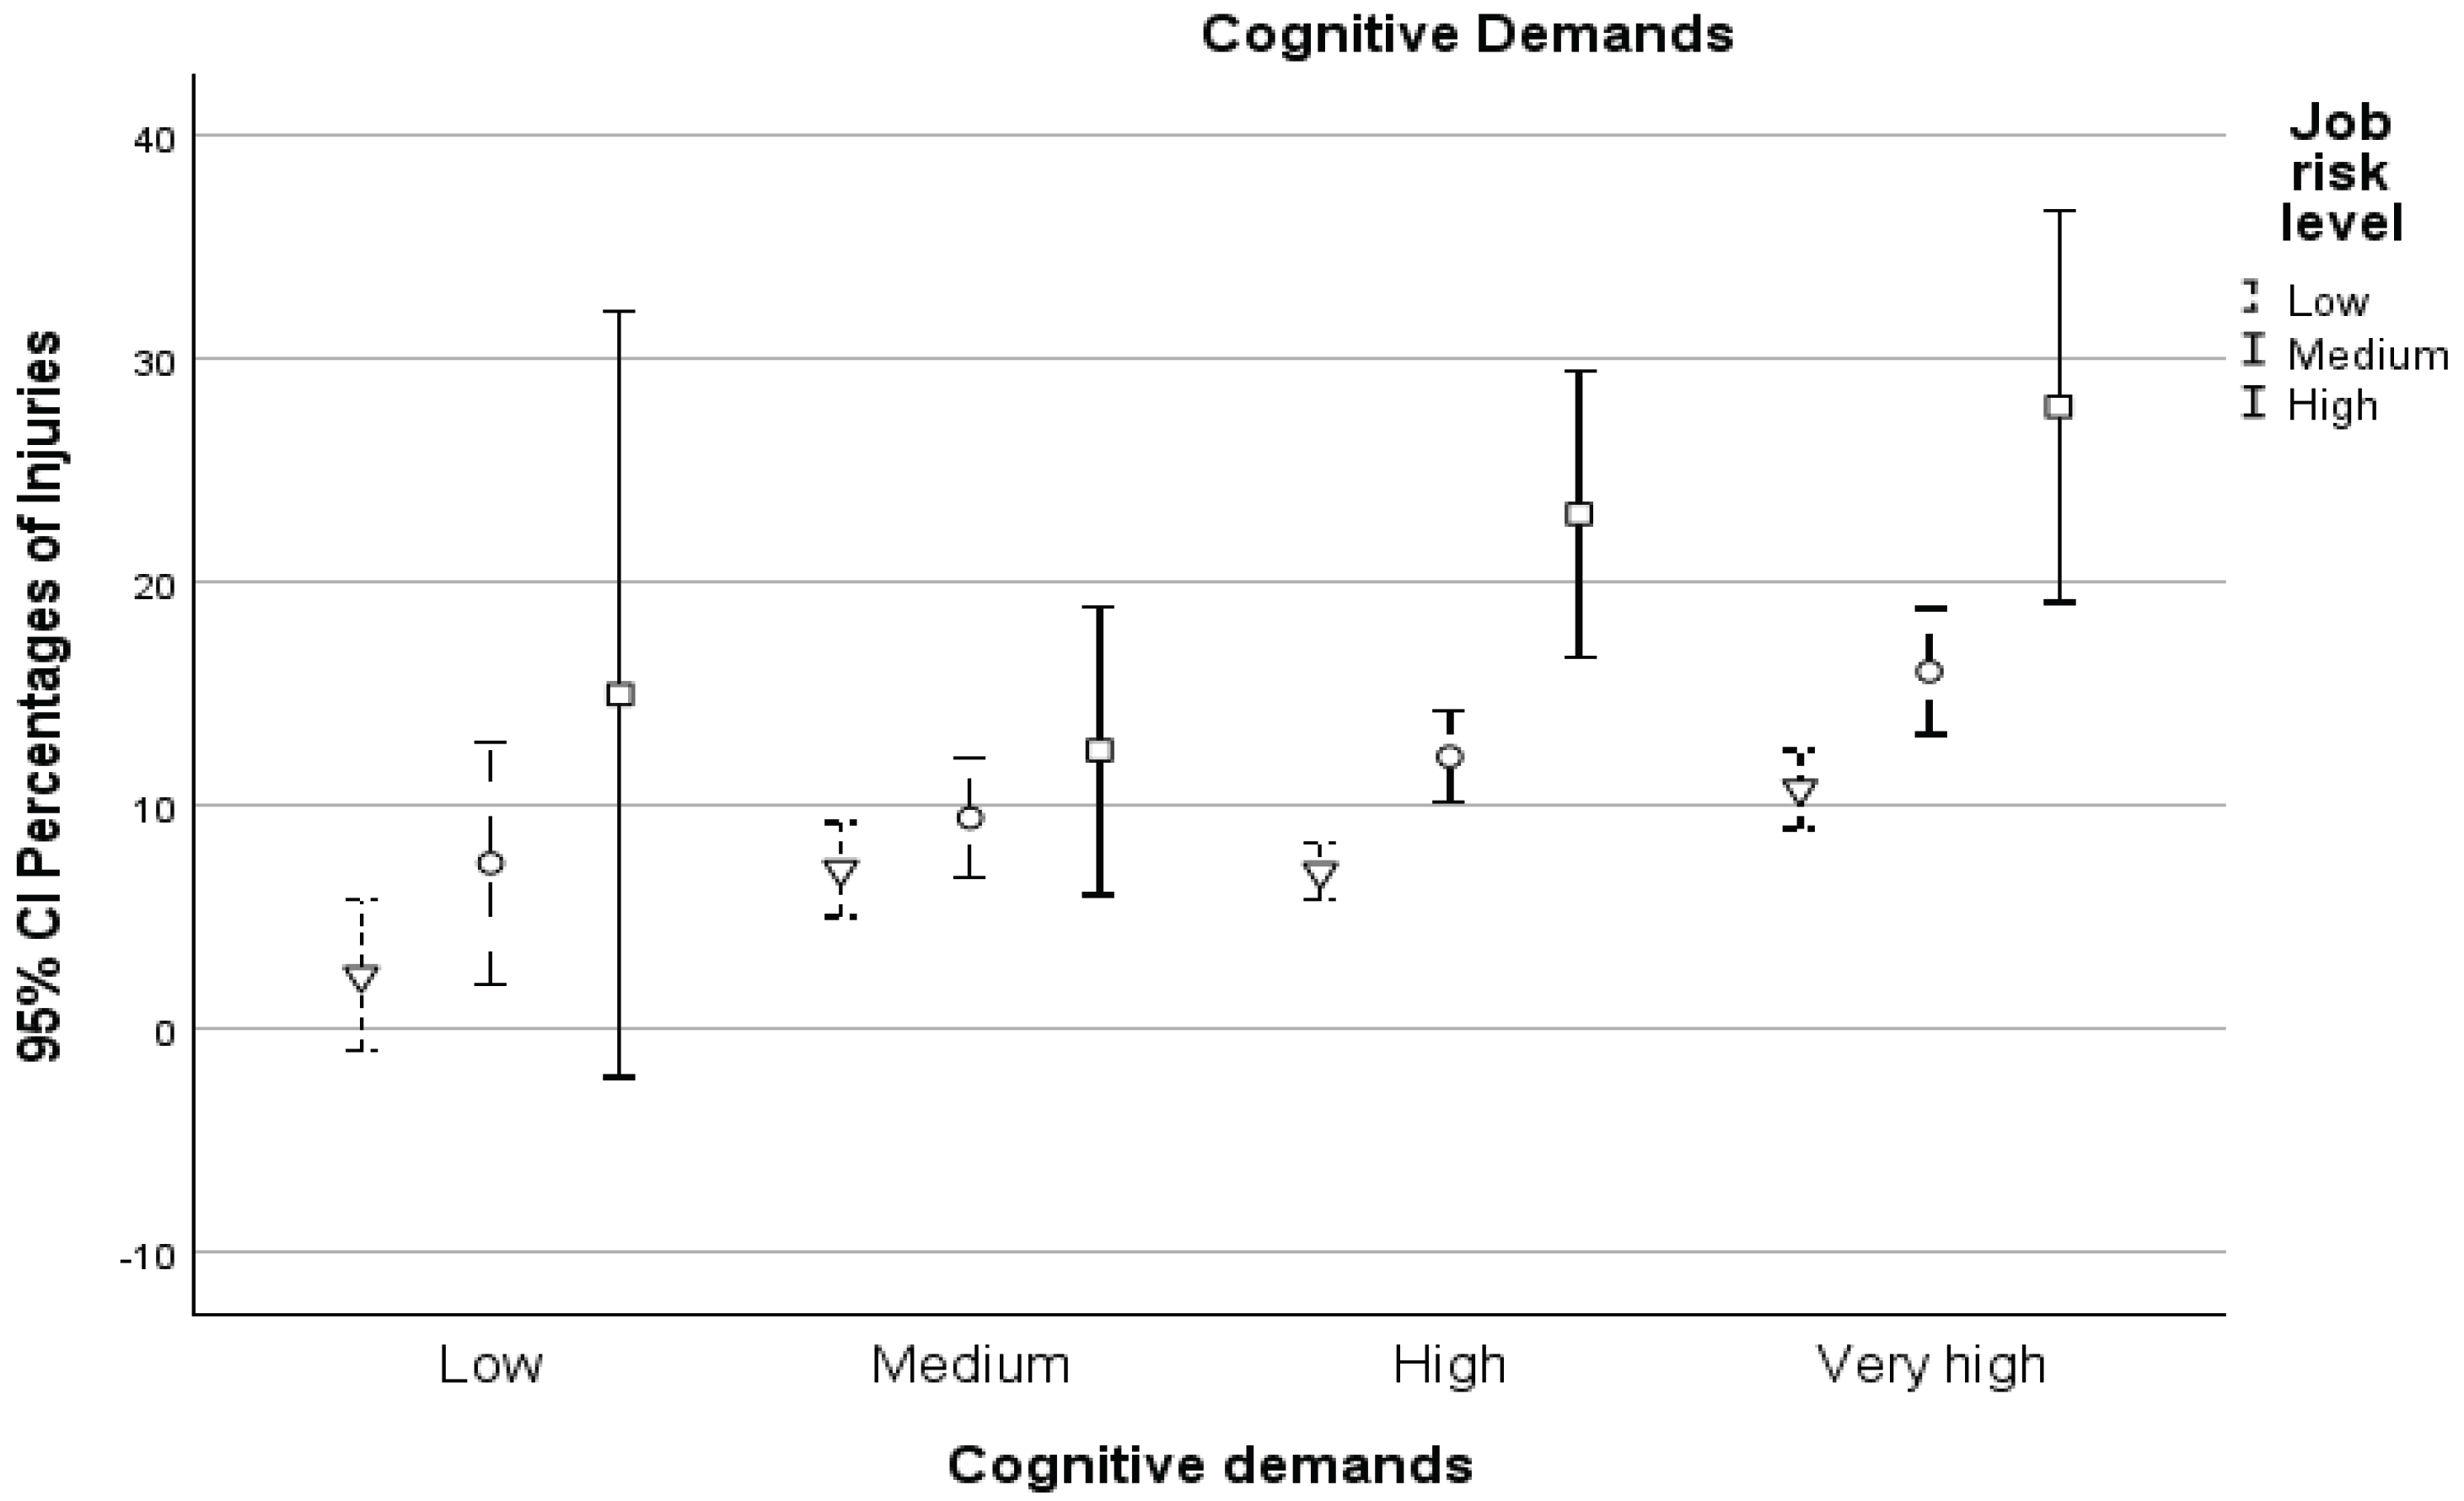
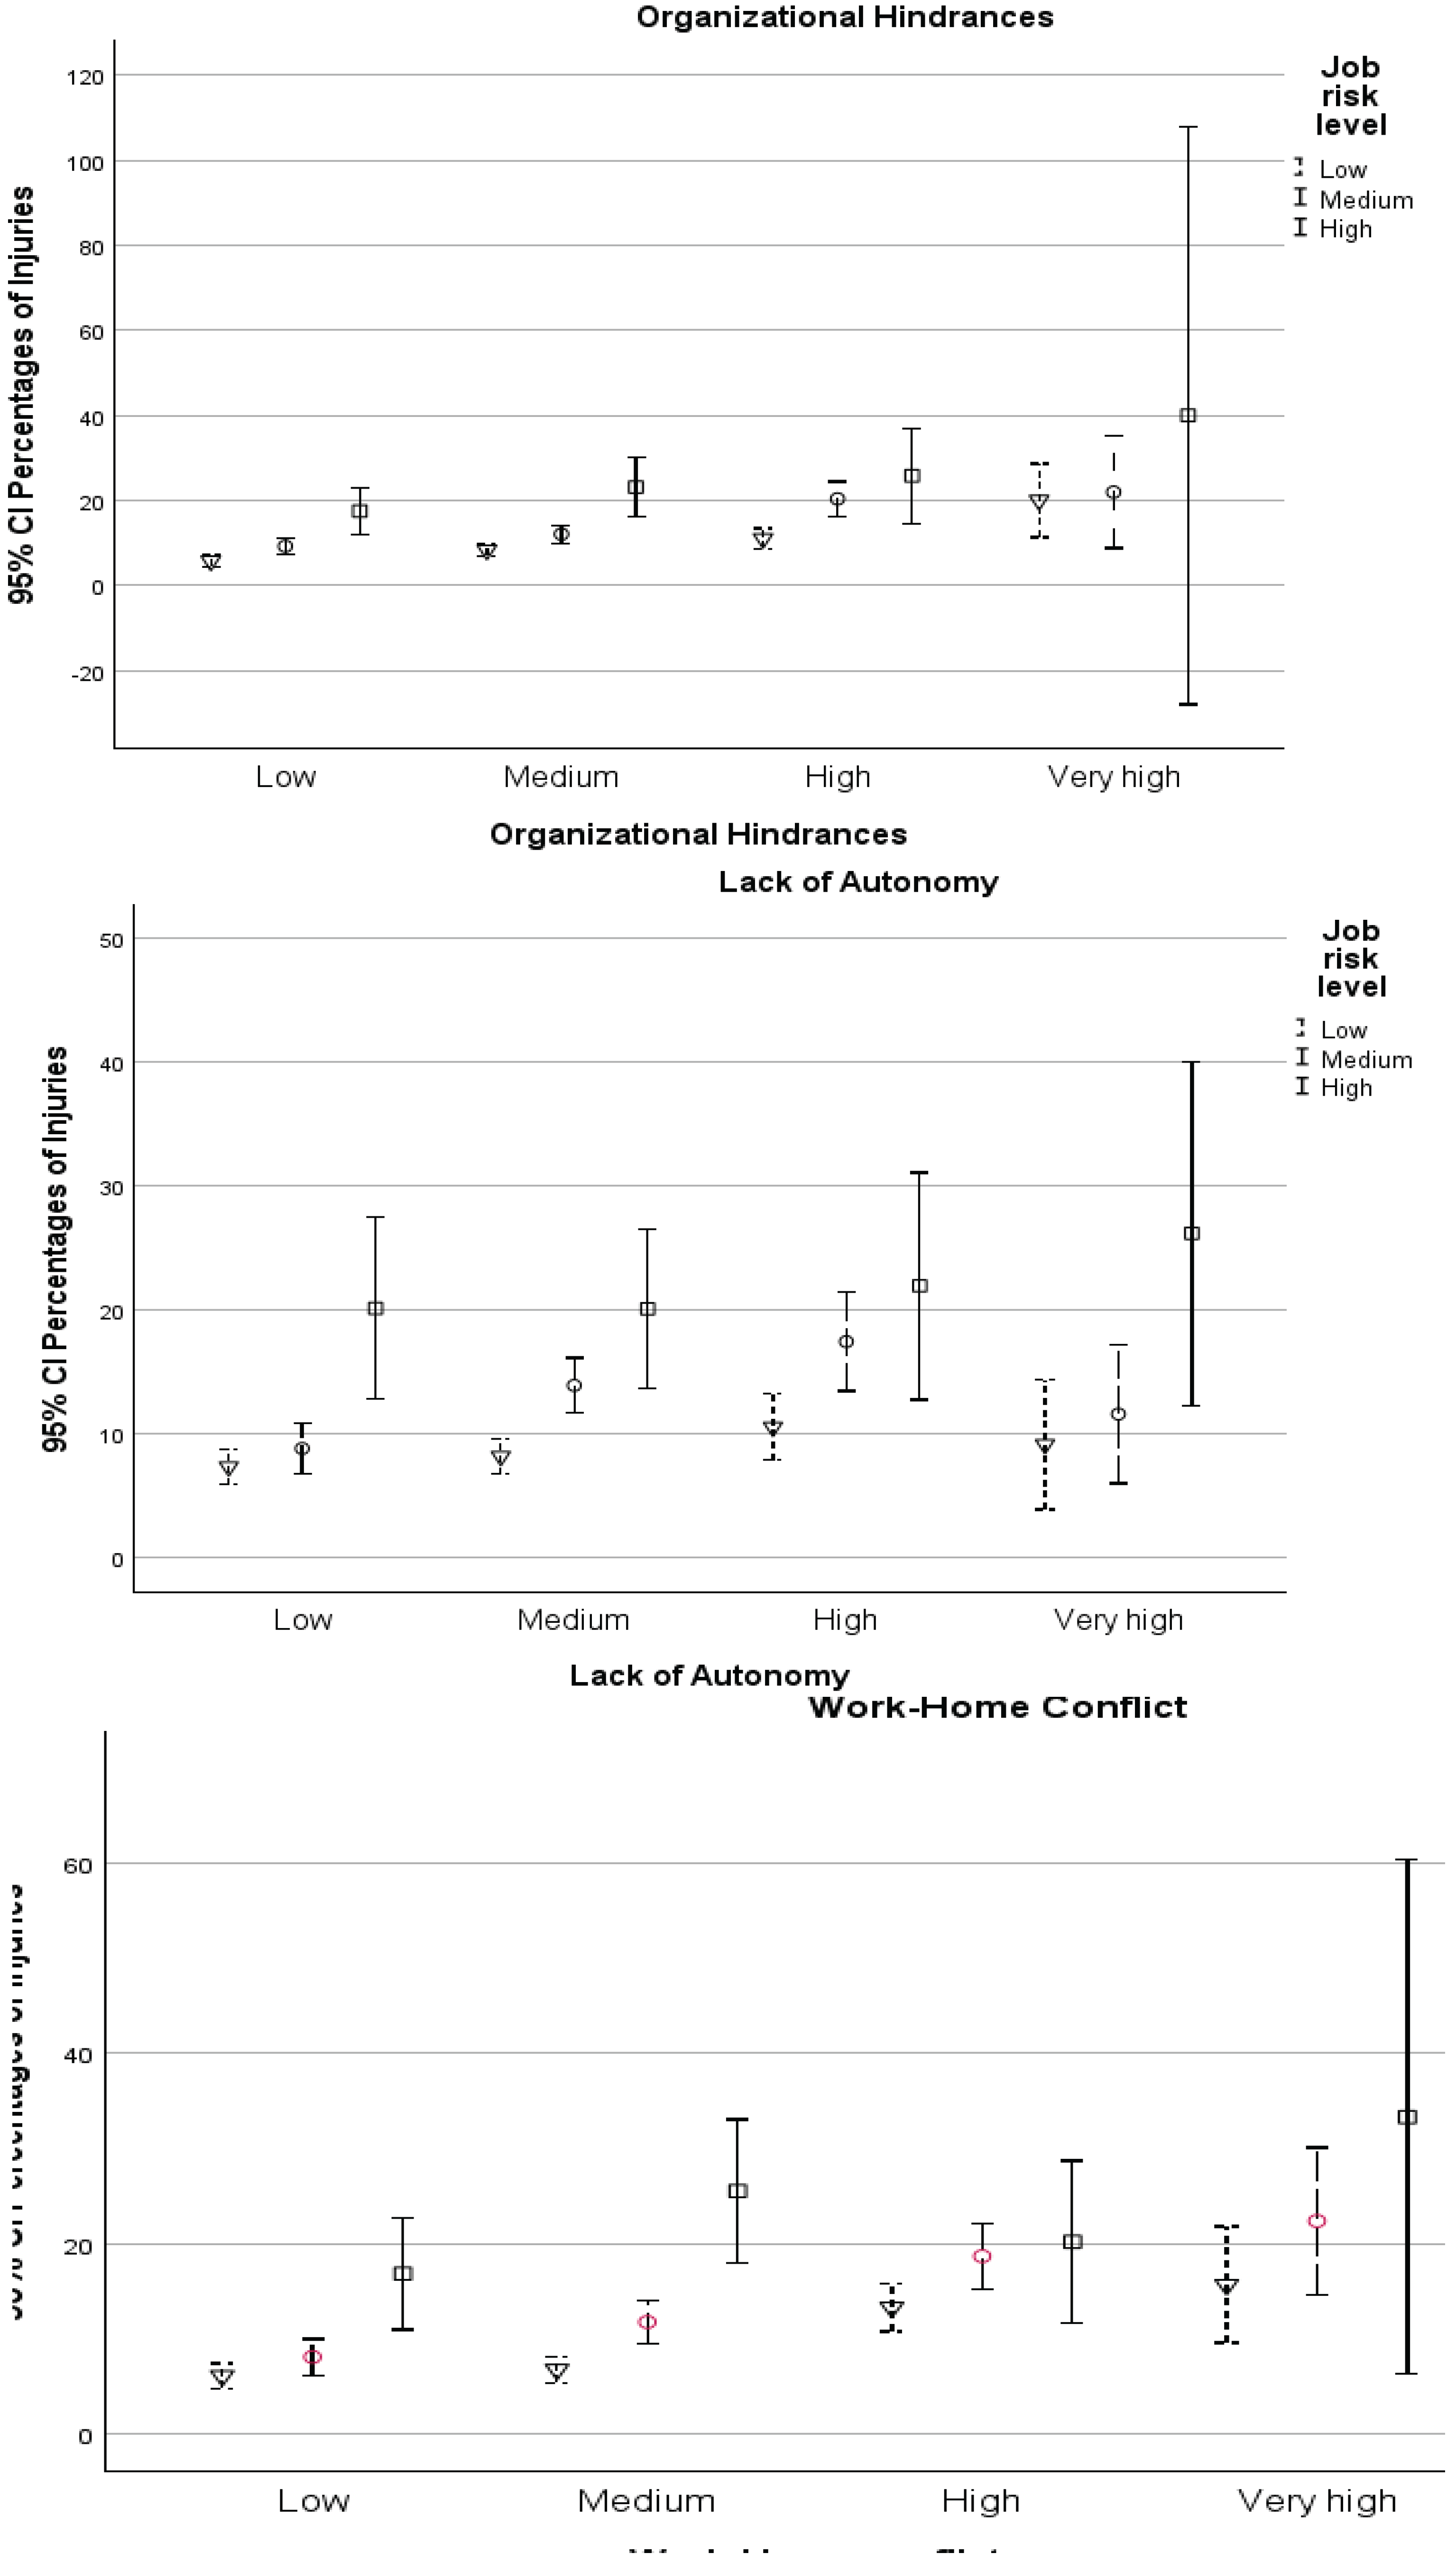
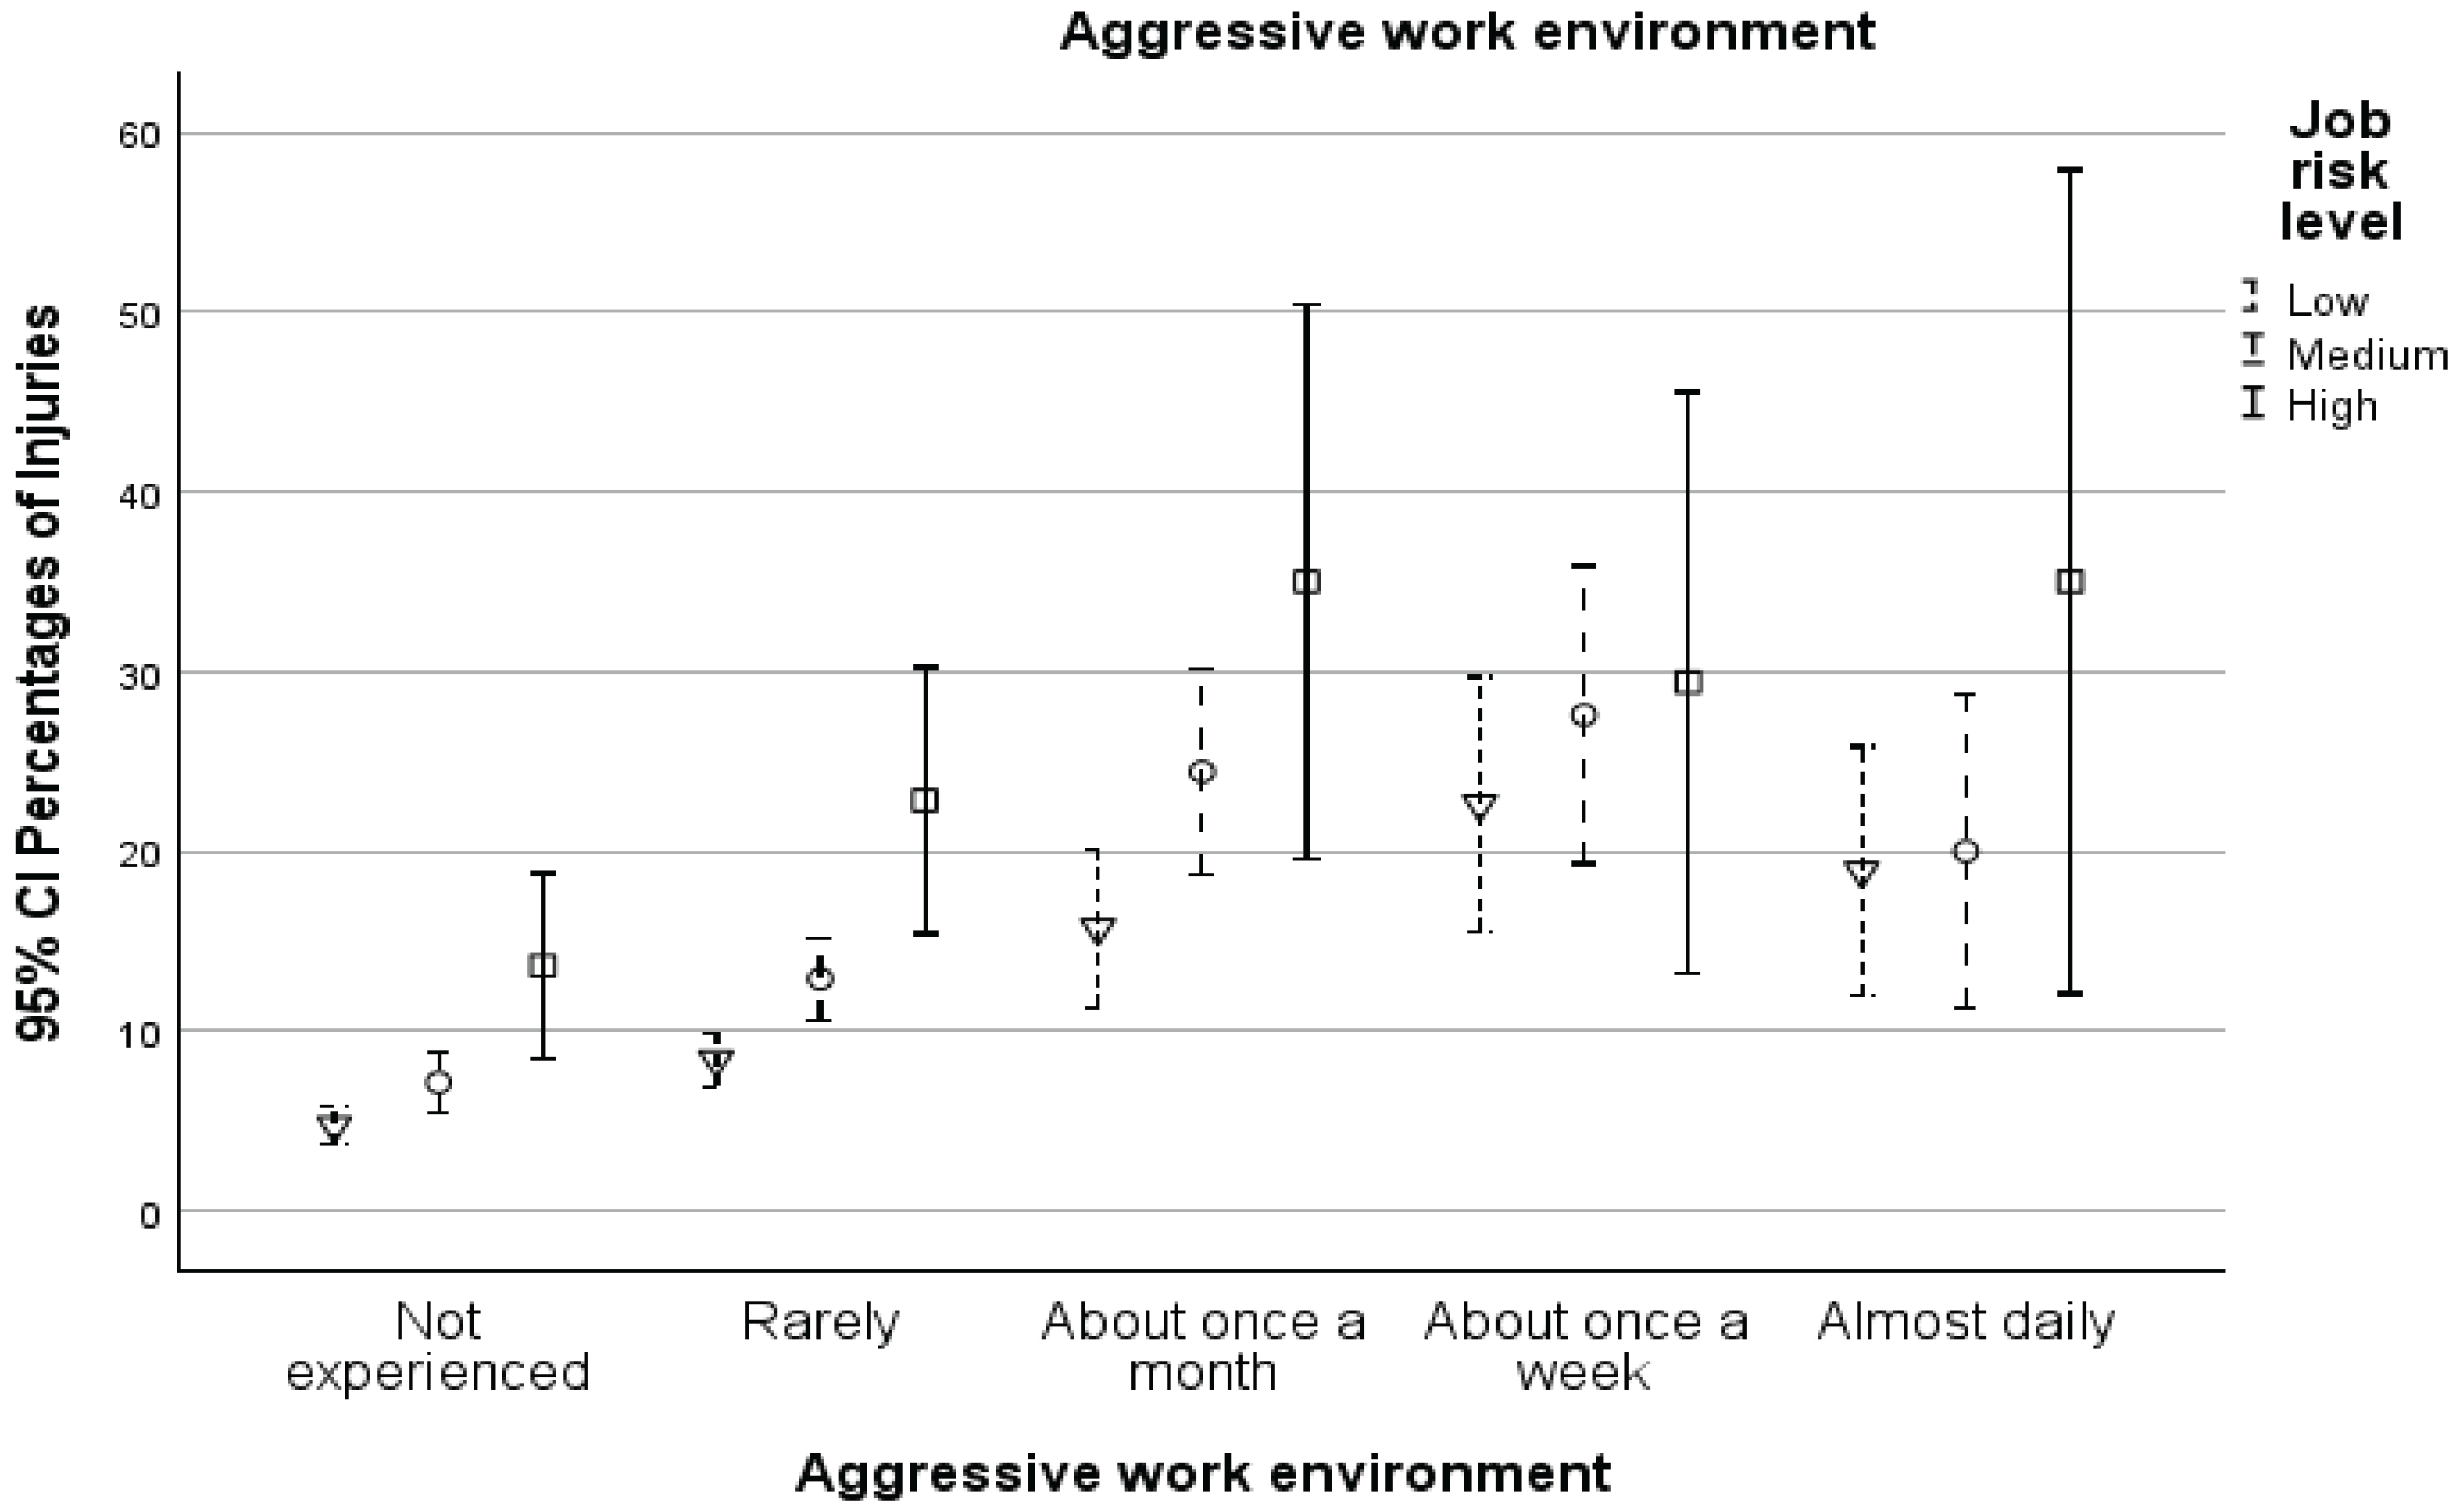

Table 1.
Demographic and employment factors—association with injuries.
| % injured In 2024 |
% injured in 2025 | Association with Injury Prevalence | |
|---|---|---|---|
| Gender | n.s | ||
| Men | 10.5 | 10.5 | |
| Women | 12.0 | 9.8 | |
| Age | n.s | ||
| 18–25 | 13.0 | 9.7 | |
| 26–35 | 11.4 | 9.7 | |
| 36–45 | 10.6 | 10.4 | |
| 46–55 | 11.7 | 10.7 | |
| 55–65 | 11.8 | 10.3 | |
| Above 65 | 8.0 | 8.1 | |
| Education | |||
| High school | 12.7 | 16.4 | 2024 ꭕ2 = 10.43, p = 0.034 2025 ꭕ2 = 15.71, p = 0.003 |
| High school exams | 13.7 | 12.4 | |
| Professional certificate | 13.3 | 11.5 | |
| Academic degree | 10.6 | 9.1 | |
| Master’s degree | 8.6 | 7.9 | |
| Income | |||
| Minimum wage | 19.9 | 14.0 | 2024 ꭕ2 = 30.27, p < 0.001 2025 ꭕ2 = 20.80, p < 0.001 |
| Up to Median | 10.6 | 11.4 | |
| Up to Average | 12.3 | 11.8 | |
| Above average | 11.2 | 8.3 | |
| Twice the average | 4.5 | 3.2 | |
| Do not want to indicate | 8.2 | 8.8 |
Table 2.
Prevalence of injuries for job risk level.
| % injured in 2024 | % injured in 2025 | |
|---|---|---|
| Low risk level | 9.1 (N = 154) | 7.5 (N = 126) |
| Medium risk | 13.2 (N = 149) | 11.9 (N = 127) |
| High risk level | 20.5 (N = 34) | 21.6 (N = 50) |
Table 3.
Percentages of participants reporting exposure levels for each psychosocial factor.
| Psychosocial Factor/Level | Cognitive Overload | Lack of Autonomy | Work-Home Conflict |
Organizational Hindrances | ||||
|---|---|---|---|---|---|---|---|---|
| 2024 | 2025 | 2024 | 2025 | 2024 | 2025 | 2024 | 2025 | |
| Low | 3.2 | 3.4 | 37.0 | 36.3 | 35.9 | 37.6 | 36.0 | 37.6 |
| Medium | 18.9 | 19.0 | 42.1 | 43.2 | 38.3 | 36.1 | 41.7 | 42.8 |
| High | 45.0 | 45.1 | 16.0 | 15.6 | 21.5 | 21.5 | 20.3 | 17.1 |
| Very high | 32.9 | 32.5 | 4.9 | 4.9 | 4.3 | 4.8 | 2.0 | 2.4 |
| 100.0 | 100.0 | 100.0 | 100.0 | 100.0 | 100.0 | 100.0 | 100.0 | |
Table 4.
Logistic regression of psychosocial factors with increased risk of injury for 2024 and 2025.
Table 4.
Logistic regression of psychosocial factors with increased risk of injury for 2024 and 2025.
| Variable | Year 2024 OR (95% CI) |
Year 2025 OR (95% CI) |
|---|---|---|
| (Intercept) | 0.07 (0.03, 0.17) | 0.08 (0.03, 0.21) |
| Sex (Man = 1, Women = 2) | 1.12 (0.86, 1.46) | 0.84 (0.67, 1.19) |
| Age | 1.08 (0.98, 1.20) | 1.09 (0.98, 1.21) |
| Income | 0.85 (0.75, 0.97) | 0.75 (0.66, 0.86) |
| Education | 0.90 (0.80, 1.00)* | 0.91 (0.81, 1.02)* |
| Risk Level of the job | 1.41 (1.15, 1.71) | 1.55 (1.27, 1.89) |
| Job (lack of) Autonomy | 1.15 (0.86, 1.54) | 1.28 (0.94, 1.74) |
| Cognitive Demands | 1.18 (0.90, 1.56) | 1.57 (1.17, 2.10) |
| Hindrances | 1.50 (1.08, 2.06) | 1.78 (1.26, 2.52) |
| Work-Home Conflict | 1.66 (1.22, 2.26) | 1.38 (0.99, 1.93)* |
| Aggressive environment | 1.99(1.41, 2.81) | 2.34 (1.63, 3.36) |
* P < 0.10. Degrees of freedom = 2680 (2024), 2611 (2025).
Table 5.
Logistic regression of long-term exposure to psychosocial factors associated with injuries.
Table 5.
Logistic regression of long-term exposure to psychosocial factors associated with injuries.
| Variable | Injuries on 2025 OR (95% CI) |
|---|---|
| (Intercept) | 0.09 (0.03, 0.23) |
| Gender (Man = 1, Women = 2) | 0.87 (0.66, 1.16) |
| Age | 1.10 (0.99, 1.22) |
| Job changes in 2025 | 1.74 (1.32, 2.29) |
| Income | 0.73 (0.64, 0.84) |
| Education | 0.91 (0.81, 1.02) |
| Risk Level of the job 2025 | 1.57 (1.28, 1.91) |
| Job (lack) Autonomy both 24–25 | 1.00 (0.67, 1.49) |
| Cognitive Demands both 24–25 | 1.50 (1.14,1.97) |
| Hindrances both 24–25 | 1.88 (1.21, 2.91) |
| Work-Home Conflict both 24–25 | 1.49 (0.98, 2.28)* |
| Aggressive environment both 24–25 | 2.83 (1.75, 4.59) |
* p = 0.06. DF = 2612.
Table 6.
Multiple logistic regression with the sum of psychosocial factors to predict the risk for work injury.
Table 6.
Multiple logistic regression with the sum of psychosocial factors to predict the risk for work injury.
| Variable | Injuries in 2025 OR (95% CI) |
|---|---|
| (Intercept) | 0.09 (0.03, 0.23) |
| Gender (Man = 1, Women = 2) | 0.87 (0.65, 1.14) |
| Age | 1.10 (0.99, 1.22) |
| Job changes in 2025 | 1.75 (1.33, 2.31) |
| Income | 0.73 (0.64, 0.83) |
| Education | 0.91 (0.81, 1.02) |
| Risk Level of the job 2025 | 1.56 (1.28, 1.90) |
| Sum of psychosocial factors (OR compared to zero) | |
| One | 1.69 (1.27,2.25) |
| Two | 2.21 (1.40, 3.48) |
| Three | 4.52 (1.98, 10.31) |
| Aggressive environment both 24–25 | 2.92 (1.75, 4.59) |
DF = 2612.
Disclaimer/Publisher’s Note: The statements, opinions and data contained in all publications are solely those of the individual author(s) and contributor(s) and not of MDPI and/or the editor(s). MDPI and/or the editor(s) disclaim responsibility for any injury to people or property resulting from any ideas, methods, instructions or products referred to in the content. |
© 2026 by the authors. Licensee MDPI, Basel, Switzerland. This article is an open access article distributed under the terms and conditions of the Creative Commons Attribution (CC BY) license (http://creativecommons.org/licenses/by/4.0/).
Copyright: This open access article is published under a Creative Commons CC BY 4.0 license, which permit the free download, distribution, and reuse, provided that the author and preprint are cited in any reuse.