
Submitted:
25 May 2026
Posted:
26 May 2026
You are already at the latest version
Abstract
The aim of this study was to identify genes whose expression levels influence both cardiometabolic and neurobehavioral traits. To achieve this, genome-wide association study (GWAS) data for cardiometabolic and neurobehavioral traits were integrated with expression quantitative trait loci (eQTL) data from the eQTLGen consortium. Following Mendelian randomization analysis, significant findings were further evaluated using eQTL data from the INTERVAL study. A total of 83 transcripts displaying pleiotropic effects (P < 5e-8) were identified. The genomic distribution of these transcripts was non-uniform. Chromosomal regions 3p21.31, the HLA region, 8p23.1, 14q11.2, 16p11.2, and 17q21.31 contained 55 of identified transcripts and accounted for 78% of observed associations. Investigating the function of these loci highlighted the contribution of immune, CNS and lifestyle factors to the co-occurrence of cardiometabolic and neurobehavioral traits. Among the neurobehavioral traits, educational attainment showed the highest number of significant genetic correlations with cardiometabolic traits.This study identified 83 transcripts contributing to the co-occurrence of cardiometabolic and neurobehavioral traits and provides a systematic analytical framework for investigating genes underlying the co-occurrence of complex phenotypes.
Keywords:
pleiotropy
; cardiometabolic traits
; neurobehavioral traits
; eQTL
; mendelian randomization
; analytical framework
Introduction
One important line of evidence emerging from genomic studies is the presence of pleiotropic SNPs shared between seemingly distinct diseases. This finding has changed the traditional model of “unique malady–unique set of broken genes” into the diseasome model [1] that considers human diseases not as isolated clinical entities, but as an interconnected web of shared genetic origins and biological processes. The presence of shared genes among diseases has raised several possibilities for future applications. The degree of genetic overlap between diseases may provide a basis for disease classification and offer insight into comorbidities observed at the population level. Identification of pleiotropic genes also creates new opportunities for drug repurposing and therapeutic development. Furthermore, investigation of pleiotropic genes is important from an evolutionary perspective because such genes may exhibit greater persistence across generations and may be less likely to undergo purifying selection, particularly when they display antagonistic pleiotropic effects.
Previous studies have documented the co-occurrence of cardiometabolic and neurobehavioral traits within the same individuals, and several biological mechanisms have been proposed to explain this relationship [2,3,4,5]. Systemic low-grade inflammation promotes atherosclerosis and insulin resistance and may also disrupt neurotransmitter systems involved in mood regulation. The hypothalamic-pituitary-adrenal (HPA) axis, which regulates stress responses as well as metabolism, blood pressure, brain function, and immune activity, has also been implicated in both cardiometabolic and neurobehavioral traits. In addition, shared regulatory networks involved in lipid and glucose metabolism in both the brain and peripheral tissues, as well as neural processes such as reward signaling and synaptic plasticity, have been studied in this context [2,3,4,5]. Nonetheless, these insights mainly drawn from physiological and GWAS studies. With the availability of functional data from QTL mapping studies, it is possible to more systematically and precisely search for pleiotropic genes contributing to these conditions. Another development in this field is the existence of QTL data from independent studies. This enables conducting validation analyses in order to lower the likelihood of false positives.
Building upon these progresses, the aim of this study was to integrate the GWAS data for neurobehavioral and cardiometabolic conditions with eQTL data from independent studies in order to identify transcripts influencing these traits. In the methods section, the nature of the data and the analysis plan used to generate the results are reviewed.
Methods
Figure 1 provides an overview of the analysis plan used in this study to identify genes with pleiotropic effects on cardiometabolic and neurobehavioral traits. Initially, GWAS summary statistics for these conditions were obtained by surveying previous studies. Next, a search was conducted to identify SNPs with pleiotropic effect (P<5e-8). The outcome of search identified pleiotropic SNPs between 12 cardiometabolic and 8 neurobehavioral traits. General characteristics of GWAS data for these traits are summarized in Table S1. eQTL data were obtained from the eQTLGen study in which the authors reported GWAS summary statistics for 19,960 transcripts measured in blood samples of 31,684 individuals. The authors generated the results by performing meta-analysis of eQTL data from 37 independent studies. Next, Mendelian randomization was performed using GSMR tool [6] to test the association between the identified transcripts and the traits. As compared to other tools, GSMR provides higher statistical power because it takes into account the linkage disequilibrium among the SNPs and standard errors around their effect sizes [6]. Significant findings from MR analysis were once more re-investigated using eQTL data from the INTERVAL study in which the authors reported eQTLs for 15,298 transcripts measured in blood samples obtained from 4,732 participants of European ancestry [7].
To address the possible bias attributed to the source of eQTL data (blood) in the discovery and the validation step, eQTL data from the BrainMeta study [8] were obtained and their pleiotropic effect on cardiometabolic and neurobehavioral traits were re-investigated using the analysis plan (Figure 1). In the BrainMeta study, the authors investigated the genetics of transcriptome using brain cortex samples from 2,443 individuals of European ancestry and consequently provided eQTLs for 16,974 transcripts.
DAVID functional annotation tool [9] was used to conduct gene ontology (GO) enrichment analysis based on biological processes. The tool compares the input gene set against the genome to determine whether particular biological processes occur more frequently than expected by chance. Furthermore, to gain insight into the function of a chromosome band, a PheWAS analysis was conducted by examining the influence of its genes on 6 categories of traits including blood, physical measure, cancer, immune, CNS, and lifestyle traits and comparing the ratio of significant findings (P<5e-8) to the expected ratio under the null. Each category was made of 10 traits selected from the UK Biobank (Table S2). Mendelian randomization was used to test if a gene has significant influence on a trait. Data from PhenomeXcan [10] was also surveyed to gain additional insight into the function of a gene. PhenomeXcan is a repertoire of gene expression–trait associations derived by joint analysis of data from the GTEX and the UK Biobank projects.
HDL package (implemented in R) was used to estimate the genetic correlation between pairs of traits using genome-wide GWAS summary statistics. The method compares the pattern of genetic associations across the genome between two traits to determine the extent to which they share common genetic influences. HDL also incorporates linkage disequilibrium (LD) information from a reference panel, allowing more accurate estimation of genetic correlation. For this study, the UK Biobank imputed HapMap3 reference panel provided by the authors was used.
Results
By jointly analyzing the GWAS data, initially, I calculated the degree of genetic correlation (rg) between cardiometabolic and neurobehavioral traits. This analysis uses information from all SNPs to judge the overall relation between two traits. The outcome of analysis revealed there are significant correlations (P<0.05) between majority of traits (Table S3); however, the magnitude of correlations were modest ranged from -0.34 to 0.21, (Figure 2a). In average, the genetic correlation between cardiometabolic and neurobehavioral traits was |rg|=0.07 (95% CI=0.06, 0.08, Table S3). Mapping significant correlations (P<0.05, 0.05<|rg|<0.34) indicated all studied traits are related as they aggregated into a network (Figure 2b). In this network, educational attainment (years of education) had the highest number of interactions with cardiometabolic traits (N=10, Table S3).
By following the analysis plan described in Figure 1, 145 transcripts that showed significant effect on cardiometabolic and neurobehavioral traits were identified at the discovery stage. By selecting these transcripts, I re-investigated their pleiotropic effects using eQTL data from the INTERVAL study. The outcome of analysis confirmed the pleiotropic effect of 83 transcripts (Table S4). The distribution of the identified transcripts across the genome was non-uniform. There were aggregations of transcripts on chromosome bands, 3p21.31, the HLA region, 8p23.1, 14q11.2, 16p11.2 and 17q21.31. These regions contained 55 of identified transcripts and accounted for 78% of observed associations. To investigate the function of these regions (chromosome bands), I investigated their impact on phenome by testing association of their genes with 6 categories of traits selected from UK Biobank (Table S2). The outcome of analysis is presented in Table 1. All examined regions showed significant association with blood traits, which is expected considering the RNAs were extracted from the blood; however, genes at the HLA and 14q11.2 region showed significant influence on immune cells; whereas, genes at 3p21.31 showed significant influence on lifestyle traits and genes at 8p23.1 showed significant influence on CNS traits. The association between the HLA and 14q11.2 is expected considering both genomic regions are fundamental to the function of immune system. The 3p21.31 region is known as the site where lifestyle risk factors for coronary artery disease converge [11]. 8p23.1 is a structurally complex region, chromosome rearrangement in this region is reported to cause neurodevelopmental and neurobehavioral issues [12].
The main contributors to RNA obtained from blood are leukocytes. This could bias the results toward immune processes. As such, to investigate the possibility of such a bias, I repeated the analyses by investigating eQTL data from brain. For this purpose, I obtained eQTL data from the BrainMeta study [8] and applied the same procedure (Figure 1) to find transcripts that are shared between cardiometabolic and neurobehavioral traits. A total of 44 significant associations (P<5e-8, Table S5) between cardiometabolic and neurobehavioral traits were identified. 41% of observed associations were located in the HLA region. Furthermore, the outcome of functional analysis significantly pointed to immune related processes (Table 2). I also investigated the contribution of gene-trait pairs from the initial results (based on blood eQTLs, Table S4) in the BrainMeta study (based on brain eQTLs). The outcome of analysis generated results for 50 gene-trait pairs and the observed direction of effects were consistent for 43 pairs (Table S6) and the results reached GWAS significance for 29 gene-trait pairs (Table 3). Apart from LRRIQ3 and RPS26, the remaining genes were located in chromosome bands indicated in Table 2. Limited functional information is currently available for LRRIQ3 and RPS26. LRRIQ3 is a Leucine-Rich Repeat and IQ Domain-Containing Protein 3, while RPS26 encodes small ribosomal subunit protein ES26. Examining the function of these genes in the PhenomeXcan database [10] confirmed higher expression of LRRIQ3 is negatively associated with educational attainment (P=1.4e-9) and body size (P=3.6e-6); while higher expression of RPS26 is associated with higher body impedance (P=9.2e-13).
Discussion
In this study, an analysis workflow was devised to identify genes whose expression levels influence both cardiometabolic and neurobehavioral traits. By integrating GWAS and eQTL data, through two step discovery and validation analysis, 83 pleiotropic genes were identified. The distribution of genes across the genome was not even. There was an aggregation of genes on several chromosome bands including 3p21.31, the HLA region, 8p23.1, 14q11.2, 16p11.2 and 17q21.31.
Thirty of transcripts were located on the HLA and 14q11.2 region. HLA is the most important genomic region for the function of immune system. 14q11.2 also is important in this regard. It is the location of T-cell receptors which enable T-cells to identify invaders. Further investigation using eQTL data from the BrainMeta study confirmed the contribution of genes with immune function to the pleiotropy of cardiometabolic and neurobehavioral traits. It is known that chronic low-grade inflammation, characterized by increased cytokine signaling such as IL-6, TNF-α, and CRP, contributes to insulin resistance, obesity, atherosclerosis, and vascular dysfunction while simultaneously influencing neuroinflammation, neurotransmitter metabolism, synaptic plasticity, and cognitive function. [13,14] Previously, Baltramonaityte et al. [15] conducted a multivariate genome-wide association study to identify SNPs contributing to multimorbidity of psycho-cardiometabolic. The authors reported significant enrichment of identified SNPs in immune and inflammatory pathways. In another study, by examining the genetics data from UK Biobank, Hayman et al. [2] reported association signals for metabolic, cardiovascular and neurobehavioral traits in the HLA region. By investigating the function of the identified SNPs in the GTEX database, the authors highlighted the role of 5 genes that might contribute to the shared biology of cardiometabolic and neurobehavioral traits. Two of these genes, ATF6B and C4A are also identified in this study. Altogether these findings support the notion that the dysregulation of immune system contributes to the pathogenesis of cardiometabolic and neurobehavior disorders.
Traditionally, HPA axis is considered as the bridge between environmental cues and the internal response. Perceived environmental stressors increase synthesis and release of hypothalamic corticotropin releasing factor (CRF) into blood circulation. This triggers a cascade of change including altering appetite, feeling and immune activity to keep the internal homeostasis. In this study, I identified higher levels of CRHR1IT1 that encodes an antisense RNA for Corticotropin-releasing hormone receptor 1 (CRHR1) to be associated with higher risk of obesity and higher neuroticism score (Table S4). CRHR1 is located at 17q21.31 which is known for its influence on cognitive, psychiatric or neurodevelopmental disorders as well as disease of autoimmune origin [16,17,18].
A line of evidence from previous studies also highlighted the role of lifestyle habits in shaping health outcomes. According to this notion, the sensitivity of neural processes to environmental factors can influence behavioral and lifestyle choices through their effects on cognition, reward processing, stress response, and emotional regulation. Over time, these established lifestyle habits contribute to long-term health outcomes [4,3,19]. Consistent with this notion, in this study, genes at genomic hubs, 3p21.13 and 8p23.1 showed significant association with lifestyle and CNS traits. 3p21.31 is known for its contribution to the severity of SARS-CoV-2 infection [20]. Furthermore, it is reported as a region where lifestyle traits contributing to the risk of coronary artery disease converge at. 8p23.1 contains important immune, metabolic, developmental, and sensory-related genes. In this study, I identified genes MFHAS1, RP11-62H7.2, and SLC35G5 in this region that showed significant association with diverse categories of cardiometabolic traits and negative affectivity. Not much is known about the function of RP11-62H7.2, and SLC35G5, but MFHAS1 is an immune-regulatory protein; it is involved in cellular stress responses and inflammatory signaling. Furthermore, among the identified genes in this study, this gene had the highest number of associations with studied traits, it also showed antagonistic pleiotropic effect. Higher expression of it contributed to favorable cardiometabolic outcomes but it also displayed negative impact on mental health (Table S4). As such, finding a threshold that balances the pleiotropic effect of this gene is important for therapeutic purposes.
How the findings from this study relate to one another remains an open question. A hypothetical model for this purpose is provided in Figure 3. It is assumed that environmental factors such as stressors, incentives and learnings influence neural processes such as HPA axis, reward pathway and synaptic plasticity. This consequently contributes to behavior and lifestyle habits that a person chooses including sleep, diet, exercise, substance use, and social interaction. In the long term, these choices influence immune system. Change in the activity of immune system eventually influences the body and contributes to health outcomes including cardiometabolic and neurobehavioral outcomes.
This study was possible because of availability of eQTL data from independent studies. However, it has limitations that future studies can further improve. The eQTL data used in this study were mainly cis-eQTLs, this limits the possibility of conducting interaction analysis in order to prioritize the identified genes and pinpoint those that act as hub and as such are more valuable for therapeutic targeting. Furthermore, it would be important to re-conduct future analyses using QTL data from diverse tissues in order to identify the tissues from which a pleiotropic gene exerts its influence.
In summary, by integrating the publicly available data, through two step discovery and validation analysis, this study reported a list of pleiotropic genes influencing cardiometabolic and neurobehavioral traits. The identified genes tended to aggregate in particular genomic regions and functional analysis indicated the pleiotropy between cardiometabolic and neurobehavioral traits likely originates from several inter-connected sources including lifestyle choices, neural and immune processes. The analysis plan described in this study provides a workflow to systematically investigate genes contributing to co-occurrence of phenotypes.
Supplementary Materials
The following supporting information can be downloaded at the website of this paper posted on Preprints.org.
Funding
This research received no funding.
Institutional Review Board Statement
Not applicable.
Data Availability Statement
Summary association statistics for 83 transcripts identified in this study are provided in supplementary Table S4.
Acknowledgments
This research work was enabled in part by computational resources and support provided by the Compute Ontario and the Digital Research Alliance of Canada.
Competing interests
The author declares no competing interests.
References
- Goh, K.-I. et al. The human disease network. Proc. Natl. Acad. Sci. U. S. A. 104, 8685–8690 (2007).
- Hayman, M. et al. Genetic architecture of the HLA/MHC locus in cardiometabolic disease, severe mental illness, and related traits. 2023. Preprint at . [CrossRef]
- Otobo, E. et al. Depression, Anxiety, and Bipolar Disorder and Atherosclerosis. Curr. Atheroscler. Rep. 28, 41 (2026).
- Nikpay, M. et al. Genetic mapping of habitual substance use, obesity-related traits, responses to mental and physical stress, and heart rate and blood pressure measurements reveals shared genes that are overrepresented in the neural synapse. Hypertens. Res. Off. J. Jpn. Soc. Hypertens. 35, 585–591 (2012).
- Miller, A. H. & Raison, C. L. The role of inflammation in depression: from evolutionary imperative to modern treatment target. Nat. Rev. Immunol. 16, 22–34 (2016).
- Zhu, Z. et al. Causal associations between risk factors and common diseases inferred from GWAS summary data. Nat. Commun. 9, 224 (2018).
- Xu, Y. et al. An atlas of genetic scores to predict multi-omic traits. Nature 616, 123–131 (2023).
- Qi, T. et al. Genetic control of RNA splicing and its distinct role in complex trait variation. Nat. Genet. 54, 1355–1363 (2022).
- Huang, D. W., Sherman, B. T. & Lempicki, R. A. Systematic and integrative analysis of large gene lists using DAVID bioinformatics resources. Nat. Protoc. 4, 44–57 (2009).
- Pividori, M. et al. PhenomeXcan: Mapping the genome to the phenome through the transcriptome. Sci. Adv. 6, eaba2083 (2020).
- Nikpay, M. & McPherson, R. Convergence of biomarkers and risk factor trait loci of coronary artery disease at 3p21.31 and HLA region. Npj Genomic Med. 6, 12 (2021).
- Okur, V. et al. Clinical and genomic characterization of 8p cytogenomic disorders. Genet. Med. 23, 2342–2351 (2021).
- Hotamisligil, G. S. Inflammation and metabolic disorders. Nature 444, 860–867 (2006).
- Miller, A. H. & Raison, C. L. The role of inflammation in depression: from evolutionary imperative to modern treatment target. Nat. Rev. Immunol. 16, 22–34 (2016).
- Baltramonaityte, V. et al. A multivariate genome-wide association study of psycho-cardiometabolic multimorbidity. PLOS Genet. 19, e1010508 (2023).
- Koolen, D. A. et al. Mutations in the chromatin modifier gene KANSL1 cause the 17q21.31 microdeletion syndrome. Nat. Genet. 44, 639–641 (2012).
- Harerimana, N. V., Goate, A. M. & Bowles, K. R. The influence of 17q21.31 and APOE genetic ancestry on neurodegenerative disease risk. Front. Aging Neurosci. 14, 1021918 (2022).
- Saarah, P. et al. Shared genetic and neuroimmune architecture links type 1 diabetes with neurocognitive traits. Nat. Commun. 17, 4057 (2026).
- World Health Organization. Everyday actions for better health – WHO recommendations. https://www.who.int/europe/news-room/fact-sheets/item/everyday-actions-for-better-health-who-recommendations (2025).
- Zeberg, H. & Pääbo, S. The major genetic risk factor for severe COVID-19 is inherited from Neanderthals. Nature 587, 610–612 (2020).
Figure 1.
Analysis pipeline that was used to search for pleiotropic genes influencing cardiometabolic and neurobehavioral traits. Initially, a search was performed to identify SNPs that show pleiotropic effect (P<5e-8) on cardiometabolic and neurobehavioral traits and also act as eQTL (P<5e-8) in eQTLGen database. Next, Mendelian randomization was used to test the association between transcripts and cardiometabolic/ cardiometabolic and neurobehavioral traits tagged by SNPs. Significant findings from this step were once more re-investigated using eQTL data from the INTERVAL study. Finally, functional analysis was performed to understand the nature of identified genes.
Figure 1.
Analysis pipeline that was used to search for pleiotropic genes influencing cardiometabolic and neurobehavioral traits. Initially, a search was performed to identify SNPs that show pleiotropic effect (P<5e-8) on cardiometabolic and neurobehavioral traits and also act as eQTL (P<5e-8) in eQTLGen database. Next, Mendelian randomization was used to test the association between transcripts and cardiometabolic/ cardiometabolic and neurobehavioral traits tagged by SNPs. Significant findings from this step were once more re-investigated using eQTL data from the INTERVAL study. Finally, functional analysis was performed to understand the nature of identified genes.
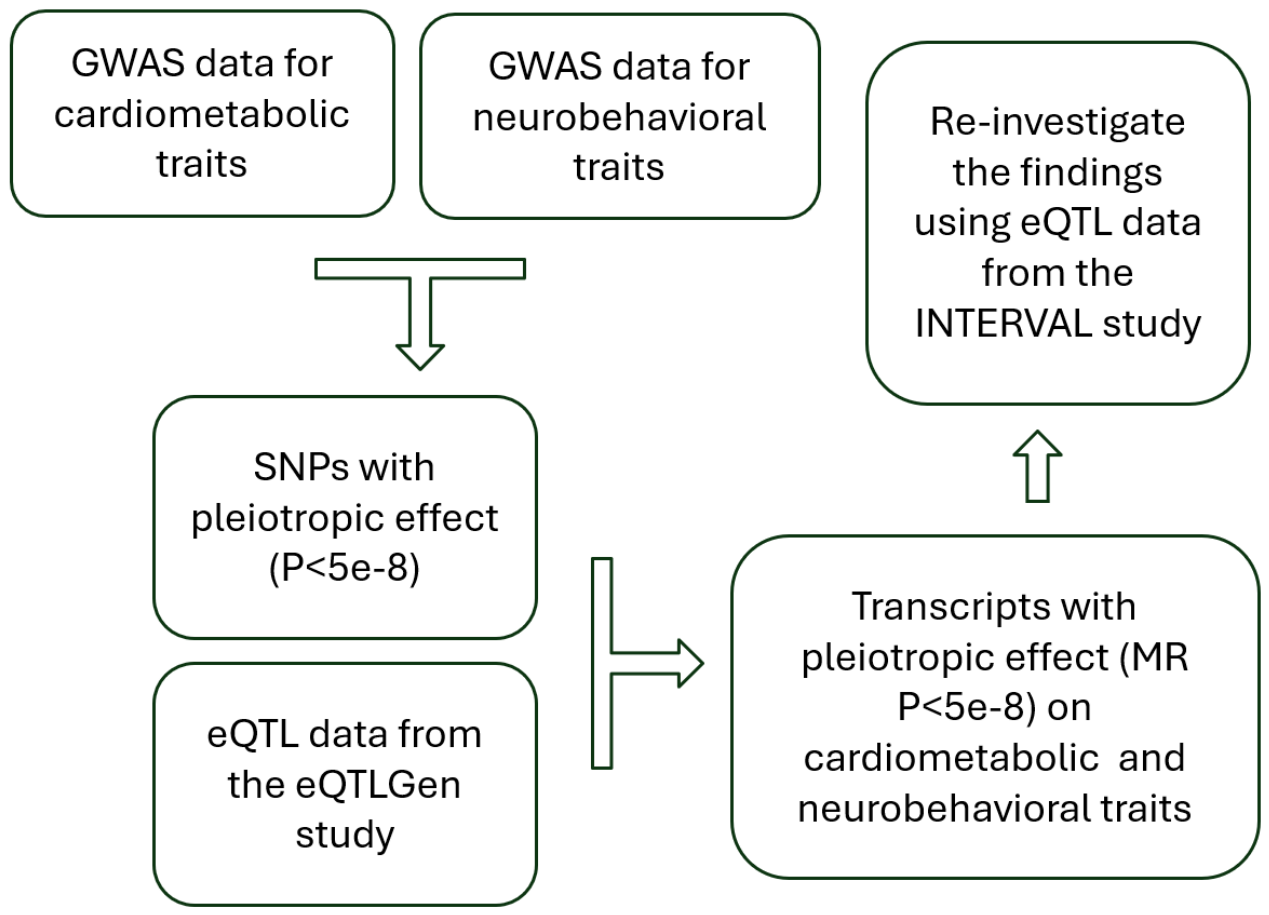
Figure 2.
Evidence of genetic correlation between cardiometabolic and neurobehavioral traits. a) The outcome of genetic correlation analysis indicates, to varying degree cardiometabolic and neurobehavioral traits are related (-0.34 ≤ rg ≤ 0.21). Statistical details are provided in S3 Table. Plot was generated using the corrplot package in R software. b) Traits that showed significant correlation (P<0.05, 0.05<|rg|<0.34) aggregated into a network of interacting traits. In this network, years of education showed the highest number of connections with cardiometabolic traits. The line widths represent the magnitude of correlations between the traits. The dashed line indicates positive correlation and the solid line indicates negative correlation. Cardiometabolic traits are displayed with circles and neurobehavioral traits are displayed with rectangles. Cystoscape software was used to generate the plot.
Figure 2.
Evidence of genetic correlation between cardiometabolic and neurobehavioral traits. a) The outcome of genetic correlation analysis indicates, to varying degree cardiometabolic and neurobehavioral traits are related (-0.34 ≤ rg ≤ 0.21). Statistical details are provided in S3 Table. Plot was generated using the corrplot package in R software. b) Traits that showed significant correlation (P<0.05, 0.05<|rg|<0.34) aggregated into a network of interacting traits. In this network, years of education showed the highest number of connections with cardiometabolic traits. The line widths represent the magnitude of correlations between the traits. The dashed line indicates positive correlation and the solid line indicates negative correlation. Cardiometabolic traits are displayed with circles and neurobehavioral traits are displayed with rectangles. Cystoscape software was used to generate the plot.
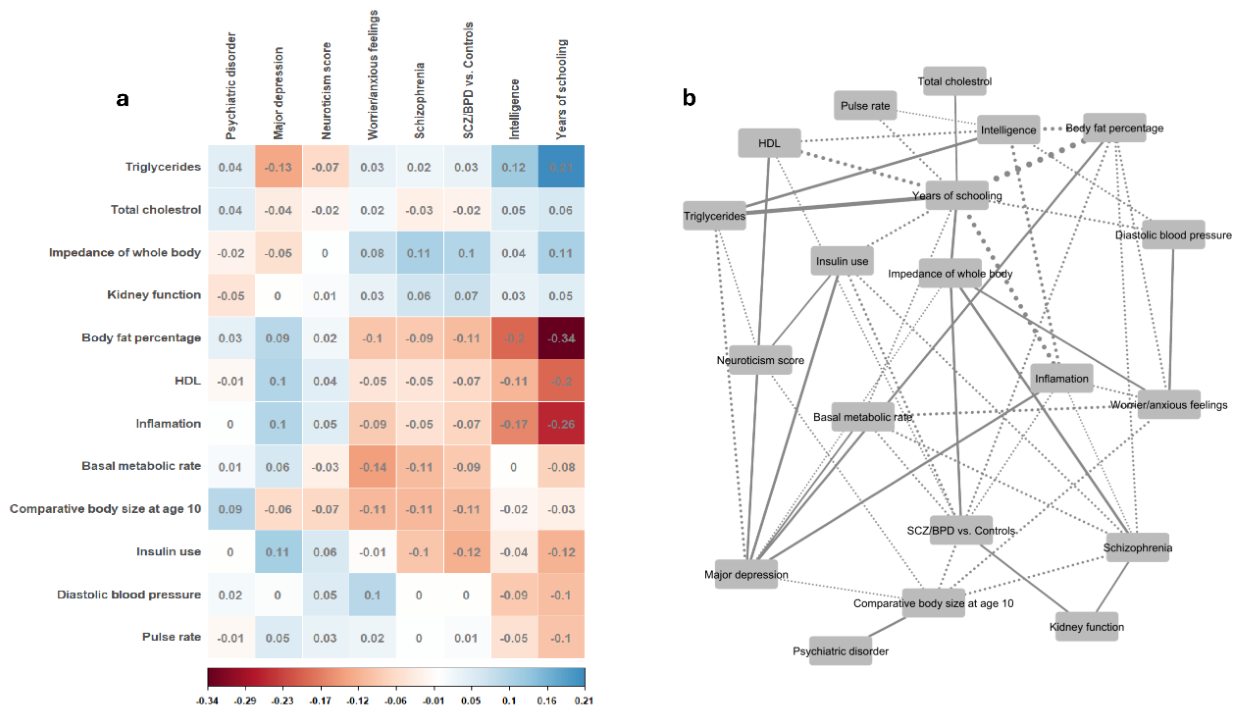
Figure 3.
Hypothetical model by which the findings from this study relate to one another. Environmental factors such as stressors, incentives and learnings influence neural processes. This consequently has an impact on lifestyle habits that a person chooses in life, because such habits modify the sensitivity of neural processes to environmental factors. However, they also have an impact on the immune system. Change in the activity of immune system eventually influences the body and contributes to health outcomes including cardiometabolic and neurobehavioral outcomes.
Figure 3.
Hypothetical model by which the findings from this study relate to one another. Environmental factors such as stressors, incentives and learnings influence neural processes. This consequently has an impact on lifestyle habits that a person chooses in life, because such habits modify the sensitivity of neural processes to environmental factors. However, they also have an impact on the immune system. Change in the activity of immune system eventually influences the body and contributes to health outcomes including cardiometabolic and neurobehavioral outcomes.
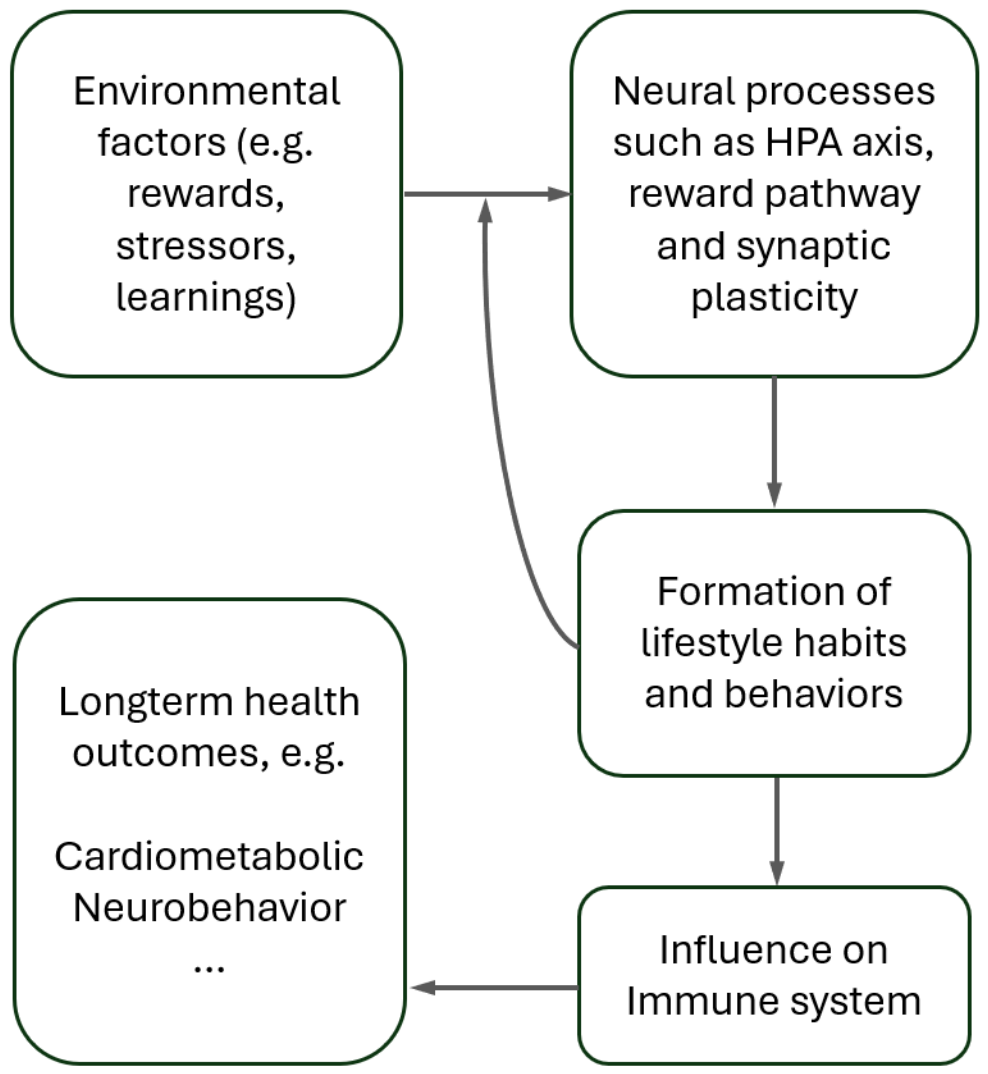

Table 1.
The influence of main loci on various categories of traits from UK Biobank.
| Locus | Category | N(Category) |
N (All) |
Observed ratio |
P-value* |
| 3p21.31 | Lifestyle | 13 | 33 | 0.39 | 0.002 |
| Blood | 10 | 0.30 | 0.04 | ||
| HLA | Immune | 75 | 262 | 0.29 | <1e-16 |
| Blood | 158 | 0.60 | <1e-16 | ||
| 8p23.1 | CNS | 10 | 29 | 0.34 | 0.02 |
| Blood | 9 | 0.31 | 0.04 | ||
| 14q11.2 | Immune | 16 | 41 | 0.39 | 5e-4 |
| Blood | 23 | 0.56 | <1e-16 | ||
| 16p11.2 | Lifestyle | 13 | 26 | 0.50 | 9e-5 |
| Blood | 10 | 0.38 | 0.007 | ||
| 17q21.31 | Blood | 37 | 75 | 0.49 | <1e-16 |
* P-value was calculated using binomial test and by comparing the observed ratio vs. the expected ratio () for a category of a trait.
Table 2.
Biological processes that are overrepresented among brain transcripts that showed significant pleiotropic effects on cardiometabolic and CNS traits.
Table 2.
Biological processes that are overrepresented among brain transcripts that showed significant pleiotropic effects on cardiometabolic and CNS traits.
| Term | Count in the network | Fold Enrichment | P-value |
| Antigen processing and presentation via MHC class II | 2 in 22 | 221.73 | 7.9e-03 |
| Antigen processing and presentation | 2 in 49 | 99.55 | 1.7e-02 |
| Immune system process | 3 in 953 | 7.68 | 4.2e-02 |
Table 3.
Validation of findings from the initial analysis (based on blood eQTLs) in the BrainMeta study.
Table 3.
Validation of findings from the initial analysis (based on blood eQTLs) in the BrainMeta study.
| Gene | Chr band | Cardiometabolic trait | Z-value | P-value | Neurobehavior trait | Z-value | P-value |
| LRRIQ3 | 1p31.1 | Body size at age 10 | -6.2 | 5.6E-10 | Years of schooling | -6.34 | 2.3E-10 |
| RBM6 | 3p21.31 | Body fat percentage | -8.37 | 5.8E-17 | Years of schooling | 9.34 | 9.6E-21 |
| Impedance of whole body | 8.04 | 9.0E-16 | Years of schooling | 9.34 | 9.6E-21 | ||
| Inflammation | -9.05 | 1.5E-19 | Years of schooling | 9.34 | 9.6E-21 | ||
| High density lipoprotein | -13.7 | 1.1E-42 | Years of schooling | 9.34 | 9.6E-21 | ||
| HYAL3 | High density lipoprotein | -6.64 | 3.1E-11 | Years of schooling | 6.96 | 3.3E-12 | |
| Impedance of whole body | 8.03 | 9.5E-16 | Years of schooling | 6.96 | 3.3E-12 | ||
| BTN3A2 | HLA | Body size at age 10 | -5.86 | 4.7E-09 | Schizophrenia | 7.11 | 1.1E-12 |
| Basal metabolic rate | -6.92 | 4.5E-12 | Schizophrenia | 7.11 | 1.1E-12 | ||
| HLA-G | Triglycerides | -11.26 | 2.0E-29 | Schizophrenia | 6.01 | 1.9E-09 | |
| VARS2 | Triglycerides | -5.57 | 2.6E-08 | Schizophrenia | 8.88 | 6.5E-19 | |
| Triglycerides | -5.57 | 2.6E-08 | SCZ/BP vs. controls | 6.12 | 9.1E-10 | ||
| Total cholesterol | -6.35 | 2.2E-10 | Schizophrenia | 8.88 | 6.5E-19 | ||
| Basal metabolic rate | -7.77 | 7.8E-15 | Schizophrenia | 8.88 | 6.5E-19 | ||
| Basal metabolic rate | -7.77 | 7.8E-15 | Psychiatric disorder | -6.96 | 3.5E-12 | ||
| Diastolic blood pressure | 7.59 | 3.3E-14 | Schizophrenia | 8.88 | 6.5E-19 | ||
| C4A | Insulin use | -9.63 | 6.1E-22 | Schizophrenia | 9.96 | 2.2E-23 | |
| Body size at age 10 | -7.17 | 7.7E-13 | Schizophrenia | 9.96 | 2.2E-23 | ||
| Total cholesterol | -6.76 | 1.4E-11 | Schizophrenia | 9.96 | 2.2E-23 | ||
| Basal metabolic rate | -8.94 | 4.1E-19 | Schizophrenia | 9.96 | 2.2E-23 | ||
| HLA-DQA1 | Total cholesterol | -7.34 | 2.1E-13 | Schizophrenia | 5.74 | 9.7E-09 | |
| Triglycerides | -12.27 | 1.4E-34 | Schizophrenia | 5.74 | 9.7E-09 | ||
| HLA-DQB1 | Insulin use | -11.58 | 5.2E-31 | Schizophrenia | 6.29 | 3.2E-10 | |
| RPS26 | 12q13.2 | High density lipoprotein | -6.34 | 2.2E-10 | Years of schooling | 7.53 | 5.2E-14 |
| Impedance of whole body | 7.36 | 1.8E-13 | Years of schooling | 7.53 | 5.2E-14 | ||
| EIF3C | 16p11.2 | Body fat percentage | 9.56 | 1.1E-21 | Intelligence | -6.75 | 1.5E-11 |
| LRRC37A4P | 17q21.31 | Impedance of whole body | 7.23 | 5.0E-13 | Neuroticism score | -9.98 | 1.8E-23 |
| RP11-259G18.3 | Impedance of whole body | -7.19 | 6.4E-13 | Neuroticism score | 8.89 | 6.3E-19 |
Disclaimer/Publisher’s Note: The statements, opinions and data contained in all publications are solely those of the individual author(s) and contributor(s) and not of MDPI and/or the editor(s). MDPI and/or the editor(s) disclaim responsibility for any injury to people or property resulting from any ideas, methods, instructions or products referred to in the content. |
© 2026 by the authors. Licensee MDPI, Basel, Switzerland. This article is an open access article distributed under the terms and conditions of the Creative Commons Attribution (CC BY) license (http://creativecommons.org/licenses/by/4.0/).
Copyright: This open access article is published under a Creative Commons CC BY 4.0 license, which permit the free download, distribution, and reuse, provided that the author and preprint are cited in any reuse.


