Submitted:
25 May 2026
Posted:
25 May 2026
You are already at the latest version
Abstract
This study investigates the synergistic therapeutic potential of Rivastigmine (RVG) and Epigallocatechin (EGC) in Alzheimer’s disease (AD), a multifactorial neurodegenerative disorder characterized by neuroinflammation, oxidative stress, and dysregulated signaling pathways. Conventional therapies primarily provide symptomatic relief and target limited pathways, highlighting the need for multi-target strategies with improved efficacy and safety. An integrated in-silico approach combining pharmacokinetic evaluation, network pharmacology, molecular docking, and molecular dynamics simulations is used to determine the synergistic potential of RVG and EGC. Pharmacokinetic analysis indicates favorable drug-likeness and acceptable ADME/Tox profiles for both compounds. Network pharmacology identified 146 overlapping targets associated with AD, highlighting key hub genes including NFKB1, MAPK1, STAT1, PRKACA, GRB2, LYN, and PTPN11 are involved in neuroinflammation, synaptic signaling, and neuronal survival. Functional enrichment analysis indicated significant involvement of MAPK/ERK signaling and immune-regulatory pathways. Importantly, the PD-1/PD-L1 signaling pathway is identified as a novel mechanistic connecting neuroimmune modulation with intracellular kinase-driven neurodegeneration. Molecular docking studies showed strong binding affinities of RVG and EGC toward key AD-related targets, particularly MAPK1, supported by stable hydrogen bonding and interaction profiles. Molecular dynamics simulations confirmed stable protein-ligand interactions, with EGC contributing structural stability and RVG exhibiting adaptive flexibility within the binding pocket. These results suggest that the RVG-EGC combination exhibits synergistic potential by simultaneously modulating neuroinflammatory, oxidative stress, and kinase-mediated signaling pathways. The integration of PD-1/PD-L1 and MAPK/ERK signaling provides a novel mechanistic pathway for multi-target therapeutic intervention in AD.
Keywords:
rivastigmine
; epigallocatechin
; MAPK/ERK signaling
; PD-1/PD-L1
; synergistic therapy
; neuroinflammation
1. Introduction
Neurodegenerative disorders are characterized by progressive loss of neuronal structure and function, leading to cognitive and motor impairments. Among these, Alzheimer’s disease (AD) and Parkinson’s disease (PD) represent the most clinically significant conditions, with AD primarily affecting cognition and memory, while PD largely impairs motor function. These disorders play a significant role in clinical, social, and economic burden, as their chronic and irreversible progression leads to loss of independence, increased caregiver dependency, and substantial healthcare costs [1,2]. The growing aging population further increases this burden, making neurodegenerative diseases a major global public health challenge. According to the epidemiological perspective, AD is the leading cause of dementia, accounting for approximately 60-80% of cases worldwide, with nearly 50 million individuals currently affected and projections reaching 139 million by 2050 [3]. PD affects around 6 million people globally, with incidence expected to rise steadily. Beyond prevalence, the impact of these diseases extends to reduced quality of life, long-term institutional care, and significant emotional and financial strain on families and healthcare systems [4].
Patho-physiologically, AD is characterized by β-amyloid plaque deposition, tau neurofibrillary tangles, synaptic dysfunction, and progressive neuronal loss. In addition to these classical markers, mitochondrial dysfunction is emerged as a significant contributor, resulting in impaired ATP production and elevated oxidative stress [5]. Disruptions in neuronal plasticity and extracellular matrix homeostasis further limit the brain’s ability to repair and adapt, thereby accelerating cognitive decline and disease progression. These multifactorial mechanisms highlight the complexity of AD and the limitations of single-target therapeutic strategies [6]. Current pharmacological management primarily involves cholinesterase inhibitors such as Rivastigmine (RVG), Donepezil, and Galantamine, along with the NMDA receptor antagonist Memantine. Although these agents provide moderate symptomatic relief, they are not reverse disease progression. Moreover, their prolonged use is frequently associated with adverse effects, including gastrointestinal disturbances, bradycardia, and sleep-related disorders, limiting patient compliance and therapeutic effectiveness. These limitations highlight a significant need for improved therapeutic strategies that can address both symptoms and underlying disease mechanisms [7].
Recent advancements introduced biologics such as Lecanemab and Donanemab, indicate the ability to slow cognitive and functional decline. However, limitation regarding safety, cost, and variable efficacy have led to mixed responses within the scientific community. Simultaneously, progress in biomarker development including PET imaging, cerebrospinal fluid analysis, and blood-based assays are improved diagnostic accuracy and enabled earlier intervention. In this context, growing attention is directed toward integrating naturally derived bioactive compounds with established therapeutics [8,9]. Epigallocatechin (EGC), a catechin, exhibits potent antioxidant, anti-inflammatory, and anti-amyloidogenic properties, along with the ability to modulate mitochondrial dysfunction and support neuronal survival. The rationale for combining these EGC with RVG agents shows their complementary and multi-targeted mechanisms of action (Figure 1). While Rivastigmine primarily addresses neurotransmitter deficits associated with cognitive decline through enhancement of cholinergic signaling, EGC targets upstream pathological processes, including oxidative stress, mitochondrial dysfunction, and β-amyloid aggregation. This integrative approach enables simultaneous modulation of both symptomatic pathways and highlighting disease-driving mechanisms. Such a combination strategy is a promising approach in Alzheimer’s disease, where single-target therapies often fail to address the complex and interconnected network of pathological events. By concurrently targeting cholinergic dysfunction, oxidative damage, mitochondrial impairment, and amyloid pathology, the combined use of RVG and EGC provides a more potent therapeutic approach [10]. This synergy not only supports improved cognitive function but also offers the potential to attenuate disease progression by modulating at multiple stages of the pathological cascade. Therefore, the integration of RVG with EGC represents a promising and rational strategy for enhancing therapeutic efficacy and advancing the overall management of Alzheimer’s disease.
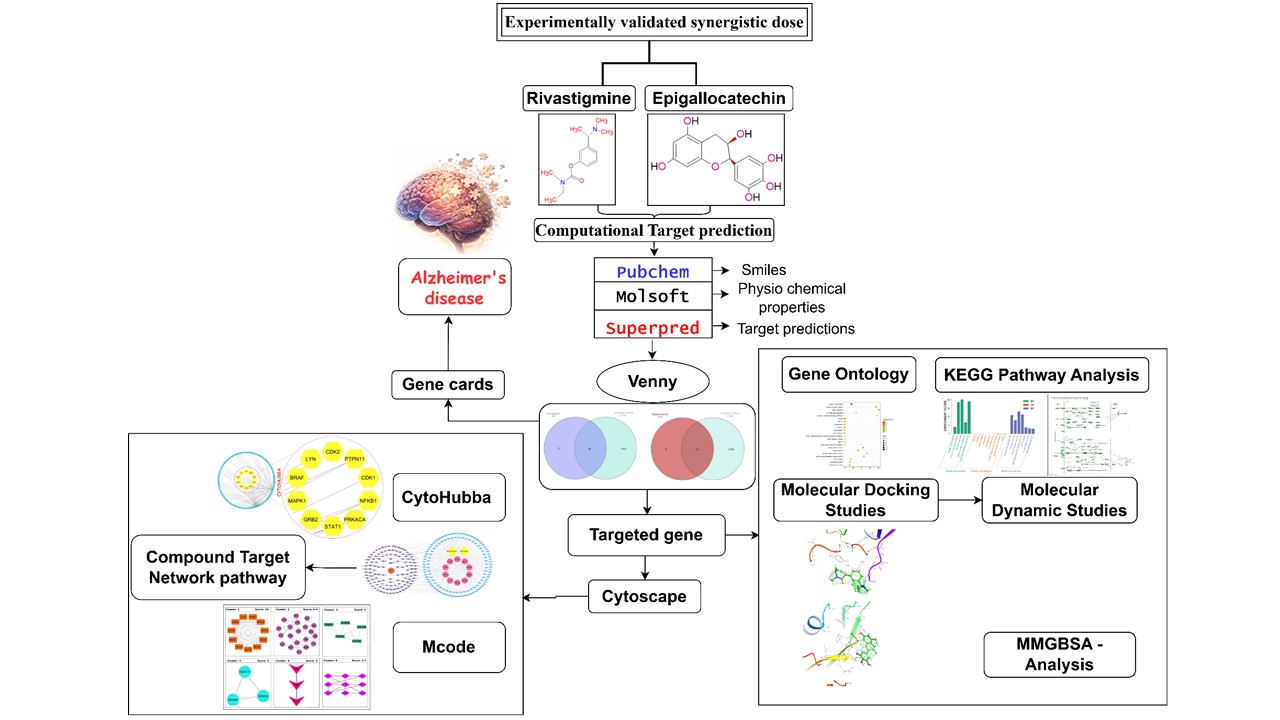
In the present study, an integrated in-silico and experimental strategy to evaluate the pharmacological and synergistic efficacy of the selected agents. Initially, in silico analyses such as SwissADME and pkCSM predictions are performed to evaluate the key pharmacokinetic properties such as toxicity profiles and drug-likeness. Furthermore, computational pharmacology analysis and protein-protein interaction (PPI) evaluation are used to determine the relevant therapeutic targets and to determine the mechanistic pathway involved in disease modulation. Subsequently, molecular docking studies, subsequent MD simulations were performed to evaluate the binding score, interaction patterns, and stability of protein-ligand complexes.
2. Methodology
2.1. In-Silico Drug Likeness and ADMET Analysis
The pharmacokinetic profile and toxicity properties of RVG and EGC are assessed by the online tools pkCSM (http://biosig.unimelb.edu.au/pkcsm/) and SWISS-ADME (https://www.swissadme.ch/), are widely used for predicting drug-likeness, ADME properties, and safety profiles. SWISS-ADME is used to validate the estimated key parameters related to absorption, metabolism, and distribution, along with physicochemical characteristics, whereas the pkCSM integrates information from both in-vivo and in-vitro studies to predict significant toxicity risks with an overall safety profile. Drug-likeness is assessed by the Lipinski’s Rule of Five, and its parameters such as Molecular weight ≤ 500 Da (MW), Hydrogen bond donors ≤ 5 (HBD), LogP ≤ 5, and Hydrogen bond acceptors ≤ 10 (HBA). Pharmacokinetic predictions, such as intestinal absorption, with values ≥ 30% regarded as acceptable, and Blood-Brain Barrier permeability expressed as logBB. Toxicological assessment involved prediction of hERG I inhibition, where non-inhibition suggests reduced cardiotoxic risk, acute oral toxicity in rats represented as LD50 mg/kg range exceeding 300 mg/kg, indicating potential hepatotoxicity. These parameters help to a comprehensive evaluation of the ADMET profile of RVG and EGC, supporting their suitability in terms of pharmacokinetics and safety [11].
2.2. Pharmacological Network Analysis
2.2.1. Mapping the Disease-Associated Gene and Target Prediction
SMILES formats for RVG and EGC are obtained by PubChem and subsequently uploaded to the SuperPred web server for computational prediction for the target (https://prediction.charite.de). To investigate disease-associated genes, the determined targets of compounds (RVG and EGC) were compared with a dataset of genes associated with Alzheimer’s disease, retrieved from the GeneCards database using the keyword “Alzheimer’s disease” (https://www.genecards.org). Common targets shared between the predicted compounds and disease-associated genes are identified through overlap analysis and further represented using Venny tools (https://www.interactivenn.net/). However, this approach enabled the identification of significant molecular targets and provided insights into the therapeutic mechanisms of RVG and EGC in Alzheimer’s disease [12,13].
2.2.2. Identification of Shared RVG-EGC Targets in AD
Common targets predicted from the Venny analysis were integrated, duplicate entries were deleted to ensure data reliability. PPI-analysis is performed using the STRING online tool (https://string-db.org/) selected with the organism chosen as Homo Sapiens, applying a high-confidence score threshold of 0.700 while excluding unconnected nodes. The generated interaction data is downloaded in TSV format and further imported into Cytoscape (v3.9.1) for representation, the nodes indicate edges and proteins indicate their interaction profiles. Key genes within the networks are identified by the CytoHubba plugin (v0.1) based on centrality of degree, enabling the prediction of highly interconnected and potentially significant molecular targets involved in AD [14,15].
2.2.3. Analysis of Functional Modules
To detect highly interconnected nodes within the PPI network, clustering analysis is analysed by MCODE (v2.0.3) plugin in Cytoscape. The earlier established PPI network of common targets associated with RVG and EGC in AD is used as the input dataset. The analysis is conducted using standard parameters, including node score cutoff = 0.2, degree cutoff = 2, maximum depth = 100, and k-core = 2. The resulting clusters are arranged based on their scores, and most significant clusters with higher scores are selected for further analysis. Each identified cluster was evaluated in terms of node and edge distribution, and its biological relevance is interpreted based on the gene composition within each cluster. This approach facilitated the identification of significant molecular networks and functional components that may play a significant role in the progression and pathology of AD [16].
2.2.4. Analysis of Compound-Target-Pathway (CTP) Interactions
The CTP network is used to observe the interactions between RVG and EGC, their predicted molecular targets, and the associated pathways in AD. The top hub 10 genes identified through Cytohubba (v0.1) analysis were chosen for pathway enrichment analysis using (https://www.kegg.jp) the KEGG-database, facilitated by the (https://david.ncifcrf.gov/) DAVID bioinformatics platform. Potentially enriched pathways (p < 0.05) are identified and aligned with their respective target genes. However, the integrated data CTP-gene-disease relationships are opened into Cytoscape for network construction and visualisation. This network highlights the multi-target and pathway interactions of these selected compounds, providing insights into their potential roles in regulating key signalling pathways associated with the pathogenesis of AD[17,18].
2.2.5. Functional Enrichment (GO) and KEGG Pathway Analysis
Functional analysis is carried out by the DAVID bioinformatics platform to explore the physiological significance of targets associated with RVG and EGC in AD. The overlapping target genes are applied to Kyoto Encyclopedia of Genes and Genomes (KEGG) Pathway Analysis and Gene Ontology (GO) Enrichment Analysis, with the organism specified as Homo sapiens. GO annotations are classified into three: Biological Process (BP), Cellular Component (CC), and Molecular Function (MF). GO and Enriched pathways terms are chosen based on statistical significance criteria of p < 0.05 and further prioritised according to gene count relevance. Enrichment results are represented using bar charts and bubble plots generated through the SR-plot online platform (https://www.bioinformatics.com.cn/en). Prior to analysis, repeated targets are eliminated to ensure data accuracy and consistency throughout the enrichment process [19,20].
2.3. Molecular Docking Study
Docking studies for RVG and EGC for the predicted targets are performed by the Schrödinger-Suite 2023-1. The three-dimensional analysis of targets is taken by the RCSB Protein Data Bank (https://www.rcsb.org/), and the PDB IDs are 8TQD, 1TVO, 1YVL, 2GU8, and 7MPH. Protein preparations are taken into the Protein Preparation Wizard, that helps to remove crystallographic water molecules, add side chains and missing residues, and restrain minimisation by the OPLS4 Force Field with an atom RMSD cutoff of 0.30 Å. To assess the validity of the docking protocol, ligands co-crystallised with the protein structures are used as reference molecules, and docking is performed using the same grid parameters. Ligand preparation for RVG and EGC is conducted using the LigPrep module, and the ionization states were generated using Epik at physiological pH conditions (7.0 ± 2.0). The ligands are further minimized with the OPLS4, and the minimum-energy conformations are selected for molecular docking analysis. Receptor grids are formed by Grid Generation module by center the grid box on the active position of every protein: NFkB1 (x = 7.31, y = -14.33, z = -13.31), 1TVO (x = 6.42, y = -4.37, z = 16.44), 2GU8 (x = -9.29, y = -10.58, z = 2.21), 1YVL (x = -23.32, y = -1.96, z = 104.33), and 7MPH (x = 9.16, y = 12.17, z = 14.87). Docking is performed by a van der Waals factor of 1.0 and a partial charge cutoff range of 0.25. The Glide XP (extra precision) module is utilized for simulations, and the significant binding poses are further evaluated with the XP Visualizer to predict the important amino acid interactions modulating binding affinity. Furthermore, intermolecular interactions, including bond lengths and distances between ligands and target proteins, were evaluated using BIOVIA Discovery Studio 2024. Docking scores kcal/mol and their interacting residues are recorded for further analysis of binding stability and interaction profiles [21,22].
2.4. Computational Molecular Dynamics (MD) Analysis
MD simulations of the top-ranked protein-ligand complexes are carried out by Desmond integrated with Schrödinger Suite 2023-1. The final docking RVG and EGC complexes, taken from Glide XP precision, were selected for further dynamic study. Every complex is integrated in orthorhombic box with a buffer distance of 10 Å and also solvated by the water model TIP3P. To maintain the system neutrality, appropriate counterions were added, along with 0.15 M NaCl used to simulate physiological ionic environment. This is subsequently subjected to equilibration and energy minimization by default relaxation protocol under the OPLS4 force field. The production run is performed for 100 ns with NPT ensemble conditions such as regulating a constant temperature (CT) of 300 K and the pressure of 1 atm by Martyna-Tobias-Klein barostat. Post-simulation trajectory analyses, such as root-mean-square fluctuation (RMSF), root-mean-square deviation (RMSD), and interactions with hydrogen bond, are used to assess structural integrity, flexibility, and dynamic behavior of the protein-ligand complexes [23,24].
3. Results
3.1. Pharmacokinetic and Physicochemical Characteristic Study
The pharmacokinetic and toxicity characteristics of RVG and EGC were assessed by computational prediction tools to evaluate their suitability as potential therapeutic agents for AD. Both compounds showed overall favorable pharmacokinetic characteristics and acceptable safety profiles. Based on physicochemical property analysis, RVG is adhered to Lipinski’s drug-likeness criteria, while EPI showed a single violation related to hydrogen bond donors (NH or OH>5) (Table 1).
RVG exhibited higher intestinal absorption (88.456%) compared to EPI (54.128%), suggesting more efficient gastrointestinal absorption. Compared to blood-brain barrier (BBB) permeability, RVG showed a positive logBB value (0.508), indicating greater BBB penetration, whereas EPI exhibited low BBB permeability (-1.377). Similarly, central nervous system (CNS) permeability predictions indicated limited CNS penetration for both compounds, with RVG (-2.255) showing relatively higher permeability than EGC (-3.507), suggesting a lower level of CNS-related toxicity, particularly for EPI. Neither RVG nor EGC is predicted to inhibit hERG I channel, indicating a lower risk of cardiotoxicity. RVG and EGC are non-hepatotoxic and non-sensitizing, enhancing their potential for prolonged therapeutic adherence. Acute toxicity following oral analysis revealed LD₅₀ range of 3.402 mol/kg for RIV and 2.492 mol/kg for EPI, both exceeding the threshold for low toxicity and indicating acceptable tolerability. Furthermore, chronic toxicity assessment showed a lower LOAEL for RIV (1.163 log mg/kg bw/day) than for EPI (2.927 log mg/kg bw/day), indicating improved safety for long-term administration (Table 2).
3.2. Network-Based Pharmacological Analysis
3.2.1. Computational Target Identification and AD Association
Significant molecular targets of RVG and EGC is predicted by the SuperPRED online tool by their respective SMILES structures taken from the database of PubChem. The identified targets are subsequently analyzed by the STRING online database to identify the PPI and pathway relations, leading to 86 targets for RVG and 111 targets for EGC are predicted. To identify disease-associated genes, a comprehensive set of 17508 genes related to AD is obtained from the GeneCards online database by searching the keyword “Alzheimer’s disease.” These genes are reported to maintain key molecular signaling involved in the onset and disease progression of AD. The intersecting genes between AD-associated targets and the identified targets of RVG and EGC suggest their mechanistic involvement and therapeutic potential in AD.
3.2.2. Construction of the Target Interaction Network of RVG and EGC in AD
Interactive network analysis is used to identify common targets between AD-associated genes and the predicted molecular targets of RVG and EGC. A total of 84 common genes were identified for RVG, and 111 overlapping genes for EGC are obtained following comparison with AD-associated genes retrieved from the GeneCards online database (Figure 2A). After integration of the two datasets and removal of duplicate targets, a combined interaction network consisting of 146 nodes with 611 edges are constructed and shown in Cytoscape v3.8.0, providing a comprehensive overview of the shared molecular landscape regulated by RVG and EGC. To analyse key components within the network, the Cytohubba is used to score the nodes by degree centrality. The analysis highlighted the top hub genes: NFKB1, MAPK1, STAT1, PRKACA, GRB2, LYN, PTPN11, BRAF, CDK2, and CDK1 (Figure 2B; Table 3). These 10 hub genes play a significant regulatory module involved in critical biological processes associated with AD, including neuroinflammation, synaptic signaling, neuronal survival, and cell cycle regulation. NFKB1 and STAT1 play pivotal roles in inflammatory and immune-mediated signaling pathways in neurodegeneration. MAPK1, BRAF, and PRKACA are key regulators of intracellular signaling cascades that influence neuronal plasticity and stress responses. GRB2, LYN, and PTPN11 are involved in receptor-mediated signal transduction is essential for synaptic function and neuronal communication. CDK1 and CDK2 are associated with aberrant cell cycle re-entry, a phenomenon linked to neuronal loss in AD.
3.2.3. MCODE-Based Cluster Analysis
Clustering of common target proteins is performed by the MCODE in Cytoscape to determine the highly connected regions in the PPI network, representing biologically related functional modules. This analysis revealed six separate clusters exhibiting different connectivity levels, indicating that RVG and EGC may influence multiple biological processes involved in AD (Figure 3). Cluster 1 is a potential module, containing 11-nodes and 50-edges, and signaling molecules including NFKB1, STAT1, MAPK1, BRAF, GRB2, LYN, and PTPN11. This highly interconnected cluster represents a central signaling network associated with neuroinflammation, immune activation, and intracellular kinase signaling, are critically involved in AD pathogenesis. Cluster 2 consisted of 20 nodes and 42 edges and included receptors and regulatory proteins involved in neuroimmune communication, neurotransmission, and oxidative stress responses. Cluster 3, containing 5 nodes and 8 edges, is associated with cell cycle regulation and DNA-related processes. Aberrant activation of cell cycle-related pathways in post-mitotic neurons is a recognized contributor to neuronal loss in AD, indicating the potential relevance of this module to disease progression. Cluster 4 comprised 3 nodes and 3 edges, representing a compact epigenetic regulatory module involved in chromatin remodeling and transcriptional control. Dysregulation of epigenetic mechanisms is linked to impaired synaptic plasticity and memory deficits in AD. Cluster 5, also containing 3 nodes and 3 edges, is associated with vascular and proteolytic regulation, that may influence cerebral perfusion, BBB integrity, and amyloid clearance mechanisms in AD. Cluster 6 included 9 nodes and 11 edges and involved genes related to oxidative stress defense, neurotransmitter transport, and calcium signaling, all important for maintaining neuronal homeostasis and preventing neurodegenerative damage.
3.2.4. Analysis of Compound–Target Interactions
A CTPD network is constructed to represent the computational-level interactions of RVG and EGC in AD (Figure 4). The network integrates the relationships among the two compounds, their predicted molecular targets, associated signaling pathways, and AD, providing a comprehensive overview of their multi-target therapeutic potential. In the network, RVG and EGC occupy central positions and are extensively connected to multiple target genes and biological pathways implicated in AD pathogenesis. Several hub targets, including NFKB1, STAT1, MAPK1, BRAF, GRB2, PRKACA, LYN, PTPN11, CDK1, and CDK2, exhibit high connectivity within the network, highlighting their critical regulatory roles. These targets play a major role in neuroinflammation, immune signaling, synaptic function, cell cycle dysregulation, and neuronal survival in the development and progression of AD. The strong interconnections among these targets and multiple signaling pathways suggest that RVG and EGC alter AD-related mechanisms through coordinated regulation of interconnected molecular networks rather than single-target effects. Compared to the PPI network and MCODE analyses, this helps to predict the PPI and localized clusters. The CTPD network provides a comprehensive pathway-level perspective, molecular targets linked to higher-level biological processes and disease mechanisms.
3.2.5. KEGG and GO Functional Enrichment Analysis in AD
Gene Ontology (GO) functional enrichment is to evaluate the functional mechanisms highlighting the therapeutic potential of EGC and RVG in AD (Figure 4A). Enriched GO categories were organized into BP, CC, and MF classifications. In the BP category, significant enrichment is observed in signal transduction, protein phosphorylation, MAPK cascade, ERK1/ERK2 signaling, and DNA damage response, indicating that the therapeutic potential is primarily driven by regulation of intracellular pathways and stress-response mechanisms. These biological processes are closely related to significant pathological characteristics of AD, such as tau hyperphosphorylation, amyloid-beta-induced toxicity, and progressive neuronal degeneration. In the CC category, enriched terms such as cytosol, nucleus, nucleoplasm, mitochondrion, and centrosome indicate that the target proteins are distributed across significant subcellular compartments involved in transcriptional regulation, intracellular signaling, and energy metabolism. The enrichment of mitochondrial components further highlights the significant role of mitochondrial dysfunction and redox balance in the progression of neurodegeneration. In the MF category, strong enrichment is observed for protein kinase activity, cyclin-dependent kinase activity, protein serine/threonine kinase activity, ATP binding, and phosphotyrosine residue binding, indicating that dysregulated kinase-mediated phosphorylation is a key mediator of pathological signaling, particularly contributing to tau hyperphosphorylation and neuronal dysfunction in Alzheimer’s disease.
KEGG enrichment functional analysis is used to determine the significant pathways related to the identified targets (Figure 4B). The analysis showed significant enrichment of pathways related to MAPK signaling, neuroinflammatory responses, and cellular stress pathways, plays a important role as a regulator of synaptic plasticity, neuronal survival, and apoptosis. Key hub genes, including NFKB1, MAPK1, STAT1, PRKACA, GRB2, LYN, PTPN11, BRAF, CDK2, and CDK1, showed strong network connectivity, suggesting their central roles in modulating oxidative stress, inflammatory signaling, and protein aggregation in Alzheimer’s disease. However, PD-1/PD-L1 signaling pathway (Figure 5), plays an significant role in neuroimmune regulation and neuroinflammation. This pathway highlights that upstream activation of receptor-mediated signaling cascades, including EGFR and cytokine receptors, triggers downstream PI3K/AKT and MAPK signaling pathways. Within this pathway, the MAPK signalling (RAS-RAF-MEK-ERK) is significantly involved, and ERK (MAPK1) regulates transcription factors such as AP-1 and NF-κB.
In Alzheimer’s disease, aberrant activation of ERK is associated with increased tau phosphorylation, neuronal stress, and synaptic dysfunction. The PD-1/PD-L1 signalling pathway further modulates immune responses by influencing T-cell activity and inflammatory signalling, thereby contributing to chronic neuroinflammation observed in neurodegenerative conditions. Targeting ERK within this pathway suggests a potential therapeutic strategy, and modulation of MAPK signaling may attenuate downstream inflammatory responses, reduce abnormal phosphorylation events, and improve neuronal survival.
4. Docking-Based Interaction Analysis
The docking procedure is validated through redocking of the co-crystallized ligands of the selected target proteins, yielding an RMSD range below 2 Å (Table 5), supporting the validity and accuracy of the docking procedure. The top five hub proteins identified, NFKB1, MAPK1, STAT1, PRKACA, and GRB2, are subjected to MD with RVG and EGC to determine their binding affinities toward AD-associated targets. Docking scores presented in (Table 4) varied between -8.63 and -3.49 kcal/mol, indicating differences in binding affinity among the selected targets. Among these, MAPK1 exhibited the strongest interaction, with RVG showing the binding affinity (-8.63 kcal/mol), forming multiple interactions with residues such as LYS164, ASP162, GLN132, and ARG135. EGC also showed strong binding toward MAPK1 (-7.32 kcal/mol), interacting with ASP111, LYS151, and ASP167. These interactions were further supported by conventional hydrogen bonds and their bond distances ranging from ~4.37 Å to 5.96 Å, indicating persistent ligand-protein interactions. Similarly, NFKB1 showed significant binding, where RVG (-7.94 kcal/mol) formed hydrogen bonding with LYS243 (~5.68 Å), while EGC (-6.79 kcal/mol) established multiple hydrogen bonds with GLU62, ARG56, and ALA244, and its interaction bond distances ranged from ~4.29 Å to 4.47 Å. In the case of STAT1, moderate binding affinities are observed, with EGC (-6.61 kcal/mol) exhibiting relatively stronger interaction than RVG (-5.28 kcal/mol), validated by hydrogen bonding interactions with GLU618 and ALA630 (~4.08-4.42 Å), whereas RVG interacted with MET654 (~4.46-5.42 Å). For PRKACA, both compounds displayed moderate binding, where RVG (-4.81 kcal/mol) formed hydrogen bonds with GLU127 and LYS168 (~5.66-6.04 Å), and EGC (-4.61 kcal/mol) interacted with amino acids LYS168, ASP166, and GLU170, with its bond distances ranging from ~4.13 Å to 5.21 Å. GRB2 showed relatively weaker binding interactions, where RVG showed a docking score of -3.74 kcal/mol and formed a hydrogen bond with ASP94 at an approximate distance of 4.02 Å. In comparison, EGC exhibited a docking score of -3.49 kcal/mol and interacted with ARG112, VAL110, and ASP94 through multiple contacts ranging from approximately 3.37 Å to 4.70 Å, suggesting relatively weaker but stable interactions. Comparison with co-crystallized ligands indicated that several interactions of RVG and EGC were comparable and supportive of native ligand binding, further validating their binding potential (Table 6). The 2D and 3D interaction profiles (Figure 6 and Figure 7) further show the binding conformations and key interacting residues, highlighting the ability of RVG and EGC to effectively target multiple AD-related targets.

Table 4.
Binding scores of RVG and EGC toward AD target proteins.
| Target | PDB | Ligand Name | Docking Energy (kcal/mol)) | Binding Residues |
| NFKB1 | 8TQD | RIV | -7.94 | LYS 243, ALA 244, TYR 59 |
| EPI | -6.79 | GLU 62, ARG 56, ALA 244, ARG 58, PHE 55, GLY 54 | ||
| MAPK1 | 1TVO | RIV | -8.63 | LYS 164, ASP 162, GLN 132, ARG 135, ARG 79, HIE 80,GLU 81, ASN 82, ILE 83, ILE 84, GLY 85 |
| EPI | -7.32 | ASP 111, LYS 151, ASP 167, ASN 154, SER 153, ASP 149, ARG 67, ILE 31, GLY 32, GLU 33, GLY 34, TYR 36, VAL 39, LYS 54 | ||
| STAT1 | 1YVL | RIV | -5.28 | MET 654, ALA 656, ALA 655, VAL 653, GLU 618, TRP 616, HIE 629 |
| EPI | -6.61 | GLU 618, ALA 630, TRP 616, HIE 629, VAL 631, GLU 632, ALA 656, ALA 655, MET 654, VAL 653 | ||
| PRKACA | 2GU8 | RIV | -4.81 | LYS 168, GLU 127, ASP 166, GLU170, ASN 171, TYR 330, PHE 187, ASP 184, PHE, 129, SER 53, GLY 52, THR 51, GLY 50, LEU 49 |
| EPI | -4.61 | GLU 170, LYS 168, ASP 166, THR 51, GLY 52, SER 53, THR 201, PHE 187, ASP 184, ASN 171 | ||
| GRB2 | 7MPH | RIV | -3.74 | ASP 94, SER 96, LYS 109, LEU 111, ARG 112 |
| EPI | -3.49 | ARG 112, VAL 110, ASP 94, LEU 111, LYS 109, SER 96, PHE 95, SER 88, ARG 86 |
Table 5.
Analysis of RVG and EGC binding affinities in comparison with co-crystal ligands.
| Targets | PDB | Docking Energy (kcal/ mol) | Interacting Residues | RMSD Range (Å) | Validation Method |
| NFKB1 | 8TQD | -5.02 | GLU 62, ARG 56, ALA 244, ARG 58, LYS 243 | 1.10 Å |
Redocking of the co- crystallized ligand |
| MAPK1 | 1TVO | -7.01 | ASP 111, LYS 151, ASP 167, LYS 164 | 1.24 Å | |
| STAT1 | 1YVL | -5.63 | GLU 618, ALA 630, MET 654 | 0.82 Å | |
| PRKACA | 2GU8 | -8.22 | GLU 170, LYS 168, ASP 166, THR 51, LYS 168, GLU 127 | 0.60 Å | |
| GRB2 | 7MPH | -4.90 | ARG 112, VAL 110, ASP 94 | 1.50 Å |
Table 6.
Protein-ligand interaction patterns and bond lengths of RIV and EPI.
| Target | PDB | Ligand Name | Type of Interaction | Binding Residue | Ligand Atom (or) Ring | Predicted Distance (Å) |
| NFKB1 | 8TQD | RIV | Conventional H-bond Interaction | LYS 243 | H atom | 5.68 |
| EPI | GLU 62, ARG 56, ALA 244, | H atom O atom H atom |
4.42 4.29 4.47 |
|||
| MAPK1 | 1TVO | RIV | Conventional H-bond | LYS 164 |
Benzene ring O atom |
5.96 5.36 |
| EPI | ASP 111, LYS 151, ASP 167 | H atom H atom H atom |
4.46 5.79 4.37 |
|||
| STAT1 | 1YVL | RIV | Conventional H-bond Interaction | MET 654 | H atom O atom |
5.42 4.46 |
| EPI | GLU 618, ALA 630 | H atom H atom |
4.42 4.08 |
|||
| PRKACA | 2GU8 | RIV | Conventional H-bond Interaction | GLU 127 LYS 168 |
H atom O atom |
5.66 6.04 |
| EPI | LYS 168, ASP 166, GLU170 | O atom H atom H atom |
5.21 4.53 4.13 |
|||
| GRB2 | 7MPH | RIV | Conventional H-bond | ASP 94 | H atom | 4.02 |
| EPI | ARG 112, VAL 110, ASP 94 | H atom H atom H atom |
3.43 4.70 3.37 |
5. Molecular Dynamics (MD) Studies
5.1. RMSD-Based Stability Assessment
The structural stability and conformational changes of RVG and EGC complexes by the 200 ns MD simulation is analysed using RMSD analysis. As represented in (Figure 8A), the RVG-MAPK1 ligand-protein complex undergoes an initial equilibration phase within the first 30-40 ns, followed by stabilization of the (Cα RMSD) protein backbone around ~2.4-2.8 Å. The ligand RMSD shows a gradual increase, particularly after ~130 ns, reaching ~2.5-3.0 Å, that suggests adaptive conformational flexibility and dynamic repositioning within the binding pocket. This indicates improved accommodation within the active site, supporting sustained interactions over the simulation. In contrast, the EGC-MAPK1 complex (Figure 8B) exhibits rapid equilibration within the first 20 ns, with both protein and ligand RMSD stabilizing consistently around ~2.0-2.5 Å. The ligand RMSD remains steady with minimal fluctuations, indicating stable binding and strong retention within the active site throughout the simulation period. However, both complexes showed favorable stability profiles, with EGC contributing structural rigidity and consistent binding, while RVG exhibits adaptive flexibility that may enhance binding site accommodation.
5.2. RMSF-Based Flexibility Assessment
The flexibility of individual protein residues in complex with RVG and EGC is analysed by RMSF analysis. As represented in (Figure 9A), the RVG-MAPK1complex indicates relatively stable residue fluctuations, with moderate peaks exhibited in loop regions, particularly toward the terminal residues (~300-330). These localized fluctuations indicate flexible regions that may facilitate conformational adaptability without disrupting the overall structural integrity. Importantly, the binding site residues exhibit relatively low RMSF values (<2.0 Å), suggesting that RVG maintains stable interactions within the active site while allowing adaptive flexibility in peripheral regions. In contrast, the EGC-MAPK1complex (Figure 9B) exhibits comparatively lower residue fluctuations across the majority of the protein structure. Minor peaks are observed in loop regions, consistent with natural protein dynamics; however, the binding site residues remain highly stable with RMSF values predominantly below ~1.5-2.0 Å. This indicates strong stabilization of the active site and effective retention of EGC throughout the simulation.
5.3. Protein–Ligand Interaction Analysis
Protein-ligand interaction analysis is used to find out how the protein complexes (RVG, EGC) have key contacts during the MD simulation. The complex of RVG-MAPK1 shows a strong interaction with the presence of those key residues that form the hydrogen bond network, which is responsible for the maintenance of ligand arrangement in the target binding site, as shown in (Figure 10A). No matter how much time the simulation runs for, hydrogen-bond interactions are consistently seen which shows continued binding stability. Hydrophobic contacts from the residues THY30, HIS125 and TRP also stabilize the ligand positioned within the hydrophobic pocket of the active binding site. Electrostatic complementarity is improved with the presence of charged residues, such as GLU109 and ASP124. Moreover, many water-mediated HIS125, LEU156, TYR128, and other residue-by-residue contacts are seen, among others, which allow indirect contacts and overall conformational stability. However, the other EGC-MAPK1 complex (Figure 10B) suggests a large and very stable interaction with the binding residues ILE31, GLU33, GLY71, GLN105 and MET108, which remain stable throughout the simulation. Several hydrogen bonds (usually 3-5) implies strong binding in active pocket because of the presence of several hydrogen bonds. Further contacts with ligands are hydrophobic contacts from VAL39, LEU1560, and ALA52. Water bridges are also clearly seen, including residues LYS54 and MET108, which increases the stability of the interaction and the ability to adapt its dynamics with the help of water.
5.4. Ligand-Protein Contact Analysis
The key active residues in the active binding region which contribute to the stability of RVG and EGC are identified through the ligand-protein contact analysis. The complex of RVG-MAPK1 shows a significant ionic bond between the protonated amine group of the ligand and GLU109, which could be a key electrostatic interaction for the stabilization of the binding pocket. Moreover, the orientation and accommodation of the polar carbamate group are further supported by the surrounding polar contacts. These interactions guarantee the stability of RVG, with very little alteration of the RVG structure and also effective positioning in the active region. The EGC-MAPK1 complex (Figure 11B) has a wide hydrogen-bonding interaction network, including several residues, such as GLU33, LYS54, GLN59, ASP106, ASP111, MET108, LEU156 and ILE31. The ‘hydroxyl’ groups on the ligand allow multiple and strong hydrogen bond interactions and often these interactions are direct or are mediated by other water molecules, making ligand binding more stable.
Figure 12.
Ligand-protein interaction diagrams of Rivastigmine and Epigallocatechin within the binding site. (A) RVG protein complex. (B) EGC protein complex. Dashed lines represent hydrogen bonds and water-mediated interactions, while colored residues indicate interacting amino acids within the binding pocket.

6. Discussion
AD is a progressive neurodegenerative disease characterised by cognitive deterioration, impaired synaptic function, and neuronal loss. The pathologies of AD, such as tau hyperphosphorylation, amyloid-β aggregation, mitochondrial dysfunction, and chronic neuroinflammation, are regulated by highly interconnected molecular pathways rather than a single causative mechanism. This complexity has limited the success of conventional single-target therapies, highlighting the urgent need for multi-target therapeutic strategies for modulating multiple pathological processes simultaneously. One of the central mediating factors of AD progression is chronic neuroinflammation, primarily driven by microglial activation and dysregulated immune signaling. Persistent activation of inflammatory pathways leads to excessive production of cytokines, oxidative stress, and neuronal damage. Key signaling molecules such as NF-κB and STAT1 act as transcriptional regulators of inflammatory gene expression, linking extracellular stress signals to intracellular responses. Dysregulation of these pathways contributes to sustained inflammation and neuronal dysfunction, suggesting that targeting upstream signaling networks shows a more effective therapeutic approach.
Among the critical intracellular signaling pathways, the MAPK/ERK plays a significant role in regulating neuronal survival, stress responses, and synaptic plasticity. The RAS-RAF-MEK-ERK pathway integrates extracellular stimuli and modulates downstream transcription factors such as AP-1 and NF-κB. Under physiological conditions, ERK activation supports learning and memory processes; however, in AD, aberrant and sustained ERK activation is strongly associated with tau hyperphosphorylation, synaptic impairment, and neuronal apoptosis. Additionally, ERK signaling interacts with other kinase-driven pathways, including CDKs and PRKACA, further enhancing pathological phosphorylation. Therefore, modulation of ERK signaling represents a significant therapeutic strategy to restore cellular homeostasis and prevent neurodegenerative progression.
A particularly important mechanism emerging from this study is the interplay between the PD-1/PD-L1 immune checkpoint signaling pathway and MAPK/ERK (MAPK1) signaling, that provides a novel link between neuroimmune regulation and intracellular kinase-driven neurodegeneration in Alzheimer’s disease. The PD-1/PD-L1 signaling pathway is a significant regulator of immune homeostasis, functioning to inhibit excessive T-cell stimulation and maintain immune tolerance. In the central nervous system, this pathway is increasingly associated with the modulation of microglial activity and neuroinflammatory responses. Dysregulation of PD-1/PD-L1 signaling can lead to impaired clearance of amyloid-β and sustained inflammatory activation, thereby contributing to disease progression. Mechanistically, PD-L1 expression is tightly regulated by upstream signaling cascades, including receptor tyrosine kinase activation and cytokine-mediated pathways, that converge on intracellular signaling networks such as PI3K/AKT and the MAPK cascade [25]. The MAPK/ERK pathway plays a important role in transducing extracellular signals into transcriptional responses through activation of downstream effectors such as AP-1 and NF-κB. Aberrant activation of ERK has been strongly implicated in tau hyperphosphorylation, synaptic dysfunction, and neuronal stress responses in AD. Importantly, activation of ERK signaling can enhance PD-L1 expression, thereby establishing a feedback loop that links intracellular stress signaling with immune checkpoint regulation. This crosstalk suggests that modulation of MAPK1 not only influences neuronal survival pathways but also indirectly regulates immune signaling dynamics within the brain. Therefore, targeting ERK within the PD-1/PD-L1 signaling context represents a dual-action therapeutic strategy, capable of attenuating kinase-driven pathological processes while simultaneously modulating neuroimmune responses. Such integrated regulation may reduce chronic inflammation, restore immune balance, and limit neurodegenerative progression, highlighting the significance of this pathway as a key mechanistic bridge in Alzheimer’s disease pathology [26].
The combined use of RVG and EGC therefore represents a mechanistically complementary strategy, where RVG primarily contributes to neurotransmitter balance and immune modulation, while EGC provides broad-spectrum regulation of oxidative stress, kinase signaling, and protein aggregation pathways. This dual mechanism complies with the principles of network pharmacology, where simultaneous modulation of interconnected pathways leads to enhanced therapeutic efficacy compared to single-target interventions. Importantly, the connections between MAPK/ERK signaling and PD-1/PD-L1-mediated immune regulation provide a novel mechanistic basis for this combination. By influencing upstream signaling nodes and immune checkpoints, the combined modulation of these pathways may reduce neuroinflammation, limit abnormal phosphorylation events, and improve neuronal survival. Additionally, the regulation of downstream transcription factors, including NF-κB, further supports the suppression of inflammatory gene expression, contributing to a neuroprotective environment. Further experimental validation and clinical investigations are necessary to validate these findings and assess their therapeutic potential in AD management.
7. Study Limitations and Future Perspectives
The findings are currently limited to computational predictions, highlighting the need for experimental confirmation of the RVG-EGC therapeutic effects in AD. Future studies will include in-vitro evaluation using neuronal cell lines (e.g., SH-SY5Y, PC12) to assess neuroprotection, anti-inflammatory effects, and modulation of amyloid-β and tau pathology. In-vivo validation will be performed in transgenic AD models to evaluate cognitive function and disease progression. Pharmacokinetic studies will determine parameters such as half-life (t₁/₂), Cmax, AUC, and BBB permeability, while biodistribution analysis will assess brain targeting and systemic safety. Mechanistic validation will be carried out using Western blotting and RT-qPCR to examine key pathways, particularly MAPK/ERK and PD-1/PD-L1 signaling (MAPK1, NF-κB, STAT1). Functional assays, including ROS, apoptosis, and mitochondrial activity, will further clarify the therapeutic effects. These studies will support the translational potential of the RVG-EGC combination as a multi-target strategy for Alzheimer’s disease.
8. Conclusion
In conclusion, the present study highlights the therapeutic potential of the RVG-EGC combination as a multi-target strategy against AD by targeting interconnected neuroinflammatory and neurodegenerative pathways. This suggests that combined regulation of PD-1/PD-L1 targeted signaling may suppress chronic inflammation, abnormal phosphorylation, oxidative stress, and neuronal dysfunction associated with AD progression. The synergistic actions of RVG and EGC further enhance their role in restoring immune balance and promoting neuroprotection through network-based pathway modulation. Although the current findings are based on computational analysis, this provides a strong mechanistic basis for future experimental and translational investigations of this combination therapy in AD management.
Author Contributions
Bhaswati Das Conceptualization, Methodology, Writing—Review & Editing, Writing -original draft, Visualization; Marakanam Srinivasan Umashankar Data Curation, Validation, Visualization, Supervision.
Funding
The article was prepared without the use of any external funding sources.
Data Availability
This article contains no datasets generated or analyzed during the current study.
Acknowledgments
The authors gratefully acknowledge SRM College of Pharmacy, SRMIST, Faculty of Medical and Health Science, for providing the necessary infrastructure, technical assistance, and academic support that greatly facilitated the successful completion of this research work.
Declaration of Interest
The authors declare that they have no known competing financial interests or personal relationships that could have appeared to influence the work reported in this paper.
Ethical Approval
Not applicable.
Consent for Publication
Not applicable.
Abbreviations
| AD | Alzheimer’s Disease |
| RVG | Rivastigmine |
| EGC | Epigallocatechin |
| Aβ | Amyloid-beta |
| BBB | Blood-Brain Barrier |
| CNS | Central Nervous System |
| PPI | Protein-Protein Interaction |
| CTPD | Compound-Target-Pathway-Disease |
| GO | Gene Ontology |
| KEGG | Kyoto Encyclopedia of Genes and Genomes |
| BP | Biological Process |
| CC | Cellular Component |
| MF | Molecular Function |
| MD | Molecular Dynamics |
| RMSD | Root Mean Square Deviation |
| RMSF | Root Mean Square Fluctuation |
| H-bond | Hydrogen Bond |
| ROS | Reactive Oxygen Species |
| MAPK | Mitogen-Activated Protein Kinase |
| ERK | Extracellular Signal-Regulated Kinase |
| NF-κB | Nuclear Factor kappa B |
| STAT1 | Signal Transducer and Activator of Transcription 1 |
| PI3K | Phosphoinositide 3-Kinase |
| AKT | Protein Kinase B |
| PD-1/PD-L1 | Programmed Cell Death Protein 1 / Programmed Death-Ligand 1 |
References
- Lamptey, R.N.L.; Chaulagain, B.; Trivedi, R.; Gothwal, A.; Layek, B.; Singh, J. A Review of the Common Neurodegenerative Disorders: Current Therapeutic Approaches and the Potential Role of Nanotherapeutics. In Int J Mol Sci.; PubMed Central, 6 Feb 2022; Volume 23, 3. [Google Scholar] [CrossRef] [PubMed] [PubMed Central]
- Gao, W.; Jing, S.; He, C.; Saberi, H.; Sharma, H.S.; Han, F.; et al. Advancements in neurodegenerative diseases: Pathogenesis and novel neurorestorative interventions. J. Neurorestoratology 2025, 13(2), 100176. [Google Scholar] [CrossRef]
- Alzheimer’s disease facts and figures. Alzheimers Dement 2025, 21(4), e70235. [CrossRef] [PubMed Central]
- Li, M.; Ye, X.; Huang, Z.; Ye, L.; Chen, C. Global burden of Parkinson’s disease from 1990 to 2021: a population-based study. In BMJ Open; PubMed Central, 27 Apr 2025; Volume 15, 4, p. e095610. [Google Scholar] [CrossRef] [PubMed] [PubMed Central]
- Yin, X.; Qiu, Y.; Zhao, C.; Zhou, Z.; Bao, J.; Qian, W. The Role of Amyloid-Beta and Tau in the Early Pathogenesis of Alzheimer’s Disease. In Med Sci Monit Int Med J Exp Clin Res; PubMed Central, 2 Sep 2021; Volume 27, p. e933084-1-e933084-7. [Google Scholar] [CrossRef] [PubMed] [PubMed Central]
- Jahan, I.; Harun-Ur-Rashid, M.; Islam, MdA; Sharmin, F.; Al Jaouni, S.K.; Kaki, A.M.; et al. Neuronal plasticity and its role in Alzheimer’s disease and Parkinson’s disease. Neural Regen. Res. 2024, 21(1), 107–25. [Google Scholar] [CrossRef] [PubMed] [PubMed Central]
- Miculas, D.C.; Negru, P.A.; Bungau, S.G.; Behl, T.; Hassan, SS ul; Tit, D.M. Pharmacotherapy Evolution in Alzheimer’s Disease: Current Framework and Relevant Directions. Cells 2022, 12(1), 131. [Google Scholar] [CrossRef] [PubMed] [PubMed Central]
- Espay, A.J.; Kepp, K.P.; Herrup, K. Lecanemab and Donanemab as Therapies for Alzheimer’s Disease: An Illustrated Perspective on the Data ENEURO.0319-23.2024. In eNeuro; PubMed Central, 28 Jun 2024; 7, p. 11. [Google Scholar] [CrossRef] [PubMed Central]
- Boxer, A.L.; Sperling, R. Accelerating Alzheimer’s therapeutic development: The past and future of clinical trials. Cell. 2023, 186(22), 4757–72. [Google Scholar] [CrossRef]
- Cummings, J.L.; Osse, A.M.L.; Kinney, J.W.; Cammann, D.; Chen, J. Alzheimer’s Disease: Combination Therapies and Clinical Trials for Combination Therapy Development. In CNS Drugs; PubMed Central, 2024; Volume 38, 8, pp. 613–24. [Google Scholar] [CrossRef] [PubMed] [PubMed Central]
- Kannan, K.; Mohan, S. Targeting mTORC1/TGFB1 signaling with a novel Bergapten-Esculetin combination: a computational and experimental approach in idiopathic pulmonary fibrosis. Mol. Divers PubMed. 2025. [Google Scholar] [CrossRef] [PubMed]
- Wu, X.; Zheng, X.; Tang, H.; Zhao, L.; He, C.; Zou, Y.; et al. A network pharmacology approach to identify the mechanisms and molecular targets of curcumin against Alzheimer disease. Medicine 2022, 101(34), e30194. [Google Scholar] [CrossRef] [PubMed] [PubMed Central]
- Gangwal, A.; Ansari, I.; Sawale, J.A.; Ansari, A. Network pharmacology-guided identification and molecular validation of multi-target phytoconstituents from Gmelina arborea against Alzheimer’s disease. Silico Res. Biomed. 2026, 2, 100247. [Google Scholar] [CrossRef]
- Li, J.; Zhang, J.; Ke, J.; Ren, Z.; Feng, C. Integrative network pharmacology and machine learning identify potential targets of indole-3-lactic acid in colorectal cancer. PLoS ONE 2026, 21(3), e0344478. [Google Scholar] [CrossRef] [PubMed] [PubMed Central]
- Hossain, M.A.; Rahman, M.H.; Sultana, H.; Ahsan, A.; Rayhan, S.I.; Hasan, M.I.; et al. An integrated in-silico Pharmaco-BioInformatics approaches to identify synergistic effects of COVID-19 to HIV patients. In Comput Biol Med.; PubMed Central, Mar 2023; Volume 155, p. 106656. [Google Scholar] [CrossRef] [PubMed] [PubMed Central]
- Kannan, K.; Pillai, N.P.; Mohan, S.; Kuppusamy, S. Targeting HSP90AA1/mTOR signaling by a novel synergistic bioactive combination of Methotrexate and Vitexin (Vitex negundo L.) in lung cancer: An integrated network pharmacology and in-vitro validation approach. Food Biosci. 2026, 79, 108851. [Google Scholar] [CrossRef]
- Harakeh, S.; Niyazi, H.A.; Niyazi, H.A.; Abdalal, S.A.; Mokhtar, J.A.; Almuhayawi, M.S.; et al. Integrated Network Pharmacology Approach to Evaluate Bioactive Phytochemicals of Acalypha indica and Their Mechanistic Actions to Suppress Target Genes of Tuberculosis. ACS Omega 2023, 9(2), 2204–19. [Google Scholar] [CrossRef] [PubMed] [PubMed Central]
- wen, Ye X; H li, Wang; qing, Cheng S; L jing, Xia; fang, Xu X; X ri, Li. Network Pharmacology-Based Strategy to Investigate the Pharmacologic Mechanisms of Coptidis Rhizoma for the Treatment of Alzheimer’s Disease. In Front Aging Neurosci; PubMed Central, 21 Jun 2022; Volume 14. [Google Scholar] [CrossRef] [PubMed] [PubMed Central]
- Gao, X.; Li, S.; Cong, C.; Wang, Y.; Xu, L. A Network Pharmacology Approach to Estimate Potential Targets of the Active Ingredients of Epimedium for Alleviating Mild Cognitive Impairment and Treating Alzheimer’s Disease. In Evid-Based Complement Altern Med ECAM; PubMed Central, 28 Jan 2021; Volume 2021, p. 2302680. [Google Scholar] [CrossRef] [PubMed] [PubMed Central]
- Patil, N.; Dhariwal, R.; Mohammed, A.; Wei, L.S.; Jain, M. Network pharmacology-based approach to elucidate the pharmacologic mechanisms of natural compounds from Dictyostelium discoideum for Alzheimer’s disease treatment. Heliyon 2024, 10(8), e28852. [Google Scholar] [CrossRef] [PubMed]
- Shri, S.R.; Nayak, Y.; Ranganath Pai, S. Molecular docking studies and molecular dynamic simulation analysis: To identify novel ATP-competitive inhibition of Glycogen synthase kinase-3β for Alzheimer’s disease. F1000Research 2025, 13, 773. [Google Scholar] [CrossRef] [PubMed] [PubMed Central]
- Vijayakumar, S.; Manogar, P.; Prabhu, S.; Sanjeevkumar Singh, R.A. Novel ligand-based docking; molecular dynamic simulations; and absorption, distribution, metabolism, and excretion approach to analyzing potential acetylcholinesterase inhibitors for Alzheimer’s disease. J. Pharm. Anal. 2018, 8(6), 413–20. [Google Scholar] [CrossRef] [PubMed]
- Mazri, R.; Ouassaf, M.; Zekri, A.; Khan, S.U.; Rengasamy, K.R.R.; Alhatlani, B.Y. In Silico Network Pharmacology, Molecular Docking, and Molecular Dynamics Analysis of Rosemary-Derived Compounds as Potential HSP90 Inhibitors for Cancer Therapy. Curr. Issues Mol. Biol. 2025, 47(10), 860. [Google Scholar] [CrossRef] [PubMed] [PubMed Central]
- Vikhar Danish Ahmad A, Khan SW, Ali SA, Yasar Q. Network pharmacology combined with molecular docking and experimental verification to elucidate the effect of flavan-3-ols and aromatic resin on anxiety. Sci. Rep. 2024, 14(1), 9799. [CrossRef] [PubMed]
- Han, Y.; Liu, D.; Li, L. PD-1/PD-L1 pathway: current researches in cancer. Am. J. Cancer Res. 2020, 10(3), 727–42. [Google Scholar] [PubMed] [PubMed Central]
- Moadab, A.; Khorramdelazad, H.; Javar, M.T.A.; Nejad, M.S.M.; Mirzaie, S.; Hatami, S.; et al. Unmasking a Paradox: Roles of the PD-1/PD-L1 Axis in Alzheimer’s Disease-Associated Neuroinflammation. J. Neuroimmune Pharmacol. Off. J. Soc. NeuroImmune Pharmacol.;PubMed 2025, 20(1), 46. [Google Scholar] [CrossRef] [PubMed]
Figure 1.
Chemical structures of (A) Rivastigmine (C₁₄H₂₂N₂O₂) and (B) Epigallocatechin (C₁₅H₁₄O₇), illustrating their key functional groups and structural features relevant to their pharmacological activity in Alzheimer’s disease.
Figure 1.
Chemical structures of (A) Rivastigmine (C₁₄H₂₂N₂O₂) and (B) Epigallocatechin (C₁₅H₁₄O₇), illustrating their key functional groups and structural features relevant to their pharmacological activity in Alzheimer’s disease.

Figure 2.
Network-based pharmacology prediction of RVG and EGC targets in AD. (A) shows Venn diagrams and the overlap between predicted targets of RVG and EPG with AD-associated genes, highlighting the common targets considered for further analysis. (B) A PPI network constructed from the overlapping targets using Cytoscape, and the nodes indicate proteins and the edges indicate their functional connectivity. Identification of hub genes using the Cytohubba, with highlighted nodes representing the top-ranked genes (CDK2, PTPN11, CDK1, NFKB1, PRKACA, STAT1, GRB2, MAPK1, BRAF, and LYN) based on their degree of connectivity, suggesting its potential regulatory roles in Alzheimer’s disease.

Figure 3.
MCODE-based clustering of the RVG-EGC PPI network. Six functional clusters (Clusters 1-6) are extracted from the PPI network by the MCODE in Cytoscape, based on topological connectivity. Nodes represent proteins, while edges denote validated protein-protein interactions. Different node colors indicate individual protein members within each module. Cluster 1 (score: 10) represents the principal seed module and includes key hub proteins such as MAPK1, STAT1, and GRB2. The remaining clusters (Clusters 2-6) correspond to supporting functional modules associated with processes such as drug transport (e.g., ABCC1, SLC19A1) and metabolic regulation.

Figure 4.
Compound-Target-Pathway (CTP) network of RVG and EGC in AD. The network shows the interactions between RVG and EGC (yellow diamond nodes), their predicted target proteins (blue rectangular nodes), and key hub genes (pink circular nodes), along with enriched signaling pathways (purple triangular nodes). The central orange node represents AD. Edges indicate the relationships between compounds, targets, and pathways, indicating a multi-target and multi-pathway regulatory framework. The highlighted hub genes (e.g., STAT1, MAPK1, NFKB1, PRKACA, GRB2, CDK1, CDK2, BRAF, LYN, and PTPN11) suggest their critical involvement in disease-associated signaling pathways, emphasizing the potential synergistic action of RVG and EGC in modulating AD pathophysiology.

Figure 5.
Functional enrichment analysis of RVG and EGC associated with AD. (A) GO enrichment analysis showing the key enriched terms under Biological Process (green), Cellular Component (orange), and Molecular Function (blue). Bar lengths correspond to the enrichment magnitude of each term. (B) Bubble plot representing significantly enriched GO categories, bubble size corresponds to the number of associated genes, and color gradient represents statistical significance based on -log10(p-value), with darker shades indicating stronger significance.

Figure 6.
PD-1/PD-L1 pathway in cancer. PD-1/PD-L1 immune checkpoint signaling, highlighting key upstream regulators and downstream effects. Activation of pathways such as PI3K-AKT, MAPK, mTOR, NF-κB, and JAK/STAT promotes PD-L1 expression in tumor cells. The binding of PD-L1 to PD-1 on T cells inhibits T-cell receptor signaling via SHP2, leading to reduced T-cell activation, cytokine production, and proliferation, ultimately causing immune evasion and tumor progression.

Figure 7.
3D protein-ligand interaction poses of RVG and EGC with key AD targets. A (NFKB1: RVG), B (NFKB1: EGC), C (MAPK1: RVG), D (MAPK1: EGC), E (STAT1: RVG), F (STAT1: EGC), G (PRKACA: RVG), H (PRKACA: EGC), I (GRB2: RVG), J (GRB2: EGC). Ligands are represented as orange stick structures, and proteins are represented in ribbon form. Green dotted lines represent hydrogen-bond interactions with active position residues.

Figure 8.
2D protein-ligand interaction poses of RVG and EGC with key AD targets. A (NFKB1: RVG), B (NFKB1: EGC), C (MAPK1: RVG), D (MAPK1: EGC), E (STAT1: RVG), F (STAT1: EGC), G (PRKACA: RVG), H (PRKACA: EGC), I (GRB2: RVG), J (GRB2: EGC). Colored spheres show amino acid residues based on their physicochemical characteristics: green indicates hydrophobicity, blue indicates by positive charge, red indicates by negative charge, and cyan indicates by polar residues. Hydrogen bonds formed with backbone or side-chain residues are shown by pink arrows, while green lines correspond to π–cation contacts.

Figure 9.
RMSD profiles of Rivastigmine and Epigallocatechin complexes during molecular dynamics simulation. (A) Represents the RVG-MAPK1complex, showing gradual stabilization with significant ligand fluctuations at later simulation time, indicating conformational rearrangement within the binding pocket. (B) Represents the EGC-MAPK1 complex, indicating stable protein and ligand RMSD with minimal deviations, suggesting strong and consistent binding. The blue line indicates the protein backbone (Cα)-RMSD, and the red line indicates ligand-RMSD.

Figure 10.
RMSF profiles of Rivastigmine and Epigallocatechin complexes during molecular dynamics simulation. (A) RVG-MAPK1 complex. (B) EGC-MAPK1 complex. The plot represents residue-wise RMSF (Å) of the protein backbone (Cα) over the simulation period.
Figure 10.
RMSF profiles of Rivastigmine and Epigallocatechin complexes during molecular dynamics simulation. (A) RVG-MAPK1 complex. (B) EGC-MAPK1 complex. The plot represents residue-wise RMSF (Å) of the protein backbone (Cα) over the simulation period.

Figure 11.
Protein-ligand interaction profiles of RVG and EGC complexes during MD simulation. (A) RVG-MAPK1 complex. (B) EGC-MAPK1 complex. The bars represent interaction fractions of hydrophobic contacts, hydrogen bonds, water bridges, and ionic interactions, formed with individual residues over the simulation period.

Table 1.
Drug-likeness properties of RVG and EGC.
| Compounds Name | Molecular Weight (MW) | Hydrogen Bond Acceptor (HBA) | Hydrogen Bond Donor (HBD) | Lipophilicity (LogP) | Lipinski Rule | No. of Rotatable Bonds | Topological Polar Surface Area (TPSA) |
| RVG | 250.17 | 3 | 0 | 1.86 | 0 | 4 | 25.09 |
| EGC | 306.07 | 7 | 6 | 0.26 | 1 | 1 | 105.93 |
Table 2.
Computationally derived ADME and safety parameters of RIV and EPI.
| ADME/Toxicity Property | Reference Criterion for Favourability | RIV | EPI |
| Intestinal absorption (%) | >30% considered good absorption | 88.456% | 54.128% |
| Skin sensitization | Absence indicates safety | No | No |
| Blood-brain barrier permeability (BBB) | >0.3 indicates strong BBB permeability | 0.508 | -1.377 |
| CNS permeability (log BB) | log BB > -1 shows CNS penetration | -2.255 | -3.507 |
| hERG I channel inhibition | Absence suggests safety | No | No |
| Acute oral toxicity (LD50 mol/kg) | >1 suggests low toxicity | 3.402 | 2.492 |
| Chronic oral toxicity (LOAEL log mg/kg bw/day) | <2 indicates reduced chronic toxicity | 1.163 | 2.927 |
| Liver Toxicity | Absence indicates hepatosafety | No | No |
Table 3.
Hub genes and its scores.
| Gene | Code |
| NFKB1 | 40 |
| MAPK1 | 31 |
| STAT1 | 28 |
| PRKACA | 24 |
| GRB2 | 24 |
| LYN | 23 |
| PTPN11 | 22 |
| BRAF | 22 |
| CDK2 | 21 |
| CDK1 | 21 |
Disclaimer/Publisher’s Note: The statements, opinions and data contained in all publications are solely those of the individual author(s) and contributor(s) and not of MDPI and/or the editor(s). MDPI and/or the editor(s) disclaim responsibility for any injury to people or property resulting from any ideas, methods, instructions or products referred to in the content. |
© 2026 by the authors. Licensee MDPI, Basel, Switzerland. This article is an open access article distributed under the terms and conditions of the Creative Commons Attribution (CC BY) license (http://creativecommons.org/licenses/by/4.0/).
Copyright: This open access article is published under a Creative Commons CC BY 4.0 license, which permit the free download, distribution, and reuse, provided that the author and preprint are cited in any reuse.


