

Submitted:
22 May 2026
Posted:
26 May 2026
You are already at the latest version
Abstract
Background: Understanding how flywheel-derived mechanical outputs relate to match locomotor demands is essential for linking controlled neuromuscular assessments with on-field performance. This study examined whether unilateral conical flywheel hip-extension mechanics obtained at two inertial loads (0.107 and 0.133 kg·m²) were associated with GPS-derived external-load variables in elite female football players. Methods: Eighteen professionals completed hip-extension tests from which concentric and eccentric peak power, acceleration, velocity, eccentric:concentric ratios, and asymmetries were recorded, and these were correlated with high-metabolic-load distance (HMLD), maximal acceleration, maximal deceleration, maximal speed, high-speed running (HSR), and counts of explosive accelerations and decelerations. Results: No mechanical variable correlated significantly with HMLD (all p > 0.05). At 0.133 kg·m², maximal deceleration showed large positive correlations with concentric peak acceleration (r = 0.714, p = 0.002), eccentric peak acceleration (r = 0.667, p = 0.005) and eccentric peak speed (r = 0.562, p = 0.023), and large negative correlations with concentric (r = –0.731, p < 0.001) and eccentric peak power asymmetry (r = –0.686, p = 0.003). E:C ratios of the non-dominant limb were negatively associated with maximal speed (r = –0.677, p = 0.004) and HSR (r = –0.532, p = 0.034). Conclusions: These results indicate that high-inertia flywheel metrics capture neuromechanical qualities underpinning braking and sprint efficiency, supporting their integration with GPS monitoring for individualized inertia prescription and performance optimization.
Keywords:
flywheel training
; eccentric overload
; GPS
; acceleration
; deceleration
; high-speed running
; inter-limb asymmetry
; inertial load
; elite female football
1. Introduction
In football, actions such as sprinting, braking, and directional changes impose substantial demands on an athlete’s ability to absorb and reapply mechanical energy rapidly [1]. Indeed, decelerations have been shown to impose higher mechanical stress per meter than any other locomotor activity, contributing significantly to cumulative tissue loading and fatigue in match play [2]. Moreover, the physical evolution observed in women’s football over recent years should be taken into account [3,4].
Eccentric strength and control are therefore critical for performance and injury prevention. However, traditional resistance training, however, often fails to mimic the velocity-specific, high eccentric demand typical of match actions [5]. Flywheel inertial training addresses this limitation by providing variable resistance that adapts to the athlete’s output, enabling eccentric overload throughout the full range of motion [6].
The conical flywheel device extends this principle by allowing force application in horizontal or angled directions, better simulating the neuromechanical demands of sprint-decay and braking tasks [7]. The athlete’s output and the rotational inertia of the device jointly determine the resistive torque, meaning that altering the moment of inertia modulates the mechanical stimulus: low inertial loads emphasize high-velocity concentric actions, while high inertial loads emphasize eccentric braking and control [8,9]. Indeed, Keijzer et al. [9] found that in unilateral hip extension exercises, higher inertial loads elicited greater eccentric peak power compared to lower inertial loads.
This load-dependent mechanical behavior is not only of theoretical interest but has direct implications for neuromuscular adaptation. High-inertia flywheel loading enhances eccentric torque, motor unit recruitment in lengthening contractions, and joint stabilization demands [10]. In football, these eccentrically dominated capacities are essential during repeated cycles of acceleration and deceleration, which can exceed 400 instances per match [11]. Moreover, asymmetries between limbs—that may arise from habitual dominance—can negatively affect performance and increase injury risk, making unilateral assessment through flywheel training a valuable tool for profiling neuromuscular balance [12].
Despite advances in flywheel mechanistic research, few studies have explored how mechanical outputs from flywheel devices relate to real performance metrics. Most literature to date has focused on pre–post intervention effects in controlled tests (e.g. sprint time, jump height, change-of-direction tasks), rather than the ecological translation to match-derived indicators [13]. Conversely, Global Positioning System (GPS) have become a gold standard for tracking external load in football, quantifying metrics such as high metabolic load distance (HMLD), high-speed running (HSR), maximal acceleration (max.acc), and maximal deceleration (max.dec)— variables that directly reflect competitive locomotor and mechanical demands [4].
Understanding whether mechanical qualities assessed through flywheel training translate to on–field performance is of great practical importance, as it offers coaches and sport scientists a bridge between controlled neuromuscular diagnostics and match-specific performance data. If strong correlations exist, practitioners may individualize flywheel loading or target specific mechanical traits based on GPS-derived performance profiles. For example, poor deceleration metrics might inform the design of high-inertia eccentric training to enhance braking capacity and neuromuscular resilience.
Therefore, this study aimed to examine the relationships between mechanical outputs obtained from unilateral conical flywheel exercises at two different inertial loads (0.107 and 0.133 kg·m2) and GPS-derived variables in elite female soccer players. Specifically, we investigated how concentric and eccentric peak power, acceleration, velocity, eccentric:concentric power ratios (E:C ratio), and inter-limb asymmetries relate to GPS metrics including HMLD, HSR, maximal acceleration, maximal deceleration, and counts of explosive accelerations and decelerations.
We hypothesized that greater eccentric outputs and lower inter-limb asymmetries, particularly under the higher inertia (0.133 kg·m2), would correlate positively with maximal acceleration and deceleration. Conversely, excessive eccentric dominance—especially in the non-dominant limb—was expected to show negative associations with high-speed locomotion (HMLD and HSR) due to inefficiencies in cyclical force production.
2. Materials and Methods
2.1. Study Design
A randomized, repeated-measures, cross-sectional design was employed. The study adhered to the STROBE reporting guidelines [14]. To complement the laboratory-based mechanical profiling, external load data were monitored using GPS tracking devices (UBIKO, Spain). Specifically, match and training data were collected over a four-week period preceding and a four-week period following the isoinertial hip extension assessment. This approach enabled the integration of controlled mechanical testing outputs with ecologically valid, match-derived performance metrics. All GPS raw data were exported to Excel format for subsequent statistical analysis.
2.2. Study Population
Eighteen elite female professional football players competing in the Spanish first division were enrolled in this study. Participants’ descriptive characteristics were as follows: age (27 ± 4 years), height (168.2 ± 6.3 cm), and body mass (59.9 ± 6.5 kg).
Inclusion criteria required at least six months of consistent participation in structured lower-body resistance training programs, particularly those incorporating eccentric overload strategies [15]. Regular attendance at a minimum of five pitch-based training sessions per week was also mandatory.
Exclusion criteria included any musculoskeletal or neurological lower-limb injury within the prior six months, as well as the use of pharmacological agents or substances that could influence neuromuscular performance during testing.
All players had prior exposure to eccentric overload (EOL) exercises and were familiar with the flywheel hip extension protocol, as these were integrated components of their club’s physical preparation and weekly monitoring routines.
Ethical approval for this study was obtained from the Research Ethics Committee of Blanquerna–Ramon Llull University (Barcelona, Spain). All procedures conformed to the principles of the Declaration of Helsinki for research involving human subjects [16]. Written informed consent was obtained from all participants after they were informed about the study’s aims, benefits, and potential risks.
2.3. Statistical Analysis
All data were analyzed using JASP software (version 0.18.3, University of Amsterdam, The Netherlands). Descriptive statistics were calculated for all variables and presented as means ± standard deviations. Normality was verified for each variable using the Shapiro–Wilk test. As all data showed a normal distribution, Pearson’s product–moment correlation coefficient (r) was used to assess the relationships between the mechanical outputs obtained from the flywheel conical device (at 0.107 and 0.133 kg·m2) and the external load variables derived from GPS monitoring during match play.
The magnitude of correlations was interpreted according to Cohen’s thresholds: trivial (r < 0.1), small (0.1–0.3), moderate (0.3–0.5), large (0.5–0.7), very large (0.7–0.9), and nearly perfect (>0.9). The significance level was set at p < 0.05, and tendencies were considered when 0.05 ≤ p < 0.10.
For visualization, correlation coefficients were plotted in heatmaps to represent both the direction and strength of the relationships between GPS-derived variables (e.g., high-metabolic distance, maximal acceleration, maximal deceleration, high-speed running, number of explosive accelerations/decelerations) and flywheel mechanical metrics (e.g., concentric and eccentric peak power, acceleration, velocity, E:C ratio, and asymmetries). Only the strongest and statistically significant associations were retained for graphical representation and subsequent discussion.
All analyses were performed separately for each moment of inertia (0.107 and 0.133 kg·m2), and differences in the correlation patterns between loads were qualitatively interpreted to identify potential load-dependent relationships between mechanical outputs and match performance indicators.
Generative artificial intelligence was only used to produce graphical visualizations based on the results obtained in this study. No GenAI tools were used for study design, data collection, data processing, statistical analyses, or interpretation of findings. All numerical results, datasets, and protocols remain fully original and reproducible.
3. Results
3.1. HMLD
At both 0.107 and 0.133 kg·m2, no significant correlations were observed between hmld and mechanical outputs (all p > 0.05). The strongest non-significant associations were negative for the E:C ratio of the non-dominant limb (0.107: r = –0.464, p = 0.1070; 0.133: r = –0.400, p = 0.105), suggesting a tendency for higher eccentric bias in the non-dominant limb to be related with reduced high-metabolic distance.
3.2. Maximal Deceleration
At 0.107 kg·m2, significant positive correlations were found between max.dec and non-dominant eccentric peak power (r = 0.624, p = 0.010) and E:C ratio (r = 0.515, p = 0.041). Conversely, eccentric peak power asymmetry was strongly and negatively correlated with max.dec (r = –0.689, p = 0.003).
At 0.133 kg·m2, max.dec was strongly associated with multiple eccentric and concentric outputs. Significant positive correlations were identified with dominant eccentric peak acceleration (r = 0.618, p = 0.011), non-dominant eccentric peak power (r = 0.517, p = 0.040), concentric peak acceleration (r = 0.714, p = 0.002), eccentric peak acceleration (r = 0.667, p = 0.005), and eccentric peak speed (r = 0.562, p = 0.023). In contrast, strong negative correlations emerged with concentric (r = –0.731, p < 0.001) and eccentric peak power asymmetry (r = –0.686, p = 0.003), as well as with concentric peak acceleration asymmetry (r = –0.527, p = 0.036) (Figure 1, Figure 2, Figure 3, Figure 4, Figure 5 and Figure 6).
3.3. Maximal Speed
At 0.107 kg·m2, max.speed showed a significant negative correlation with the eccentric:concentric power ratio of the non-dominant limb (r = –0.677, p = 0.004). A positive but non-significant trend was observed for non-dominant concentric peak acceleration (r = 0.488, p = 0.055).
At 0.133 kg·m2, max.speed was positively correlated with eccentric peak power asymmetry (r = 0.653, p = 0.006). A moderate but non-significant trend was also found for concentric peak power asymmetry (r = 0.439, p = 0.089).
3.4. Maximal Acceleration
At 0.107 kg·m2, max.acc was significantly correlated with eccentric peak power asymmetry (r = 0.566, p = 0.022), while eccentric peak speed asymmetry showed a non-significant trend (r = 0.453, p = 0.1078).
At 0.133 kg·m2, no significant associations were observed (all p > 0.05). The strongest tendencies were with dominant eccentric peak acceleration (r = 0.408, p = 0.117) and concentric peak speed (r = 0.1336, p = 0.203) (Figure 7).
3.5. High-Speed Running (HSR)
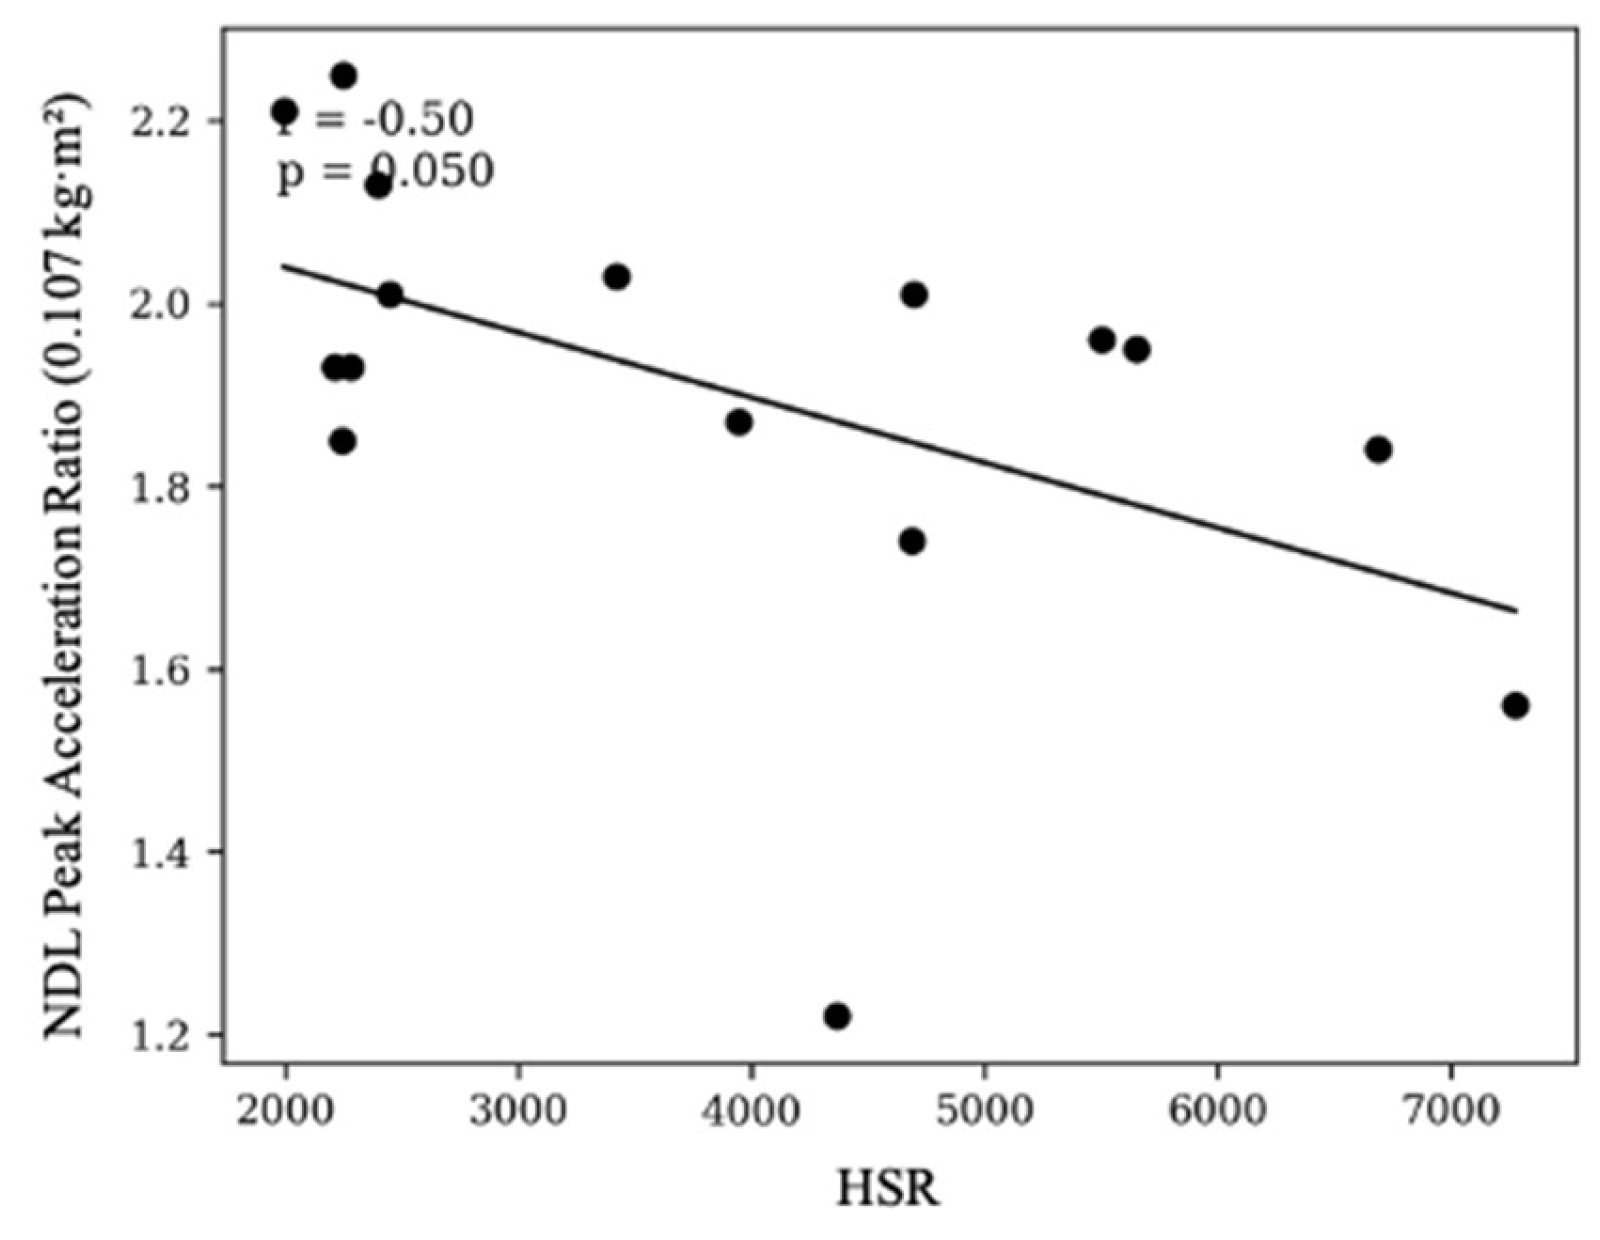
At 0.107 kg·m2, hsr was negatively correlated with the E:C ratio of the non-dominant limb (r = –0.498, p = 0.050). Trends were observed for non-dominant concentric peak acceleration (r = 0.451, p = 0.1079), and asymmetries in concentric acceleration (r = –0.482, p = 0.058) and concentric peak power (r = –0.445, p = 0.084).
At 0.133 kg·m2, hsr also demonstrated a significant negative correlation with the E:C ratio of the non-dominant limb (r = –0.532, p = 0.034), confirming consistency across inertial loads (Figure 8).
3.6. Number of Explosive Decelerations
At 0.107 kg·m2, no significant associations were observed (all p > 0.05), although a negative trend appeared for the non-dominant E:C ratio (r = –0.456, p = 0.1076).
At 0.133 kg·m2, num.dec.expl was significantly correlated with the E:C ratio of the dominant limb (r = –0.499, p = 0.049). Non-significant but close-to-threshold trends were observed with eccentric (r = 0.476, p = 0.062) and concentric (r = 0.469, p = 0.067) peak power asymmetry.
3.7. Number of Explosive Accelerations
At 0.107 kg·m2, no significant correlations were found (all p > 0.05). The strongest, albeit non-significant, was a negative trend with the non-dominant E:Cratio (r = –0.456, p = 0.1076).
At 0.133 kg·m2, num.acc.expl showed significant associations with both negative and positive markers. A negative correlation was found with the E:C ratio of the dominant limb (r = –0.506, p = 0.046), whereas positive correlations were observed for concentric (r = 0.543, p = 0.030) and eccentric (r = 0.499, p = 0.049) peak power asymmetry (Figure 9 and Figure 10).
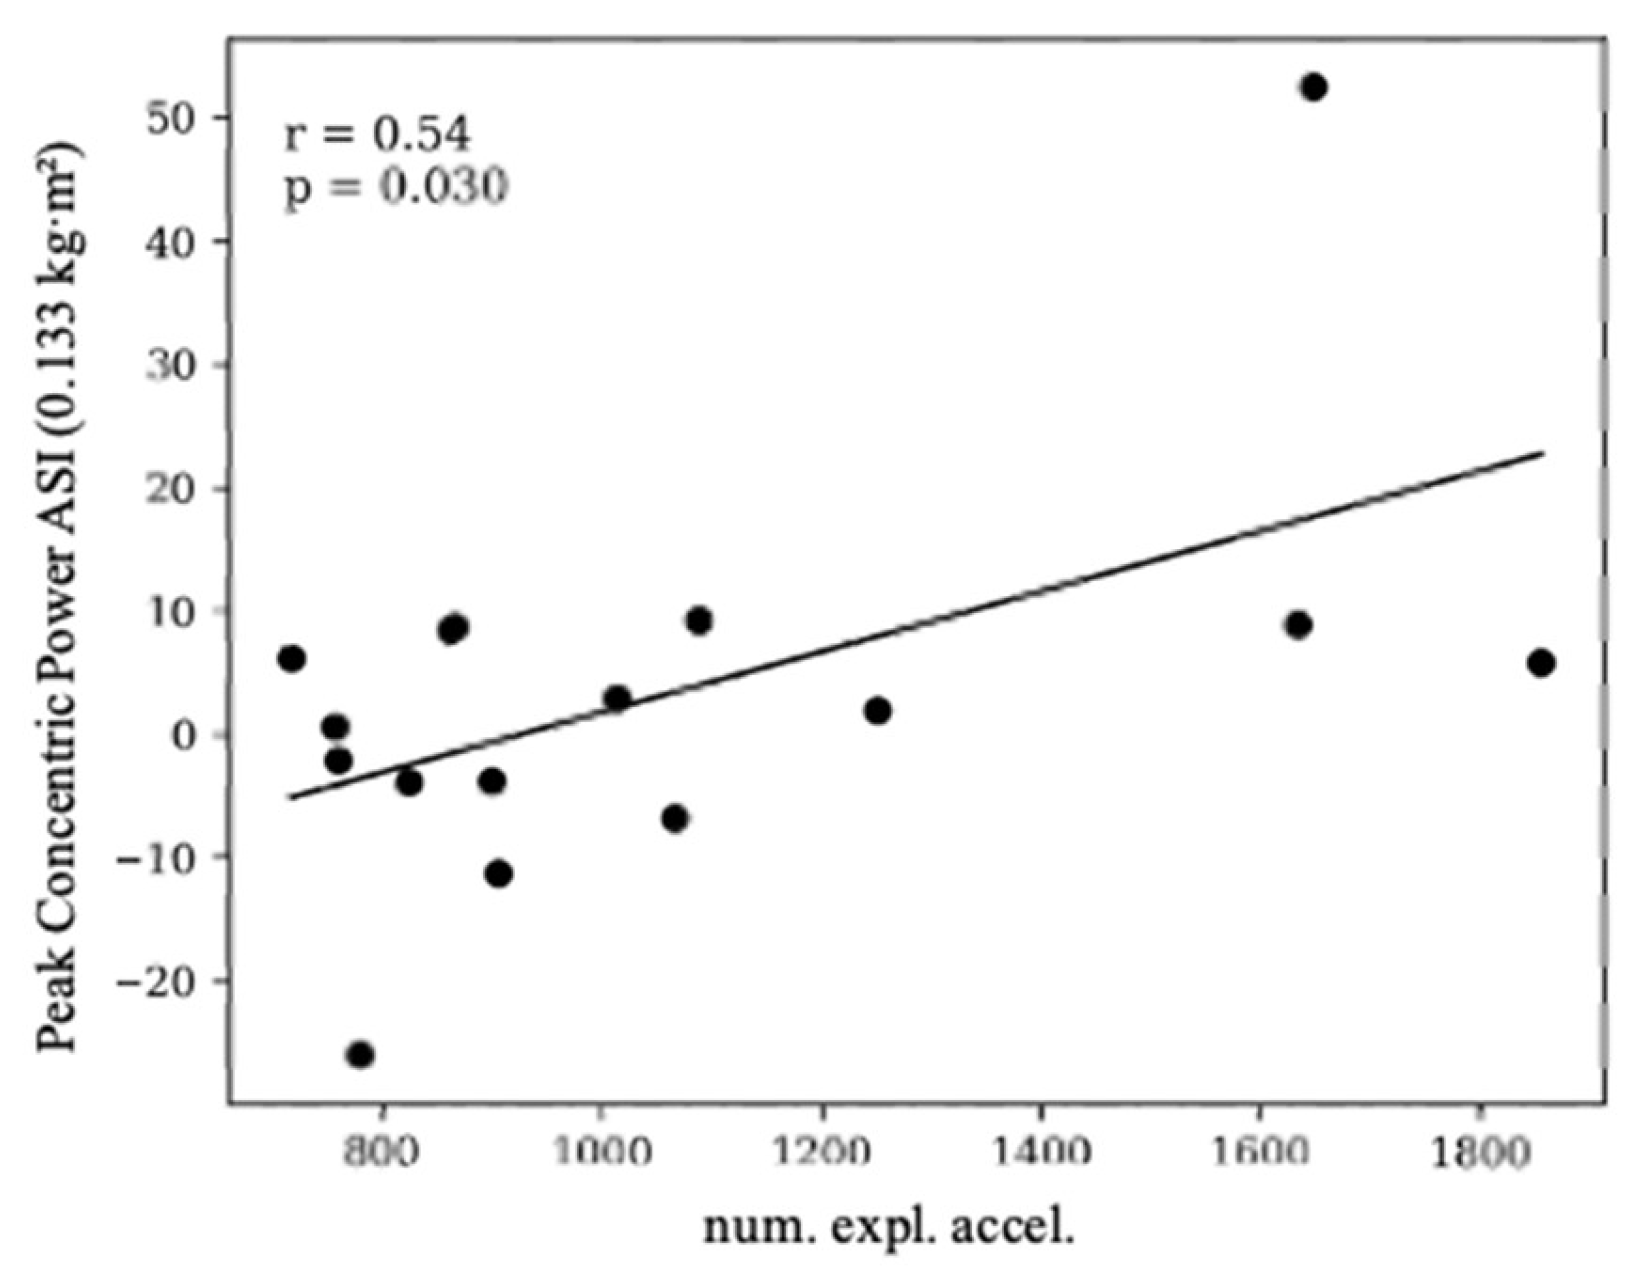
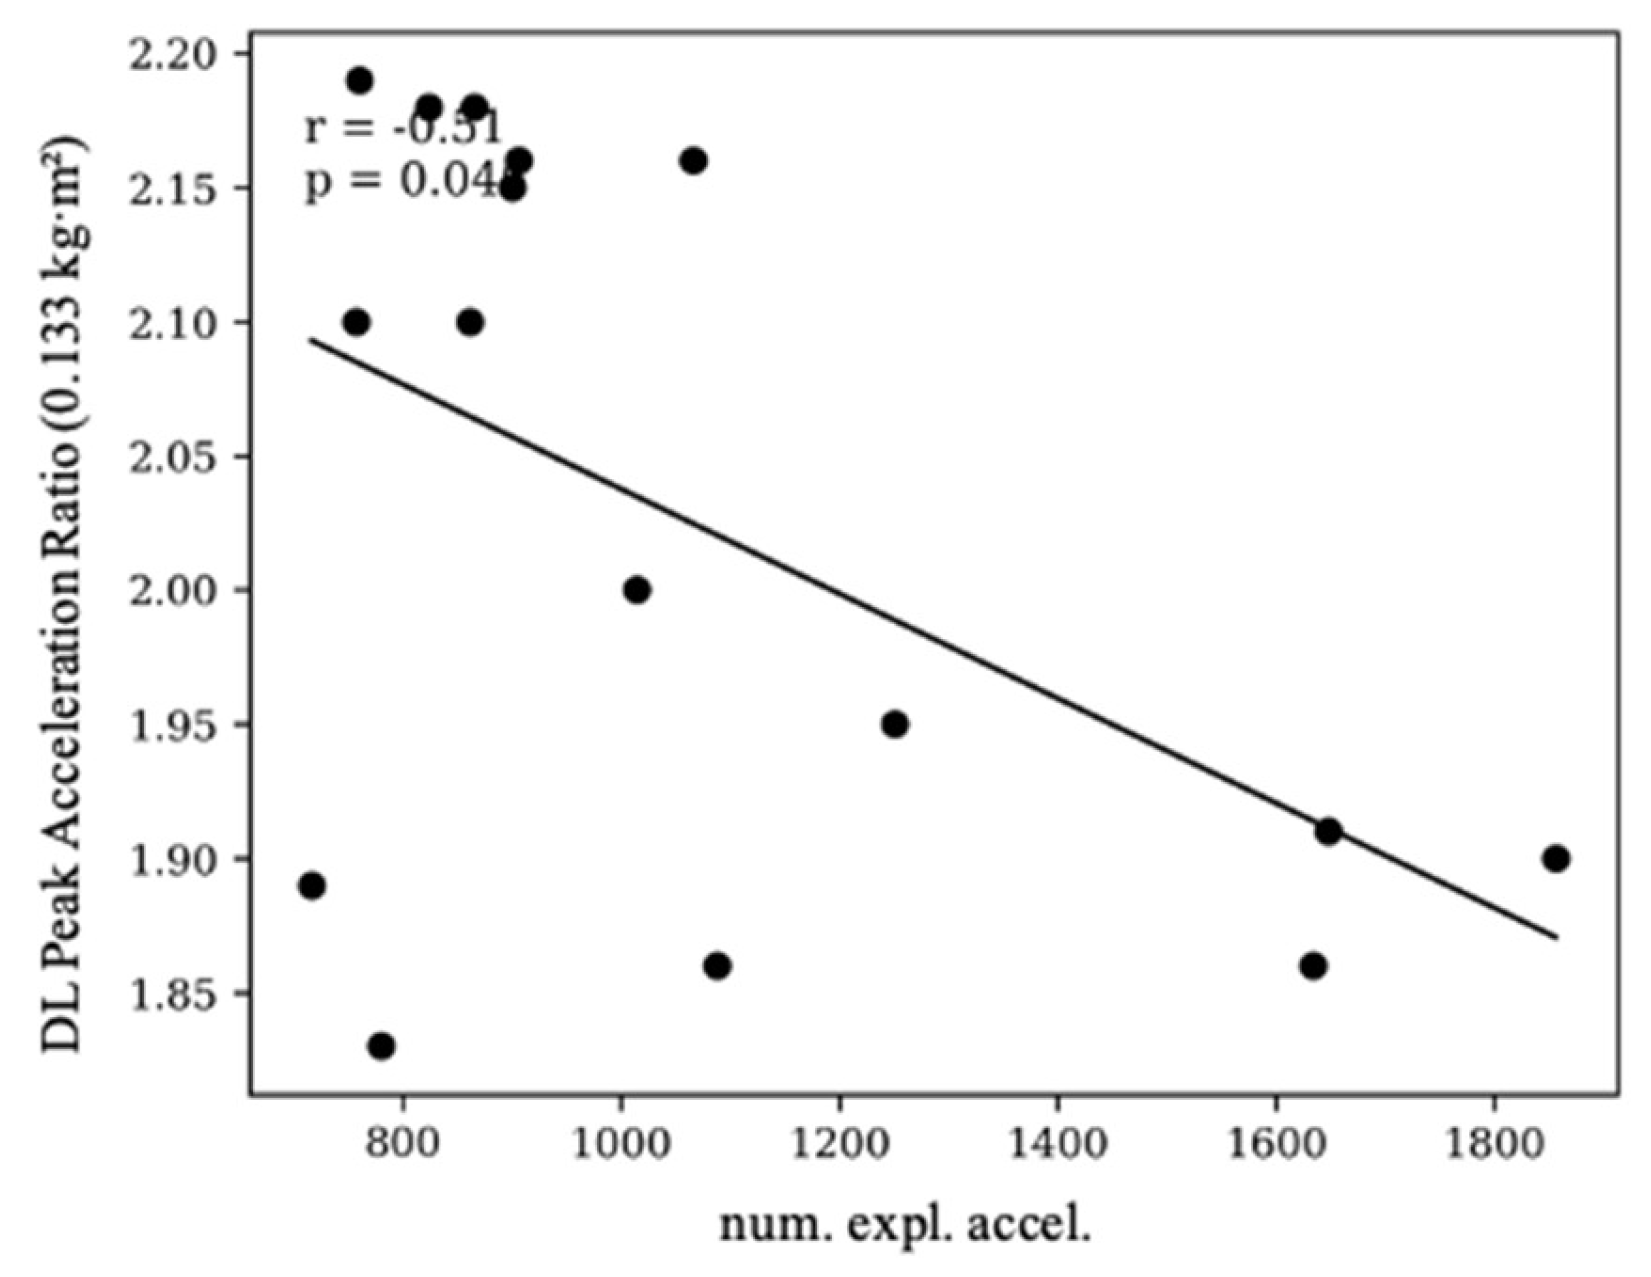
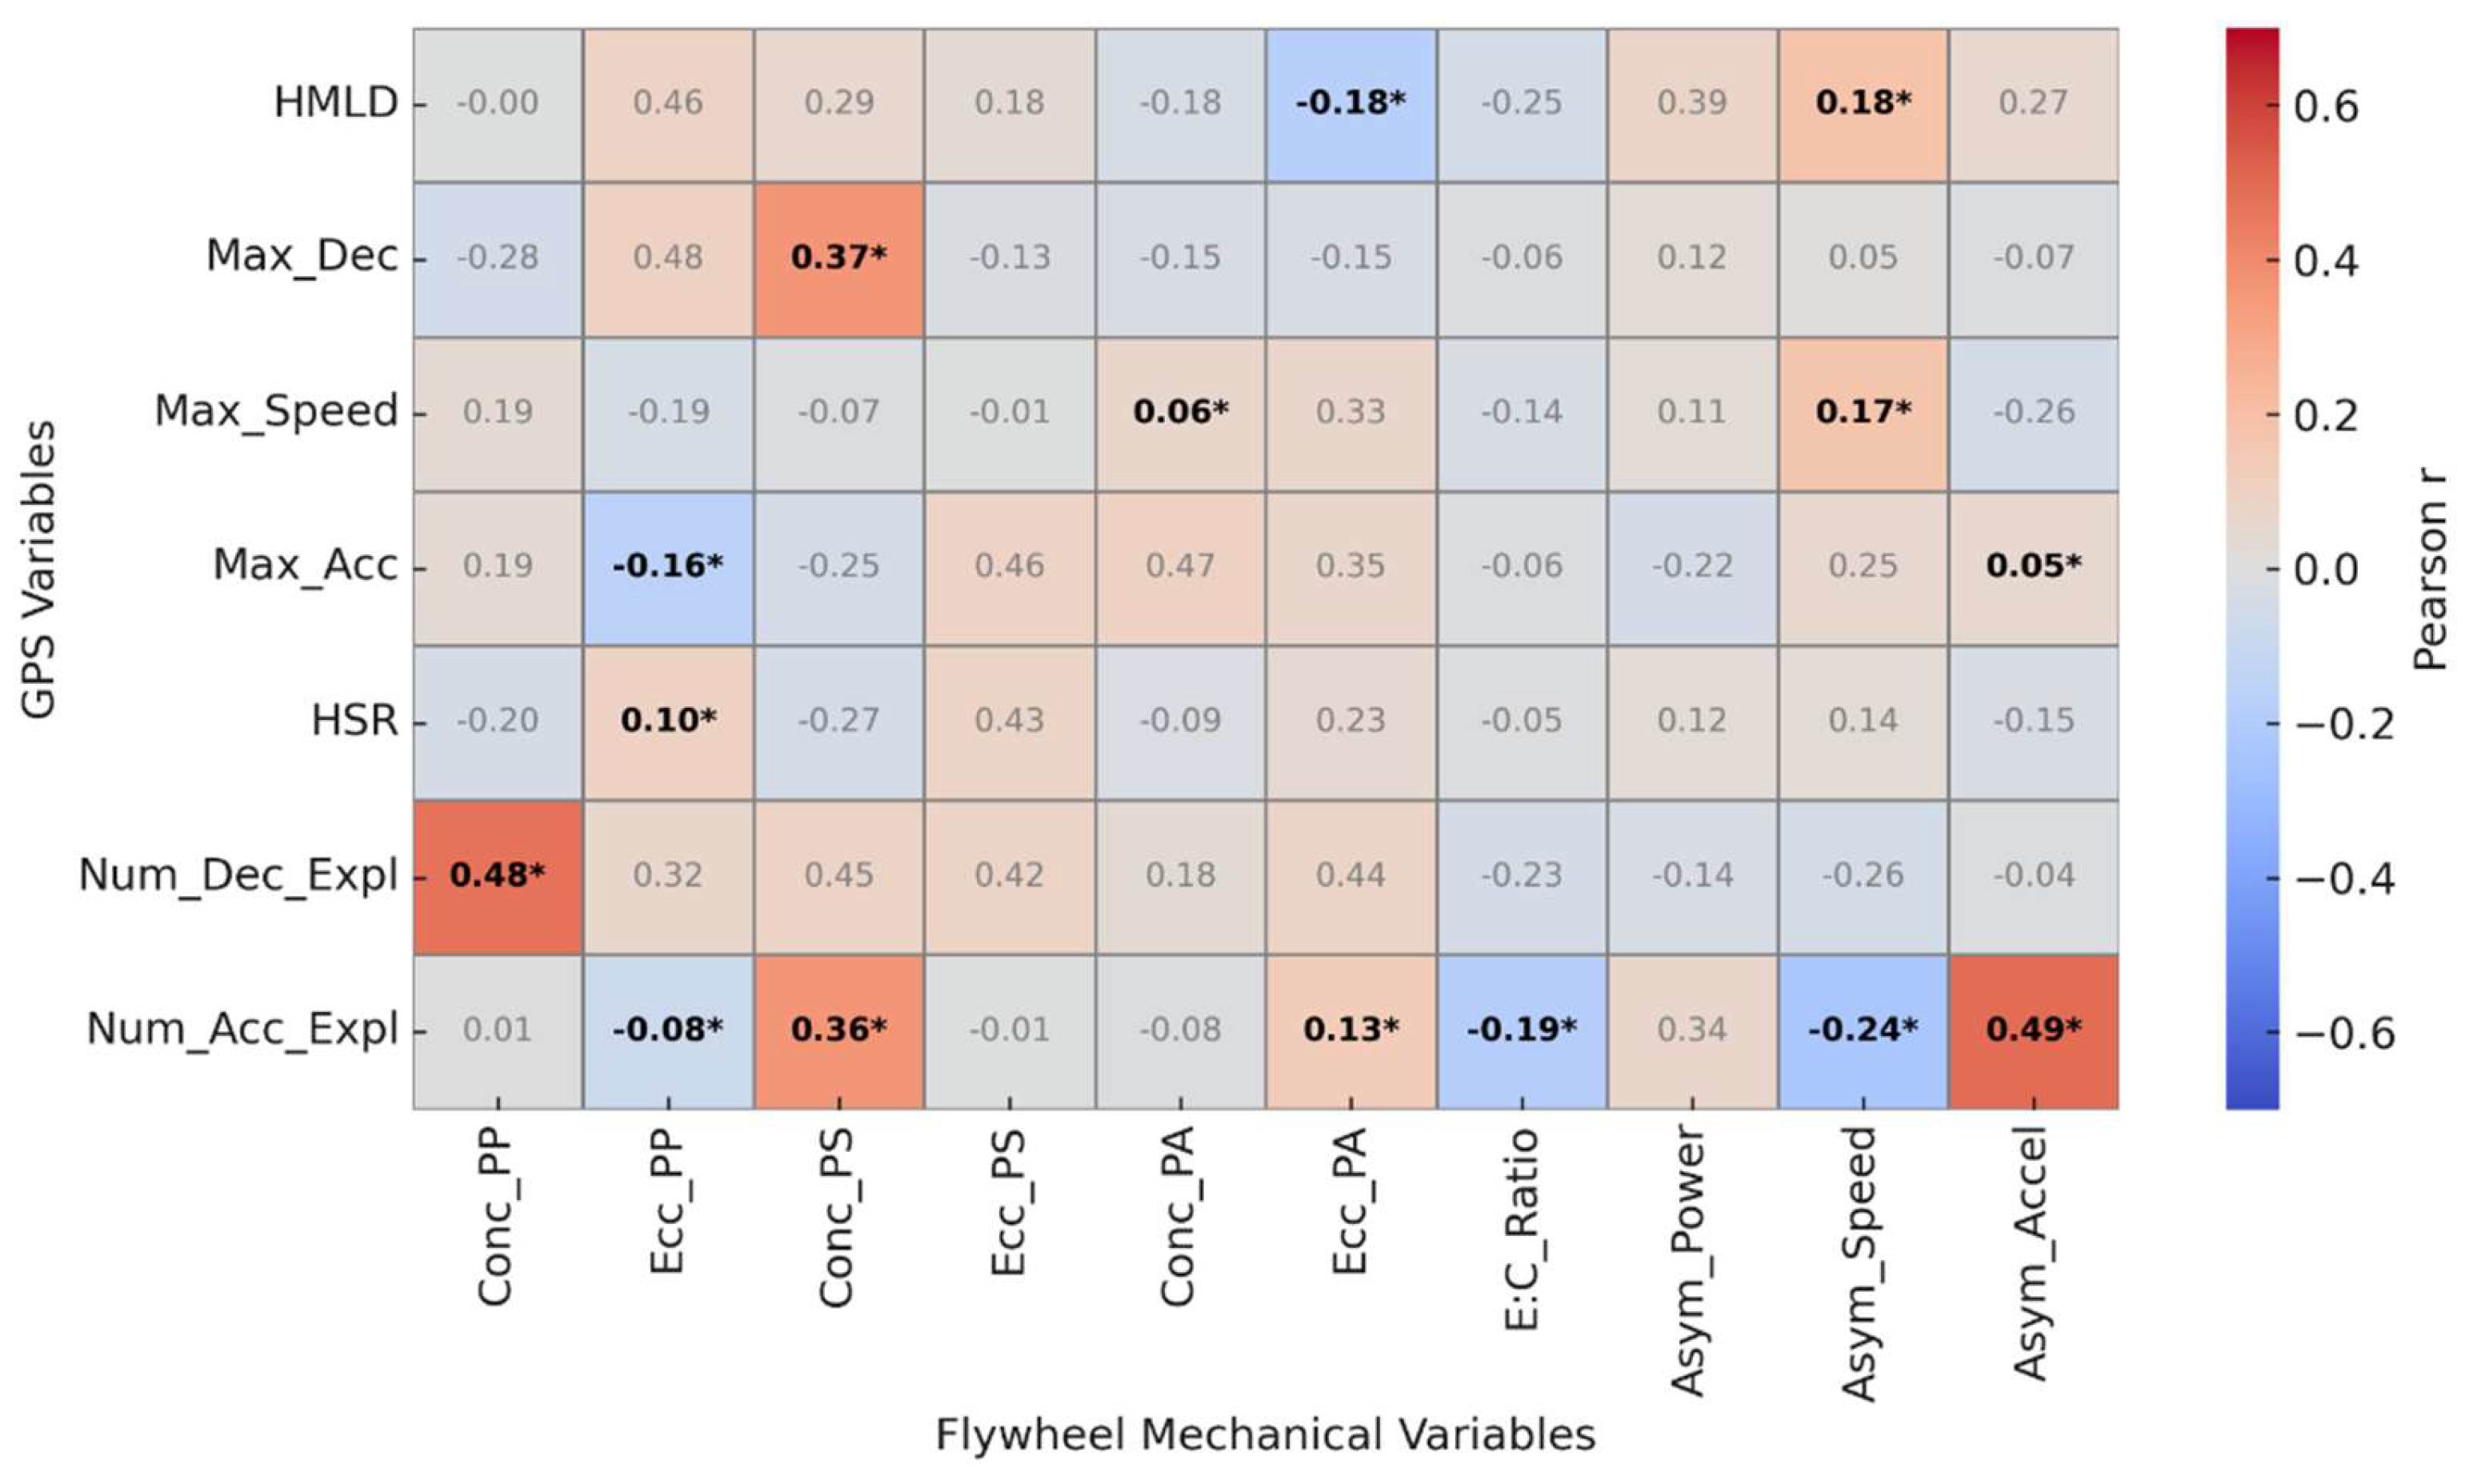
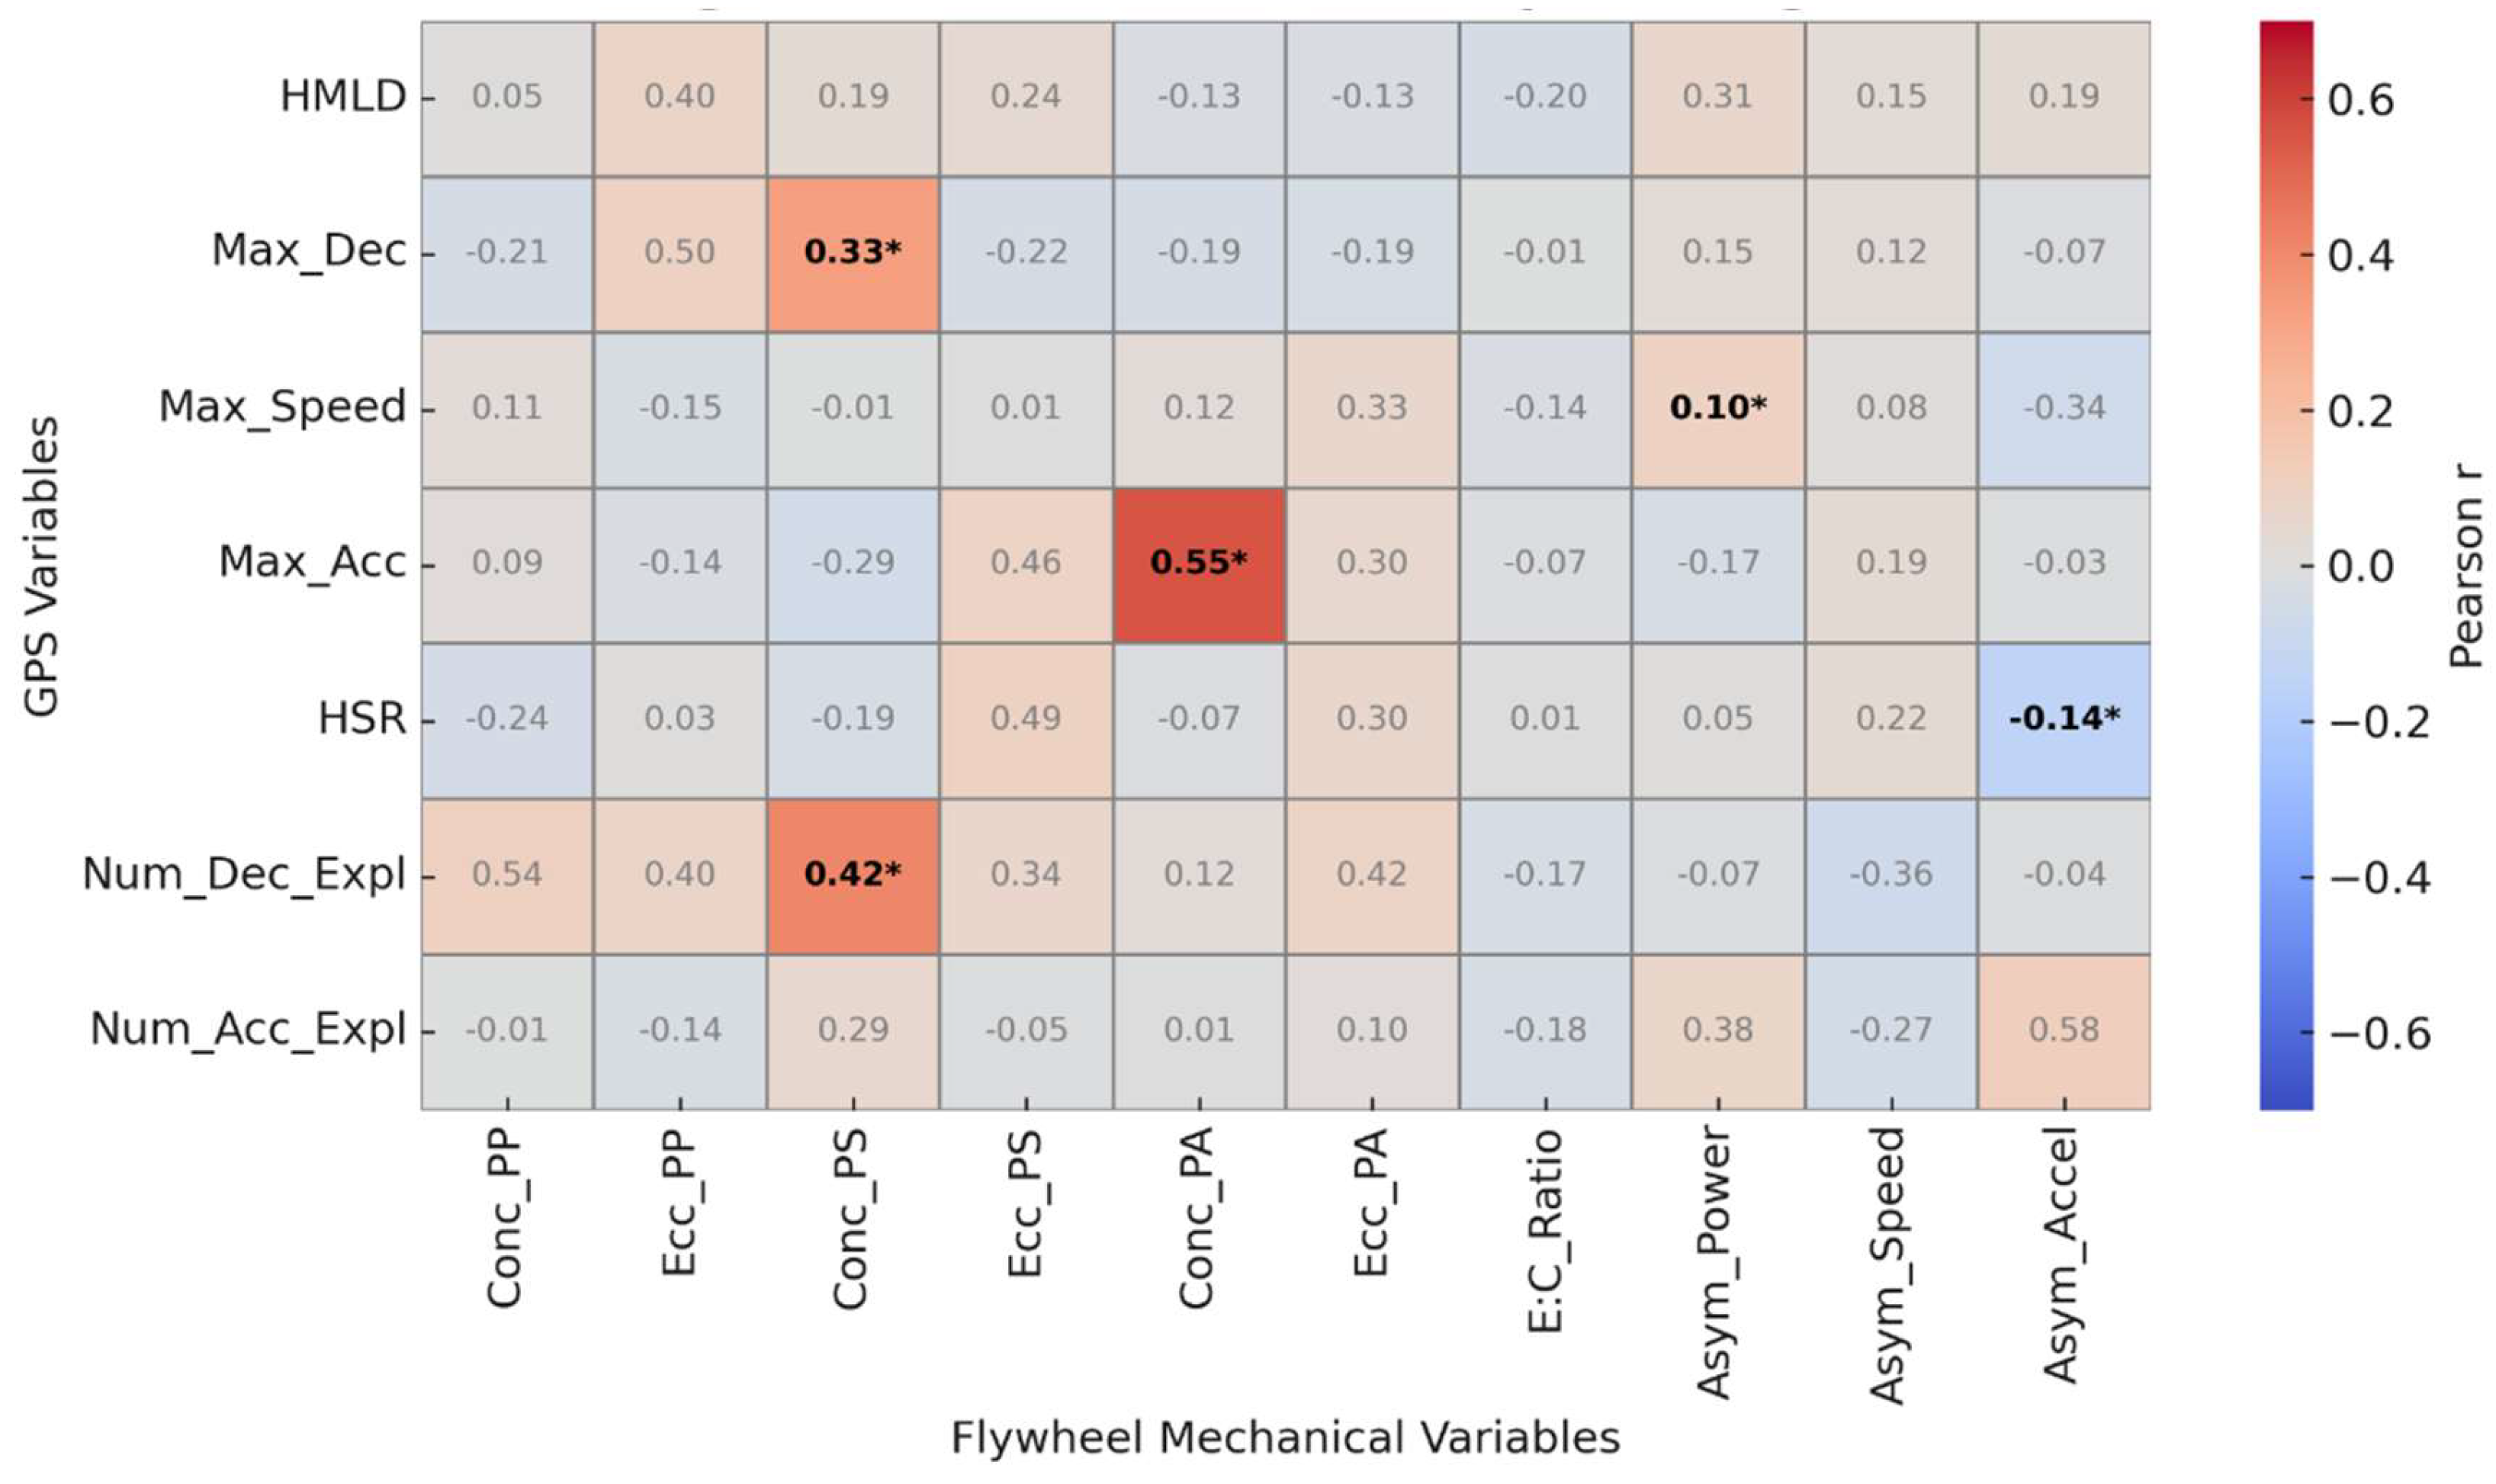
Figure 9.
Relationship between Non-Dominant Limb Peak Concentric Power ASI (0.133 kg·m2) and number of Explosive Accelerations.
Figure 9.
Relationship between Non-Dominant Limb Peak Concentric Power ASI (0.133 kg·m2) and number of Explosive Accelerations.
Figure 10.
Relationship between Dominant Limb Peak Acceleration Ratio (0.133 kg·m2) and number of Explosive Accelerations.
Figure 10.
Relationship between Dominant Limb Peak Acceleration Ratio (0.133 kg·m2) and number of Explosive Accelerations.
Figure 11.
Correlation between mechanical isoinertial variables at 0.107 kg·m2 and GPS variables.
Figure 12.
Correlation between mechanical isoinertial variables at 0.133 kg·m2 and GPS variables.
3.8. Practical Applications
The present findings provide practitioners with actionable insights into how flywheel training variables relate to match performance demands in elite female football players. The load-dependent nature of the correlations observed indicates that different inertial loads elicit distinct neuromechanical adaptations, each relevant to specific phases of play.
High-inertia loads (0.133 kg·m2) should be prioritized when the objective is to enhance eccentric braking capacity, rapid force absorption, and change-of-direction control. The strong correlations between eccentric outputs and maximal deceleration confirm that heavier inertial resistance effectively reproduces the mechanical demands of braking during match play. Implementing such loads within unilateral exercises—like conical hip extensions—can improve an athlete’s ability to tolerate and reapply high braking forces, contributing to both performance and injury resilience.
In contrast, low-inertia loads (0.107 kg·m2) emphasize concentric velocity and cyclical efficiency, which are critical for sprinting and repeated high-speed efforts. Players exhibiting reduced high-speed running or maximal sprint values despite adequate eccentric performance may therefore benefit from lighter inertial training aimed at improving concentric rate of force development and running economy.
Furthermore, the relationships between power asymmetries and acceleration performance highlight that moderate, task-specific asymmetries can be functionally advantageous, reflecting natural limb specialization for propulsion and braking. Coaches should monitor asymmetry indices longitudinally to distinguish between functional asymmetries that support performance and maladaptive ones that elevate injury risk. Integrating periodic flywheel profiling sessions allows staff to detect changes in mechanical balance and adjust training accordingly.
From a monitoring perspective, the combination of flywheel mechanical data and GPS metrics offers a powerful diagnostic framework. Tracking eccentric–concentric ratios, inter-limb asymmetries, and inertial outputs alongside match-derived locomotor data enables practitioners to build individualized load–response profiles for each player. This integration can support precision periodization, informing when to emphasize high-inertia eccentric work (for deceleration robustness) or low-inertia concentric work (for re-acceleration and sprint efficiency).
In practical terms, these results suggest that flywheel devices can serve not only as training tools but also as monitoring instruments to detect neuromuscular readiness and guide individualized loading strategies. By aligning inertial prescriptions with on-field performance profiles, coaches can enhance the transfer of strength qualities to competition, optimize load management, and mitigate mechanical stress across the competitive season.

Table 1.
Practical framework for individualized inertia selection and flywheel load prescription in elite female football players.
Table 1.
Practical framework for individualized inertia selection and flywheel load prescription in elite female football players.
| Performance Target | Inertial Load Prescription | Neuromechanical Focus | Flywheel Mechanical Variables | Match GPS Indicators | Practical Recommendations |
| Acceleration / Sprint Efficiency | Low inertia (~0.107 kg·m2) | Emphasize concentric velocity, rate of force development, and cyclical efficiency. | ↑ Concentric peak power, ↑ concentric velocity, balanced E:C ratio. | ↑ Max Speed, ↑ HSR, ↑ HMLD. | Use during speed-oriented phases or in players showing limited HSR or maximal sprint performance. Combine with resisted sprints or plyometrics for transfer. |
| Acceleration–Deceleration Transition | Moderate inertia (0.15–0.25 kg·m2) | Optimize stretch–shortening control and elastic energy reutilization. | ↑ Avg concentric/excentric power balance, ↓ asymmetry ratio. | ↑ Num.acc.expl, ↑ Num.dec.expl. | Useful during pre-season or reconditioning blocks to enhance efficiency in direction changes and repeated sprint ability. |
| Deceleration / Braking Control | High inertia (0.133 kg·m2) | Emphasize eccentric braking, stability, and force absorption under high mechanical load. | ↑ Eccentric peak power, ↑ E:C ratio (within functional range), controlled asymmetry. | ↑ Max Dec, ↓ deceleration fatigue. | Apply to players with limited deceleration capacity or high injury risk. Integrate in RTP and injury-prevention protocols. |
| Monitoring Integration | — | Combine flywheel and GPS data for individualized profiling. | Track E:C ratios, inter-limb asymmetries, eccentric/concentric peaks over time. | Relate mechanical trends with match locomotor data (HSR, Dec, Acc). | Use to guide weekly load adjustments, detect fatigue, and evaluate transfer of strength gains to match performance. |
4. Discussion
The main finding of this study was that flywheel mechanical outputs obtained during unilateral hip extension exercises were significantly associated with GPS variables in elite female football players, and that these associations were load-dependent. Stronger and more numerous correlations were observed under the higher inertial load (0.133 kg·m2), particularly between eccentric and concentric mechanical outputs and maximal deceleration, whereas lighter loads (0.107 kg·m2) yielded fewer and weaker associations. These results suggest that the neuromechanical qualities expressed under high-inertia flywheel conditions better reflect the demands of high-intensity locomotor performance during training and match play.
4.1. Load-Dependent Relationships and Eccentric Contribution
The results revealed a clear load-dependent pattern across several match variables. While the strongest and most consistent associations were found for maximal deceleration, significant relationships also appeared for explosive accelerations, maximal speed, and high-speed running. This indicates that manipulating the flywheel moment of inertia influences not only eccentric braking capacity but also the athlete’s ability to alternate efficiently between deceleration and propulsion—highlighting the multidimensional role of eccentric strength in football performance.
At 0.133 kg·m2, maximal deceleration correlated strongly with both concentric and eccentric mechanical outputs (r = 0.6–0.7), in agreement with studies showing that high-inertia flywheel training enhances eccentric torque, joint stability, and stretch–shortening control [17,18,19]. Because decelerations are among the most mechanically demanding match actions players with superior eccentric capacity can dissipate and reapply force more effectively, thus reducing mechanical strain and recovery demands [1,19].
Beyond braking actions, higher inertial loads also showed positive correlations with the number of explosive accelerations, suggesting that eccentric-oriented training may facilitate propulsive efficiency by improving the transition from braking to re-acceleration. This agrees with evidence that enhanced eccentric strength improves elastic energy reutilization and motor coordination [20]. The ability to accelerate rapidly following a deceleration therefore depends on the eccentric–concentric interplay that governs how efficiently athletes reuse stored elastic energy. Our findings support the notion of functional inter-limb specialization, where one limb contributes predominantly to braking (eccentric) and the other to propulsion (concentric), potentially improving repeated sprint performance [21].
4.2. Speed and High-Speed Locomotor Efficiency
In addition to acceleration–deceleration actions, significant correlations were observed between mechanical asymmetries and maximal sprint speed, as well as negative correlations between eccentric:concentric ratios and high-speed running (HSR) and high-metabolic load distance (HMLD). These results suggest that while moderate asymmetries may support sprint specialization, excessive eccentric dominance—especially in the non-dominant limb—can impair cyclical running efficiency due to reduced elastic return and prolonged ground contact time [22,23]. This dual behavior reflects the delicate balance between functional and maladaptive asymmetries: controlled asymmetry can enhance task-specific performance when supported by sufficient overall strength and coordination [19,24].
Together, these results indicate that different inertial loads produce differentiated neuromechanical expressions linked to distinct locomotor behaviors. Low inertias (0.107 kg·m2) emphasize concentric velocity and cyclic efficiency—qualities relevant for sprinting and high-speed running—whereas higher inertias (0.133 kg·m2) enhance eccentric braking, rapid force absorption, and transition efficiency between braking and propulsion. This supports the concept of a force–velocity–inertia continuum and underscores the importance of selecting individualized inertia to target specific football performance capacities [23].
4.3. Asymmetries, Ratios, and Individualized Profiling
The relationships observed between power asymmetries and match locomotor variables emphasize the need to interpret asymmetry as context-dependent rather than inherently positive or negative. Moderate asymmetries in mechanical power may facilitate limb specialization for sprint and acceleration tasks, while excessive discrepancies appear detrimental for deceleration control. Similarly, negative associations between E:C ratios and high-speed metrics suggest that an overemphasis on eccentric loading can hinder running efficiency, reinforcing the necessity of balanced eccentric and concentric development [25]. These results support the use of load-specific profiling to individualize training: low inertial loads to enhance concentric power and cyclical speed, and higher inertial loads to strengthen eccentric braking and control capacities, in line with recommendations from Beato et al. [19].
4.4. Integration with Match Performance and Practical Relevance
By linking flywheel mechanical profiles with GPS metrics, this study provides a new framework for assessing neuromechanical efficiency under ecologically valid conditions. Previous work has shown that eccentric fatigue and inter-limb imbalances can modulate GPS external-load responses during competition [4]. The present results extend that evidence by demonstrating that flywheel outputs—particularly those obtained under higher inertial demands—relate to real-game acceleration, deceleration, and sprint actions.
Practically, these findings suggest that coaches can integrate flywheel diagnostics into daily monitoring to identify player-specific profiles. Athletes displaying strong eccentric but limited concentric outputs might benefit from low-inertia, high-velocity sessions to improve re-acceleration capacity, whereas those with poor braking performance could emphasize high-inertia eccentric overload to enhance deceleration tolerance and reduce mechanical stress during matches.
Overall, the results highlight that individualized inertia selection and balanced eccentric–concentric profiling are key to optimizing high-intensity locomotor performance and managing the physical demands of elite football.
Author Contributions
Conceptualization, Alesander Badiola–Zabala; Methodology, Jordi Pumarola and Mònica Solana–Tramunt; Software, Jordi Pumarola; Validation, Alesander Badiola–Zabala and Mònica Solana–Tramunt; Investigation, Jordi Pumarola; Data curation, Jordi Pumarola; Writing – original draft, Jordi Pumarola; Writing – review & editing, Alesander Badiola–Zabala and Mònica Solana–Tramunt; Visualization, Alesander Badiola–Zabala and Mònica Solana–Tramunt; Supervision, Mònica Solana–Tramunt; Project administration, Alesander Badiola–Zabala and Mònica Solana–Tramunt. All authors have read and agreed to the published version of the manuscript.
Funding
This research received no external funding.
Institutional Review Board Statement
The study was approved by the Institutional Research Ethics Committee of Blanquerna–Ramon Llull University (protocol code 0000001DA, date of approval 17 November 2024).
Informed Consent Statement
Written informed consent was obtained from all participants after they were informed about the study’s aims, benefits, and potential risks.
Data Availability Statement
The data presented in this study are available on request from the corresponding author.
Conflicts of Interest
The authors declare no conflict of interest.
References
- Beato, M.; Dello Iacono, A. Implementing Flywheel (Isoinertial) Exercise in Strength Training: Current Evidence, Practical Recommendations, and Future Directions. Front. Physiol. 2020, 11, 1–6. [Google Scholar] [CrossRef]
- Beato, M.; Drust, B. Acceleration intensity is an important contributor to the external and internal training load demands of repeated sprint exercises in soccer players. Res. Sport Med. 2021, 29, 67–76. [Google Scholar] [CrossRef]
- Beato, M.; Maroto-izquierdo, S.; Hernández-davó, J.L. Flywheel Training Periodization in Team Sports. Front. Physiol. 2021, 12, 1–6. [Google Scholar] [CrossRef]
- Bishop, C.; Pereira, L.A.; Reis, V.P.; Read, P.; Turner, A.N.; Loturco, I. Comparing the magnitude and direction of asymmetry during the squat, countermovement and drop jump tests in elite youth female soccer players. J. Sports Sci. 2019, 00, 1–8. [Google Scholar] [CrossRef]
- Cuschieri, S. The STROBE guidelines. Saudi J. Anaesth. 2019, 13, S31–S34. [Google Scholar] [CrossRef] [PubMed]
- González-García, J.; Giráldez-Costas, V.; Ramirez-Campillo, R.; Drust, B.; Romero-Moraleda, B. Assessment of Peak Physical Demands in Elite Women Soccer Players: Can Contextual Variables Play a Role? Res. Q. Exerc. Sport 2023, 94, 435–443. [Google Scholar] [CrossRef]
- Harper, D.J.; Carling, C.; Kiely, J. High-Intensity Acceleration and Deceleration Demands in Elite Team Sports Competitive Match Play: A Systematic Review and Meta-Analysis of Observational Studies. Sport Med. 2019, 49, 1923–1947. [Google Scholar] [CrossRef]
- Harper, D.J.; McBurnie, A.J.; Santos, T.D.; et al. Biomechanical and Neuromuscular Performance Requirements of Horizontal Deceleration: A Review with Implications for Random Intermittent Multi-Directional Sports. Vol 52. Springer International Publishing; 2022. [CrossRef]
- Keijzer, K.L.; Gonzalez, J.R.; Beato, M. The effect of flywheel training on strength and physical capacities in sporting and healthy populations: An umbrella review. PLoS ONE 2022, 17, 1–18. [Google Scholar] [CrossRef] [PubMed]
- Maroto-Izquierdo, S.; García-López, D.; Fernandez-Gonzalo, R.; Moreira, O.C.; González-Gallego, J.; de Paz, J.A. Skeletal muscle functional and structural adaptations after eccentric overload flywheel resistance training: A systematic review and meta-analysis. J. Sci. Med. Sport 2017, 20, 943–951. [Google Scholar] [CrossRef] [PubMed]
- Maroto-Izquierdo, S.; Raya-González, J.; Hernández-Davó, J.L.; Beato, M. Load Quantification and Testing Using Flywheel Devices in Sports. Front. Physiol. 2021, 12. [Google Scholar] [CrossRef]
- Morin, J.B.; Bourdin, M.; Edouard, P.; Peyrot, N.; Samozino, P.; Lacour, J.R. Mechanical determinants of 100-m sprint running performance. Eur. J. Appl. Physiol. 2012, 112, 3921–3930. [Google Scholar] [CrossRef]
- Muñoz-López, A.; Floría, P.; Sañudo, B.; Pecci, J.; Pérez, J.C.; Pozzo, M. The maximum flywheel load: A novel index to monitor loading intensity of flywheel devices. Sensors 2021, 21, 1–16. [Google Scholar] [CrossRef]
- Núñez, F.J.; Galiano, C.; Muñoz-López, A.; Floria, P. Is possible an eccentric overload in a rotary inertia device? Comparison of force profile in a cylinder-shaped and a cone-shaped axis devices. J. Sports Sci. 2020, 38, 1624–1628. [Google Scholar] [CrossRef]
- Nuñez Sanchez, F.J.; De Villarreal, E.S. Does flywheel paradigm training improve muscle volume and force? A meta-analysis. J. Strength Cond. Res. 2017, 31, 3177–3186. [Google Scholar] [CrossRef] [PubMed]
- Perna, P.; Keijzer KLDe; Beato, M. Flywheel resistance training in football : A useful rehabilitation tool for practitioners. Front. Sports Act. Living 2024, 6, 1–6. [Google Scholar] [CrossRef]
- Piqueras-Sanchiz, F.; Martín-Rodríguez, S.; Martínez-Aranda, L.M.; et al. Effects of moderate vs. High iso-inertial loads on power, velocity, work and hamstring contractile function after flywheel resistance exercise. PLoS ONE 2019, 14, 1–16. [Google Scholar] [CrossRef]
- Piqueras-Sanchiz, F.; Sabido, R.; Raya-González, J.; et al. Effects of Different Inertial Load Settings on Power Output Using a Flywheel Leg Curl Exercise and its Inter-Session Reliability. J. Hum. Kinet. 2020, 74, 215–226. [Google Scholar] [CrossRef] [PubMed]
- Raya-González, J.; Castillo, D.; Beato, M. The flywheel paradigm in team sports: A soccer approach. Strength Cond. J. 2021, 43, 12–22. [Google Scholar] [CrossRef]
- Raya-González, J.; Prat-Luri, A.; López-Valenciano, A.; Sabido, R.; Hernández-Davó, J.L. Effects of Flywheel Resistance Training on Sport Actions. A Systematic Review and Meta-Analysis. J. Hum. Kinet. 2021, 77, 191–204. [Google Scholar] [CrossRef]
- Romero-Moraleda, B.; Nedergaard, N.J.; Morencos, E.; Casamichana, D.; Ramirez-Campillo, R.; Vanrenterghem, J. External and internal loads during the competitive season in professional female soccer players according to their playing position: Differences between training and competition. Res. Sport Med. 2021, 29, 449–461. [Google Scholar] [CrossRef]
- Sabido, R.; Hernández-Davó, J.L.; García-Valverde, A.; Marco, P.; Asencio, P. Influence of the Strap Rewind Height during a Conical Pulley Exercise. J. Hum. Kinet. 2020, 74, 109–118. [Google Scholar] [CrossRef] [PubMed]
- Suarez-Arrones, L.; Núñez, F.J.; Lara-Lopez, P.; Di Salvo, V.; Méndez-Villanueva, A. Inertial flywheel knee- And hip-dominant hamstring strength exercises in professional soccer players: Muscle use and velocity-based (mechanical) eccentric overload. PLoS ONE 2020, 15. [Google Scholar] [CrossRef] [PubMed]
- Suchomel, T.J.; Wagle, J.P.; Douglas, J.; et al. Implementing eccentric resistance training—Part 1: A brief review of existing methods. J. Funct. Morphol. Kinesiol. 2019, 4. [Google Scholar] [CrossRef] [PubMed]
- World Medical Association Declaration of Helsinki: Ethical principles for medical research involving human subjects. JAMA 2013, 310, 2191–2194. [CrossRef]
Figure 1.
Relationship between Dominant Limb Peak Concentric Acceleration (0.133 kg·m2) and Maximal Deceleration.
Figure 1.
Relationship between Dominant Limb Peak Concentric Acceleration (0.133 kg·m2) and Maximal Deceleration.
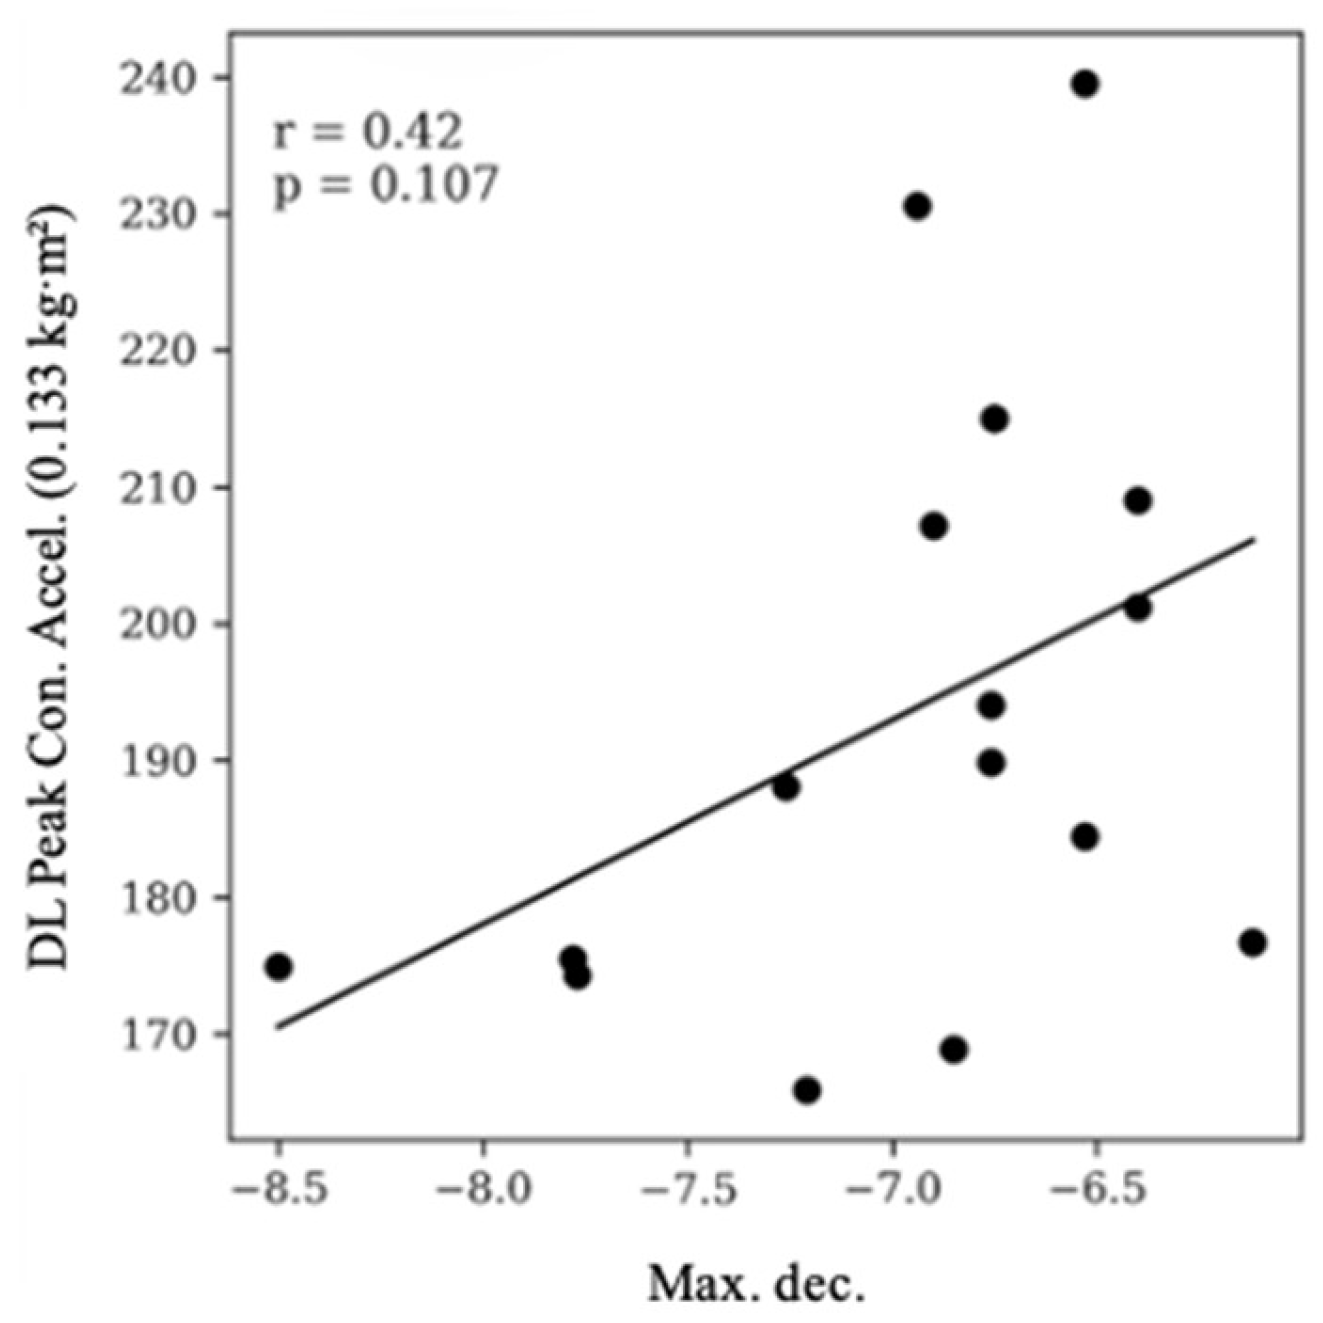
Figure 2.
Relationship between Dominant Limb Peak Eccentric Acceleration (0.133 kg·m2) and Maximal Deceleration.
Figure 2.
Relationship between Dominant Limb Peak Eccentric Acceleration (0.133 kg·m2) and Maximal Deceleration.
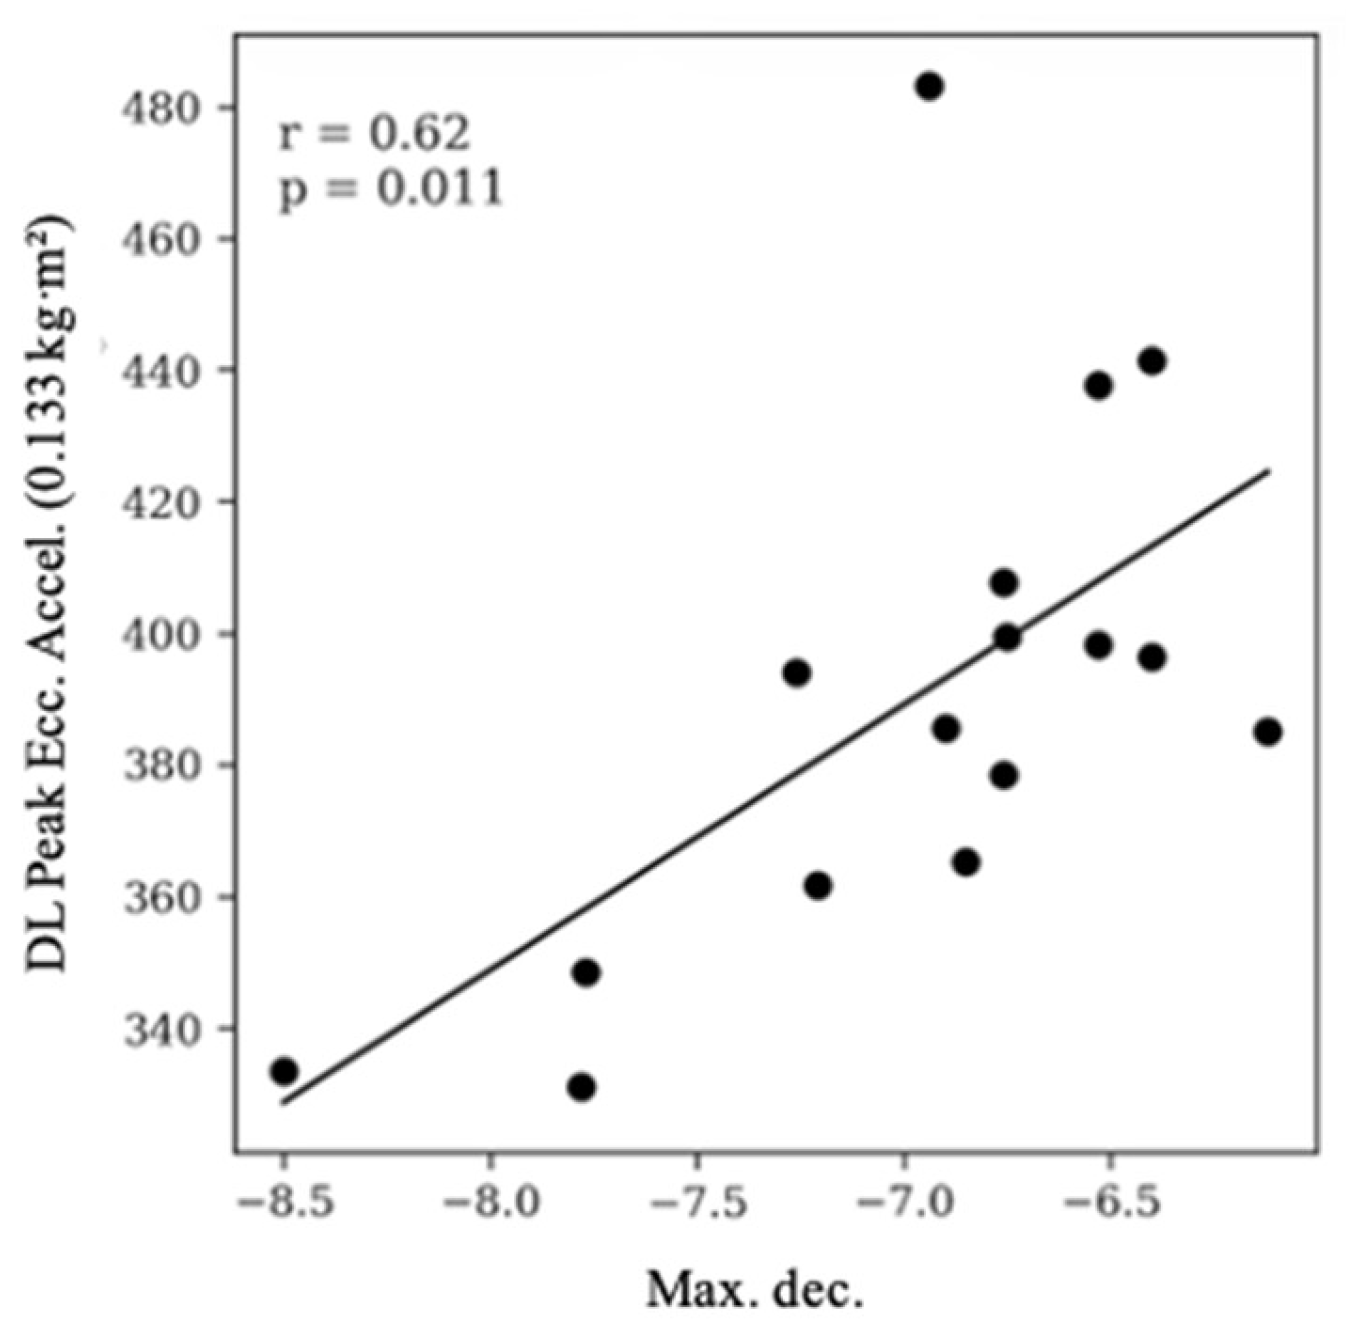
Figure 3.
Relationship between Dominant Limb Peak Eccentric Velocity (0.133 kg·m2) and Maximal Deceleration.
Figure 3.
Relationship between Dominant Limb Peak Eccentric Velocity (0.133 kg·m2) and Maximal Deceleration.
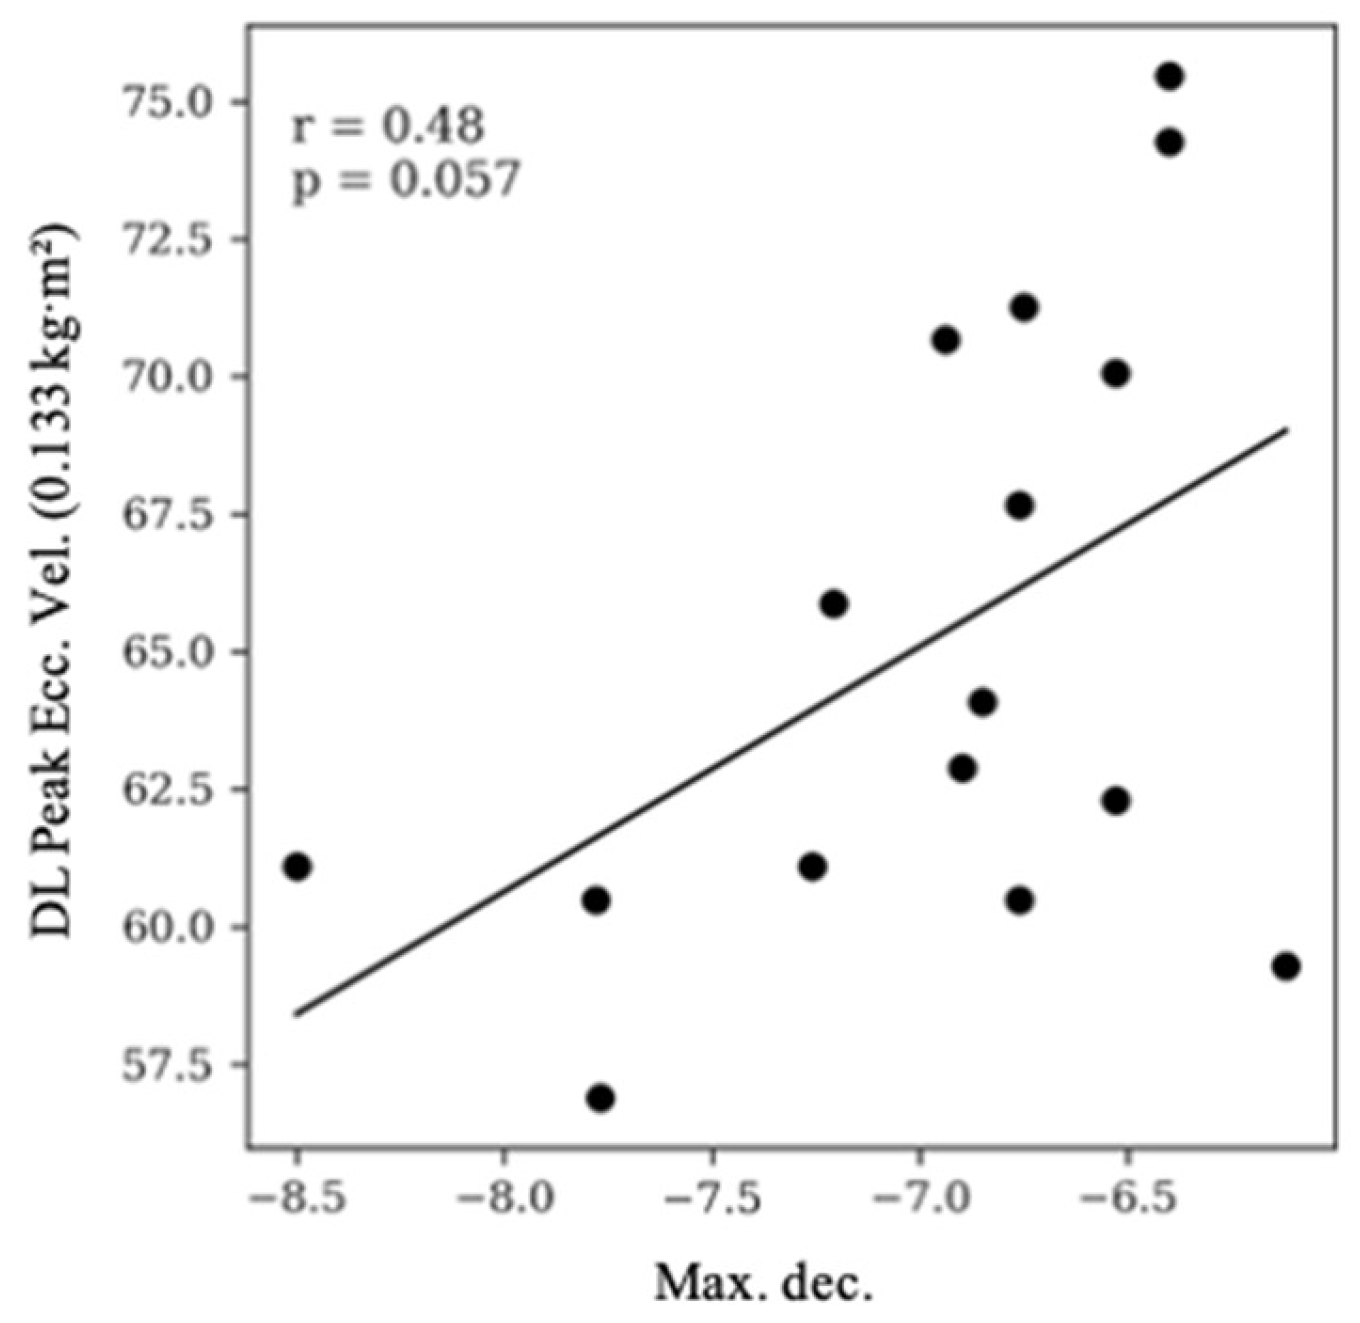
Figure 4.
Relationship between Non-Dominant Limb Peak Eccentric Velocity (0.133 kg·m2) and Maximal Deceleration.
Figure 4.
Relationship between Non-Dominant Limb Peak Eccentric Velocity (0.133 kg·m2) and Maximal Deceleration.
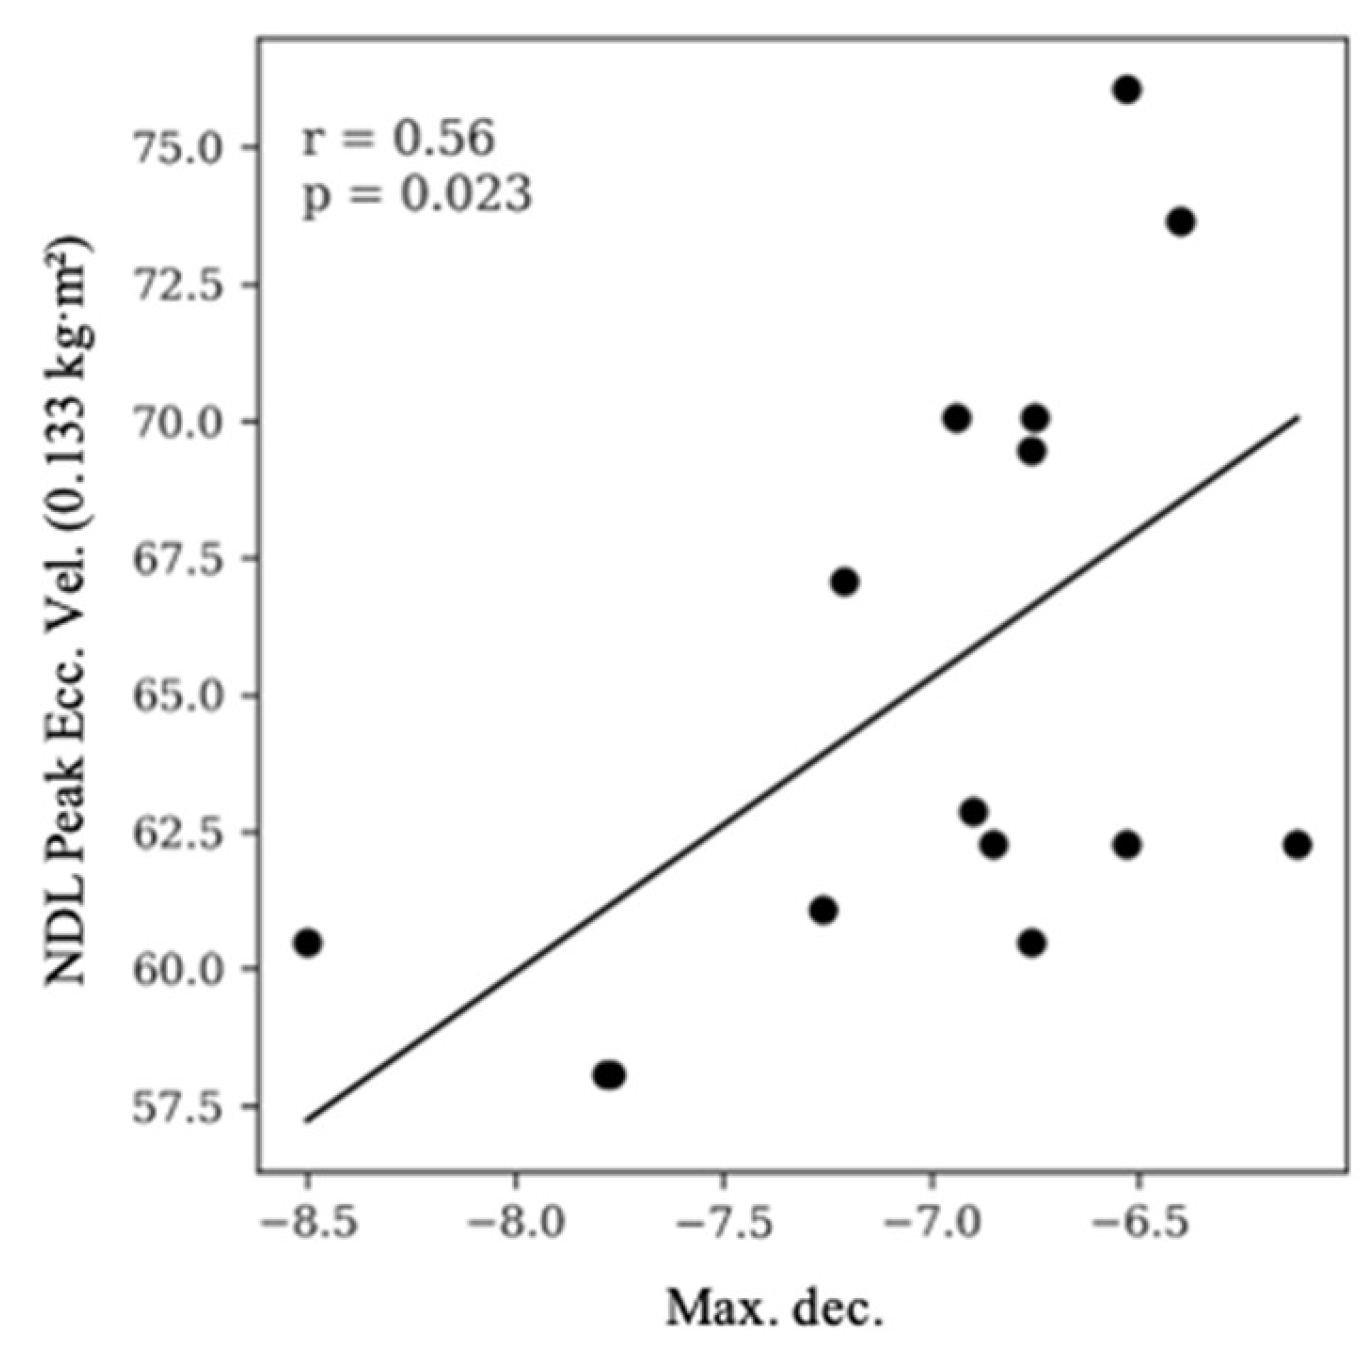
Figure 5.
Relationship between Non-Dominant Limb Peak Concentric Acceleration (0.133 kg·m2) and Maximal Deceleration.
Figure 5.
Relationship between Non-Dominant Limb Peak Concentric Acceleration (0.133 kg·m2) and Maximal Deceleration.
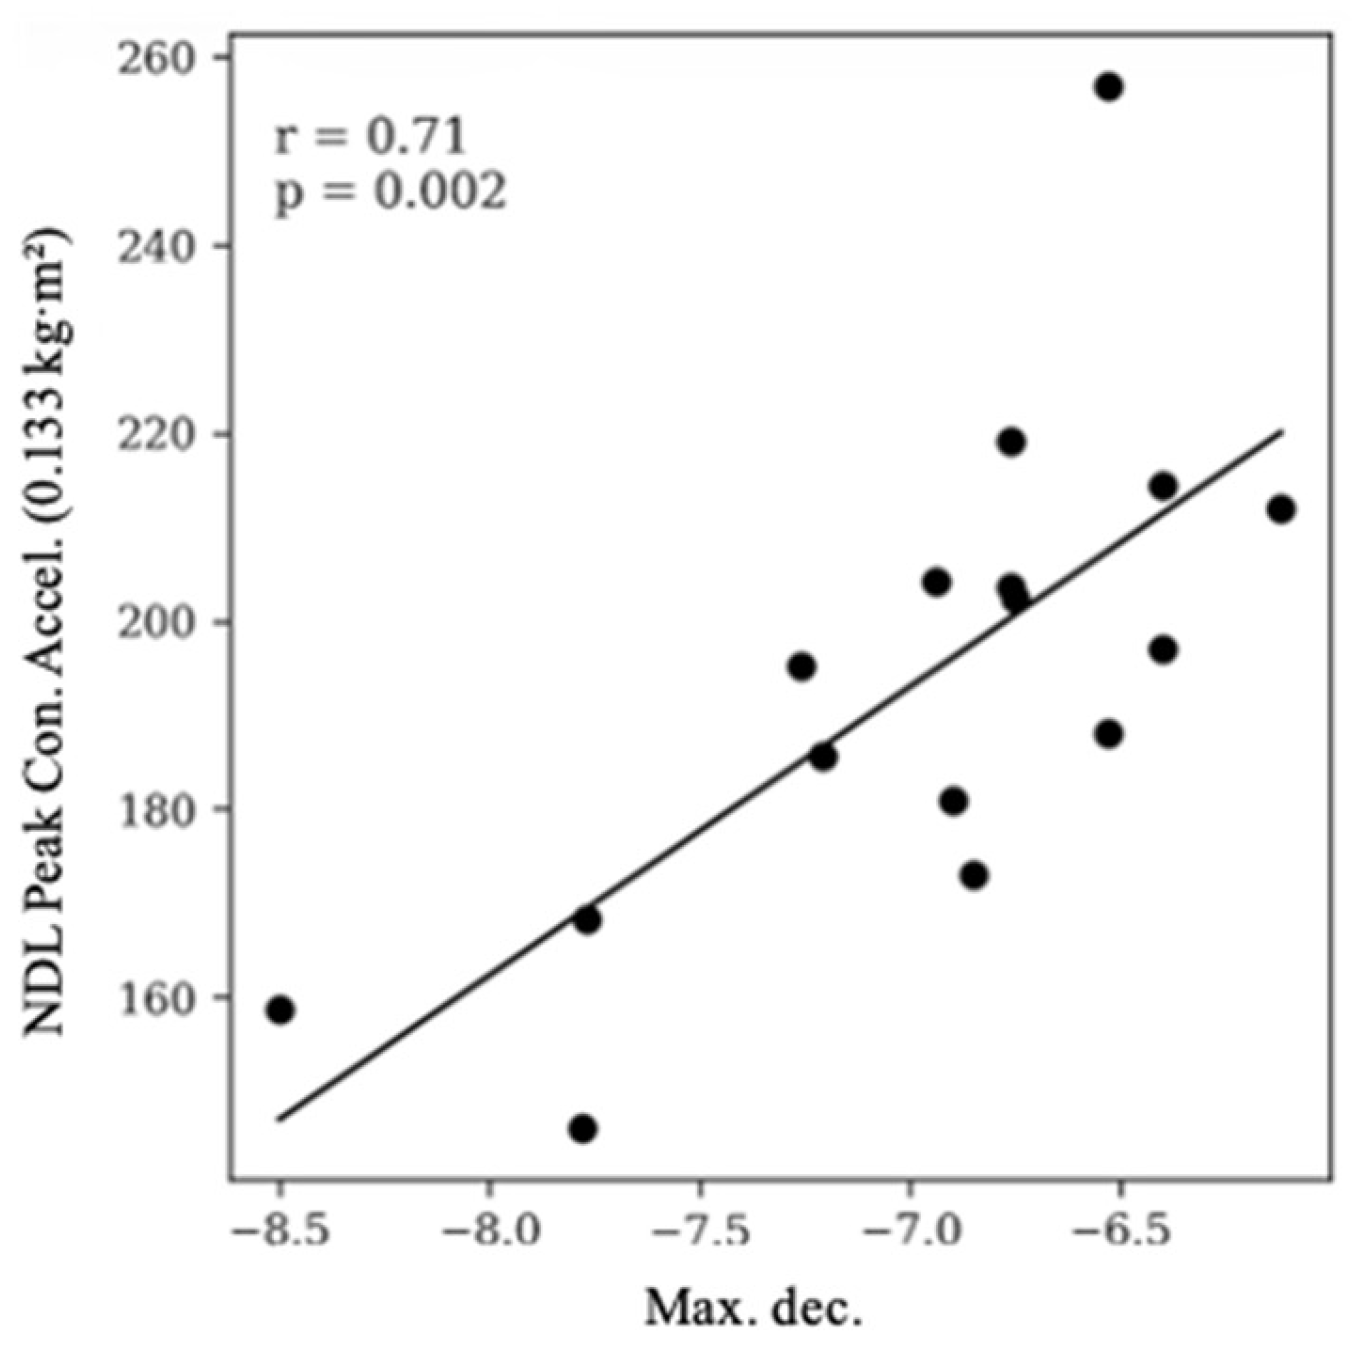
Figure 6.
Relationship between Non-Dominant Limb Peak Concentric Acceleration (0.133 kg·m2) and Maximal Deceleration.
Figure 6.
Relationship between Non-Dominant Limb Peak Concentric Acceleration (0.133 kg·m2) and Maximal Deceleration.
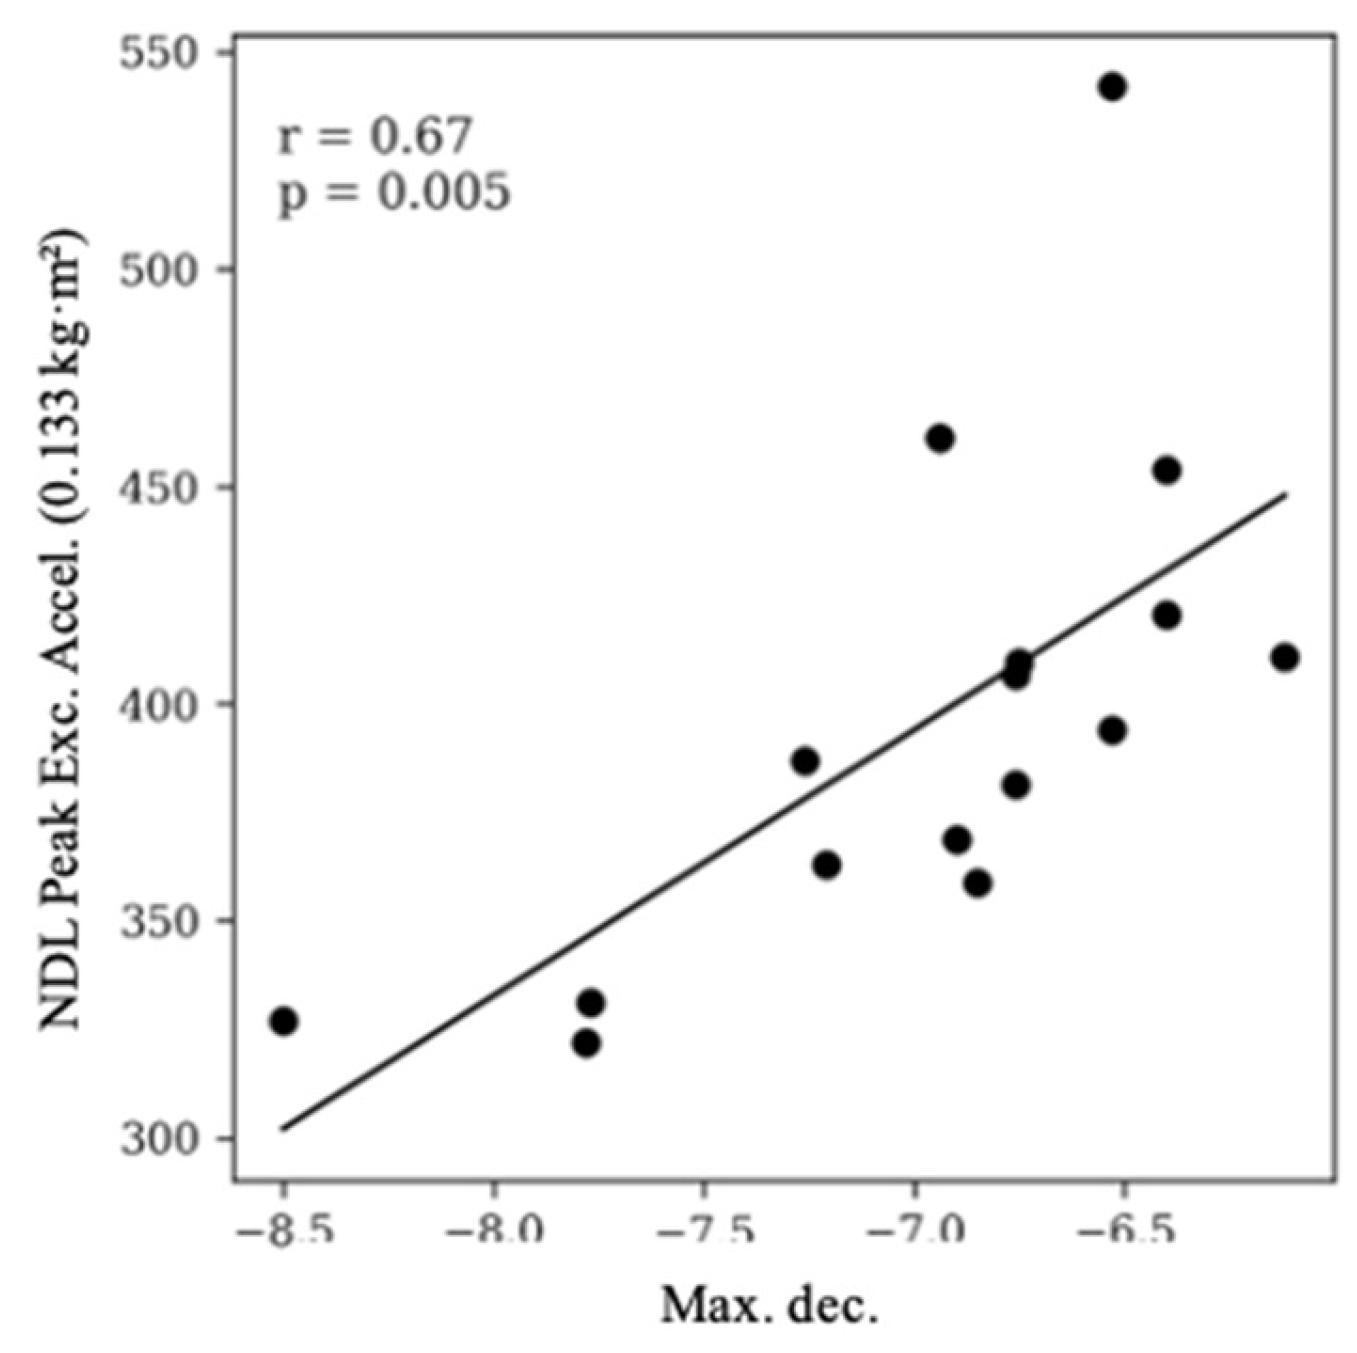
Figure 7.
Relationship between Non-Dominant Limb Peak Power Ratio (0.133 kg·m2) and Maximal Velocity.
Figure 7.
Relationship between Non-Dominant Limb Peak Power Ratio (0.133 kg·m2) and Maximal Velocity.
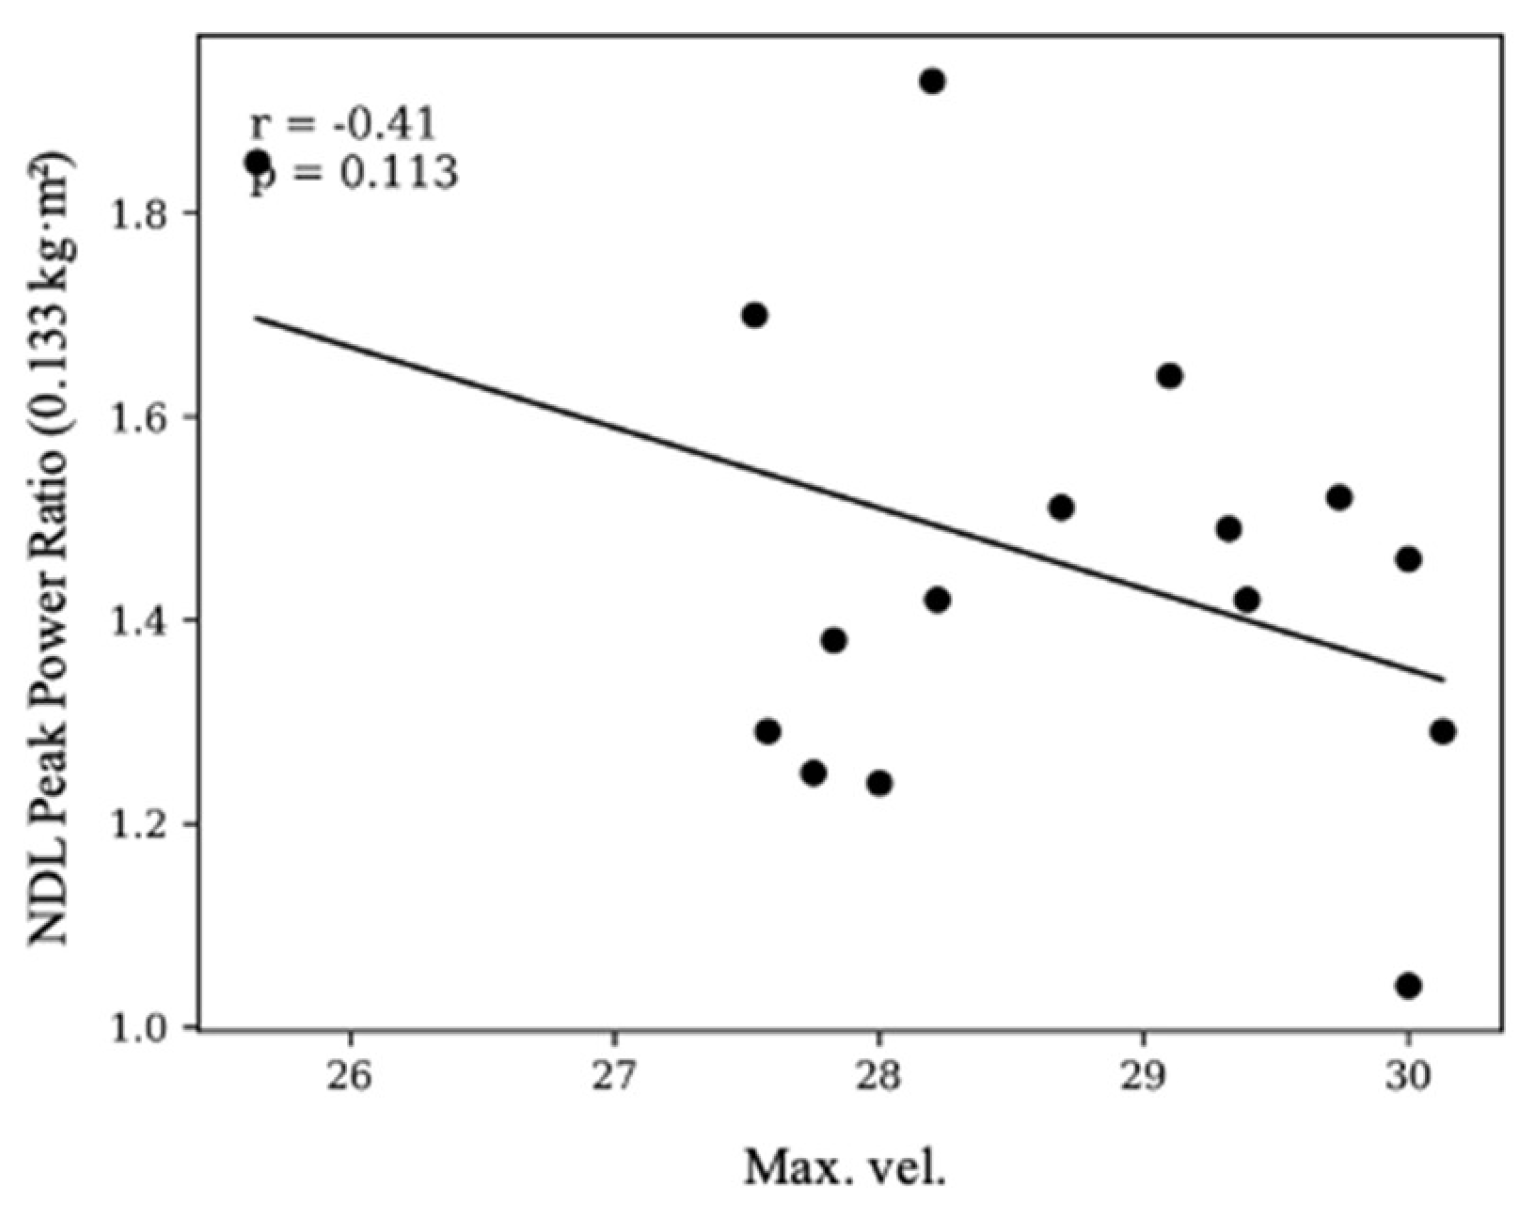
Figure 8.
Relationship between Non-Dominant Limb Peak Acceleration Ratio (0.107 kg·m2) and High-Speed Running.
Figure 8.
Relationship between Non-Dominant Limb Peak Acceleration Ratio (0.107 kg·m2) and High-Speed Running.
Disclaimer/Publisher’s Note: The statements, opinions and data contained in all publications are solely those of the individual author(s) and contributor(s) and not of MDPI and/or the editor(s). MDPI and/or the editor(s) disclaim responsibility for any injury to people or property resulting from any ideas, methods, instructions or products referred to in the content. |
© 2026 by the authors. Licensee MDPI, Basel, Switzerland. This article is an open access article distributed under the terms and conditions of the Creative Commons Attribution (CC BY) license (http://creativecommons.org/licenses/by/4.0/).
Copyright: This open access article is published under a Creative Commons CC BY 4.0 license, which permit the free download, distribution, and reuse, provided that the author and preprint are cited in any reuse.


