Submitted:
24 May 2026
Posted:
26 May 2026
You are already at the latest version
Abstract
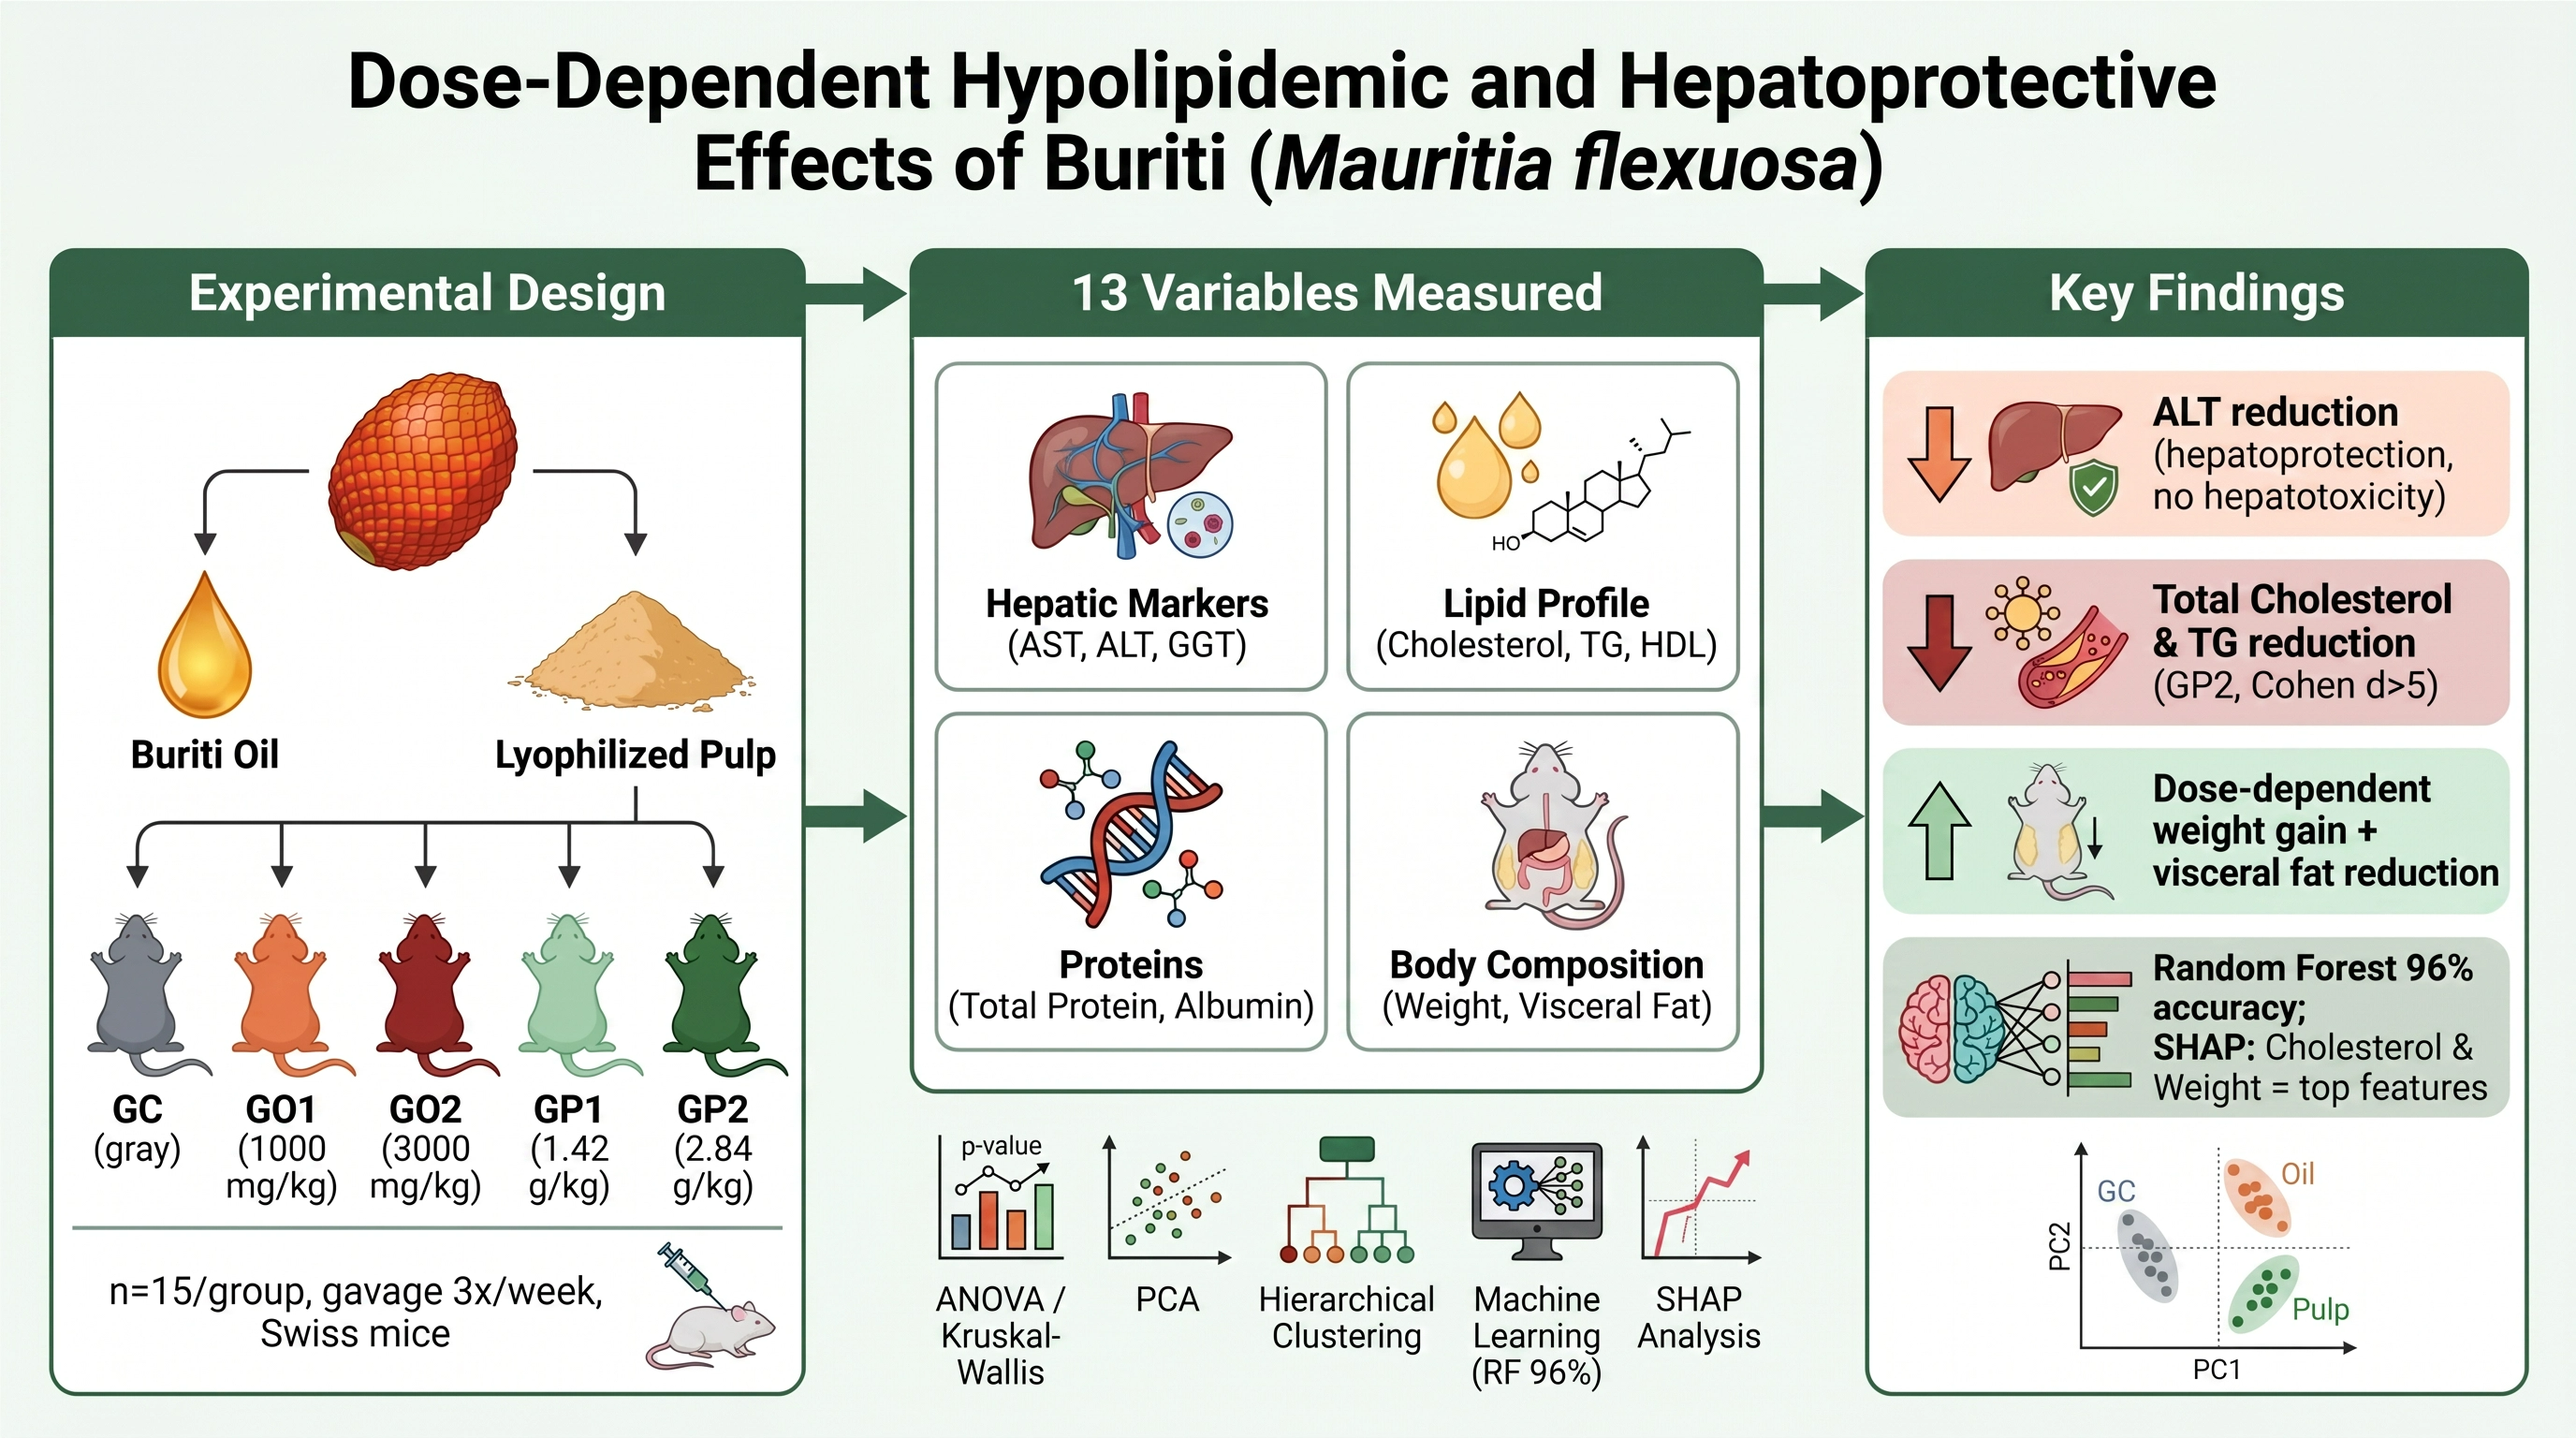
Background/Objectives: Amazonian biodiversity provides a rich source of bioactive compounds with potential metabolic benefits. Buriti (Mauritia flexuosa) is character-ized by high concentrations of monounsaturated fatty acids, carotenoids, and phe-nolic compounds. This study aimed to evaluate the metabolic effects of buriti oil and pulp supplementation and to investigate distinct dose-response patterns using classi-cal statistics and machine learning models. Methods: A controlled experimental study was conducted with 75 male Swiss mice, distributed into five groups (n = 15/group): control (GC), buriti oil at 1000 mg/kg (GO1) and 3000 mg/kg (GO2), and lyophilized buriti pulp at 1.42 g/kg (GP1) and 2.84 g/kg (GP2), administered by ga-vage three times a week. Biochemical, metabolic, and body composition variables were analyzed using inferential statistics, Principal Component Analysis (PCA), Hi-erarchical Clustering, and eight machine learning classification algorithms, and the results were interpreted using SHapley Additive exPlanations (SHAP). Results: High-dose buriti pulp (GP2) produced significant reductions in total cholesterol and triglycerides, along with a significant decrease in alanine aminotransferase (ALT), in-dicating hypolipidemic and hepatoprotective effects without hepatotoxicity. Despite a dose-dependent increase in body weight, a reduction in visceral fat depots was ob-served. Ensemble machine learning models (Random Forest and Gradient Boosting) achieved 96% accuracy in classifying experimental groups. SHAP analysis confirmed that total cholesterol, final weight, and ALT were the most critical features driving metabolic differentiation. Conclusions: Buriti exhibits broad, dose-dependent meta-bolic effects, reinforcing its potential as a functional food for modulating lipid metab-olism and preserving hepatic function.
Keywords:
Mauritia flexuosa
; lipid metabolism
; hepatoprotection
; machine learning
; SHAP analysis
; functional foods
; Amazonian biodiversity
; dose-response
1. Introduction
The Amazonian biodiversity represents one of the world's largest reserves of natural resources, standing out for the high nutritional, functional, and therapeutic potential of its plant species. Native fruits from this region have been extensively investigated due to their high concentrations of bioactive compounds that modulate metabolic, inflammatory, and oxidative processes, making them promising candidates for the development of functional foods and the formulation of evidence-based nutritional interventions [1,2]. In parallel, there is a significant increase in the prevalence of metabolic disorders, such as dyslipidemias and liver diseases associated with lipid metabolism, representing a relevant public health problem on a global scale [3,4].
The liver plays a central role in metabolic homeostasis, acting in the synthesis, storage, and distribution of lipids, as well as in the detoxification of endogenous and exogenous metabolites [5]. Alterations in hepatocellular integrity are frequently reflected in elevations of the enzymes alanine aminotransferase (ALT) and aspartate aminotransferase (AST), widely used as biochemical markers of metabolic stress and liver damage in experimental studies [6].
In this context, nutritional interventions aimed at modulating lipid metabolism and preserving liver function have been extensively investigated as complementary strategies to conventional pharmacological therapies. Although effective, these therapies may present limitations and adverse effects when used chronically. Thus, bioactive compounds of plant origin, especially those with recognized antioxidant activity, have aroused scientific interest due to their potential to attenuate hepatic oxidative stress [7,8]. Additional experimental evidence indicates that buriti oil and its bioactive constituents may exert hypolipidemic effects, improve cholesterol profile, and modulate markers of liver function, reinforcing its functional and therapeutic potential [9,10,11].
The buriti palm (Mauritia flexuosa) Buriti (Lf.) is a palm tree of the Palmae or Arecaceae family, found in the Amazon and other Brazilian biomes with dense vegetation. Its fruit, known as buriti, has great socioeconomic importance. The pulp and its derivatives, such as oils, nectars, sweets, fermented beverages, and seeds, are its main components of interest. The pulp is rich in antioxidants, such as carotenoids, polyphenols, and vitamin C, making it promising in the prevention of diseases related to oxidative stress. Furthermore, its lipid fraction is predominantly composed of tocopherols and fatty acids, especially oleic and palmitic acids, which may contribute to cardiovascular health [12].
Another study demonstrated that, in addition to bioactive compounds such as β-carotene, α-tocopherol, and monounsaturated fatty acids (MUFAs), including palmitoleic and oleic acids, buriti oil exhibits significant antioxidant activity in vitro [9]. Buriti oil presents a highly favorable lipid profile, standing out for its high content of monounsaturated fatty acids, especially oleic acid, which corresponds to approximately 76.38% of the total composition [13]. The pulp of buriti (Mauritia flexuosa), an emblematic fruit of the Amazon, stands out for its unique nutritional composition, characterized by a high content of monounsaturated fatty acids, carotenoids, phenolic compounds, and vitamin E [12,14]. This composition confers on buriti significant antioxidant activity and the ability to modulate lipid metabolism, suggesting hypolipidemic and hepatoprotective effects [1,15]. In vitro and in vivo studies have demonstrated that compounds present in buriti pulp and oil can reduce markers of oxidative stress and preserve liver function in experimental models [6,8].
Despite this promising evidence, the literature still presents important gaps, especially regarding the evaluation of systemic metabolic responses in controlled experimental models and the investigation of distinct dose-response patterns. Most available studies evaluate isolated effects or use a single dose, which limits the understanding of the causal relationship between the amount administered and the magnitude of the biological response [15]. Identifying distinct dose-response patterns is fundamental to establishing effective, safe, and biologically relevant doses and avoiding simplistic interpretations based solely on linear responses. Therefore, the present study aimed to evaluate the hypolipidemic and hepatoprotective effects of buriti pulp (Mauritia flexuosa) in an experimental model, investigating different doses and their associated metabolic responses.
2. Materials and Methods
2.1. Ethical Procedures
The research was analyzed and approved by the Ethics Committee on the Use of Animals (CEUA) of the Federal University of Acre (UFAC), process number 23107.018612/2016-31. The 80 Swiss strain mice were obtained from the UFAC animal facility, in accordance with the Manual of Care and Procedures for Laboratory Animals of the Animal Facility for Production and Experimentation of FCF-IQ/USP [16].
2.2. Extraction of Buriti Pulp and Oil
The fruits were harvested from buriti palm trees surrounding the Federal University of Acre campus. Approximately 15 kg of fruit were harvested to obtain approximately 3 kg of pulp. The fruits were washed in running water and immersed in a chlorinated solution containing 100 ppm free residual chlorine for 15 minutes. Rinsing was performed with potable water to remove any remaining chlorine. The pulp was removed manually; after separation, the pulp was stored in polyethylene containers, frozen with liquid nitrogen at -85 ºC, and freeze-dried in a Liotop® brand benchtop freeze-dryer, model L101. After this process, the now dehydrated pulp was placed in dark polyethylene containers, stored in a refrigerator at 5-8 ºC, and protected from light.
The buriti oil was donated by Cooperfruta, located in Mâncio Lima, a cooperative of fruit pulp and regional oil producers. The oil was obtained through mechanical extraction. Pressing was carried out in a manually operated mini-press with a feeding sump, compression basket, oil outlet cone, and helical shaft with variable pitch and diameter. The construction is made of stainless steel, including the internal parts, plates, and collection trays. After obtaining the crude oil, it was placed in an amber glass container and kept at room temperature.
2.3. Animals and Treatment
Swiss mice; the total number of mice used was 5 groups with 15 animals per group, with equivalent weights (28-30g) and an average age of 90 days. The oil and lyophilized pulp were administered by gavage, as follows:
- A)
- Control group (CNTL): receives injections of physiological solution (0.10 mL /weekly) and water via gavage (1 mL);
- B)
- Oil Group 1 (GO1): receive only buriti oil (1000 mg/Kg) three times a week;
- C)
- Oil Group 2 (GO2): receive only buriti oil (3000 mg/Kg) three times a week;
- D)
- Pulp Group 1 (GP1): receive only freeze-dried buriti pulp (1.42 g/Kg) three times a week;
- E)
- Pulp Group 2 (GP2): receive only freeze-dried buriti pulp (2.84 g/Kg) three times a week;
The composition of the experimental diets was based on the AIN-93G formulation, developed by the American Institute of Nutrition for rodent studies. In this formulation, the lipid content of the diet corresponds to 7% oil (lipids). from the rodent's diet, an amount considered adequate for supplying essential fatty acids [17]. Based on the lipid content of buriti pulp, equivalent doses of 1.42 g/kg and 2.84 g/kg were calculated. for the evaluation of metabolic effects. 7g of buriti oil was used along with 100g of diet for rats for 17 days of study [9]. Also, [18] used two groups administered by gavage, one receiving buriti oil at 1000 mg/kg of rat weight and the other at 2000 mg/kg of rat weight.
2.4. Analysis of Biochemical and Morphological Variables
After the last day of experimentation, 12 hours later, the animals were anesthetized and euthanized. Blood was collected by cardiac puncture; the maximum possible amount (3-5 mL) was collected, stored in a heparinized bottle, and centrifuged at 5000 × g for 10 minutes to obtain serum, which was then frozen for later analysis. Biochemical dosages of total cholesterol, triglycerides, urea, creatinine, alanine aminotransferase (ALT), aspartate aminotransferase (AST), gamma- glutamyl transferase (GGT), and glucose were determined by the colorimetric method using Analisa® and Katal® kits.
For weight gain assessment, the animals were weighed on a Shimadzu® analytical balance (model AUY220). Weight control of the animals was performed on the 1st, 8th, 15th, 22nd, 29th, 36th, and 43rd days of the experimental protocol. Weight monitoring was always performed between 12:00 and 14:00 hours. After euthanasia, the organs [testicles, prostate, liver, kidneys, adipose tissue (white, epididymal, mesenteric, and retroperitoneal), brain, and heart] were removed and weighed, and visual differences between the control group and the intervention groups were evaluated. Subsequent preservation in 10% formalin and, when applicable, liquid nitrogen, for later analysis.
2.5. Data Analysis
All statistical and computational analyses were performed using Python (version 3.11) within a reproducible environment. The analytical pipeline integrated classical inferential statistics, multivariate exploratory techniques, and supervised machine learning models to comprehensively evaluate the metabolic and biochemical effects of Mauritia flexuosa supplementation. The libraries utilized included SciPy (v1.11+) and Pingouin for inferential statistics, Scikit-learn (v1.3+) for machine learning and multivariate analyses, Pandas (v2.0+) and NumPy (v1.24+) for data manipulation, and Matplotlib (v3.7+) and Seaborn (v0.12+) for high-resolution data visualization.
Initially, the distribution of all continuous variables was assessed using the Shapiro-Wilk test. For variables exhibiting a normal distribution (p > 0.05), comparisons among the five experimental groups (GC, GO1, GO2, GP1, GP2) were conducted using one-way Analysis of Variance (ANOVA), followed by independent samples t-tests for post-hoc pairwise comparisons against the control group (GC). For variables that violated the normality assumption (e.g., triglycerides, weight gain, and final weight in specific groups), the non-parametric Kruskal-Wallis test was applied, followed by the Mann-Whitney U test for post-hoc comparisons. The magnitude of the observed differences was quantified using effect size metrics: Cohen's d for normally distributed data and the Rank-Biserial correlation coefficient (r) for non-normally distributed data. Statistical significance was established at p < 0.05, with distinct notation levels (* p < 0.05; ** p < 0.01; *** p < 0.001) indicating the strength of the evidence against the null hypothesis.
To explore the global metabolic response patterns and identify underlying structures within the dataset, multivariate analyses were performed incorporating all 13 measured variables (hepatic markers, lipid profile, protein status, body mass, and visceral adiposity). Principal Component Analysis (PCA) was utilized to reduce data dimensionality and visualize the spatial distribution of individual animals based on their comprehensive biochemical profiles. Subsequently, Hierarchical Clustering was applied to the group centroids using Ward's linkage method and Euclidean distance to construct a dendrogram, objectively quantifying the metabolic similarities and divergences among the experimental groups.
Furthermore, to assess the discriminative capacity of the biochemical and metabolic variables, eight supervised machine learning classification algorithms were evaluated: Random Forest, Gradient Boosting, Decision Tree, Support Vector Machine (SVM), Logistic Regression, K-Nearest Neighbors (KNN), Multilayer Perceptron (Neural Network), and AdaBoost. The models were trained on standardized data (zero mean, unit variance) to predict experimental group membership (5 classes). Model performance was rigorously evaluated using 5-fold stratified cross-validation, ensuring robust results despite the small sample size (n = 75).
Finally, to provide interpretability to the best-performing machine learning model (Random Forest), a comprehensive SHapley Additive exPlanations (SHAP) analysis was conducted. SHAP values, derived from cooperative game theory, were calculated using the TreeExplainer algorithm to quantify each feature's exact marginal contribution to the model's predictions. This approach allowed for the identification of global feature importance, the visualization of non-linear dose-response relationships (Dependence Plots), the mapping of feature interactions, and the extraction of individualized metabolic signatures (Waterfall Plots) for representative animals from each experimental group (Supplementary Material).
2.6. Study Hypothesis
Two-tailed test to detect differences in any direction.
H0 - There will be no significant difference for any study variable between the groups.
H1 - There will be a significant difference in at least one study variable between the groups.
3. Results
Among the variables studied, only blood glucose did not show a significant difference between the groups, so the null hypothesis for this variable was accepted.
Figure 1 presents the liver and kidney function profiles of the animals, indicating differences for GP2 (AST), GP1 and GP2 (ALT), GP2 and GP2 (Creatinine), and only GP2 (Urea), all relative to the control. The significant reduction in ALT (alanine aminotransferase) in the pulp-supplemented groups suggests a hepatoprotective effect. The AST (Aspartate Aminotransferase)/ALT ratio remained within normal limits in all groups, indicating the absence of hepatotoxicity. This finding is particularly relevant considering the potential use of buriti as a long-term nutritional supplement.
Supplementation with high-dose buriti pulp (GP2) produced marked reductions in total cholesterol (Cohen's d effect > 5.0) and triglycerides (Figure 2). This hypolipidemic effect is consistent with the literature on bioactive compounds in buriti, including carotenoids, tocopherols, and fiber. The pulp appears to have a more pronounced effect than the oil, possibly due to the presence of fiber and other non-lipid compounds.
The reduction in albumin and total protein in the pulp groups, especially at high doses, requires further investigation (Figure 3). Possible explanations include: (1) redistribution of proteins to peripheral tissues, (2) altered hepatic synthesis, or (3) increased protein utilization. Complementary studies with protein turnover markers are recommended.
Supplementation with buriti, in both oil and pulp forms, resulted in a significant, dose-dependent increase in body weight gain (Figure 5). Paradoxically, there was a reduction in epididymal and retroperitoneal fat deposits (Figure 4), suggesting that weight gain may be related to an increase in lean mass or other tissues, and not just fat. This pattern is consistent with anabolic effects and may be related to the high content of monounsaturated fatty acids (especially oleic acid) and carotenoids present in buriti.
Dose-response analyses revealed significant linear relationships for several variables, especially for weight gain (rho = 1.0, p < 0.001) and ALT (rho = -1.0, p < 0.001). This demonstrates that the effects of buriti are dose-dependent and predictable, which is crucial for future clinical and nutritional applications.
All experimental groups presented similar initial body weights at the beginning of the study (GC: 28.69 ± 1.87 g; GO1: 29.00 ± 1.31 g; GO2: 29.00 ± 1.31 g; GP1: 29.00 ± 1.46 g; GP2: 28.93 ± 1.39 g), confirming adequate randomization before the intervention. At the end of the experimental period, significant differences in both weight gain and final body weight were observed among groups (Kruskal-Wallis, p < 0.001 for both variables; Figure 5).
Regarding weight gain, all supplemented groups showed significantly greater weight gain than the control group (GC: 3.19 ± 1.88 g; p < 0.001 for all comparisons). The highest gains were recorded in the high-dose groups: GO2 (12.00 ± 1.51 g) and GP2 (13.07 ± 1.91 g), which formed a distinct homogeneous cluster (a), indicating no significant difference between them. The low-dose groups GO1 (8.00 ± 1.51 g) and GP1 (8.60 ± 1.84 g) constituted an intermediate cluster (b), while GC remained isolated in cluster c, reflecting the lowest weight gain observed across all groups.
Final body weight followed a consistent dose-dependent pattern. The GP2 group reached the highest final weight (42.00 ± 0.85 g; cluster a), followed by GO2 (41.00 ± 0.85 g; cluster b), and the low-dose groups GO1 (37.00 ± 0.85 g) and GP1 (37.60 ± 1.12 g), which were statistically equivalent (cluster c). The GC group had the lowest final weight (31.88 ± 1.39 g; cluster d), which differed significantly from all supplemented groups (p < 0.001). These findings indicate a clear dose-dependent effect of buriti supplementation on body mass accumulation, with the high-dose groups exhibiting the greatest weight gain, regardless of the form of supplementation (oil or pulp).

Figure 5.
Effects of buriti (Mauritia flexuosa) oil and pulp supplementation on body mass parameters in mice. (A) Body weight gain throughout the experimental period; (B) Final body weight at the end of the experimental period. Data are expressed as mean ± standard deviation (n = 15 per group). Statistical comparisons were performed using the Kruskal-Wallis test, given violation of the normality assumption in one or more groups (Shapiro-Wilk, p < 0.05), followed by the Mann-Whitney U test for post-hoc pairwise comparisons against the control group (GC). Dashed ellipses indicate statistically homogeneous clusters identified by compact letter display: groups sharing the same letter do not differ significantly from each other (p > 0.05). GC: control group; GO1: low-dose buriti oil group; GO2: high-dose buriti oil group; GP1: low-dose buriti pulp group; GP2: high-dose buriti pulp group. * p < 0.05; ** p < 0.01; *** p < 0.001 vs. GC.
The largest observed Effect Sizes were for Total Cholesterol (GO1 vs GP2): Cohen's d = 5.648 (very large effect); Albumin (GO1 vs GP2): Cohen's d = 5.370 (very large effect); Weight Gain (GC vs GO2): Cohen's d = -5.156 (very large effect); ALT (O1 vs GP1): Cohen's d = 2.748 (large effect) and Final Weight (multiple comparisons): r = 1.0 (maximum effect).
To explore the overall metabolic response patterns across experimental groups, a principal component analysis (PCA) was performed using all 13 measured variables. The first two principal components together explained 55.2% of the total variance (PC1: 44.8%; PC2: 10.4%; Figure 6A). PC1 was primarily driven by variables related to lipid metabolism, protein status, and body mass, with the highest loadings observed for total cholesterol (|loading| = 0.356), final body weight (0.356), weight gain (0.350), albumin (0.349), and total proteins (0.300). Notably, final body weight and weight gain exhibited negative loadings on PC1, indicating that groups with higher body mass accumulated to the left of the PC1 axis. In comparison, groups with lower body mass and higher biochemical marker concentrations were positioned to the right. PC2 was predominantly influenced by urea (|loading| = 0.598) and triglycerides (| loading | = 0.559), capturing a secondary axis of metabolic variation.
The PCA score plot revealed a clear spatial separation among the experimental groups, consistent with a dose-dependent metabolic effect of buriti supplementation. The GC group (centroid: PC1 = 2.76) was positioned at the rightmost end of the PC1 axis, reflecting its distinct biochemical profile, characterized by higher concentrations of total cholesterol, albumin, and total protein relative to the supplemented groups. The low-dose groups GO1 (PC1 = 1.47) and GP1 (PC1 = 0.84) occupied intermediate positions, while the high-dose groups GO2 (PC1 = −1.38) and GP2 (PC1 = −3.70) were displaced to the left, reflecting the greatest metabolic divergence from the control. Three clusters were identified: Cluster 1 (GC), Cluster 2 (oil groups: GO1 and GO2), and Cluster 3 (pulp groups: GP1 and GP2), with partial overlap between Clusters 2 and 3, suggesting a shared metabolic trajectory between oil and pulp supplementation at comparable doses.
Hierarchical clustering using Ward's linkage method and Euclidean distance on group centroids corroborated the PCA findings (Figure 6B). The dendrogram revealed that GO1 and GP1 were the most similar groups (linkage distance = 1.676), followed by their merger with GC (distance = 2.847), indicating that low-dose supplementation, regardless of the form (oil or pulp), produced a metabolic profile closer to the control. In contrast, GO2 and GP2 formed a distinct high-dose cluster (distance = 2.848), which merged with the remaining groups only at a substantially higher dissimilarity (distance = 6.622), underscoring the pronounced, dose-dependent metabolic divergence induced by high-dose buriti supplementation.
To assess the discriminative capacity of the measured variables for classifying animals into their respective experimental groups, eight supervised machine learning algorithms were evaluated using 5-fold stratified cross-validation on the complete set of 13 standardized variables (Figure 7). The ensemble methods demonstrated the highest classification performance, with Random Forest and Gradient Boosting achieving identical mean cross-validation accuracies of 0.96 ± 0.05, followed by Decision Tree (0.93 ± 0.04). These three models surpassed the 0.80 accuracy threshold with consistently low variance, indicating robust and reproducible group discrimination based on the biochemical and metabolic profiles assessed.
Among the remaining models, Support Vector Machine (SVM) achieved an accuracy of 0.87 ± 0.06, followed by Logistic Regression (0.84 ± 0.10) and K-Nearest Neighbors (KNN; 0.83 ± 0.07), all of which exceeded the 0.80 threshold. Neural Network (Multilayer Perceptron) and AdaBoost presented the lowest performance, with accuracies of 0.77 ± 0.12 and 0.75 ± 0.05, respectively, and failed to consistently surpass the reference threshold, likely reflecting their sensitivity to the relatively small sample size (n = 75) and the high dimensionality relative to the number of observations.
The high classification accuracy achieved by ensemble methods — particularly Random Forest and Gradient Boosting — corroborates the findings from the multivariate analyses (PCA and hierarchical clustering; Figure 6), confirming that the combination of lipid profile, hepatic and renal biomarkers, protein status, body mass, and visceral adiposity variables carries sufficient discriminative information to distinguish between the five experimental groups reliably. These results reinforce the biological significance of the observed metabolic differences induced by buriti (Mauritia flexuosa) supplementation at different doses and forms.
4. Discussion
The study findings demonstrate that buriti supplementation promoted relevant systemic metabolic changes, involving hepatic markers, lipid profile, body composition, and multivariate patterns of biological response. Taken together, the results indicate a dose-dependent modulating effect, with a greater magnitude in the groups that received high doses of the pulp.
The significant reduction in ALT in the groups supplemented with pulp suggests a hepatoprotective effect. The AST/ALT ratio remained within normal values in all groups, indicating an absence of hepatotoxicity. This finding is relevant given the potential use of buriti to improve lipid profiles, modulate liver function-associated biochemical markers, and serve as a long-term nutritional supplement. Serum aminotransferase levels (ALT and AST) are reliable indicators of functional or structural changes in liver cells [20].
Another study demonstrated that administering iron overload in rats increased TAG, VLDL, and LDL levels, which were associated with decreased antioxidant defense mechanisms, mainly liver enzymes. However, it was observed that the ingestion of buriti oil attenuated alterations induced by iron overload in hematological parameters, lipid profile, and serum and hepatic antioxidant status in iron-overloaded rats [9].
Significant differences were observed in hepatic and serum antioxidant activity, possibly because the liver responds earlier to dietary changes and to iron overload than markers evaluated at the systemic level [9]. Previous studies demonstrate that antioxidant enzyme activity varies across tissues in experimental models and is influenced by the lipid source of the diet. Thus, the type of fat ingested can differentially modulate responses to oxidative stress in specific organs, such as the liver [21].
Supplementation with high doses of buriti pulp had a hypolipidemic effect, consistent with the literature, which reported improvements in the lipid profile, elevated serum and hepatic retinol concentrations, and increased tocopherol levels in young rats [10,11]. The pulp had a more pronounced effect than the oil, possibly due to the presence of fiber and other non-lipid compounds.
This study showed reductions in albumin and total protein in the pulp groups, especially at the high dose. This differs from research conducted with Swiss mice (pre-clinical phase) and with 25 older women (clinical phase), which showed an increase in serum albumin levels and an improvement in the lipid profile in the pre-clinical phase [22].
Supplementation with buriti, in the form of oil or pulp, increased body weight gain in a dose-dependent manner, concomitantly with a reduction in fat deposits, suggesting that this gain is not associated with adipose tissue accumulation but may be associated with other tissues. This pattern is consistent with anabolic effects and may be related to the high content of monounsaturated fatty acids (especially oleic acid) and carotenoids present in buriti. Buriti-based supplementation was effective in treating malnutrition or risk of malnutrition, promoting improvements in anthropometric and biochemical parameters [22,23]. The improvements were demonstrated through recovery of body weight and reductions in inflammation and oxidative stress [23].
Principal Component Analysis (PCA) revealed consistent patterns of segregation among the experimental groups, confirming the impact of dietary interventions on the animals' metabolic profiles. PC1 represented the main metabolic gradient in the dataset and was strongly associated with variables related to body weight and cholesterol. The distribution of scores along this axis suggests that dietary supplementation led to substantial metabolic changes compared with the control group. PC2 captured additional variations, mainly related to lipid metabolism. This reinforces the idea that the different types of supplementation induced specific metabolic responses, affecting body and lipid parameters.
The oily extract of buriti has demonstrated the ability to attenuate platelet activation and aggregation processes. From a primary prevention perspective, these properties may help reduce cardiovascular risk and represent a potentially safe alternative, as they are not associated with the adverse effects commonly observed with conventional antiplatelet therapies [24]. Another study investigating the antioxidant potential of phenolic extracts from the leaves, fruits, and stems of Mauritia flexuosa reported distinct results depending on the analytical method used. In the assay, the fruit extract demonstrated superior performance to the buriti leaf extract. These differences were attributed to qualitative and quantitative variations in the bioactive compounds present in each part of the plant, with particular emphasis on flavonoids and anthocyanins [14], which exhibit interesting antioxidant potential [14,25]. Furthermore, supplementation showed the strongest relationship between HDL-c and non-HDL-c, indicating a possible cardioprotective effect [15].
Hierarchical cluster analysis identified two distinct patterns: one cluster associated with baseline values of hepatic and renal markers, and a second characterized by reduced aminotransferases and modulation of renal parameters, suggesting metabolic adaptation and a potential hepatoprotective effect of the treatments. The study obtained in vivo evidence corroborating the antithrombotic effects previously observed in in vitro assays with the oil extract. In the experiment, treatment with the oil extract significantly reduced thrombus growth, demonstrating efficacy comparable to that of aspirin, the reference antiplatelet drug. These findings indicate that Mauritia flexuosa oil exhibits significant antiplatelet and antithrombotic activity, suggesting potential use as a functional agent to prevent thrombotic events [26].
The buriti fruit stands out for its high content of bioactive compounds with recognized antioxidant activity, especially carotenoids, which correspond to the major fraction of its lipophilic constituents. These pigments are estimated to account for approximately 90% of the total carotenoids, giving the fruit a high antioxidant capacity. Additionally, the lipid matrix of buriti is rich in oleic acid and tocopherols, components that play a relevant role in protection against oxidative stress [27].
The pronounced hypolipidemic effect observed, particularly the reduction in total cholesterol and triglycerides in the high-dose pulp group (GP2), aligns with the high, concentration of monounsaturated fatty acids (MUFAs), notably oleic acid, present in Mauritia flexuosa. Recent experimental models have demonstrated that dietary. Supplementation with oleic acid significantly downregulates hepatic lipogenesis by modulating the expression of sterol regulatory element-binding protein 1c (SREBP-1c) and acetyl-CoA carboxylase, leading to reduced triglyceride accumulation [28]. Furthermore, MUFA-rich diets have been shown to enhance the clearance of circulating lipids by upregulating hepatic LDL receptor activity and promoting fatty acid β-oxidation [29]. The synergistic action of oleic acid with the dietary fiber present in the lyophilized Pulp likely delays intestinal lipid absorption, contributing to the superior lipid-lowering efficacy of the pulp compared to the extracted oil [30].
The significant reduction in serum ALT levels, a primary biomarker of Hepatocellular injury underscores the hepatoprotective properties of buriti supplementation. This effect is largely attributable to its rich bioactive composition, compounds, including β-carotene, tocopherols, and flavonoids. Experimental studies have established that carotenoids exert potent antioxidant effects in the hepatic parenchyma by neutralizing reactive oxygen species (ROS) and inhibiting lipid peroxidation, thereby preserving hepatocyte membrane integrity [31]. Additionally, dietary polyphenols have been reported to mitigate hepatic inflammation by suppressing the NF-κB signaling pathway and reducing the expression of pro-inflammatory cytokines in rodent models of diet-induced liver injury [32]. The concurrent presence of α-tocopherol in buriti further amplifies this protection through a synergistic antioxidant network that prevents the depletion of endogenous hepatic glutathione [33].
Interestingly, while high-dose supplementation induced a dose-dependent increase in total body mass, it also reduced visceral adipose tissue depots (epididymal and retroperitoneal fat). This paradoxical phenotype suggests a targeted modulation of fat distribution rather than systemic obesogenic effects. Similar findings have been reported in murine models supplemented with functional foods rich in bioactive lipids, where increased body weight was accompanied by enhanced lean mass. accretion and reduced visceral adiposity [34]. The reduction in epididymal and the activation of peroxisome proliferators may mediate retroperitoneal fat pads- activated receptor gamma (PPAR-γ) by dietary MUFAs and polyphenols, which promotes adipocyte differentiation into smaller, more insulin-sensitive cells, while simultaneously stimulating lipolysis in hypertrophic visceral adipocytes [35]. This Remodeling of adipose tissue is critical for preventing obesity-associated metabolic disorders dysfunction [36].
The preservation of renal function, evidenced by stable serum urea and creatinine levels across all supplemented groups, confirms the absence of nephrotoxicity even at the highest doses of buriti oil and pulp. High-fat dietary interventions often precipitate early renal injury characterized by glomerular hypertrophy and elevated circulating nitrogenous waste products [37]. However, the specific lipid profile of buriti, combined with its antioxidant constituents, appears to protect the renal microvasculature from lipotoxicity and oxidative stress [38]. Furthermore, the modulation of serum total proteins and albumin observed in the high-dose groups reflects a dynamic adaptation in hepatic protein synthesis. Albumin, beyond its role as a nutritional marker, functions as a major extracellular antioxidant; its altered synthesis rate in response to dietary lipid and Polyphenol intake has been documented as a compensatory mechanism to maintain redox homeostasis during metabolic remodeling [39].
A major strength of this study is the integration of classical inferential statistics with advanced machine learning algorithms to decode the complex metabolic responses to buriti supplementation. The high classification accuracy achieved by the ensemble methods, particularly Random Forest, demonstrate that the combined biochemical and the morphological profile carries robust discriminative signatures. The application of Shapley Additive exPlanations (SHAP) provided unprecedented interpretability to these models, moving beyond simple predictive accuracy to reveal the exact hierarchical importance and non-linear dynamics of each biomarker [40]. This computational approach aligns with the emerging paradigm of precision nutrition, where explainable artificial intelligence (XAI) is utilized to identify critical metabolic nodes, such as total cholesterol and ALT in this study, that drive the physiological response to functional foods in experimental models.
5. Conclusions
This study demonstrated that supplementation with Mauritia flexuosa oil and pulp results in significant, clearly dose-dependent metabolic effects in healthy mice. The pulp, especially at high doses, showed greater efficacy in modulating the lipid profile, with significant reductions in total cholesterol and triglycerides, and a significant decrease in ALT, indicating a hepatoprotective effect without evidence of toxicity. The presence of consistent linear relationships for key variables confirms a distinct dose-response pattern. The high proportion of variables with significant differences, along with large effect sizes and high predictive model accuracy, reinforces the robustness of the findings and the consistency of the systemic metabolic impact. Taken together, the results support the potential of buriti as a functional food with hypolipidemic and hepatoprotective properties, and establish a solid experimental model for future investigations in metabolic and functional nutrition.
Supplementary Materials
The following supporting information can be downloaded at: https://doi.org/10.6084/m9.figshare.32320164.
Author Contributions
Conceptualization, K.S.S. and R.P.M.S.; methodology, K.S.S., C.F.S. and L.C.O.G.; formal analysis, K.S.S. and C.F.S.; investigation, K.S.S., C.F.S., F.A.G. and Y.K.C.; resources, L.C.A., S.P.B. and R.P.M.S.; data curation, K.S.S. and C.F.S.; writing — original draft preparation, K.S.S. and C.F.S.; writing — review and editing, L.C.O.G. and R.P.M.S.; visualization, K.S.S., F.A.G. and Y.K.C.; supervision, L.C.O.G. and R.P.M.S.; project administration, R.P.M.S.; funding acquisition, L.C.A., S.P.B. and R.P.M.S. All authors have read and agreed to the published version of the manuscript.
Funding
This work was funded by research grants from the Acre State Research Support Foundation (FAPAC) and the Coordination for the Improvement of Higher Education Personnel - Brazil (CAPES).
Institutional Review Board Statement
The research was analyzed and approved by the Ethics Committee on the Use of Animals (CEUA) of the Federal University of Acre (UFAC), process number 23107.018612/2016-31. The 80 Swiss mice were obtained from the UFAC animal facility, respecting the guidelines of the Manual of Care and Procedures for Laboratory Animals of the Production and Experimentation Animal Facility of FCF-IQ/USP [16].
Informed Consent Statement
Not applicable.
Data Availability Statement
The datasets generated and analyzed during the current study are available from the corresponding author upon reasonable request.
Conflicts of Interest
The authors declare no conflicts of interest.
Abbreviations
The following abbreviations are used in this manuscript:
| AIN-93G | American Institute of Nutrition — 1993 formulation for growing rodents |
| ALT | alanine aminotransferase |
| ANOVA | Analysis of Variance |
| AST | aspartate aminotransferase |
| CEUA | Ethics Committee on Animal Use |
| CONCEA | Brazilian National Council for the Control of Animal Experimentation |
| GC | control group |
| GGT | gamma-glutamyl transferase |
| GO1 | low-dose buriti oil group |
| GO2 | high-dose buriti oil group |
| GP1 | low-dose buriti pulp group |
| GP2 | high-dose buriti pulp group |
| HDL-c | high-density lipoprotein cholesterol |
| KNN | K-Nearest Neighbors |
| MUFAs | monounsaturated fatty acids |
| NF-κB | nuclear factor kappa B |
| PC1 | first principal component |
| PC2 | second principal component |
| PCA | Principal Component Analysis |
| PPAR-γ | peroxisome proliferator-activated receptor gamma |
| ROS | reactive oxygen species |
| SHAP | SHapley Additive exPlanations |
| SREBP-1c | sterol regulatory element-binding protein 1c |
| SVM | Support Vector Machine |
| XAI | Explainable Artificial Intelligence. |
References
- Silva, N.R.R.N.; Cavalcante, R.B.M.; Silva, F.A. Nutritional properties of Buriti (Mauritia flexuosa) and health benefits. J. Food Compos Anal. 2023, 117, 105092. [Google Scholar] [CrossRef]
- Rodrigues Neto, E.M.; Girão Júnior, F.J.; Fraga, E.G.S.; Campos, M.O.C.; Barros, K.B.N. T.; Fonteles, M.M.F. Therapeutic and esthetic potential of Buriti (Mauritia flexuosa L. f.). J. Chem. Pharm. Res. 2017, 9, 364–367. [Google Scholar]
- World Health Organization. Global health risks: mortality and burden of disease attributable to selected major risks; World Health Organization: Geneva, 2009; Available online: https://iris.who.int/handle/10665/44203.
- Younossi, Z.M.; Golabi, P.; Paik, J.M.; Henry, A.; Van Dongen, C.; Henry, L. The global epidemiology of nonalcoholic fatty liver disease (NAFLD) and nonalcoholic steatohepatitis (NASH): a systematic review. Hepatology 2023, 77, 1335–1347. [Google Scholar] [CrossRef] [PubMed]
- Friedman, S.L.; Neuschwander-Tetri, B.A.; Rinella, M.; Sanyal, A.J. Mechanisms of NAFLD development and therapeutic strategies. Nat. Med. 2018, 24, 908–922. [Google Scholar] [CrossRef]
- Romero, A.; et al. Effects of consumption of Mauritia flexuosa fruits on renal and hepatic functions in growing rats. ABCS Health Sci. 2023, 48, e 023229. [Google Scholar] [CrossRef]
- Oliveira, D.M.; Siqueira, E.P.; Nunes, Y.R.F.; Cota, B.B. Flavonoids from leaves of Mauritia flexuosa. Rev. Bras. Pharmacogn. 2013, 23, 614–620. [Google Scholar] [CrossRef]
- da Rocha Romero, A.B.; de Carvalho e Martins Mdo, C.; Moreira Nunes, P.H.; Ravenna Trindade Ferreira, N.; da Silva Brito, A.K.; Marinho da Cunha, P.F.; de Lima, A.; de Assis, R.C.; Moreira Araújo, E. IN VITRO AND IN VIVO ANTIOXIDANT ACTIVITY OF BURITI FRUIT (MAURITIA FLEXUOSA L.F.). Nutr. Hosp. 2015, 32, 2153–61. [Google Scholar] [CrossRef]
- Aquino, J.S.; Batista, K.S.; Araujo-Silva, G.; Santos, D.C.; Brito, N.J.; López, J.A.; et al. Antioxidant and hypolipidemic effects of buriti oil (Mauritia flexuosa L.) administered to iron-overloaded rats. Molecules 2023, 28, 2585. [Google Scholar] [CrossRef]
- Aquino, J.S.; Soares, J.K.B.; Magnani, M.; Stamford, T.C.M.; Mascarenhas, R.J.J.; Tavares, R.L.; Stamford, T.L.M. Effects of Brazilian palm oil (Mauritia flexuosa L.) on cholesterol profile and vitamin A and E status of rats. Molecules 2015, 20, 9054–9070. [Google Scholar] [CrossRef]
- Medeiros, M.C.; Aquino, J.S.; Soares, J.; Figueiroa, E.B.; Mesquita, H.M.; Pessoa, D.C.; Stamford, T.L.M. Buriti oil (Mauritia flexuosa L.) negatively impacts somatic growth and reflex maturation and increases retinol deposition in young rats. Int. J. Dev. Neurosci. 2015, 46, 7–13. [Google Scholar] [CrossRef]
- Manhães, L.R.T.; Sabaa-Srur, A.U.O. Centesimal composition and bioactive compounds in buriti fruits collected in Pará. Ciênc Technol. Food 2011, 31, 856–863. [Google Scholar] [CrossRef]
- Freitas, M.L.F.; Chisté, R.C.; Polachini, T.C.; Sardella, L.A.C.Z.; Aranha, C.P.M.; Ribeiro, A.P.B.; et al. Quality characteristics and thermal behavior of buriti (Mauritia flexuosa L.) oil. Grasas Accept. 2017, 68, 223. [Google Scholar] [CrossRef]
- Koolen, H.H.F.; da Silva, F.M.A.; Gozzo, F.C.; de Souza, A.Q.L.; de Souza, A.D.L. Antioxidant, antimicrobial activities and characterization of phenolic compounds from buriti (Mauritia flexuosa L. f.) by UPLC–ESI-MS/MS. Food Res. Int. 2013, 51, 467–473. [Google Scholar] [CrossRef]
- Marcelino, G.; Hiane, P.A.; Pott, A.; et al. Characterization of buriti (Mauritia flexuosa) pulp oil and the effect of its supplementation in an in vivo experimental model. Nutrients 2022, 14, 2547. [Google Scholar] [CrossRef]
- Neves, S.M.P.; Ong, F.M.P.; Rodrigues, L.D.; et al. Manual of Care and Procedures for Laboratory Animals at the Production and Experimentation Animal Facility of FCF-IQ/USP; FCF-IQ/USP: São Paulo, 2013. [Google Scholar]
- Reeves, P.G.; Nielsen, F.H.; Fahey, G.C., Jr. AIN-93 purified diets for laboratory rodents: final report of the American Institute of Nutrition ad hoc writing committee on the reformulation of the AIN-76A rodent diet. J. Nutr. 1993, 123, 1939–1951. [Google Scholar] [CrossRef]
- Albuquerque, M.L.S.; Guedes, I.; Alcantara-Jr, P.; Moreira, S.G.C.; Barbosa-Neto, N.; Correa, D.S.; Zilio, S.C. Characterization of Buriti (Mauritia flexuosa L.) oil by absorption and emission spectroscopies. J. Braz. Chem. Soc. 2005, 16, 1113–1117. [Google Scholar] [CrossRef]
- Silberzahn, R.; Uhlmann, E.L. Crowdsourced research: Many hands make light work. Nature 2015, 526, 189–191. [Google Scholar] [CrossRef]
- Sutherland, R.J. Biochemical evaluation of the hepatobiliary system in dogs and cats. Vet. Clin. North Am. Small Anim. Pract. 1989, 19, 899–927. [Google Scholar] [CrossRef]
- Pabón, M.L.; Lönnerdal, B. Effects of dietary fat type on iron bioavailability assessed in suckling and weanling rats. Trace Elem. Med. Biol. 2001, 15, 18–23. [Google Scholar] [CrossRef] [PubMed]
- Bicalho, A.H.; Santos, F.R.; Moreira, D.C.; Guimarães, V.H.D.; Ribeiro, G.H.; de Paula, A.M.B.; Guimarães, A.L.S.; Pereira, U.A.; Costa, T.; Paiva, C.L.; Baldo, M.P.; Santos, S.H.S. Development and evaluation of a low-cost dairy food supplement with Mauritia flexuosa (buriti) to combat malnutrition: a translational study in rats and institutionalized older women. Curr. Aging Sci. 2022, 15, 37–48. [Google Scholar] [CrossRef]
- Bicalho, A.H.; Santos, F.R.; Moreira, D.C.; Oliveira, L.P.; Machado, A.S.; Farias, L.; De Paula, A.M.B.; Guimarães, A.L.S.; Santos, S.H.S. Liver damage produced by malnutrition is improved by dietary supplementation in mice: assessment of a supplement based on buriti (a Cerrado fruit) and dairy by-products. Recent Pat. Food Nutr. Agric. 2021, 12, 29–35. [Google Scholar] [CrossRef]
- Fuentes, E.; Rodríguez-Pérez, W.; Guzmán, L.; Alarcón, M.; Navarrete, S.; Forero-Doria, O.; Palomo, I. Mauritia flexuosa presents in vitro and in vivo antiplatelet and antithrombotic activities. Evid.-Based Complement Altern. Med. 2013, 2013, 653257. [Google Scholar] [CrossRef]
- Fuentes, E.; Rodríguez-Pérez, W.; Guzmán, L.; Alarcón, M.; Navarrete, S.; Forero-Doria, O.; Palomo, I. Mauritia flexuosa Presents In Vitro and In Vivo Antiplatelet and Antithrombotic Activities. Evid. Based Complement Altern. Med. 2013, 2013, 653257. [Google Scholar] [CrossRef]
- Espinoça, I.T.; Basilio, D.C.L.S.; de Araujo, A.J.P.; Ota, R.S.N.; de Souza, K.F.S.; Cassemiro, N.S.; Lagatta, D.C.; Paredes-Gamero, E.J.; Macedo, M.L.R.; Silva, D.B.; et al. Antithrombotic Effect of Oil from the Pulp of Bocaiúva—Acrocomia aculeata (Jacq.) Lodd. ex Mart. (Arecaceae). Nutrients 2024, 16, 2024. [Google Scholar] [CrossRef]
- Zanatta, C.F.; Mitjans, M.; Urgatondo, V.; Rocha Filho, P.A.; Vinardell, M.P. Photoprotective potential of emulsions formulated with buriti oil (Mauritia flexuosa) against UV irradiation on keratinocytes and fibroblast cell lines. FoodChem Toxicol. 2010, 48, 70–75. [Google Scholar] [CrossRef]
- Liu, W.; Zhu, M.; Gong, M.; Zheng, W.; Zeng, X.; Zheng, Q.; et al. Comparison of the effects of monounsaturated fatty acids and polyunsaturated fatty acids on liver lipid disorders in obese mice. Nutrients 2023, 15, 3200. [Google Scholar] [CrossRef] [PubMed]
- Picklo, M.J.; Murphy, E.J. A high-fat, high-oleic diet, but not a high-fat, saturated diet, reduces hepatic α-linolenic acid and eicosapentaenoic acid content in mice. Lipids 2016, 51, 571–582. [Google Scholar] [CrossRef]
- Jacobo-Velázquez, D.A. Functional Foods for Cholesterol Management: A Review of the Mechanisms, Efficacy, and a Novel Cholesterol-Lowering Capacity Index. Nutrients 2025, 15, 2648. [Google Scholar] [CrossRef] [PubMed]
- Lee, Y.; Hu, S.; Park, Y.K.; Lee, J.Y. A Role of Carotenoids in the Prevention of Non-Alcoholic Fatty Liver Disease. Prev. Nutr. Food Sci. 2019, 24, 103–104. [Google Scholar] [CrossRef]
- Li, S.; Tan, H.Y.; Wang, N.; Zhang, Z.J.; Lao, L.; Wong, C.W.; Feng, Y. The Potential and Action Mechanism of Polyphenols in the Treatment of Liver Diseases. Oxid. Med. Cell Longev. 2018, 2018, 8394818. [Google Scholar] [CrossRef] [PubMed]
- Yilmaz, B.; Sahin, K.; Bilen, H.; Bahcecioglu, I.H.; Bilir, B.; Ashraf, S.; Halazun, K.J.; Kucuk, O. Carotenoids and non-alcoholic fatty liver disease. Hepatobiliary Surg. Nutr. 2015, 4, 161–71. [Google Scholar] [CrossRef]
- Zhao, C.; Guo, J.; Du, C.; Xu, Y. Modulation of Fat Deposition–Gut Interactions in Obese Mice by Administrating with Nobiletin. Genes. 2023, 14, 1062. [Google Scholar] [CrossRef] [PubMed]
- Franczyk, M.P.; He, M.; Yoshino, J. Removal of Epididymal Visceral Adipose Tissue Prevents Obesity-Induced Multi-organ Insulin Resistance in Male Mice. J. Endocr. Soc. 2021, 5, bvab024. [Google Scholar] [CrossRef]
- Desmarchelier, C.; Ludwig, T.; Scheundel, R.; et al. Diet-induced obesity in ad libitum-fed mice: food texture overrides the effect of macronutrient composition. Br. J. Nutr. 2013, 109, 1598–1609. [Google Scholar] [CrossRef] [PubMed]
- Kim, S.Y.; Lim, A.Y.; Jeon, S.K.; Lee, I.S.; Choue, R. Effects of dietary protein and fat contents on renal function and inflammatory cytokines in rats with adriamycin-induced nephrotic syndrome. Mediat. Inflamm. 2011, 2011, 945123. [Google Scholar] [CrossRef] [PubMed]
- Calvo-Rubio, M.; Burón, M.I.; López-Lluch, G.; Navas, P.; de Cabo, R.; Ramsey, J.J.; Villalba, J.M.; González-Reyes, J.A. Dietary fat composition influences glomerular and proximal convoluted tubule cell structure and autophagic processes in kidneys from calorie-restricted mice. Aging Cell. 2016, 15, 477–87. [Google Scholar] [CrossRef]
- Zatelli, A.; D'Ippolito, P.; Roura, X.; Zini, E. Short-term effects of dietary supplementation with amino acids in dogs with proteinuric chronic kidney disease. Can. Vet. J. 2017, 58, 1287–1293. [Google Scholar]
- Qi, X.; Wang, S.; Fang, C.; Jia, J.; Lin, L.; Yuan, T. Machine learning and SHAP value interpretation for predicting comorbidity of cardiovascular disease and cancer with dietary antioxidants. Redox Biol. 2025, 79, 103470. [Google Scholar] [CrossRef]
Figure 1.
Effects of buriti (Mauritia flexuosa) oil and pulp supplementation on hepatic and renal biomarkers in mice. (A) Aspartate aminotransferase (AST); (B) Alanine aminotransferase (ALT); (C) Creatinine; (D) Urea. Data are expressed as mean ± standard deviation (n = 15 per group). Statistical comparisons were performed using one-way ANOVA followed by independent-samples t-tests for post hoc pairwise comparisons against the control group (GC). GC: control group; GO1: low-dose buriti oil group; GO2: high-dose buriti oil group; GP1: low-dose buriti pulp group; GP2: high-dose buriti pulp group. * p < 0.05; ** p < 0.01; *** p < 0.001 vs. GC.

Figure 2.
Effects of buriti (Mauritia flexuosa) oil and pulp supplementation on lipid profile in mice. (A) Total cholesterol; (B) Triglycerides; (C) High-density lipoprotein cholesterol (HDL-c). Data are expressed as mean ± standard deviation (n = 15 per group). Total cholesterol and HDL-c were analyzed using one-way ANOVA followed by independent-samples t-tests for post hoc pairwise comparisons against the control group (GC). Triglycerides were analyzed using the Kruskal-Wallis test followed by the Mann-Whitney U test for post-hoc comparisons against GC, given violation of the normality assumption in the GP2 group (Shapiro-Wilk, p < 0.05). GC: control group; GO1: low-dose buriti oil group; GO2: high-dose buriti oil group; GP1: low-dose buriti pulp group; GP2: high-dose buriti pulp group. * p < 0.05; ** p < 0.01; *** p < 0.001 vs. GC.

Figure 3.
Effects of buriti (Mauritia flexuosa) oil and pulp supplementation on serum protein markers in mice. (A) Total proteins; (B) Albumin. Data are expressed as mean ± standard deviation (n = 15 per group). Statistical comparisons were performed using a one-way ANOVA followed by an independent-samples t-test for post hoc pairwise comparisons against the control group (GC). GC: control group; GO1: low-dose buriti oil group; GO2: high-dose buriti oil group; GP1: low-dose buriti pulp group; GP2: high-dose buriti pulp group. * p < 0.05; ** p < 0.01; *** p < 0.001 vs. GC.

Figure 4.
Effects of buriti (Mauritia flexuosa) oil and pulp supplementation on visceral adipose tissue depots in mice. (A) Epididymal fat pad weight; (B) Retroperitoneal fat pad weight. Data are expressed as mean ± standard deviation (n = 15 per group). Statistical comparisons were performed using one-way ANOVA followed by independent-samples t-tests for post hoc pairwise comparisons against the control group (GC). GC: control group; GO1: low-dose buriti oil group; GO2: high-dose buriti oil group; GP1: low-dose buriti pulp group; GP2: high-dose buriti pulp group. * p < 0.05; ** p < 0.01; *** p < 0.001 vs. GC.

Figure 6.
Multivariate analysis of the profile of patterns, trends, and clustering among experimental groups based on all 13 measured variables. (A) Principal Component Analysis (PCA) biplot displaying individual animal scores on the first two principal components (PC1 and PC2), which together explained 55.2% of total variance (PC1: 44.8%; PC2: 10.4%). Dashed ellipses represent the 95% confidence regions of three identified clusters: Cluster 1 (control group, GC); Cluster 2 (oil-supplemented groups, GO1 and GO2); Cluster 3 (pulp-supplemented groups, GP1 and GP2). (B) Hierarchical clustering dendrogram of experimental group centroids, computed using Ward's linkage method with Euclidean distance based on standardized mean values of all 13 variables. GC: control group; GO1: low-dose buriti oil group; GO2: high-dose buriti oil group; GP1: low-dose buriti pulp group; GP2: high-dose buriti pulp group.

Figure 7.
Comparison of machine learning classification models for predicting experimental group membership based on 13 biochemical, metabolic, and body composition variables. Cross-validation accuracy (mean ± standard deviation) was estimated using 5-fold stratified cross-validation (n = 75 animals; n = 15 per group; 5 classes). Eight supervised classification algorithms were evaluated: Random Forest, Gradient Boosting, Decision Tree, Support Vector Machine (SVM), Logistic Regression, K-Nearest Neighbors (KNN), Multilayer Perceptron (Neural Network), and AdaBoost. Bars are color-coded by performance level, from red (lower accuracy) to green (higher accuracy). The dashed vertical line indicates the 0.80 accuracy threshold. Gold-bordered bars denote the top-2 performing models. All models were trained on standardized data (zero mean, unit variance).

Disclaimer/Publisher’s Note: The statements, opinions and data contained in all publications are solely those of the individual author(s) and contributor(s) and not of MDPI and/or the editor(s). MDPI and/or the editor(s) disclaim responsibility for any injury to people or property resulting from any ideas, methods, instructions or products referred to in the content. |
© 2026 by the authors. Licensee MDPI, Basel, Switzerland. This article is an open access article distributed under the terms and conditions of the Creative Commons Attribution (CC BY) license (http://creativecommons.org/licenses/by/4.0/).
Copyright: This open access article is published under a Creative Commons CC BY 4.0 license, which permit the free download, distribution, and reuse, provided that the author and preprint are cited in any reuse.


