

Submitted:
22 May 2026
Posted:
25 May 2026
You are already at the latest version
Abstract
Introduction: Decompressive craniectomy (DC) is often required to stabilize the intracranial pressure (ICP) in patients with traumatic brain injury (TBI). Both the sinking flap syndrome and hydrocephalus are known complications of DC. The pathophysiology of each is unknown. Case Report: We report on a patient who underwent DC for TBI who suffered both the sinking flap syndrome and low-pressure hydrocephalus. We measured the changes in volumes of each hemisphere and the ventricles with CT, and the cerebral blood flow (CBF) and aqueduct flow with phase-contrast MRI during different stages of the disease process. Discussion: The sinking flap syndrome in this patient was associated with a reduction in volume of both supratentorial cavities. There was a significant reduction in CBF bilaterally, which increased by an average of 26% following cranioplasty. During the low-pressure hydrocephalus phase of the patient’s illness, there was a reversed CSF flow directed toward the ventricles. Once the ventricles returned to normal size, this reversed flow was lost. Lumped parameter modelling of the patients’ CSF and vascular systems suggests that the reduction in blood flow was due to a reversible constriction of the arterioles secondary to a reset of the autoregulation rather than compression of the venous structures. There is evidence to suggest there is an increase in CSF absorption efficiency despite the known CSF absorption mechanisms being unlikely to function at such a low ICP. A hypothesis is put forward that CSF absorption occurs via the brain capillary bed in these diseases.
Keywords:
cerebral blood flow
; blood-brain barrier
; low-pressure hydrocephalus
; net aqueduct flow
; sinking flap syndrome
1. Introduction
Decompressive craniectomy (DC) involves the removal of a large portion of the skull to accommodate the increased brain volume, which can occur in patients with severe cerebral oedema following a brain insult [1]. Decompressive craniectomy is often required to urgently treat intracranial hypertension due to stroke, head trauma, and cerebritis [2]. A cranial window allows the swollen brain to bulge out through the defect, decreasing the intracranial pressure (ICP) and increasing the intracranial compliance [2]. Usually, the swelling subsides over several weeks, and a bone flap is replaced in the cranial window. The procedure is not without risk, with many possible complications noted. Of interest is the development of the sinking flap syndrome (SFS). In this syndrome, the previously convex skin flap becomes concave and bulges inward toward the brain. The collapse of the flap occurs weeks to months following DC and is associated with headaches, dizziness, seizures, sensory deficits, motor dysfunction, and cognitive impairment [3]. The symptoms improve following reconstitution of the skull with a cranioplasty. The incidence is approximately 28% of craniectomies [4]. Another significant complication of DC is hydrocephalus. Hydrocephalus refers to the abnormal accumulation of CSF within the ventricles not due to atrophy or ex-vacuo dilatation [5]. The ICP is often elevated in hydrocephalus but may be in the normal range in so-called “normal pressure hydrocephalus” (NPH) [6]. Rather paradoxically, Pang and Altschuler identified a variant of hydrocephalus with a low or even negative ICP [7]. Decompressive craniectomy leads to hydrocephalus in 15% of patients with traumatic brain injury (TBI) [8]. The purpose of the current paper is to describe the CT and MRI findings in a patient who underwent DC for a TBI who subsequently suffered both the sinking flap syndrome and low-pressure hydrocephalus. The aim is to see if this case can provide any clues as to the underlying pathophysiology of these complications and suggest a new hypothesis regarding causation.
2. Case Report
A man in his fifties suffered an electric scooter accident while not wearing a helmet. On arrival at the hospital, he was unconscious with a Glasgow Coma Scale (GCS) score of 7. He was noted to have a large abrasion to the right side of his head. He had no movement of his left upper limb and was very weak in the left lower limb, with normal movement on the right. An immediate head CT scan showed a large right frontoparietal intraparenchymal hemorrhage (see Figure 1A).
The volume of the hemorrhage was measured by tracing the outline of the hemorrhage on the individual slices and multiplying the areas obtained by the slice thickness. A volume of 94 ml was calculated. A slice obtained at the level of the frontal horns of the ventricles showed a degree of midline shift and some ventricular effacement (Figure 1B). The changes in the volume of the right and left supratentorial spaces, incorporating the midline shift, the ventricular volume, and the total supratentorial volume, were measured using the same technique as for the hemorrhage. The findings are appended in Table 1.
The supratentorial space had a volume of 1300 ml initially and given the right and left hemispheres are usually symmetrical, this would give a volume of 650 ml for each. It is noted that the midline shift has increased the volume of the right side by 32 mL and reduced the left by the same amount. The ventricles were slit-like with a small total volume of 4 mL.
The patient was immediately taken to the operating theater and a large decompressive craniectomy and hemorrhage evacuation performed. A CT was performed the next day (Figure 1C). The craniectomy had increased the supratentorial volume by 144 mL and reduced the midline shift and allowed the ventricles to return to a normal size. A lumbar drain was inserted to monitor and treat the raised ICP. At this point the GCS improved to between 14 and 15 with good verbal responses but a dense left hemiplegia and a left-sided neglect. Over the course of time the patient developed fluctuating reductions in the level of consciousness and confusion. The lumbar drain was removed on day 18 post-injury.
By day 78 the patient was noted to be becoming drowsier, with worsening speech and slurring of his words initially but ultimately becoming almost mute. He developed severe paroxysmal reductions in consciousness, and a repeat CT was performed (Figure 1D). The flap was now deeply concave with 19.2 mm of midline shift. The sulci appeared compressed, but paradoxically, the left ventricle had continued to increase in size. The diagnosis of sinking flap syndrome was made. The volume measurements showed the total supratentorial volume had reduced by 156 mL below the initial volume, with 96 mL of this reduction coming from the right side and 60 mL from the left. The ventricular volume had increased by 108% compared to the craniectomy phase. It was feared that the patient was developing obstructed hydrocephalus secondary to kinking of the cerebral aqueduct, so an MRI study with phase-contrast volume measurements of the cerebral blood flow and aqueduct flow was performed on day 81. The results are appended in Table 2.
The right, left, and basilar artery blood flows were measured at the skull base, and the total flow was calculated by adding these together. The total flow seemed low at 534 mL/min. The aqueduct was patent with no pulsation to the flow. It was noted there was a net caudocranial flow of 4.9 mL/min into the ventricles. The cross-sectional area of the sagittal sinus was measured on the T2 images 3 cm above the torcula. On day 114 a cranioplasty was performed using a polyetheretherketone prosthesis. The patient almost immediately improved with the GCS increasing from 14 to 15. The patient’s speech returned to the initial findings, and he was able to sit up and feed himself. The supratentorial volume returned to just above normal with less midline shift (Figure 1E). However, the ventricles remained enlarged. A repeat MRI study 20 days after the cranioplasty showed an increase in the right carotid flow of 39% and the left 26%. The total blood flow increased by 26%. The aqueduct flow had returned to being pulsatile with a systolic stroke volume of 79 µL. The net CSF inflow towards the ventricles had reduced to 1.5 mL/min. The cross-sectional area of the sagittal sinus was reduced by 26%.
By day 23 following the cranioplasty, it was noted there was wound breakdown at the cranioplasty site with the prosthesis now being on show. The cranioplasty was removed 3 days later. There was a period of wound infection, which was treated with antibiotics. By day 28 following the removal of the cranioplasty, the sinking flap syndrome had recurred with fluctuating consciousness and reduced speech. A repeat CT (Figure 1F) showed increased midline shift, but the ventricles were no longer dilated, with no evidence of hydrocephalus. The supratentorial volume was now 59 mL less than the initial volume with a 39 mL reduction on the right and 20 mL on the left. The MRI study was repeated on day 30 following the cranioplasty removal, and the cerebral blood flow was now less than during the previous sinking flap syndrome episode, being 502 mL/min in total. The aqueduct flow was again non-pulsatile, but there was no net flow into or out of the ventricles at this time. The sagittal sinus had increased in cross-sectional area by 15%.
3. Discussion
3.1. Sinking Flap Syndrome: Brain Compression or Reduced CSF Volume
As noted in the introduction, this patient fulfilled the criteria for the sinking flap syndrome (SFS) on two occasions. In addition, the marked dilatation of the ventricles despite the reduced subarachnoid space CSF volume in Figure 1D suggested the development of low-pressure hydrocephalus, which subsequently resolved over time. The Monro-Kellie doctrine states that as all the components of the intracranial cavity are incompressible within the fixed volume of the skull, any increase in one component must be accommodated by an equal reduction in another. Thus, the brain, CSF, and cerebral blood volumes must be in balance [9]. The initial hemorrhage acutely added 94 mL of volume to the right hemisphere. This was accommodated by shifting the midline, allowing the right hemisphere to increase in volume by 32 mL. The remaining 62 mL appeared to be accommodated by reducing both the CSF volume within the subarachnoid space on the right and the size of the ventricles. In the acute phase the brain parenchymal volume would not alter. The cerebral blood flow reduces on average by 23% in TBI in the acute setting, but the CBV does not change significantly [10]. This means the CSF volume must change acutely. The 32 mL reduction in the left supratentorial space was accommodated by reducing the subarachnoid space over the left hemisphere. Thus, we can see that the increase in volume on the right, which occurred after the initial hemorrhage, pushed the midline of the brain to the left and compressed the CSF spaces bilaterally to dissipate any remaining pressure gradients. Following the craniectomy and the evacuation of the hemorrhage, the brain herniated into the skull defect, reducing the midline shift.
During the first SFS phase (Figure 1D), there was a return of the midline shift (greater than previous) and a reduction in the CSF spaces around the brain to accommodate the overall 156 mL reduction in intracranial volume. As the brain is very compliant, the initial pressure gradient that would have produced these changes would be largely dissipated at this stage. This raises the question, was the brain pushed (due to an elevated atmospheric pressure gradient) or pulled (due to marked CSF absorption)? It is generally assumed that the brain is pushed by the atmospheric pressure collapsing the flap [3]. Often authors note the normal air pressure at sea level is 760 mmHg and suggest that a large pressure gradient occurs across the cranial defect to be transmitted through to the entire cerebrum [11]. However, this is incorrect. The air pressure is 760 mmHg with respect to the vacuum of space or compared to the vacuum above the mercury column within a barometer but not with respect to the pressure within the cranium. In patients undergoing decompressive craniectomy, the ICP measured with the frontal lobe with a telemetric sensor in the supine position averaged -0.5 mmHg the week before cranioplasty and increased to 6.3 mmHg in the week following cranioplasty. The sensor depth is between 2.5-3 cm in the frontal region [12]. Given there is a hydrostatic pressure gradient within the brain due to the height of the skull, the average intracranial pressure would be higher than that measured. In the case of our patient, his intracranial space was 13 cm in height. Therefore, if the pressure was -0.5 mmHg at 3 cm in depth, the pressure within the subarachnoid space just below the frontal bone would be -2.7 mmHg, and that just inside the occipital bone would be +9.1 mmHg for an average pressure at the center of the brain of +3.5 mmHg (10.3 mmHg post-cranioplasty). Thus, in Figure 1D, the 19.2 mm midline shift is occurring despite the ICP likely being above the atmospheric pressure, and therefore, the brain was unlikely to have been pushed. This indicates the brain was likely to have been pulled due to a primary reduction in the CSF volume.
There is further evidence that the brain was not pushed. This comes from looking at the size of the sulci on the opposite vertex to the side of the disturbance. This will be explained with the help of Figure 2.
It appears to be very difficult to shift the brain towards the opposite vertex even with a large increase in the volume on the other side because the falx cerebri is firmly attached to the skull. Thus, initially, in Figure 2A there is obliteration of the sulci on the right but no compression on the left. The left sulci do not change following craniectomy (Figure 2B), confirming they were not originally compressed. In Figure 2C there is a large reduction in CSF volume on the left despite the brain volume loss on the right due to gliosis from the previous insult. This suggests the CSF volume on the left is reduced during the SFS despite the left brain not being compressed from the right. This indicates the CSF volume loss is not due to compression from the outside. The volume of CSF returns to normal following cranioplasty (Figure 2D). Marasanov et al. came to the same conclusion. In a patient with the SFS, CSF volumes were measured with MRI volumetry. Pre-cranioplasty, the cranial CSF volume was 100.8 mL and the spinal volume 78.2 mL. These volumes increased to 152.7 mL (+ 51.9 mL) and 91.1 mL (+ 12.9 mL), respectively, following cranioplasty with no change in the brain parenchymal volume [13]. Indicating the CSF volume is the primary driver of the SFS, with the reduced volume even occurring within the spinal canal. It is known that volume loss and crowding of the sulci over the vertex, such as that seen in Figure 2C, is a hallmark of NPH, further suggesting that our patient initially had both sinking flap syndrome and hydrocephalus at the same time [14]. Given that the threshold for low-pressure hydrocephalus is an ICP less than 70 mmH2O or 5.1 mmHg [15], our estimate of the average ICP in this patient being 3.5 mmHg indicates this is low-pressure hydrocephalus rather than NPH.
3.2. Changes in Cerebral Blood Flow
Our findings of a total CBF of 530 mL/min for the first instance of the sinking flap syndrome and 502 mL/min in the second are much less than that expected for a male in his mid-50s, which is usually closer to 600 mL/min [16,17]. In a wide-ranging review of the CBF changes in DC patients following cranioplasty, Halani et al. found all studies demonstrated an increase in the ipsilateral CBF, with 43% of studies reporting increased flow on the contralateral side as well [11]. In a study of 54 patients measuring the effect of cranioplasty on CBF using first-pass perfusion CT, the mean increase in CBF and cerebral blood volume (CBV) on the craniectomy side was 15% and 8%, respectively. On the contralateral side to the skull defect, the CBF and CBV increased by 14% and 12%, respectively [18]. However, individual case reports can show remarkably large improvements in CBF and CBV up to 220% and 27%, respectively, on the ipsilateral side and 270% and 26% on the contralateral side [19]. So, our findings of a 39% and 26% increase in the ipsilateral and contralateral CBF are not without precedent. However, we are unaware of any other studies using phase-contrast MRI to measure this effect. As to why such a reduction in blood flow occurs, the literature brings up similar suggestions as noted before. Halani et al. speculate the external force transmitted from the atmosphere to the cerebral vasculature may be enough to cause a reduced CBF due to incomplete vessel collapse [11]. However, is an average pressure within the intracranial cavity of 3.5 mmHg enough to collapse the vessels? To investigate this further, we have performed a lumped parameter study using a technique we have previously extensively published [20,21,22,23,24] (see Figure 3). This model has been validated by correctly predicting the CBV in many differing disease states given the changes in the CBF and ICP. The current modelling is based on the current patients’ CBF and the mean arterial pressure (which was 100 mmHg at the time of the SFS). The ICP is our estimate of an average of 3.5 mmHg in this patient, and the venous sinus pressure comes from Fodstadt et al., who used CSF infusion studies in 14 patients with sinking flap syndrome following craniectomy and calculated the sagittal sinus pressure to be 5.6 mmHg [25].
Essentially, the modelling balances the changes in blood pressure across each segment with the calculated changes in blood volume for each segment depending on the relationship between the change in volume and the change in resistance. More information can be obtained by reviewing the original papers. The main finding is that the CBF is reduced below a normal middle-aged person despite the perfusion pressure (mean arterial pressure—ICP) being increased from 88.5 to 96.5 mmHg. This means the total vascular resistance must increase by 44%. The sinuses are predicted to dilate due to the reversed pressure gradient across their walls (2.1 vs -4.0 mmHg). This correlates well with the measured sagittal sinus cross-sectional area in Table 1 being dilated during the SFS phases compared to the post-cranioplasty state. In spontaneous intracranial hypotension, the sagittal sinus cross-sectional area was 22% larger than in controls due to the reduction in the transmural pressure [26]. The marginal volume reduction in the parenchymal veins comes about due to the slight reduction in the venous transmural pressure gradient, but the increased resistance due to this is negligible. The capillary bed is not compressed in this model due to the extreme bending forces required to reduce such small vessels in volume any further despite the reduced transmural pressures. To balance the total resistance, the arterioles must be significantly constricted, reducing their volume. The total CBV of 47.6 mL in this patient is 7% less than normal and compares with the previously discussed literature findings that the CBV is reduced by an average of 8% in the sinking flap syndrome on the ipsilateral side [18]. The latter prediction suggests the modelling is accurate enough for the current purposes. Note that the arterioles constrict despite having a much larger internal pressure than the ICP, indicating they are not being compressed from outside. The fact that the arterioles are so constricted but can dilate to increase the CBF following cranioplasty indicates they are not irreversibly damaged but rather are electing to be constricted. The same finding was noted in NPH, where the average CBF is reduced by 20% and increases following treatment [22]. This is another indicator that sinking flap syndrome and NPH share pathophysiology.
3.3. Increased CSF Absorption Efficiency
We have concluded that a reduction in CSF volume is the primary abnormality in the SFS. This could come about due to a lack of CSF formation or an increase in the efficiency of CSF absorption. Fodstadt et al. used CSF infusion studies on post-craniectomy patients with sinking flap syndrome and found the CSF formation rate to be normal at 0.42 ml/min [25]. This suggests that the CSF absorption must occur with an average set point (ICP) of 3.5 mmHg, which would make the absorption mechanism of increased efficiency. It is difficult to see how the standard CSF outflow pathways could even operate at such low pressure, let alone at increased efficiency. Most of the CSF absorption is thought to occur through the arachnoid villi. The opening pressure for cranial arachnoid villi is around 3-5 mmHg above the sinus pressure [27]. In Figure 3 you can see the driving pressure across the sinus wall is estimated to be -2.1 mmHg, i.e., no flow should occur. Some CSF absorption is hypothesized to occur via the olfactory nerves into the nasal/ cervical lymphatics [28] and also is suggested to occur through the lymphatics adjacent to the sinuses [29]. The lymphatics drain into the central veins in the chest, which sit at a pressure of 5.0 mmHg [30], meaning the driving pressure for lymphatic absorption is usually 6.5 mmHg between the CSF and right heart, but this falls to -1.5 mmHg in the sinking flap syndrome, meaning it is unlikely to be operating at an increased efficiency. Previously we have suggested that the brain opens an accessory CSF absorption pathway via the capillaries in NPH and in idiopathic intracranial hypertension by utilizing the Starling forces across the capillary walls [21]. Net fluid absorption or production follows a relationship depending on the balance of hydrostatic and osmotic pressures and is summarized in equation 1.
where Jcap is the net capillary fluid flow rate, Lcap is the capillary hydraulic conductivity coefficient, Pcap-Pcsf is the hydraulic pressure gradient across the capillary wall (i.e., the transmural pressure), σcap is the osmotic reflection coefficient, and πcap-πcsf is the osmotic pressure gradient across the capillary wall taking into account both salt and protein [31]. It was noted previously that with an intact blood-brain barrier, the cerebral capillaries have hydraulic conductivities that are two to three orders of magnitude less than systemic capillaries (effectively zero) [32], and the osmotic reflection coefficient is 1 for all substances [31], meaning no net production or absorption of water is possible [21]. However, if the blood-brain barrier opens, then the hydraulic conductivity would increase and the reflection coefficient for salt would drop to zero. Under these circumstances, CSF absorption is possible provided the capillary transmural hydrostatic pressure is low enough and the osmotic pressure gradient afforded by the higher concentration of protein within the capillaries compared to the CSF holds by retaining a high reflection coefficient for protein [21]. We note the average capillary transmural pressure in Figure 3 is reduced in the SFS by 26% compared to normal. There is a significant blood-brain barrier disruption in both NPH [33] and the sinking flap syndrome [34]. In hydrocephalus the CSF protein concentrations are not altered compared to normal in patients with either communicating high-pressure hydrocephalus or NPH [35]. The total CSF protein was noted to be low before shunt but increased by 135% one month after shunt in NPH [36]. The finding of a normal or low CSF protein in NPH would tend to suggest some retention of the protein reflection coefficient. Ten patients with sinking flap syndrome following DC had total CSF protein levels measured [3]. Excluding the 3 patients who had shunts inserted, there was a mean level of 7% above the mean for a large cohort of neurologically normal individuals [37]. This suggests a modest decrease in the protein reflection coefficient in SFS to perhaps 0.8. Thus, if the hydraulic conductivity coefficient were increased, the reflection coefficient for salt reduced to zero, and the protein reflection coefficient retained at a figure of say, 0.8 in SFS, then CSF absorption through the capillaries would be possible. Is this hypothesis feasible? We can test this by placing the known and estimated values in equation 1 to see if an acceptable result occurs. If all the normal CSF production calculated by Fodstadt et al. in SFS of 0.42 mL/min were absorbed through the capillaries, then Jcap would be -0.42 mL/min. We calculated the Pcap-PCSF to be 8.9 mmHg in Figure 3. The πcap-πcsf for protein is 25 mmHg [38]. Our estimate for the reflection coefficient for protein is 0.8. Placing these values in equation 1 gives a hydraulic conductivity coefficient of 0.038 mL/min/mmHg. For a 1500 g brain, this would be 0.0025 mL/min/mmHg/100 g which is 75% lower than the figure for skeletal muscle, which is 0.01–0.015 mL/min/mmHg/100 g [39]. Reducing the reflection coefficient to 0.5 would give a required conductivity coefficient of 0.008 mL/min/mmHg/100 g which is approaching the value for skeletal muscle, but the protein concentration in the CSF of SFS should have been much higher. These results suggest that our hypothesis may be feasible.
3.3. Low-Pressure Hydrocephalus vs. Sinking Flap Syndrome
Thus, both low-pressure hydrocephalus and SFS require a CSF absorption of greater than normal efficiency, which we hypothesize may be due to capillary absorption. What then is the difference between SFS and hydrocephalus? This patient had two episodes of SFS; in the first, the ventricles dilated, and in the second, they did not. In the first, the measured CSF flow through the aqueduct was very high and reversed; in the second, there was no flow into the ventricles at all (see Figure 4).
A flow of 4.9 mL/min into the ventricles (Figure 4A) equates to 7 liters per day and is almost certainly an overestimate. Due to partial voluming effects (where a pixel encompasses both flowing and non-flowing spins), the phase contrast technique we used tends to overestimate the flow volume [40]. However, the effect is stable and relatively limited provided the number of pixels per vessel diameter is greater than 4. The overestimate error is about 10% at 6 pixels per vessel diameter, 15% at 5 pixels per diameter, and 17% at 4 pixels per diameter [40]. Below 4 pixels per diameter, the technique becomes less stable, with overestimation peaking at about 40% at 3 pixels per diameter [41]. The pixel size we used was 0.63 x 0.63 mm, meaning the error for the arterial measurements was 10% or less, but the error for the aqueduct measurement approached 40%. However, the same 3T scanner was used for each measurement, so a similar error should have been seen across all the measurements, meaning the percentage changes should be accurate. The magnitude error should not change the direction of the flow, which should also remain accurate. Irrespective, the net flow was into the ventricles with the ventricles being dilated, and there was no flow into the ventricles with normal-sized ventricles. In 16/21 NPH patients, retrograde flow into the ventricles was seen before shunting and reversed to antegrade after [42]. The authors of this paper noted retrograde flow indicates a positive pressure gradient between ventricles and parenchyma, dilating the ventricles [29]. Thus, the only difference between low-pressure hydrocephalus and SFS may be where the CSF is absorbed. Through the ventricle walls into the deep white matter in hydrocephalus, giving dilatation, and through the leptomeninges into the cortical capillaries, where no ventricular dilatation ensues.
4. Conclusions
The sinking flap syndrome in this patient was associated with a reduction in volume of both of the supratentorial cavities. There was a significant reduction in CBF bilaterally, which increased by an average of 26% following cranioplasty. During the low-pressure hydrocephalus phase of the patient’s illness, there was a reversed CSF flow directed toward the ventricles. Once the ventricles returned to normal size, this reversed flow was lost. Lumped parameter modelling of the patients’ CSF and vascular systems suggests that the reduction in blood flow was due to a reversible constriction of the arterioles secondary to a reset of the autoregulation rather than compression of the venous structures. There is evidence to suggest there is an increase in CSF absorption efficiency despite the known CSF absorption mechanisms being unlikely to function at such a low ICP. A hypothesis is put forward that CSF absorption occurs via the brain capillary bed in these diseases.
Author Contributions
Conceptualisation GAB, ARB. Methodology GAB, ARB. Validation ARB. Writing original draft preparation GAB. Writing- Review and editing GAB ARB. All authors read and approved the final manuscript.
Funding
This research received no external funding.
Institutional Review Board Statement
The study was conducted in accordance with the Declaration of Helsinki and approved by the Hunter New England Local Area Health District ethics committee with reference number 20260428-006.
Informed Consent Statement
Written informed consent was obtained from the patient and their guardian for the conduct of this study and the publication of the results.
Data Availability Statement
All data utilised is contained within the article.
Conflicts of Interest
The authors declare no conflicts of interest.
Abbreviations
The following abbreviations are used in this manuscript:
| CBF | cerebral blood flow |
| CBV | cerebral blood volume |
| CSF | cerebrospinal fluid |
| CT | computed tomography |
| DC | decompressive craniectomy |
| GCS | Glasgow coma scale |
| Hg | mercury |
| ICP | intracranial pressure |
| Jcap | net capillary fluid flow rate |
| Lcap | capillary hydraulic conductivity coefficient |
| min | minute |
| mL | milliliter |
| mm | millimeter |
| MRI | magnetic resonance imaging |
| NPH | normal pressure hydrocephalus |
| Pcap | capillary hydrostatic pressure |
| Pcsf | CSF hydrostatic pressure |
| SPS | sinking flap syndrome |
| TBI | traumatic brain injury |
| µL | microliters |
| πcap | capillary osmotic pressure |
| πcsf | CSF osmotic pressure |
| σcap | capillary reflectance coefficient |
References
- Cooper, D.J.; Rosenfeld, J.V.; Murray, L.; Arabi, Y.M.; Davies, A.R.; D’Urso, P.; Kossmann, T.; Ponsford, J.; Seppelt, I.; Reilly, P.; et al. Decompressive craniectomy in diffuse traumatic brain injury. N Engl. J. Med. 2011, 364, 1493–1502. [Google Scholar] [CrossRef] [PubMed]
- Nomura, S.; Oka, F.; Sugimoto, K.; Fujii, N.; Kawano, A.; Nishimoto, T.; Mori, N.; Ishihara, H. Analysis of persistent sunken brain after cranioplasty as a cause of extracerebral fluid collection. World Neurosurg. X 2026, 30, 100589. [Google Scholar] [CrossRef]
- Yamaura, A.; Makino, H. Neurological deficits in the presence of the sinking skin flap following decompressive craniectomy. Neurol. Med. Chir. 1977, 17, 43–53. [Google Scholar] [CrossRef]
- Tarr, J.T.; Hagan, M.; Zhang, B.; Tanna, N.; Andrews, B.T.; Lee, J.C.; Bradley, J.P. Syndrome of the Trephined: Quantitative Functional Improvement after Large Cranial Vault Reconstruction. Plast. Reconstr. Surg. 2020, 145, 1486–1494. [Google Scholar] [CrossRef]
- Bakmeedeniya, R.W.; Hedger, J.S.; Purnell, M.R. Management of Low/Negative Pressure Hydrocephalus: A Systematic Review of Etiology, Pathophysiology, and Treatment. World Neurosurg. 2026, 207, 124789. [Google Scholar] [CrossRef] [PubMed]
- Adams, R.D.; Fisher, C.M.; Hakim, S.; Ojemann, R.G.; Sweet, W.H. Symptomatic Occult Hydrocephalus with “Normal” Cerebrospinal-Fluid Pressure. A Treatable Syndrome. N Engl. J. Med. 1965, 273, 117–126. [Google Scholar] [CrossRef]
- Pang, D.; Altschuler, E. Low-pressure hydrocephalic state and viscoelastic alterations in the brain. Neurosurgery 1994, 35, 643-655; discussion 655-646. [Google Scholar] [CrossRef]
- Kurland, D.B.; Khaladj-Ghom, A.; Stokum, J.A.; Carusillo, B.; Karimy, J.K.; Gerzanich, V.; Sahuquillo, J.; Simard, J.M. Complications Associated with Decompressive Craniectomy: A Systematic Review. Neurocrit Care 2015, 23, 292–304. [Google Scholar] [CrossRef]
- Kim, J.H.; Choo, Y.H.; Jeong, H.; Kim, M.; Ha, E.J.; Oh, J.; Lee, S. Recent Updates on Controversies in Decompressive Craniectomy and Cranioplasty: Physiological Effect, Indication, Complication, and Management. Korean J. Neurotrauma 2023, 19, 128–148. [Google Scholar] [CrossRef]
- Bouma, G.J.; Muizelaar, J.P.; Schuurman, R.; Fatouros, P.; Marmarou, A. Cerebral Blood Volume in Acute Head Injury: Relationship to CBF and ICP; Springer: Berlin, 1993. [Google Scholar]
- Halani, S.H.; Chu, J.K.; Malcolm, J.G.; Rindler, R.S.; Allen, J.W.; Grossberg, J.A.; Pradilla, G.; Ahmad, F.U. Effects of Cranioplasty on Cerebral Blood Flow Following Decompressive Craniectomy: A Systematic Review of the Literature. Neurosurgery 2017, 81, 204–216. [Google Scholar] [CrossRef] [PubMed]
- Lilja-Cyron, A.; Andresen, M.; Kelsen, J.; Andreasen, T.H.; Petersen, L.G.; Fugleholm, K.; Juhler, M. Intracranial pressure before and after cranioplasty: insights into intracranial physiology. J. Neurosurg. 2020, 133, 1548–1558. [Google Scholar] [CrossRef] [PubMed]
- Marasanov, S.M.; Rados, M.; Njavro, F.; Vukic, M.; Jurejvic, I.; Klarica, M. Craniospinal cerebrospinal fluid volume changes after extreme bilateral frontotemporoparietal craniectomy and cranioplasty: a volumetric magnetic resonance imaging case report. Croat. Med. J. 2026, 67, 44–49. [Google Scholar] [CrossRef] [PubMed]
- Yun, S.; Song, Y.; Suh, C.H.; Jung, W.; Lee, S.H.; Kim, S.; Choi, K.S.; Heo, H.; Shim, W.H.; Jo, S.; et al. Data-Driven differentiation of idiopathic Normal-Pressure hydrocephalus and progressive supranuclear palsy via automated volumetric analysis. Neuroradiology 2025, 67, 3555–3563. [Google Scholar] [CrossRef]
- Wu, X.; Zang, D.; Wu, X.; Sun, Y.; Yu, J.; Hu, J. Diagnosis and Management for Secondary Low- or Negative-Pressure Hydrocephalus and a New Hydrocephalus Classification Based on Ventricular Pressure. World Neurosurg. 2019, 124, e510–e516. [Google Scholar] [CrossRef] [PubMed]
- Wu, C.; Honarmand, A.R.; Schnell, S.; Kuhn, R.; Schoeneman, S.E.; Ansari, S.A.; Carr, J.; Markl, M.; Shaibani, A. Age-Related Changes of Normal Cerebral and Cardiac Blood Flow in Children and Adults Aged 7 Months to 61 Years. J. Am. Heart Assoc. 2016, 5. [Google Scholar] [CrossRef]
- Buijs, P.C.; Krabbe-Hartkamp, M.J.; Bakker, C.J.; de Lange, E.E.; Ramos, L.M.; Breteler, M.M.; Mali, W.P. Effect of age on cerebral blood flow: measurement with ungated two-dimensional phase-contrast MR angiography in 250 adults. Radiology 1998, 209, 667–674. [Google Scholar] [CrossRef]
- Paredes, I.; Castano, A.M.; Cepeda, S.; Alen, J.A.; Salvador, E.; Millan, J.M.; Lagares, A. The Effect of Cranioplasty on Cerebral Hemodynamics as Measured by Perfusion Computed Tomography and Doppler Ultrasonography. J. Neurotrauma 2016, 33, 1586–1597. [Google Scholar] [CrossRef] [PubMed]
- Coelho, F.; Oliveira, A.M.; Paiva, W.S.; Freire, F.R.; Calado, V.T.; Amorim, R.L.; Neville, I.S.; de Andrade, A.F.; Bor-Seng-Shu, E.; Anghinah, R.; et al. Comprehensive cognitive and cerebral hemodynamic evaluation after cranioplasty. Neuropsychiatr. Dis. Treat. 2014, 10, 695–701. [Google Scholar] [CrossRef]
- Bateman, G.A.; Bateman, A.R. Brain Ischemia in Alzheimer’s Disease May Partly Counteract the Disruption of the Blood–Brain Barrier. Brain Sci. 2025, 15, 269. [Google Scholar] [CrossRef]
- Bateman, G.A.; Bateman, A.R. A Lumped Parameter Modelling Study of Idiopathic Intracranial Hypertension Suggests the CSF Formation Rate Varies with the Capillary Transmural Pressure. Brain Sci. 2025, 15. [Google Scholar] [CrossRef]
- Bateman, G.A.; Bateman, A.R. A lumped parameter modelling study of cerebral autoregulation in normal pressure hydrocephalus suggests the brain chooses to be ischemic. Sci. Rep. 2024, 14, 24373. [Google Scholar] [CrossRef]
- Bateman, G.A.; Bateman, A.R. A Lumped Parameter Model Suggests That Infusion Studies Overestimate the Cerebrospinal Fluid Outflow Resistance in Normal Pressure Hydrocephalus. Brain Sci. 2024, 14, 1242. [Google Scholar] [CrossRef]
- Bateman, G.A.; Bateman, A.R. A Lumped Parameter Modelling Study of Leukoaraiosis Suggests Its Vascular Pathophysiology May Be Similar to Normal-Pressure Hydrocephalus. Brain Sci. 2025, 15. [Google Scholar] [CrossRef]
- Fodstad, H.; Love, J.A.; Ekstedt, J.; Friden, H.; Liliequist, B. Effect of cranioplasty on cerebrospinal fluid hydrodynamics in patients with the syndrome of the trephined. Acta Neurochir. (Wien) 1984, 70, 21–30. [Google Scholar] [CrossRef]
- Bateman, G.A.; Lechner-Scott, J.; Copping, R.; Moeskops, C.; Yap, S.L. Comparison of the sagittal sinus cross-sectional area between patients with multiple sclerosis, hydrocephalus, intracranial hypertension and spontaneous intracranial hypotension: a surrogate marker of venous transmural pressure? Fluids Barriers CNS 2017, 14, 18. [Google Scholar] [CrossRef]
- Benabid, A.L.; De Rougemont, J.; Barge, M. Cerebral venous pressure, sinus pressure and intracranial pressure. Neurochirurgie 1974, 20, 623–632. [Google Scholar]
- Bozanovic-Sosic, R.; Mollanji, R.; Johnston, M.G. Spinal and cranial contributions to total cerebrospinal fluid transport. Am. J. Physiol. Regul. Integr. Comp. Physiol. 2001, 281, R909–916. [Google Scholar] [CrossRef] [PubMed]
- van Osch, M.J.P.; Wahlin, A.; Scheyhing, P.; Mossige, I.; Hirschler, L.; Eklund, A.; Mogensen, K.; Gomolka, R.; Radbruch, A.; Qvarlander, S.; et al. Human brain clearance imaging: Pathways taken by magnetic resonance imaging contrast agents after administration in cerebrospinal fluid and blood. NMR BioMed 2024, 37, e5159. [Google Scholar] [CrossRef]
- Norsk, P.; Foldager, N.; Bonde-Petersen, F.; Elmann-Larsen, B.; Johansen, T.S. Central venous pressure in humans during short periods of weightlessness. J. Appl. Physiol. (1985) 1987, 63, 2433–2437. [Google Scholar] [CrossRef] [PubMed]
- Kimelberg, H.K. Water homeostasis in the brain: basic concepts. Neuroscience 2004, 129, 851–860. [Google Scholar] [CrossRef] [PubMed]
- Xiang, J.; Hua, Y.; Xi, G.; Keep, R.F. Mechanisms of cerebrospinal fluid and brain interstitial fluid production. Neurobiol. Dis. 2023, 183, 106159. [Google Scholar] [CrossRef]
- Lee, M.J.; Kim, Y.E.; Chang, H.J.; An, J.H.; Pyo, C.H.; Jeong, J.; Kim, T.; Chang, J.; Oh, E.; Chung, W.; et al. Brain Barriers in Normal Pressure Hydrocephalus: Mechanisms and Therapeutic Perspectives. J. Adv. Res. 2026. [Google Scholar] [CrossRef] [PubMed]
- Ojogho, B.; Abedi, A.; Lee, D.J.; Shao, X.; Russin, J.; Jann, K.; Liu, C.Y.; Wang, D.J.J. Cerebral Perfusion and Blood-Brain Barrier Changes After Cranioplasty: A Diffusion-Prepared Arterial Spin Labeling Study. J. Neuroimaging 2025, 35, e70106. [Google Scholar] [CrossRef]
- Wilhelmy, F.; Krause, M.; Schob, S.; Merkenschlager, A.; Wachowiak, R.; Hartig, W.; Meixensberger, J.; Gburek-Augustat, J.; Wende, T. Cerebrospinal Fluid Protein Concentrations in Hydrocephalus. Children 2023, 10. [Google Scholar] [CrossRef]
- Chen, C.P.C.; Huang, Y.C.; Chang, C.N.; Chen, J.L.; Hsu, C.C.; Lin, W.Y. Changes of cerebrospinal fluid protein concentrations and gait patterns in geriatric normal pressure hydrocephalus patients after ventriculoperitoneal shunting surgery. Exp. Gerontol. 2018, 106, 109–115. [Google Scholar] [CrossRef]
- Fautsch, K.J.; Block, D.R.; Graff-Radford, J.; Wang, F.; Craver, E.C.; Hodge, D.O.; Cutsforth-Gregory, J.K.; Kilgore, K.P.; Petersen, R.C.; Knopman, D.S.; et al. Population-Based Evaluation of Total Protein in Cerebrospinal Fluid. Mayo Clin. Proc. 2023, 98, 239–251. [Google Scholar] [CrossRef]
- Janigro, D. Are you in or out? Leukocyte, ion, and neurotransmitter permeability across the epileptic blood-brain barrier. Epilepsia 2012, 53 Suppl 1, 26–34. [Google Scholar] [CrossRef]
- Taylor, A.E. Capillary fluid filtration. Starling forces and lymph flow. Circ. Res. 1981, 49, 557–575. [Google Scholar] [CrossRef] [PubMed]
- Huang, Z.; Tu, X.; Lin, Q.; Zhan, Z.; Tang, L.; Liu, J. Increased internal cerebral vein diameter is associated with age. Clin. Imaging 2021, 78, 187–193. [Google Scholar] [CrossRef]
- Tang, C.; Blatter, D.D.; Parker, D.L. Accuracy of phase-contrast flow measurements in the presence of partial-volume effects. J. Magn. Reson Imaging 1993, 3, 377–385. [Google Scholar] [CrossRef] [PubMed]
- Ringstad, G.; Emblem, K.E.; Eide, P.K. Phase-contrast magnetic resonance imaging reveals net retrograde aqueductal flow in idiopathic normal pressure hydrocephalus. J. Neurosurg. 2016, 124, 1850–1857. [Google Scholar] [CrossRef] [PubMed]
Figure 1.
The CT findings during the varying phases of the patient’s hospital stay. (A) The initial scan shows a large haemorrhage on the right. (B) A lower slice through the brain during the initial scanning showing a 9 mm midline shift (white horizontal bar) and a small occipital horn of the ventricle on the left measuring 2 mm (yellow bar). (C) The next day following craniectomy, the midline shift has reduced to 4.8 mm with bulging of the flap outward. There is swelling of the right hemisphere with loss of the cortical sulci. The left occipital portion of the ventricle has increased in size to 8.3 mm. (D) The sinking flap phase is associated with a deeply concave skin flap on the right with 19.2 mm of midline shift and reduced cortical sulci bilaterally. The occipital portion of the lateral ventricle has dilated to 16 mm. (E) Following cranioplasty, the midline shift has reduced to 7.5 mm; the cortical sulci have returned, and the left ventricle has slightly reduced in size to 12.8 mm. (F) Following removal of the cranioplasty, the midline shift has increased to 13.4 mm, but the ventricles have continued to decrease in size.
Figure 1.
The CT findings during the varying phases of the patient’s hospital stay. (A) The initial scan shows a large haemorrhage on the right. (B) A lower slice through the brain during the initial scanning showing a 9 mm midline shift (white horizontal bar) and a small occipital horn of the ventricle on the left measuring 2 mm (yellow bar). (C) The next day following craniectomy, the midline shift has reduced to 4.8 mm with bulging of the flap outward. There is swelling of the right hemisphere with loss of the cortical sulci. The left occipital portion of the ventricle has increased in size to 8.3 mm. (D) The sinking flap phase is associated with a deeply concave skin flap on the right with 19.2 mm of midline shift and reduced cortical sulci bilaterally. The occipital portion of the lateral ventricle has dilated to 16 mm. (E) Following cranioplasty, the midline shift has reduced to 7.5 mm; the cortical sulci have returned, and the left ventricle has slightly reduced in size to 12.8 mm. (F) Following removal of the cranioplasty, the midline shift has increased to 13.4 mm, but the ventricles have continued to decrease in size.
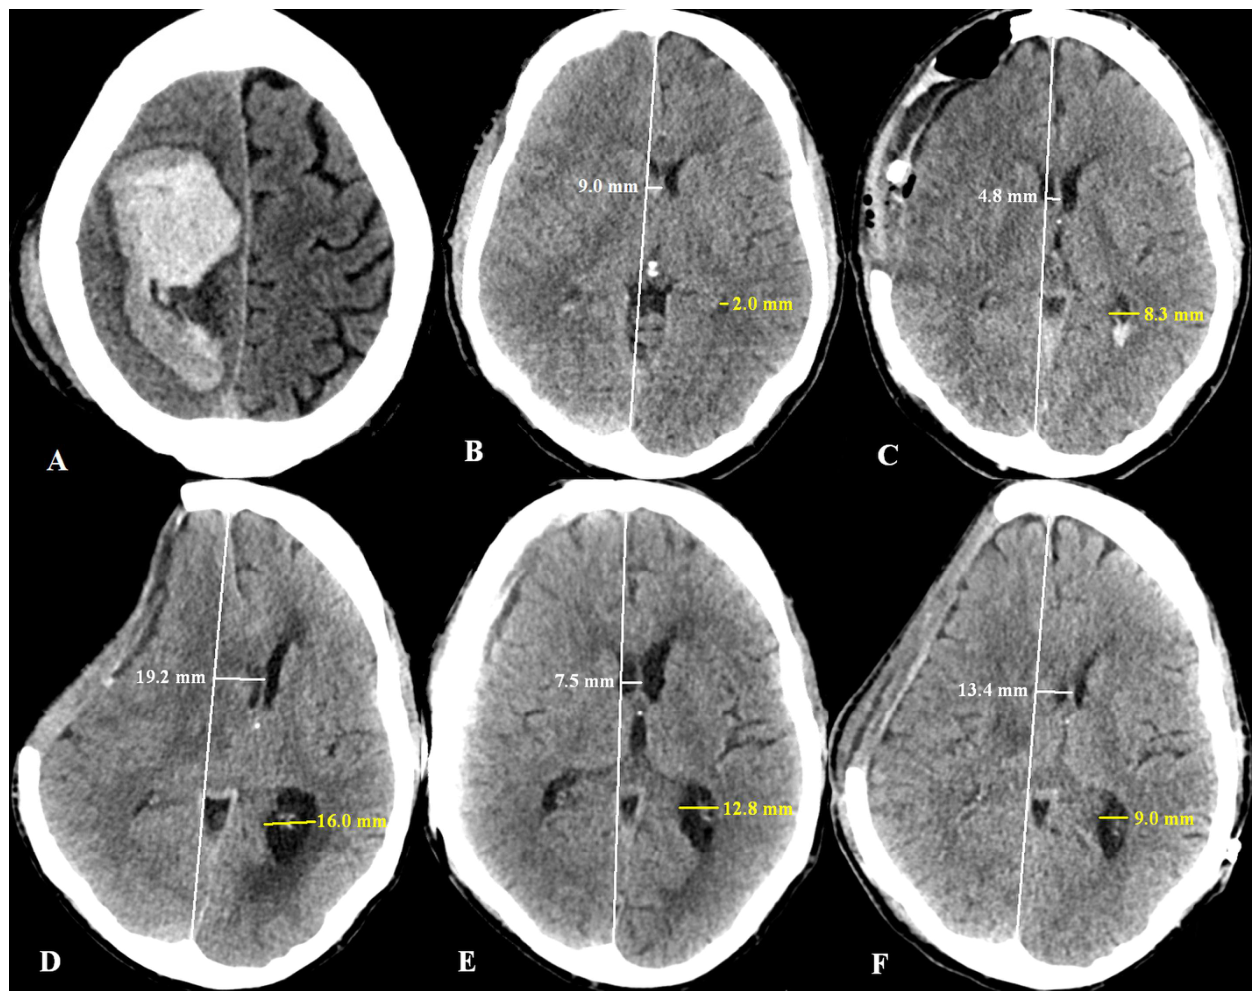
Figure 2.
The CT findings at the vertex during the varying phases of the patient’s hospital stay. (A) The initial scan shows loss of the sulci on the right but preservation on the left, with the central sulcus measuring 4.1 mm (yellow bar). (B) Same slice position after craniectomy showing the left sulci to have not changed in volume. (C) During the sinking flap phase, there is a reduction in the size of the sulci of 83%. (D) Following cranioplasty, the sulci return to a normal volume.
Figure 2.
The CT findings at the vertex during the varying phases of the patient’s hospital stay. (A) The initial scan shows loss of the sulci on the right but preservation on the left, with the central sulcus measuring 4.1 mm (yellow bar). (B) Same slice position after craniectomy showing the left sulci to have not changed in volume. (C) During the sinking flap phase, there is a reduction in the size of the sulci of 83%. (D) Following cranioplasty, the sulci return to a normal volume.
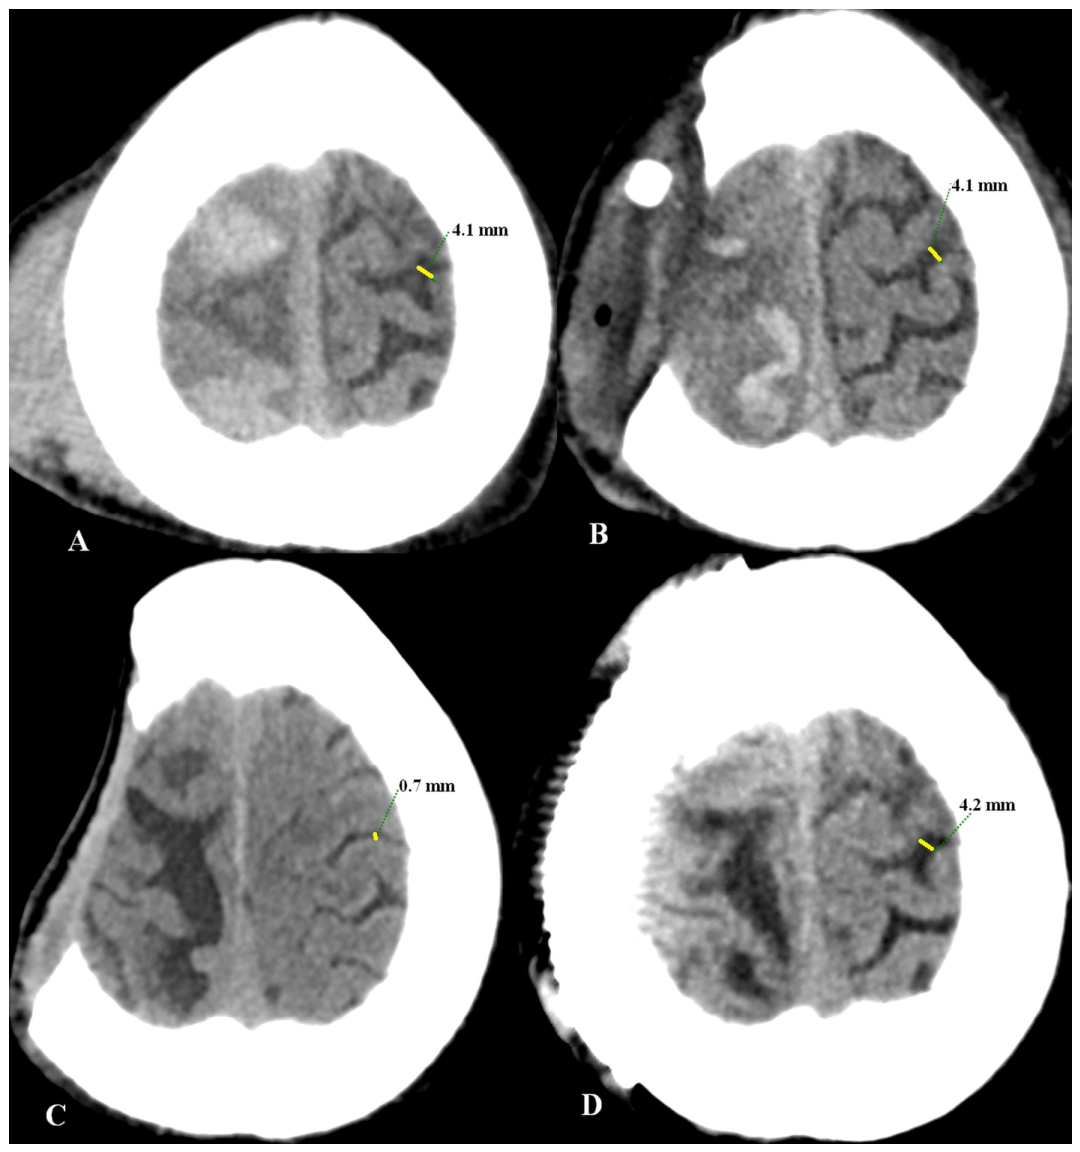
Figure 3.
Lumped parameter modelling of sinking flap syndrome compared to normal. The five vascular segments modelled are shown in Figure 3A: the arteries in red, the capillaries in orange, the veins in yellow, the outflow cuff in green, and the sinus in blue. The pressures at the beginning and end of each segment have been appended within the vessels in Figure 3A and were originally obtained from the literature. The resistance of each segment was calculated to be the change in pressure divided by the flow and is shown below the vessels. The normal cerebral blood volume (CBV) values are shown below the resistances. The blue numbers represent the transmural pressure gradients for each vessel segment and are obtained by subtracting the ICP from the segment pressure. The red figure is the average capillary TMP obtained by averaging the value from before and after the capillaries. Figure 3B represents the findings in sinking flap syndrome; the red segments represent the areas of increased resistance compared to the normal findings, and the green represents reduced resistance. Note: ICP; intracranial pressure, min; minute, mm; millimetre and mmHg; millimetre of mercury. Figure 3A is reproduced from [22] under a CC BY 4.0 commons licence.
Figure 3.
Lumped parameter modelling of sinking flap syndrome compared to normal. The five vascular segments modelled are shown in Figure 3A: the arteries in red, the capillaries in orange, the veins in yellow, the outflow cuff in green, and the sinus in blue. The pressures at the beginning and end of each segment have been appended within the vessels in Figure 3A and were originally obtained from the literature. The resistance of each segment was calculated to be the change in pressure divided by the flow and is shown below the vessels. The normal cerebral blood volume (CBV) values are shown below the resistances. The blue numbers represent the transmural pressure gradients for each vessel segment and are obtained by subtracting the ICP from the segment pressure. The red figure is the average capillary TMP obtained by averaging the value from before and after the capillaries. Figure 3B represents the findings in sinking flap syndrome; the red segments represent the areas of increased resistance compared to the normal findings, and the green represents reduced resistance. Note: ICP; intracranial pressure, min; minute, mm; millimetre and mmHg; millimetre of mercury. Figure 3A is reproduced from [22] under a CC BY 4.0 commons licence.
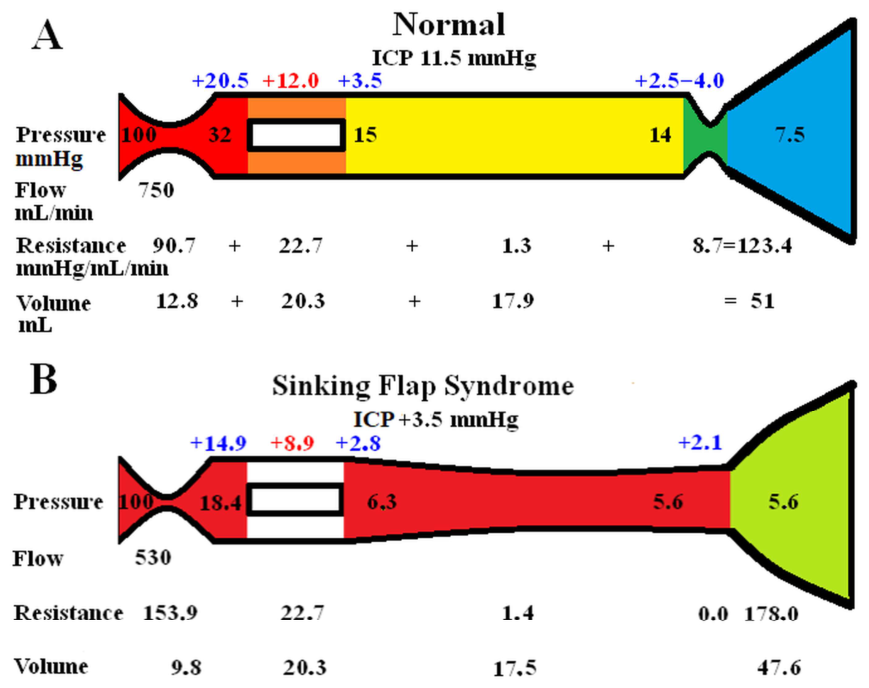
Figure 4.
Flow graphs through the aqueduct. (A) During the first sinking flap syndrome phase, there was little pulsation, indicating high intracranial compliance. There was no negative flow indicating only flow passing intracranially. (B) During the period of the cranioplasty, a normal pulsation returns with a reduction in the net flow, but this still occurs into the ventricles. (C) The second sinking flap syndrome period shows no pulsation or net flow into or out of the ventricles.
Figure 4.
Flow graphs through the aqueduct. (A) During the first sinking flap syndrome phase, there was little pulsation, indicating high intracranial compliance. There was no negative flow indicating only flow passing intracranially. (B) During the period of the cranioplasty, a normal pulsation returns with a reduction in the net flow, but this still occurs into the ventricles. (C) The second sinking flap syndrome period shows no pulsation or net flow into or out of the ventricles.
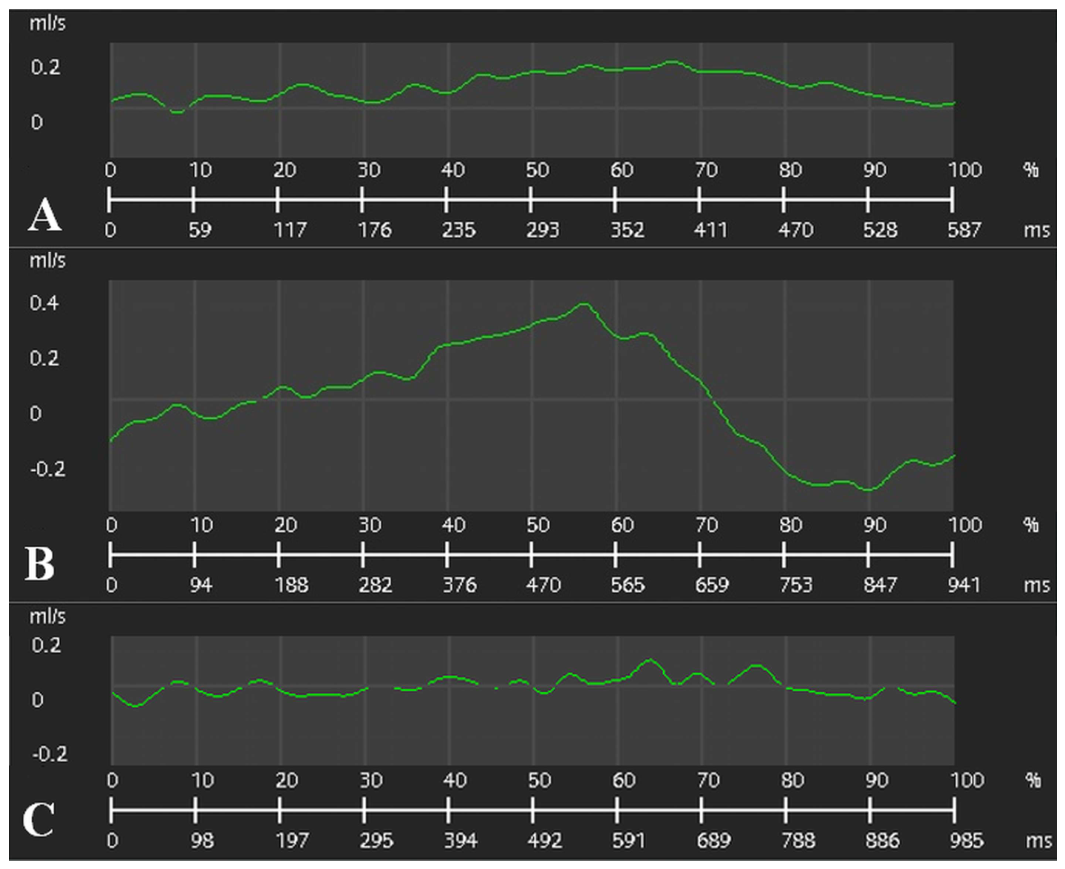

Table 1.
Summary of CT volume changes.
| Region | Acute | Craniectomy | Sinking flap 1 | Cranioplasty | Sinking flap 2 |
|---|---|---|---|---|---|
| Right ST mL |
682 | 807 | 554 | 705 | 611 |
| Left ST mL |
618 | 637 | 590 | 648 | 630 |
| Total ST mL |
1300 | 1444 | 1144 | 1353 | 1241 |
| Ventricular mL |
4 | 13 | 27 | 28 | 10 |
Note: mL, milliliters; ST, supratentorial.
Table 2.
Summary of MRI findings.
| Measurement | Sinking flap 1 | Cranioplasty | % Change | Sinking flap 2 | % Change |
|---|---|---|---|---|---|
| Right carotid flow mL/min |
174 | 242 | +39 | 172 | -29 |
| Left carotid flow mL/min |
204 | 258 | +26 | 192 | -26 |
| Basilar flow mL/min |
156 | 174 | +12 | 138 | -21 |
| Total CBF mL/min |
534 | 674 | +26 | 502 | -26 |
| Aqueduct pulsation µL |
0 | 79 | - | 0 | -100 |
| Aqueduct net flow mL/min |
4.9 | 1.5 | -69 | 0 | -100 |
| SSS area mm2 |
73.1 | 54.3 | -26 | 62.4 | +15 |
Note: CBF, cerebral blood flow; µL, microliters; mL/min, milliliters per minute; mm2, millimeters squared.
Disclaimer/Publisher’s Note: The statements, opinions and data contained in all publications are solely those of the individual author(s) and contributor(s) and not of MDPI and/or the editor(s). MDPI and/or the editor(s) disclaim responsibility for any injury to people or property resulting from any ideas, methods, instructions or products referred to in the content. |
© 2026 by the authors. Licensee MDPI, Basel, Switzerland. This article is an open access article distributed under the terms and conditions of the Creative Commons Attribution (CC BY) license (http://creativecommons.org/licenses/by/4.0/).
Copyright: This open access article is published under a Creative Commons CC BY 4.0 license, which permit the free download, distribution, and reuse, provided that the author and preprint are cited in any reuse.


